Attached files
| file | filename |
|---|---|
| 8-K - 8-K - MYRIAD GENETICS INC | mygn-8k_20200505.htm |
| EX-99.1 - EX-99.1 - MYRIAD GENETICS INC | mygn-ex991_43.htm |

Myriad Genetics Fiscal Third-Quarter 2020 Earnings Call May 5, 2020 Exhibit 99.2
Forward Looking Statements Some of the information presented here today may contain projections or other forward-looking statements regarding future events or the future financial performance of the Company. These statements are based on management’s current expectations and the actual events or results may differ materially and adversely from these expectations. We refer you to the documents the Company files from time to time with the Securities and Exchange Commission, specifically, the Company’s annual reports on Form 10-K, its quarterly reports on Form 10-Q, and its current reports on Form 8-K. These documents identify important risk factors that could cause the actual results to differ materially from those contained in the Company’s projections or forward-looking statements. In this presentation, the Company’s financial results and financial guidance are provided in accordance with accounting principles generally accepted in the United States (GAAP) and using certain non-GAAP financial measures. The Company’s financial measures under GAAP include substantial one-time charges related to its acquisitions and ongoing amortization expense related to acquired intangible assets that will be recognized over the useful lives of the assets and charges related to executive severance. Management believes that presentation of operating results that excludes these items provides useful supplemental information to investors and facilitates the analysis of the Company’s core operating results and comparison of operating results across reporting periods. Management also uses non-GAAP financial measures to establish budgets and to manage the Company’s business. A link to reconciliation of the GAAP to non-GAAP financial guidance is provided above. Forward Looking Statements Non-GAAP Financial Measures For additional information on GAAP to non-GAAP reconciliation see: https://www.myriad.com/investors/gaap-to-non-gaap-reconciliation/
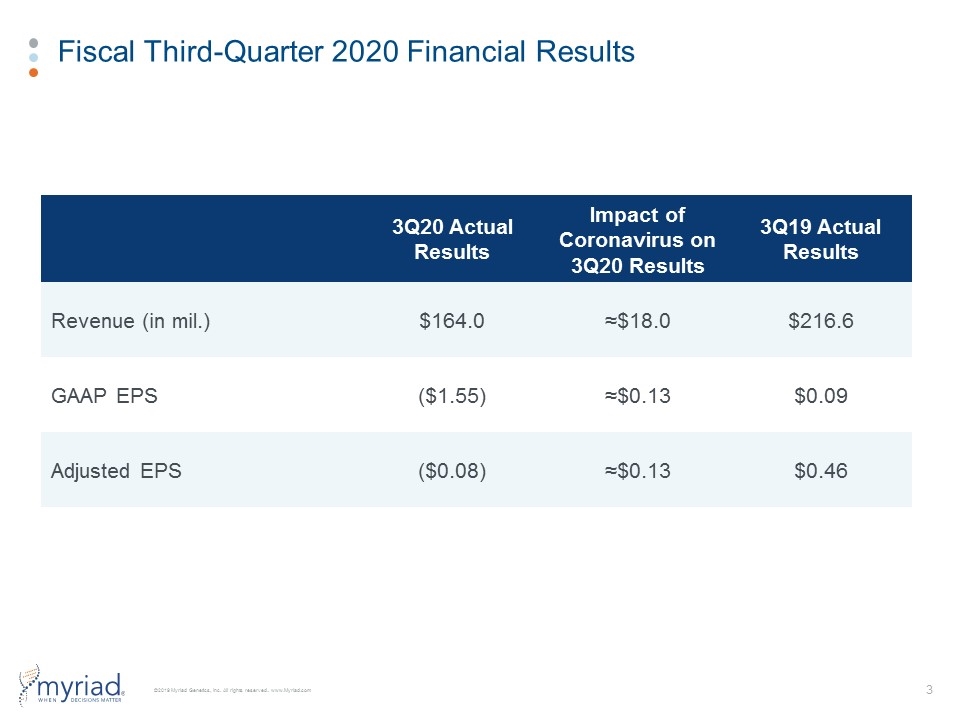
Fiscal Third-Quarter 2020 Financial Results 3Q20 Actual Results Impact of Coronavirus on 3Q20 Results 3Q19 Actual Results Revenue (in mil.) $164.0 ≈$18.0 $216.6 GAAP EPS ($1.55) ≈$0.13 $0.09 Adjusted EPS ($0.08) ≈$0.13 $0.46
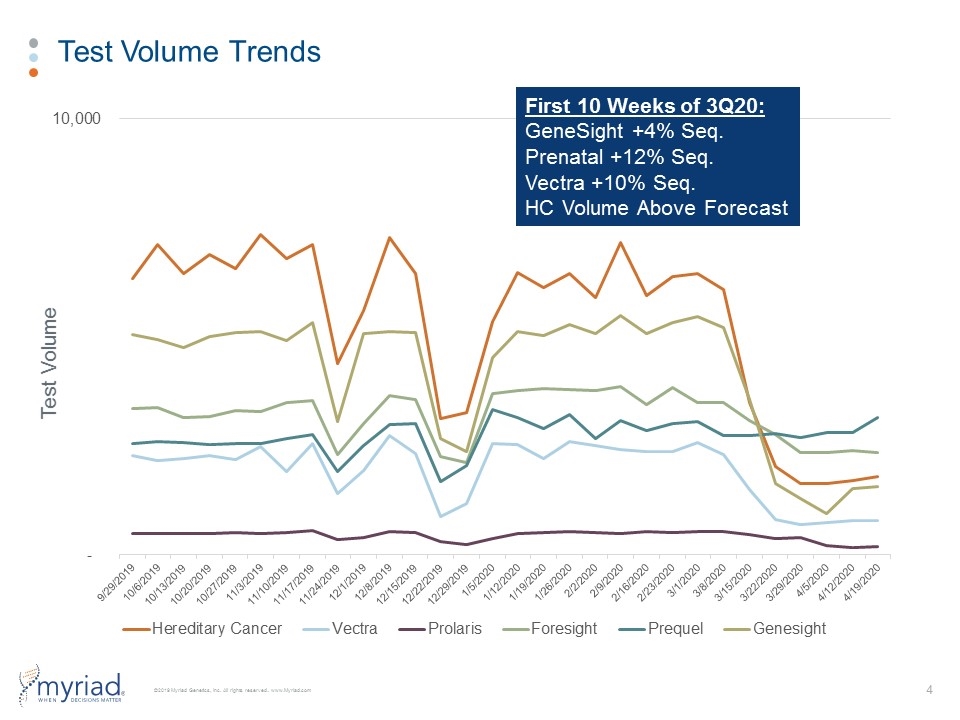
Test Volume Trends Test Volume First 10 Weeks of 3Q20: GeneSight +4% Seq. Prenatal +12% Seq. Vectra +10% Seq. HC Volume Above Forecast
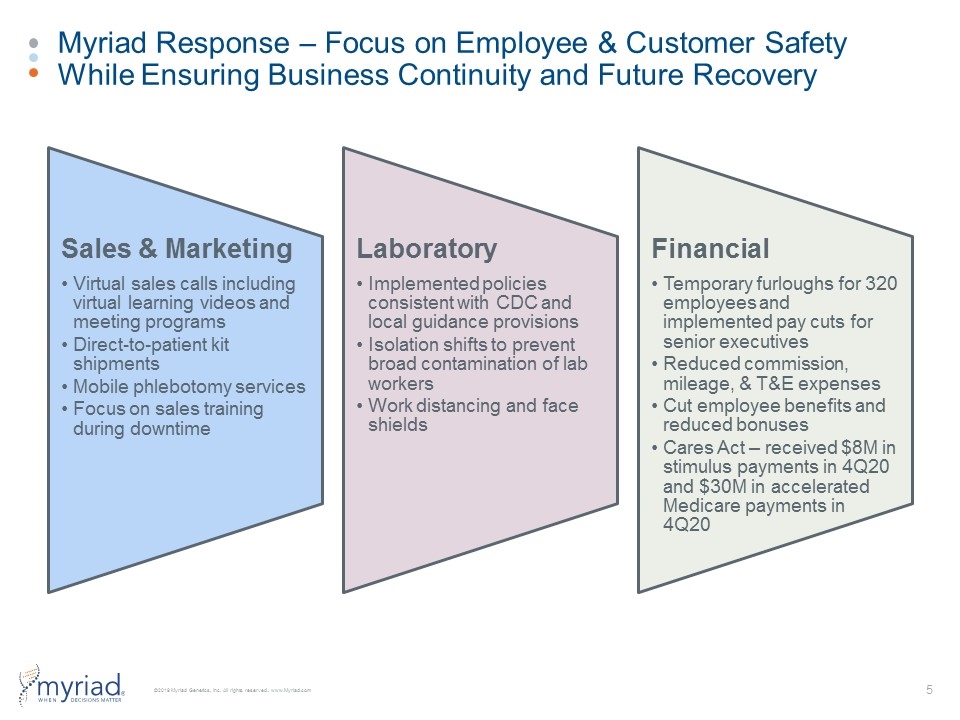
Myriad Response – Focus on Employee & Customer Safety While Ensuring Business Continuity and Future Recovery Sales & Marketing Virtual sales calls including virtual learning videos and meeting programs Direct-to-patient kit shipments Laboratory Implemented policies consistent with CDC and local guidance provisions Financial Temporary furloughs for 320 employees and implemented pay cuts for senior executives Mobile phlebotomy services Focus on sales training during downtime Isolation shifts to prevent broad contamination of lab workers Work distancing and face shields Reduced commission, mileage, & T&E expenses Cut employee benefits and reduced bonuses Cares Act – received $8M in stimulus payments in 4Q20 and $30M in accelerated Medicare payments in 4Q20

Financial Overview
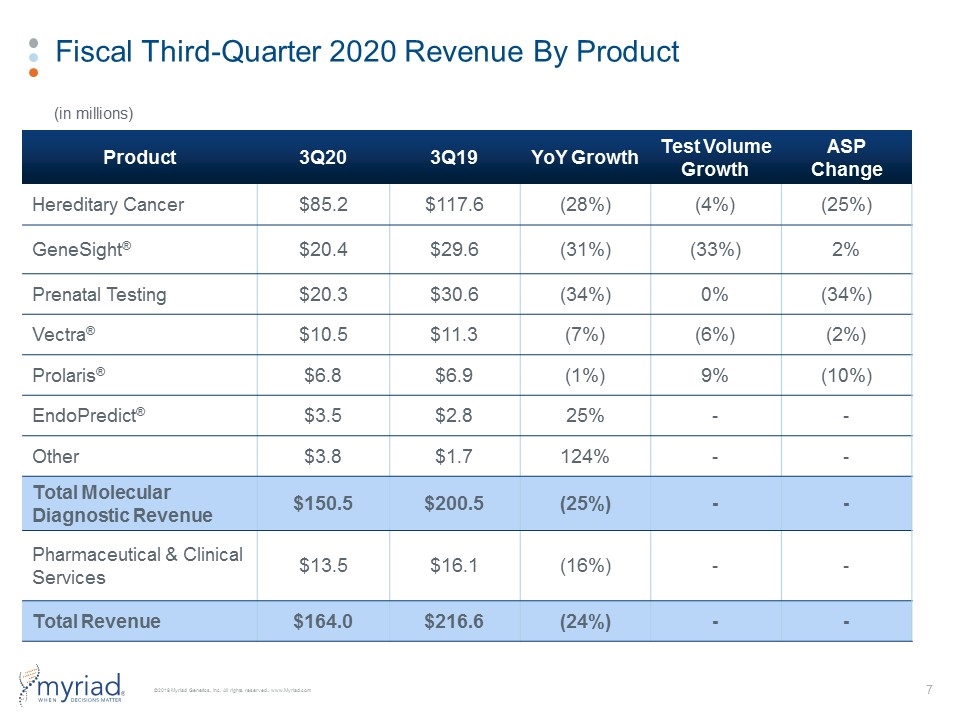
Fiscal Third-Quarter 2020 Revenue By Product Product 3Q20 3Q19 YoY Growth Test Volume Growth ASP Change Hereditary Cancer $85.2 $117.6 (28%) (4%) (25%) GeneSight® $20.4 $29.6 (31%) (33%) 2% Prenatal Testing $20.3 $30.6 (34%) 0% (34%) Vectra® $10.5 $11.3 (7%) (6%) (2%) Prolaris® $6.8 $6.9 (1%) 9% (10%) EndoPredict® $3.5 $2.8 25% - - Other $3.8 $1.7 124% - - Total Molecular Diagnostic Revenue $150.5 $200.5 (25%) - - Pharmaceutical & Clinical Services $13.5 $16.1 (16%) - - Total Revenue $164.0 $216.6 (24%) - - (in millions)
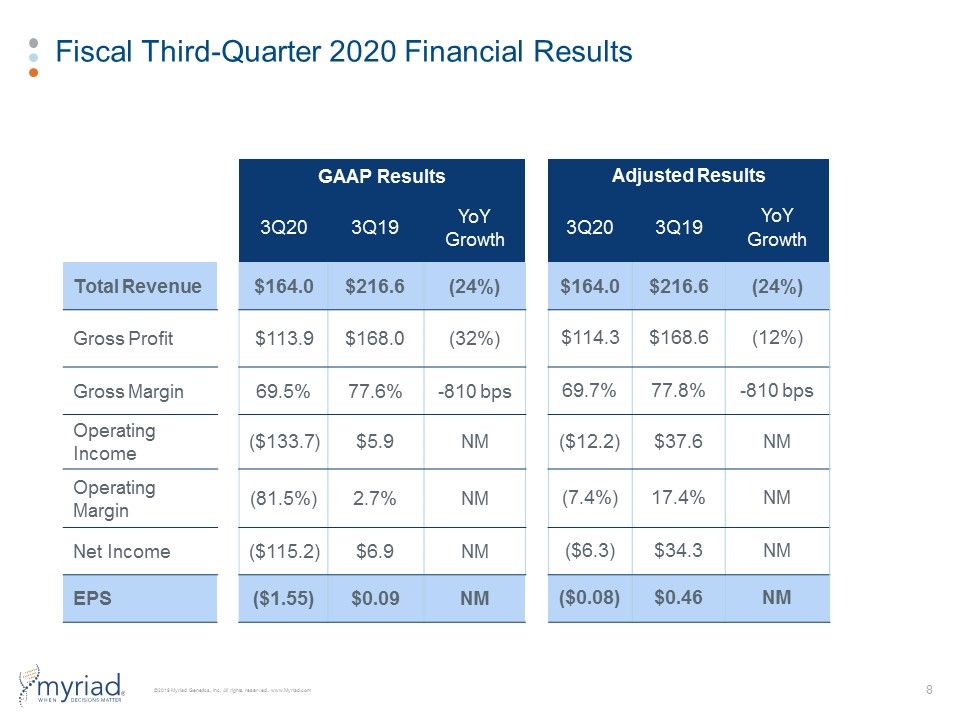
Fiscal Third-Quarter 2020 Financial Results GAAP Results Adjusted Results 3Q20 3Q19 YoY Growth 3Q20 3Q19 YoY Growth Total Revenue $164.0 $216.6 (24%) $164.0 $216.6 (24%) Gross Profit $113.9 $168.0 (32%) $114.3 $168.6 (12%) Gross Margin 69.5% 77.6% -810 bps 69.7% 77.8% -810 bps Operating Income ($133.7) $5.9 NM ($12.2) $37.6 NM Operating Margin (81.5%) 2.7% NM (7.4%) 17.4% NM Net Income ($115.2) $6.9 NM ($6.3) $34.3 NM EPS ($1.55) $0.09 NM ($0.08) $0.46 NM
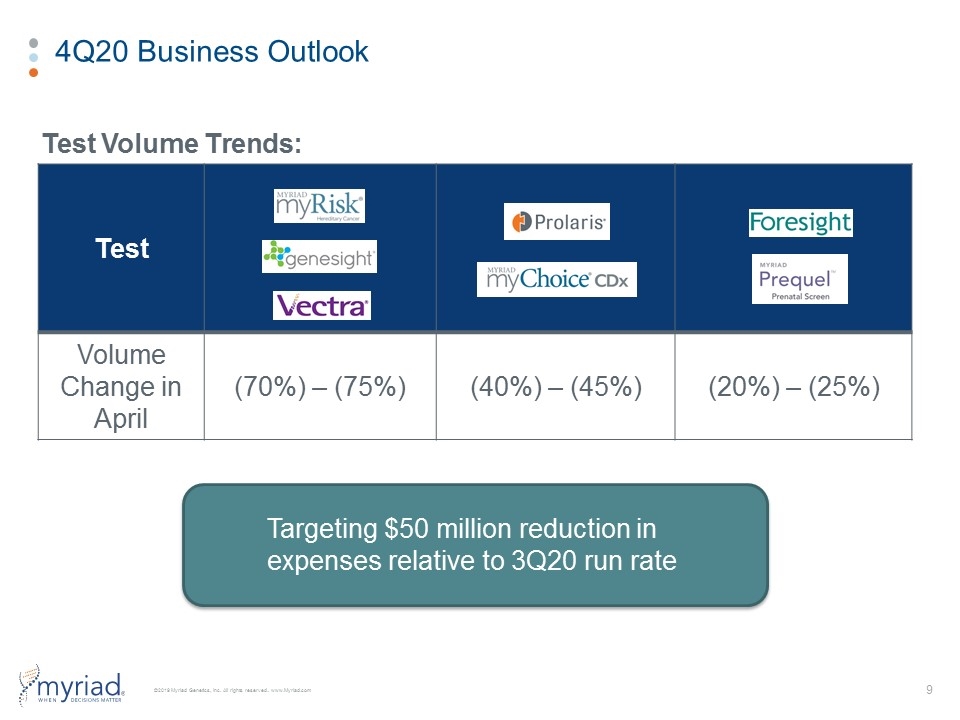
4Q20 Business Outlook Test Volume Trends: Test Volume Change in April (70%) – (75%) (40%) – (45%) (20%) – (25%) Targeting $50 million reduction in expenses relative to 3Q20 run rate
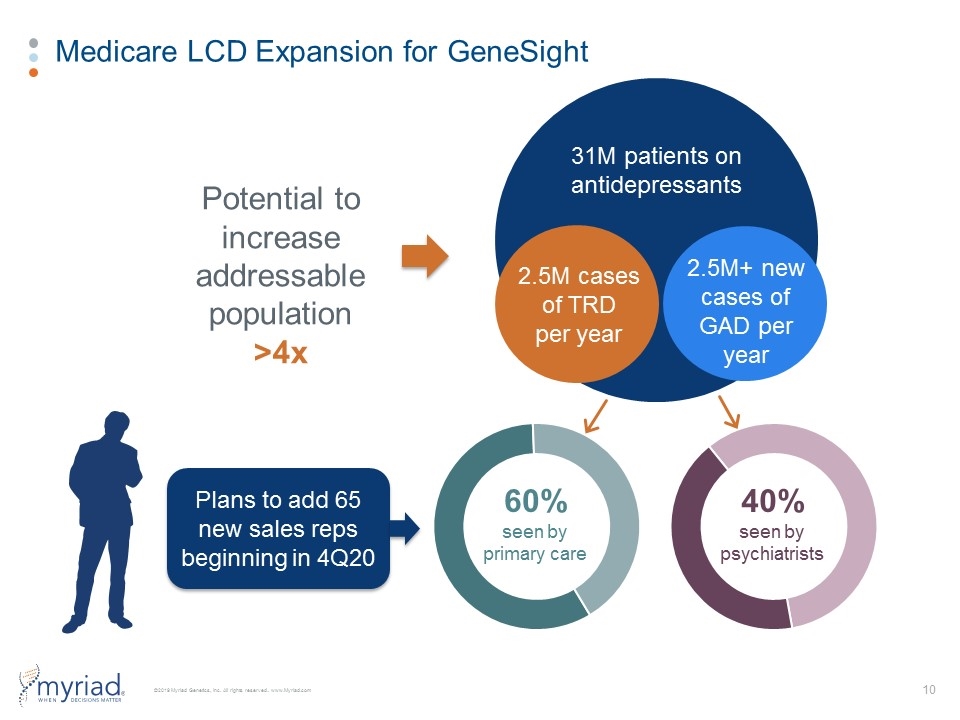
Medicare LCD Expansion for GeneSight 31M patients on antidepressants 2.5M cases of TRD per year 60% seen by primary care 40% seen by psychiatrists Plans to add 65 new sales reps beginning in 4Q20 2.5M+ new cases of GAD per year Potential to increase addressable population >4x
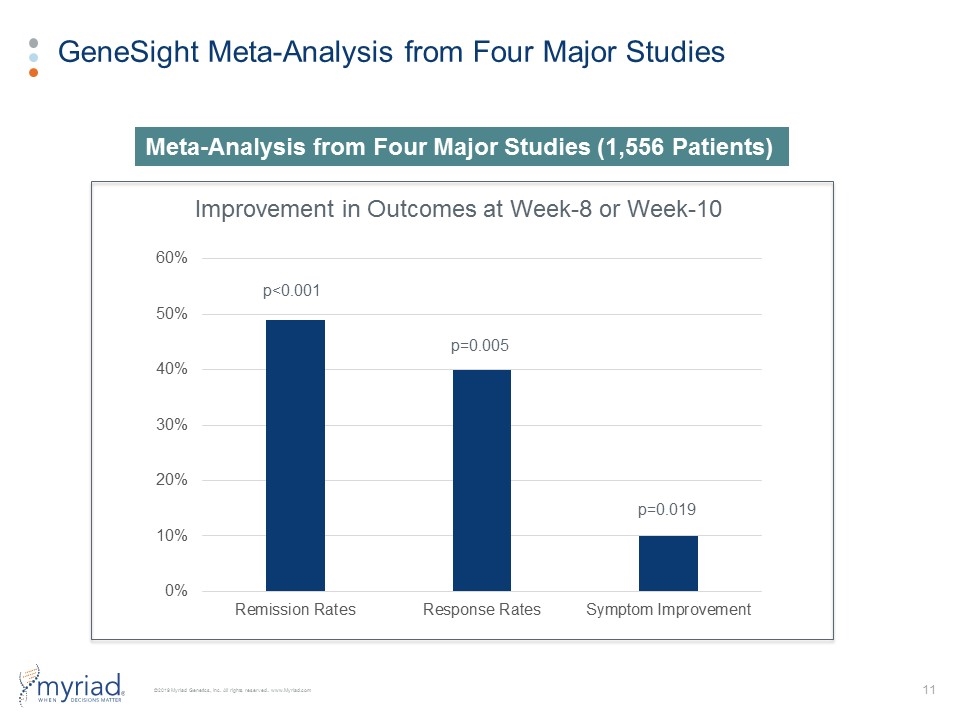
GeneSight Meta-Analysis from Four Major Studies Improvement in Outcomes at Week-8 or Week-10 Meta-Analysis from Four Major Studies (1,556 Patients) p=0.019 p=0.005 p<0.001
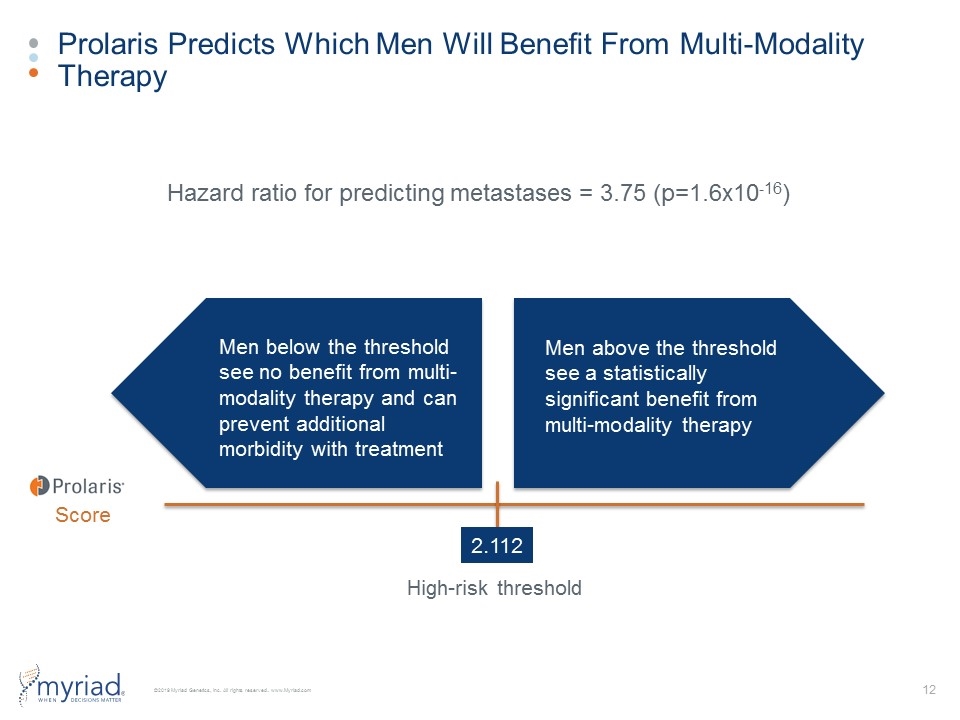
Prolaris Predicts Which Men Will Benefit From Multi-Modality Therapy 70% 42% 23% Study Arm: TAU (n=430) GeneSight Guided (n=357) Score 2.112 Men above the threshold see a statistically significant benefit from multi-modality therapy Men below the threshold see no benefit from multi-modality therapy and can prevent additional morbidity with treatment High-risk threshold Hazard ratio for predicting metastases = 3.75 (p=1.6x10⁻¹⁶)
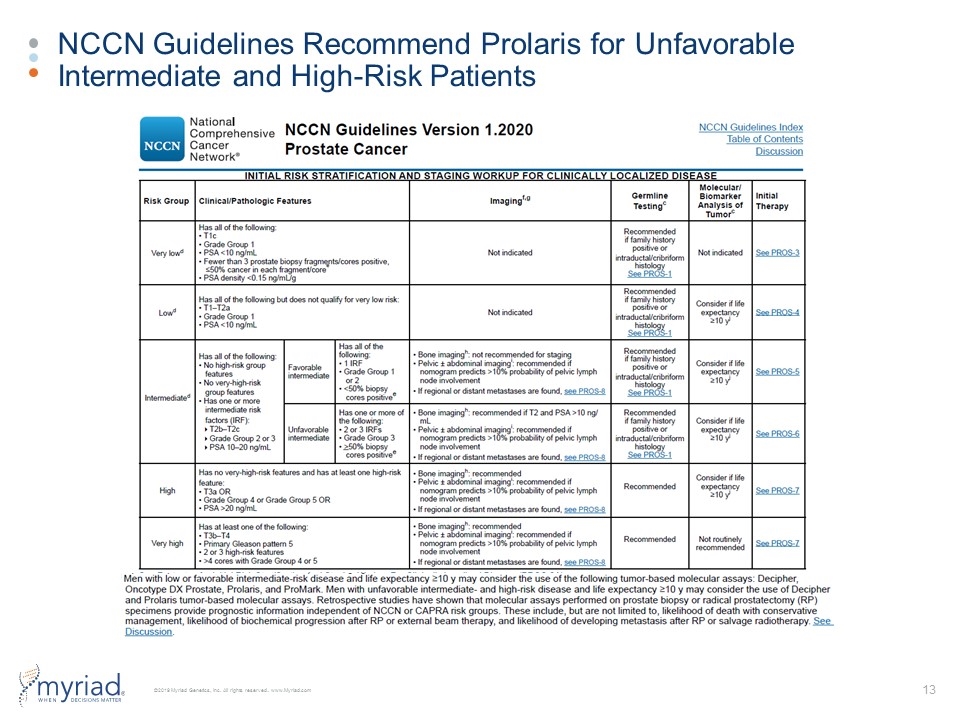
NCCN Guidelines Recommend Prolaris for Unfavorable Intermediate and High-Risk Patients 70% 42% 23% Study Arm: TAU (n=430) GeneSight Guided (n=357)
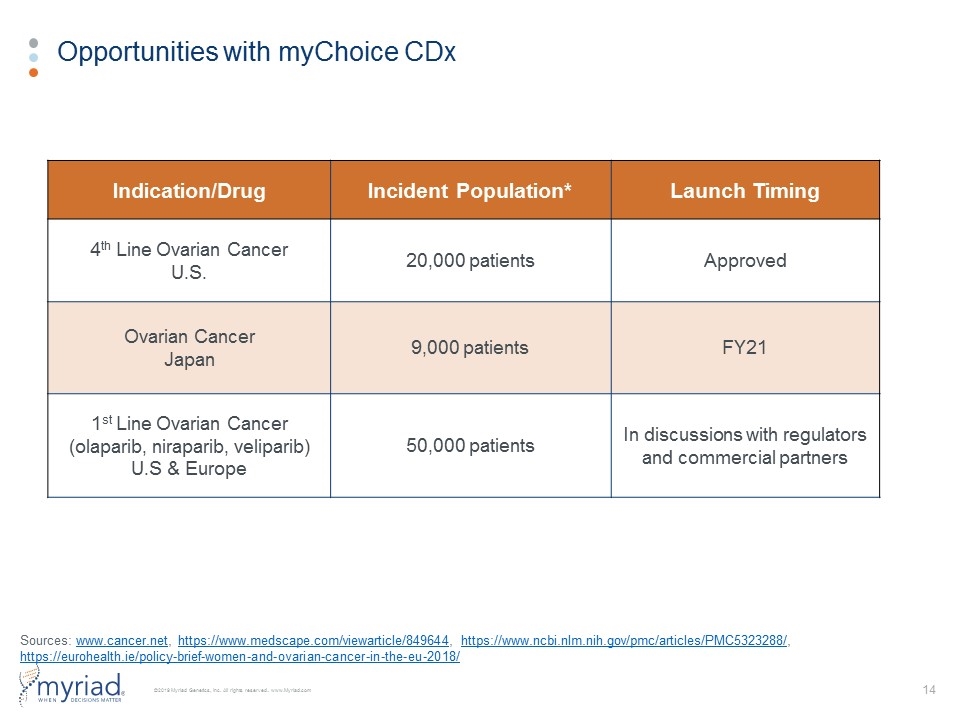
Opportunities with myChoice CDx Indication/Drug Incident Population* Launch Timing 4th Line Ovarian Cancer U.S. 20,000 patients Approved Ovarian Cancer Japan 9,000 patients FY21 1st Line Ovarian Cancer (olaparib, niraparib, veliparib) U.S & Europe 50,000 patients In discussions with regulators and commercial partners Sources: www.cancer.net, https://www.medscape.com/viewarticle/849644, https://www.ncbi.nlm.nih.gov/pmc/articles/PMC5323288/, https://eurohealth.ie/policy-brief-women-and-ovarian-cancer-in-the-eu-2018/
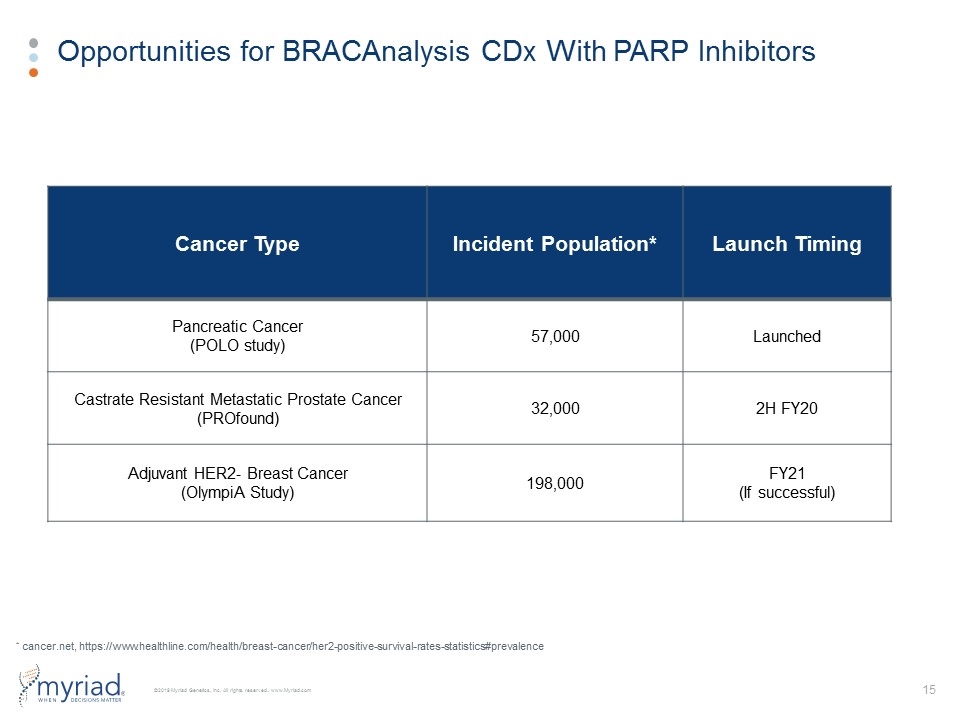
Opportunities for BRACAnalysis CDx With PARP Inhibitors Cancer Type Incident Population* Launch Timing Pancreatic Cancer (POLO study) 57,000 Launched Castrate Resistant Metastatic Prostate Cancer (PROfound) 32,000 2H FY20 Adjuvant HER2- Breast Cancer (OlympiA Study) 198,000 FY21 (If successful) * cancer.net, https://www.healthline.com/health/breast-cancer/her2-positive-survival-rates-statistics#prevalence
