Attached files
| file | filename |
|---|---|
| 8-K - FB FINANCIAL CORP. 8-K - FB Financial Corp | a52215204.htm |
Exhibit 99.1

May 6, 2020 Second Quarter Investor
Presentation

IMPORTANT INFORMATION FOR SHAREHOLDERS AND INVESTORSIn connection with the proposed merger with Franklin,
FB Financial has filed a registration statement on Form S-4 with the SEC. The registration statement contains the joint proxy statement of Franklin and FB Financial which was sent to the FB Financial and Franklin shareholders seeking their
approvals in connection with the merger and the issuance of FB Financial common stock in the merger. The registration statement also contains the prospectus of FB Financial to register the shares of FB Financial common stock to be issued in
connection with the merger. Investors and shareholders are encouraged to read the registration statement, including the joint proxy statement/prospectus that is part of the registration statement, as well as any other relevant documents filed
by FB Financial and Franklin with the SEC, including any amendments or supplements to the registration statement and other documents filed with the SEC, because they contain important information about the Franklin merger, Franklin, and FB
Financial. The registration statement and other documents filed with the SEC may be obtained for free on the SEC’s website (www.sec.gov). The definitive proxy statement/prospectus will also be made available for free by contacting FB Financial
Corporation Investor Relations at (615) 564-1212 or investors@firstbankonline.com, or by contacting Franklin Investor Relations at (615) 236-8327 or investors@franklinsynergy.com. This presentation does not constitute an offer to sell, the
solicitation of an offer to sell or the solicitation of an offer to buy any securities, or the solicitation of any vote or approval, nor shall there be any sale of securities in any jurisdiction in which such offer, solicitation or sale would
be unlawful prior to registration or qualification under the securities laws of such jurisdiction.PARTICIPANTS IN THE SOLICITATIONFB Financial, Franklin, and certain of their respective directors and executive officers may be deemed to be
participants in the solicitation of proxies from FB Financial and Franklin shareholders in connection with the proposed Franklin merger under the rules of the SEC. Information about the directors and executive officers of FB Financial may be
found in the definitive proxy statement for FB Financial’s 2020 annual meeting of shareholders, filed with the SEC by FB Financial on March 17, 2020, and other documents subsequently filed by FB Financial with the SEC. Information about the
directors and executive officers of Franklin may be found in the definitive proxy statement for Franklin’s 2019 annual meeting of shareholders, filed with the SEC by Franklin on April 12, 2019, and other documents subsequently filed by Franklin
with the SEC. Other information regarding the participants in the proxy solicitation and a description of their direct and indirect interests, by security holdings or otherwise, will be contained in the joint proxy statement/prospectus when it
becomes available. Free copies of these documents may be obtained as described in the paragraph above.
Forward–Looking Statements Certain statements contained in this press release may constitute
forward-looking statements within the meaning of Section 27A of the Securities Act of 1933, as amended, and Section 21E of the Securities Exchange Act of 1934, as amended. These forward-looking statements include, without limitation, statements
regarding the projected impact of the COVID-19 global pandemic on our business operations, statements relating to the timing, benefits, costs, and synergies of the proposed merger with Franklin Financial Network, Inc. (“Franklin”) (the
“Franklin merger”) and of the recent merger with FNB Financial Corp. (“FNB”) (together with the Franklin merger, the “mergers”), and FB Financial’s future plans, results, strategies, and expectations. These statements can generally be
identified by the use of the words and phrases “may,” “will,” “should,” “could,” “would,” “goal,” “plan,” “potential,” “estimate,” “project,” “believe,” “intend,” “anticipate,” “expect,” “target,” “aim,” “predict,” “continue,” “seek,”
“projection,” and other variations of such words and phrases and similar expressions. These forward-looking statements are not historical facts, and are based upon current expectations, estimates, and projections, many of which, by their
nature, are inherently uncertain and beyond FB Financial’s control. The inclusion of these forward-looking statements should not be regarded as a representation by FB Financial or any other person that such expectations, estimates, and
projections will be achieved. Accordingly, FB Financial cautions shareholders and investors that any such forward-looking statements are not guarantees of future performance and are subject to risks, assumptions, and uncertainties that are
difficult to predict. Actual results may prove to be materially different from the results expressed or implied by the forward-looking statements. A number of factors could cause actual results to differ materially from those contemplated by
the forward-looking statements including, without limitation, (1) current and future economic conditions, including the effects of declines in housing and commercial real estate prices, high unemployment rates, and any slowdown in economic
growth in the local or regional economies in which we operate and/or the US economy generally, (2) the effects of the COVID-19 pandemic, including the magnitude and duration of the pandemic and its impact on general economic and financial
market conditions and on our business and our customers' business, results of operations, asset quality and financial condition, (3) changes in government interest rate policies, (4) our ability to effectively manage problem credits, (5) the
risk that the cost savings and any revenue synergies from the mergers or another acquisition may not be realized or may take longer than anticipated to be realized, (6) disruption from the mergers with customer, supplier, or employee
relationships, (7) the occurrence of any event, change, or other circumstances that could give rise to the termination of the merger agreement with Franklin, (8) the failure to obtain necessary regulatory approvals for the Franklin merger, (9)
the failure to obtain the approval of FB Financial and Franklin’s shareholders in connection with the Franklin merger, (10) the possibility that the costs, fees, expenses, and charges related to the mergers may be greater than anticipated,
including as a result of unexpected or unknown factors, events, or liabilities, (11) the failure of the conditions to the Franklin merger to be satisfied, (12) the risks related to the integrations of the combined businesses following the
mergers, including the risk that the integrations will be materially delayed or will be more costly or difficult than expected, (13) the diversion of management time on issues related to the mergers, (14) the ability of FB Financial to
effectively manage the larger and more complex operations of the combined company following the Franklin merger, (15) the risks associated with FB Financial’s pursuit of future acquisitions, (16) reputational risk and the reaction of the
parties’ respective customers to the mergers, (17) FB Financial’s ability to successfully execute its various business strategies, including its ability to execute on potential acquisition opportunities, (18) the risk of potential litigation or
regulatory action related to the Franklin merger, and (19) general competitive, economic, political, and market conditions. Further information regarding FB Financial and factors that could affect the forward-looking statements contained herein
can be found in FB Financial's Annual Report on Form 10-K for the fiscal year ended December 31, 2019, and its other filings with the Securities and Exchange Commission (the “SEC”). Many of these factors are beyond FB Financial’s ability to
control or predict. If one or more events related to these or other risks or uncertainties materialize, or if the underlying assumptions prove to be incorrect, actual results may differ materially from the forward-looking statements.
Accordingly, shareholders and investors should not place undue reliance on any such forward-looking statements. Any forward-looking statement speaks only as of the date of this press release, and FB Financial undertakes no obligation to
publicly update or review any forward-looking statement, whether as a result of new information, future developments or otherwise, except as required by law. New risks and uncertainties may emerge from time to time, and it is not possible for
FB Financial to predict their occurrence or how they will affect the company. FB Financial qualifies all forward-looking statements by these cautionary statements.

Use of non-GAAP financial measures This presentation contains certain financial measures that are not
measures recognized under U.S. generally accepted accounting principles (“GAAP”) and therefore are considered non-GAAP financial measures. These non‐GAAP financial measures include, without limitation, adjusted net income, adjusted diluted
earnings per share, adjusted pro forma net income, adjusted pro forma diluted earnings per share, pre-tax, pre-provision earnings, adjusted pre-tax, pre-provision earnings, adjusted pre-tax, pre-provision earnings per share, core noninterest
expense, core revenue, core noninterest income, core efficiency ratio (tax-equivalent basis), banking segment core efficiency ratio (tax-equivalent basis), mortgage segment core efficiency ratio (tax-efficiency basis), adjusted mortgage
contribution, adjusted return on average assets, equity and tangible common equity, pre-tax, pre-provision return on average assets, equity and tangible common equity, pro forma return on average assets and equity, pro forma adjusted return on
average assets, equity and tangible common equity and adjusted pre-tax, pre-provision return on average assets, equity and tangible common equity. Each of these non-GAAP metrics excludes certain income and expense items that the Company’s
management considers to be non‐core/adjusted in nature. The Company refers to these non‐GAAP measures as adjusted or core measures. The corresponding Earnings Release also presents tangible assets, tangible common equity, tangible book value
per common share, tangible common equity to tangible assets, return on tangible common equity, return on average tangible common equity, and adjusted return on average tangible common equity. Each of these non-GAAP metrics excludes the impact
of goodwill and other intangibles.The Company’s management uses these non-GAAP financial measures in their analysis of the Company’s performance, financial condition and the efficiency of its operations as management believes such measures
facilitate period-to-period comparisons and provide meaningful indications of its operating performance as they eliminate both gains and charges that management views as non-recurring or not indicative of operating performance. Management
believes that these non-GAAP financial measures provide a greater understanding of ongoing operations and enhance comparability of results with prior periods as well as demonstrating the effects of significant non-core gains and charges in the
current and prior periods. The Company’s management also believes that investors find these non-GAAP financial measures useful as they assist investors in understanding the Company’s underlying operating performance and in the analysis of
ongoing operating trends. In addition, because intangible assets such as goodwill and other intangibles, and the other items excluded each vary extensively from company to company, the Company believes that the presentation of this information
allows investors to more easily compare the Company’s results to the results of other companies. However, the non-GAAP financial measures discussed herein should not be considered in isolation or as a substitute for the most directly comparable
or other financial measures calculated in accordance with GAAP. Moreover, the manner in which the Company calculates the non-GAAP financial measures discussed herein may differ from that of other companies reporting measures with similar names.
You should understand how such other banking organizations calculate their financial measures similar or with names similar to the non-GAAP financial measures the Company has discussed herein when comparing such non-GAAP financial measures. The
following tables provide a reconciliation of these measures to the most directly comparable GAAP financial measures.
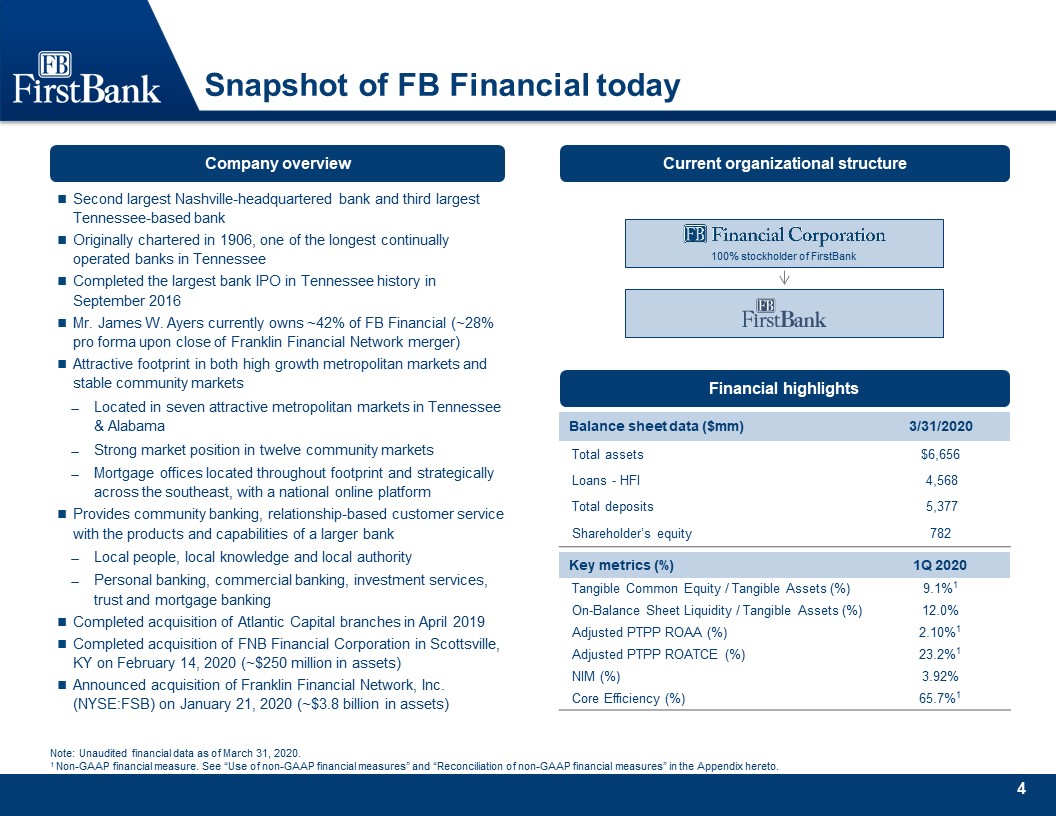
Snapshot of FB Financial today Note: Unaudited financial data as of March 31, 2020.1 Non-GAAP financial
measure. See “Use of non-GAAP financial measures” and “Reconciliation of non-GAAP financial measures” in the Appendix hereto. Financial highlights Balance sheet data ($mm) 3/31/2020 Total assets $6,656 Loans - HFI 4,568 Total
deposits 5,377 Shareholder’s equity 782 Key metrics (%) 1Q 2020 Tangible Common Equity / Tangible Assets (%) 9.1%1 On-Balance Sheet Liquidity / Tangible Assets (%) 12.0% Adjusted PTPP ROAA (%) 2.10%1 Adjusted PTPP ROATCE
(%) 23.2%1 NIM (%) 3.92% Core Efficiency (%) 65.7%1 100% stockholder of FirstBank Company overview Second largest Nashville-headquartered bank and third largest Tennessee-based bankOriginally chartered in 1906, one of the longest
continually operated banks in Tennessee Completed the largest bank IPO in Tennessee history in September 2016Mr. James W. Ayers currently owns ~42% of FB Financial (~28% pro forma upon close of Franklin Financial Network merger)Attractive
footprint in both high growth metropolitan markets and stable community marketsLocated in seven attractive metropolitan markets in Tennessee& AlabamaStrong market position in twelve community marketsMortgage offices located throughout
footprint and strategically across the southeast, with a national online platformProvides community banking, relationship-based customer service with the products and capabilities of a larger bankLocal people, local knowledge and local
authorityPersonal banking, commercial banking, investment services, trust and mortgage bankingCompleted acquisition of Atlantic Capital branches in April 2019Completed acquisition of FNB Financial Corporation in Scottsville, KY on February 14,
2020 (~$250 million in assets) Announced acquisition of Franklin Financial Network, Inc. (NYSE:FSB) on January 21, 2020 (~$3.8 billion in assets) Current organizational structure
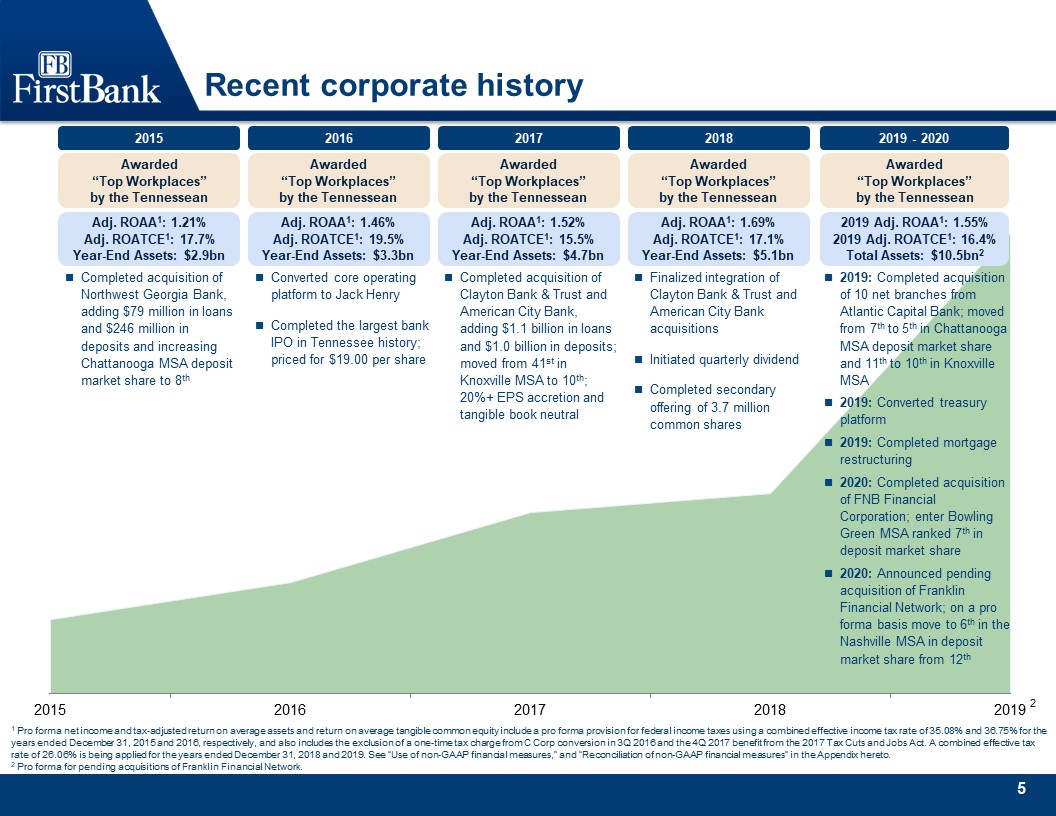
Recent corporate history 1 Pro forma net income and tax-adjusted return on average assets and return on
average tangible common equity include a pro forma provision for federal income taxes using a combined effective income tax rate of 35.08% and 36.75% for the years ended December 31, 2015 and 2016, respectively, and also includes the exclusion
of a one-time tax charge from C Corp conversion in 3Q 2016 and the 4Q 2017 benefit from the 2017 Tax Cuts and Jobs Act. A combined effective tax rate of 26.06% is being applied for the years ended December 31, 2018 and 2019. See “Use of
non-GAAP financial measures,” and “Reconciliation of non-GAAP financial measures” in the Appendix hereto.2 Pro forma for pending acquisitions of Franklin Financial Network. Completed acquisition of Northwest Georgia Bank, adding $79 million in
loans and $246 million in deposits and increasing Chattanooga MSA deposit market share to 8th 2015 2019 - 2020 2018 2017 2016 Converted core operating platform to Jack HenryCompleted the largest bank IPO in Tennessee history; priced for
$19.00 per share Completed acquisition of Clayton Bank & Trust and American City Bank, adding $1.1 billion in loans and $1.0 billion in deposits; moved from 41st in Knoxville MSA to 10th; 20%+ EPS accretion and tangible book
neutral 2 Finalized integration of Clayton Bank & Trust and American City Bank acquisitionsInitiated quarterly dividendCompleted secondary offering of 3.7 million common shares 2019: Completed acquisition of 10 net branches from
Atlantic Capital Bank; moved from 7th to 5th in Chattanooga MSA deposit market share and 11th to 10th in Knoxville MSA2019: Converted treasury platform2019: Completed mortgage restructuring2020: Completed acquisition of FNB Financial
Corporation; enter Bowling Green MSA ranked 7th in deposit market share2020: Announced pending acquisition of Franklin Financial Network; on a pro forma basis move to 6th in the Nashville MSA in deposit market share from 12th Adj. ROAA1:
1.21%Adj. ROATCE1: 17.7%Year-End Assets: $2.9bn 2019 Adj. ROAA1: 1.55%2019 Adj. ROATCE1: 16.4%Total Assets: $10.5bn2 Adj. ROAA1: 1.69%Adj. ROATCE1: 17.1%Year-End Assets: $5.1bn Adj. ROAA1: 1.52%Adj. ROATCE1: 15.5%Year-End Assets:
$4.7bn Adj. ROAA1: 1.46%Adj. ROATCE1: 19.5%Year-End Assets: $3.3bn Awarded “Top Workplaces”by the Tennessean Awarded “Top Workplaces”by the Tennessean Awarded “Top Workplaces”by the Tennessean Awarded “Top Workplaces”by the
Tennessean Awarded “Top Workplaces”by the Tennessean
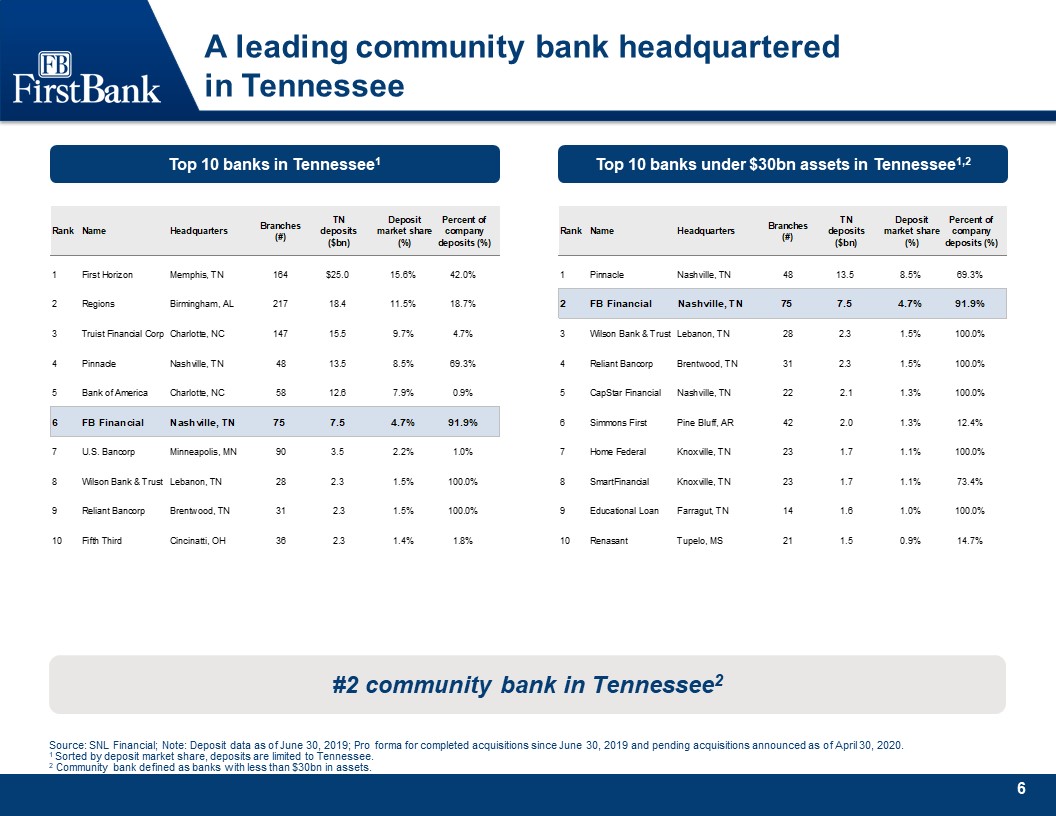
A leading community bank headquarteredin Tennessee Source: SNL Financial; Note: Deposit data as of June
30, 2019; Pro forma for completed acquisitions since June 30, 2019 and pending acquisitions announced as of April 30, 2020.1 Sorted by deposit market share, deposits are limited to Tennessee.2 Community bank defined as banks with less than
$30bn in assets. Top 10 banks in Tennessee1 #2 community bank in Tennessee2 Top 10 banks under $30bn assets in Tennessee1,2
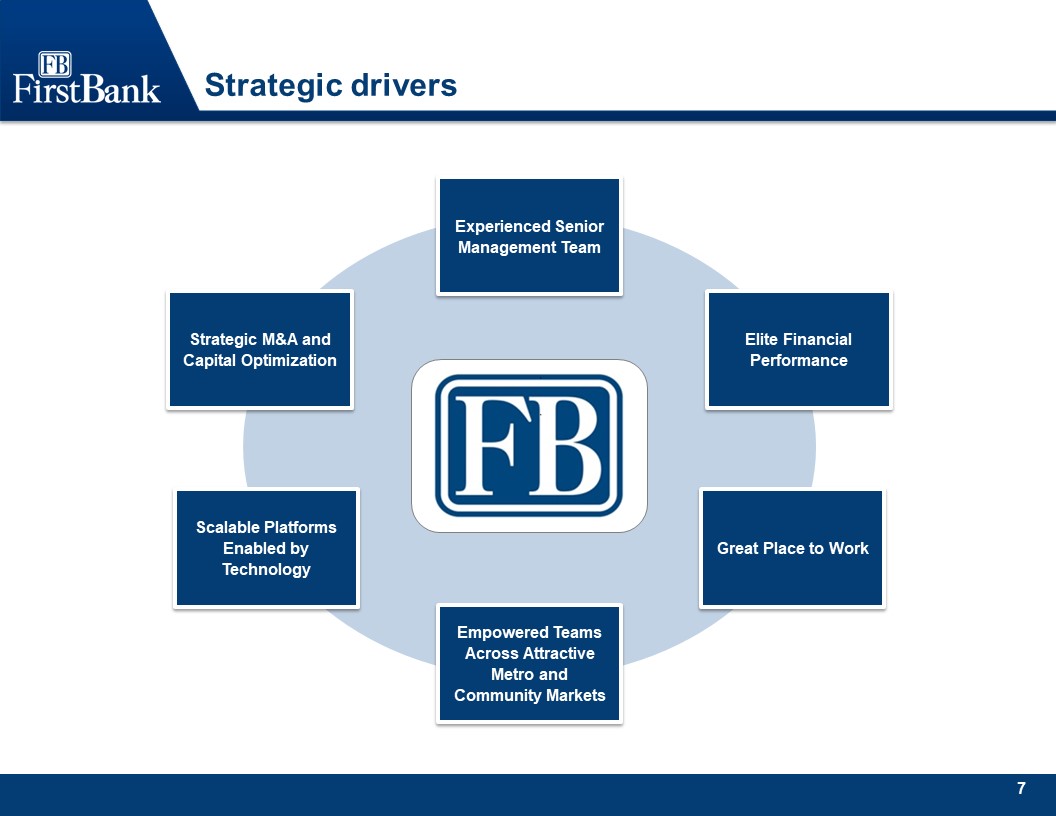
Strategic drivers Great Place to Work Strategic M&A and Capital Optimization Experienced Senior
Management Team Elite Financial Performance Scalable Platforms Enabled by Technology Empowered Teams Across Attractive Metro andCommunity Markets
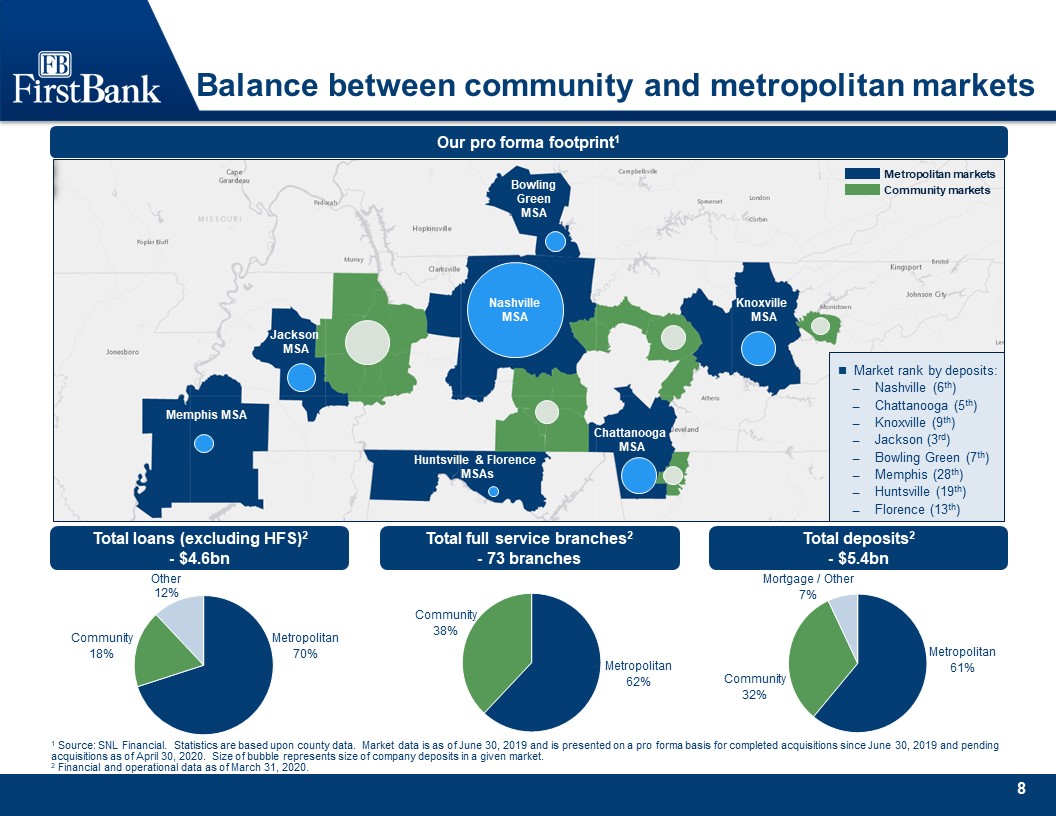
Balance between community and metropolitan markets 1 Source: SNL Financial. Statistics are based upon
county data. Market data is as of June 30, 2019 and is presented on a pro forma basis for completed acquisitions since June 30, 2019 and pending acquisitions as of April 30, 2020. Size of bubble represents size of company deposits in a given
market.2 Financial and operational data as of March 31, 2020. Our pro forma footprint1 Total loans (excluding HFS)2- $4.6bn Total full service branches2- 73 branches Total deposits2- $5.4bn Metropolitan70% Community 18% Community
38% Metropolitan62% Metropolitan61% Community 32% Metropolitan marketsCommunity markets Market rank by deposits: Nashville (6th)Chattanooga (5th) Knoxville (9th) Jackson (3rd)Bowling Green (7th)Memphis (28th)Huntsville (19th)
Florence (13th) Nashville MSA Knoxville MSA Chattanooga MSA Huntsville & Florence MSAs Memphis MSA Jackson MSA Bowling Green MSA
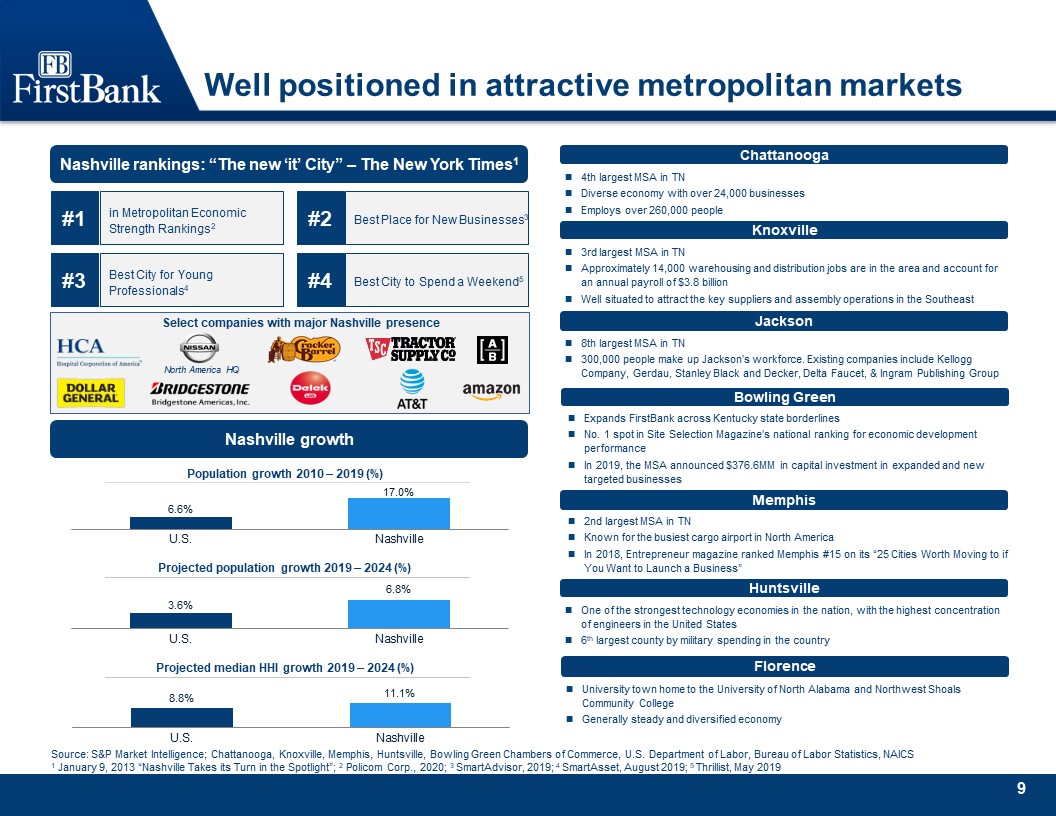
Well positioned in attractive metropolitan markets Source: S&P Market Intelligence; Chattanooga,
Knoxville, Memphis, Huntsville, Bowling Green Chambers of Commerce, U.S. Department of Labor, Bureau of Labor Statistics, NAICS1 January 9, 2013 “Nashville Takes its Turn in the Spotlight”; 2 Policom Corp., 2020; 3 SmartAdvisor, 2019; 4
SmartAsset, August 2019; 5 Thrillist, May 2019 Nashville rankings: “The new ‘it’ City” – The New York Times1 Select companies with major Nashville presence North America HQ Best Place for New Businesses3 #2 in Metropolitan Economic
Strength Rankings2 #1 Best City to Spend a Weekend5 #4 Best City for Young Professionals4 #3 Nashville growth Population growth 2010 – 2019 (%) Projected population growth 2019 – 2024 (%) Projected median HHI growth 2019 – 2024
(%) Chattanooga 4th largest MSA in TNDiverse economy with over 24,000 businesses Employs over 260,000 people Memphis 2nd largest MSA in TNKnown for the busiest cargo airport in North AmericaIn 2018, Entrepreneur magazine ranked Memphis #15
on its “25 Cities Worth Moving to if You Want to Launch a Business” Knoxville 3rd largest MSA in TN Approximately 14,000 warehousing and distribution jobs are in the area and account for an annual payroll of $3.8 billionWell situated to
attract the key suppliers and assembly operations in the Southeast Huntsville One of the strongest technology economies in the nation, with the highest concentration of engineers in the United States6th largest county by military spending in
the country Jackson 8th largest MSA in TN300,000 people make up Jackson’s workforce. Existing companies include Kellogg Company, Gerdau, Stanley Black and Decker, Delta Faucet, & Ingram Publishing Group Bowling Green Expands FirstBank
across Kentucky state borderlinesNo. 1 spot in Site Selection Magazine’s national ranking for economic development performanceIn 2019, the MSA announced $376.6MM in capital investment in expanded and new targeted
businesses Florence University town home to the University of North Alabama and Northwest Shoals Community CollegeGenerally steady and diversified economy
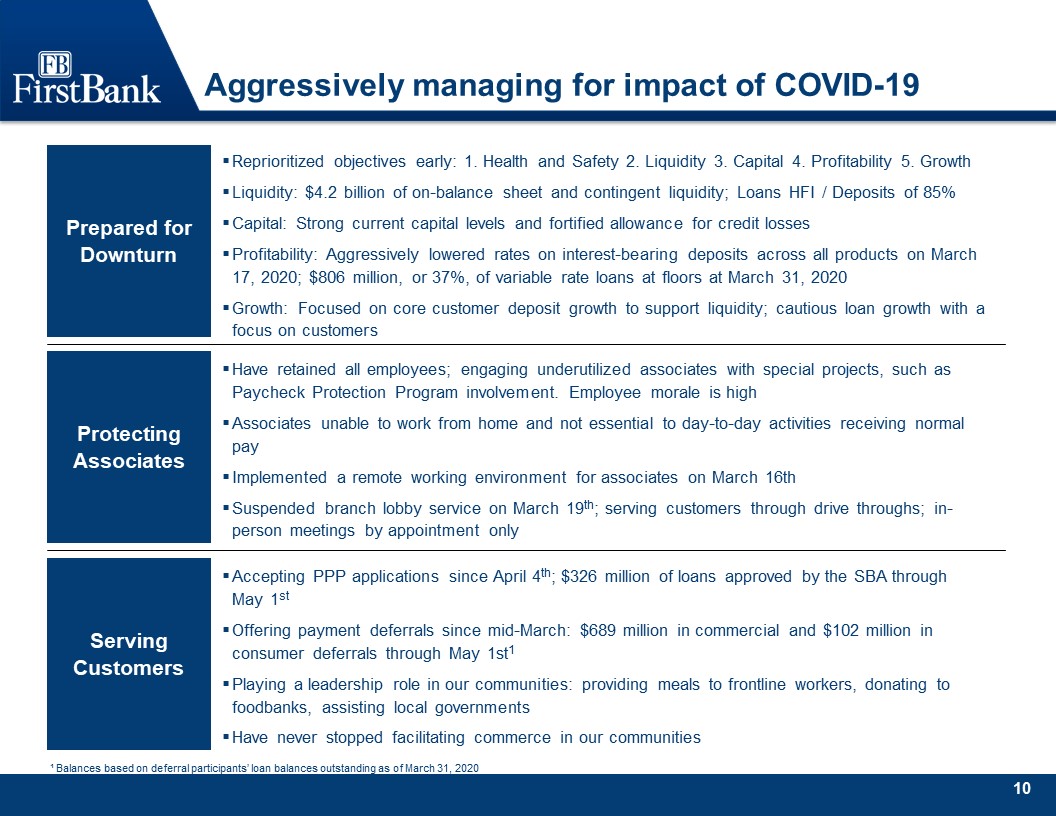
Aggressively managing for impact of COVID-19 Prepared for Downturn Reprioritized objectives early: 1.
Health and Safety 2. Liquidity 3. Capital 4. Profitability 5. GrowthLiquidity: $4.2 billion of on-balance sheet and contingent liquidity; Loans HFI / Deposits of 85%Capital: Strong current capital levels and fortified allowance for credit
lossesProfitability: Aggressively lowered rates on interest-bearing deposits across all products on March 17, 2020; $806 million, or 37%, of variable rate loans at floors at March 31, 2020Growth: Focused on core customer deposit growth to
support liquidity; cautious loan growth with a focus on customers Have retained all employees; engaging underutilized associates with special projects, such as Paycheck Protection Program involvement. Employee morale is highAssociates unable
to work from home and not essential to day-to-day activities receiving normal payImplemented a remote working environment for associates on March 16thSuspended branch lobby service on March 19th; serving customers through drive throughs;
in-person meetings by appointment only Protecting Associates Serving Customers ¹ Balances based on deferral participants’ loan balances outstanding as of March 31, 2020 Accepting PPP applications since April 4th; $326 million of loans
approved by the SBA through May 1stOffering payment deferrals since mid-March: $689 million in commercial and $102 million in consumer deferrals through May 1st1Playing a leadership role in our communities: providing meals to frontline workers,
donating to foodbanks, assisting local governmentsHave never stopped facilitating commerce in our communities

Assisting customers in the face of uncertainty Deferral Programs Paycheck Protection Program Offering
relief in the form of deferral programs for all customers who request assistanceBegan proactively reaching out to consumer and commercial customers in mid-MarchStandard consumer loan receiving 2-payment relief; maintaining dialogue in the
interim for decisions on extensions863 consumer, residential mortgage, and HELOC loans have received modifications as of May 1st$102 million of loans participating1, or 8.2% of outstanding balances as of March 31st Of $7 billion unpaid
principal balance in mortgage servicing portfolio, ~5% have received forbearancesStandard commercial loan receiving 90 day principal and interest forbearance, maintaining dialogue in the interim for decisions on extensions872 C&I,
Construction, Multifamily and CRE loans have received modifications as of May 1st $689 million of loans participating1, or 20.8% of outstanding balances as of March 31st Began accepting applications on April 4th Over 300 associates involved
in application, approval and SBA submission process, or ~50% of banking segment teammatesReceived SBA approvals on over 2,500 applications representing $326 million through May 1st Approximately 45,000 thousand employed by companies receiving
PPP loans from FirstBankAverage loan size of $121 thousand$72 million in loans above $2 million$119 million between $350 thousand and $2 million$135 million below $350 thousandExpect fees of approximately $7.3 million, net of direct costs of
origination, deferred over the life of the loan ¹ Balances based on deferral participants’ loan balances outstanding as of March 31, 2020
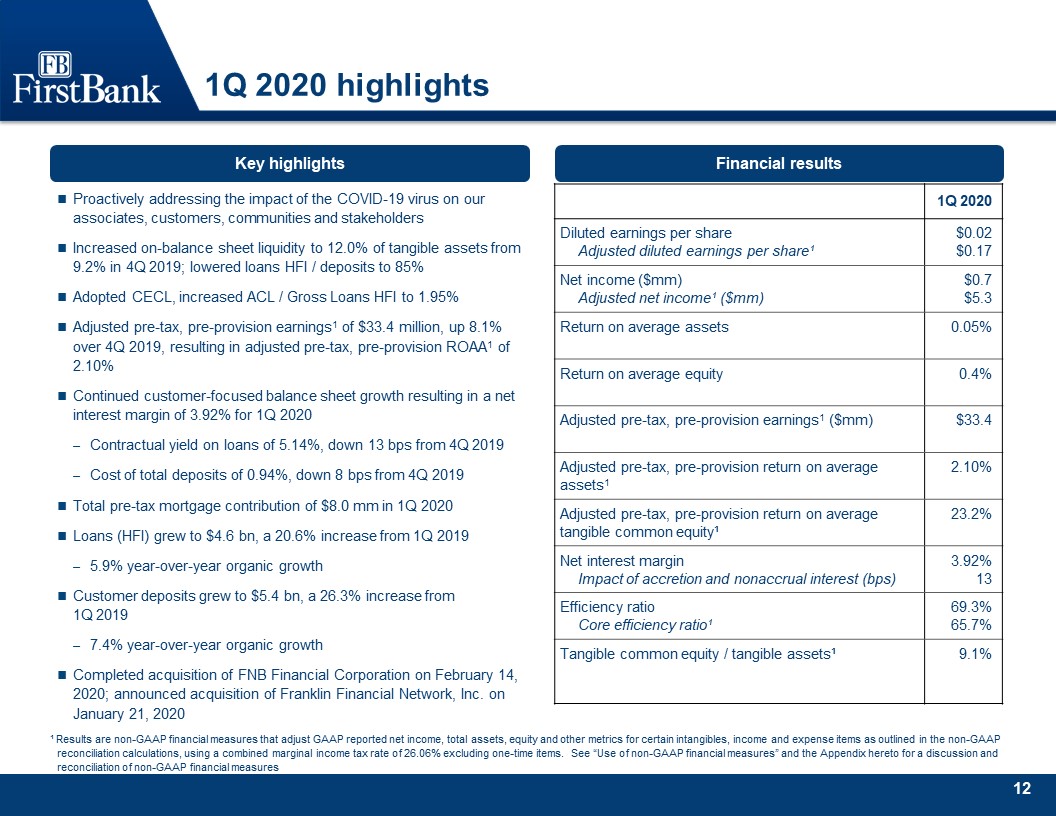
1Q 2020 highlights Key highlights Financial results Proactively addressing the impact of the COVID-19
virus on our associates, customers, communities and stakeholdersIncreased on-balance sheet liquidity to 12.0% of tangible assets from 9.2% in 4Q 2019; lowered loans HFI / deposits to 85%Adopted CECL, increased ACL / Gross Loans HFI to
1.95%Adjusted pre-tax, pre-provision earnings1 of $33.4 million, up 8.1% over 4Q 2019, resulting in adjusted pre-tax, pre-provision ROAA1 of 2.10%Continued customer-focused balance sheet growth resulting in a net interest margin of 3.92% for 1Q
2020Contractual yield on loans of 5.14%, down 13 bps from 4Q 2019Cost of total deposits of 0.94%, down 8 bps from 4Q 2019Total pre-tax mortgage contribution of $8.0 mm in 1Q 2020Loans (HFI) grew to $4.6 bn, a 20.6% increase from 1Q 20195.9%
year-over-year organic growthCustomer deposits grew to $5.4 bn, a 26.3% increase from 1Q 20197.4% year-over-year organic growthCompleted acquisition of FNB Financial Corporation on February 14, 2020; announced acquisition of Franklin Financial
Network, Inc. on January 21, 2020 ¹ Results are non-GAAP financial measures that adjust GAAP reported net income, total assets, equity and other metrics for certain intangibles, income and expense items as outlined in the non-GAAP
reconciliation calculations, using a combined marginal income tax rate of 26.06% excluding one-time items. See “Use of non-GAAP financial measures” and the Appendix hereto for a discussion and reconciliation of non-GAAP financial measures 1Q
2020 Diluted earnings per shareAdjusted diluted earnings per share¹ $0.02$0.17 Net income ($mm)Adjusted net income¹ ($mm) $0.7$5.3 Return on average assets 0.05% Return on average equity 0.4% Adjusted pre-tax, pre-provision earnings1
($mm) $33.4 Adjusted pre-tax, pre-provision return on average assets1 2.10% Adjusted pre-tax, pre-provision return on average tangible common equity¹ 23.2% Net interest marginImpact of accretion and nonaccrual interest
(bps) 3.92%13 Efficiency ratioCore efficiency ratio¹ 69.3%65.7% Tangible common equity / tangible assets¹ 9.1%
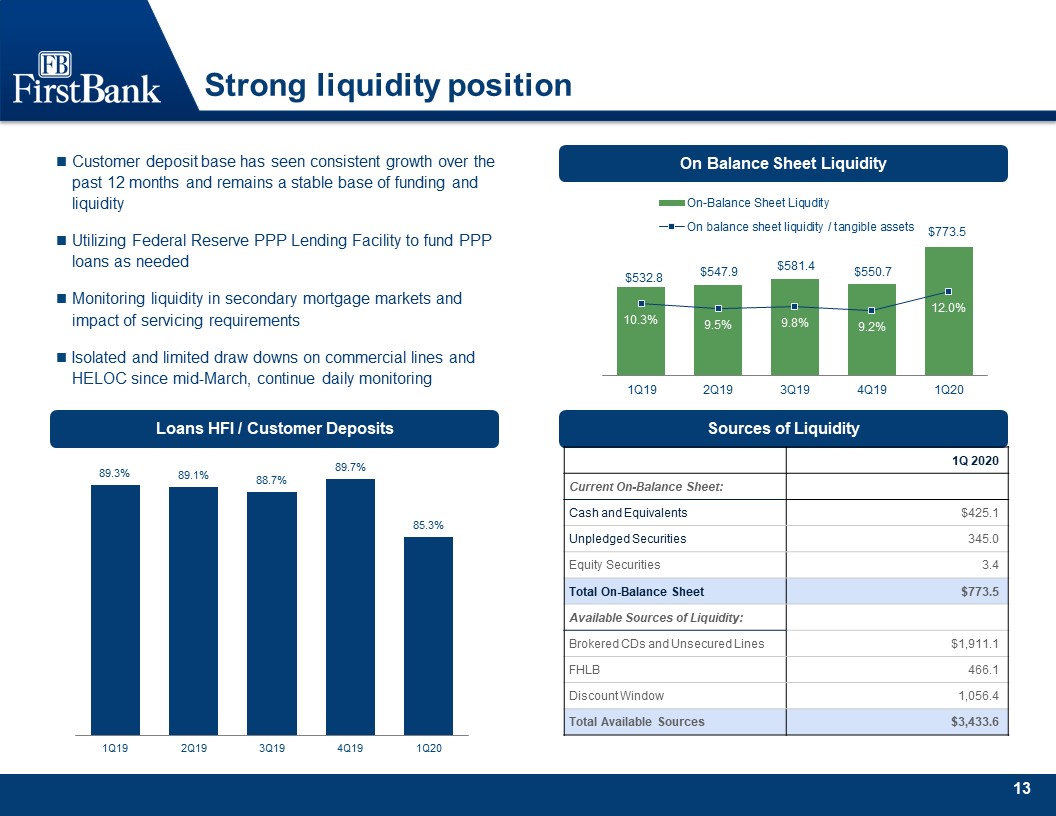
Strong liquidity position On Balance Sheet Liquidity Loans HFI / Customer Deposits Sources of
Liquidity 1Q 2020 Current On-Balance Sheet: Cash and Equivalents $425.1 Unpledged Securities 345.0 Equity Securities 3.4 Total On-Balance Sheet $773.5 Available Sources of Liquidity: Brokered CDs and Unsecured
Lines $1,911.1 FHLB 466.1 Discount Window 1,056.4 Total Available Sources $3,433.6 Customer deposit base has seen consistent growth over the past 12 months and remains a stable base of funding and liquidityUtilizing Federal Reserve PPP
Lending Facility to fund PPP loans as neededMonitoring liquidity in secondary mortgage markets and impact of servicing requirementsIsolated and limited draw downs on commercial lines and HELOC since mid-March, continue daily monitoring
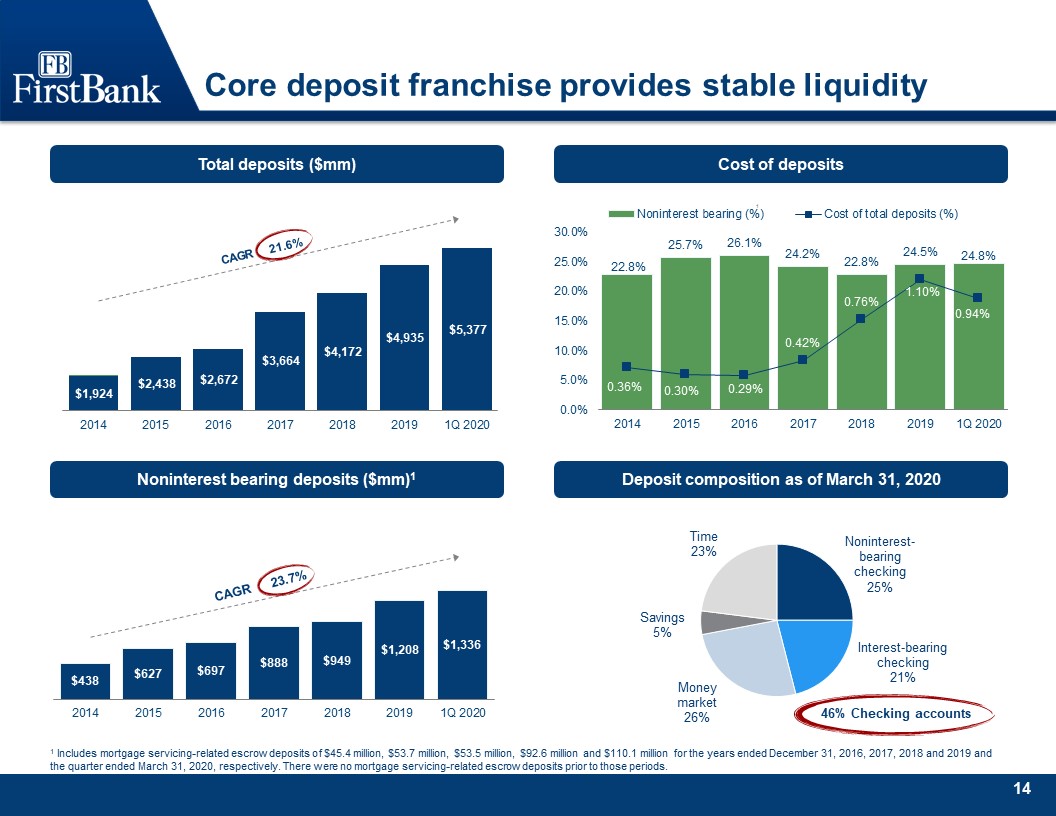
Core deposit franchise provides stable liquidity 1 Includes mortgage servicing-related escrow deposits
of $45.4 million, $53.7 million, $53.5 million, $92.6 million and $110.1 million for the years ended December 31, 2016, 2017, 2018 and 2019 and the quarter ended March 31, 2020, respectively. There were no mortgage servicing-related escrow
deposits prior to those periods. Total deposits ($mm) Cost of deposits CAGR 21.6% 1 Noninterest bearing deposits ($mm)1 Deposit composition as of March 31, 2020 CAGR 23.7%
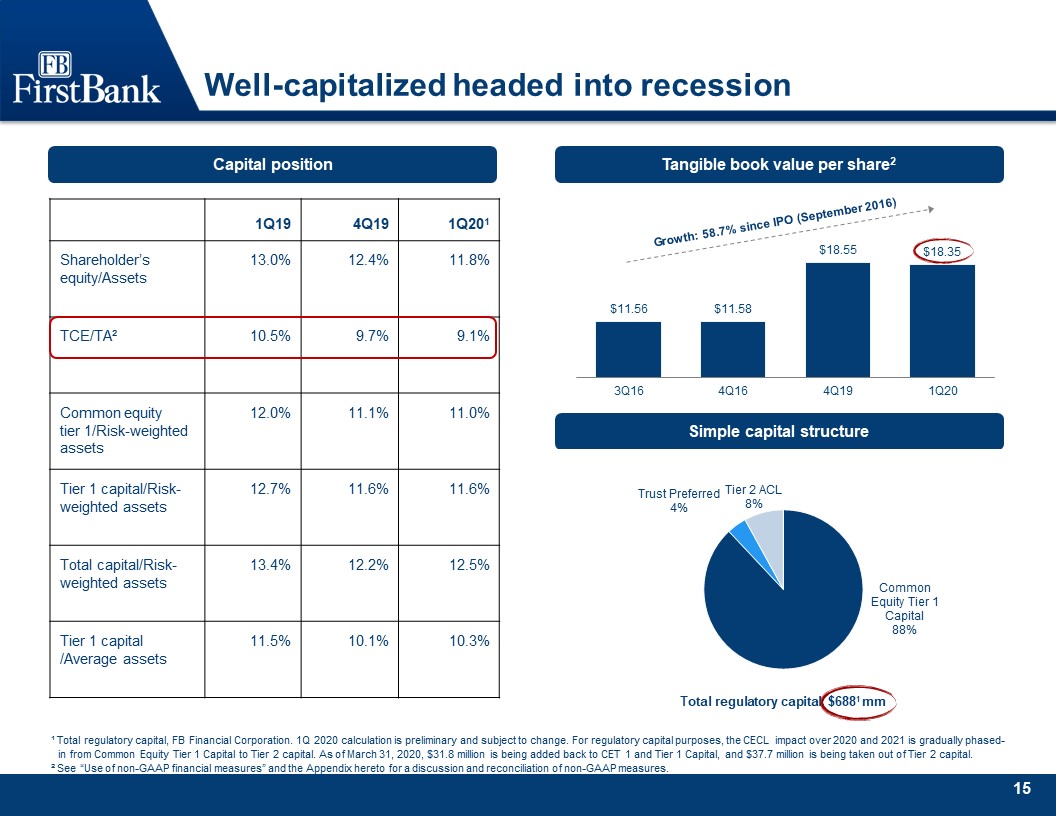
Well-capitalized headed into recession Tangible book value per share2 Simple capital
structure Growth: 58.7% since IPO (September 2016) 1Q19 4Q19 1Q201 Shareholder’s equity/Assets 13.0% 12.4% 11.8% TCE/TA² 10.5% 9.7% 9.1% Common equity tier 1/Risk-weighted assets 12.0% 11.1% 11.0% Tier 1
capital/Risk-weighted assets 12.7% 11.6% 11.6% Total capital/Risk-weighted assets 13.4% 12.2% 12.5% Tier 1 capital /Average assets 11.5% 10.1% 10.3% Capital position ¹ Total regulatory capital, FB Financial Corporation. 1Q 2020
calculation is preliminary and subject to change. For regulatory capital purposes, the CECL impact over 2020 and 2021 is gradually phased-in from Common Equity Tier 1 Capital to Tier 2 capital. As of March 31, 2020, $31.8 million is being added
back to CET 1 and Tier 1 Capital, and $37.7 million is being taken out of Tier 2 capital.² See “Use of non-GAAP financial measures” and the Appendix hereto for a discussion and reconciliation of non-GAAP measures.
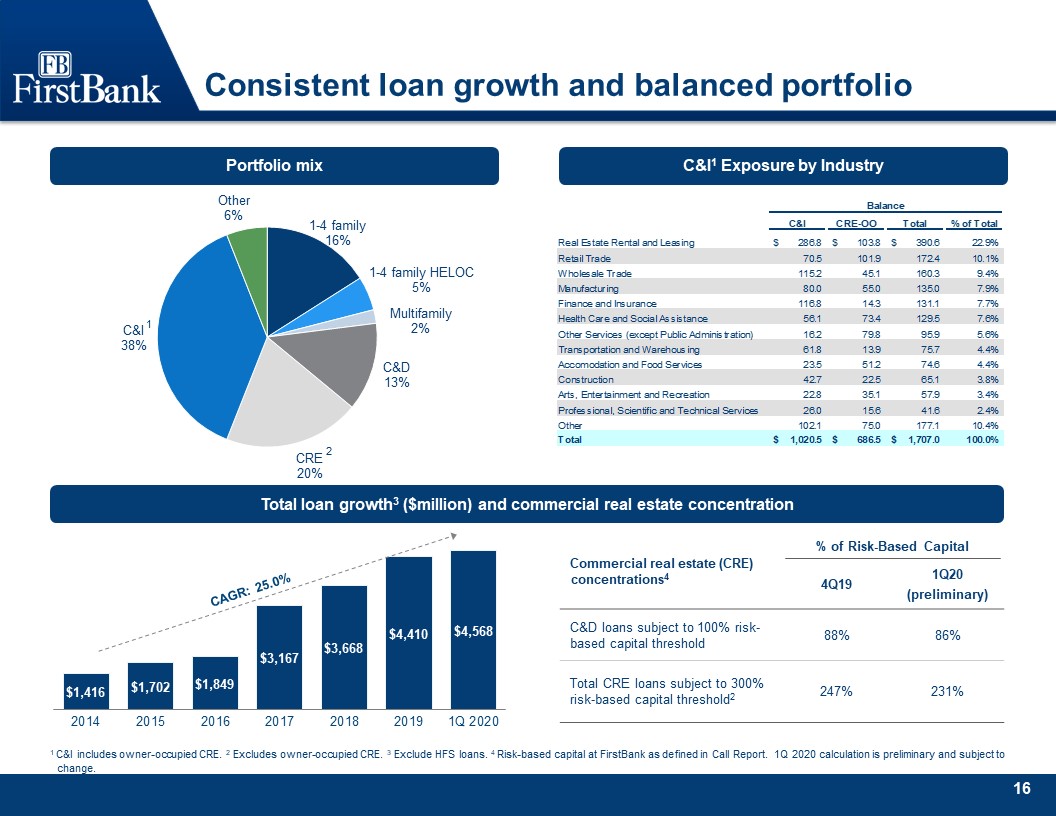
Consistent loan growth and balanced portfolio Total loan growth3 ($million) and commercial real estate
concentration Commercial real estate (CRE) concentrations4 % of Risk-Based Capital 4Q19 1Q20(preliminary) C&D loans subject to 100% risk-based capital threshold 88% 86% Total CRE loans subject to 300% risk-based capital
threshold2 247% 231% Portfolio mix 1 C&I includes owner-occupied CRE. 2 Excludes owner-occupied CRE. 3 Exclude HFS loans. 4 Risk-based capital at FirstBank as defined in Call Report. 1Q 2020 calculation is preliminary and subject to
change. C&I1 Exposure by Industry 1 2
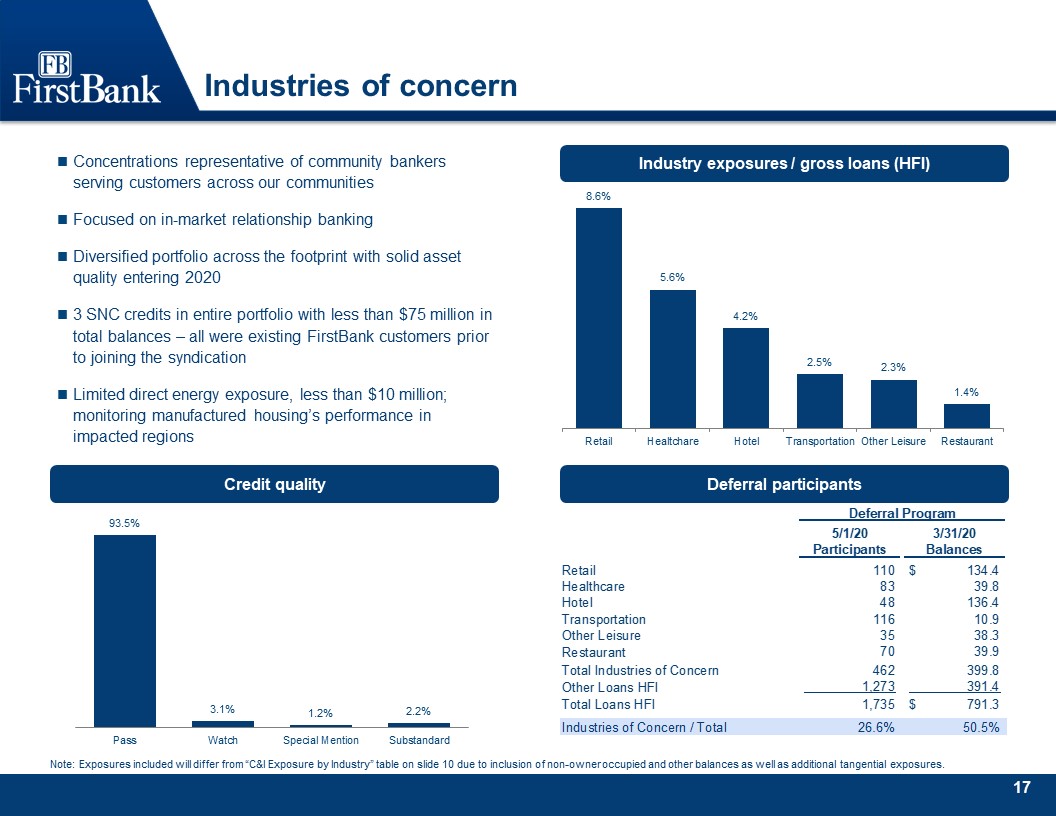
Concentrations representative of community bankers serving customers across our communitiesFocused on
in-market relationship bankingDiversified portfolio across the footprint with solid asset quality entering 20203 SNC credits in entire portfolio with less than $75 million in total balances – all were existing FirstBank customers prior to
joining the syndicationLimited direct energy exposure, less than $10 million; monitoring manufactured housing’s performance in impacted regions Industries of concern Deferral participants Credit quality Industry exposures / gross loans
(HFI) Note: Exposures included will differ from “C&I Exposure by Industry” table on slide 10 due to inclusion of non-owner occupied and other balances as well as additional tangential exposures.
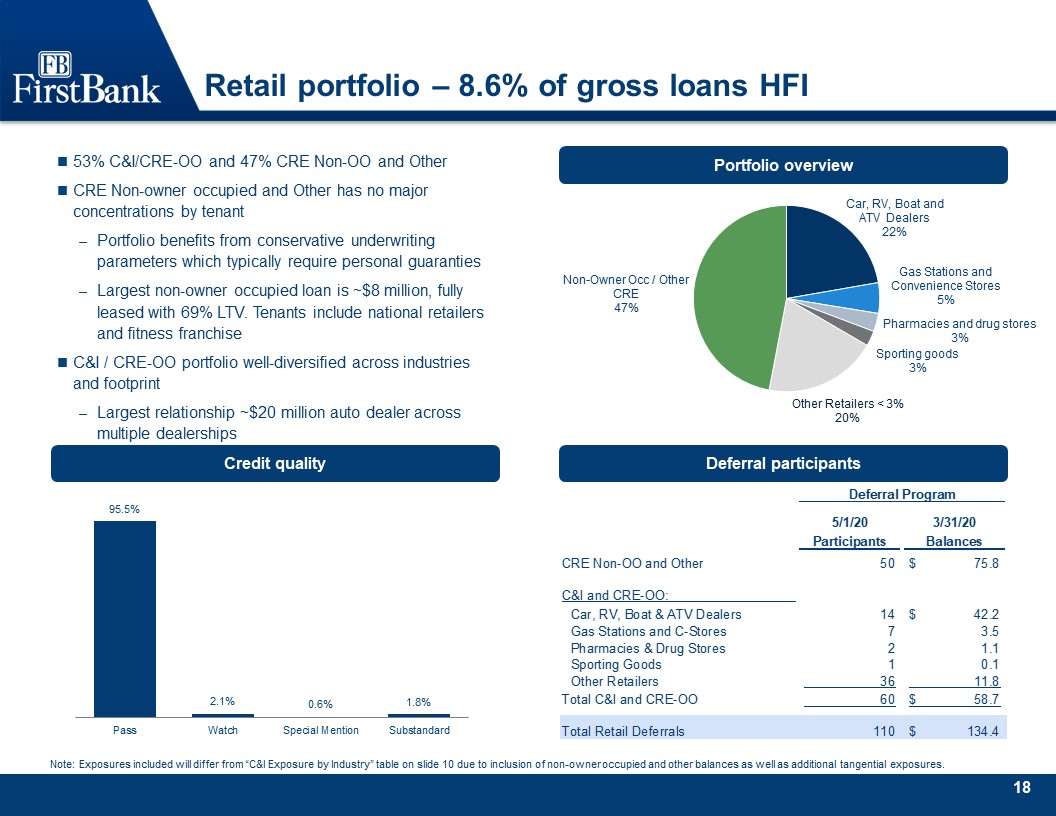
Retail portfolio – 8.6% of gross loans HFI Portfolio overview Deferral participants Credit
quality 53% C&I/CRE-OO and 47% CRE Non-OO and OtherCRE Non-owner occupied and Other has no major concentrations by tenantPortfolio benefits from conservative underwriting parameters which typically require personal guarantiesLargest
non-owner occupied loan is ~$8 million, fully leased with 69% LTV. Tenants include national retailers and fitness franchiseC&I / CRE-OO portfolio well-diversified across industries and footprintLargest relationship ~$20 million auto dealer
across multiple dealerships Note: Exposures included will differ from “C&I Exposure by Industry” table on slide 10 due to inclusion of non-owner occupied and other balances as well as additional tangential exposures.

Healthcare & social assistance portfolio – 5.6% of loans HFI Portfolio overview Deferral
participants Credit quality Portfolio diversified over several segments across the footprintAssisted Living / Nursing Care / Continuing Care property types include assisted living with the largest loan ~$10M, one continuing care facility loan
~$21M, and skilled nursing care operators with the largest loan outstanding of ~$11MLoans to offices of physicians are spread across the franchiseMental health and substance abuse includes a ~$28 million credit in good standing Note: Exposures
included will differ from “C&I Exposure by Industry” table on slide 10 due to inclusion of non-owner occupied and other balances as well as additional tangential exposures.
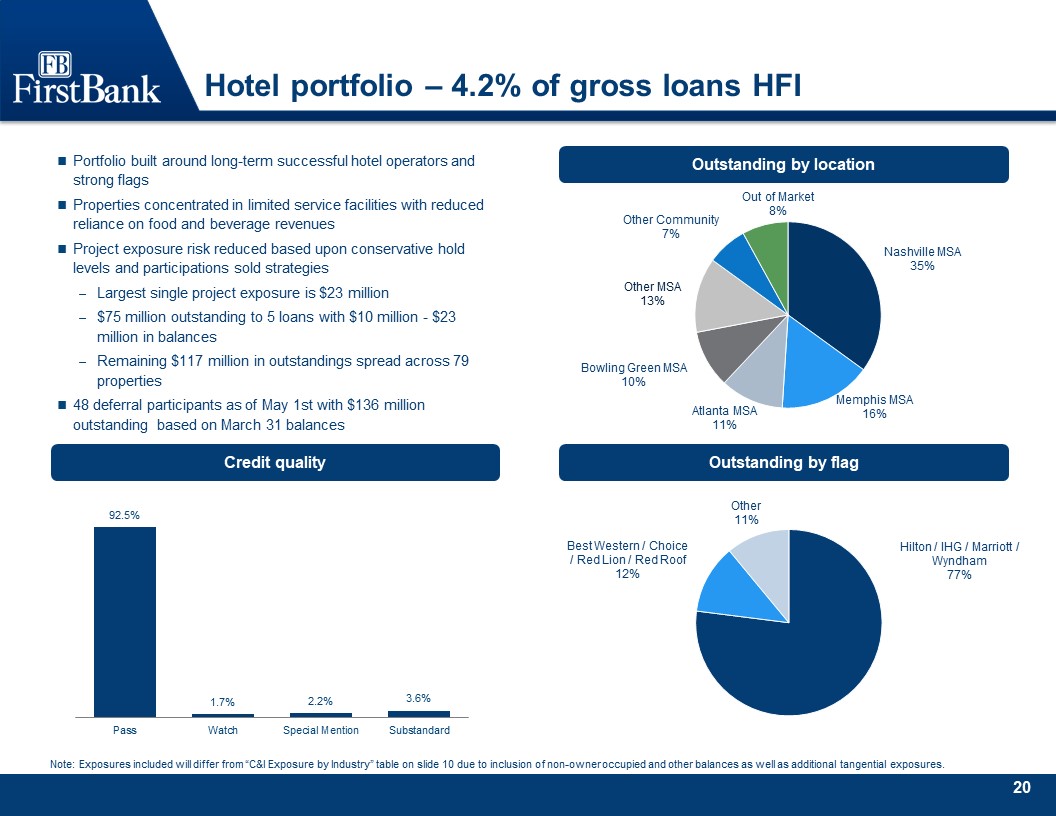
Hotel portfolio – 4.2% of gross loans HFI Outstanding by location Outstanding by flag Credit
quality Portfolio built around long-term successful hotel operators and strong flagsProperties concentrated in limited service facilities with reduced reliance on food and beverage revenuesProject exposure risk reduced based upon conservative
hold levels and participations sold strategiesLargest single project exposure is $23 million$75 million outstanding to 5 loans with $10 million - $23 million in balancesRemaining $117 million in outstandings spread across 79 properties48
deferral participants as of May 1st with $136 million outstanding based on March 31 balances Note: Exposures included will differ from “C&I Exposure by Industry” table on slide 10 due to inclusion of non-owner occupied and other balances
as well as additional tangential exposures.
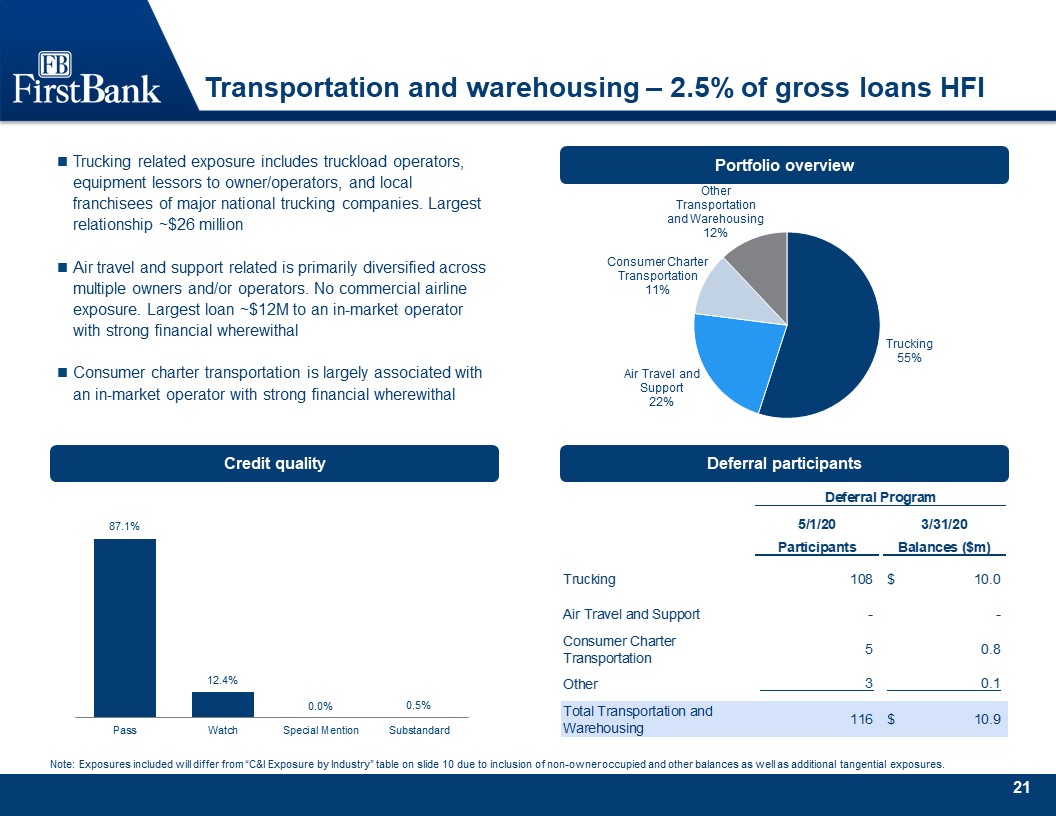
Transportation and warehousing – 2.5% of gross loans HFI Portfolio overview Deferral
participants Credit quality Trucking related exposure includes truckload operators, equipment lessors to owner/operators, and local franchisees of major national trucking companies. Largest relationship ~$26 millionAir travel and support
related is primarily diversified across multiple owners and/or operators. No commercial airline exposure. Largest loan ~$12M to an in-market operator with strong financial wherewithalConsumer charter transportation is largely associated with an
in-market operator with strong financial wherewithal Note: Exposures included will differ from “C&I Exposure by Industry” table on slide 10 due to inclusion of non-owner occupied and other balances as well as additional tangential
exposures.
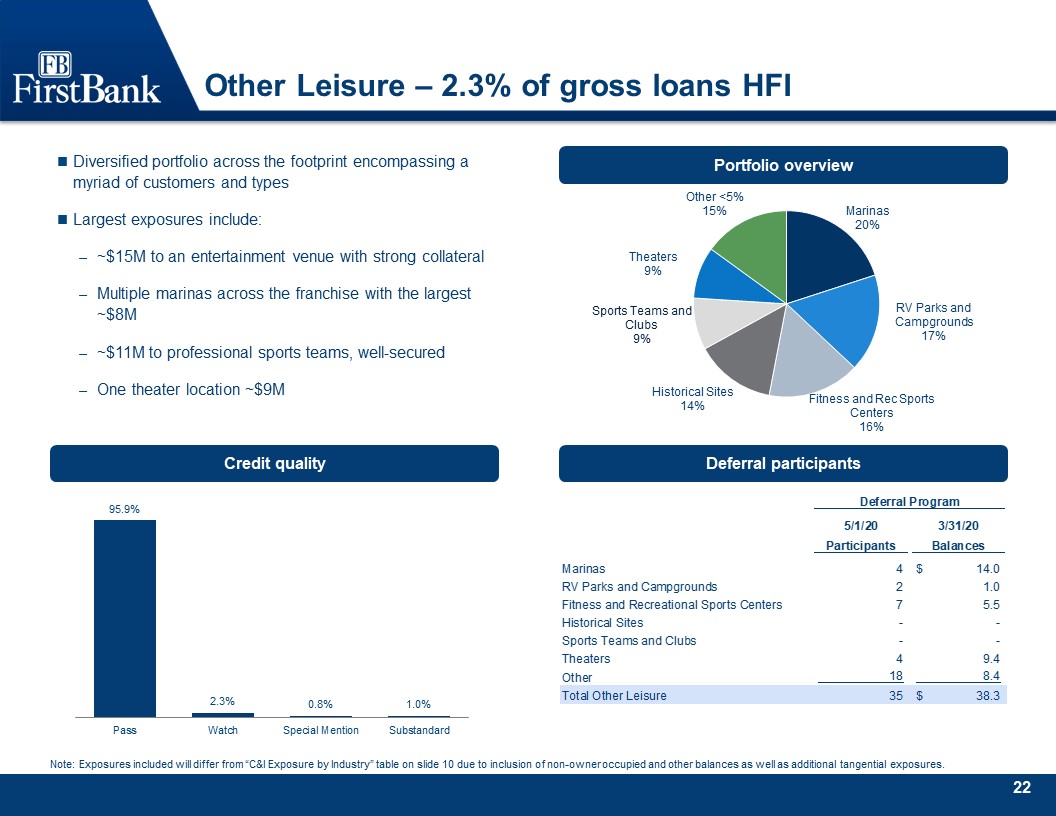
Other Leisure – 2.3% of gross loans HFI Portfolio overview Deferral participants Credit
quality Diversified portfolio across the footprint encompassing a myriad of customers and typesLargest exposures include: ~$15M to an entertainment venue with strong collateralMultiple marinas across the franchise with the largest ~$8M~$11M to
professional sports teams, well-securedOne theater location ~$9M Note: Exposures included will differ from “C&I Exposure by Industry” table on slide 10 due to inclusion of non-owner occupied and other balances as well as additional
tangential exposures.
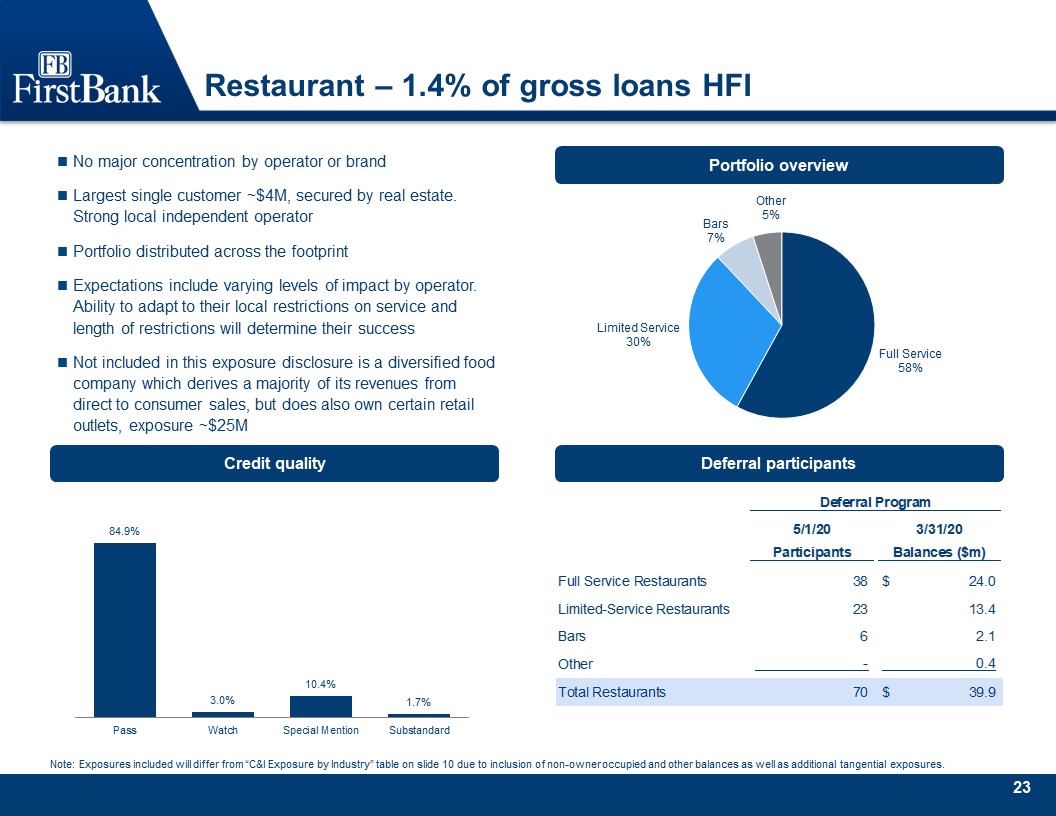
Restaurant – 1.4% of gross loans HFI Portfolio overview Deferral participants Credit quality No major
concentration by operator or brandLargest single customer ~$4M, secured by real estate. Strong local independent operatorPortfolio distributed across the footprintExpectations include varying levels of impact by operator. Ability to adapt to
their local restrictions on service and length of restrictions will determine their successNot included in this exposure disclosure is a diversified food company which derives a majority of its revenues from direct to consumer sales, but does
also own certain retail outlets, exposure ~$25M Note: Exposures included will differ from “C&I Exposure by Industry” table on slide 10 due to inclusion of non-owner occupied and other balances as well as additional tangential exposures.
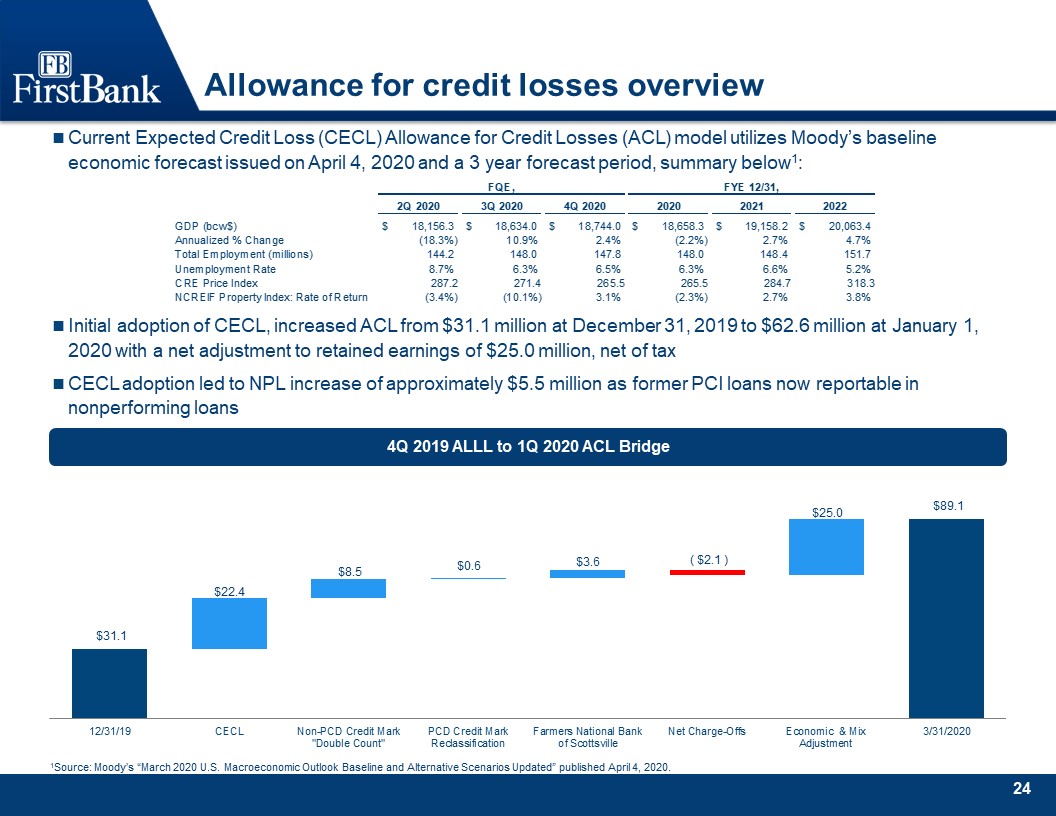
Allowance for credit losses overview 4Q 2019 ALLL to 1Q 2020 ACL Bridge Current Expected Credit Loss
(CECL) Allowance for Credit Losses (ACL) model utilizes Moody’s baseline economic forecast issued on April 4, 2020 and a 3 year forecast period, summary below1:Initial adoption of CECL, increased ACL from $31.1 million at December 31, 2019 to
$62.6 million at January 1, 2020 with a net adjustment to retained earnings of $25.0 million, net of taxCECL adoption led to NPL increase of approximately $5.5 million as former PCI loans now reportable in nonperforming loans 1Source: Moody’s
“March 2020 U.S. Macroeconomic Outlook Baseline and Alternative Scenarios Updated” published April 4, 2020.
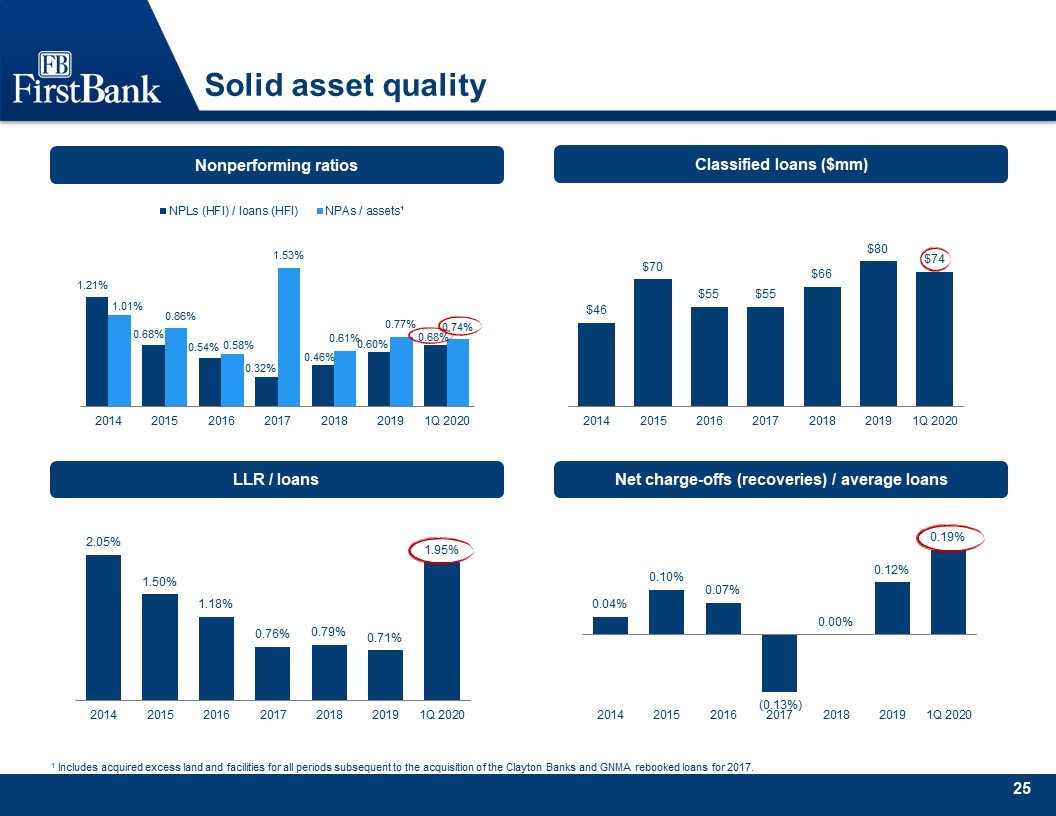
Solid asset quality 1 Includes acquired excess land and facilities for all periods subsequent to the
acquisition of the Clayton Banks and GNMA rebooked loans for 2017. Nonperforming ratios Classified loans ($mm) LLR / loans Net charge-offs (recoveries) / average loans
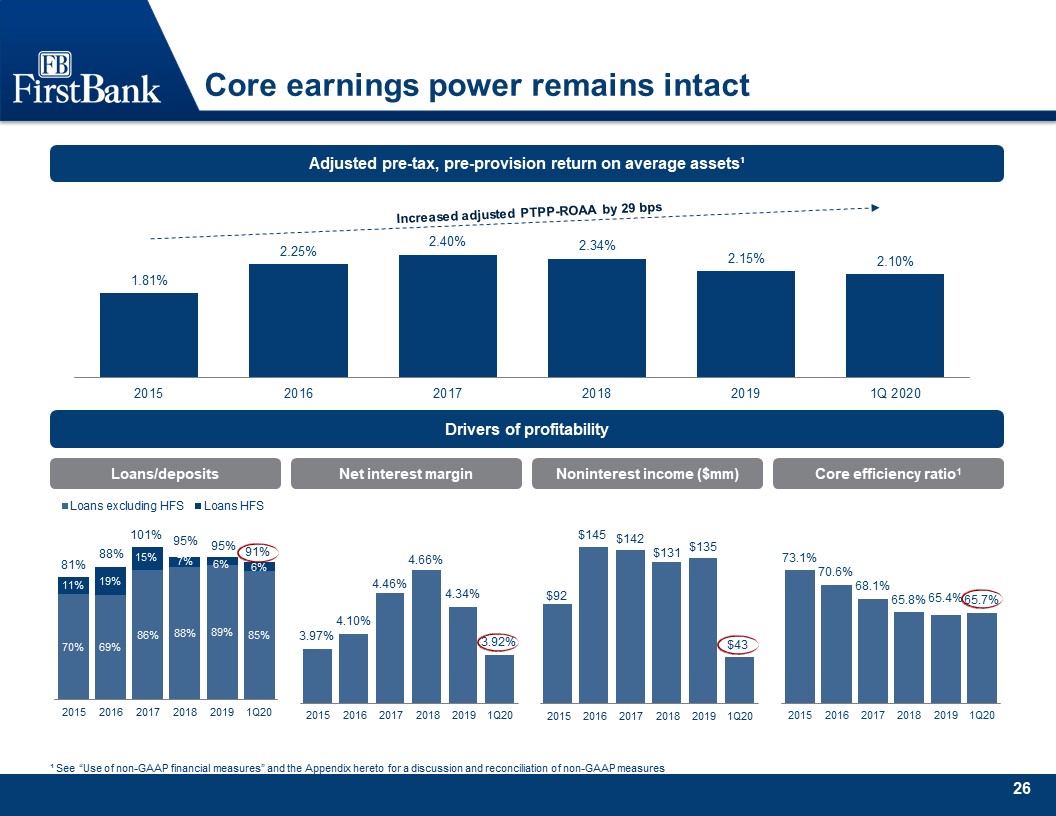
Core earnings power remains intact ¹ See “Use of non-GAAP financial measures” and the Appendix hereto
for a discussion and reconciliation of non-GAAP measures Adjusted pre-tax, pre-provision return on average assets¹ Drivers of profitability Net interest margin Noninterest income ($mm) Loans/deposits Core efficiency
ratio1 Increased adjusted PTPP-ROAA by 29 bps
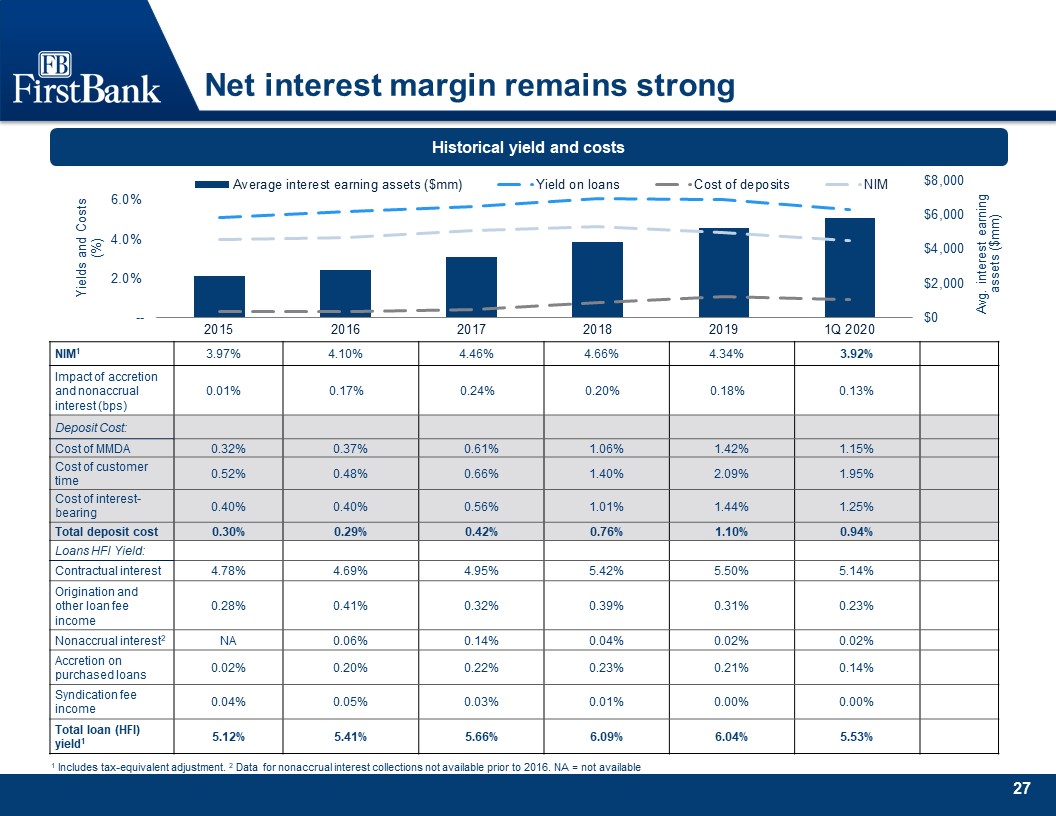
Net interest margin remains strong 1 Includes tax-equivalent adjustment. 2 Data for nonaccrual interest
collections not available prior to 2016. NA = not available Historical yield and costs NIM1 3.97% 4.10% 4.46% 4.66% 4.34% 3.92% Impact of accretion and nonaccrual interest (bps)
0.01% 0.17% 0.24% 0.20% 0.18% 0.13% Deposit Cost: Cost of MMDA 0.32% 0.37% 0.61% 1.06% 1.42% 1.15% Cost of customer time 0.52% 0.48% 0.66% 1.40% 2.09% 1.95% Cost of
interest-bearing 0.40% 0.40% 0.56% 1.01% 1.44% 1.25% Total deposit cost 0.30% 0.29% 0.42% 0.76% 1.10% 0.94% Loans HFI Yield: Contractual interest 4.78% 4.69% 4.95% 5.42% 5.50% 5.14% Origination and
other loan fee income 0.28% 0.41% 0.32% 0.39% 0.31% 0.23% Nonaccrual interest2 NA 0.06% 0.14% 0.04% 0.02% 0.02% Accretion on purchased loans 0.02% 0.20% 0.22% 0.23% 0.21% 0.14% Syndication fee
income 0.04% 0.05% 0.03% 0.01% 0.00% 0.00% Total loan (HFI) yield1 5.12% 5.41% 5.66% 6.09% 6.04% 5.53%
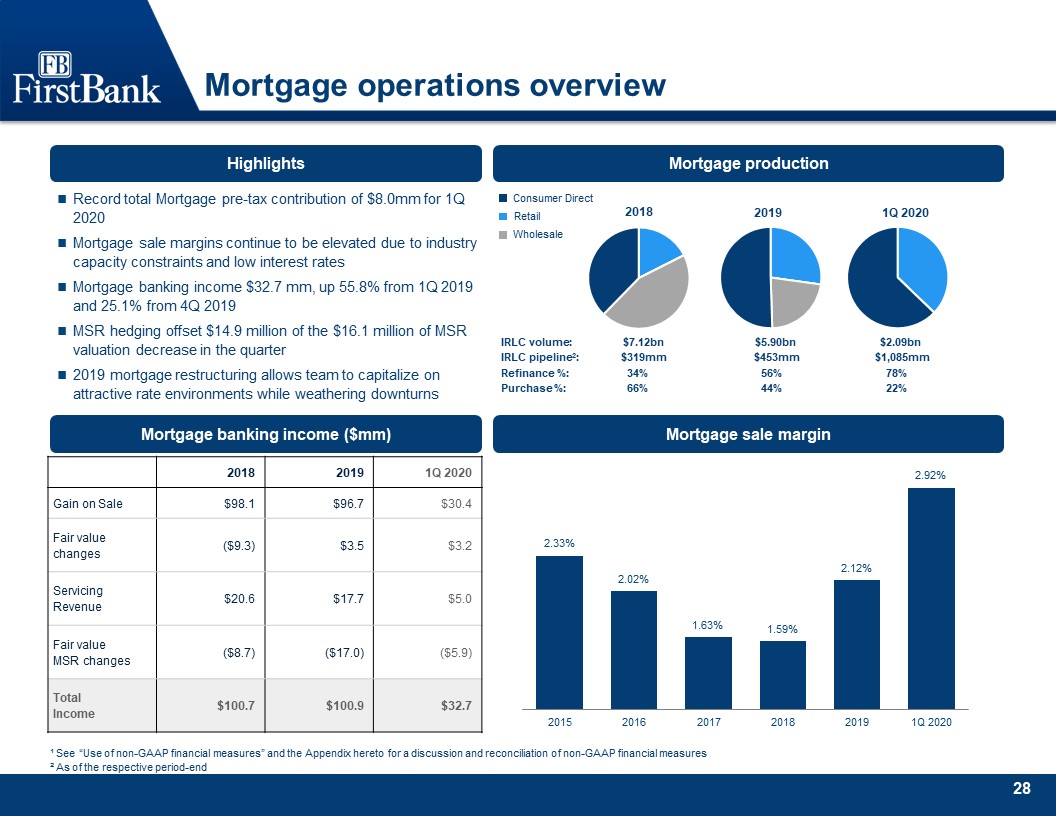
Mortgage operations overview Highlights Record total Mortgage pre-tax contribution of $8.0mm for 1Q
2020Mortgage sale margins continue to be elevated due to industry capacity constraints and low interest ratesMortgage banking income $32.7 mm, up 55.8% from 1Q 2019 and 25.1% from 4Q 2019MSR hedging offset $14.9 million of the $16.1 million of
MSR valuation decrease in the quarter2019 mortgage restructuring allows team to capitalize on attractive rate environments while weathering downturns Mortgage banking income ($mm) 2018 2019 1Q 2020 Gain on Sale $98.1 $96.7 $30.4 Fair
value changes ($9.3) $3.5 $3.2 Servicing Revenue $20.6 $17.7 $5.0 Fair value MSR changes ($8.7) ($17.0) ($5.9) Total Income $100.7 $100.9 $32.7 ¹ See “Use of non-GAAP financial measures” and the Appendix hereto for a discussion
and reconciliation of non-GAAP financial measures² As of the respective period-end Mortgage production Mortgage sale margin IRLC volume: IRLC pipeline2: Refinance %: Purchase %: $7.12bn $5.90bn $2.09bn $319mm $453mm $1,085mm
34% 56% 78% 66% 44% 22% Consumer Direct Wholesale Retail
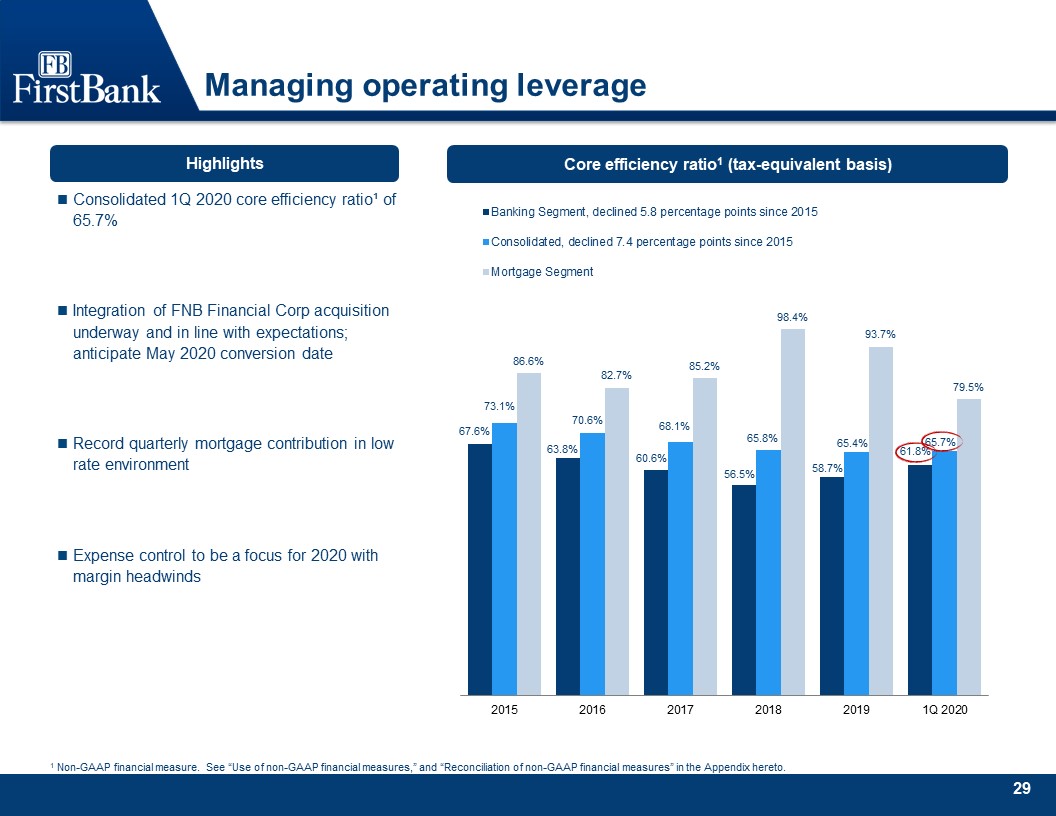
Managing operating leverage Core efficiency ratio1 (tax-equivalent basis) Highlights 1 Non-GAAP
financial measure. See “Use of non-GAAP financial measures,” and “Reconciliation of non-GAAP financial measures” in the Appendix hereto. Consolidated 1Q 2020 core efficiency ratio¹ of 65.7%Integration of FNB Financial Corp acquisition
underway and in line with expectations; anticipate May 2020 conversion dateRecord quarterly mortgage contribution in low rate environmentExpense control to be a focus for 2020 with margin headwinds
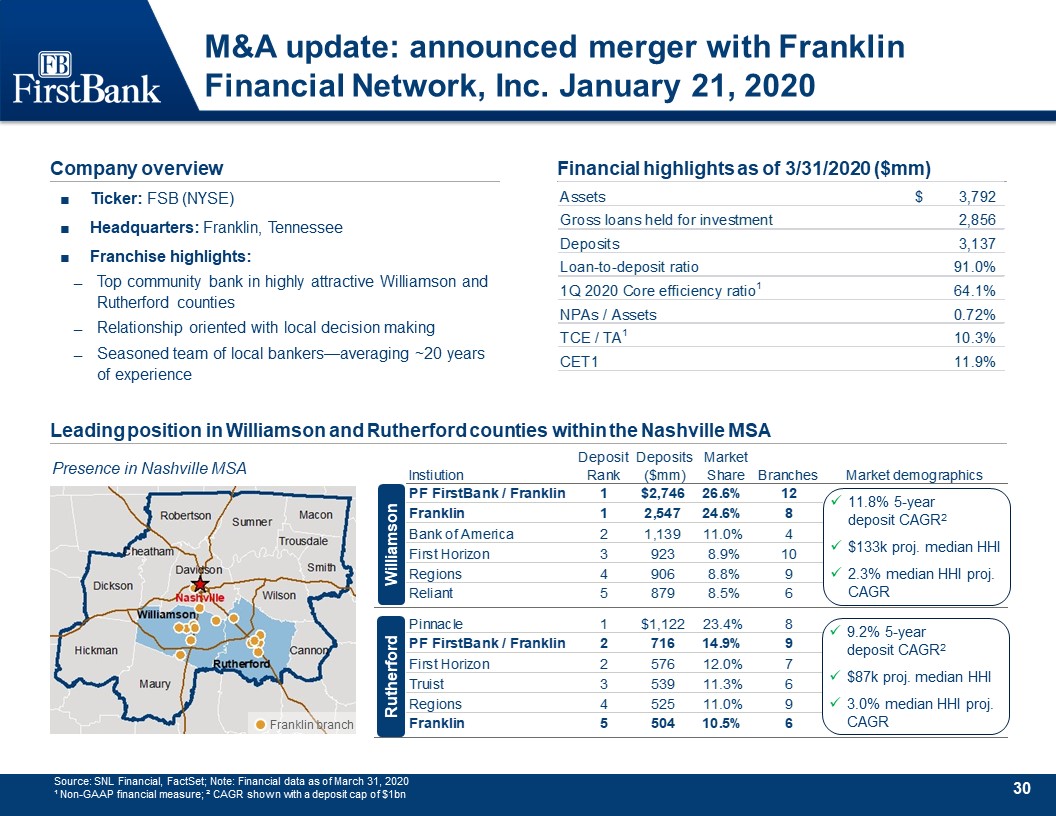
Company overview Ticker: FSB (NYSE)Headquarters: Franklin, TennesseeFranchise highlights: Top community
bank in highly attractive Williamson and Rutherford countiesRelationship oriented with local decision makingSeasoned team of local bankers—averaging ~20 years of experience Financial highlights as of 3/31/2020 ($mm) Leading position in
Williamson and Rutherford counties within the Nashville MSA Source: SNL Financial, FactSet; Note: Financial data as of March 31, 2020¹ Non-GAAP financial measure; ² CAGR shown with a deposit cap of $1bn Williamson Rutherford 11.8% 5-year
deposit CAGR2$133k proj. median HHI2.3% median HHI proj. CAGR Presence in Nashville MSA 9.2% 5-year deposit CAGR2$87k proj. median HHI3.0% median HHI proj. CAGR *PLEASE DO NOT DELETE THIS TEXT BOX*This map was created using ArcMap.Updates
and edits can be easily done using the ArcMap program, contact GCFO-Presentations to make edits.NOTE: If the map is ungrouped it can no longer be edited in ArcMap.Workflow reference number is: 3105626-002 Franklin branch M&A update:
announced merger with Franklin Financial Network, Inc. January 21, 2020

Appendix
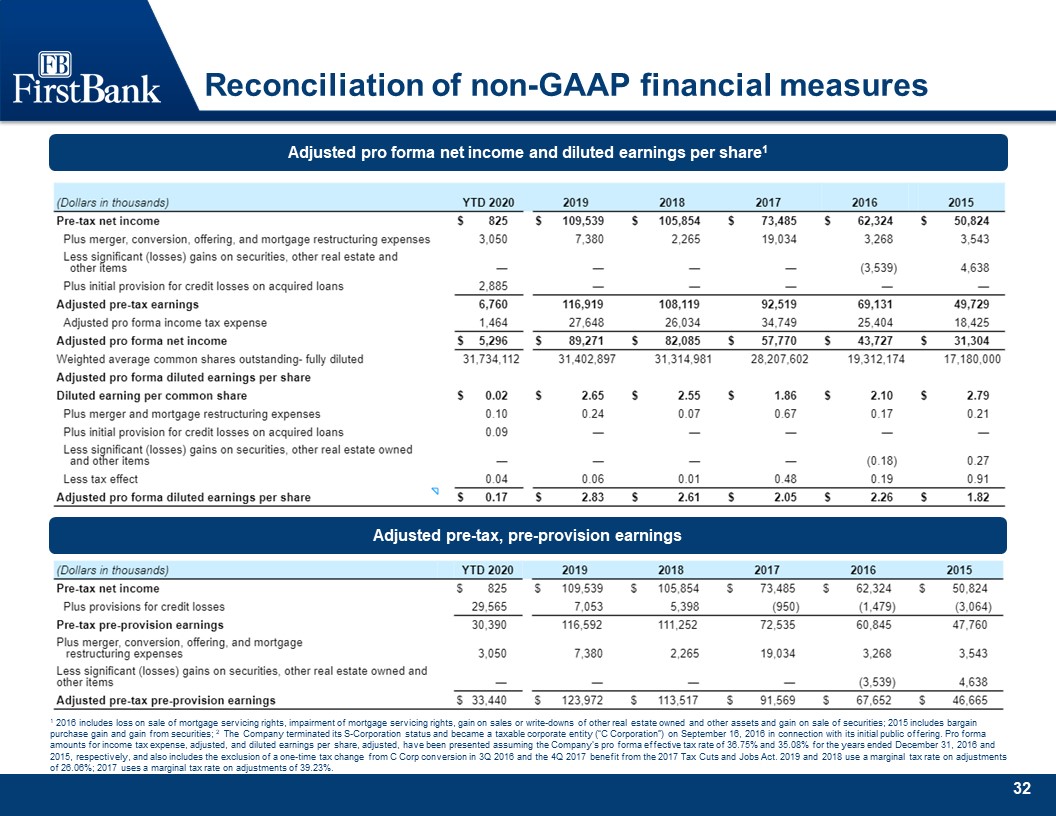
Reconciliation of non-GAAP financial measures Adjusted pro forma net income and diluted earnings per
share1 1 2016 includes loss on sale of mortgage servicing rights, impairment of mortgage servicing rights, gain on sales or write-downs of other real estate owned and other assets and gain on sale of securities; 2015 includes bargain purchase
gain and gain from securities; 2 The Company terminated its S-Corporation status and became a taxable corporate entity (“C Corporation”) on September 16, 2016 in connection with its initial public offering. Pro forma amounts for income tax
expense, adjusted, and diluted earnings per share, adjusted, have been presented assuming the Company’s pro forma effective tax rate of 36.75% and 35.08% for the years ended December 31, 2016 and 2015, respectively, and also includes the
exclusion of a one-time tax change from C Corp conversion in 3Q 2016 and the 4Q 2017 benefit from the 2017 Tax Cuts and Jobs Act. 2019 and 2018 use a marginal tax rate on adjustments of 26.06%; 2017 uses a marginal tax rate on adjustments of
39.23%. Adjusted pre-tax, pre-provision earnings
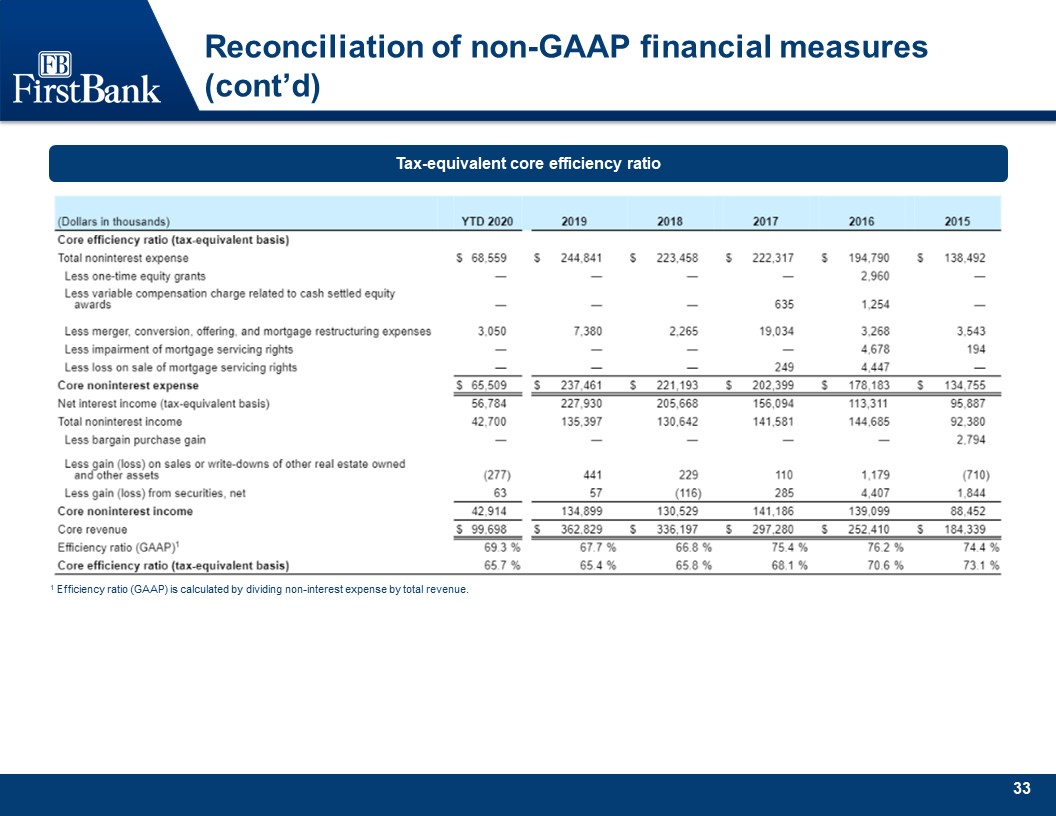
Reconciliation of non-GAAP financial measures (cont’d) Tax-equivalent core efficiency ratio 1
Efficiency ratio (GAAP) is calculated by dividing non-interest expense by total revenue.
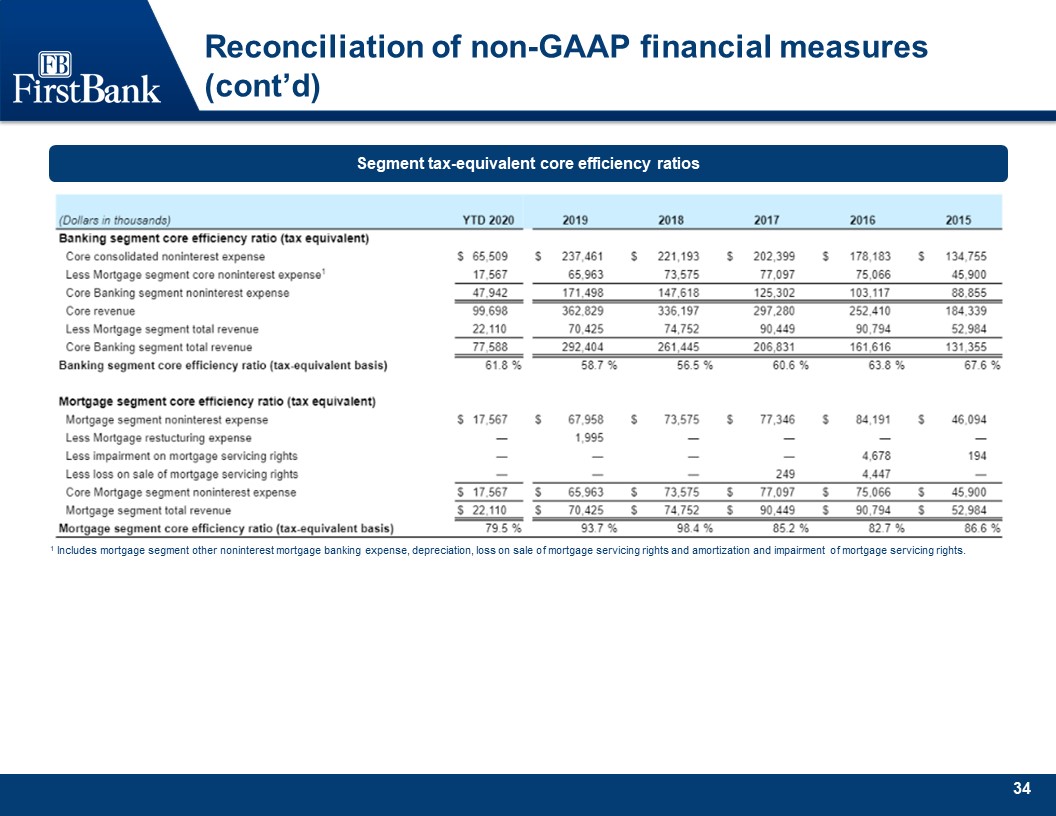
Reconciliation of non-GAAP financial measures (cont’d) Segment tax-equivalent core efficiency ratios 1
Includes mortgage segment other noninterest mortgage banking expense, depreciation, loss on sale of mortgage servicing rights and amortization and impairment of mortgage servicing rights.
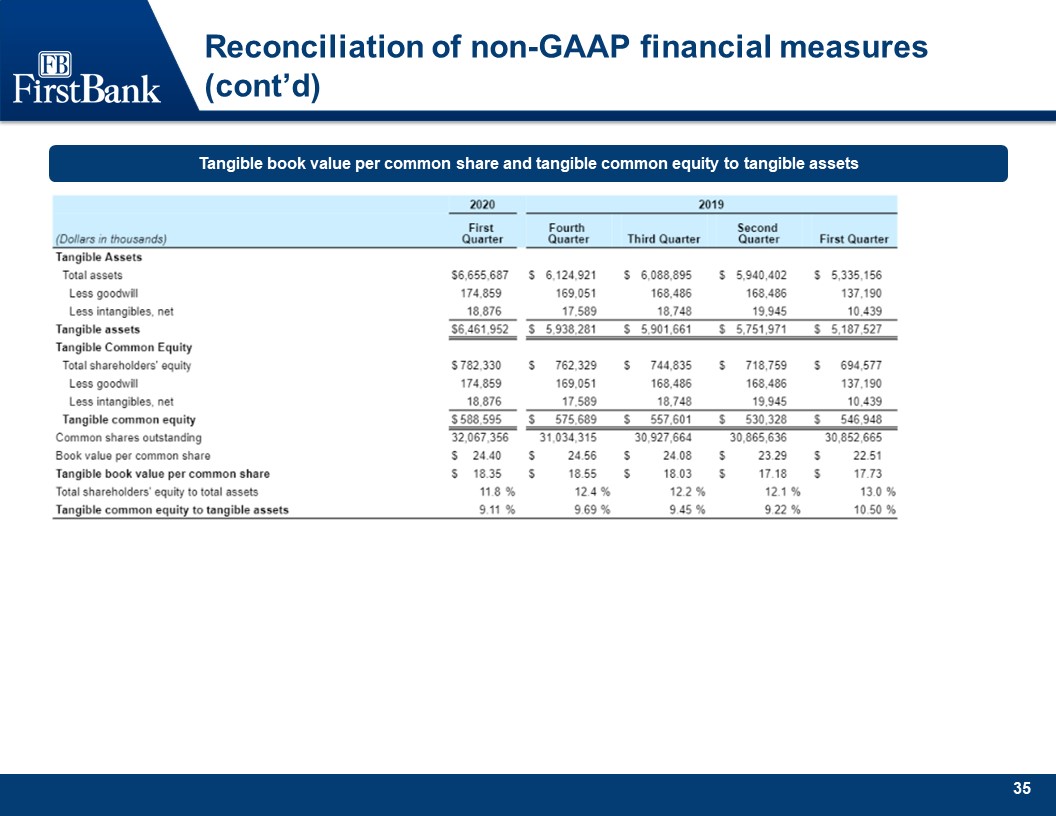
Reconciliation of non-GAAP financial measures (cont’d) Tangible book value per common share and tangible
common equity to tangible assets

Reconciliation of non-GAAP financial measures (cont’d) Adjusted pre-tax, pre-provision, return on
average tangible common equity Adjusted pro forma return on average tangible common equity
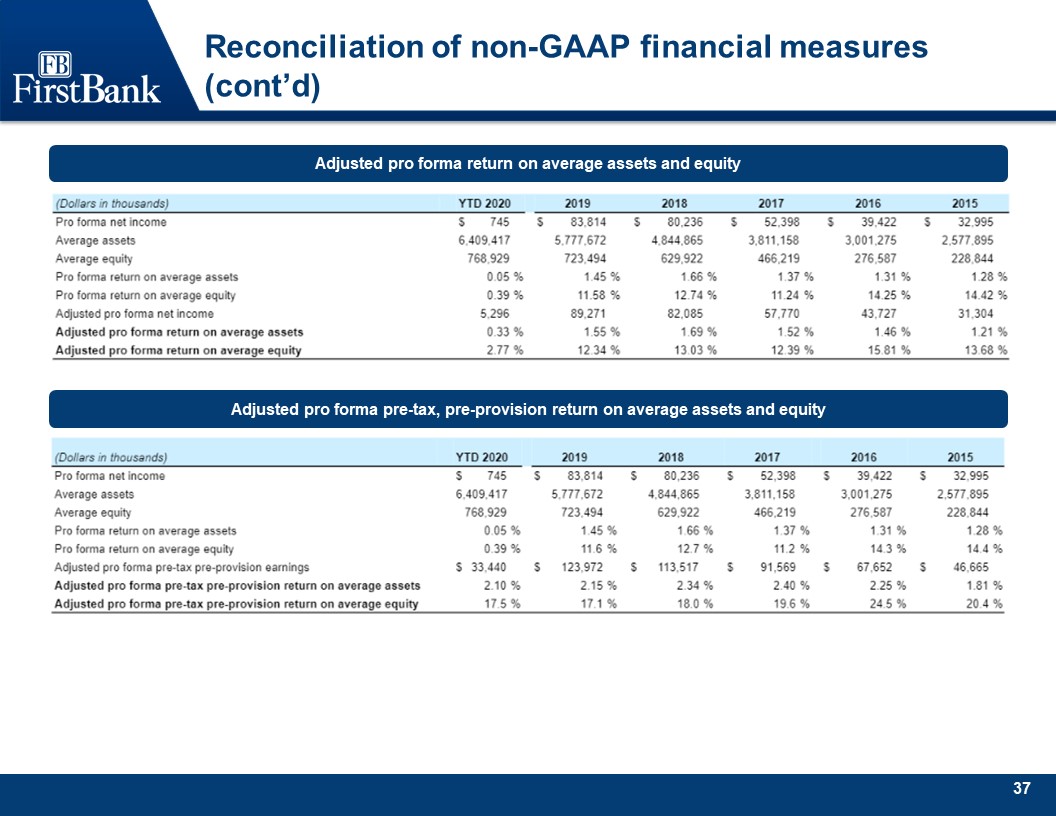
Reconciliation of non-GAAP financial measures (cont’d) Adjusted pro forma return on average assets and
equity Adjusted pro forma pre-tax, pre-provision return on average assets and equity