Attached files
| file | filename |
|---|---|
| 8-K - FORM 8-K - Eagle Bancorp Montana, Inc. | f8k_050520.htm |
Exhibit 99.1
D.A. DAVIDSON FINANCIAL SERVICES CONFERENCE MAY 2020

CAUTIONARY NOTICE REGARDING FORWARD - LOOKING STATEMENTS 2 Certain statements contained in this presentation that are not statements of historical fact are forward - looking statements. These forward - looking statements, which are based on certain assumptions and describe our future plans, strategies and expectations, can generally be identified by the use of the words “may”, “would”, “could”,“will”, “expect”, “anticipate”, “project”, “believe”, “intend”, “plan” and “estimate”, as well as similar words and expressions. These forward - looking statements include statements related to our projected growth, our anticipated acquisitions, including statements related to the expected timing, completion and other effects our anticipated acquisitions, our anticipated future financial performance, and management’s long - term performance goals, as well as statements relating to the anticipated effects on results of operations and financial condition from expected developments or events, or business and growth strategies, including projections of future amortization and accretion, the impact of the anticipated internal growth and plans to establish or acquire banks. These forward - looking statements involve significant risks and uncertainties that could cause our actual results to differ materially from those anticipated in such statements. Potential risks and uncertainties include the following: > the duration and impact of the COVID - 19 pandemic, including but not limited to the closure of non - essential businesses, which may adversely impact our customers, and the associated governmental containment actions, may vary from our current expectations; > the diversion of management time on issues related to integration; > the effect of our acquisitions, including failure to achieve expected revenue growth and/or expense savings, the failure to effectively integrate their operations and the difficu lti es and risks inherent with entering new markets; > general economic conditions (both generally and in our markets) may be less favorable than expected, which could result in, among other things, a continued deterioration in credit quality, a further reduction in demand for credit and a further decline in real estate values; > our ability to raise additional capital may be impaired if markets are disrupted or become more volatile; > costs or difficulties related to the integration of the banks we may acquire may be greater than expected; > restrictions or conditions imposed by our regulators on our operations may make it more difficult for us to achieve our goals; > governmental monetary and fiscal polices as well as legislative or regulatory changes, including changes in accounting standards and compliance requirements, may adversely affect us; > competitive pressures among depository and other financial institutions may increase significantly; > changes in the interest rate environment may reduce margins or the volumes or values of the loans we make or have acquired; > other financial institutions have greater financial resources and may be able to develop or acquire products that enable them to compete more successfully than we can; > our ability to attract and retain key personnel can be affected by the increased competition for experienced employees in the banking industry; > adverse changes may occur in the bond and equity markets; > war or terrorist activities may cause further deterioration in the economy or cause instability in credit markets; > economic, governmental or other factors may prevent the projected population, residential and commercial growth in the markets in which we operate; and > we will or may continue to face the risk factors discussed from time to time in the periodic reports we file with the SEC, including our Form 10 - K for the fiscal year ended December 31, 2019. For these forward - looking statements, we claim the protection of the safe harbor for forward - looking statements contained in the Private Securities Litigation Reform Act of 1995 . You should not place undue reliance on the forward - looking statements, which speak only as of the date of this presentation . All subsequent written and oral forward - looking statements attributable to us or any person acting on our behalf are expressly qualified in their entirety by the cautionary statements contained or referred to in this section . We undertake no obligation to publicly update or revise any forward - looking statements, whether as a result of new information, future events or otherwise . See Item 1 A, Risk Factors, in our Annual Report on Form 10 - K for the year ended December 31 , 2019 , and otherwise in our SEC reports and filings, for a description of some of the important factors that may affect actual outcomes .

COMMUNITY FOCUSED INSTITUTION □ Eagle Bancorp Montana, Inc . is the holding company for Opportunity Bank of Montana ; established in 1922 , the Bank is the 4 th largest bank headquartered in Montana with 23 banking offices and has deeply embedded itself as the bank of choice within the community □ Continued execution on commercial bank model following the transition from a thrift ▪ Established commercial bank charter in 2014; rebranded as Opportunity Bank of Montana ▪ Improving loan mix with higher yielding CRE credits and increasing commercial loans ▪ Improving deposit mix: non - CDs, at 74% of total deposits as of March 31, 2020 ▪ Positioned for NIM expansion and improved profitability ▪ Core lines of business include: retail lending, commercial lending, deposit products and services and mortgage origination ▪ Interest rate risk profile showing asset sensitive balance sheet prepared for an increasing rate environment □ Continuation of strong credit culture; excellent credit quality with NPAs of 52 bps as of March 31, 2020 □ Track record of execution on strategic initiatives: ▪ Announced Acquisition of Western Holding Company of Wolf Point in August 2019, completed January 2020 ▪ Announced Acquisition of Big Muddy Bancorp, Inc. in August 2018, completed January 2019 ▪ Announced Acquisition of Ruby Valley Bank in September 2017, completed January 2018 ▪ Successful acquisition and integration of seven branches from Sterling Financial in 2012 3

COMPANY OVERVIEW □ 23 branches in Montana operating under the Company’s banking subsidiary – Opportunity Bank of Montana □ Balance Sheet (3/31/20): ▪ Assets $1.159 billion ▪ Gross Loans $822.0 million ▪ Deposits $888.2 million ▪ Total equity $133.7 million □ Asset Quality (3/31/20): ▪ NPAs/assets – 0.52% □ Profitability for 1Q20: ▪ Net income of $3.9 million ▪ NIM – 4. 04% ▪ ROAA – 1.36% ▪ ROAE – 11.87% • 23 Bank Branches 4

EXPERIENCED EXECUTIVE MANAGEMENT 5

EXPERIENCED BOARD Director Experience Year E le c t e d Peter J. Johnson President and CEO of Opportunity Bank and the Company 2007 Rick F. Hays Retired President of a Montana telecommunications company 2007 Thomas J. McCarvel Retired Vice President of Carroll College 1998 Maureen J. Rude Retired Executive Director of Montana Homeownership Network/NeighborWorks 2010 Montana Shavon R. Cape Co - founder of JWT Capital, LLC, a real estate development and operating company 2015 Tanya J. Chemodurow President of Abatement Contractors of Montana, LLC, specializing in environmental 2015 remediation Kenneth M.Walsh Retired Market President of Opportunity Bank, former CEO of Ruby Valley Bank 2018 Corey Jensen President/CEO of Vision Net, Inc. 2018 Benjamin G. Ruddy Vice President, Agricultural Division, of Opportunity Bank, former President of The 2019 State Bank of Townsend Cynthia A. Utterback Tax Business Unit Director and Shareholder at Anderson ZurMuehlen & Co. CPAs 2019 6

□ Continue to diversify our loan portfolio into commercial (C&I), commercial real estate and agriculture □ Attract and retain lower - cost core deposits □ Continue to expand our franchise through selective acquisitions and branch additions □ Maintain high asset quality levels □ Continue to operate as a community - oriented financial institution BUSINESS STRATEGY 7

□ Since the acquisitions, the 4 th largest banking institution headquartered in Montana in terms of deposits □ Footprint with presence in the key Montana markets DEPOSIT MARKET SHARE - STATE OF MONTANA Institution (ST) 2019 Rank 2018 Rank B r a n c h e s Total Deposits In Market ($000) 2 0 1 9 To t a l M a r k e t Share ( % ) Montana Glacier Bancorp Inc. (MT) First Interstate BancSystem (MT) Wells Fargo & Co. (CA) Stockman Financial Corp. (MT) U.S. Bancorp (MN) 1 2 3 4 5 1 2 3 4 5 6 8 4 8 3 0 3 8 2 3 4,875,213 4,333,136 2,773,890 2,748,674 2,497,251 19.93 17.72 11.34 11.24 10.21 Eagle Bancorp Montana Inc. (MT) 6 6 2 2 7 4 8 , 4 33 3 . 0 6 Montana Security Inc. (MT) 7 7 6 669 , 9 2 1 2 . 7 4 Yellowstone Holding Co. (MT) 8 8 9 585 , 4 9 6 2 . 3 9 Bitterroot Holding Co. (MT) 9 1 0 1 5 506 , 8 0 2 2 . 0 7 Heartland Financial USA Inc. (IA) 1 0 9 9 438 , 3 4 9 1 . 7 9 Total For Institutions In Market 381 24,459,146 Source: S&P Global Market Intelligence Deposit data as of 6/30/19 8

So u r c e : MONTANA METROPOLITAN MARKETS Deposit Market Share – Missoula, MSA The Missoula MSA is the 2 nd largest metropolitan area in Montana by population □ Home to the University of Montana (11,000+ students) □ Regional hub for a wide range of retail, professional and service activities S&P Global Market Intelligence Deposit Market Share – Billings, MSA The Billings MSA is the largest metropolitan area in Montana by population □ Significant investment and activity by energy industry □ Regional hub for healthcare and trade Institution (ST) 2019 Rank 2018 Rank B r a n c h es T o t a l Deposits In Market ($000) 2 0 1 9 T o t a l M a r k e t S ha re ( % ) Missoula, MT First Interstate BancSystem (MT) 1 1 3 6 6 5 , 8 9 0 2 7 . 2 0 Glacier Bancorp Inc. (MT) 2 2 9 6 6 0 , 3 7 6 2 6 . 9 7 U.S. Bancorp (MN) 3 3 2 2 8 7 , 0 2 8 1 1 . 7 2 Wells Fargo & Co. (CA) 4 4 2 2 6 0 , 8 5 1 1 0 . 6 5 Bitterroot Holding Co. (MT) 5 5 7 2 2 4 , 9 0 4 9 . 1 9 Stockman Financial Corp. (MT) 6 6 3 1 4 6 , 2 4 8 5 . 9 7 Bancorp of Montana Holding Co. (M 7 7 1 7 1 , 0 2 1 2 . 9 0 Farmers State Financial Corp. (MT) 8 1 0 2 4 1 , 9 6 1 1 . 7 1 Eagle Bancorp Montana Inc. (MT) 9 8 2 40 , 99 5 1 . 6 7 First National Bancorp Inc. (MT) 1 0 1 1 2 3 3 , 5 4 4 1 . 3 7 Total For Institutions In Market 3 5 2 , 4 4 8 , 53 9 Deposit data as of 6/30/19 9 Institution (ST) 2019 Rank 2018 Rank B r a n c h e s T o t a l Deposits In Market ($000) 201 9 T o t a l M a r ke t S h a r e ( % ) Billings, MT First Interstate BancSystem (MT) 1 1 1 2 1 , 336 , 61 7 26 . 3 3 U.S. Bancorp (MN) 2 2 5 1 , 053 , 60 5 20 . 7 6 Wells Fargo & Co. (CA) 3 3 5 692 , 36 8 13 . 6 4 Stockman Financial Corp. (MT) 4 5 6 596 , 44 7 11 . 7 5 Glacier Bancorp Inc. (MT) 5 4 7 592 , 26 3 11 . 6 7 Yellowstone Holding Co. (MT) 6 6 7 473 , 51 4 9 . 3 3 Bridger Co. (MT) 7 8 3 125 , 93 7 2 . 4 8 Heartland Financial USA Inc. (IA) 8 7 2 103 , 29 5 2 . 0 3 Beartooth Financial Corp. (MT) 9 9 1 38 , 50 3 0 . 7 6 Antler Land Co. (MT) 1 0 1 1 1 32 , 33 2 0 . 6 4 Eagle Bancorp Montana Inc. (MT) 1 1 1 0 3 31 , 14 0 0 . 6 1 Total For Institutions In Market 5 2 5 , 076 , 02 1

Source: S&P Global Market Intelligence □ Fastest growing area in Montana □ Home to Montana State University (16,000+ students) □ Healthcare industry rapidly expanding □ High - tech center of Montana Deposit Market Share – Helena, MT □ Helena's economic stability is largely due to state government, regional healthcare, education, and small business □ Government positions account for 70% of Helena's workforce Deposit Market Share – Bozeman, MT 2 0 1 9 T o t al T o t a l Deposits M a r k e t 2 0 19 2 0 18 In Market S h a r e Institution (ST) R a n k R a n k B r a n c h es ( $ 0 0 0 ) ( % ) Bozeman, MT Glacier Bancorp Inc. (MT) 1 1 9 1 , 08 9 , 5 3 7 3 3 . 6 9 First Interstate BancSystem (MT) 2 2 6 46 1 , 5 0 3 1 4 . 2 7 Stockman Financial Corp. (MT) 3 4 4 33 6 , 2 1 6 1 0 . 4 0 Wells Fargo & Co. (CA) 4 3 2 33 2 , 0 8 6 1 0 . 2 7 U.S. Bancorp (MN) 5 5 2 30 2 , 7 6 1 9 . 3 6 Guaranty Dev. Co. (MT) 6 6 3 24 0 , 0 8 9 7 . 4 2 MSB Financial Inc. (MT) 7 7 4 16 4 , 1 7 5 5 . 0 8 Eagle Bancorp Montana Inc. (MT) 8 8 2 1 1 8 , 9 0 6 3 . 68 Bozeman Bancorp Inc. (MT) 9 9 1 6 8 , 0 7 8 2 . 1 1 Heartland Financial USA Inc. (IA) 1 0 10 1 4 5 , 4 5 8 1 . 4 1 Total For Institutions In Market 4 0 3 , 2 3 4 , 0 7 7 Deposit data as of 6/30/19 10 MONTANA MARKETS Institution (ST) 2019 Rank 2018 Rank B r a n c h e s T o t al Deposits In Market ($000) 2 0 1 9 T o t a l M a r k et S h a r e ( % ) Helena, MT Glacier Bancorp Inc. (MT) First Interstate BancSystem (MT) Wells Fargo & Co. (CA) U.S. Bancorp (MN) 1 2 3 4 2 3 1 5 7 5 3 1 391,572 373,794 348,765 193,620 2 1 . 9 0 2 0 . 9 1 1 9 . 5 1 1 0 . 8 3 Eagle Bancorp Montana Inc. (MT) 5 4 3 19 2 , 0 3 0 10 . 74 Stockman Financial Corp. (MT) 6 6 2 8 5 , 6 0 1 4 . 7 9 Ascent Bancorp (MT) 7 8 2 4 5 , 9 4 6 2 . 5 7 Jackass Creek Land & Livestock (MT) 8 9 2 4 2 , 31 0 2 . 37 Heartland Financial USA Inc. (IA) 9 7 1 4 1 , 6 8 5 2 . 3 3 Forstrom Bancorp. Inc. (MN) 10 1 0 1 3 1 , 5 7 2 1 . 7 7 Total For Institutions In Market 31 1 , 78 7 , 7 3 7

COVID - 19 IMPACT □ Updating customers through the website □ Fee waivers addressed upon request □ Loan modifications based on degree of need □ Active in SBA Paycheck Protection Program loans for existing customers □ Proactively touched existing business borrowers to assess needs □ Employee safety is our number one priority □ Frequent communications to employees and supervisors □ Alternating in - office staff schedules to reduce risk of exposure □ Personal time off for COVID affected families □ Most branches remain open for drive - ups, walk - ups, or ATMs □ Online banking and mobile banking are available □ Bankers available by appointment □ Executive management meeting at least daily to address changing issues EMPLOYEES Ensuring health and safety of our team members CLIENTS Supporting the needs of our customers OPE R A T I ON S Ensuring safety of our customers 11

COVID - 19 IMPACT PROVIDING RELIEF TO CUSTOMERS Paycheck Protection Program (PPP) □ Began receiving PPP applications on 4/3/20 □ Currently funding loans Over 660 Applications received and approved Over $31.3 million Loans funded as of 4/30/20 Loan Modification To Borrowers □ Granting extensions and deferrals □ YTD we have completed loan modification requests, primarily due to COVID - 19 of: ~ 298 Total accounts modified ~$114.5 million Total loans modified Mortgage Forbearance To Borrowers □ Accepting forbearance requests from borrowers □ Assisted mortgage borrowers with attaining hardship forbearances ~ 116 Total granted as of 4/30/20

COVID - 19 HIGH IMPACT INDUSTRIES $822 Million in Total Net Loans (as of March 31, 2020) Category Avg Loan Size Max Loan Size Total Exposure Storage Units $ 4 75 , 98 3 $ 2 , 412 , 90 8 $ 1 2 , 3 75 , 5 6 7 Educational Services $ 3 25 , 74 2 $ 9 50 , 00 0 $ 2 , 280 , 1 9 4 Healthcare and Social Assistance $ 2 22 , 67 7 $ 2 , 304 , 58 8 $ 2 7 , 3 89 , 2 3 5 Nursing Homes $ 2 , 031 , 96 8 $ 5 , 924 , 92 0 $ 6 , 095 , 9 0 3 Casinos $ 3 83 , 72 8 $ 1 , 862 , 53 8 $ 9 , 593 , 2 0 9 Hotels / Accommodations $ 1 , 510 , 41 5 $ 9 , 432 , 50 0 $ 3 6 , 2 49 , 9 6 5 Bars and Restaurants $ 2 44 , 39 6 $ 1 , 469 , 70 2 $ 1 7 , 1 07 , 7 4 2 T o t al s $ 399,6 1 1 $ 9,432, 5 0 0 $1 11,091,8 1 6

□ On January 1, 2020 completed purchase of Western Bank of Wolf Point, in Wolf Point Montana. □ On January 1, 2019 completed purchase of The State Bank of Townsend, in Townsend, Montana. □ On January 31, 2018 completed purchase of Ruby Valley Bank,Twin Bridges, Montana. □ On October 13, 2017, successfully completed a public offering of its common stock, and issued 1,189,041 shares and received approximately $20.1 million in net cash proceeds. □ In May 2017 received approval by the state to convert our LPO in Great Falls to a full service branch. □ On February 13, 2017, the Company completed the issuance of $10 million of senior unsecured debt. The net proceeds of $9.8 million was used as capital contribution to its bank subsidiary to support growth. □ Mortgage origination team is in the top 5 of market share in Helena, Bozeman, Butte, Missoula and Great Falls. Added 6 high performing loan originators during the past year. COMPANY DEVELOPMENTS 14

AN EXPANDING FRANCHISE — EAGLE BANCORP MONTANA, INC. A SSE T S $800 MM $940 MM $710 MM $510 MM $316 MM $ 150 MM 2 0 0 0 2 0 1 0 2 0 1 2 2012 - 2016 2 0 1 7 2 0 1 8 201 8 201 7 2012 - 2016 201 2 201 0 200 0 2 0 1 9 First Stage Second Acquisition Organic Acquisition Acquisition A c q u i s i t i o n Conversion Stage IPO of 7 Branches Growth Of of The State of Western from Sterling through new Ruby Valley Bank of Bank Financial lending teams Bank Townsend of Wolf Point including $182 and products MM of Deposits $ 1 , 0 5 4 MM 201 9 Since its 2010 IPO, Eagle has leveraged its equity through acquisitions and strong organic growth, extending its franchise to all key markets in Montana and tripling its size:The Western Bank of Wolf Point is another step in this expansion. A SS ET S 15
FINANCIAL HIGHLIGHTS 16

NET INTEREST INCOME & NET INTEREST MARGIN 3.65% 3.80% 3.75% 3.77% 4.18% 3.95% 3.95% 4.33% 4.31% 4.15% 4.22% 4.04% 3.20% 3.40% 3.60% 3.80% 4.00% 4.20% 4.40% $ 0 $ 2,000 $ 4,000 $ 6,000 $ 8,000 $ 10,0 0 0 $ 12,0 0 0 2 Q 17 3 Q 17 4 Q 17 3 Q 19 4 Q 19 1 Q 20 1Q18 2Q18 3Q18 4Q18 1Q19 2Q19 Net Interest Income Net Interest Margin 17 Net interest income in 000’s
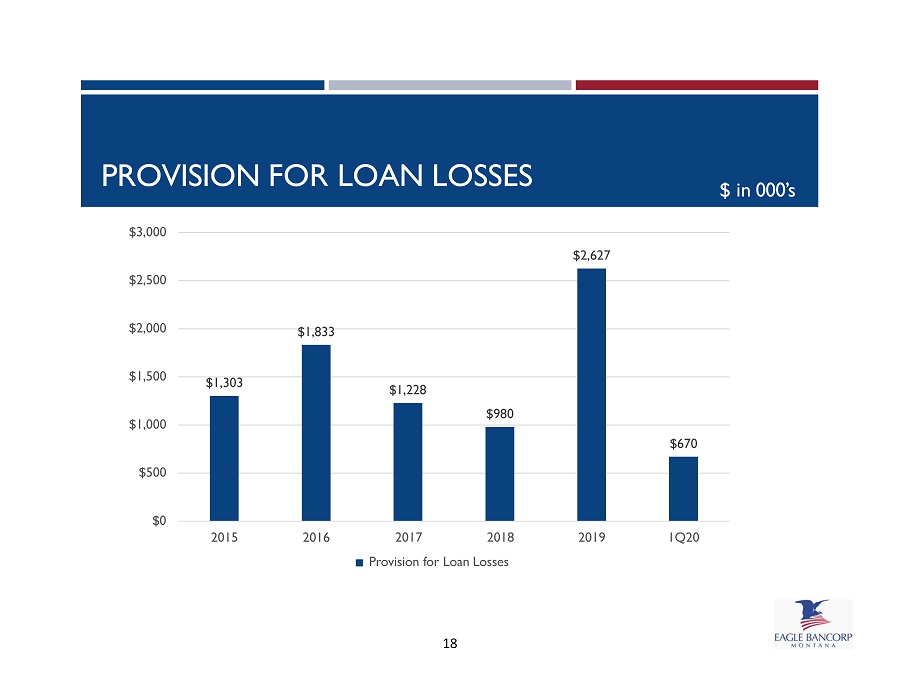
PROVISION FOR LOAN LOSSES $ 1,303 $ 1,833 $1,228 $ 980 $ 2,627 $ 670 $ 0 $ 500 $ 1,000 $ 1,500 $ 2,000 $ 2,500 $ 3,000 2015 2016 2019 1 Q 20 2017 2018 Provision for Loan Losses 18 $ in 000’s

BALANCE SHEET EXPANSION $ in millions $ 630 $ 674 $ 717 $ 854 $ 1,054 $1,159 $ 466 $ 617 $ 779 $ 822 $ 483 $ 513 $513 $521 $ 627 $ 809 $ 888 $ 407 $400 $ 200 $ 0 $ 600 $ 800 $ 1,000 $ 1,200 $ 1,400 12 / 31 / 2 015 12 / 31 / 2 016 12 / 31 / 2 017 12 / 31 / 2 018 12 / 31 / 2 019 3 / 31 / 2 0 20 A ss e t s To t a l Lo ans Dep o s i t s 19

Loan Portfolio Composition – 3/31/2020 □ Since 2008, number of Commercial/Ag lenders has increased from 4 to 30 □ Total loans increased 13% comparing 3/31/20 to 3/31/19 □ C&I accounts for 9.3% of loan portfolio □ Owner - occupied CRE loans represent 16.3% of total loans R e s i de n t i a l 1 - 4 family, 15% Residential 1 - 4 family construction, 4% C o m m e r c i a l RE, 41% Commercial construction & development, 7% Ag. & F a r m l a n d , 14% equity, 7% C o nsu m e r , 3% Home C omm e r c i a l , 9% Per call report data, excludes loans held for sale LOAN PORTFOLIO DETAIL 20
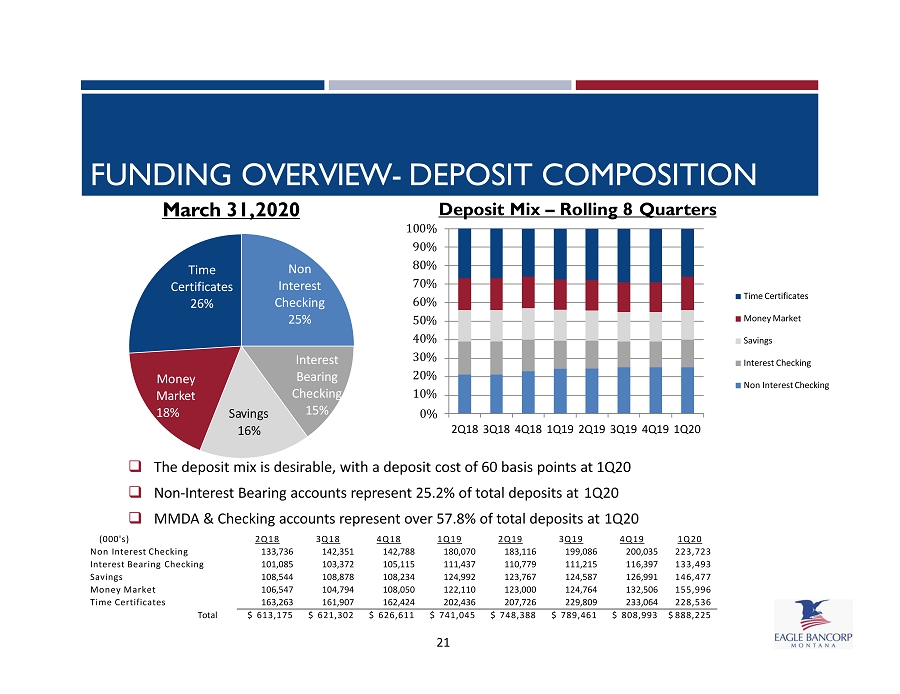
Non Interest C h e c k i n g 25% Interest Bearing C h e c k i n g 15% S a vi n g s 16% M o n ey Ma r k e t 18 % Time C e r t i f i c a t e s 26% 0 % 1 0 0 % 9 0 % 8 0 % 7 0 % 6 0 % 5 0 % 4 0 % 3 0 % 2 0 % 1 0 % 2Q18 3Q18 4Q18 1Q19 2Q19 3Q19 4Q19 1Q20 Time Certificates Money Market Savings Interest Checking Non Interest Checking March 31, 2020 Deposit Mix – Rolling 8 Quarters □ The deposit mix is desirable, with a deposit cost of 60 basis points at 1Q20 □ Non - Interest Bearing accounts represent 25.2% of total deposits at 1Q20 □ MMDA & Checking accounts represent over 57.8% of total deposits at 1Q20 (000's) 2Q18 3 Q18 4Q18 1Q19 2Q19 3 Q19 4Q19 1Q20 Non Interest Checking 13 3, 7 36 14 2, 35 1 1 42 , 78 8 18 0, 07 0 1 83 , 11 6 19 9, 08 6 2 0 0 , 03 5 223,723 Interest Bearing Checking 10 1, 0 85 10 3, 37 2 1 05 , 11 5 11 1, 43 7 1 10 , 77 9 11 1, 21 5 1 1 6 , 39 7 133,493 Savings 10 8, 5 44 10 8, 87 8 1 08 , 23 4 12 4, 99 2 1 23 , 76 7 12 4, 58 7 1 2 6 , 99 1 146,477 Money Market 10 6, 5 47 10 4, 79 4 1 08 , 05 0 12 2, 11 0 1 23 , 00 0 12 4, 76 4 1 3 2 , 50 6 155,996 Time Certificates 16 3, 2 63 16 1, 90 7 1 62 , 42 4 20 2, 43 6 2 07 , 72 6 22 9, 80 9 2 3 3 , 06 4 228,536 To tal $ 613,175 $ 621,302 $ 626,611 $ 741,045 $ 748,388 $ 789,461 $ 808,993 $ 888,225 FUNDING OVERVIEW - DEPOSIT COMPOSITION 21

22 DISCIPLINED CREDIT CULTURE 0.29% 0.21% 0.45% 0.52% 0.52% 0.84% 0.69% 0.56% 0.60% 0.68% 0.20% 0.10% 0.00% 0.30% 0.40% 0.50% 0.60% 0.70% 0.80% 0.90% 12 / 31 / 2 016 12 / 31 / 2 017 12 / 31 / 2 019 3 / 31 / 2 0 20 Nonperforming Assets/Total Assets E BM T 12/31/2018 Peer Group Peer Group includes PFLX, RVSB, CSHX, FSBW, TSBK, SFBC, OVLY, CVCY, NRIM, BOCH, CZBC, SSBI, FNRN & AMRB Source: S&P Global Market Intelligence

CRE RISK MANAGEMENT □ Executive Board Level Oversight of Approval Process □ Disciplined Underwriting □ Proactive Portfolio Management □ Quarterly Stress Testing of CRE Portfolio □ Independent Credit Review 23

YIELD AND COST OF FUNDS 6.00% 5.00% 4.00% 3.00% 2.00% 1.00% 0.00% 2015Y 1 Q 20 2016Y 2017Y 2018Y 2019Y EBMT Peer Group 6.00% 5.00% 4.00% 3.00% 2.00% 1.00% 0.00% 1 Q 20 Yield on Average Earning Assets Yield on Loans 2015Y 2016Y 2017Y 2018Y 2019Y EBMT Peer Group 0.00% 0.80% 0.60% 0.40% 0.20% 2015Y 2019Y 1 Q 20 Cost of Funds 2016Y 2017Y 2018Y EBMT Peer Group 24 Peer Group includes PFLX, RVSB, CSHX, FSBW, TSBK, SFBC, OVLY, CVCY, NRIM, BOCH, CZBC, SSBI, FNRN & AMRB Source: S&P Global Market Intelligence

CAPITAL STRENGTH □ Authorized the repurchase of up to 100,000 shares of its common stock, representing approximately 1.47% of outstanding shares. ($ in 000s) 2016Y 2017Y 2018Y 2019Y 3/31/2020 Total Assets $ 673,925 $ 716,782 $ 853,903 $ 1,054,260 $ 1,158,600 Total Common Stockholders' Equity $ 59,456 $ 83,616 $ 94,806 $ 121,659 $ 133,708 Total Regulatory Capital $ 71,900 $ 96,602 $ 104,186 $ 126,711 $ 134,358 Tier 1 Leverage Ratio 9 . 9 5% 1 1 . 5 1% 1 0 . 51 % 1 0 . 52 % 1 0 . 17 % Tier 1 Risk Based Capital Ratio 1 3 . 2 3% 1 5 . 2 9% 1 3 . 83 % 1 3 . 58 % 1 3 . 21 % Total Risk Based Capital Ratio 1 6 . 6 4% 1 8 . 2 7% 1 6 . 45 % 1 5 . 92 % 1 5 . 42 % Common Equity Tier 1 (CETI) Ratio 1 3 . 2 3% 1 4 . 3 5% 1 3 . 04 % 1 2 . 95 % 1 2 . 64 % Tangible Common Equity Ratio 7 . 8 8% 1 0 . 7 5% 9 . 66 % 9 . 95 % 9 . 70 % 25
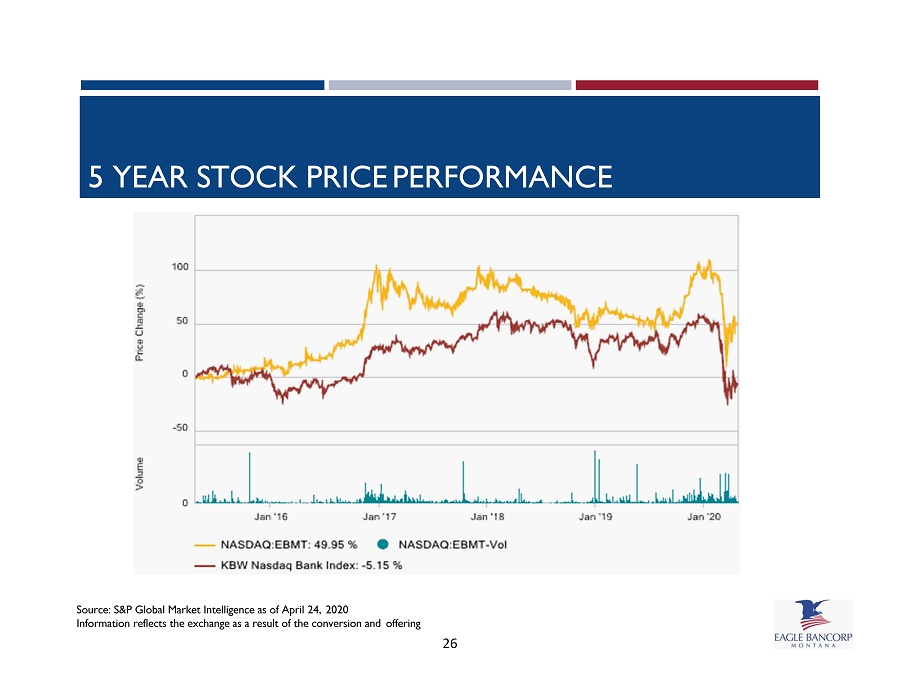
Source: S&P Global Market Intelligence as of April 24, 2020 Information reflects the exchange as a result of the conversion and offering 5 YEAR STOCK PRICE PERFORMANCE 26
