Attached files
| file | filename |
|---|---|
| 8-K - 8-K - TriState Capital Holdings, Inc. | tsc-1q20xirpresentationx8k.htm |

Investor presentation TRISTATE CAPITAL HOLDINGS, INC. (NASDAQ: TSC) First quarter ended March 31, 2020

Important Information About this presentation Financial information and data: Unless noted otherwise herein, income statement data is for the trailing twelve-months ended March 31, 2020, compared to the same TTM period the year prior; and balance sheet data is as of March 31, 2020, compared to one year prior. Forward looking statements: This presentation may contain “forward-looking” statements. Such forward-looking statements are subject to risks that could cause actual results or outcomes to differ materially from those currently anticipated. TriState Capital has no duty to, and does not intend to, update or revise forward-looking statements after the date on which they are made. For further information about the factors that could affect TriState Capital’s future results, please see the company’s most recent annual and quarterly reports filed on Form 10-K and Form 10-Q. Non-GAAP measures: To the extent non-GAAP financial measures are presented herein, comparable GAAP measures and reconciliations can be found in TriState Capital’s most recent quarterly financial results news release. 2 Investor presentation

Three Businesses Drive Differentiated Growth Uncorrelated, but highly complementary, businesses serving sophisticated clients Private Banking Investment Management Commercial Banking NATIONAL NATIONAL PA, NY, NJ & OH Organic growth Organic & acquisitive growth Organic growth Low capital requirements Low capital requirements Traditional capital requirements Integrated funding through liquidity Relationship-driven funding through management for family offices and treasury management and business financial institutions owner liquidity solutions 3 Investor presentation

Record of Growth Illustrates the strength and effectiveness of consistently executed strategy Growth from Growth from One Year Prior Three Years Prior Among Fortune’s 100 LTM or Period End TSC Peers2 TSC Peers2 Fastest-Growing Companies Non-interest income 5% 5% 7% 6% Ranked by Fortune1 in 2019 for Net-interest income 12% 7% 70% 2% 3rd consecutive year based on: • Growth in EPS Revenue3 10% 7% 46% 3% • Revenue growth Deposits 46% 12% 135% 1% • Total return on a three-year annualized basis Loans 30% 12% 97% 4% 1 The September 2019 issue of Fortune reported that it ranks the 100 Fastest-Growing Companies listed on major U.S. stock exchanges by "revenue growth rate, EPS growth rate, and total return for the period ended June 29, 2019 on a three-year annualized. (To compute the revenue and EPS growth rates, Fortune uses a trailing-four-quarters log linear least square regression fit.)." 2 Commercial bank holding companies with $5B-$10B in assets, at or as of the end of MRQ, based on data from S&P Global Market Intelligence. 3 Revenue, which is not calculated in accordance with GAAP, is a financial measure that TriState Capital has consistently utilized to provide a greater understanding of its significant fee-generating businesses. 4 Investor presentation

Flexible Balance Sheet Enables active management of interest rate risk in changing markets Agile liability pricing Disciplined loan repricing Majority of funding through variable rate deposits Interest rate floors in place for ~50% of loans 93% ~ 15% FLOATING ~ 19% RATE ~ 8% ~ 7% Deposits Loans ~ 9% $7.8B $7.0B ~ 5% ~ 85% ~ 52% Linked to EFF* or other benchmark Rates set at bank discretion Indexed to 30-Day LIBOR Fixed-rate CDs Other fixed-rate term Indexed to Prime or Other Non-interest bearing Fixed-rate * Effective Funds Rate 5 Investor presentation

Credit Risk Profile Intentional result of differentiated model and investments in talent and tech Private banking loans collateralized by marketable securities Collateral monitored and priced daily by TSC experts and tech Marketable equity and fixed-income collateral Favorable regulatory capital treatment 56% Private Banking Capital efficiency enhanced by lower risk weighting than commercial lending Total Loans Minimal reserve levels under both incurred loss method $7.0B accounting standard, applied to date, and CECL History of zero losses since inception Commercial Commercial and private banking credit management Highly experienced talent in career portfolio managers positions Expert teams dedicated to managing credit risk of commercial and private banking loans Stringent executive loan approval process Commercial focus on the highest-quality borrowers with proven track records is enabled by pricing flexibility afforded through low all-in cost funding mechanism 6 Investor presentation

Superior Credit Quality Designed to maintain low annual credit costs relative to peers ALLOWANCE / TOTAL LOANS COMMERCIAL ALLOWANCE / COMMERCIAL LOANS 1.0% 1.2% 1.10% 0.9% 1.1% 1.04% 0.8% 1.0% 0.7% 0.63% 0.9% 0.6% 0.55% 0.8% 0.67% 0.7% 0.5% 0.6% 0.50% 0.50% 0.4% 0.34% 0.42% 0.26% 0.5% 0.3% 0.21% 0.25% 0.4% 0.2% 0.3% 0.1% 0.2% 0.1% 0.0% 0.0% 2015 2016 2017 2018 2019 1Q20 2015 2016 2017 2018 2019 1Q20 NPLs / TOTAL LOANS NCOs / AVERAGE LOANS 1.5% $7 0.6% $6 0.4% 1.0% $5 s NPLs / Total Loans n $4 o 0.0% i 0.10% 0.59% l 0.2% 0.52% l $3 i —% 0.02% (0.01)% 0.5% B (0.03)% $2 0.0% 0.09% 0.08% 0.04% —% —% $1 0.0% $0 -0.2% 2015 2016 2017 2018 2019 1Q20 2015 2016 2017 2018 2019 1Q20 Total Loans NPLs / Total Loans US Bank Aggregate NCOs / Avg Loans 7 Investor presentation
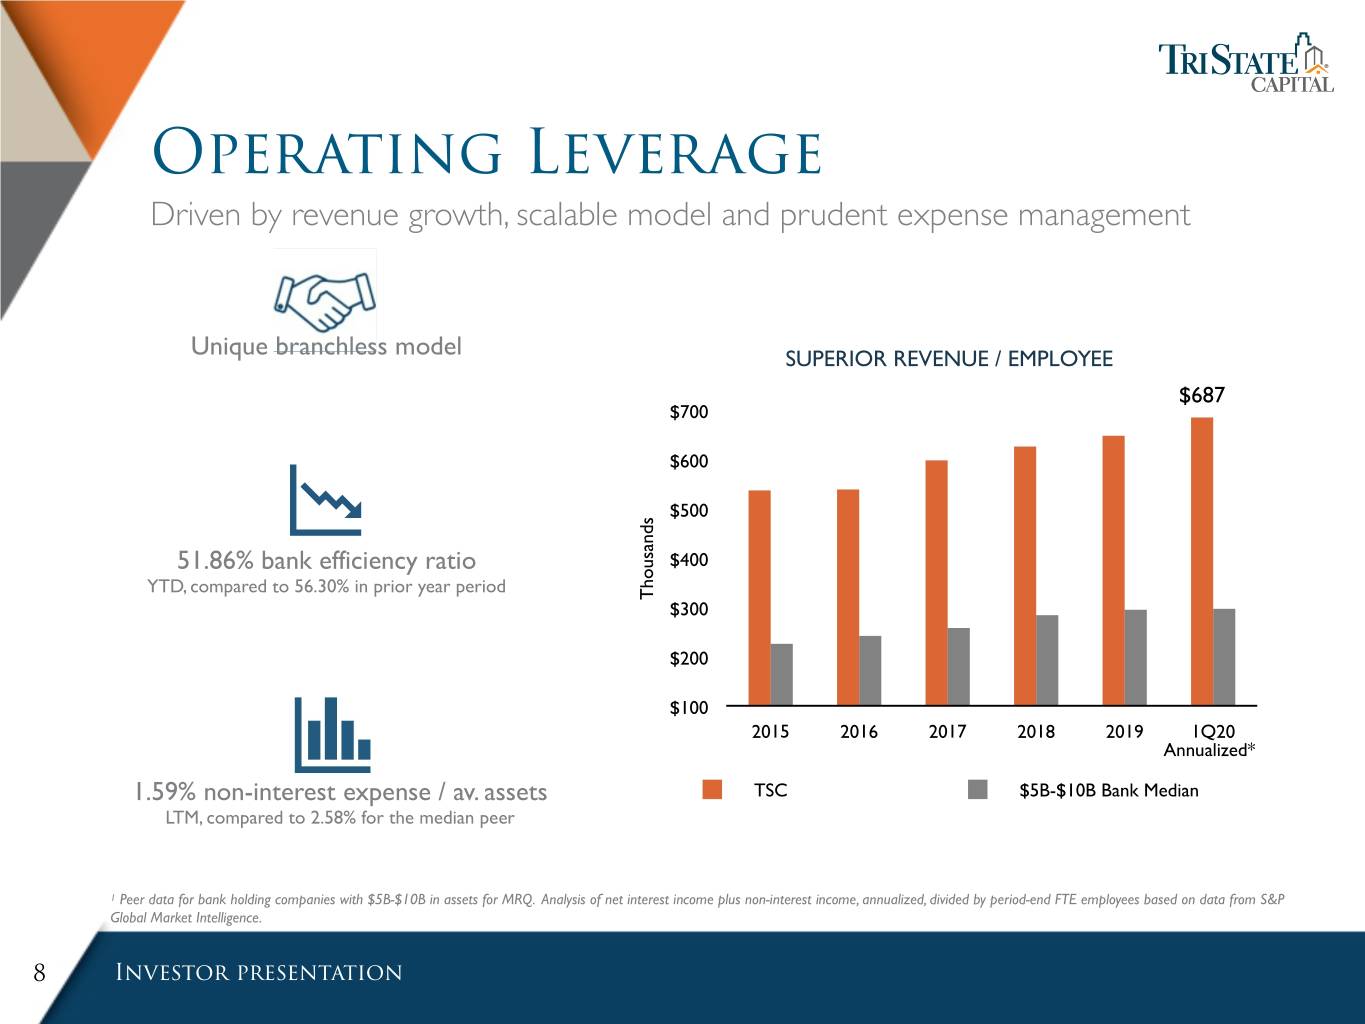
Operating Leverage Driven by revenue growth, scalable model and prudent expense management Unique branchless model SUPERIOR REVENUE / EMPLOYEE $687 $700 $600 $500 s d n a s 51.86% bank efficiency ratio u $400 o YTD, compared to 56.30% in prior year period h T $300 $200 $100 2015 2016 2017 2018 2019 1Q20 Annualized* 1.59% non-interest expense / av. assets TSC $5B-$10B Bank Median LTM, compared to 2.58% for the median peer 1 Peer data for bank holding companies with $5B-$10B in assets for MRQ. Analysis of net interest income plus non-interest income, annualized, divided by period-end FTE employees based on data from S&P Global Market Intelligence. 8 Investor presentation

Revenue Growth Organic loan growth drives net REVENUE GROWTH interest income at rates outpacing margin compression $200 $179 $184 $52 $52 Uncorrelated, but $161 $48 complementary, revenue $150 $138 streams enable robust organic $121 $47 $127 $132 s $46 growth complemented by n $103 o $113 i l l $100 strategic investment i $35 management acquisitions M $91 $75 $68 $50 Annual revenue 10% growth over LTM $0 2015 2016 2017 2018 2019 LTM Net Interest Income Non-Interest Income, ex. Securities Gains/Losses Revenue, a non-GAAP financial metric is a measure that TriState Capital has consistently utilized to provide a greater understanding of its significant fee-generating businesses, is the sum of net interest income and non-interest income, excluding net gains on the sale of debt securities. 9 Investor presentation

Non-Interest Income Engine Chartwell contributes significant investment management fee income NON-INTEREST INCOME $60 100% Countercyclical fees provided by $52 $52 back-to-back, loan-level interest rate $50 $47 $48 swap offering for clients $46 80% $40 $35 60% No regulatory capital required s n o i l to generate fees making meaningful l $30 i top-line contribution M 38% 34% 34% 40% $20 30% 29% 29% 20% of LTM Revenue from $10 29% Non-Interest Income $0 0% 2015 2016 2017 2018 2019 LTM Investment management Swaps Other Non-Interest Income/Revenue Revenue, a non-GAAP financial metric is a measure that TriState Capital has consistently utilized to provide a greater understanding of its significant fee-generating businesses, is the sum of net interest income and non-interest income, excluding net gains on the sale of debt securities. 10 Investor presentation
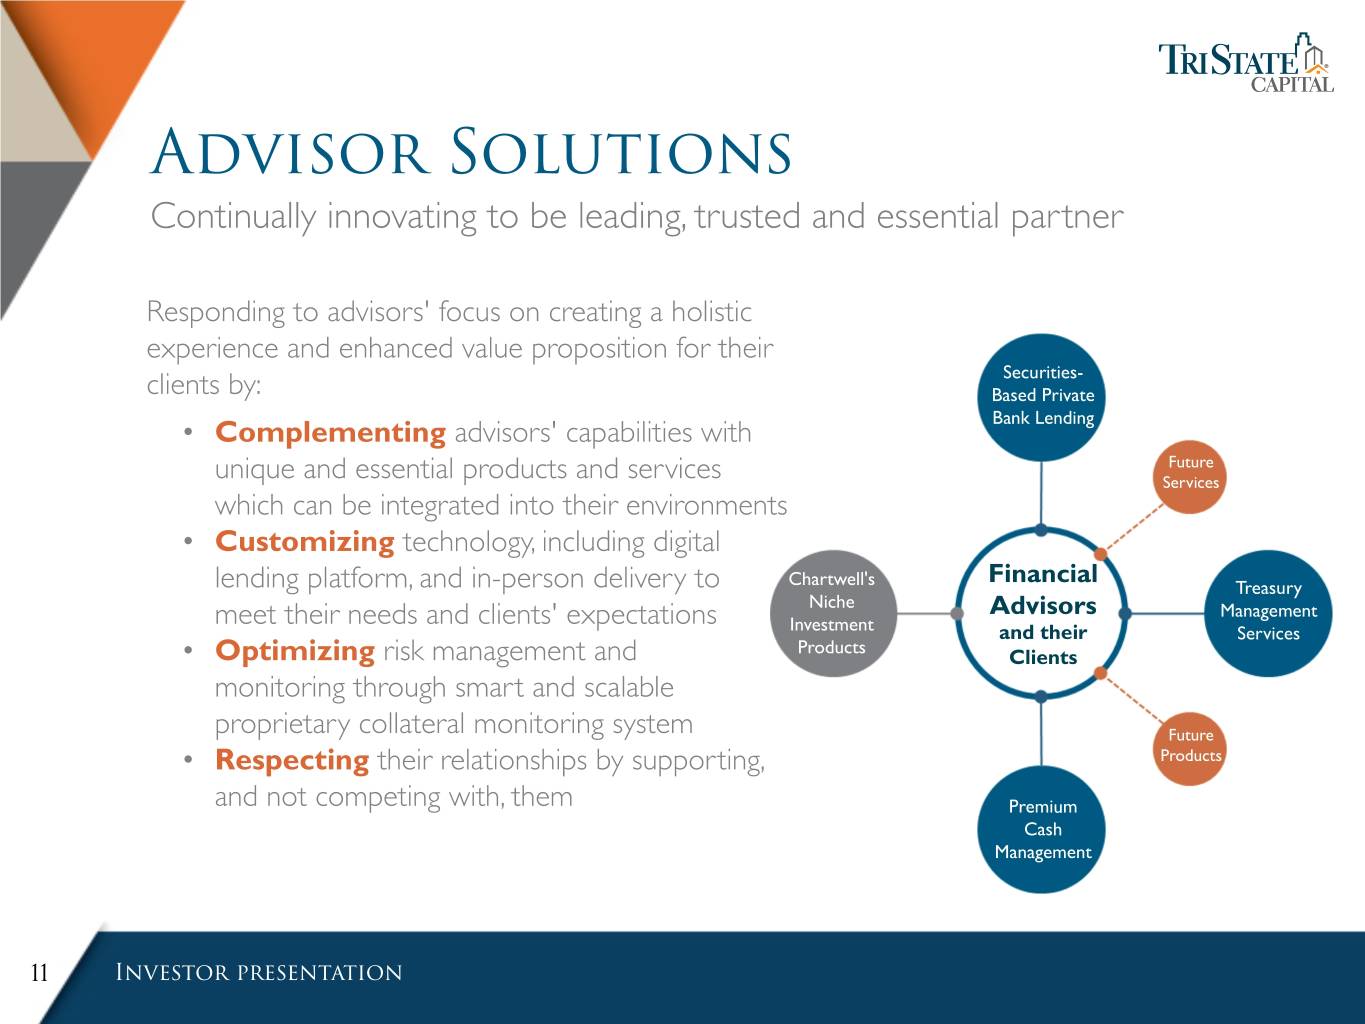
Advisor Solutions Continually innovating to be leading, trusted and essential partner Responding to advisors' focus on creating a holistic experience and enhanced value proposition for their Securities- clients by: Based Private • Complementing advisors' capabilities with Bank Lending Future unique and essential products and services Services which can be integrated into their environments • Customizing technology, including digital Financial lending platform, and in-person delivery to Chartwell's Treasury meet their needs and clients' expectations Niche Advisors Management Investment and their Services • Optimizing risk management and Products Clients monitoring through smart and scalable proprietary collateral monitoring system Future • Respecting their relationships by supporting, Products and not competing with, them Premium Cash Management 11 Investor presentation

Private Banking TSC's fastest growing category of lending aimed at assisting financial advisors of all types provide enhanced value to their clients PRIVATE BANKING LOANS Loans over-collateralized by marketable $4.5 securities or cash value life insurance (CVLI) $4.0 $3.916 policies from select, top-rated issuers $3.695 • No loss history $3.5 CAGR $3.0 29% $2.870 Marketable securities collateral consist of s $2.5 liquid and primarily well-diversified n $2.266 o i l l i portfolios B $2.0 $1.736 $1.5 $1.345 $1.0 $0.5 $0.0 2015 2016 2017 2018 2019 1Q20 % of Total Loans 47.3% 51.0% 54.1% 55.9% 56.2% 56.3% 12 Investor presentation
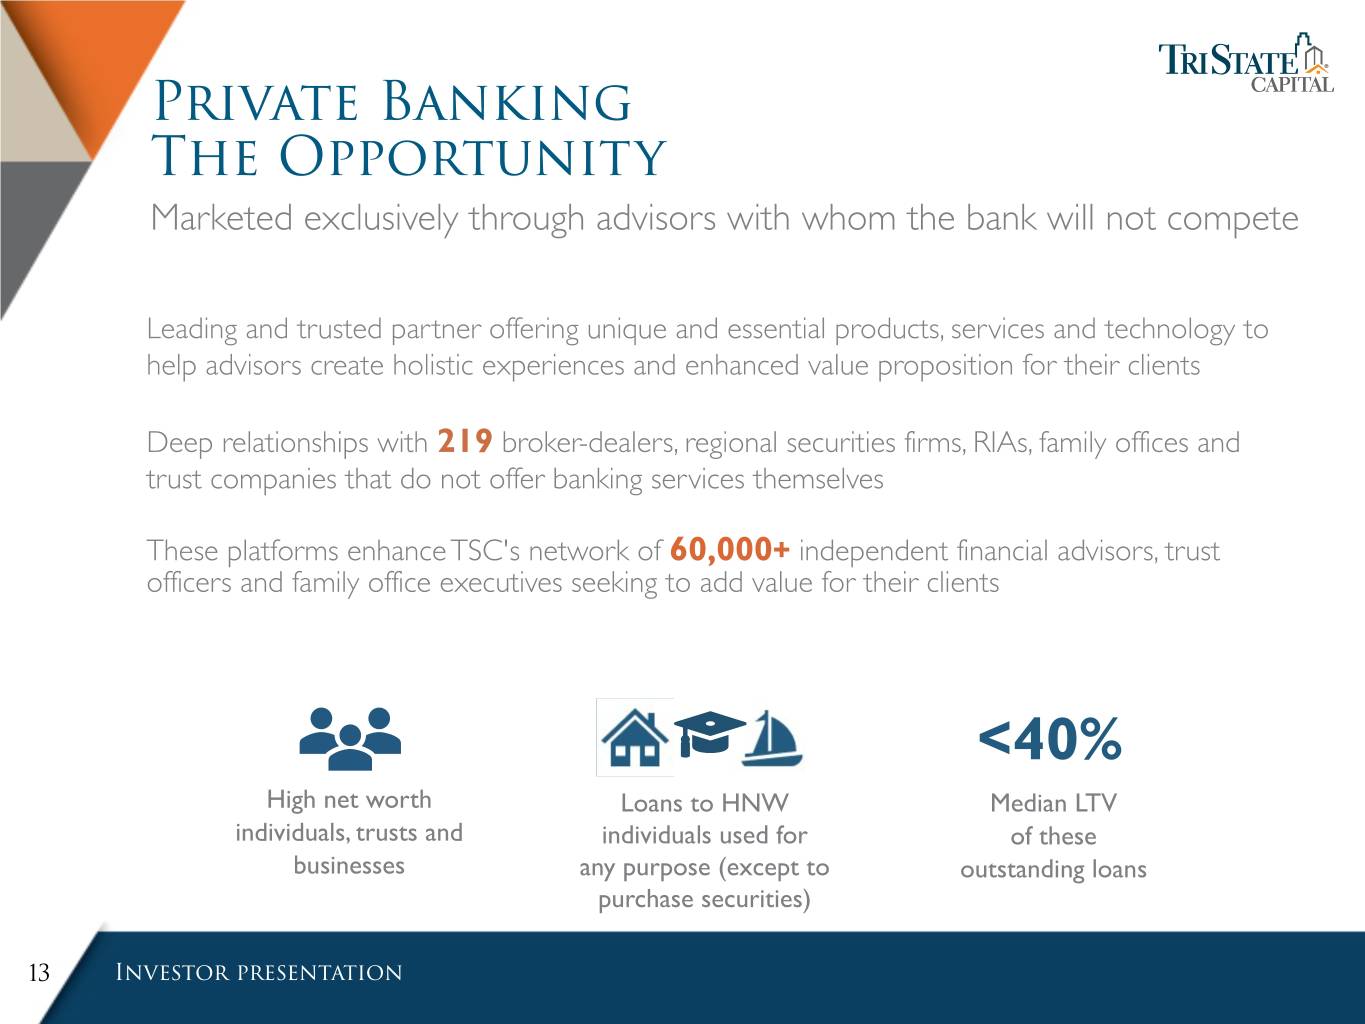
Private Banking The Opportunity Marketed exclusively through advisors with whom the bank will not compete Leading and trusted partner offering unique and essential products, services and technology to help advisors create holistic experiences and enhanced value proposition for their clients Deep relationships with 219 broker-dealers, regional securities firms, RIAs, family offices and trust companies that do not offer banking services themselves These platforms enhance TSC's network of 60,000+ independent financial advisors, trust officers and family office executives seeking to add value for their clients <40% High net worth Loans to HNW Median LTV individuals, trusts and individuals used for of these businesses any purpose (except to outstanding loans purchase securities) 13 Investor presentation

COMMERCIAL & INDUSTRIAL $1.25 $1.191 $1.086 $1.00 s n o i l l i $0.785 B Middle-Market $0.75 $0.668 $0.634 Commercial $0.587 $0.50 Lending 2015 2016 2017 2018 2019 1Q20 Regional, in-market lender COMMERCIAL REAL ESTATE $2.00 $1.797 $1.851 organic commercial $1.478 $1.50 $1.251 29% loan growth YOY s $1.078 n o i l $1.00 $0.862 l i B $0.50 $0.00 2015 2016 2017 2018 2019 1Q20 CRE: owner-occupied CRE: non-owner occupied 14 Investor presentation

Middle-Market Commercial Banking In-market relationships and diversified across industries, property type and geographies Highly experienced in-market regional presidents and relationship managers, with 20+ years average experience, source and serve local clients through our Mid-Atlantic representative offices 16% 24% 50% 11% 23% 15% COMMERCIAL C&I LOANS CRE LOANS 30% LOANS BY $1.19B $1.85B 26% REGION $3.04B 21% 17% 10% 17% 4% 18% 18% Finance & Insurance Service Income-producing Owner-occupied Western PA Eastern PA Real Estate & Leasing Manufacturing Multifamily/apartment Construction/land Ohio New Jersey Transportation All others New York 15 Investor presentation

Organic Deposit Growth DIVERSE AND HIGH-QUALITY DEPOSIT FRANCHISE World class financial institutions and national deposit team $8 Treasury management capabilities and team enhanced $6 in 2016 s Enhanced capabilities to serve n o i l $4 family offices and ultra high net l i worth clients in 2018 B $2 Organic growth 46% over LTM $0 2015 1 2016 2017 2018 2019 1Q20 Certificates of Deposit Money Market Deposits Noninterest and Interest Checking Balances at period end 16 Investor presentation Annualized

Treasury Management a Strategic Priority Investments in best-in-class technology and talent beginning in 2016 are paying off for our clients and our business TREASURY MANAGEMENT DEPOSIT ACCOUNTS Treasury management deposits are up approximately 40% year-over-year $1,200 13 dedicated professionals across regional $1,107.6 $1,074.6 footprint $1,053.1 $978.5 s $1,000 More than 400 clients and growing, including n o i l l i deposit-only clients with essential need for M treasury management services $789.8 $800 $600 03/31/19 06/30/19 09/30/19 12/31/19 03/31/20 17 Investor presentation

Treasury Management Deposits Sophisticated and high touch service combined with transparent fee structures driving growth with existing clients and rapid expansion of new clients Lending Client - Operating Accounts 22% Payment Processors (3rd Party, Class Action) 15% Real Estate (Investments & Services) Financial Entities (Funds, Custody,Trust) Financial Intermediaries (Broker dealers, BALANCES OF advisory) 26% $1.11B 11% Family Offices & Foundations C&I Non-Lending Non-Profit Organizations 8% 1% Financial Entities (Banks) 4% 7% < 1% 5% Other 18 Investor presentation
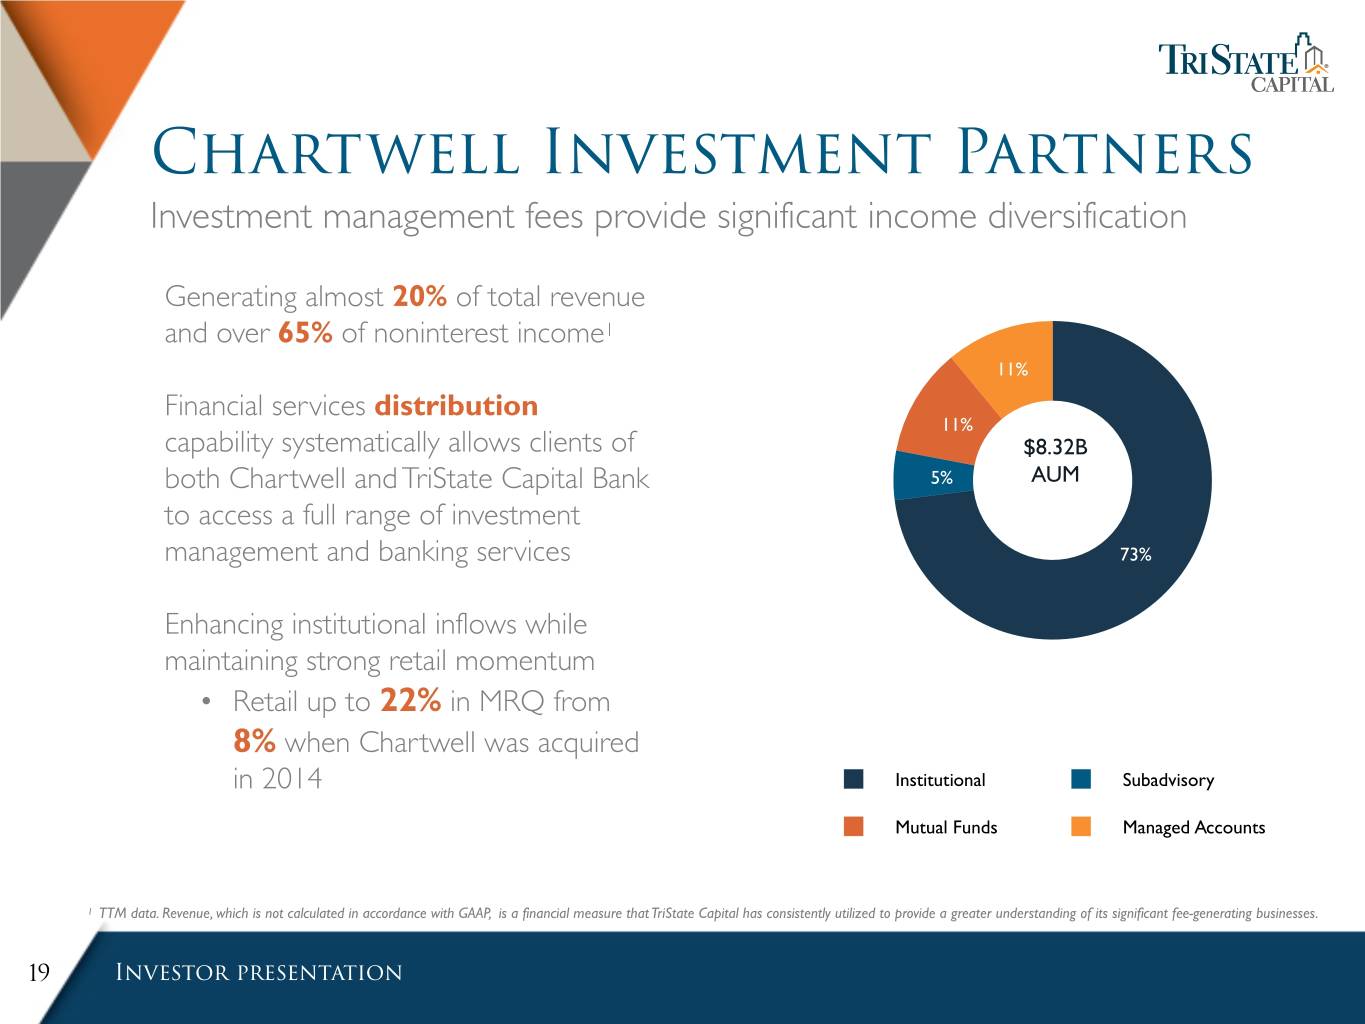
Chartwell Investment Partners Investment management fees provide significant income diversification Generating almost 20% of total revenue and over 65% of noninterest income1 11% Financial services distribution 11% capability systematically allows clients of $8.32B both Chartwell and TriState Capital Bank 5% AUM to access a full range of investment management and banking services 73% Enhancing institutional inflows while maintaining strong retail momentum • Retail up to 22% in MRQ from 8% when Chartwell was acquired in 2014 Institutional Subadvisory Mutual Funds Managed Accounts 1 TTM data. Revenue, which is not calculated in accordance with GAAP, is a financial measure that TriState Capital has consistently utilized to provide a greater understanding of its significant fee-generating businesses. 19 Investor presentation

Investment Performance Chartwell's active strategies not easily replicated by passive products Strong investment performance contributed to positive net inflows of strategies outperforming respective $57M in 1Q20 and new-business pipeline 6 benchmarks for 1, 3 and 5 years commitments of >$200M from institutional investors by mid-April 2020 Small Cap Value Mid Cap Value Smid Cap Value Dividend Value 12% 19% Value Equity Covered Call Short Duration BB-Rated High Yield Fixed Income Growth Equity AUM BY 2% INVESTMENT 9% Balanced Large Cap Growth TEAM Fixed Income Small Cap Growth Berwyn Income Fund 58% Large Cap Short Duration High Grade Corporate Intermediate High Grade Fixed Income Core High Grade Fixed Income Core Plus Fixed Income High Yield Fixed Income 20 Investor presentation

Capital and Investment Profile History of deploying capital in accretive acquisitions while organically growing balance sheet Deployed $66M raised in 2013 IPO Investment Profile2 (last common equity raise) in three accretive investment management Closing Price $ 12.91 acquisitions1 while organically growing 52-Week High $ 26.43 bank’s balance sheet by more than $4B 52-Week Low $ 7.59 Non-cumulative perpetual Common Shares Outstanding 29.8M stock offerings in 2018-2019 preferred Float 27.3M raised net capital of $116M, providing additional Tier 1 capital for the holding Average Daily Volume (3 mos.) ~286,000 company Insider Ownership ~8% Repurchased 2.1M shares since 4Q14 for $32.9M (~$15.39 per share) 1 Chartwell acquisition closed 3/5/2014, TKG acquisition closed 4/29/2016, and Columbia acquisition closed 4/6/2018. 2 Market data as of April 21, 2020. 21 Investor presentation
appendix 22 Investor presentation
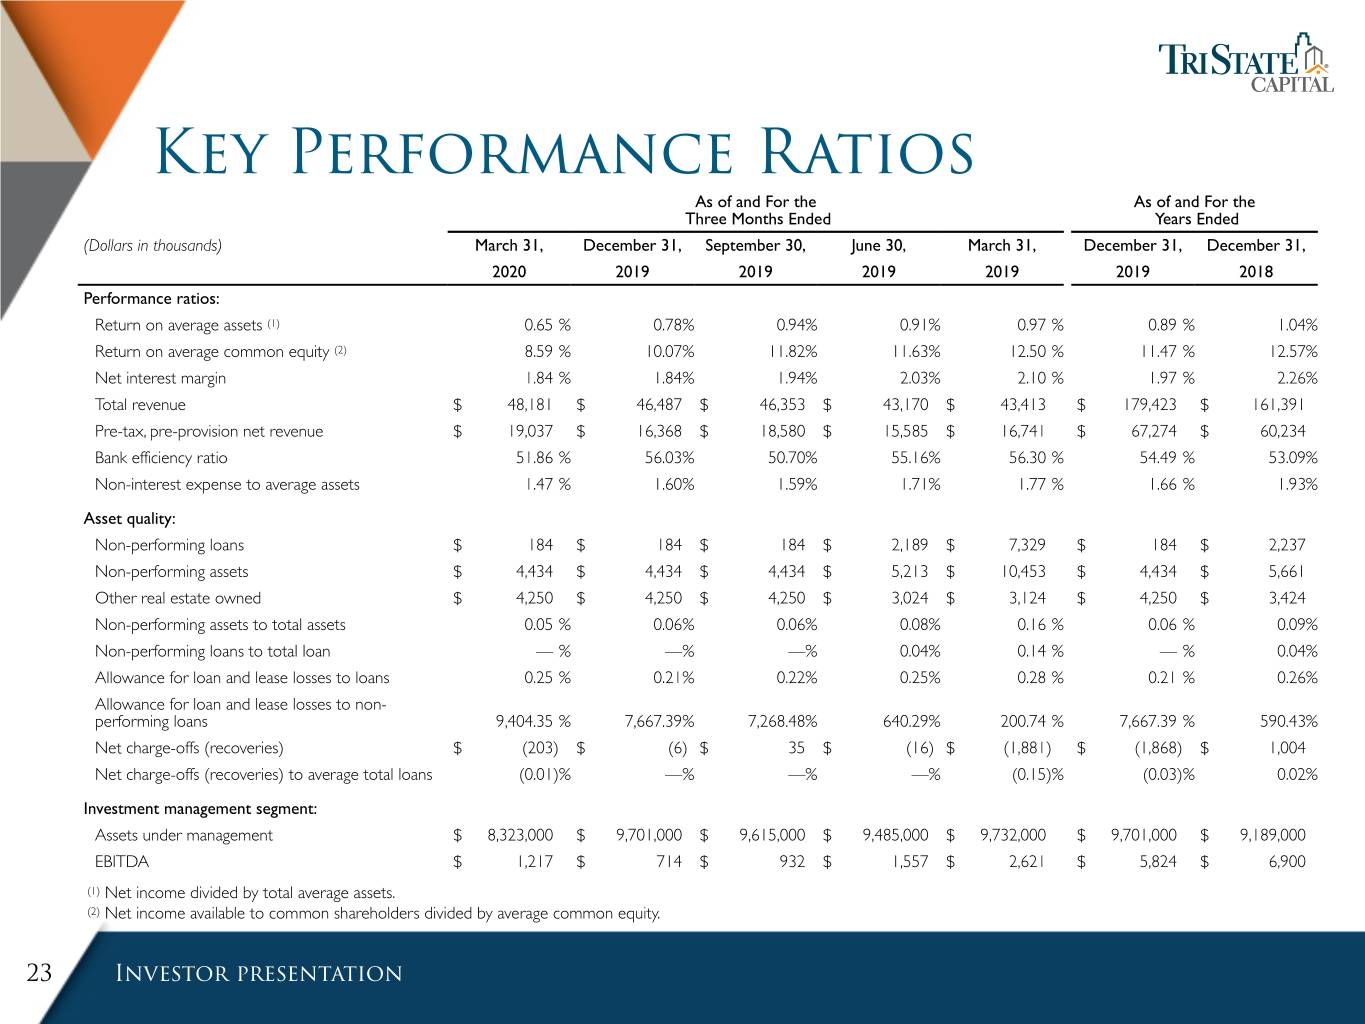
Key Performance Ratios As of and For the As of and For the Three Months Ended Years Ended (Dollars in thousands) March 31, December 31, September 30, June 30, March 31, December 31, December 31, 2020 2019 2019 2019 2019 2019 2018 Performance ratios: Return on average assets (1) 0.65 % 0.78% 0.94% 0.91% 0.97 % 0.89 % 1.04% Return on average common equity (2) 8.59 % 10.07% 11.82% 11.63% 12.50 % 11.47 % 12.57% Net interest margin 1.84 % 1.84% 1.94% 2.03% 2.10 % 1.97 % 2.26% Total revenue $ 48,181 $ 46,487 $ 46,353 $ 43,170 $ 43,413 $ 179,423 $ 161,391 Pre-tax, pre-provision net revenue $ 19,037 $ 16,368 $ 18,580 $ 15,585 $ 16,741 $ 67,274 $ 60,234 Bank efficiency ratio 51.86 % 56.03% 50.70% 55.16% 56.30 % 54.49 % 53.09% Non-interest expense to average assets 1.47 % 1.60% 1.59% 1.71% 1.77 % 1.66 % 1.93% Asset quality: Non-performing loans $ 184 $ 184 $ 184 $ 2,189 $ 7,329 $ 184 $ 2,237 Non-performing assets $ 4,434 $ 4,434 $ 4,434 $ 5,213 $ 10,453 $ 4,434 $ 5,661 Other real estate owned $ 4,250 $ 4,250 $ 4,250 $ 3,024 $ 3,124 $ 4,250 $ 3,424 Non-performing assets to total assets 0.05 % 0.06% 0.06% 0.08% 0.16 % 0.06 % 0.09% Non-performing loans to total loan — % —% —% 0.04% 0.14 % — % 0.04% Allowance for loan and lease losses to loans 0.25 % 0.21% 0.22% 0.25% 0.28 % 0.21 % 0.26% Allowance for loan and lease losses to non- performing loans 9,404.35 % 7,667.39% 7,268.48% 640.29% 200.74 % 7,667.39 % 590.43% Net charge-offs (recoveries) $ (203) $ (6) $ 35 $ (16) $ (1,881) $ (1,868) $ 1,004 Net charge-offs (recoveries) to average total loans (0.01)% —% —% —% (0.15)% (0.03)% 0.02% Investment management segment: Assets under management $ 8,323,000 $ 9,701,000 $ 9,615,000 $ 9,485,000 $ 9,732,000 $ 9,701,000 $ 9,189,000 EBITDA $ 1,217 $ 714 $ 932 $ 1,557 $ 2,621 $ 5,824 $ 6,900 (1) Net income divided by total average assets. (2) Net income available to common shareholders divided by average common equity. 23 Investor presentation
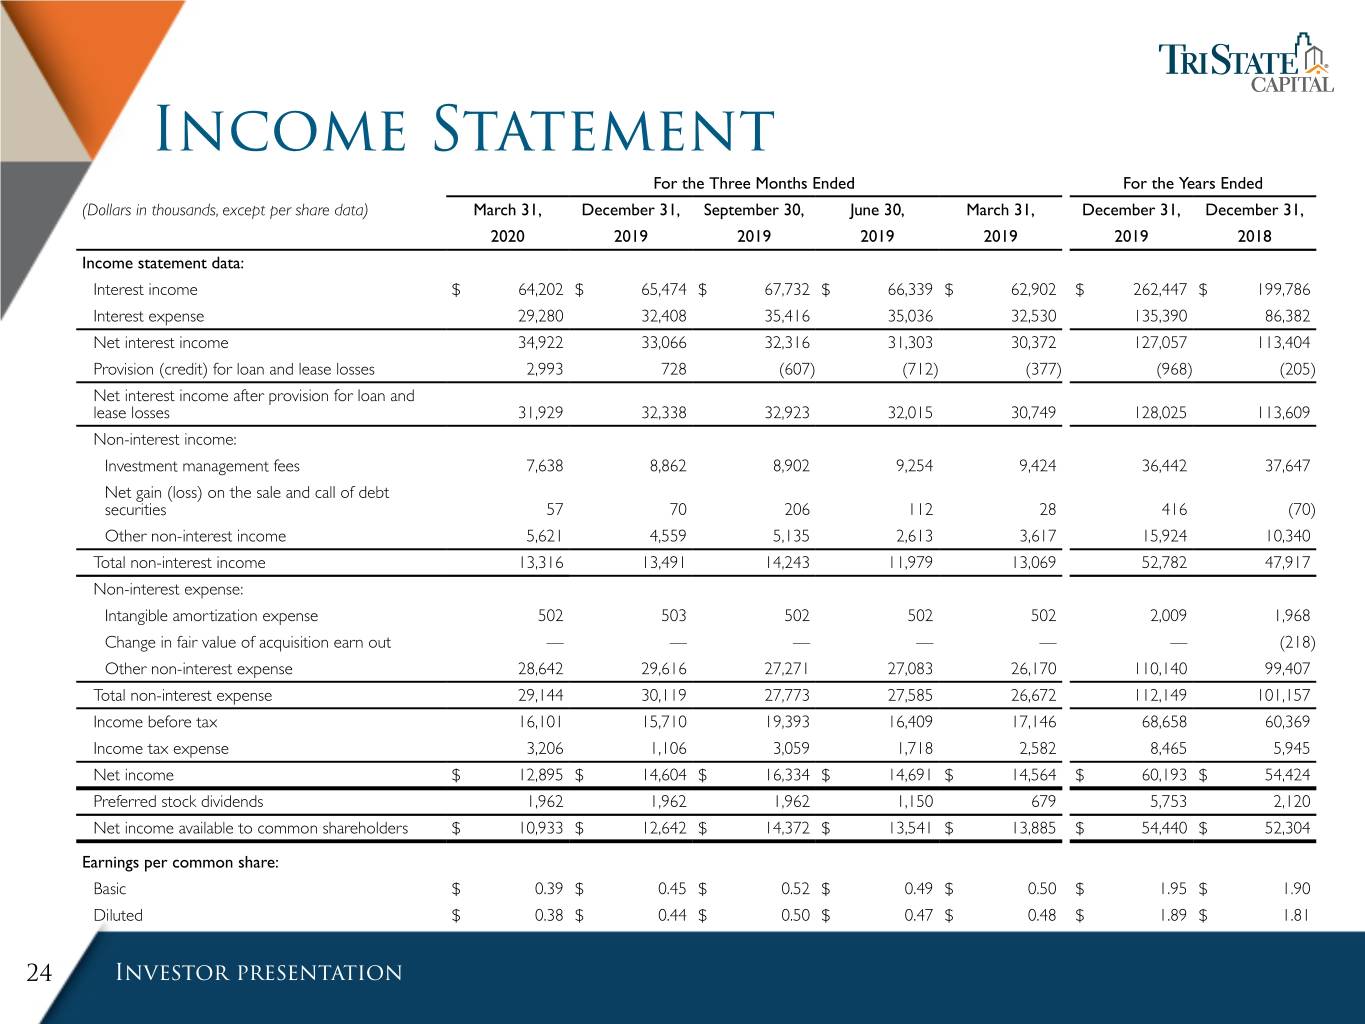
Income Statement For the Three Months Ended For the Years Ended (Dollars in thousands, except per share data) March 31, December 31, September 30, June 30, March 31, December 31, December 31, 2020 2019 2019 2019 2019 2019 2018 Income statement data: Interest income $ 64,202 $ 65,474 $ 67,732 $ 66,339 $ 62,902 $ 262,447 $ 199,786 Interest expense 29,280 32,408 35,416 35,036 32,530 135,390 86,382 Net interest income 34,922 33,066 32,316 31,303 30,372 127,057 113,404 Provision (credit) for loan and lease losses 2,993 728 (607) (712) (377) (968) (205) Net interest income after provision for loan and lease losses 31,929 32,338 32,923 32,015 30,749 128,025 113,609 Non-interest income: Investment management fees 7,638 8,862 8,902 9,254 9,424 36,442 37,647 Net gain (loss) on the sale and call of debt securities 57 70 206 112 28 416 (70) Other non-interest income 5,621 4,559 5,135 2,613 3,617 15,924 10,340 Total non-interest income 13,316 13,491 14,243 11,979 13,069 52,782 47,917 Non-interest expense: Intangible amortization expense 502 503 502 502 502 2,009 1,968 Change in fair value of acquisition earn out — — — — — — (218) Other non-interest expense 28,642 29,616 27,271 27,083 26,170 110,140 99,407 Total non-interest expense 29,144 30,119 27,773 27,585 26,672 112,149 101,157 Income before tax 16,101 15,710 19,393 16,409 17,146 68,658 60,369 Income tax expense 3,206 1,106 3,059 1,718 2,582 8,465 5,945 Net income $ 12,895 $ 14,604 $ 16,334 $ 14,691 $ 14,564 $ 60,193 $ 54,424 Preferred stock dividends 1,962 1,962 1,962 1,150 679 5,753 2,120 Net income available to common shareholders $ 10,933 $ 12,642 $ 14,372 $ 13,541 $ 13,885 $ 54,440 $ 52,304 Earnings per common share: Basic $ 0.39 $ 0.45 $ 0.52 $ 0.49 $ 0.50 $ 1.95 $ 1.90 Diluted $ 0.38 $ 0.44 $ 0.50 $ 0.47 $ 0.48 $ 1.89 $ 1.81 24 Investor presentation

Period-End Balance Sheet As of (Dollars in thousands) March 31, December 31, September 30, June 30, March 31, 2020 2019 2019 2019 2019 Period-end balance sheet data: Cash and cash equivalents $ 1,010,128 $ 403,855 $ 383,948 $ 458,269 $ 243,911 Total investment securities 606,736 469,150 468,721 431,426 487,087 Loans and leases held-for-investment 6,958,149 6,577,559 6,016,680 5,664,934 5,336,725 Allowance for loan and lease losses (17,304) (14,108) (13,374) (14,016) (14,712) Loans and leases held-for-investment, net 6,940,845 6,563,451 6,003,306 5,650,918 5,322,013 Goodwill and other intangibles, net 65,352 65,854 66,357 66,859 67,361 Other assets 367,000 263,500 276,117 238,531 223,638 Total assets $ 8,990,061 $ 7,765,810 $ 7,198,449 $ 6,846,003 $ 6,344,010 Deposits $ 7,782,759 $ 6,634,613 $ 6,094,605 $ 5,786,983 $ 5,337,704 Borrowings, net 330,000 355,000 330,000 335,000 398,216 Other liabilities 262,922 154,916 169,337 135,039 111,533 Total liabilities 8,375,681 7,144,529 6,593,942 6,257,022 5,847,453 Preferred stock 116,079 116,079 116,064 116,142 38,468 Common shareholders' equity 498,301 505,202 488,443 472,839 458,089 Total shareholders' equity 614,380 621,281 604,507 588,981 496,557 Total liabilities and shareholders' equity $ 8,990,061 $ 7,765,810 $ 7,198,449 $ 6,846,003 $ 6,344,010 25 Investor presentation

Capital Ratios As of March 31, December 31, September 30, June 30, March 31, 2020 2019 2019 2019 2019 TSCH capital ratios: Tier 1 leverage ratio 7.19 % 7.54 % 7.91 % 8.21 % 7.13 % Common equity tier 1 risk-based capital ratio 8.81 % 9.32 % 9.58 % 9.83 % 9.98 % Tier 1 risk-based capital ratio 11.07 % 11.75 % 12.15 % 12.56 % 10.92 % Total risk-based capital ratio 11.42 % 12.05 % 12.40 % 12.82 % 11.26 % TSCB capital ratios: Tier 1 leverage ratio 7.36 % 7.22 % 7.20 % 7.43 % 7.29 % Common equity tier 1 risk-based capital ratio 11.34 % 11.26 % 11.07 % 11.38 % 11.18 % Tier 1 risk-based capital ratio 11.34 % 11.26 % 11.07 % 11.38 % 11.18 % Total risk-based capital ratio 11.69 % 11.57 % 11.38 % 11.73 % 11.57 % 26 Investor presentation
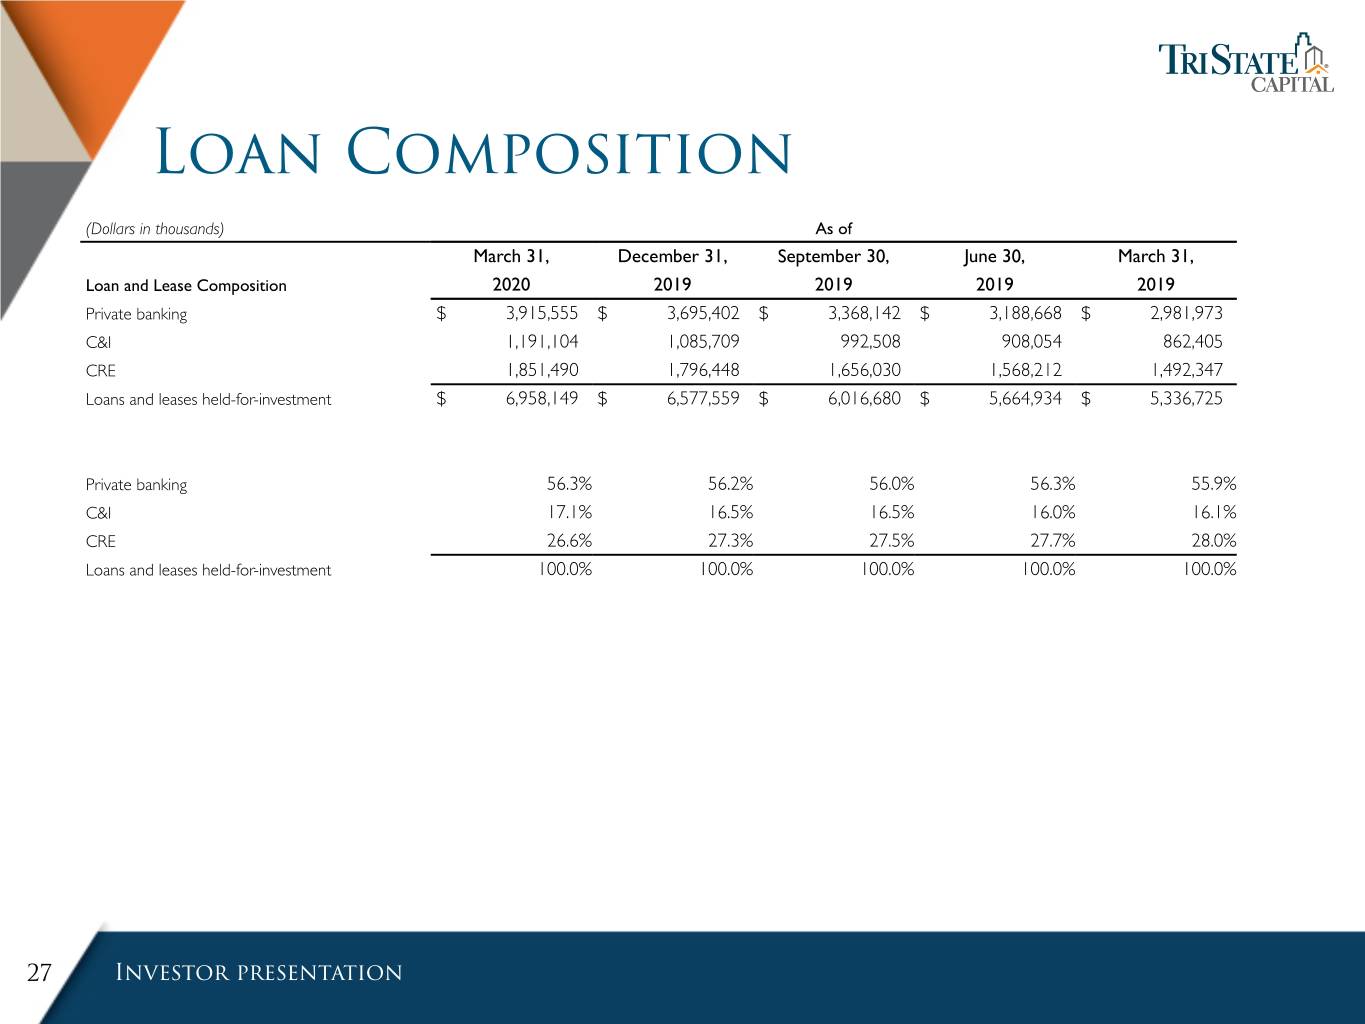
Loan Composition (Dollars in thousands) As of March 31, December 31, September 30, June 30, March 31, Loan and Lease Composition 2020 2019 2019 2019 2019 Private banking $ 3,915,555 $ 3,695,402 $ 3,368,142 $ 3,188,668 $ 2,981,973 C&I 1,191,104 1,085,709 992,508 908,054 862,405 CRE 1,851,490 1,796,448 1,656,030 1,568,212 1,492,347 Loans and leases held-for-investment $ 6,958,149 $ 6,577,559 $ 6,016,680 $ 5,664,934 $ 5,336,725 Private banking 56.3% 56.2% 56.0% 56.3% 55.9% C&I 17.1% 16.5% 16.5% 16.0% 16.1% CRE 26.6% 27.3% 27.5% 27.7% 28.0% Loans and leases held-for-investment 100.0% 100.0% 100.0% 100.0% 100.0% 27 Investor presentation

Deposit Composition (Dollars in thousands) As of March 31, December 31, September 30, June 30, March 31, Deposit Composition 2020 2019 2019 2019 2019 Noninterest-bearing checking accounts $ 362,075 $ 356,102 $ 312,285 $ 270,435 $ 292,188 Interest-bearing checking accounts 2,195,824 1,398,264 1,333,189 971,081 895,948 Money market deposit accounts 3,783,842 3,426,745 3,149,346 3,021,610 2,760,147 Certificates of deposit 1,441,018 1,453,502 1,299,785 1,523,857 1,389,421 Total deposits $ 7,782,759 $ 6,634,613 $ 6,094,605 $ 5,786,983 $ 5,337,704 Noninterest-bearing checking accounts 4.7% 5.4% 5.1% 4.7% 5.5% Interest-bearing checking accounts 28.2% 21.1% 21.9% 16.8% 16.8% Money market deposit accounts 48.6% 51.6% 51.7% 52.2% 51.7% Certificates of deposit 18.5% 21.9% 21.3% 26.3% 26.0% Total deposits 100.0% 100.0% 100.0% 100.0% 100.0% 28 Investor presentation
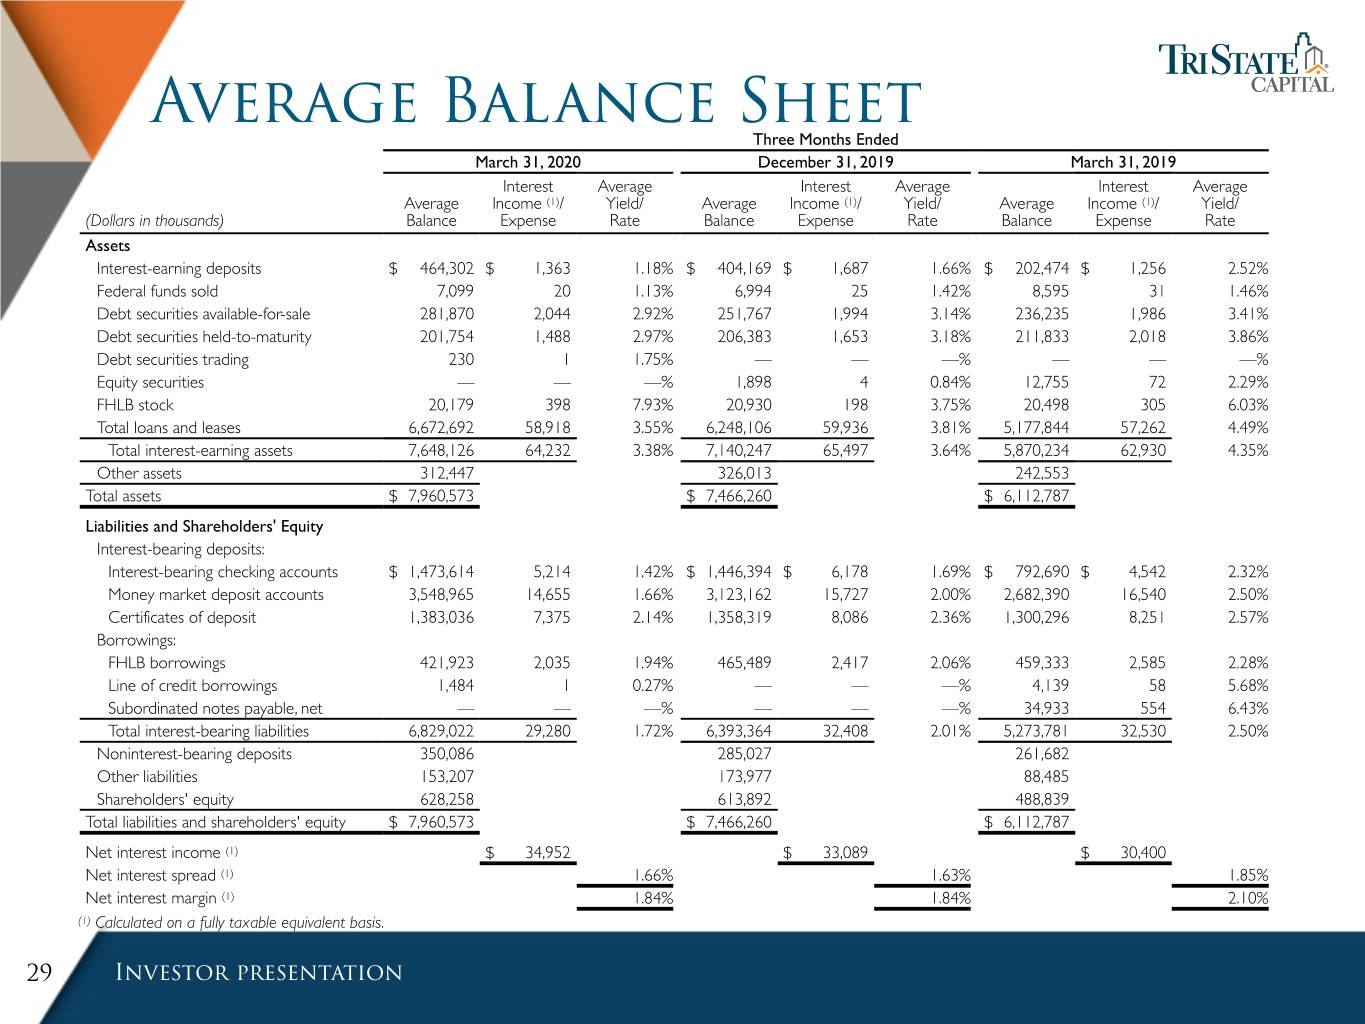
Average Balance Sheet Three Months Ended March 31, 2020 December 31, 2019 March 31, 2019 Interest Average Interest Average Interest Average Average Income (1)/ Yield/ Average Income (1)/ Yield/ Average Income (1)/ Yield/ (Dollars in thousands) Balance Expense Rate Balance Expense Rate Balance Expense Rate Assets Interest-earning deposits $ 464,302 $ 1,363 1.18% $ 404,169 $ 1,687 1.66% $ 202,474 $ 1,256 2.52% Federal funds sold 7,099 20 1.13% 6,994 25 1.42% 8,595 31 1.46% Debt securities available-for-sale 281,870 2,044 2.92% 251,767 1,994 3.14% 236,235 1,986 3.41% Debt securities held-to-maturity 201,754 1,488 2.97% 206,383 1,653 3.18% 211,833 2,018 3.86% Debt securities trading 230 1 1.75% — — —% — — —% Equity securities — — —% 1,898 4 0.84% 12,755 72 2.29% FHLB stock 20,179 398 7.93% 20,930 198 3.75% 20,498 305 6.03% Total loans and leases 6,672,692 58,918 3.55% 6,248,106 59,936 3.81% 5,177,844 57,262 4.49% Total interest-earning assets 7,648,126 64,232 3.38% 7,140,247 65,497 3.64% 5,870,234 62,930 4.35% Other assets 312,447 326,013 242,553 Total assets $ 7,960,573 $ 7,466,260 $ 6,112,787 Liabilities and Shareholders' Equity Interest-bearing deposits: Interest-bearing checking accounts $ 1,473,614 5,214 1.42% $ 1,446,394 $ 6,178 1.69% $ 792,690 $ 4,542 2.32% Money market deposit accounts 3,548,965 14,655 1.66% 3,123,162 15,727 2.00% 2,682,390 16,540 2.50% Certificates of deposit 1,383,036 7,375 2.14% 1,358,319 8,086 2.36% 1,300,296 8,251 2.57% Borrowings: FHLB borrowings 421,923 2,035 1.94% 465,489 2,417 2.06% 459,333 2,585 2.28% Line of credit borrowings 1,484 1 0.27% — — —% 4,139 58 5.68% Subordinated notes payable, net — — —% — — —% 34,933 554 6.43% Total interest-bearing liabilities 6,829,022 29,280 1.72% 6,393,364 32,408 2.01% 5,273,781 32,530 2.50% Noninterest-bearing deposits 350,086 285,027 261,682 Other liabilities 153,207 173,977 88,485 Shareholders' equity 628,258 613,892 488,839 Total liabilities and shareholders' equity $ 7,960,573 $ 7,466,260 $ 6,112,787 Net interest income (1) $ 34,952 $ 33,089 $ 30,400 Net interest spread (1) 1.66% 1.63% 1.85% Net interest margin (1) 1.84% 1.84% 2.10% (1) Calculated on a fully taxable equivalent basis. 29 Investor presentation

Average Balance Sheet Years Ended December 31, 2019 2018 Interest Average Interest Average Average Income (1)/ Yield/ Average Income (1)/ Yield/ (Dollars in thousands) Balance Expense Rate Balance Expense Rate Assets Interest-earning deposits $ 313,413 $ 6,628 2.11% $ 188,921 $ 3,598 1.90% Federal funds sold 8,803 167 1.90% 8,315 156 1.88% Debt securities available-for-sale 250,064 8,119 3.25% 205,652 6,195 3.01% Debt securities held-to-maturity 193,443 6,921 3.58% 90,895 3,399 3.74% Equity securities 6,733 115 1.71% 10,517 277 2.63% FHLB stock 18,043 1,270 7.04% 15,136 924 6.10% Total loans and leases 5,669,507 239,328 4.22% 4,500,117 185,349 4.12% Total interest-earning assets 6,460,006 262,548 4.06% 5,019,553 199,898 3.98% Other assets 281,171 221,467 Total assets $ 6,741,177 $ 5,241,020 Liabilities and Shareholders' Equity Interest-bearing deposits: Interest-bearing checking accounts $ 1,058,064 $ 21,480 2.03% $ 612,921 $ 11,440 1.87% Money market deposit accounts 2,943,541 69,336 2.36% 2,429,203 45,106 1.86% Certificates of deposit 1,371,038 34,776 2.54% 1,071,556 21,947 2.05% Borrowings: FHLB borrowings 394,480 8,639 2.19% 325,356 5,555 1.71% Line of credit borrowings 1,234 68 5.51% 2,568 119 4.63% Subordinated notes payable, net 17,335 1,091 6.29% 34,807 2,215 6.36% Total interest-bearing liabilities 5,785,692 135,390 2.34% 4,476,411 86,382 1.93% Noninterest-bearing deposits 267,846 244,090 Other liabilities 128,618 75,473 Shareholders' equity 559,021 445,046 Total liabilities and shareholders' equity $ 6,741,177 $ 5,241,020 Net interest income (1) $ 127,158 $ 113,516 Net interest spread (1) 1.72% 2.05% Net interest margin (1) 1.97% 2.26% (1) Calculated on a fully taxable equivalent basis. 30 Investor presentation

Segments Three Months Ended March 31, 2020 Three Months Ended March 31, 2019 Investment Parent Investment Parent (Dollars in thousands) Bank Management and Other Consolidated Bank Management and Other Consolidated Income statement data: Interest income $ 64,202 $ — $ — $ 64,202 $ 62,830 $ — $ 72 $ 62,902 Interest expense 29,296 — (16) 29,280 31,919 — 611 32,530 Net interest income (loss) 34,906 — 16 34,922 30,911 — (539) 30,372 Provision (credit) for loan and lease losses 2,993 — — 2,993 (377) — — (377) Net interest income (loss) after provision for loan and lease losses 31,913 — 16 31,929 31,288 — (539) 30,749 Non-interest income: Investment management fees — 7,765 (127) 7,638 — 9,533 (109) 9,424 Net gain on the sale and call of debt securities 57 — — 57 28 — — 28 Other non-interest income (loss) 5,652 (31) — 5,621 2,877 21 719 3,617 Total non-interest income (loss) 5,709 7,734 (127) 13,316 2,905 9,554 610 13,069 Non-interest expense: Intangible amortization expense — 502 — 502 — 502 — 502 Other non-interest expense 21,034 6,626 982 28,642 19,021 7,058 91 26,170 Total non-interest expense 21,034 7,128 982 29,144 19,021 7,560 91 26,672 Income (loss) before tax 16,588 606 (1,093) 16,101 15,172 1,994 (20) 17,146 Income tax expense (benefit) 3,348 28 (170) 3,206 2,024 563 (5) 2,582 Net income (loss) $ 13,240 $ 578 $ (923) $ 12,895 $ 13,148 $ 1,431 $ (15) $ 14,564 31 Investor presentation

Reconciliation of Non-GAAP Financial measures to GAAP Income Statement Items For the Three Months Ended For the Years Ended March 31, December 31, September 30, June 30, March 31, December 31, December 31, (Dollars in thousands) 2020 2019 2019 2019 2019 2019 2018 Total revenue: Net interest income $ 34,922 $ 33,066 $ 32,316 $ 31,303 $ 30,372 $ 127,057 $ 113,404 Total non-interest income 13,316 13,491 14,243 11,979 13,069 52,782 47,917 Less: net gain (loss) on the sale and call of debt securities 57 70 206 112 28 416 (70) Total revenue $ 48,181 $ 46,487 $ 46,353 $ 43,170 $ 43,413 $ 179,423 $ 161,391 Less: total non-interest expense 29,144 30,119 27,773 27,585 26,672 112,149 101,157 Pre-tax, pre-provision net revenue $ 19,037 $ 16,368 $ 18,580 $ 15,585 $ 16,741 $ 67,274 $ 60,234 For the Three Months Ended For the Years Ended March 31, December 31, September 30, June 30, March 31, December 31, December 31, (Dollars in thousands) 2020 2019 2019 2019 2019 2019 2018 Bank total revenue: Net interest income $ 34,906 $ 33,025 $ 32,265 $ 31,794 $ 30,911 $ 127,996 $ 115,455 Total non-interest income 5,709 4,655 5,319 2,590 2,905 15,467 11,042 Less: net gain (loss) on the sale and call of debt securities 57 70 206 112 28 416 (70) Bank total revenue $ 40,558 $ 37,610 $ 37,378 $ 34,272 $ 33,788 $ 143,047 $ 126,567 Bank efficiency ratio: Total non-interest expense (numerator) $ 21,034 $ 21,073 $ 18,949 $ 18,903 $ 19,021 $ 77,945 $ 67,190 Total revenue (denominator) $ 40,558 $ 37,610 $ 37,378 $ 34,272 $ 33,788 $ 143,047 $ 126,567 Bank efficiency ratio 51.86% 56.03% 50.70% 55.16% 56.30% 54.49% 53.09% For a comprehensive discussion on the use of non-GAAP data, please refer to the Company’s most recent quarterly financial results news release filed with the Securities and Exchange Commission and available at www.tscbank.com 32 Investor presentation

Reconciliation of Non-GAAP Financial measures to GAAP Income Statement Items For the Three Months Ended For the Years Ended March 31, December 31, September 30, June 30, March 31, December 31, December 31, (Dollars in thousands) 2020 2019 2019 2019 2019 2019 2018 Investment Management EBITDA: Net income $ 578 $ 13 $ 316 $ 672 $ 1,431 $ 2,433 $ 3,851 Interest expense — — — — — — — Income taxes expense (benefit) 28 88 3 264 563 918 579 Depreciation expense 109 110 111 119 125 464 502 Intangible amortization expense 502 503 502 502 502 2,009 1,968 EBITDA $ 1,217 $ 714 $ 932 $ 1,557 $ 2,621 $ 5,824 $ 6,900 For a comprehensive discussion on the use of non-GAAP data, please refer to the Company’s most recent quarterly financial results news release filed with the Securities and Exchange Commission and available at www.tscbank.com 33 Investor presentation

Reconciliation of Non-GAAP Financial measures to GAAP Balance Sheet Items As of March 31, December 31, September 30, June 30, March 31, (Dollars in thousands, except per share data) 2020 2019 2019 2019 2019 Tangible book value per common share: Common shareholders' equity $ 498,301 $ 505,202 $ 488,443 $ 472,839 $ 458,089 Less: goodwill and intangible assets 65,352 65,854 66,357 66,859 67,361 Tangible common equity $ 432,949 $ 439,348 $ 422,086 $ 405,980 $ 390,728 Common shares outstanding 29,762,578 29,355,986 29,296,970 29,339,152 29,351,833 Tangible book value per common share $ 14.55 $ 14.97 $ 14.41 $ 13.84 $ 13.31 For a comprehensive discussion on the use of non-GAAP data, please refer to the Company’s most recent quarterly financial results news release filed with the Securities and Exchange Commission and available at www.tscbank.com 34 Investor presentation
