Attached files
| file | filename |
|---|---|
| EX-99.1 - EXHIBIT 99.1 - Shake Shack Inc. | shak-20200504exhibit991.htm |
| 8-K - 8-K - Shake Shack Inc. | shak-202005048k.htm |

FIRST QUARTER 2020 EARNINGS SUPPLEMENTAL MAY 4, 2020
CAUTIONARY NOTE ON FORWARD-LOOKING STATEMENTS This presentation contains forward-looking Forward-looking statements discuss the Company's current expectations and projections relating to its financial position, results of operations, plans, objectives, statements, within the meaning of the Private future performance and business. You can identify forward-looking statements by the Securities Litigation Reform Act of 1995, fact that they do not relate strictly to historical or current facts. These statements may which are subject to known and unknown include words such as "aim," "anticipate," "believe," "estimate," "expect," "forecast," "outlook," "potential," "project," "projection," "plan," "intend," "seek," "may," "could," risks, uncertainties and other important "would," "will," "should," "can," "can have," "likely," the negatives thereof and other factors that may cause actual results to be similar expressions. materially different. All forward-looking statements are expressly qualified in their entirety by these cautionary statements. You should evaluate all forward-looking statements made All statements other than statements of historical fact included in this in this presentation in the context of the risks and uncertainties disclosed in presentation are forward-looking statements, including, but not limited the Company’s Annual Report on Form 10-K for the fiscal year ended December to, expected financial outlook for fiscal 2020, expected operating 25, 2019, and the Current Reports on Form 8-K dated March 16, 2020 and April 17, performance for fiscal 2020, expected Shack construction 2020 as filed with the Securities and Exchange Commission ("SEC"). All of the and openings, expected same-Shack sales growth and trends in Shake Company's SEC filings are available online at www.sec.gov, www.shakeshack.com Shack Inc.’s (the "Company's") operations including statements relating or upon request from Shake Shack Inc. The forward-looking statements included in to the effects of COVID-19 and the Company’s mitigation efforts. this presentation are made only as of the date hereof. The Company undertakes no obligation to publicly update or revise any forward-looking statement as a result of new information, future events or otherwise, except as otherwise required by law. 2
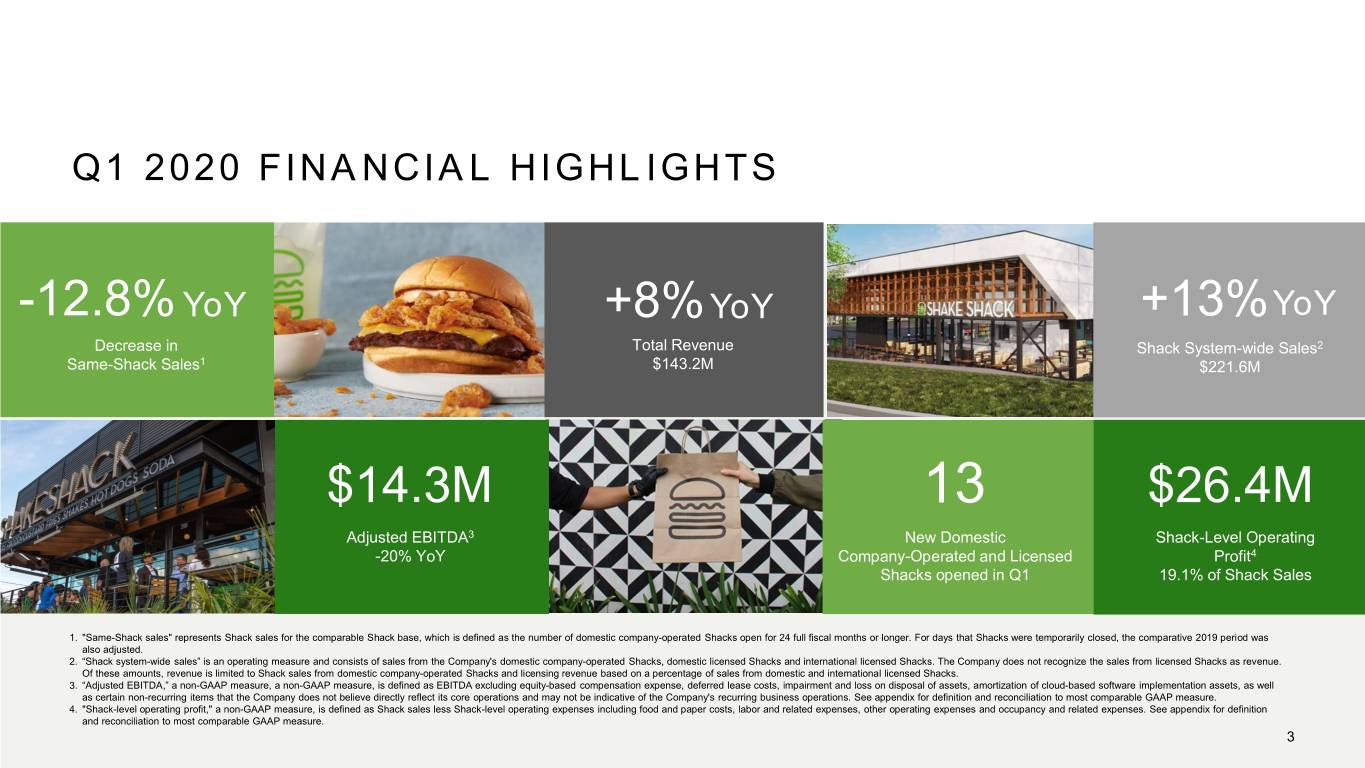
Q1 2020 FINANCIAL HIGHLIGHTS -12.8% YoY +8% YoY +13%YoY Decrease in Total Revenue Shack System-wide Sales2 Same-Shack Sales1 $143.2M $221.6M $14.3M 13 $26.4M Adjusted EBITDA3 New Domestic Shack-Level Operating -20% YoY Company-Operated and Licensed Profit4 Shacks opened in Q1 19.1% of Shack Sales 1. "Same-Shack sales" represents Shack sales for the comparable Shack base, which is defined as the number of domestic company-operated Shacks open for 24 full fiscal months or longer. For days that Shacks were temporarily closed, the comparative 2019 period was also adjusted. 2. “Shack system-wide sales” is an operating measure and consists of sales from the Company's domestic company-operated Shacks, domestic licensed Shacks and international licensed Shacks. The Company does not recognize the sales from licensed Shacks as revenue. Of these amounts, revenue is limited to Shack sales from domestic company-operated Shacks and licensing revenue based on a percentage of sales from domestic and international licensed Shacks. 3. “Adjusted EBITDA,” a non-GAAP measure, a non-GAAP measure, is defined as EBITDA excluding equity-based compensation expense, deferred lease costs, impairment and loss on disposal of assets, amortization of cloud-based software implementation assets, as well as certain non-recurring items that the Company does not believe directly reflect its core operations and may not be indicative of the Company's recurring business operations. See appendix for definition and reconciliation to most comparable GAAP measure. 4. "Shack-level operating profit," a non-GAAP measure, is defined as Shack sales less Shack-level operating expenses including food and paper costs, labor and related expenses, other operating expenses and occupancy and related expenses. See appendix for definition and reconciliation to most comparable GAAP measure. 3
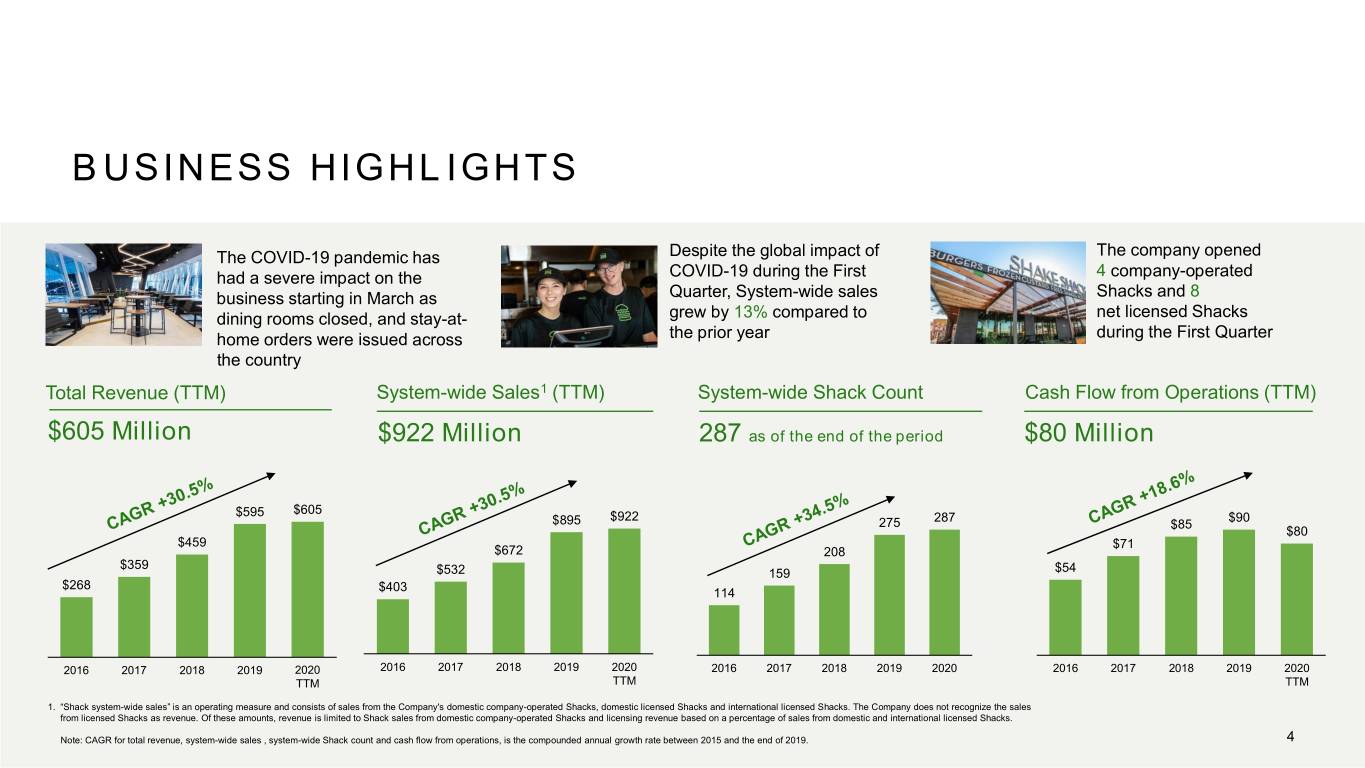
BUSINESS HIGHLIGHTS The COVID-19 pandemic has Despite the global impact of The company opened had a severe impact on the COVID-19 during the First 4 company-operated business starting in March as Quarter, System-wide sales Shacks and 8 dining rooms closed, and stay-at- grew by 13% compared to net licensed Shacks home orders were issued across the prior year during the First Quarter the country Total Revenue (TTM) System-wide Sales1 (TTM) System-wide Shack Count Cash Flow from Operations (TTM) $605 Million $922 Million 287 as of the end of the period $80 Million $605 $595 $922 287 $90 $895 275 $85 $80 $459 $71 $672 208 $359 $532 159 $54 $268 $403 114 2016 2017 2018 2019 2020 2016 2017 2018 2019 2020 2016 2017 2018 2019 2020 2016 2017 2018 2019 2020 TTM TTM TTM 1. “Shack system-wide sales” is an operating measure and consists of sales from the Company's domestic company-operated Shacks, domestic licensed Shacks and international licensed Shacks. The Company does not recognize the sales from licensed Shacks as revenue. Of these amounts, revenue is limited to Shack sales from domestic company-operated Shacks and licensing revenue based on a percentage of sales from domestic and international licensed Shacks. Note: CAGR for total revenue, system-wide sales , system-wide Shack count and cash flow from operations, is the compounded annual growth rate between 2015 and the end of 2019. 4
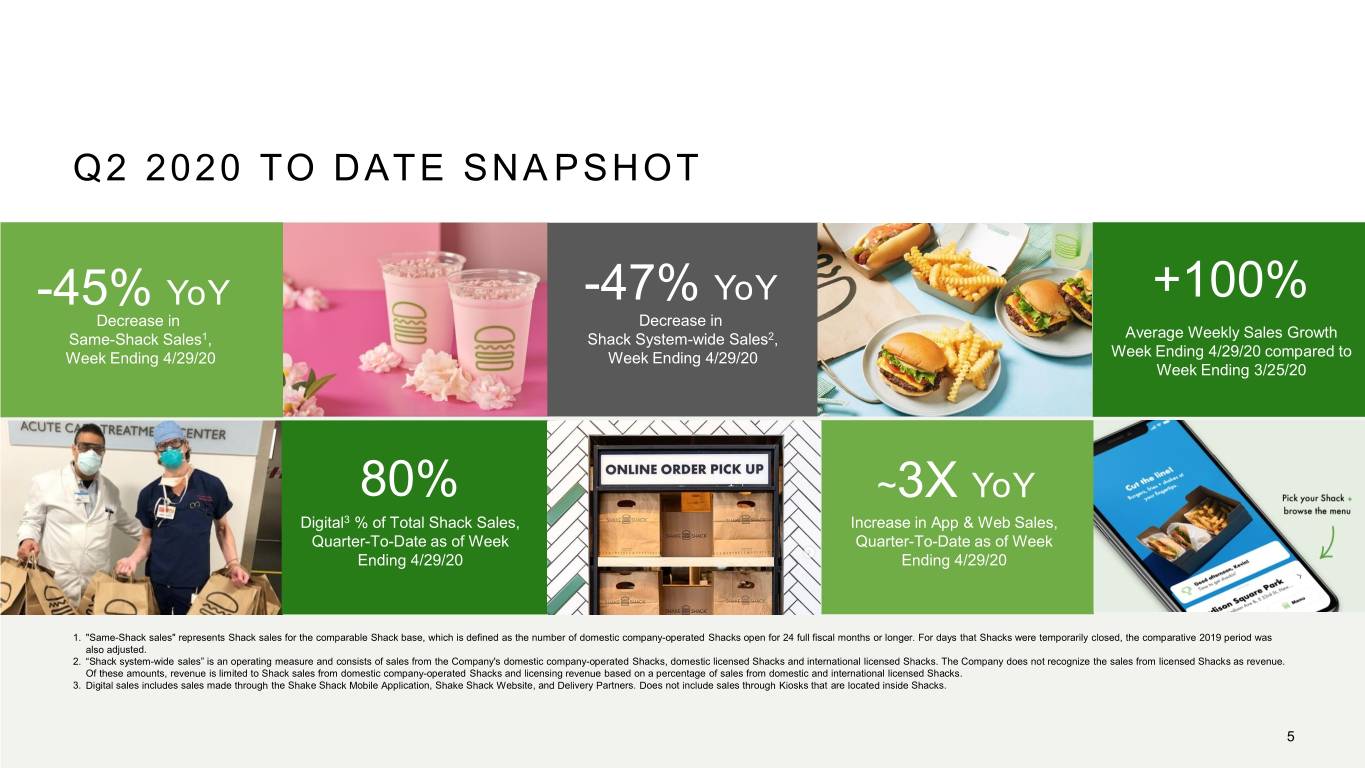
Q2 2020 TO DATE SNAPSHOT -45% YoY -47% YoY +100% Decrease in Decrease in Same-Shack Sales1, Shack System-wide Sales2, Average Weekly Sales Growth Week Ending 4/29/20 Week Ending 4/29/20 Week Ending 4/29/20 compared to Week Ending 3/25/20 80% ~3X YoY Digital3 % of Total Shack Sales, Increase in App & Web Sales, Quarter-To-Date as of Week Quarter-To-Date as of Week Ending 4/29/20 Ending 4/29/20 1. "Same-Shack sales" represents Shack sales for the comparable Shack base, which is defined as the number of domestic company-operated Shacks open for 24 full fiscal months or longer. For days that Shacks were temporarily closed, the comparative 2019 period was also adjusted. 2. “Shack system-wide sales” is an operating measure and consists of sales from the Company's domestic company-operated Shacks, domestic licensed Shacks and international licensed Shacks. The Company does not recognize the sales from licensed Shacks as revenue. Of these amounts, revenue is limited to Shack sales from domestic company-operated Shacks and licensing revenue based on a percentage of sales from domestic and international licensed Shacks. 3. Digital sales includes sales made through the Shake Shack Mobile Application, Shake Shack Website, and Delivery Partners. Does not include sales through Kiosks that are located inside Shacks. 5
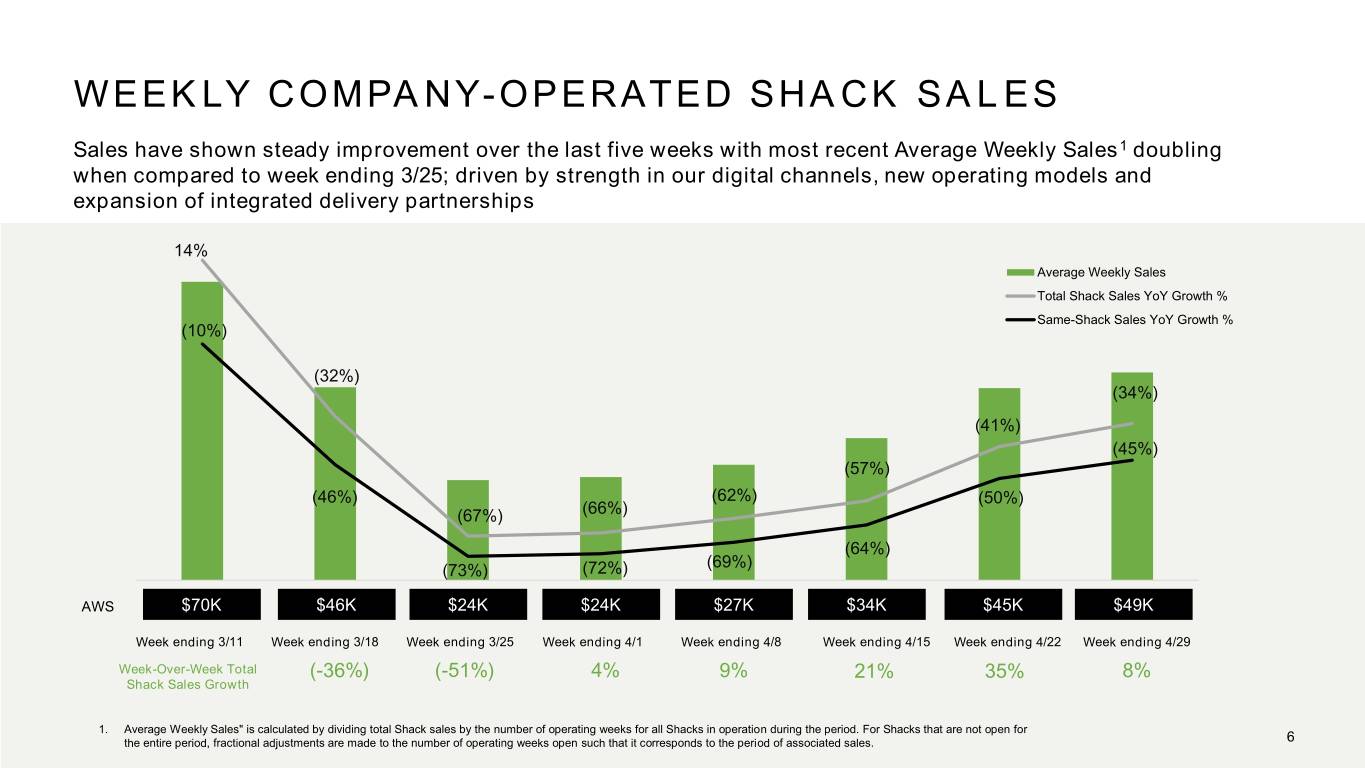
WEEKLY COMPANY-OPERATED SHACK SALES Sales have shown steady improvement over the last five weeks with most recent Average Weekly Sales1 doubling when compared to week ending 3/25; driven by strength in our digital channels, new operating models and expansion of integrated delivery partnerships $80,000 20% 14% Average Weekly Sales 10% $70,000 Total Shack Sales YoY Growth % 0% Same-Shack Sales YoY Growth % $60,000 (10%) -10% $50,000 (32%) -20% (34%) $40,000 -30% (41%) -40% $30,000 (45%) (57%) -50% $20,000 (46%) (62%) (50%) (67%) (66%) -60% $10,000 (64%) -70% (69%) (73%) (72%) $0 -80% Week Ending 3/11 Week Ending 3/18 Week Ending 3/25 Week Ending 4/1 Week Ending 4/8 Week Ending 4/15 Week Ending 4/22 Week Ending 4/29 AWS $70K $46K $24K $24K $27K $34K $45K $49K Week ending 3/11 Week ending 3/18 Week ending 3/25 Week ending 4/1 Week ending 4/8 Week ending 4/15 Week ending 4/22 Week ending 4/29 Week-Over-Week Total (-36%) (-51%) 4% 9% 21% 35% 8% Shack Sales Growth 1. Average Weekly Sales" is calculated by dividing total Shack sales by the number of operating weeks for all Shacks in operation during the period. For Shacks that are not open for the entire period, fractional adjustments are made to the number of operating weeks open such that it corresponds to the period of associated sales. 6
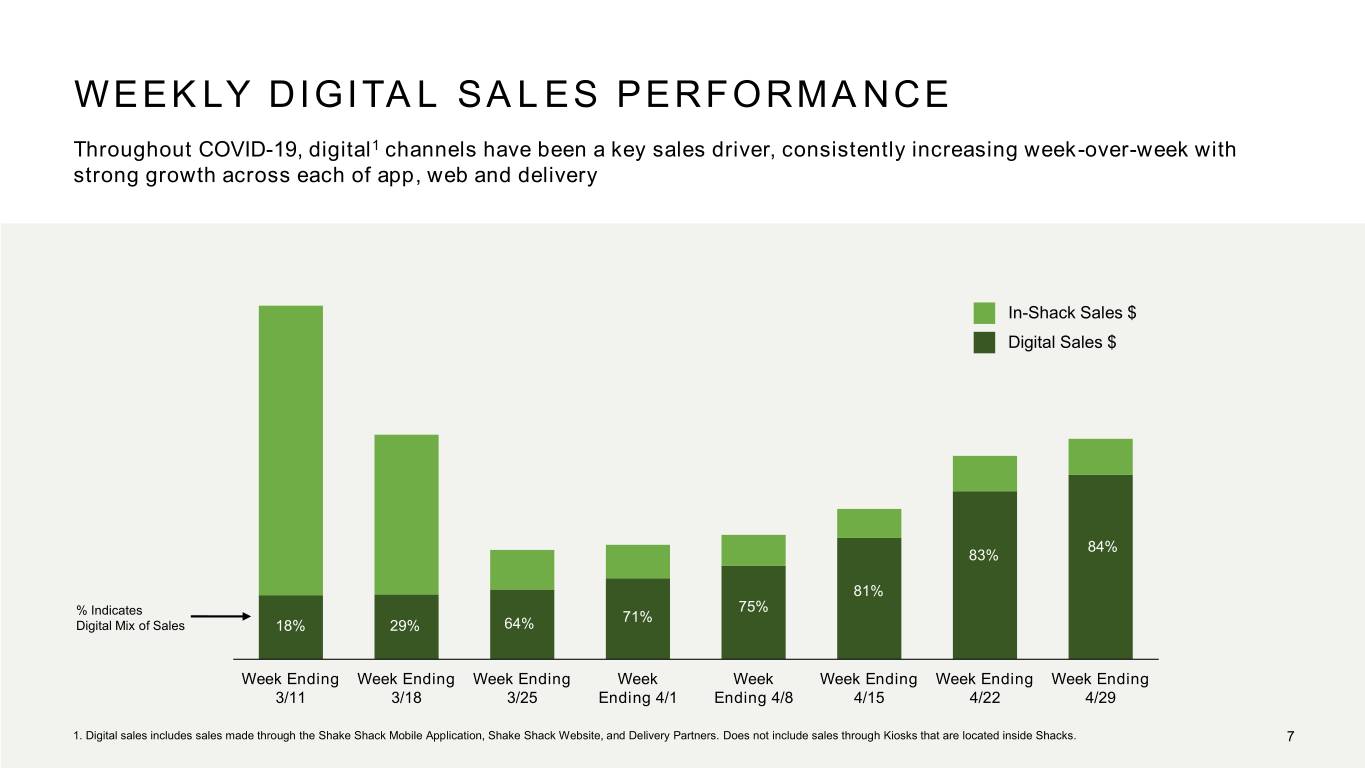
WEEKLY DIGITAL SALES PERFORMANCE Throughout COVID-19, digital1 channels have been a key sales driver, consistently increasing week-over-week with strong growth across each of app, web and delivery In-Shack Sales $ Digital Sales $ 84% 83% 81% 75% % Indicates 71% Digital Mix of Sales 18% 29% 64% Week Ending Week Ending Week Ending Week Week Week Ending Week Ending Week Ending 3/11 3/18 3/25 Ending 4/1 Ending 4/8 4/15 4/22 4/29 1. Digital sales includes sales made through the Shake Shack Mobile Application, Shake Shack Website, and Delivery Partners. Does not include sales through Kiosks that are located inside Shacks. 7
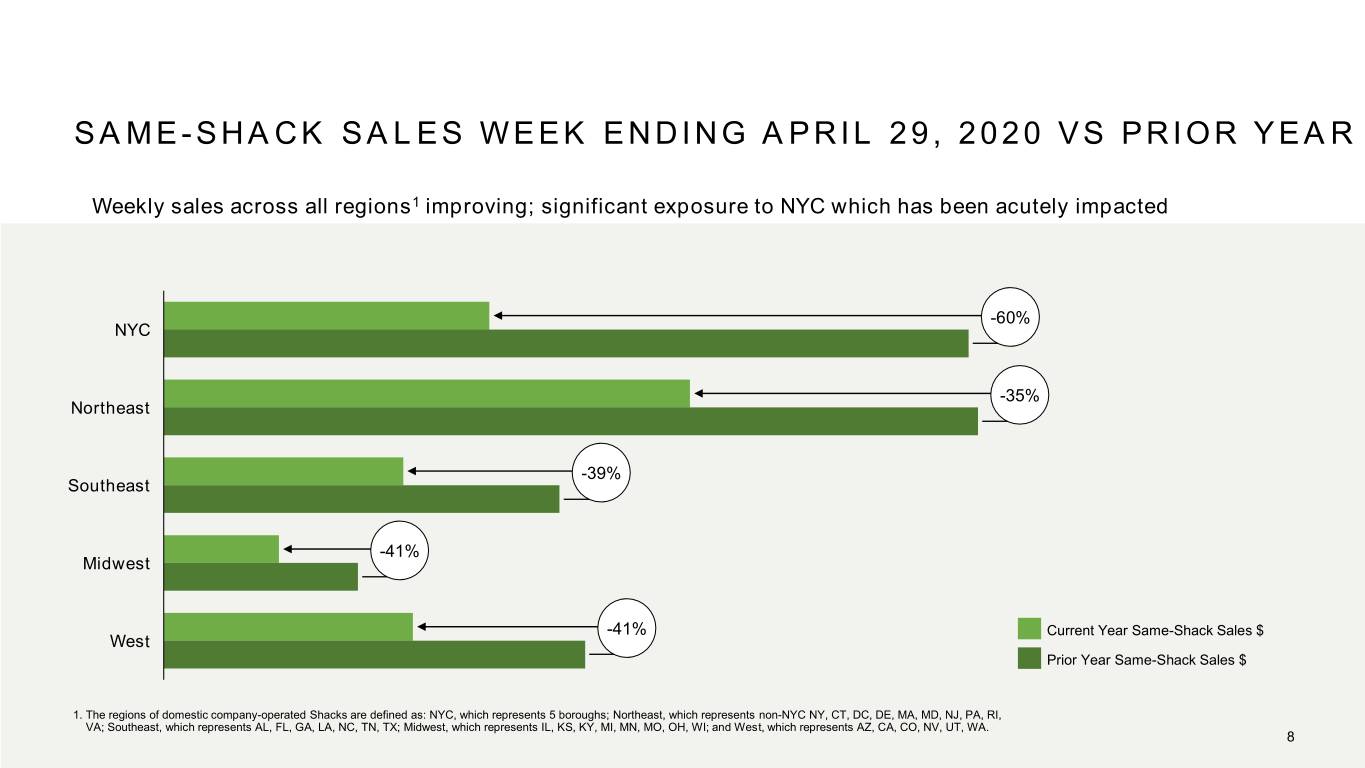
SAME - SHACK SALES WEEK ENDING APRIL 29, 2020 VS PRIOR YEAR Weekly sales across all regions1 improving; significant exposure to NYC which has been acutely impacted -60% NYC -35% Northeast -39% Southeast -41% Midwest -41% Current Year Same-Shack Sales $ West Prior Year Same-Shack Sales $ 1. The regions of domestic company-operated Shacks are defined as: NYC, which represents 5 boroughs; Northeast, which represents non-NYC NY, CT, DC, DE, MA, MD, NJ, PA, RI, VA; Southeast, which represents AL, FL, GA, LA, NC, TN, TX; Midwest, which represents IL, KS, KY, MI, MN, MO, OH, WI; and West, which represents AZ, CA, CO, NV, UT, WA. 8
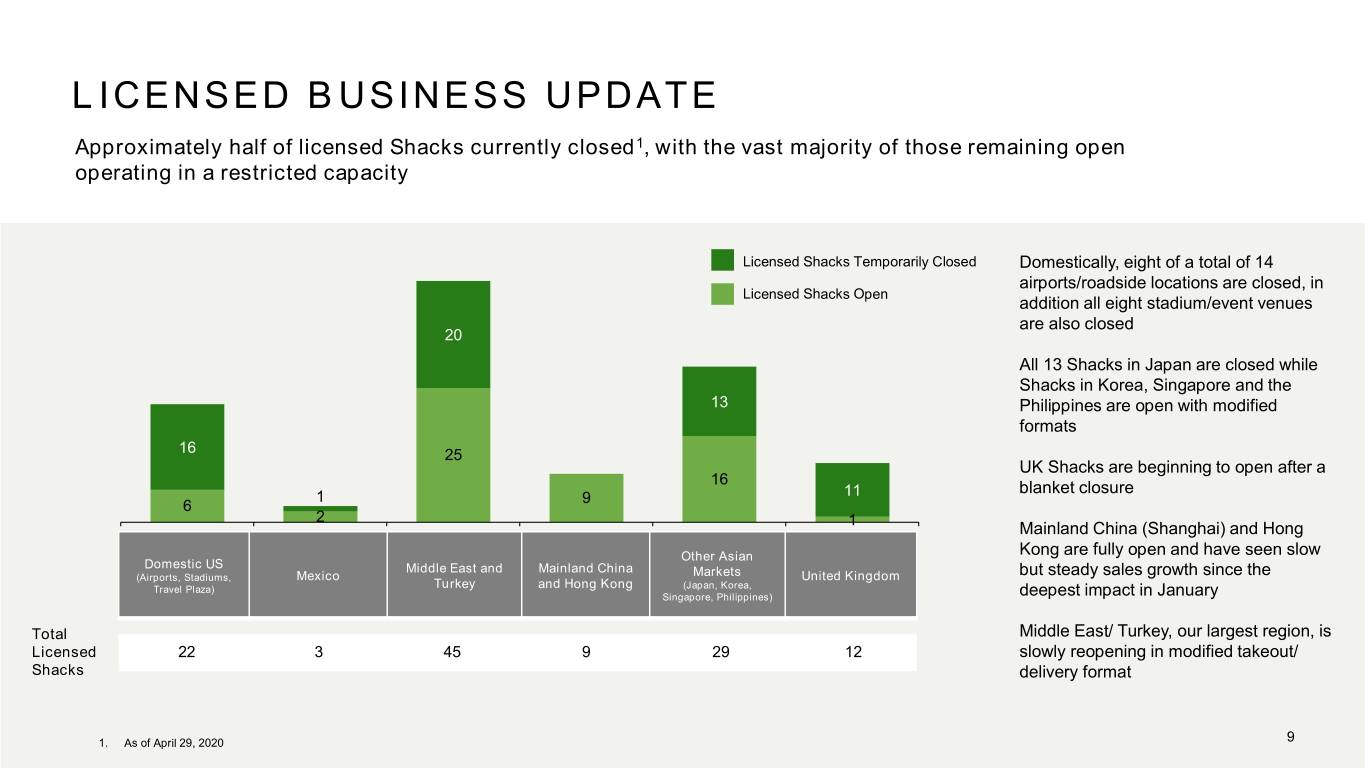
LICENSED BUSINESS UPDATE Approximately half of licensed Shacks currently closed1, with the vast majority of those remaining open operating in a restricted capacity Licensed Shacks Temporarily Closed Domestically, eight of a total of 14 airports/roadside locations are closed, in Licensed Shacks Open addition all eight stadium/event venues are also closed 20 All 13 Shacks in Japan are closed while Shacks in Korea, Singapore and the 13 Philippines are open with modified formats 16 25 UK Shacks are beginning to open after a 16 blanket closure 1 9 11 6 2 1 Mainland China (Shanghai) and Hong 1 2 3 4 5 6 Other Asian Kong are fully open and have seen slow Domestic US Middle East and Mainland China (Airports, Stadiums, Mexico Markets United Kingdom but steady sales growth since the Travel Plaza) Turkey and Hong Kong (Japan, Korea, Singapore, Philippines) deepest impact in January Total Middle East/ Turkey, our largest region, is Licensed 22 3 45 9 29 12 slowly reopening in modified takeout/ Shacks delivery format 1. As of April 29, 2020 9

FOCUS ON COMPANY OWNED DIGITAL CHANNELS AND EXPANSION OF DELIVERY PARTNERSHIPS Shack App & Web are Shifted to multi-partner Capitalizing on update the strongest growing strategy, integrating marketing digital channels year- UberEats, DoorDash, Caviar opportunities during over-year quarter-to- and Postmates in addition to current stay-at-home date through 4/29/20 previously exclusive Grubhub directives App and Web Channels Delivery is available at all Launched cook-at-home have grown nearly three Company-operated Shacks, ShackBurger meal kit in times since last year. with 98% of Shacks covered collaboration with Capturing insightful guest by 4 of the 5 Delivery Goldbelly. The partnership data and trends in a key Partners has led to over 12,000 strategic channel for the meal kits sold to date company 10

INNOVATION AND FLEXIBILITY THROUGH OPERATING MODEL PIVOTS IN REACTION TO COVID -19 In response to closed dining rooms and social distancing requirements, Shacks have created new methods of operating with makeshift drive throughs, curbside pick-up and digital pre-ordering to ensure safety of guests & teams 11
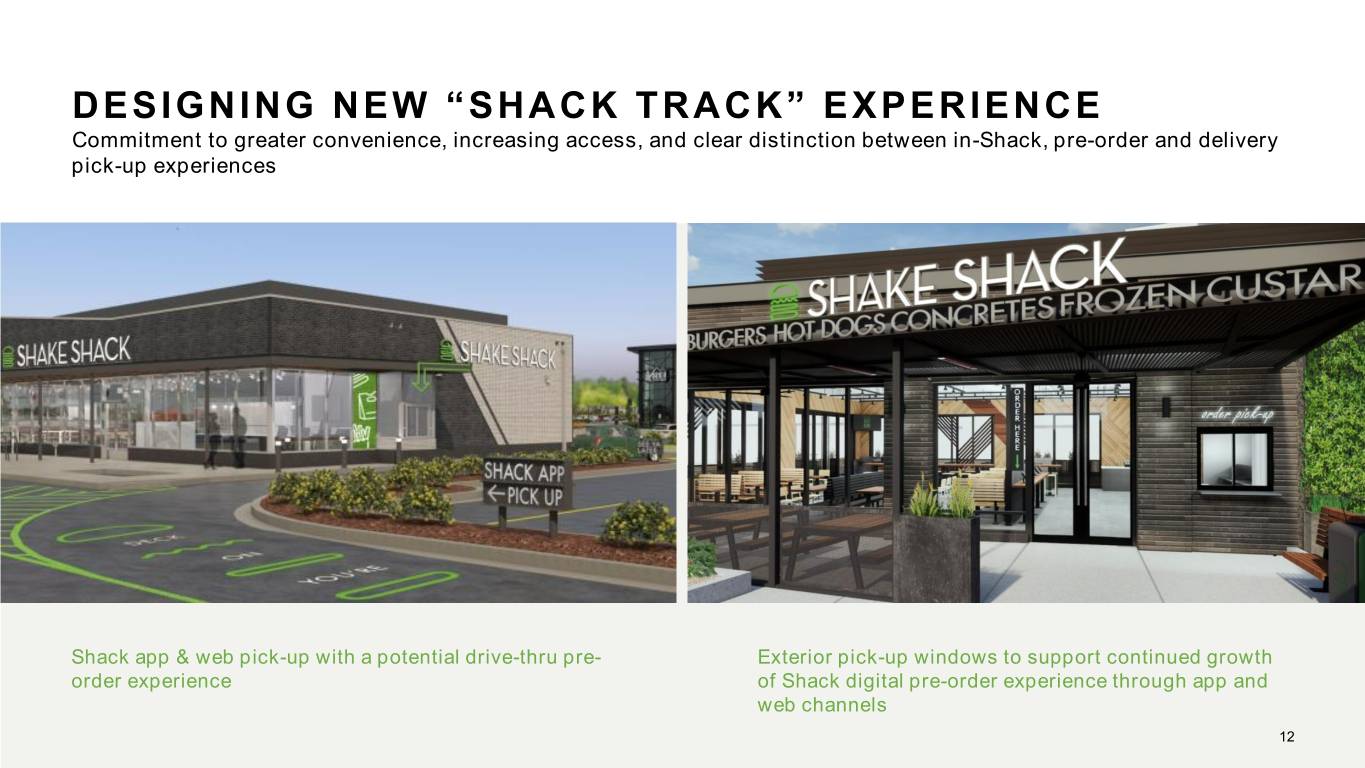
DESIGNING NEW “SHACK TRACK” EXPERIENCE Commitment to greater convenience, increasing access, and clear distinction between in-Shack, pre-order and delivery pick-up experiences Shack app & web pick-up with a potential drive-thru pre- Exterior pick-up windows to support continued growth order experience of Shack digital pre-order experience through app and web channels 12
DEFINITIONS “Adjusted EBITDA,” a non-GAAP measure”, is defined as EBITDA (as defined below), "Shack-level operating profit," a non-GAAP measure, is defined as Shack sales less excluding equity-based compensation expense, deferred lease costs, impairment and loss Shack-level operating expenses including food and paper costs, labor and related expenses, on disposal of assets, amortization of cloud-based software implementation assets, as well other operating expenses and occupancy and related expenses. as certain non-recurring items that the Company does not believe directly reflect its core operations and may not be indicative of the Company's recurring business operations. "Shack-level operating profit margin," a non-GAAP measure, is defined as Shack sales less Shack-level operating expenses, including food and paper costs, labor and related “Adjusted EBITDA margin,” a non-GAAP measure, is defined as net income (loss) before expenses, other operating expenses and occupancy and related expenses as a percentage of net interest, taxes, depreciation and amortization, which also excludes equity-based Shack sales. compensation expense, deferred lease costs, impairment and loss on disposal of assets, amortization of cloud-based software implementation assets, as well as certain non- "Shack sales" is defined as the aggregate sales of food, beverages and Shake Shack- recurring and other items that the Company does not believe directly reflect its core branded merchandise at domestic company-operated Shacks and excludes sales from operations, as a percentage of revenue. licensed Shacks. "Same-Shack Sales" represents Shack sales for the comparable Shack base, which is “Shack system-wide sales” is an operating measure and consists of sales from domestic defined as the number of domestic company-operated Shacks open for 24 full fiscal months company-operated Shacks, domestic licensed Shacks and international licensed Shacks. The or longer. For days that Shacks were temporarily closed, the comparative 2019 period was Company does not recognize the sales from licensed Shacks as revenue. Of these amounts, also adjusted. revenue is limited to Shack sales from domestic company-operated Shacks and licensing revenue based on a percentage of sales from domestic and international licensed Shacks, as “EBITDA,” a non-GAAP measure, is defined as net income (loss) before interest expense well as certain up-front fees such as territory fees and opening fees. (net of interest income), income tax expense, and depreciation and amortization expense. 13
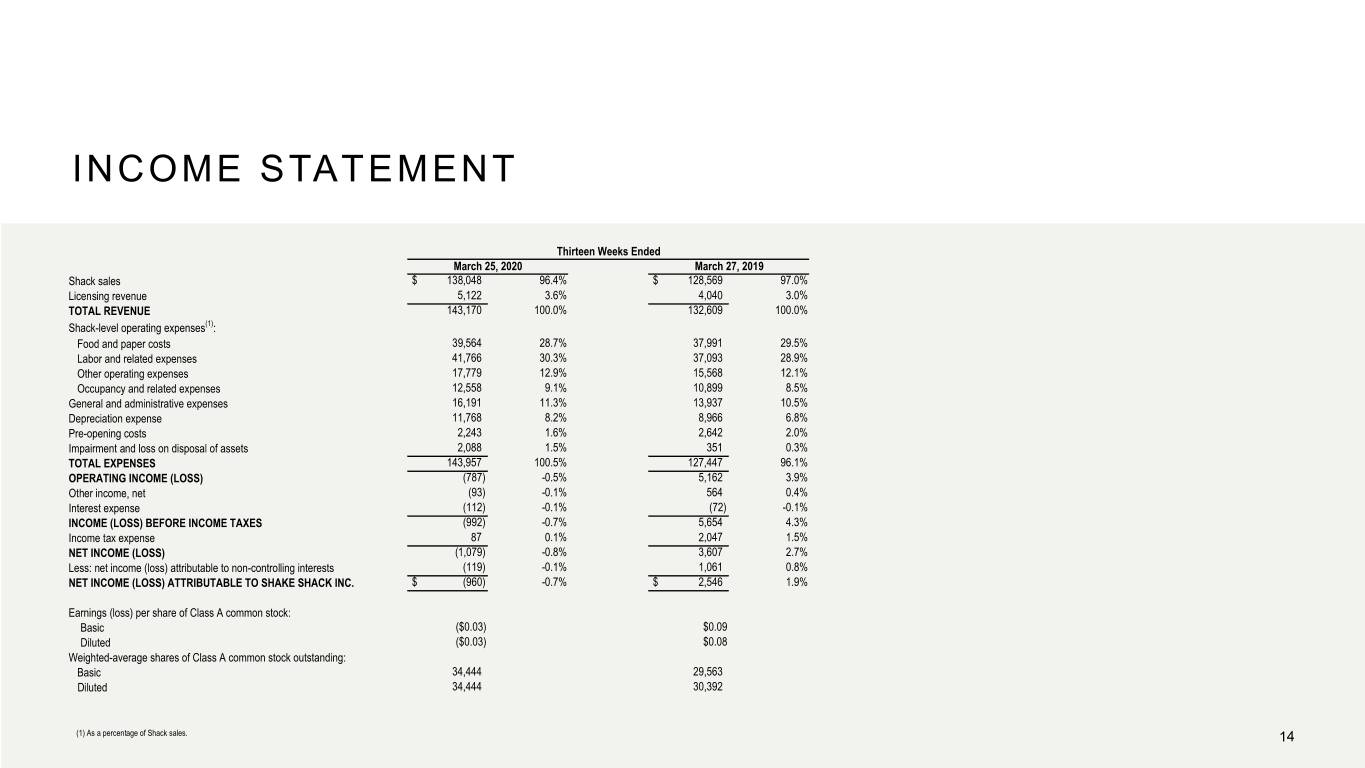
INCOME STATEMENT Thirteen Weeks Ended March 25, 2020 March 27, 2019 Shack sales $ 138,048 96.4% $ 128,569 97.0% Licensing revenue 5,122 3.6% 4,040 3.0% TOTAL REVENUE 143,170 100.0% 132,609 100.0% Shack-level operating expenses(1): Food and paper costs 39,564 28.7% 37,991 29.5% Labor and related expenses 41,766 30.3% 37,093 28.9% Other operating expenses 17,779 12.9% 15,568 12.1% Occupancy and related expenses 12,558 9.1% 10,899 8.5% General and administrative expenses 16,191 11.3% 13,937 10.5% Depreciation expense 11,768 8.2% 8,966 6.8% Pre-opening costs 2,243 1.6% 2,642 2.0% Impairment and loss on disposal of assets 2,088 1.5% 351 0.3% TOTAL EXPENSES 143,957 100.5% 127,447 96.1% OPERATING INCOME (LOSS) (787) -0.5% 5,162 3.9% Other income, net (93) -0.1% 564 0.4% Interest expense (112) -0.1% (72) -0.1% INCOME (LOSS) BEFORE INCOME TAXES (992) -0.7% 5,654 4.3% Income tax expense 87 0.1% 2,047 1.5% NET INCOME (LOSS) (1,079) -0.8% 3,607 2.7% Less: net income (loss) attributable to non-controlling interests (119) -0.1% 1,061 0.8% NET INCOME (LOSS) ATTRIBUTABLE TO SHAKE SHACK INC. $ (960) -0.7% $ 2,546 1.9% Earnings (loss) per share of Class A common stock: Basic ($0.03) $0.09 Diluted ($0.03) $0.08 Weighted-average shares of Class A common stock outstanding: Basic 34,444 29,563 Diluted 34,444 30,392 (1) As a percentage of Shack sales. 14
SHACK-LEVEL OPERATING PROFIT DEFINITIONS Shack-Level Operating Profit Limitations of the Usefulness of this Measure Shack-level operating profit is defined as Shack sales less Shack-level operating Shack-level operating profit and Shack-level operating profit margin may differ from expenses, including food and paper costs, labor and related expenses, other similarly titled measures used by other companies due to different methods of operating expenses and occupancy and related expenses. calculation. Presentation of Shack-level operating profit and Shack-level operating profit margin is not intended to be considered in isolation or as a substitute for, or superior to, the financial information prepared and presented in accordance with GAAP. Shack-level How This Measure Is Useful operating profit excludes certain costs, such as general and administrative expenses When used in conjunction with GAAP financial measures, Shack-level operating profit and pre-opening costs, which are considered normal, recurring cash operating expenses and Shack-level operating profit margin are supplemental measures of operating and are essential to support the operation and development of the Company's Shacks. performance that the Company believes are useful measures to evaluate the Therefore, this measure may not provide a complete understanding of the Company's performance and profitability of its Shacks. Additionally, Shack-level operating profit operating results as a whole and Shack-level operating profit and Shack-level operating and Shack-level operating profit margin are key metrics used internally by profit margin should be reviewed in conjunction with the Company’s GAAP financial management to develop internal budgets and forecasts, as well as assess the results. A reconciliation of Shack-level operating profit to operating income, the most performance of its Shacks relative to budget and against prior periods. It is also used directly comparable GAAP financial measure, is set forth on next slide. to evaluate employee compensation as it serves as a metric in certain performance- based employee bonus arrangements. The Company believes presentation of Shack- level operating profit and Shack-level operating profit margin provides investors with a supplemental view of its operating performance that can provide meaningful insights to the underlying operating performance of the Shacks, as these measures depict the operating results that are directly impacted by the Shacks and exclude items that may not be indicative of, or are unrelated to, the ongoing operations of the Shacks. It may also assist investors to evaluate the Company's performance relative to peers of various sizes and maturities and provides greater transparency with respect to how management evaluates the business, as well as the financial and operational decision-making. 15
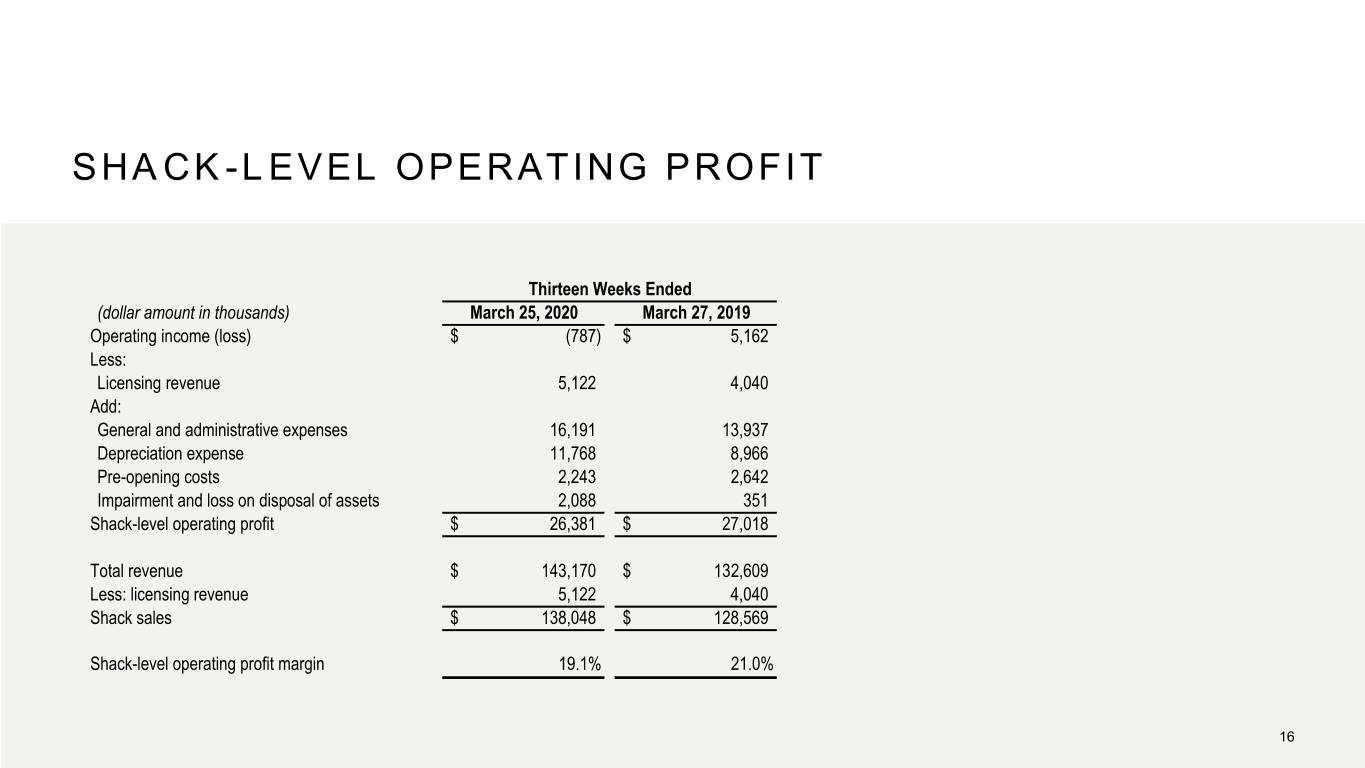
SHACK-LEVEL OPERATING PROFIT Thirteen Weeks Ended (dollar amount in thousands) March 25, 2020 March 27, 2019 Operating income (loss) $ (787) $ 5,162 Less: Licensing revenue 5,122 4,040 Add: General and administrative expenses 16,191 13,937 Depreciation expense 11,768 8,966 Pre-opening costs 2,243 2,642 Impairment and loss on disposal of assets 2,088 351 Shack-level operating profit $ 26,381 $ 27,018 Total revenue $ 143,170 $ 132,609 Less: licensing revenue 5,122 4,040 Shack sales $ 138,048 $ 128,569 Shack-level operating profit margin 19.1% 21.0% 16
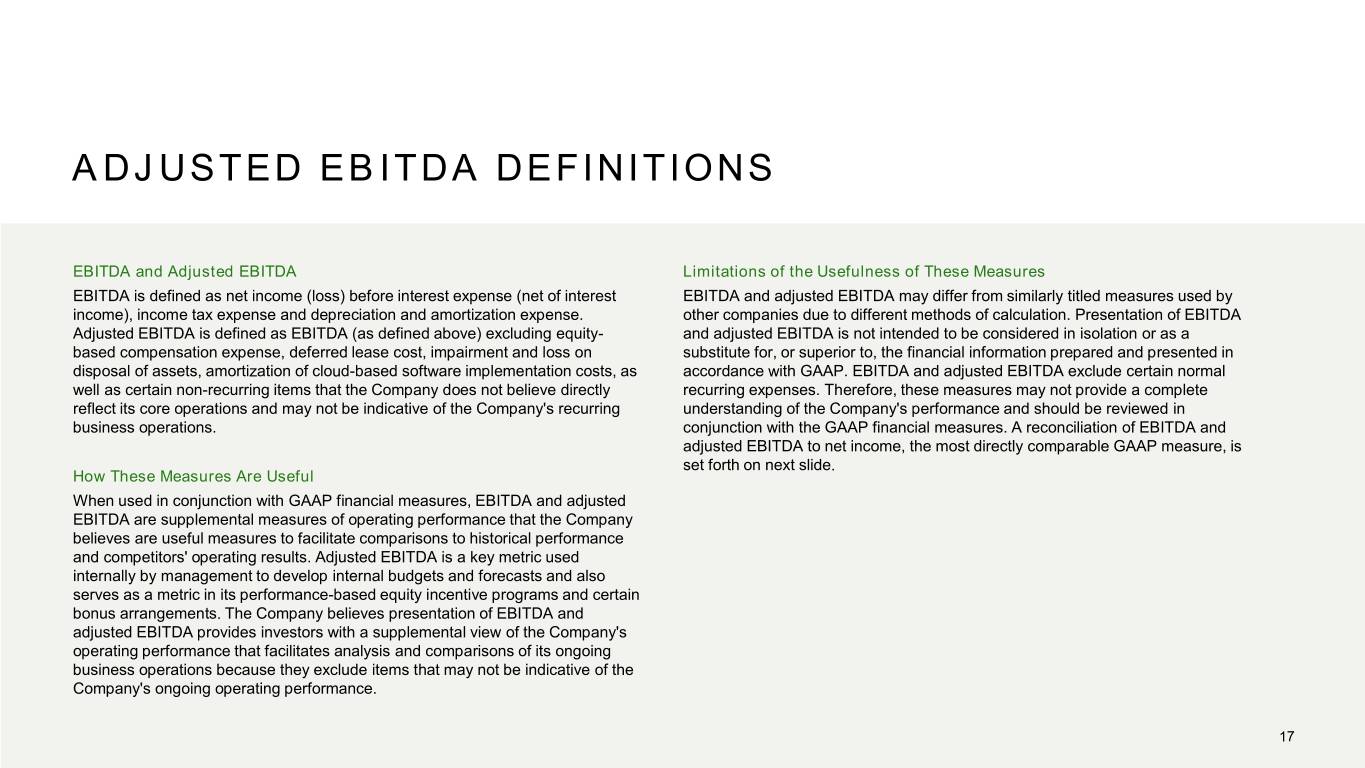
ADJUSTED EBITDA DEFINITIONS EBITDA and Adjusted EBITDA Limitations of the Usefulness of These Measures EBITDA is defined as net income (loss) before interest expense (net of interest EBITDA and adjusted EBITDA may differ from similarly titled measures used by income), income tax expense and depreciation and amortization expense. other companies due to different methods of calculation. Presentation of EBITDA Adjusted EBITDA is defined as EBITDA (as defined above) excluding equity- and adjusted EBITDA is not intended to be considered in isolation or as a based compensation expense, deferred lease cost, impairment and loss on substitute for, or superior to, the financial information prepared and presented in disposal of assets, amortization of cloud-based software implementation costs, as accordance with GAAP. EBITDA and adjusted EBITDA exclude certain normal well as certain non-recurring items that the Company does not believe directly recurring expenses. Therefore, these measures may not provide a complete reflect its core operations and may not be indicative of the Company's recurring understanding of the Company's performance and should be reviewed in business operations. conjunction with the GAAP financial measures. A reconciliation of EBITDA and adjusted EBITDA to net income, the most directly comparable GAAP measure, is set forth on next slide. How These Measures Are Useful When used in conjunction with GAAP financial measures, EBITDA and adjusted EBITDA are supplemental measures of operating performance that the Company believes are useful measures to facilitate comparisons to historical performance and competitors' operating results. Adjusted EBITDA is a key metric used internally by management to develop internal budgets and forecasts and also serves as a metric in its performance-based equity incentive programs and certain bonus arrangements. The Company believes presentation of EBITDA and adjusted EBITDA provides investors with a supplemental view of the Company's operating performance that facilitates analysis and comparisons of its ongoing business operations because they exclude items that may not be indicative of the Company's ongoing operating performance. 17
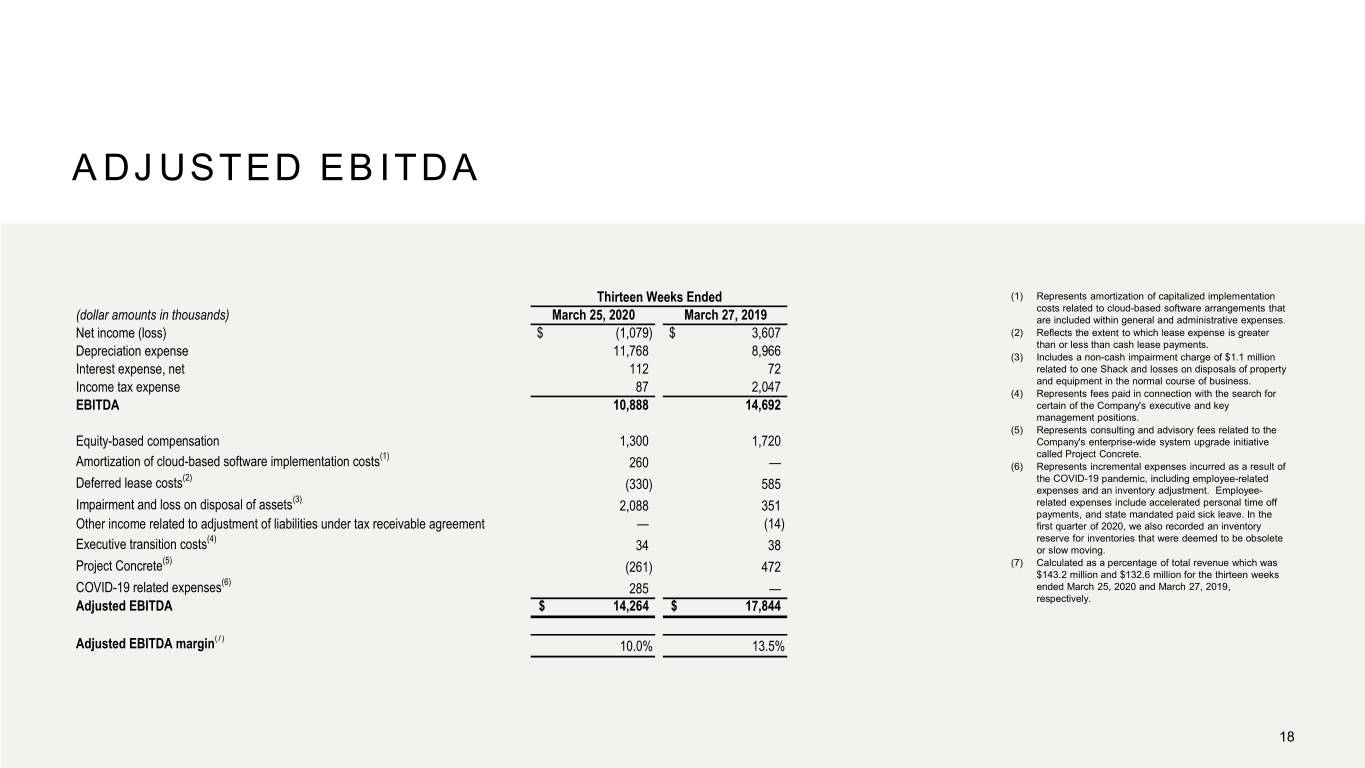
ADJUSTED EBITDA Thirteen Weeks Ended (1) Represents amortization of capitalized implementation costs related to cloud-based software arrangements that (dollar amounts in thousands) March 25, 2020 March 27, 2019 are included within general and administrative expenses. Net income (loss) $ (1,079) $ 3,607 (2) Reflects the extent to which lease expense is greater than or less than cash lease payments. Depreciation expense 11,768 8,966 (3) Includes a non-cash impairment charge of $1.1 million Interest expense, net 112 72 related to one Shack and losses on disposals of property and equipment in the normal course of business. Income tax expense 87 2,047 (4) Represents fees paid in connection with the search for EBITDA 10,888 14,692 certain of the Company's executive and key management positions. (5) Represents consulting and advisory fees related to the Equity-based compensation 1,300 1,720 Company's enterprise-wide system upgrade initiative (1) called Project Concrete. Amortization of cloud-based software implementation costs 260 — (6) Represents incremental expenses incurred as a result of Deferred lease costs(2) the COVID-19 pandemic, including employee-related (330) 585 expenses and an inventory adjustment. Employee- Impairment and loss on disposal of assets(3) 2,088 351 related expenses include accelerated personal time off payments, and state mandated paid sick leave. In the Other income related to adjustment of liabilities under tax receivable agreement — (14) first quarter of 2020, we also recorded an inventory (4) reserve for inventories that were deemed to be obsolete Executive transition costs 34 38 or slow moving. Project Concrete(5) (261) 472 (7) Calculated as a percentage of total revenue which was $143.2 million and $132.6 million for the thirteen weeks COVID-19 related expenses(6) 285 — ended March 25, 2020 and March 27, 2019, respectively. Adjusted EBITDA $ 14,264 $ 17,844 (7) Adjusted EBITDA margin 10.0% 13.5% 18
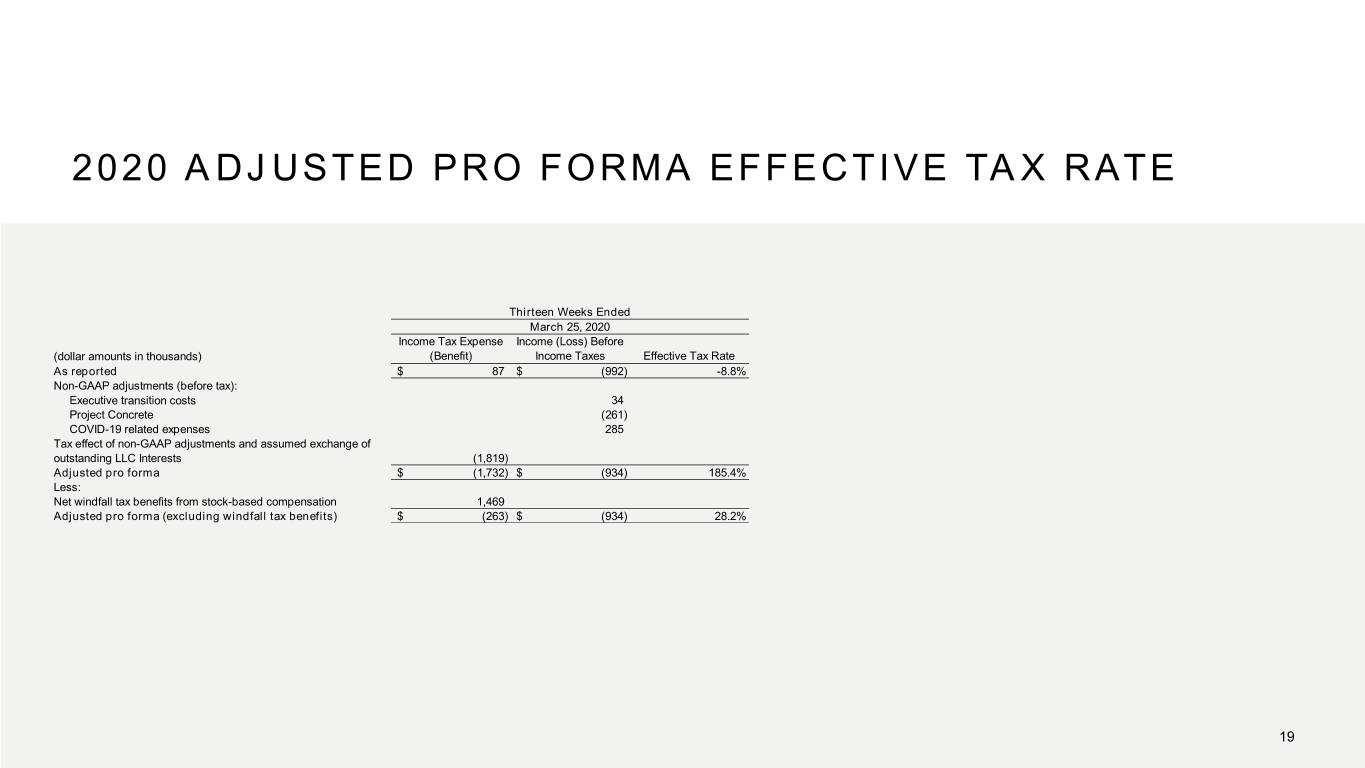
2020 ADJUSTED PRO FORMA EFFECTIVE TAX RATE Thirteen Weeks Ended March 25, 2020 Income Tax Expense Income (Loss) Before (dollar amounts in thousands) (Benefit) Income Taxes Effective Tax Rate As reported $ 87 $ (992) -8.8% Non-GAAP adjustments (before tax): Executive transition costs 34 Project Concrete (261) COVID-19 related expenses 285 Tax effect of non-GAAP adjustments and assumed exchange of outstanding LLC Interests (1,819) Adjusted pro forma $ (1,732) $ (934) 185.4% Less: Net windfall tax benefits from stock-based compensation 1,469 Adjusted pro forma (excluding windfall tax benefits) $ (263) $ (934) 28.2% 19
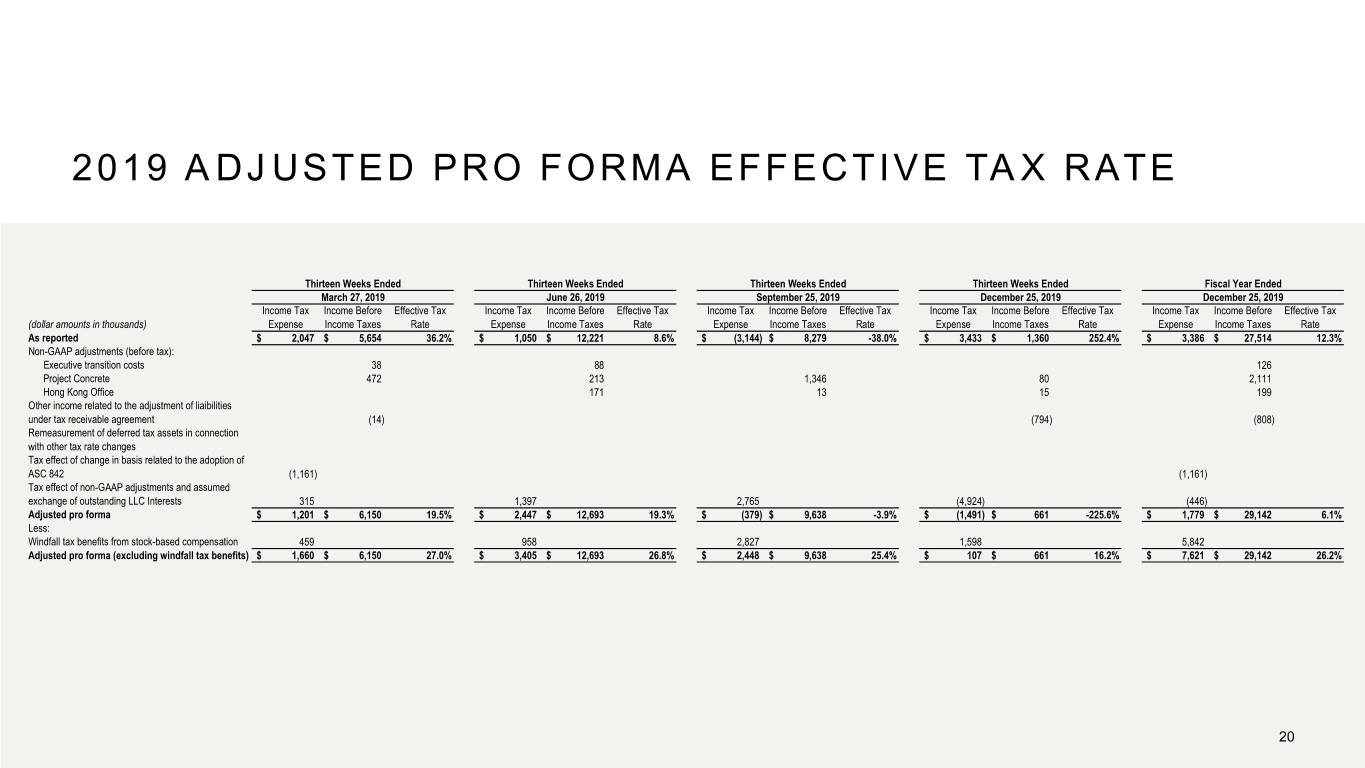
2019 ADJUSTED PRO FORMA EFFECTIVE TAX RATE Thirteen Weeks Ended Thirteen Weeks Ended Thirteen Weeks Ended Thirteen Weeks Ended Fiscal Year Ended March 27, 2019 June 26, 2019 September 25, 2019 December 25, 2019 December 25, 2019 Income Tax Income Before Effective Tax Income Tax Income Before Effective Tax Income Tax Income Before Effective Tax Income Tax Income Before Effective Tax Income Tax Income Before Effective Tax (dollar amounts in thousands) Expense Income Taxes Rate Expense Income Taxes Rate Expense Income Taxes Rate Expense Income Taxes Rate Expense Income Taxes Rate As reported $ 2,047 $ 5,654 36.2% $ 1,050 $ 12,221 8.6% $ (3,144) $ 8,279 -38.0% $ 3,433 $ 1,360 252.4% $ 3,386 $ 27,514 12.3% Non-GAAP adjustments (before tax): Executive transition costs 38 88 126 Project Concrete 472 213 1,346 80 2,111 Hong Kong Office 171 13 15 199 Other income related to the adjustment of liaibilities under tax receivable agreement (14) (794) (808) Remeasurement of deferred tax assets in connection with other tax rate changes Tax effect of change in basis related to the adoption of ASC 842 (1,161) (1,161) Tax effect of non-GAAP adjustments and assumed exchange of outstanding LLC Interests 315 1,397 2,765 (4,924) (446) Adjusted pro forma $ 1,201 $ 6,150 19.5% $ 2,447 $ 12,693 19.3% $ (379) $ 9,638 -3.9% $ (1,491) $ 661 -225.6% $ 1,779 $ 29,142 6.1% Less: Windfall tax benefits from stock-based compensation 459 958 2,827 1,598 5,842 Adjusted pro forma (excluding windfall tax benefits) $ 1,660 $ 6,150 27.0% $ 3,405 $ 12,693 26.8% $ 2,448 $ 9,638 25.4% $ 107 $ 661 16.2% $ 7,621 $ 29,142 26.2% 20

CONTACT INFORMATION INVESTOR CONTACT Melissa Calandruccio, ICR Michelle Michalski, ICR (844) Shack-04 (844-742-2504) investor@shakeshack.com MEDIA CONTACT Kristyn Clark, Shake Shack 646-747-8776 kclark@shakeshack.com 21
