Attached files
| file | filename |
|---|---|
| 8-K - 8-K - First Foundation Inc. | ffwm-8k_20200504.htm |
May 2020 INVESTOR PRESENTATION Exhibit 99.1
This presentation and the accompanying oral commentary contain forward-looking statements within the meaning of the federal securities laws. Forward-looking statements express our current assumptions, beliefs, plans and expectations about our future financial performance and achievements and are necessarily based on current information available to us. Forward-looking statements include all statements that are not statements of historical facts and can be identified by words such as “anticipates,” “believes,” “seeks,” “estimates,” “expects,” “intends,” “may,” “plans,” “potential,” “predicts, “projects,” “should,” “could,” “will,” “would” or similar expressions and the negatives of those expressions. In particular, forward-looking statements contained in this presentation and the accompanying oral commentary relate to, among other things, our future or assumed financial condition, results of operations, strategic plans and objectives, competitive position and potential growth opportunities. The realization of our future financial performance and the achievement of our plans and objectives, including the achievement of our strategic plans and the realization of our potential growth opportunities, as set forth in the forward-looking statements contained in this presentation and the accompanying oral commentary, are subject to substantial known and unknown risks and uncertainties and other factors that may cause our actual results, performance or achievements to be materially different from those expressed or implied by the forward-looking statements contained in this presentation or expressed in the accompanying oral commentary. For a discussion of some of these risks, please see the section entitled "Risk Factors" in our 2019 Annual Report on Form 10-K filed with the SEC on March 2, 2020, and in the other documents we file with the SEC from time to time. Except as required by law, we assume no obligation to update any forward-looking statements publicly, or to update the reasons our actual results could differ materially from those anticipated in these forward-looking statements, even if new information becomes available to us in the future. Safe Harbor Statement
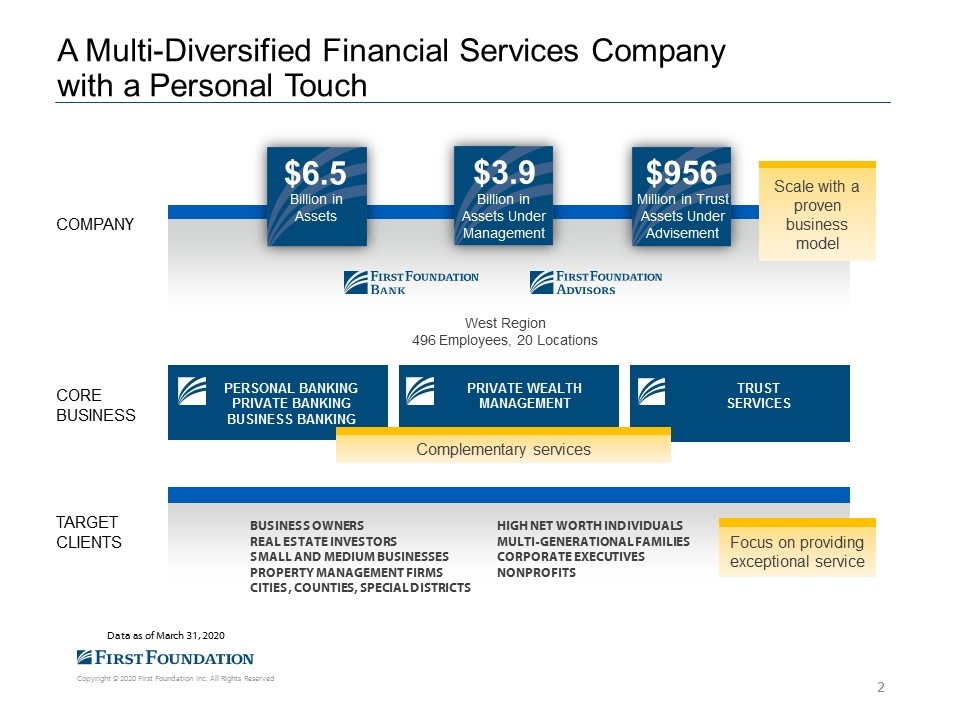
A Multi-Diversified Financial Services Company with a Personal Touch $3.9 Billion in Assets Under Management $6.5 Billion in Assets COMPANY TRUST SERVICES PERSONAL BANKING PRIVATE BANKING BUSINESS BANKING PRIVATE WEALTH MANAGEMENT Data as of March 31, 2020 West Region 496 Employees, 20 Locations CORE BUSINESS TARGET CLIENTS BUSINESS OWNERS REAL ESTATE INVESTORS SMALL AND MEDIUM BUSINESSES PROPERTY MANAGEMENT FIRMS CITIES, COUNTIES, SPECIAL DISTRICTS HIGH NET WORTH INDIVIDUALS MULTI-GENERATIONAL FAMILIES CORPORATE EXECUTIVES NONPROFITS Focus on providing exceptional service Complementary services $956 Million in Trust Assets Under Advisement Scale with a proven business model
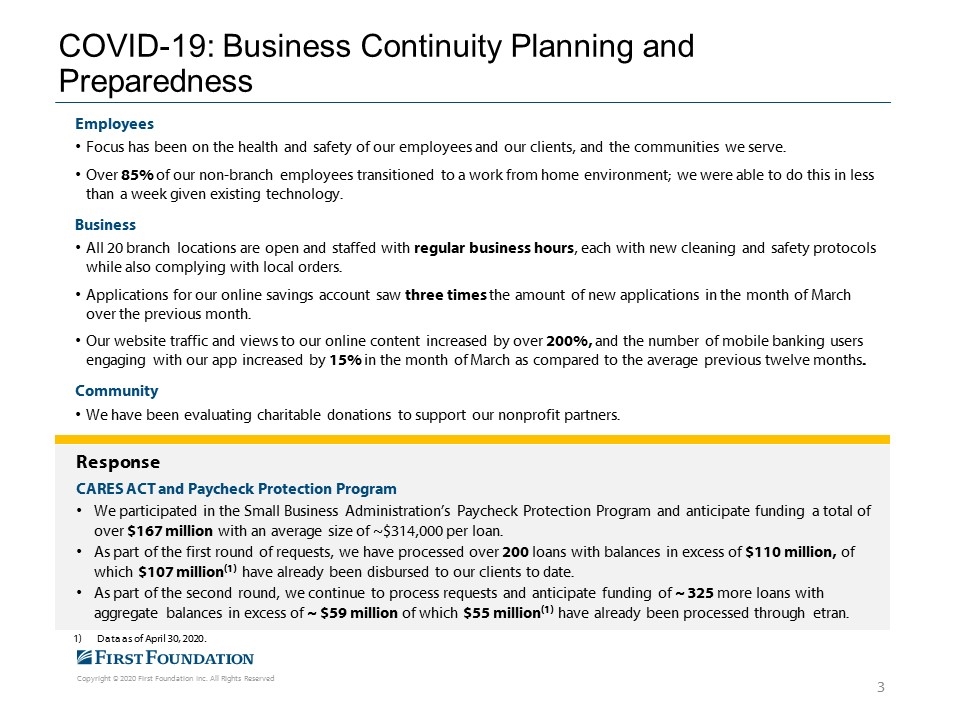
COVID-19: Business Continuity Planning and Preparedness Employees Focus has been on the health and safety of our employees and our clients, and the communities we serve. Over 85% of our non-branch employees transitioned to a work from home environment; we were able to do this in less than a week given existing technology. Business All 20 branch locations are open and staffed with regular business hours, each with new cleaning and safety protocols while also complying with local orders. Applications for our online savings account saw three times the amount of new applications in the month of March over the previous month. Our website traffic and views to our online content increased by over 200%, and the number of mobile banking users engaging with our app increased by 15% in the month of March as compared to the average previous twelve months. Community We have been evaluating charitable donations to support our nonprofit partners. Response CARES ACT and Paycheck Protection Program We participated in the Small Business Administration’s Paycheck Protection Program and anticipate funding a total of over $167 million with an average size of ~$314,000 per loan. As part of the first round of requests, we have processed over 200 loans with balances in excess of $110 million, of which $107 million(1) have already been disbursed to our clients to date. As part of the second round, we continue to process requests and anticipate funding of ~ 325 more loans with aggregate balances in excess of ~ $59 million of which $55 million(1) have already been processed through etran. Data as of April 30, 2020.
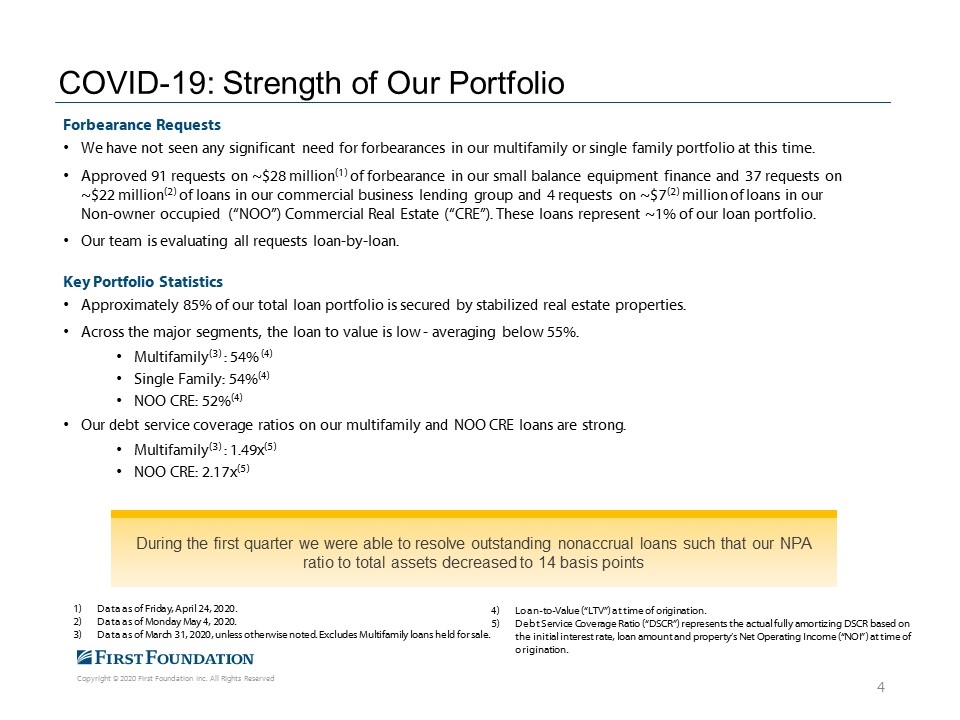
COVID-19: Strength of Our Portfolio Forbearance Requests We have not seen any significant need for forbearances in our multifamily or single family portfolio at this time. Approved 91 requests on ~$28 million(1) of forbearance in our small balance equipment finance and 37 requests on ~$22 million(2) of loans in our commercial business lending group and 4 requests on ~$7(2) million of loans in our Non-owner occupied (“NOO”) Commercial Real Estate (“CRE”). These loans represent ~1% of our loan portfolio. Our team is evaluating all requests loan-by-loan. Key Portfolio Statistics Approximately 85% of our total loan portfolio is secured by stabilized real estate properties. Across the major segments, the loan to value is low - averaging below 55%. Multifamily(3) : 54% (4) Single Family: 54%(4) NOO CRE: 52%(4) Our debt service coverage ratios on our multifamily and NOO CRE loans are strong. Multifamily(3) : 1.49x(5) NOO CRE: 2.17x(5) During the first quarter we were able to resolve outstanding nonaccrual loans such that our NPA ratio to total assets decreased to 14 basis points Data as of Friday, April 24, 2020. Data as of Monday May 4, 2020. Data as of March 31, 2020, unless otherwise noted. Excludes Multifamily loans held for sale. Loan-to-Value (“LTV”) at time of origination. Debt Service Coverage Ratio (“DSCR”) represents the actual fully amortizing DSCR based on the initial interest rate, loan amount and property’s Net Operating Income (“NOI”) at time of origination.
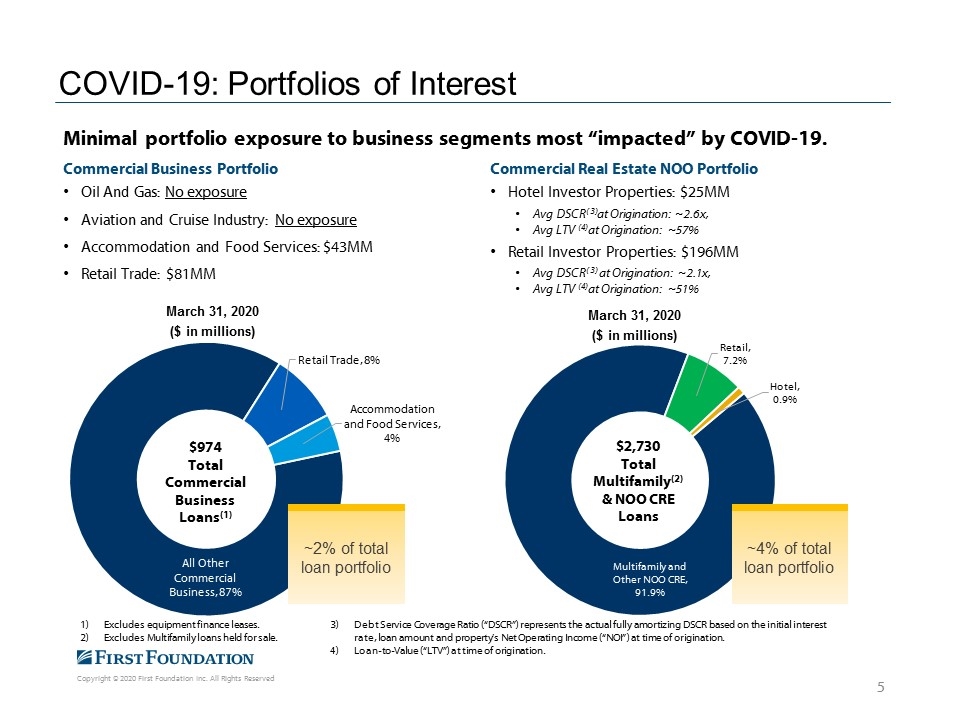
COVID-19: Portfolios of Interest Minimal portfolio exposure to business segments most “impacted” by COVID-19. Commercial Business Portfolio Oil And Gas: No exposure Aviation and Cruise Industry: No exposure Accommodation and Food Services: $43MM Retail Trade: $81MM Commercial Real Estate NOO Portfolio Hotel Investor Properties: $25MM Avg DSCR(3)at Origination: ~2.6x, Avg LTV (4)at Origination: ~57% Retail Investor Properties: $196MM Avg DSCR(3) at Origination: ~2.1x, Avg LTV (4)at Origination: ~51% Excludes equipment finance leases. Excludes Multifamily loans held for sale. Debt Service Coverage Ratio (“DSCR”) represents the actual fully amortizing DSCR based on the initial interest rate, loan amount and property’s Net Operating Income (“NOI”) at time of origination. Loan-to-Value (“LTV”) at time of origination. ~4% of total loan portfolio ~2% of total loan portfolio Multifamily and Other NOO CRE, 91.9% Retail, 7.2% Hotel, 0.9% March 31, 2020 ($ in millions) $2,730 Total Multifamily(2) & NOO CRE Loans All Other Commercial Business, 87% Retail Trade, 8% Accommodation and Food Services, 4% March 31, 2020 ($ in millions) $974 Total Commercial Business Loans(1) 1)
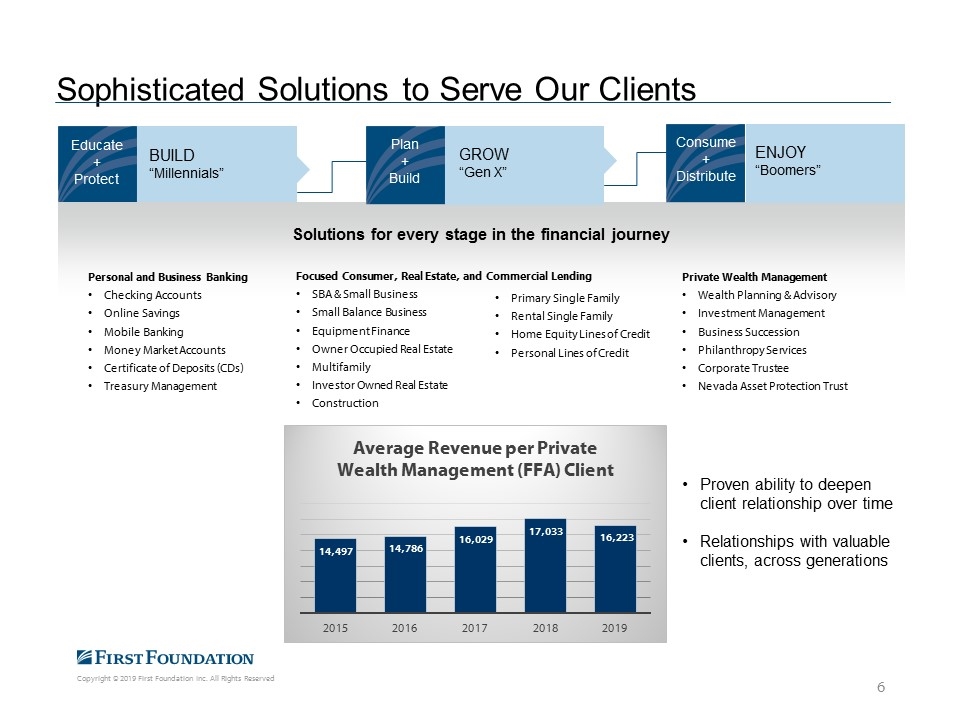
Sophisticated Solutions to Serve Our Clients Educate + Protect BUILD “Millennials” Plan + Build GROW “Gen X” Consume + Distribute ENJOY “Boomers” Solutions for every stage in the financial journey Focused Consumer, Real Estate, and Commercial Lending SBA & Small Business Small Balance Business Equipment Finance Owner Occupied Real Estate Multifamily Investor Owned Real Estate Construction Private Wealth Management Wealth Planning & Advisory Investment Management Business Succession Philanthropy Services Corporate Trustee Nevada Asset Protection Trust Personal and Business Banking Checking Accounts Online Savings Mobile Banking Money Market Accounts Certificate of Deposits (CDs) Treasury Management Primary Single Family Rental Single Family Home Equity Lines of Credit Personal Lines of Credit Proven ability to deepen client relationship over time Relationships with valuable clients, across generations 6 14,497 14,786 16,029 17,033 16,223 2015 2016 2017 2018 2019 Average Revenue per Private Wealth Management (FFA) Client
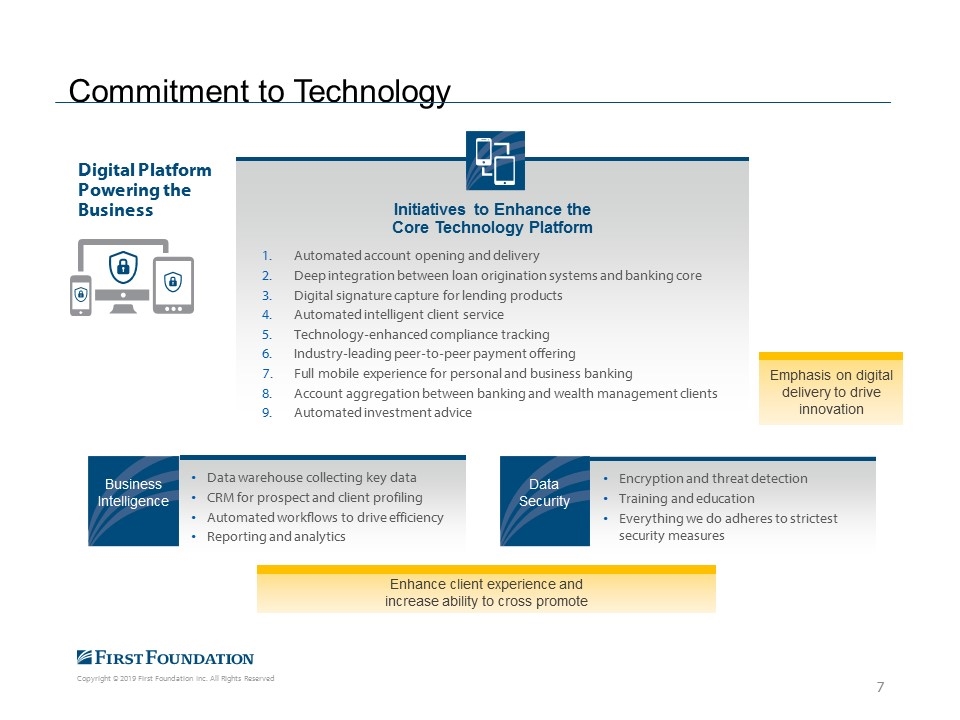
Commitment to Technology Digital Platform Powering the Business Encryption and threat detection Training and education Everything we do adheres to strictest security measures Data Security Initiatives to Enhance the Core Technology Platform Automated account opening and delivery Deep integration between loan origination systems and banking core Digital signature capture for lending products Automated intelligent client service Technology-enhanced compliance tracking Industry-leading peer-to-peer payment offering Full mobile experience for personal and business banking Account aggregation between banking and wealth management clients Automated investment advice Business Intelligence Data warehouse collecting key data CRM for prospect and client profiling Automated workflows to drive efficiency Reporting and analytics Enhance client experience and increase ability to cross promote Emphasis on digital delivery to drive innovation
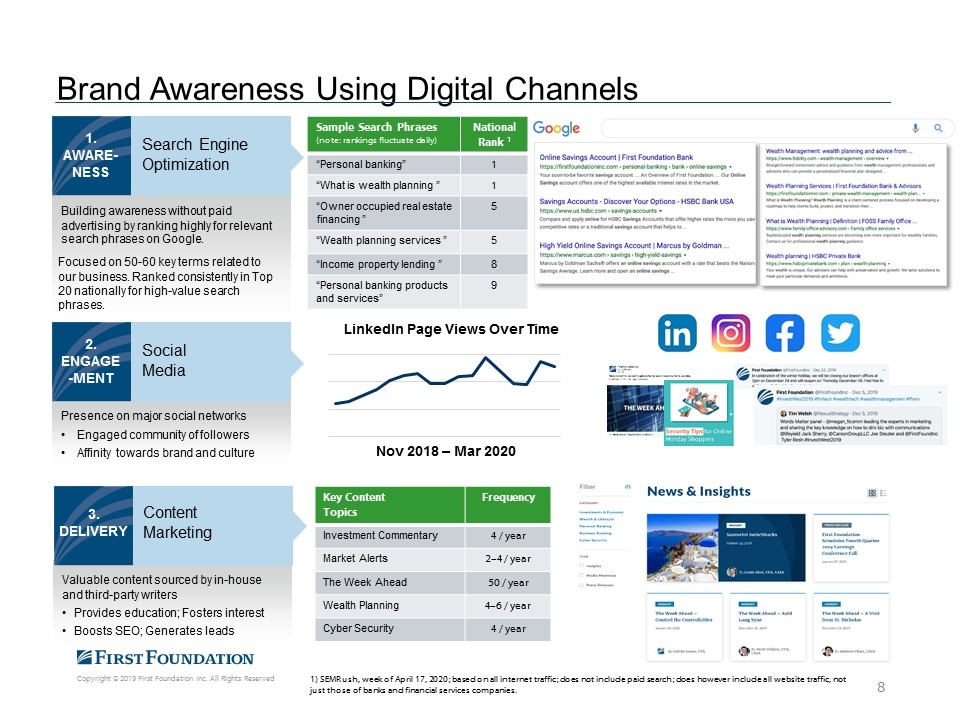
Brand Awareness Using Digital Channels 1) SEMRush, week of April 17, 2020; based on all internet traffic; does not include paid search; does however include all website traffic, not just those of banks and financial services companies. Focused on 50-60 key terms related to our business. Ranked consistently in Top 20 nationally for high-value search phrases. 1. AWARE-NESS Search Engine Optimization Building awareness without paid advertising by ranking highly for relevant search phrases on Google. Sample Search Phrases (note: rankings fluctuate daily) National Rank 1 “Personal banking” 1 “What is wealth planning ” 1 “Owner occupied real estate financing ” 5 “Wealth planning services ” 5 “Income property lending ” 8 “Personal banking products and services” 9 2. ENGAGE-MENT Social Media Presence on major social networks Engaged community of followers Affinity towards brand and culture LinkedIn Page Views Over Time 3. DELIVERY Content Marketing Valuable content sourced by in-house and third-party writers Provides education; Fosters interest Boosts SEO; Generates leads Key Content Topics Frequency Investment Commentary 4 / year Market Alerts 2–4 / year The Week Ahead 50 / year Wealth Planning 4–6 / year Cyber Security 4 / year Nov 2018 – Mar 2020
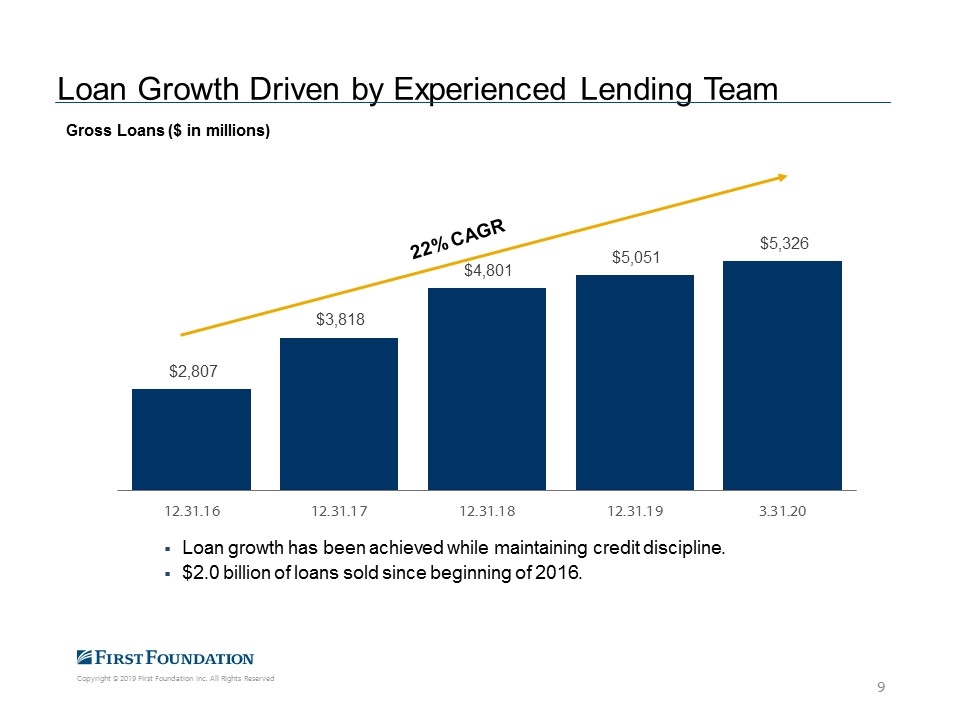
Loan growth has been achieved while maintaining credit discipline. $2.0 billion of loans sold since beginning of 2016. Loan Growth Driven by Experienced Lending Team Gross Loans ($ in millions) 22% CAGR $2,807 $3,818 $4,801 $5,051 $5,326 12.31.16 12.31.17 12.31.18 12.31.19 3.31.20
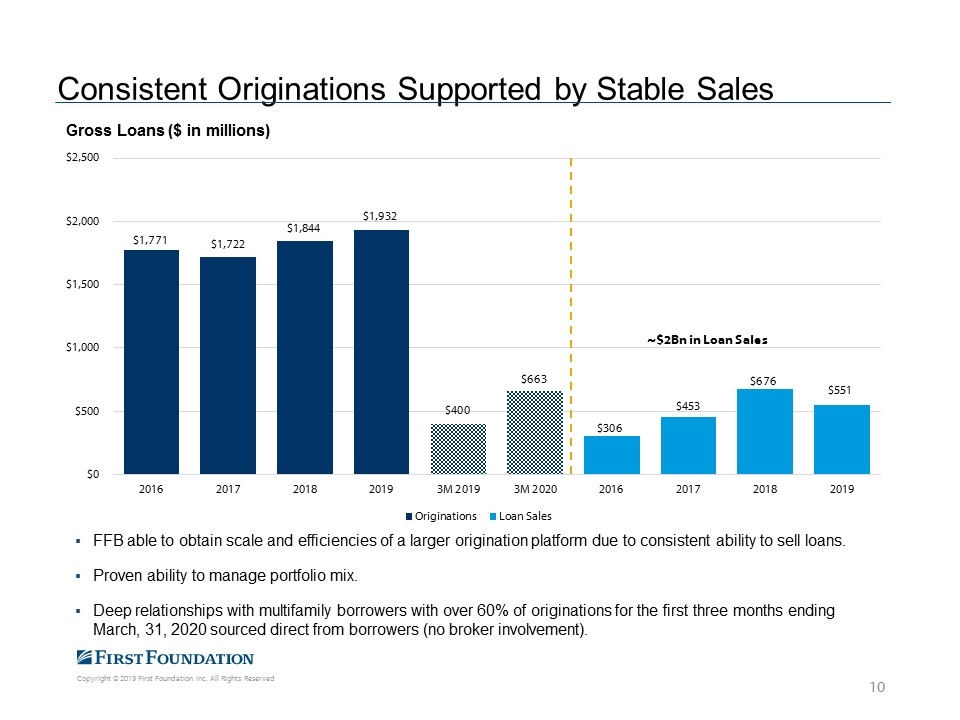
FFB able to obtain scale and efficiencies of a larger origination platform due to consistent ability to sell loans. Proven ability to manage portfolio mix. Deep relationships with multifamily borrowers with over 60% of originations for the first three months ending March, 31, 2020 sourced direct from borrowers (no broker involvement). Consistent Originations Supported by Stable Sales Gross Loans ($ in millions) ~$2Bn in Loan Sales $1,771 $1,722 $1,844 $1,932 $400 $663 $306 $453 $676 $551 $0 $500 $1,000 $1,500 $2,000 $2,500 2016 2017 2018 2019 3M 2019 3M 2020 2016 2017 2018 2019 Originations Loan Sales
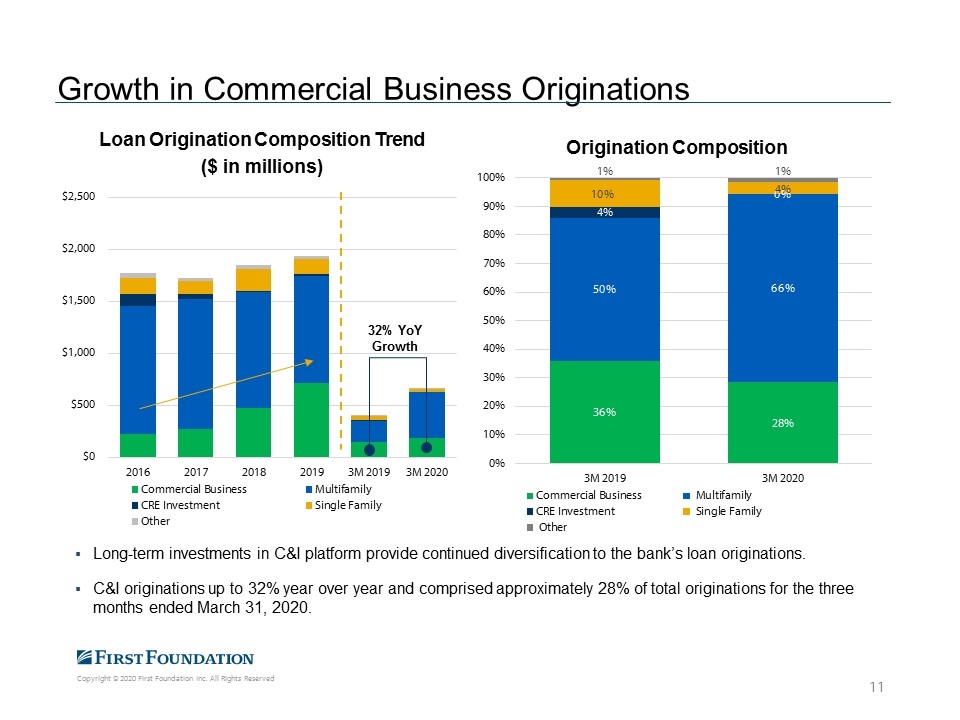
Long-term investments in C&I platform provide continued diversification to the bank’s loan originations. C&I originations up to 32% year over year and comprised approximately 28% of total originations for the three months ended March 31, 2020. Growth in Commercial Business Originations $0 $500 $1,000 $1,500 $2,000 $2,500 2016 2017 2018 2019 3M 2019 3M 2020 Loan Origination Composition Trend ($ in millions) Commercial Business Multifamily CRE Investment Single Family Other 32% YoY Growth 36% 28% 50% 66% 4% 10% 04%% 1% 1% 0% 10% 20% 30% 40% 50% 60% 70% 80% 90% 100% 3M 2019 3M 2020 Origination Composition Commercial Business Multifamily CRE Investment Single Family Other
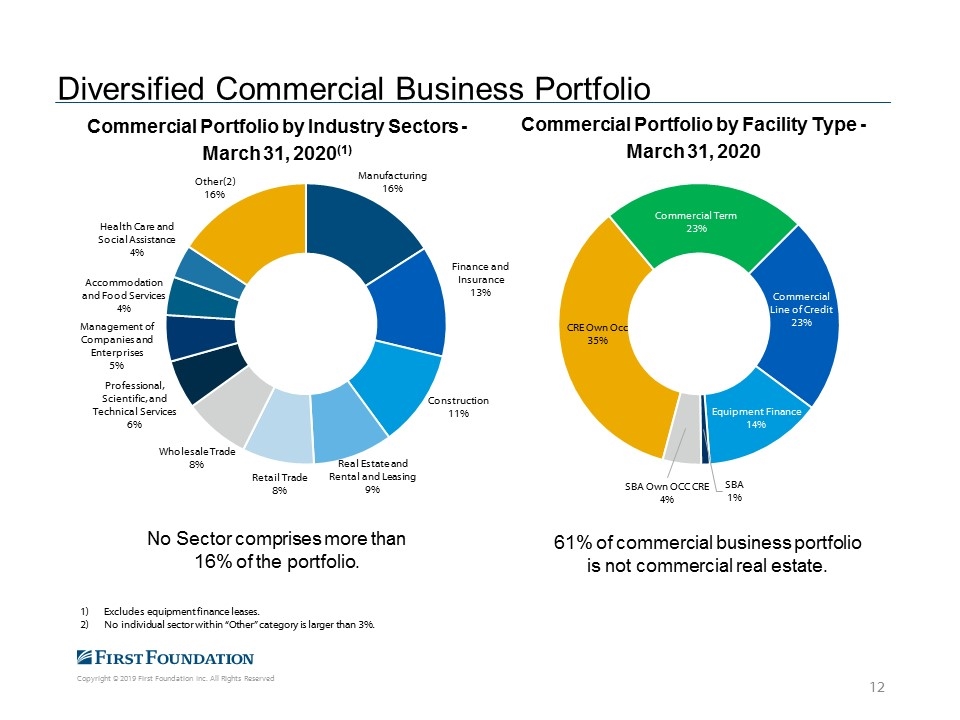
Diversified Commercial Business Portfolio No Sector comprises more than 16% of the portfolio. Excludes equipment finance leases. No individual sector within “Other” category is larger than 3%. 61% of commercial business portfolio is not commercial real estate.
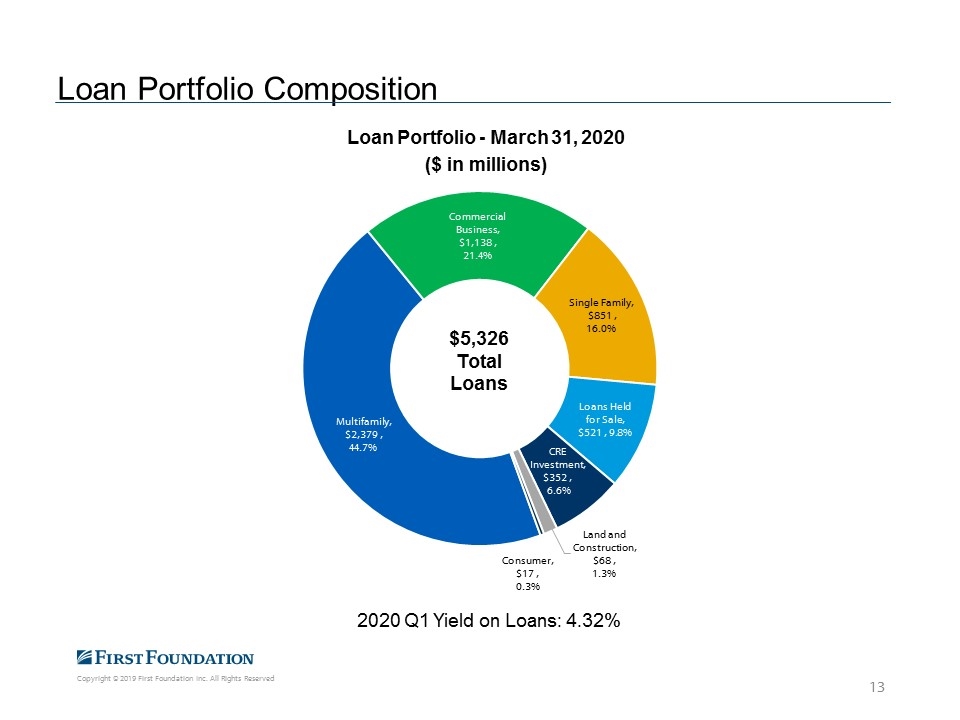
Loan Portfolio Composition $5,326 Total Loans 2020 Q1 Yield on Loans: 4.32%
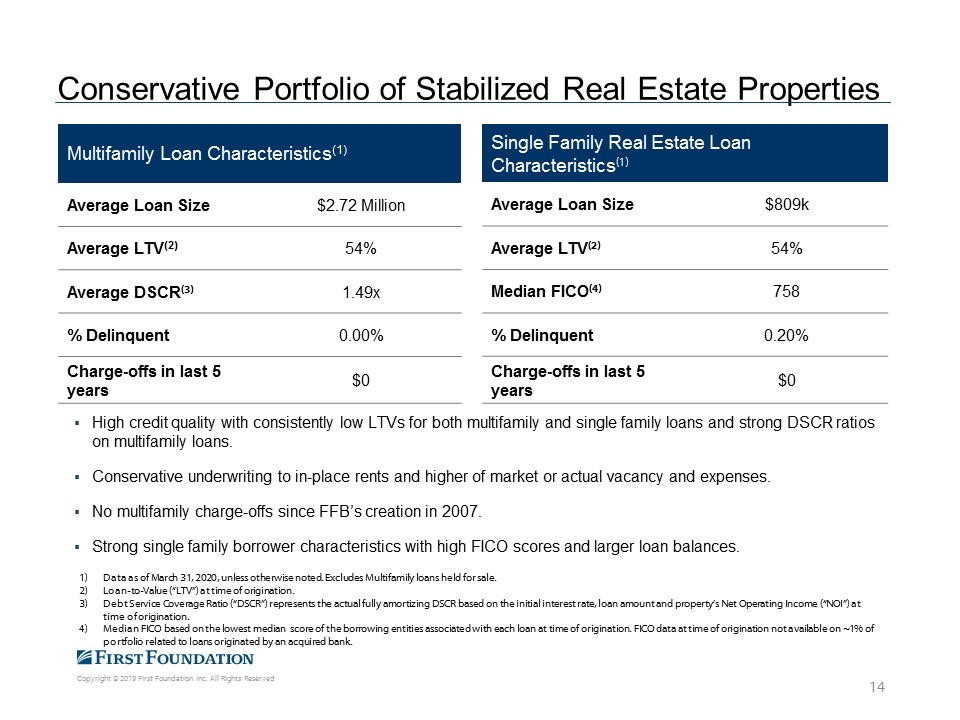
Conservative Portfolio of Stabilized Real Estate Properties Multifamily Loan Characteristics(1) Average Loan Size $2.72 Million Average LTV(2) 54% Average DSCR(3) 1.49x % Delinquent 0.00% Charge-offs in last 5 years $0 Single Family Real Estate Loan Characteristics(1) Average Loan Size $809k Average LTV(2) 54% Median FICO(4) 758 % Delinquent 0.20% Charge-offs in last 5 years $0 Data as of March 31, 2020, unless otherwise noted. Excludes Multifamily loans held for sale. Loan-to-Value (“LTV”) at time of origination. Debt Service Coverage Ratio (“DSCR”) represents the actual fully amortizing DSCR based on the initial interest rate, loan amount and property’s Net Operating Income (“NOI”) at time of origination. Median FICO based on the lowest median score of the borrowing entities associated with each loan at time of origination. FICO data at time of origination not available on ~1% of portfolio related to loans originated by an acquired bank. High credit quality with consistently low LTVs for both multifamily and single family loans and strong DSCR ratios on multifamily loans. Conservative underwriting to in-place rents and higher of market or actual vacancy and expenses. No multifamily charge-offs since FFB’s creation in 2007. Strong single family borrower characteristics with high FICO scores and larger loan balances.
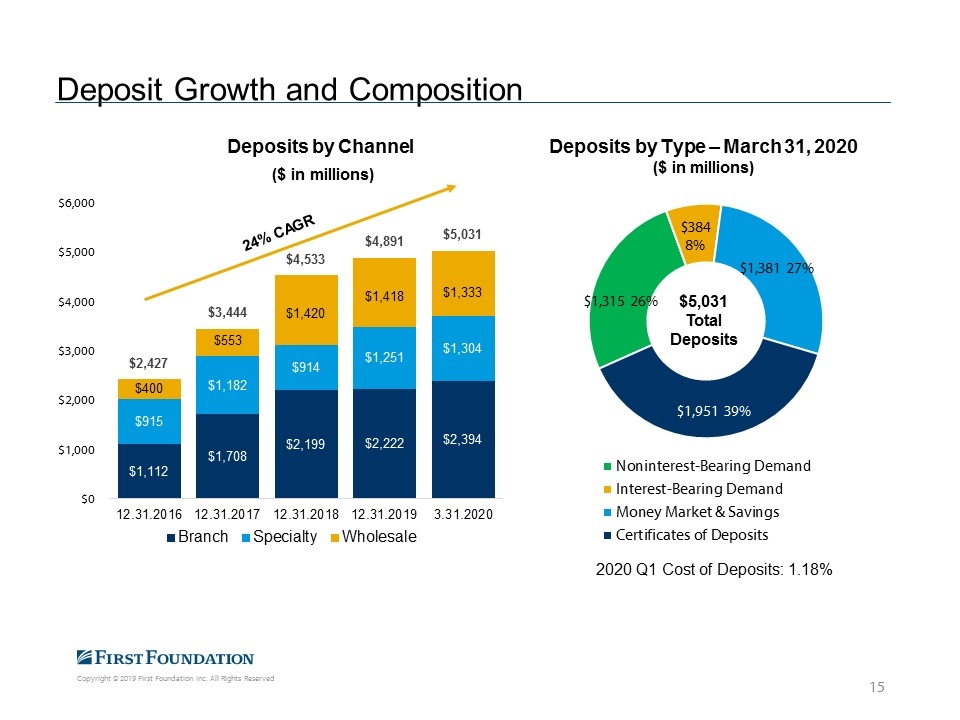
Deposit Growth and Composition 2020 Q1 Cost of Deposits: 1.18% $5,031 Total Deposits
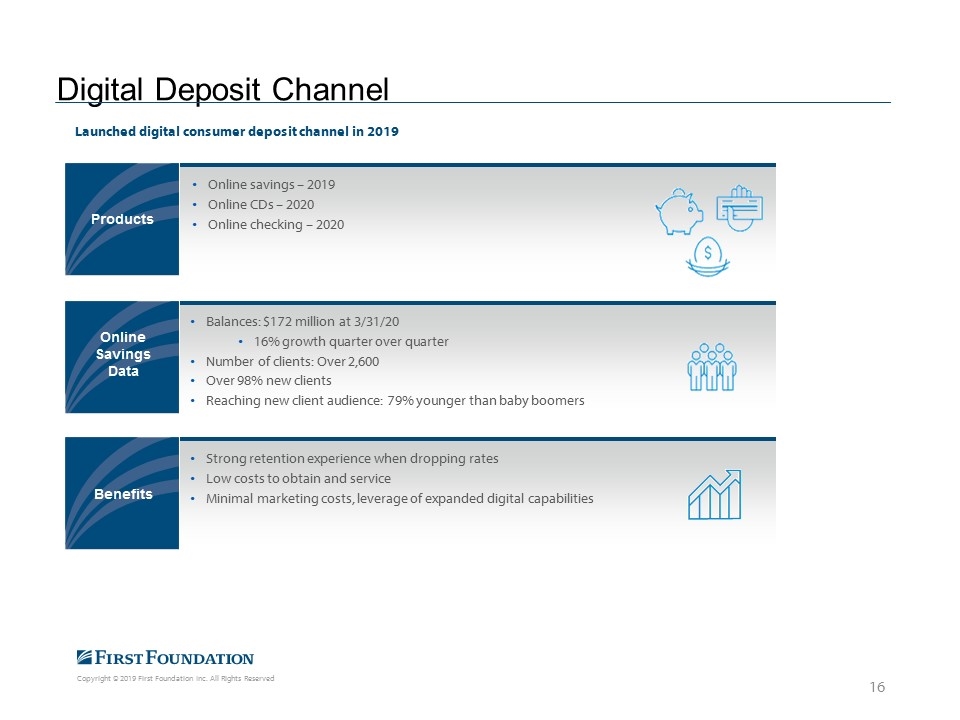
Launched digital consumer deposit channel in 2019 Online savings – 2019 Online CDs – 2020 Online checking – 2020 Balances: $172 million at 3/31/20 16% growth quarter over quarter Number of clients: Over 2,600 Over 98% new clients Reaching new client audience: 79% younger than baby boomers Strong retention experience when dropping rates Low costs to obtain and service Minimal marketing costs, leverage of expanded digital capabilities Online Savings Data Products Benefits Digital Deposit Channel
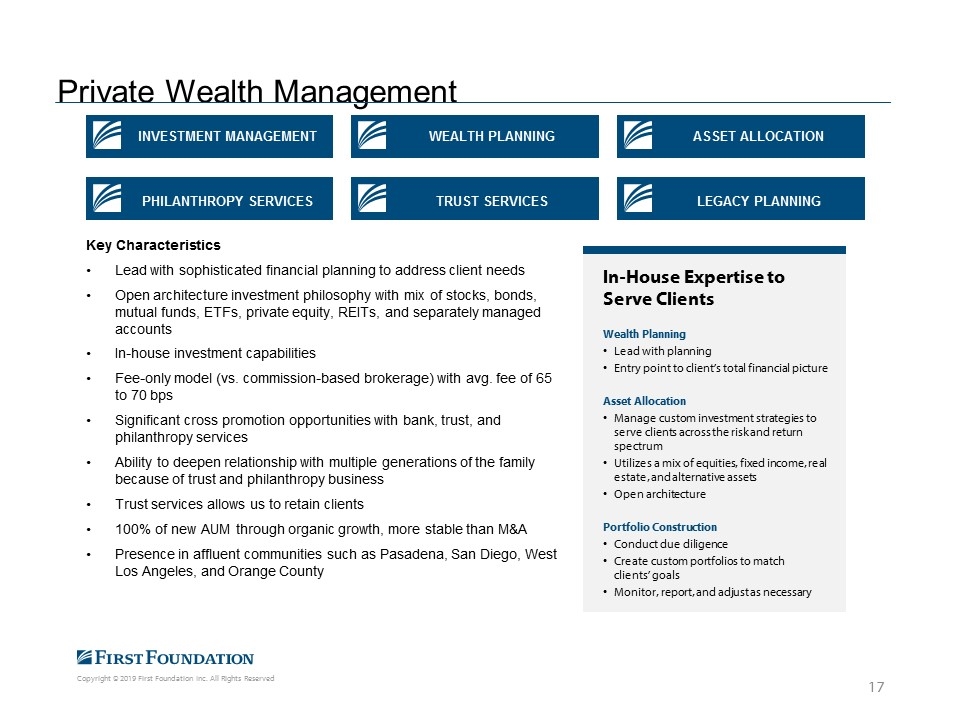
In-House Expertise to Serve Clients Wealth Planning Lead with planning Entry point to client’s total financial picture Asset Allocation Manage custom investment strategies to serve clients across the risk and return spectrum Utilizes a mix of equities, fixed income, real estate, and alternative assets Open architecture Portfolio Construction Conduct due diligence Create custom portfolios to match clients’ goals Monitor, report, and adjust as necessary INVESTMENT MANAGEMENT PHILANTHROPY SERVICES WEALTH PLANNING TRUST SERVICES ASSET ALLOCATION LEGACY PLANNING Key Characteristics Lead with sophisticated financial planning to address client needs Open architecture investment philosophy with mix of stocks, bonds, mutual funds, ETFs, private equity, REITs, and separately managed accounts In-house investment capabilities Fee-only model (vs. commission-based brokerage) with avg. fee of 65 to 70 bps Significant cross promotion opportunities with bank, trust, and philanthropy services Ability to deepen relationship with multiple generations of the family because of trust and philanthropy business Trust services allows us to retain clients 100% of new AUM through organic growth, more stable than M&A Presence in affluent communities such as Pasadena, San Diego, West Los Angeles, and Orange County Private Wealth Management
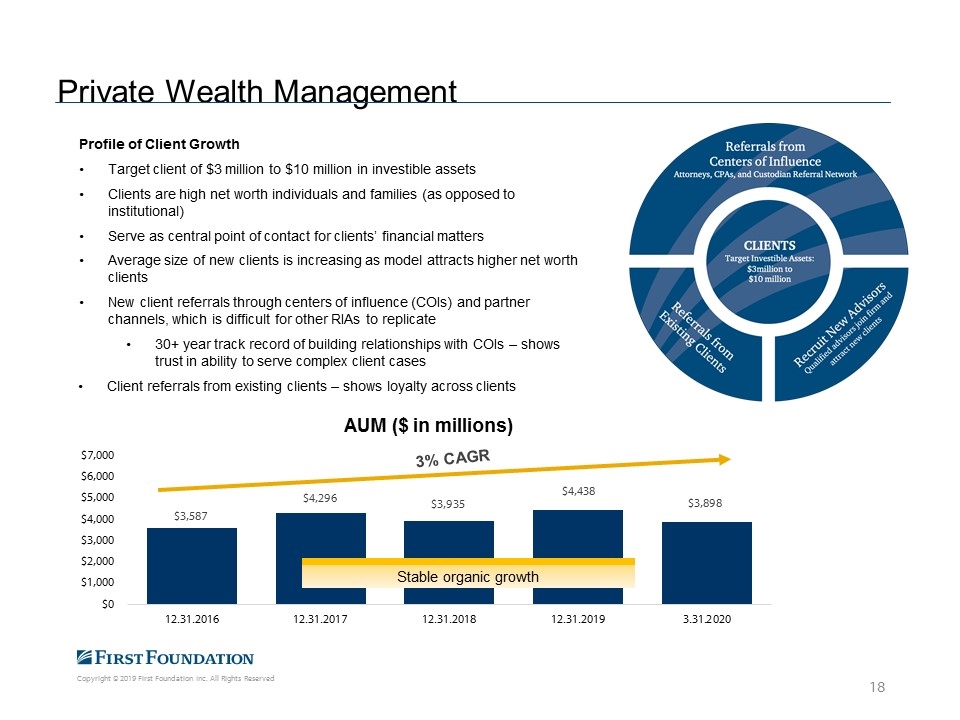
Private Wealth Management Profile of Client Growth Target client of $3 million to $10 million in investible assets Clients are high net worth individuals and families (as opposed to institutional) Serve as central point of contact for clients’ financial matters Average size of new clients is increasing as model attracts higher net worth clients New client referrals through centers of influence (COIs) and partner channels, which is difficult for other RIAs to replicate 30+ year track record of building relationships with COIs – shows trust in ability to serve complex client cases Client referrals from existing clients – shows loyalty across clients Stable organic growth
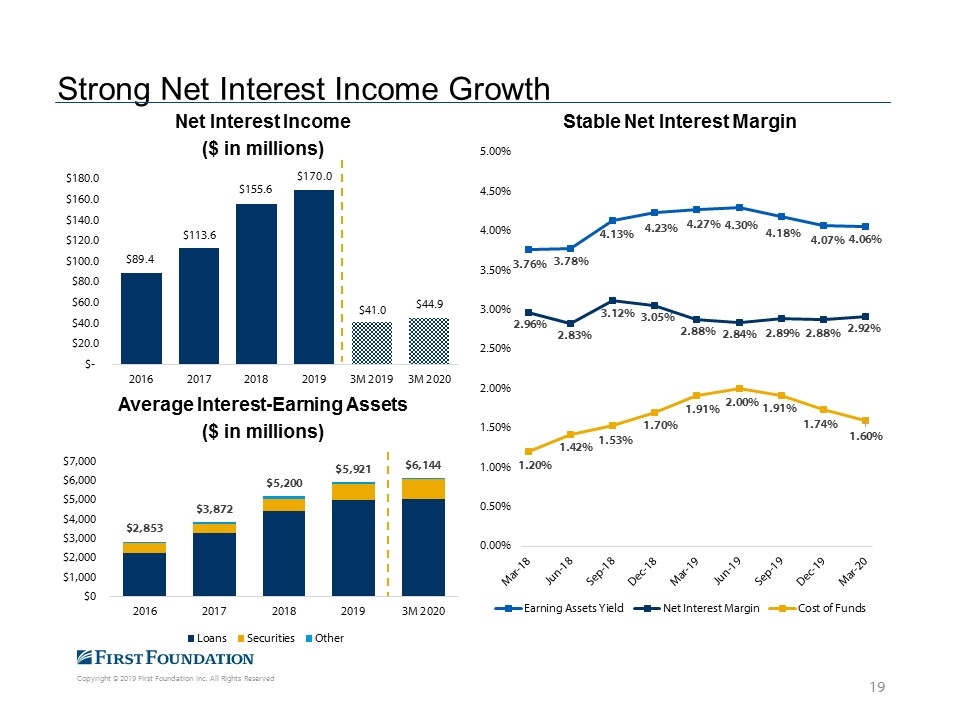
Strong Net Interest Income Growth
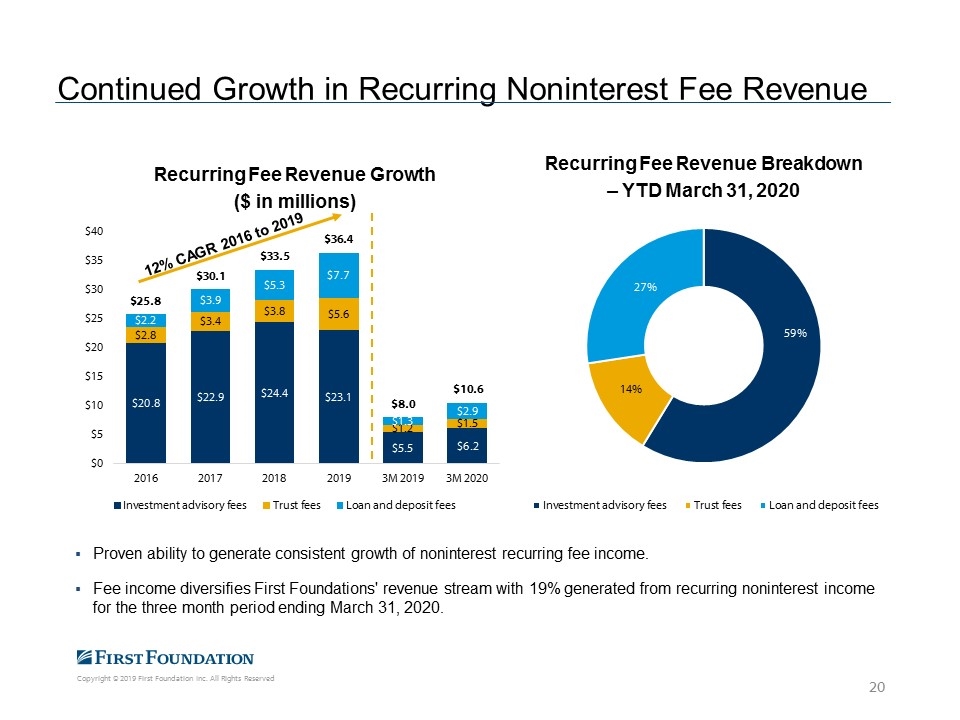
Proven ability to generate consistent growth of noninterest recurring fee income. Fee income diversifies First Foundations' revenue stream with 19% generated from recurring noninterest income for the three month period ending March 31, 2020. Continued Growth in Recurring Noninterest Fee Revenue
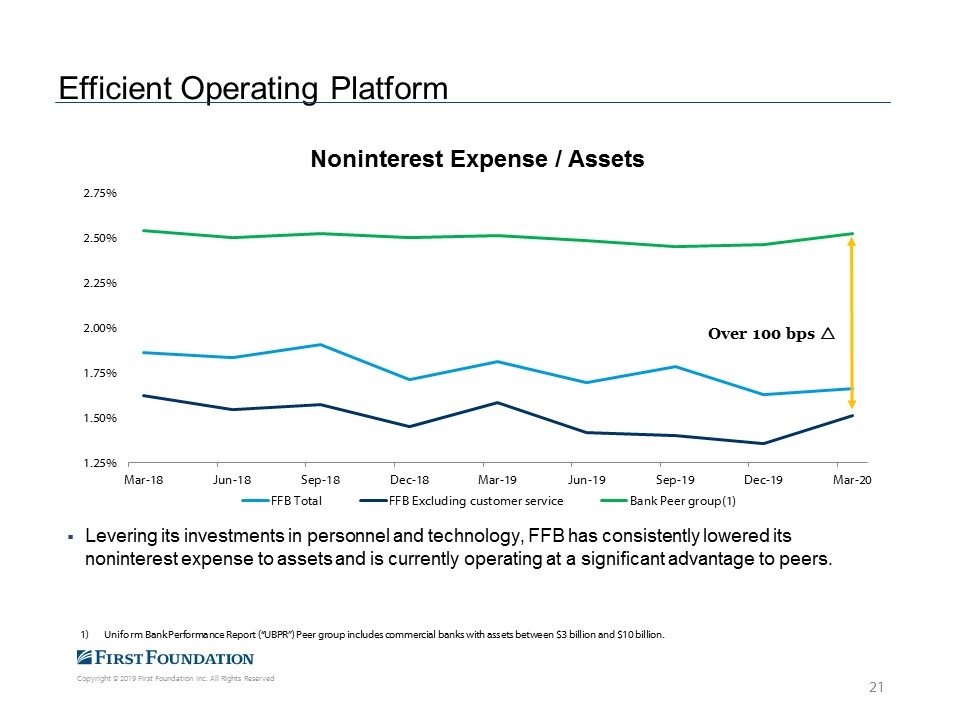
Efficient Operating Platform Levering its investments in personnel and technology, FFB has consistently lowered its noninterest expense to assets and is currently operating at a significant advantage to peers. Over 100 bps r Uniform Bank Performance Report (“UBPR”) Peer group includes commercial banks with assets between $3 billion and $10 billion.
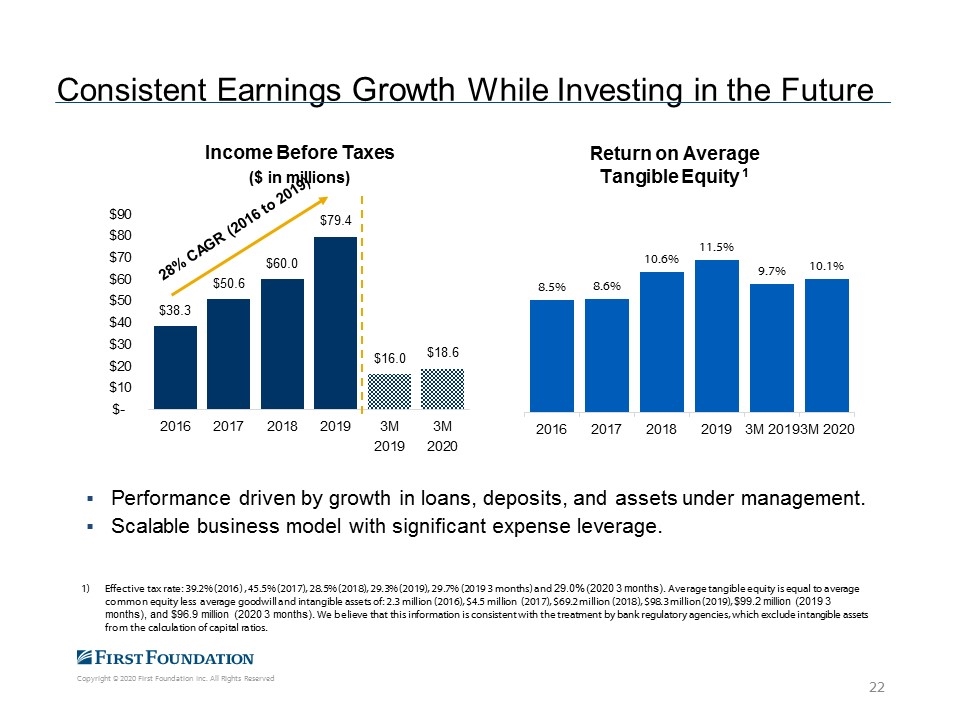
Consistent Earnings Growth While Investing in the Future Performance driven by growth in loans, deposits, and assets under management. Scalable business model with significant expense leverage. Effective tax rate: 39.2% (2016) , 45.5% (2017), 28.5% (2018), 29.3% (2019), 29.7% (2019 3 months) and 29.0% (2020 3 months). Average tangible equity is equal to average common equity less average goodwill and intangible assets of: 2.3 million (2016), $4.5 million (2017), $69.2 million (2018), $98.3 million (2019), $99.2 million (2019 3 months), and $96.9 million (2020 3 months). We believe that this information is consistent with the treatment by bank regulatory agencies, which exclude intangible assets from the calculation of capital ratios.
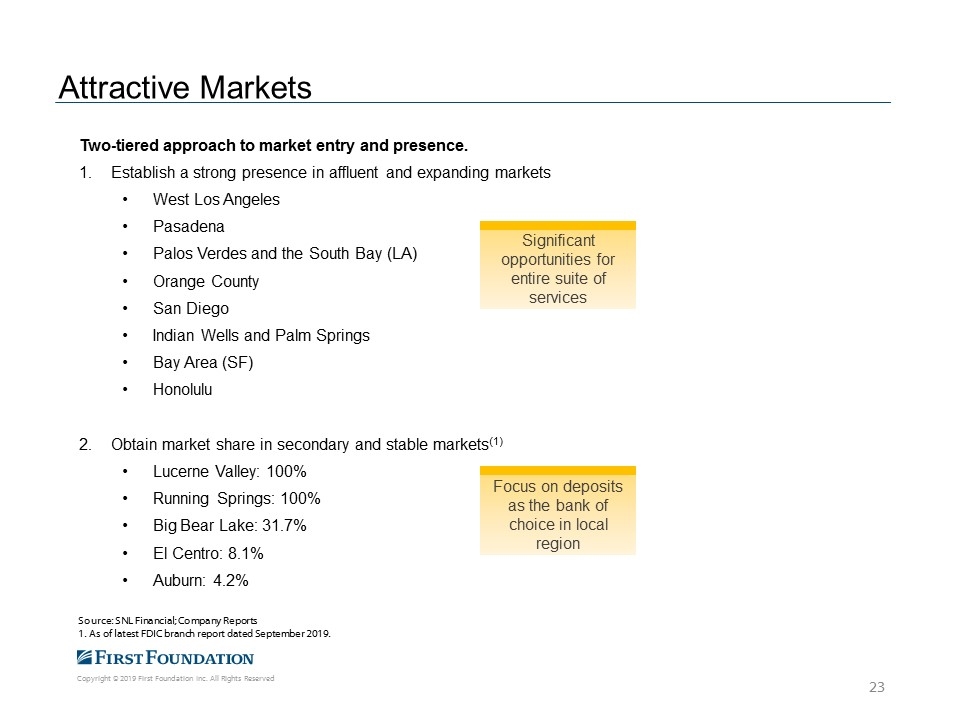
Attractive Markets Two-tiered approach to market entry and presence. Establish a strong presence in affluent and expanding markets West Los Angeles Pasadena Palos Verdes and the South Bay (LA) Orange County San Diego Indian Wells and Palm Springs Bay Area (SF) Honolulu Obtain market share in secondary and stable markets(1) Lucerne Valley: 100% Running Springs: 100% Big Bear Lake: 31.7% El Centro: 8.1% Auburn: 4.2% Source: SNL Financial; Company Reports 1. As of latest FDIC branch report dated September 2019. Significant opportunities for entire suite of services Focus on deposits as the bank of choice in local region
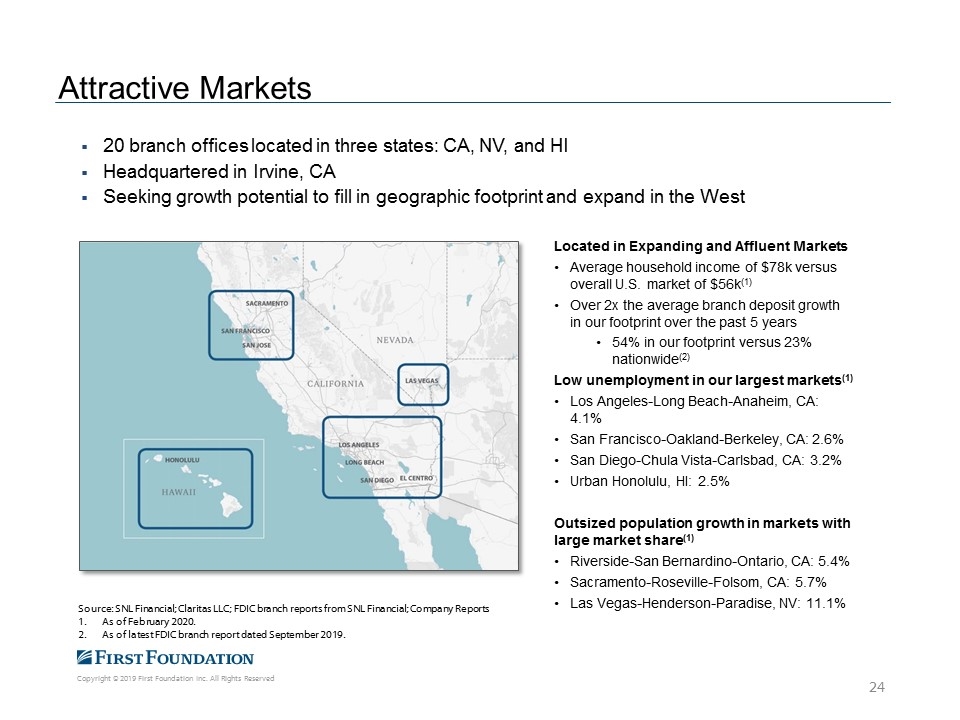
Attractive Markets 20 branch offices located in three states: CA, NV, and HI Headquartered in Irvine, CA Seeking growth potential to fill in geographic footprint and expand in the West Located in Expanding and Affluent Markets Average household income of $78k versus overall U.S. market of $56k(1) Over 2x the average branch deposit growth in our footprint over the past 5 years 54% in our footprint versus 23% nationwide(2) Low unemployment in our largest markets(1) Los Angeles-Long Beach-Anaheim, CA: 4.1% San Francisco-Oakland-Berkeley, CA: 2.6% San Diego-Chula Vista-Carlsbad, CA: 3.2% Urban Honolulu, HI: 2.5% Outsized population growth in markets with large market share(1) Riverside-San Bernardino-Ontario, CA: 5.4% Sacramento-Roseville-Folsom, CA: 5.7% Las Vegas-Henderson-Paradise, NV: 11.1% Source: SNL Financial; Claritas LLC; FDIC branch reports from SNL Financial; Company Reports As of February 2020. As of latest FDIC branch report dated September 2019.
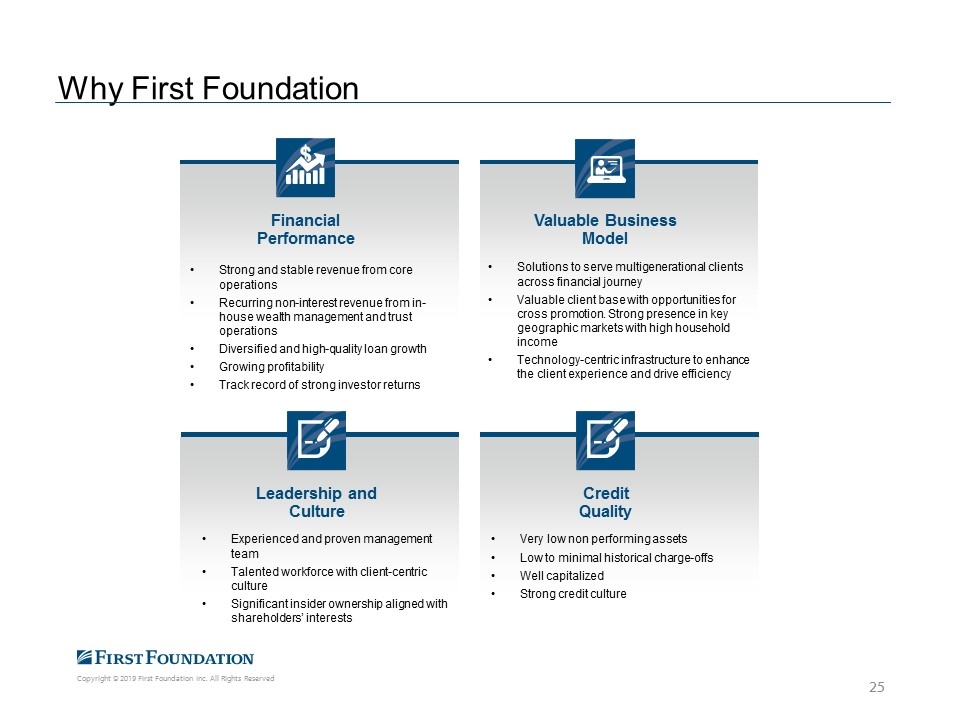
Why First Foundation Financial Performance Strong and stable revenue from core operations Recurring non-interest revenue from in-house wealth management and trust operations Diversified and high-quality loan growth Growing profitability Track record of strong investor returns Valuable Business Model Solutions to serve multigenerational clients across financial journey Valuable client base with opportunities for cross promotion. Strong presence in key geographic markets with high household income Technology-centric infrastructure to enhance the client experience and drive efficiency Leadership and Culture Experienced and proven management team Talented workforce with client-centric culture Significant insider ownership aligned with shareholders’ interests Credit Quality Very low non performing assets Low to minimal historical charge-offs Well capitalized Strong credit culture
Appendix
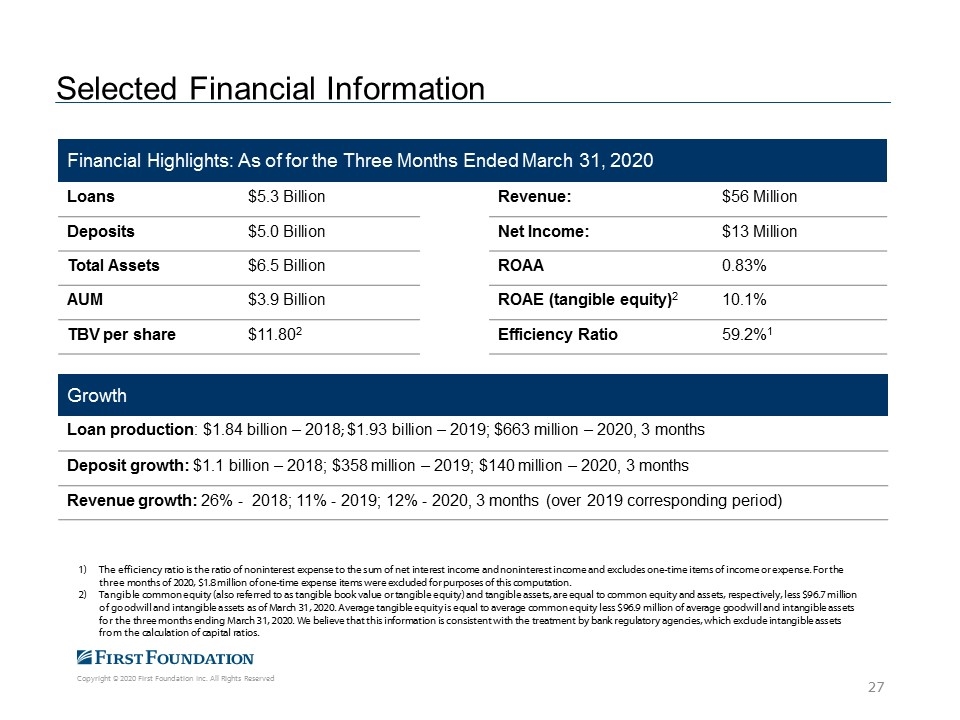
Selected Financial Information Financial Highlights: As of for the Three Months Ended March 31, 2020 Loans $5.3 Billion Revenue: $56 Million Deposits $5.0 Billion Net Income: $13 Million Total Assets $6.5 Billion ROAA 0.83% AUM $3.9 Billion ROAE (tangible equity)2 10.1% TBV per share $11.802 Efficiency Ratio 59.2%1 Growth Loan production: $1.84 billion – 2018; $1.93 billion – 2019; $663 million – 2020, 3 months Deposit growth: $1.1 billion – 2018; $358 million – 2019; $140 million – 2020, 3 months Revenue growth: 26% - 2018; 11% - 2019; 12% - 2020, 3 months (over 2019 corresponding period) The efficiency ratio is the ratio of noninterest expense to the sum of net interest income and noninterest income and excludes one-time items of income or expense. For the three months of 2020, $1.8 million of one-time expense items were excluded for purposes of this computation. Tangible common equity (also referred to as tangible book value or tangible equity) and tangible assets, are equal to common equity and assets, respectively, less $96.7 million of goodwill and intangible assets as of March 31, 2020. Average tangible equity is equal to average common equity less $96.9 million of average goodwill and intangible assets for the three months ending March 31, 2020. We believe that this information is consistent with the treatment by bank regulatory agencies, which exclude intangible assets from the calculation of capital ratios.
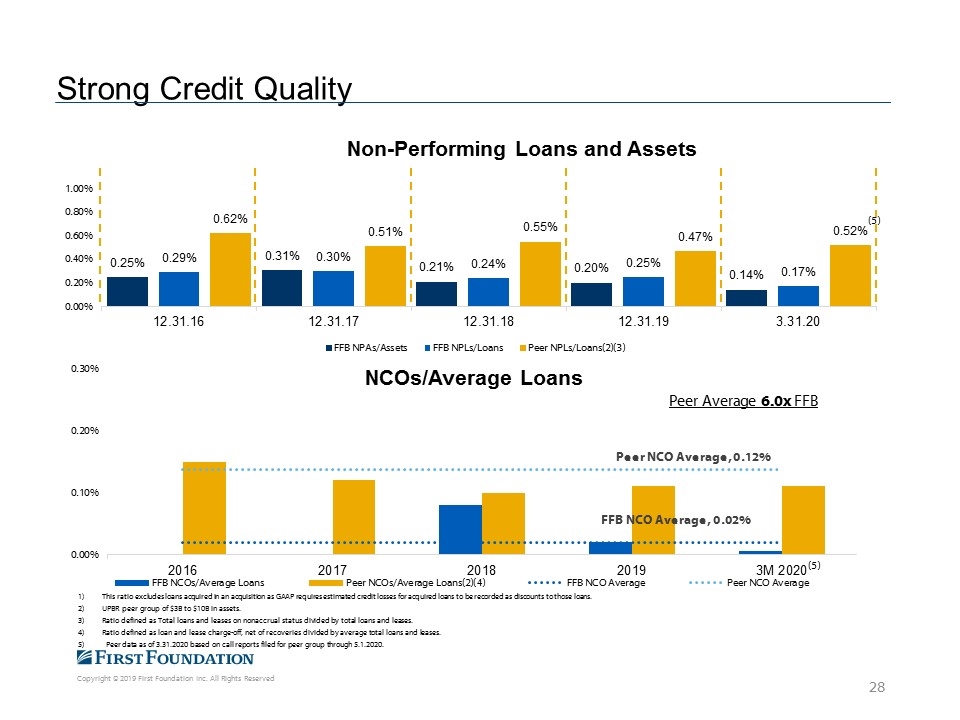
This ratio excludes loans acquired in an acquisition as GAAP requires estimated credit losses for acquired loans to be recorded as discounts to those loans. UPBR peer group of $3B to $10B in assets. Ratio defined as Total loans and leases on nonaccrual status divided by total loans and leases. Ratio defined as loan and lease charge-off, net of recoveries divided by average total loans and leases. 5) Peer data as of 3.31.2020 based on call reports filed for peer group through 5.1.2020. Strong Credit Quality (5) (5)
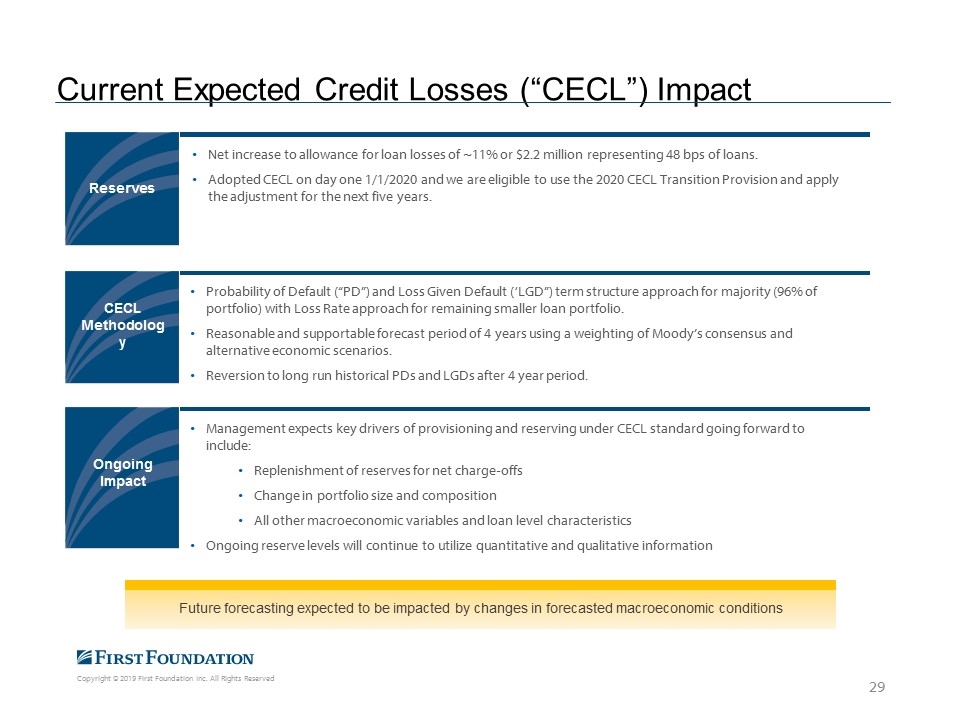
Net increase to allowance for loan losses of ~11% or $2.2 million representing 48 bps of loans. Adopted CECL on day one 1/1/2020 and we are eligible to use the 2020 CECL Transition Provision and apply the adjustment for the next five years. Probability of Default (“PD”) and Loss Given Default (‘LGD”) term structure approach for majority (96% of portfolio) with Loss Rate approach for remaining smaller loan portfolio. Reasonable and supportable forecast period of 4 years using a weighting of Moody’s consensus and alternative economic scenarios. Reversion to long run historical PDs and LGDs after 4 year period. Management expects key drivers of provisioning and reserving under CECL standard going forward to include: Replenishment of reserves for net charge-offs Change in portfolio size and composition All other macroeconomic variables and loan level characteristics Ongoing reserve levels will continue to utilize quantitative and qualitative information CECL Methodology Reserves Ongoing Impact Current Expected Credit Losses (“CECL”) Impact Future forecasting expected to be impacted by changes in forecasted macroeconomic conditions
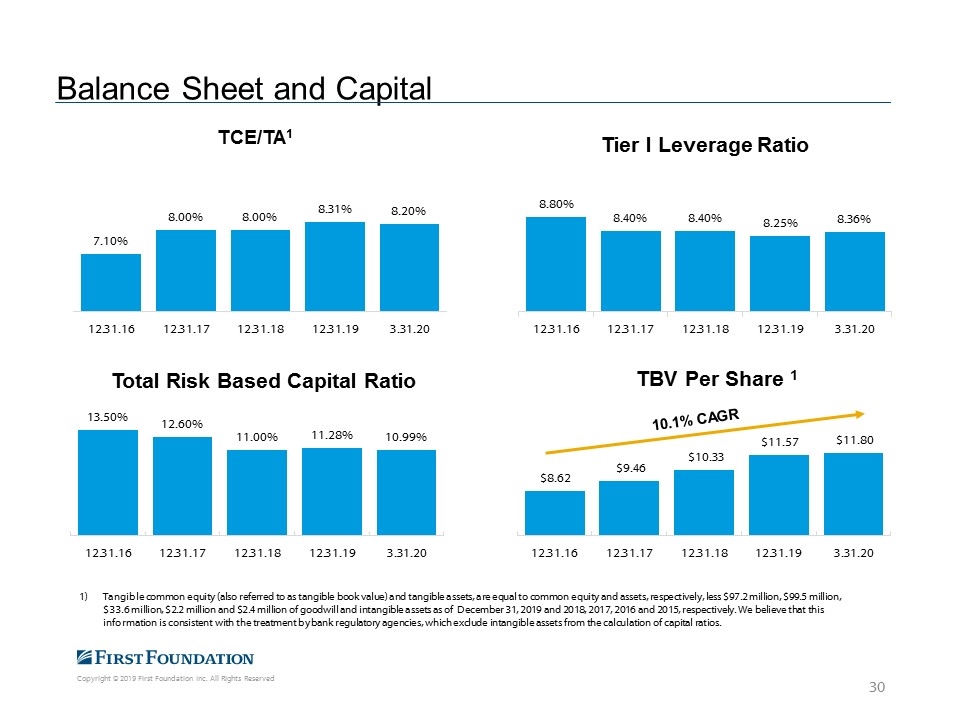
Balance Sheet and Capital Tangible common equity (also referred to as tangible book value) and tangible assets, are equal to common equity and assets, respectively, less $97.2 million, $99.5 million, $33.6 million, $2.2 million and $2.4 million of goodwill and intangible assets as of December 31, 2019 and 2018, 2017, 2016 and 2015, respectively. We believe that this information is consistent with the treatment by bank regulatory agencies, which exclude intangible assets from the calculation of capital ratios.
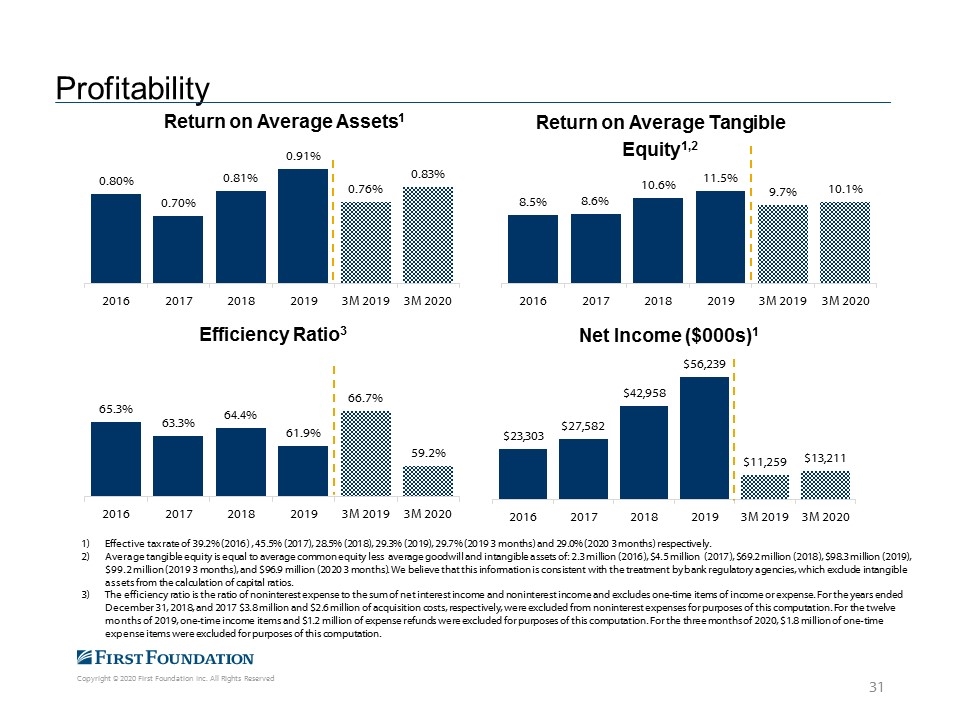
Effective tax rate of 39.2% (2016) , 45.5% (2017), 28.5% (2018), 29.3% (2019), 29.7% (2019 3 months) and 29.0% (2020 3 months) respectively. Average tangible equity is equal to average common equity less average goodwill and intangible assets of: 2.3 million (2016), $4.5 million (2017), $69.2 million (2018), $98.3 million (2019), $99.2 million (2019 3 months), and $96.9 million (2020 3 months). We believe that this information is consistent with the treatment by bank regulatory agencies, which exclude intangible assets from the calculation of capital ratios. The efficiency ratio is the ratio of noninterest expense to the sum of net interest income and noninterest income and excludes one-time items of income or expense. For the years ended December 31, 2018, and 2017 $3.8 million and $2.6 million of acquisition costs, respectively, were excluded from noninterest expenses for purposes of this computation. For the twelve months of 2019, one-time income items and $1.2 million of expense refunds were excluded for purposes of this computation. For the three months of 2020, $1.8 million of one-time expense items were excluded for purposes of this computation. Profitability
