Attached files
| file | filename |
|---|---|
| 8-K - 8-K - First Bancorp, Inc /ME/ | firstbancorp8k050420.htm |


2019 Financial Highlights 2020 Annual Meeting of Shareholders April 29, 2020
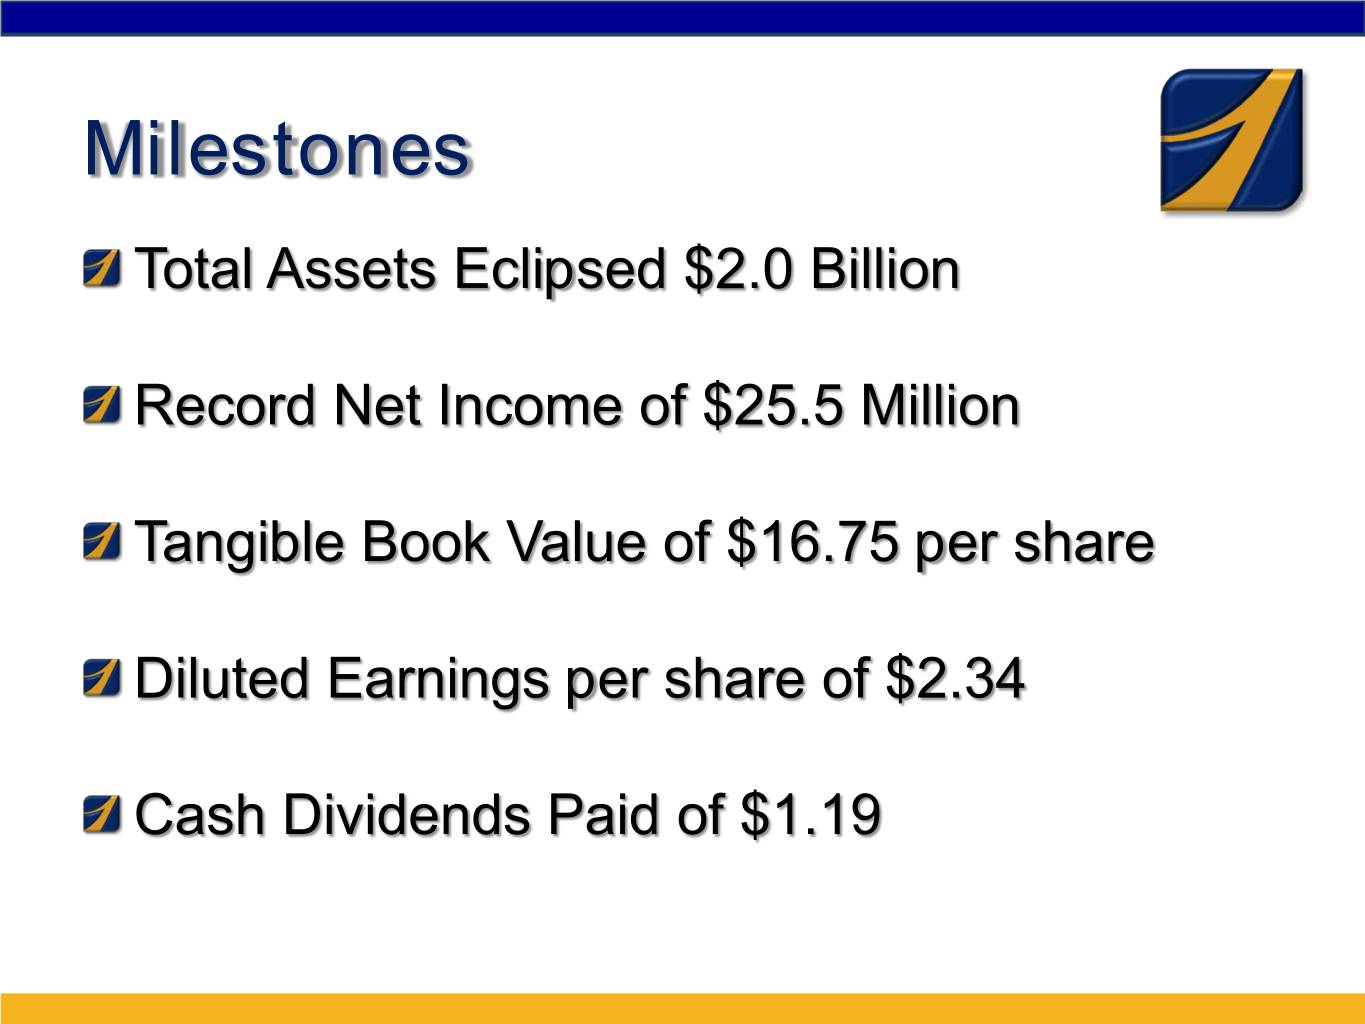
Milestones Total Assets Eclipsed $2.0 Billion Record Net Income of $25.5 Million Tangible Book Value of $16.75 per share Diluted Earnings per share of $2.34 Cash Dividends Paid of $1.19
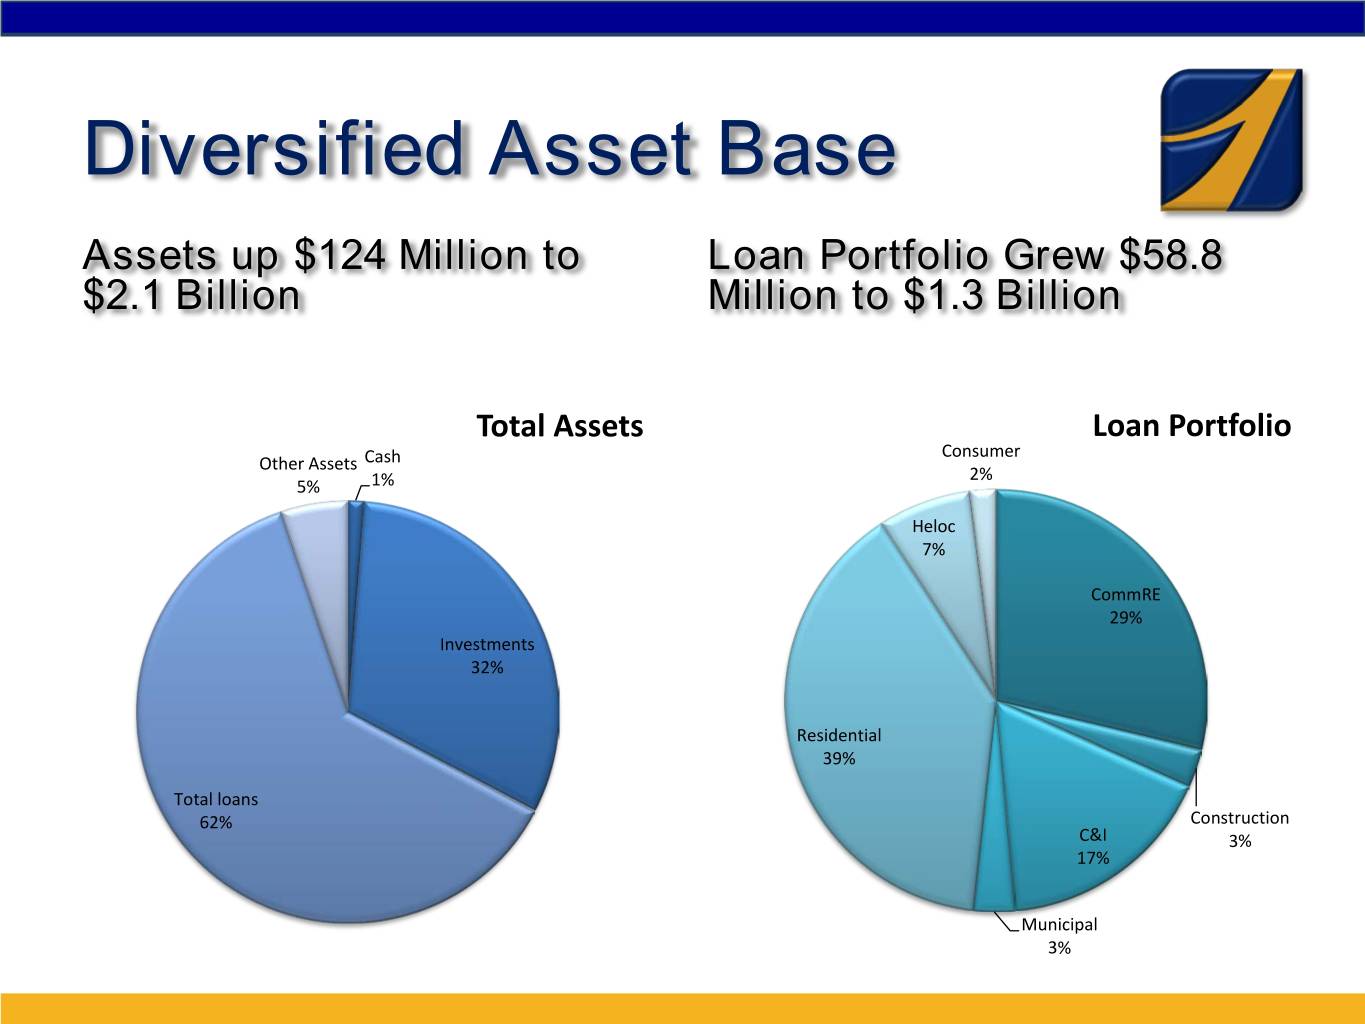
Diversified Asset Base Assets up $124 Million to Loan Portfolio Grew $58.8 $2.1 Billion Million to $1.3 Billion Total Assets Loan Portfolio Consumer Other Assets Cash 2% 5% 1% Heloc 7% CommRE 29% Investments 32% Residential 39% Total loans 62% Construction C&I 3% 17% Municipal 3%

Funding & Key Metrics Stable Funding Selected Data For 2019 Liabilities & Equity ROA: 1.27% Borrowed Funds ROTCE: 14.66% 7% Equity 8% NIM: 2.89% Low Cost Deposits 29% Dividend Payout: 50.42% Efficiency: 51.04% Total Capital: 15.27% MMDA & CDs 1Yr. Total Return: 20.13% 56%

1Q2020 Highlights Total Assets $2.14 Billion Net Income $6.5 Million, up 5.5% from 1Q2019 Loans grew $47.1 Million in the quarter Low Cost Deposits stable NPA/TA improved to 0.49% Classified/Equity improved to 16.23% Dividend of $0.30/share
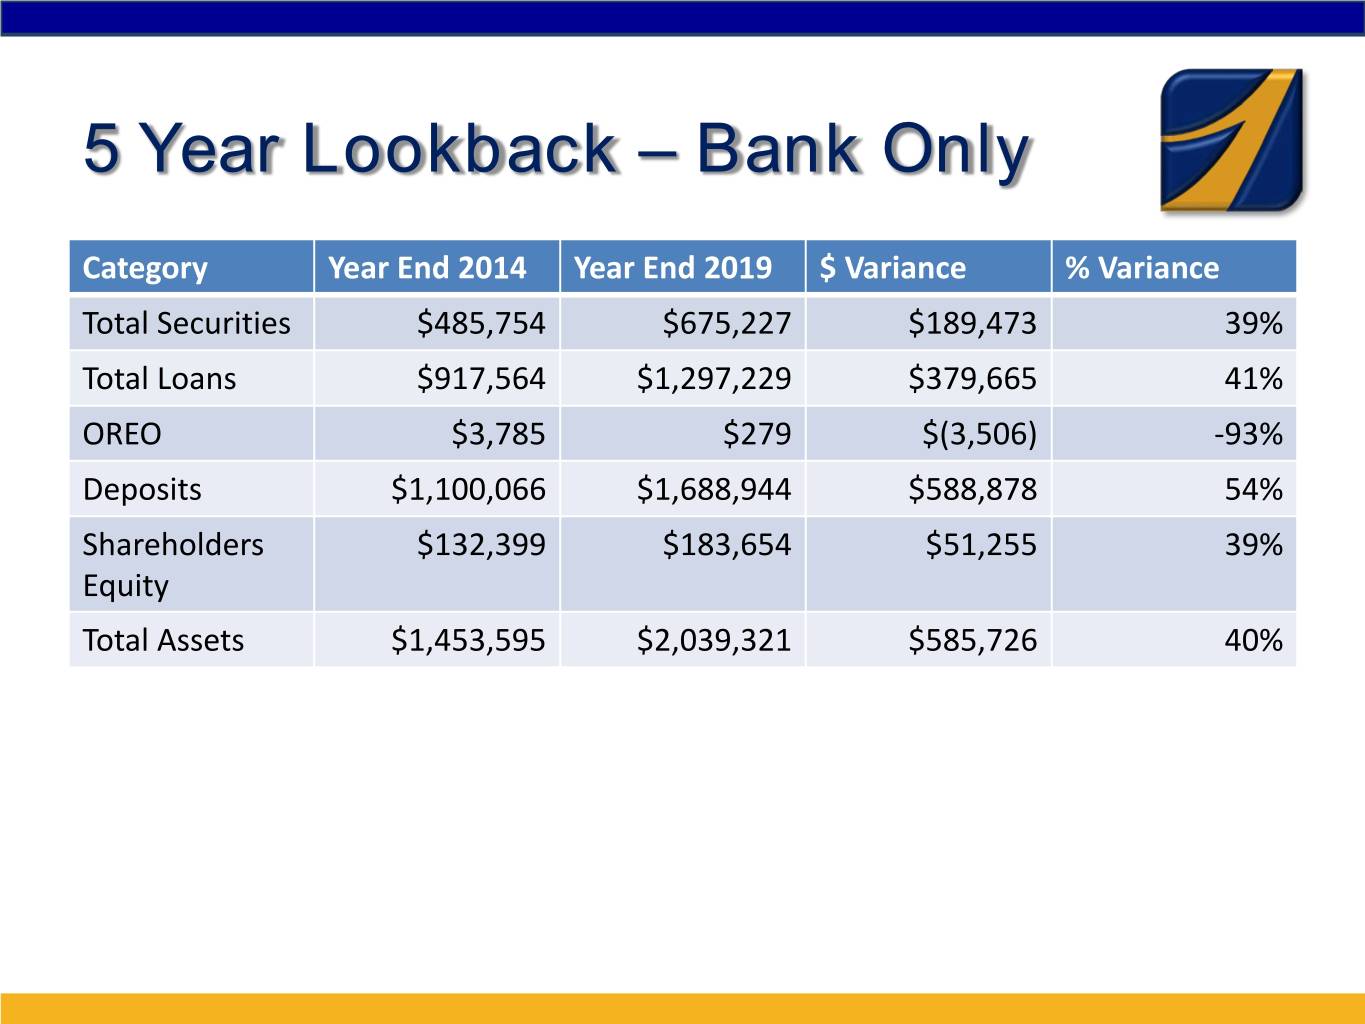
5 Year Lookback – Bank Only Category Year End 2014 Year End 2019 $ Variance % Variance Total Securities $485,754 $675,227 $189,473 39% Total Loans $917,564 $1,297,229 $379,665 41% OREO $3,785 $279 $(3,506) -93% Deposits $1,100,066 $1,688,944 $588,878 54% Shareholders $132,399 $183,654 $51,255 39% Equity Total Assets $1,453,595 $2,039,321 $585,726 40%
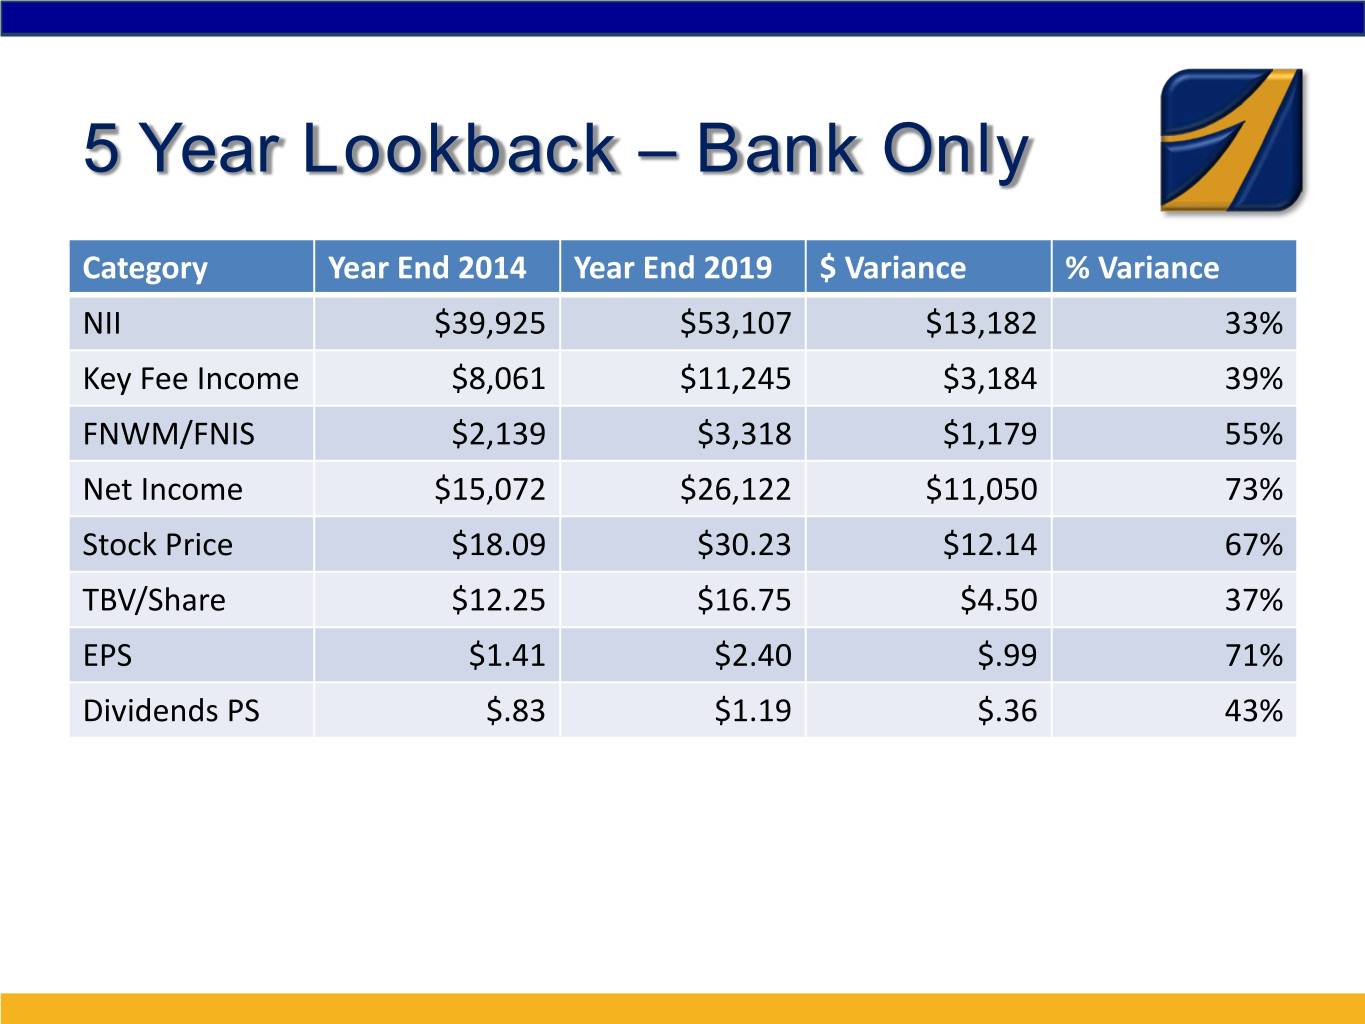
5 Year Lookback – Bank Only Category Year End 2014 Year End 2019 $ Variance % Variance NII $39,925 $53,107 $13,182 33% Key Fee Income $8,061 $11,245 $3,184 39% FNWM/FNIS $2,139 $3,318 $1,179 55% Net Income $15,072 $26,122 $11,050 73% Stock Price $18.09 $30.23 $12.14 67% TBV/Share $12.25 $16.75 $4.50 37% EPS $1.41 $2.40 $.99 71% Dividends PS $.83 $1.19 $.36 43%

5 Year Lookback – Bank Only Category Year End 2014 Year End 2019 Variance % Variance Lev Capital 8.76% 9.24% 0.48% 5% LLL $21,065 $28,754 $7,689 37% Classified/Capital 32.00% 19.45% -12.55% -39% NIM 3.11% 2.91% -.20% -6% ROA 1.04% 1.32% .28% 27% ROE 11.59% 15.11% 3.52% 30% Pers Exp/Avg Assets 1.02% 0.93% -.09% -9% Net Occ/Avg Assets 0.35% 0.33% -.02% -6% Total OH/Avg Assets 2.04% 1.74% -.30% -15% ER 55.72% 49.98% -5.74% -10%

COVID-19 Crisis Bank Actions . Drive-up only at all locations . Loan closings, notarizations, debit card replacement, new accounts – drive up . Safe deposit box entrance, other face to face limited with interview questions . Over 80% of our FTEs working from home . Critical staff/tasks still at the Bank . Push to digital channels
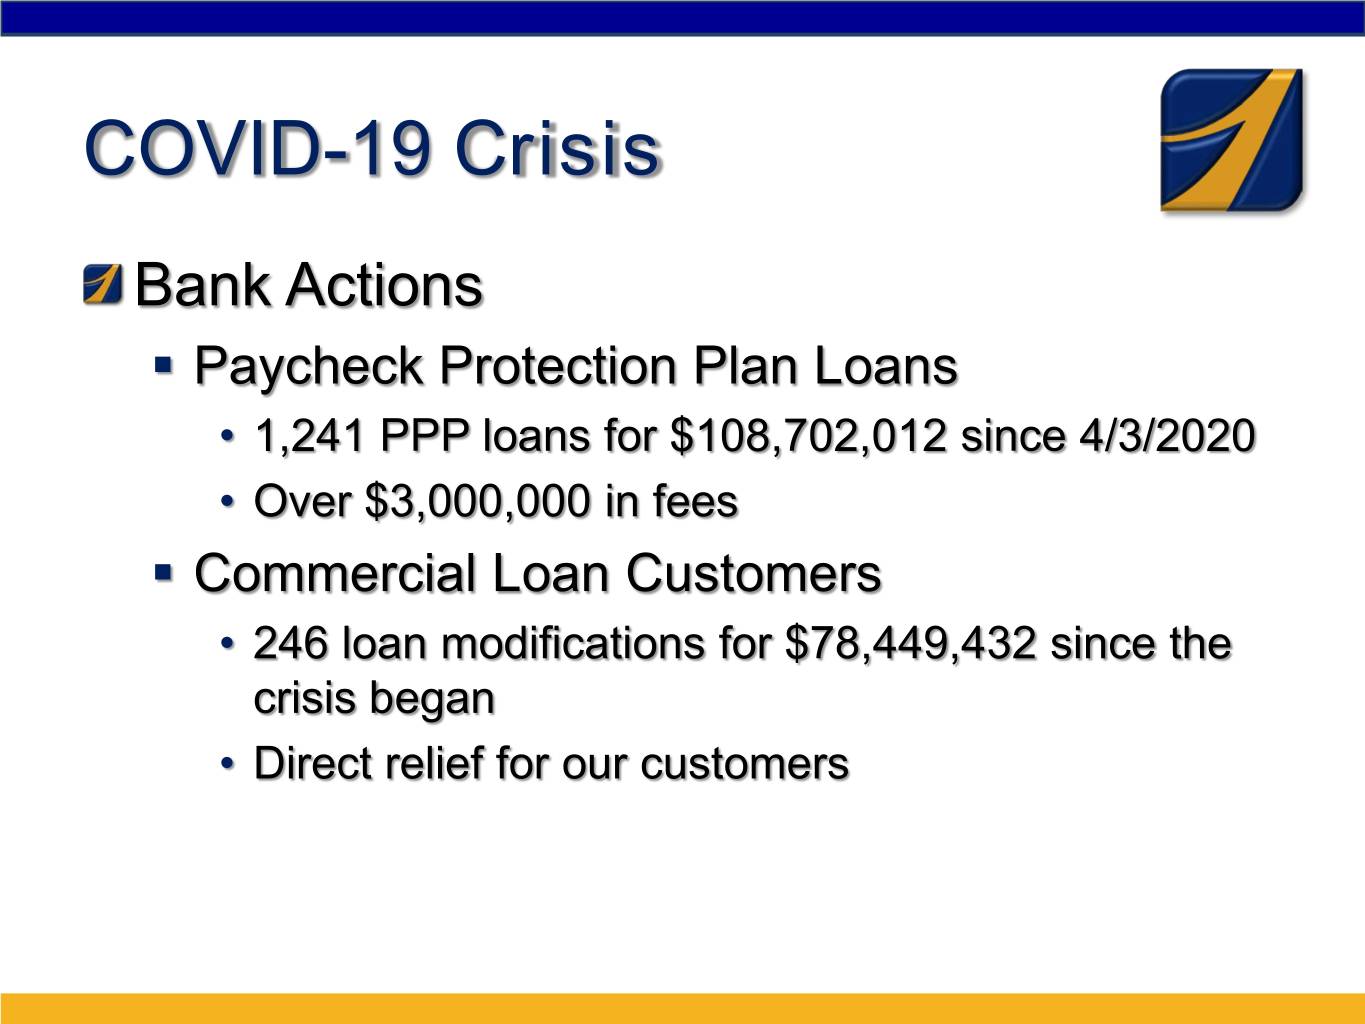
COVID-19 Crisis Bank Actions . Paycheck Protection Plan Loans • 1,241 PPP loans for $108,702,012 since 4/3/2020 • Over $3,000,000 in fees . Commercial Loan Customers • 246 loan modifications for $78,449,432 since the crisis began • Direct relief for our customers

COVID-19 Crisis Bank Actions . Residential/Consumer Loan Customers • 290 loan modifications for $37,724,146 since the crisis began • Again, direct relief for our customers . Industry Segment and Reserve Analysis • Lodging, restaurants, and fishing, sectors hit very hard by crisis • ALLL impact analysis is underway though sector analysis • Generally, reserves will rise and earnings will be impacted

Stock Performance
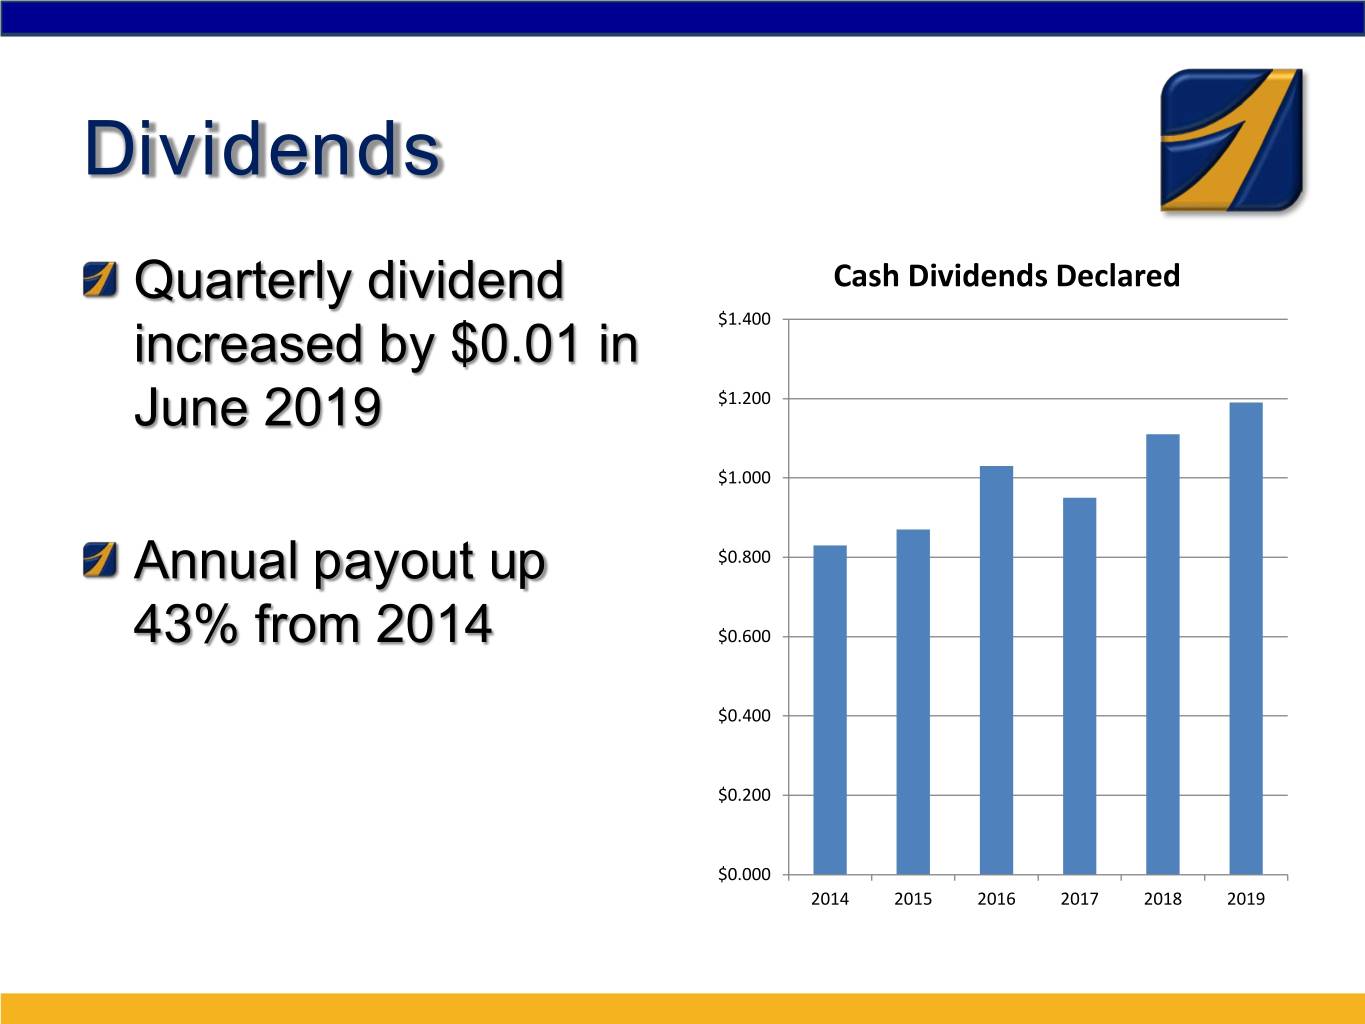
Dividends Quarterly dividend Cash Dividends Declared $1.400 increased by $0.01 in June 2019 $1.200 $1.000 Annual payout up $0.800 43% from 2014 $0.600 $0.400 $0.200 $0.000 2014 2015 2016 2017 2018 2019
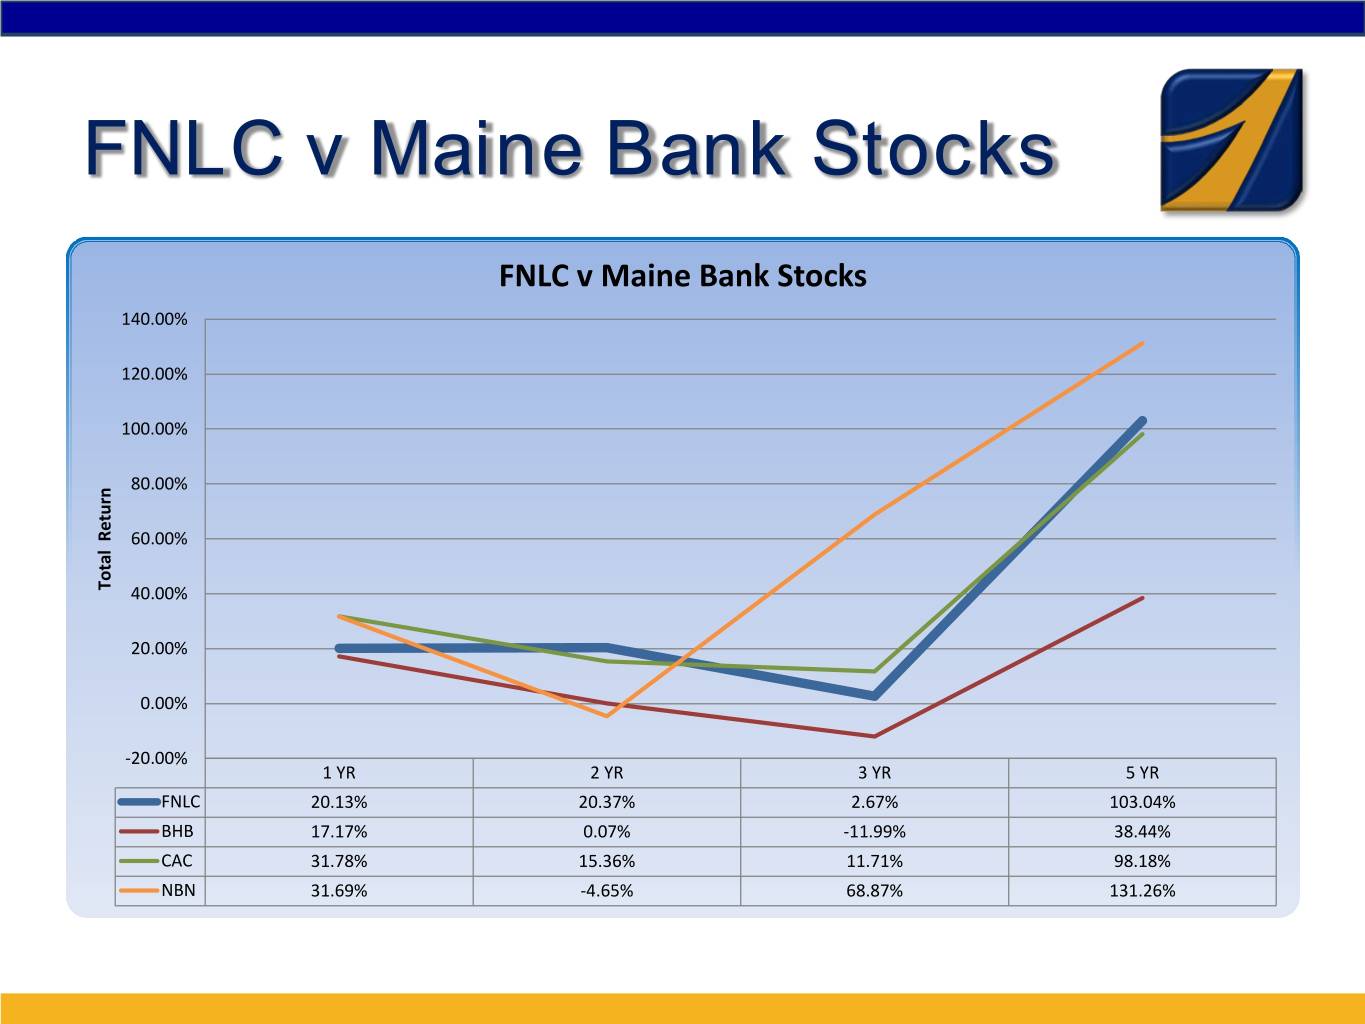
FNLC v Maine Bank Stocks FNLC v Maine Bank Stocks 140.00% 120.00% 100.00% 80.00% 60.00% Total Total Return 40.00% 20.00% 0.00% -20.00% 1 YR 2 YR 3 YR 5 YR FNLC 20.13% 20.37% 2.67% 103.04% BHB 17.17% 0.07% -11.99% 38.44% CAC 31.78% 15.36% 11.71% 98.18% NBN 31.69% -4.65% 68.87% 131.26%
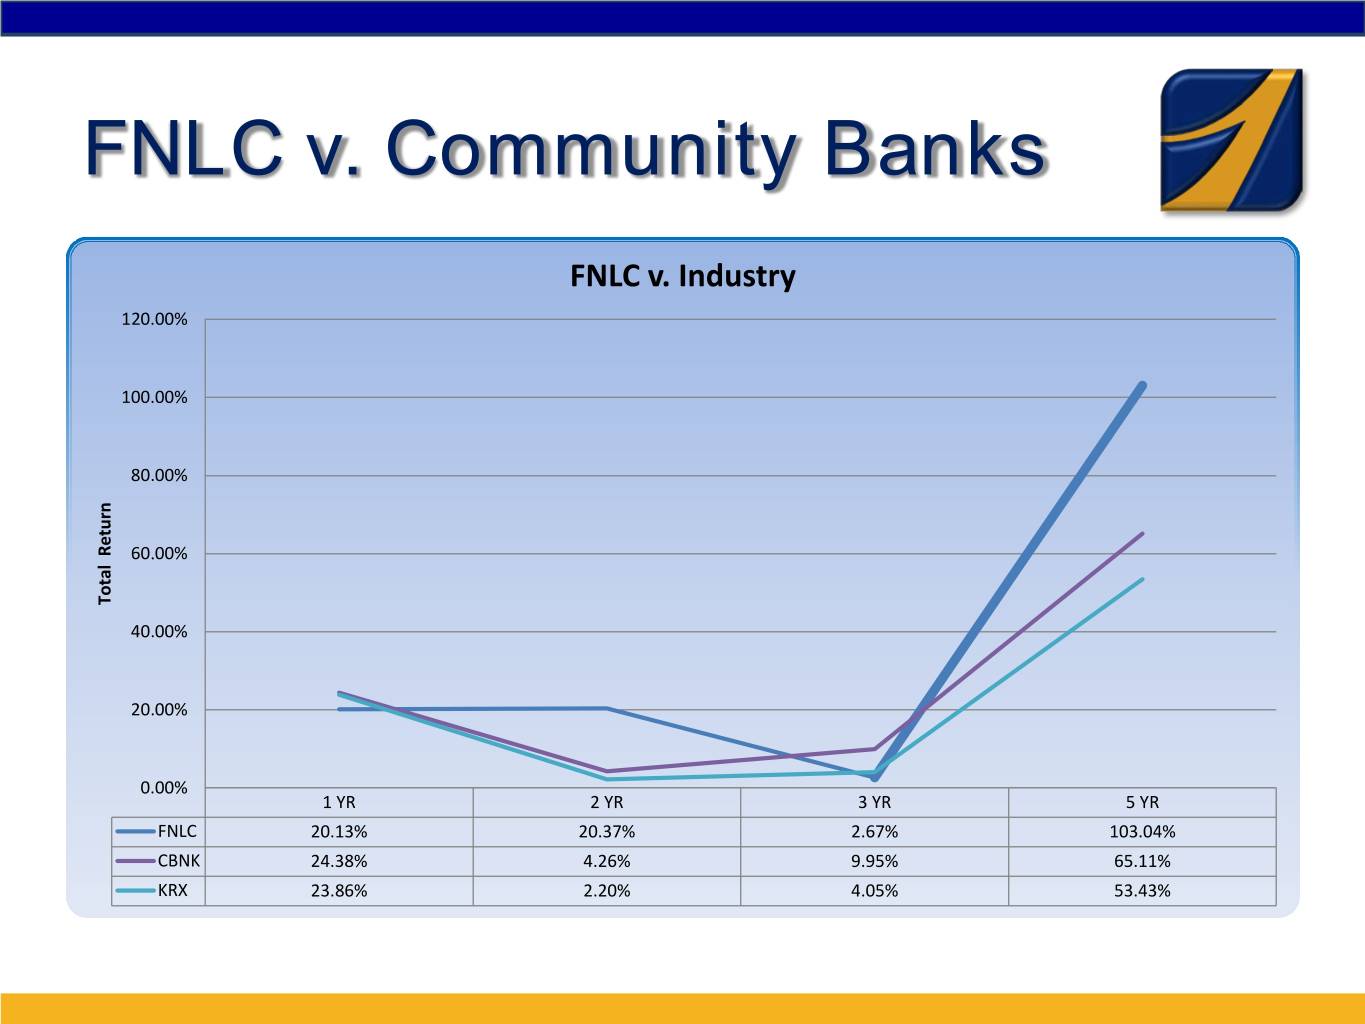
FNLC v. Community Banks FNLC v. Industry 120.00% 100.00% 80.00% 60.00% Total Total Return 40.00% 20.00% 0.00% 1 YR 2 YR 3 YR 5 YR FNLC 20.13% 20.37% 2.67% 103.04% CBNK 24.38% 4.26% 9.95% 65.11% KRX 23.86% 2.20% 4.05% 53.43%

FNLC v. Broad Market FNLC v. Broad Market 120.00% 100.00% 80.00% 60.00% Total Total Return 40.00% 20.00% 0.00% 1 YR 2 YR 3 YR 5 YR FNLC 20.13% 20.37% 2.67% 103.04% INDU 25.34% 20.98% 54.99% 80.84% SPX 31.48% 25.70% 53.13% 73.80% RTY 25.49% 11.65% 27.98% 48.36%

