Attached files
| file | filename |
|---|---|
| 8-K - FORM 8-K - SVB FINANCIAL GROUP | q120investorrelations_8-k.htm |


• • • • • • • • • •
• •
• • • • • • • • • • • •
• • • • • •
• • • • • •
• • • • •
•
• • • • • •
• •
• • • • • • • • • • •
• • • • • •
• • • •
• • • •
• • • • •
• • • • • • • • • • • • • • • • •
Appendix
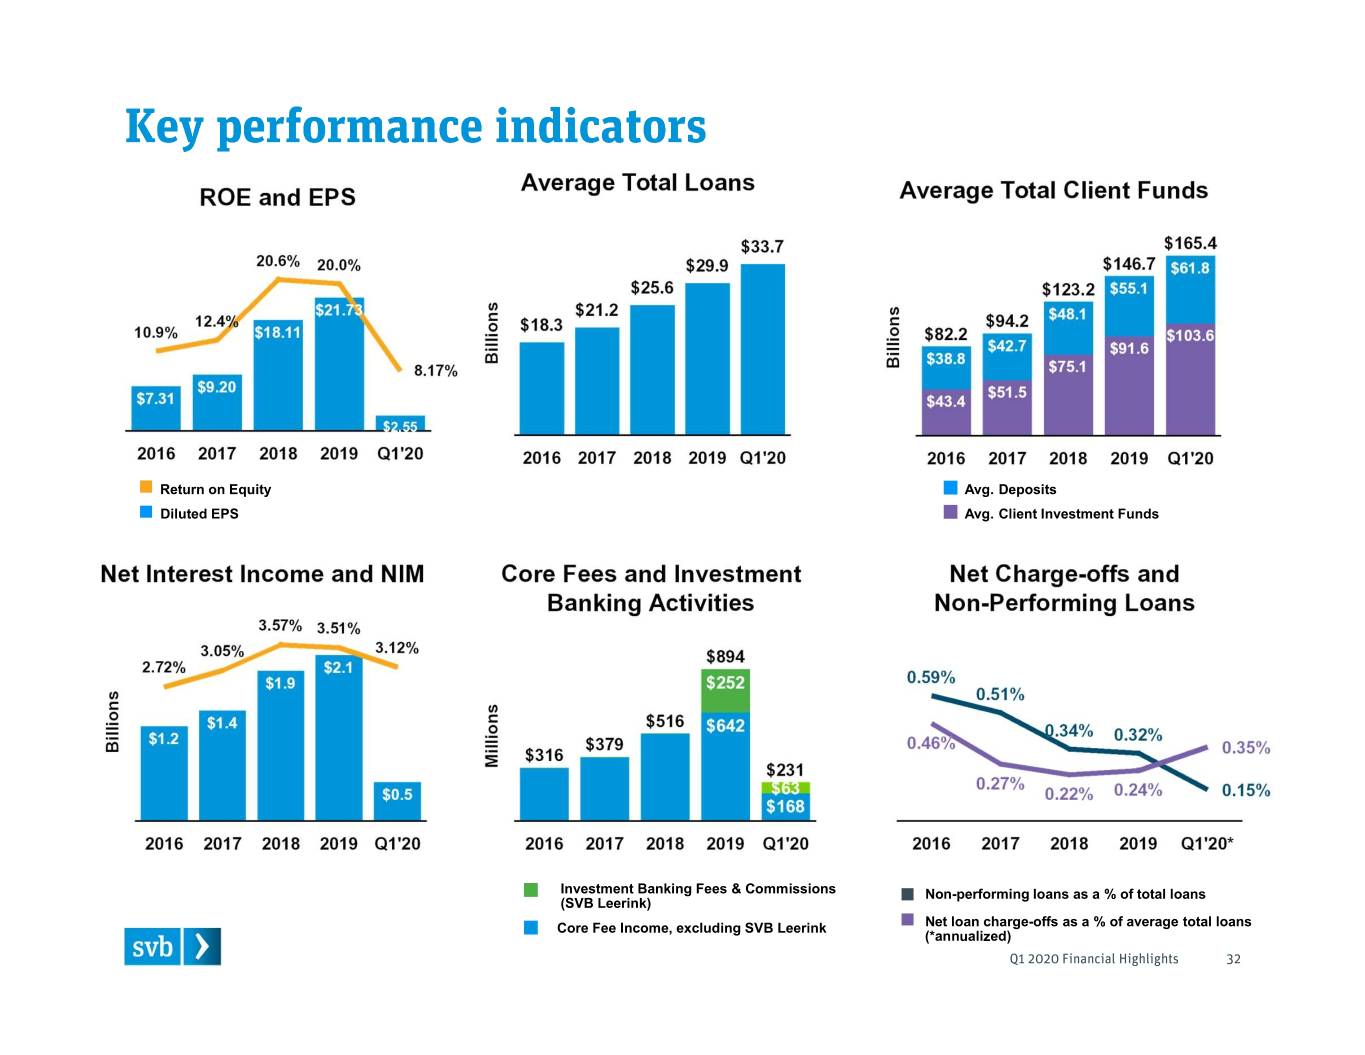
Return on Equity Avg. Deposits Diluted EPS Avg. Client Investment Funds $2.1 Investment Banking Fees & Commissions Non-performing loans as a % of total loans (SVB Leerink) Core Fee Income, excluding SVB Leerink Net loan charge-offs as a % of average total loans (*annualized)
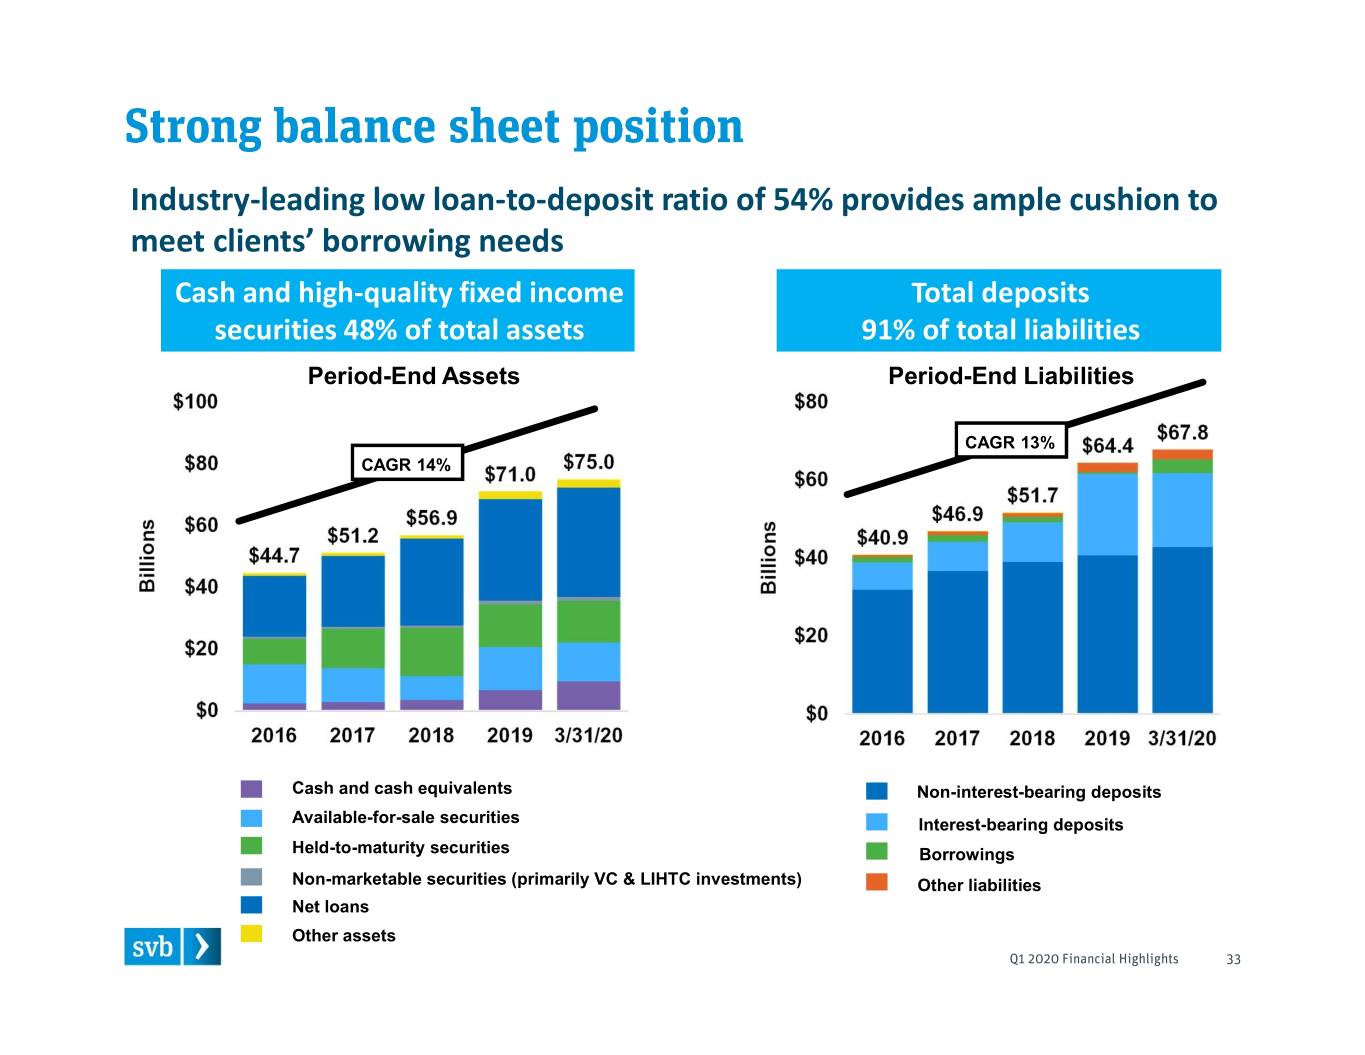
Industry-leading low loan-to-deposit ratio of 54% provides ample cushion to meet clients’ borrowing needs Cash and high-quality fixed income Total deposits securities 48% of total assets 91% of total liabilities Period-End Assets Period-End Liabilities CAGR 13% CAGR 14% Cash and cash equivalents Non-interest-bearing deposits Available-for-sale securities Interest-bearing deposits Held-to-maturity securities Borrowings Non-marketable securities (primarily VC & LIHTC investments) Other liabilities Net loans Other assets
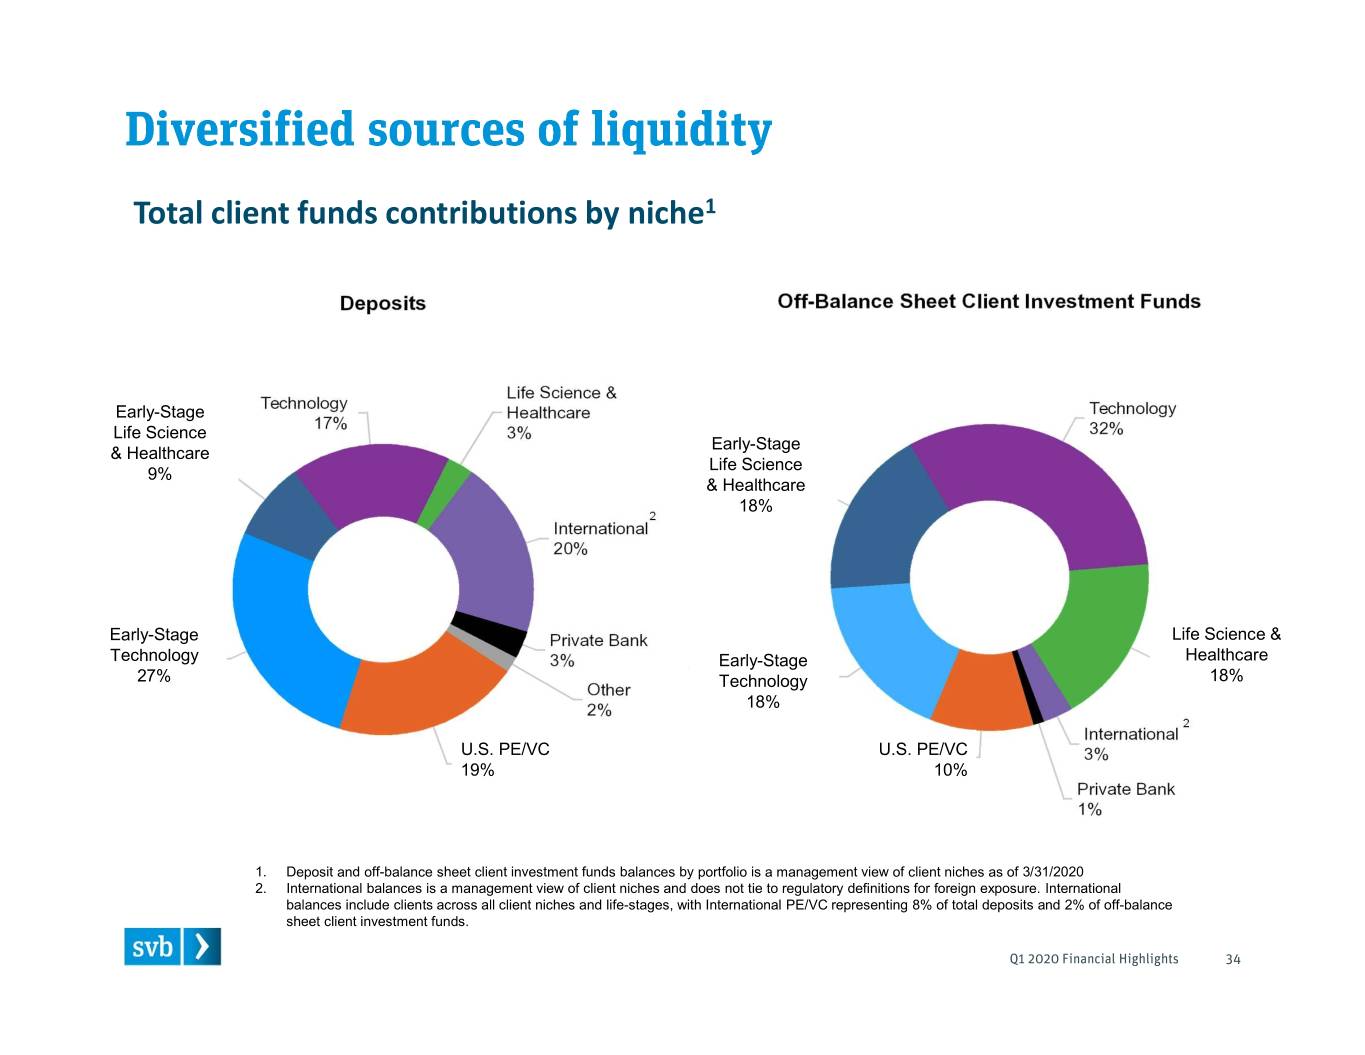
Total client funds contributions by niche1 Early-Stage Life Science Early-Stage & Healthcare Life Science 9% & Healthcare 18% 2 Early-Stage Life Science & Technology Early-Stage Healthcare 27% Technology 18% 18% 2 U.S. PE/VC U.S. PE/VC 19% 10% 1. Deposit and off-balance sheet client investment funds balances by portfolio is a management view of client niches as of 3/31/2020 2. International balances is a management view of client niches and does not tie to regulatory definitions for foreign exposure. International balances include clients across all client niches and life-stages, with International PE/VC representing 8% of total deposits and 2% of off-balance sheet client investment funds.
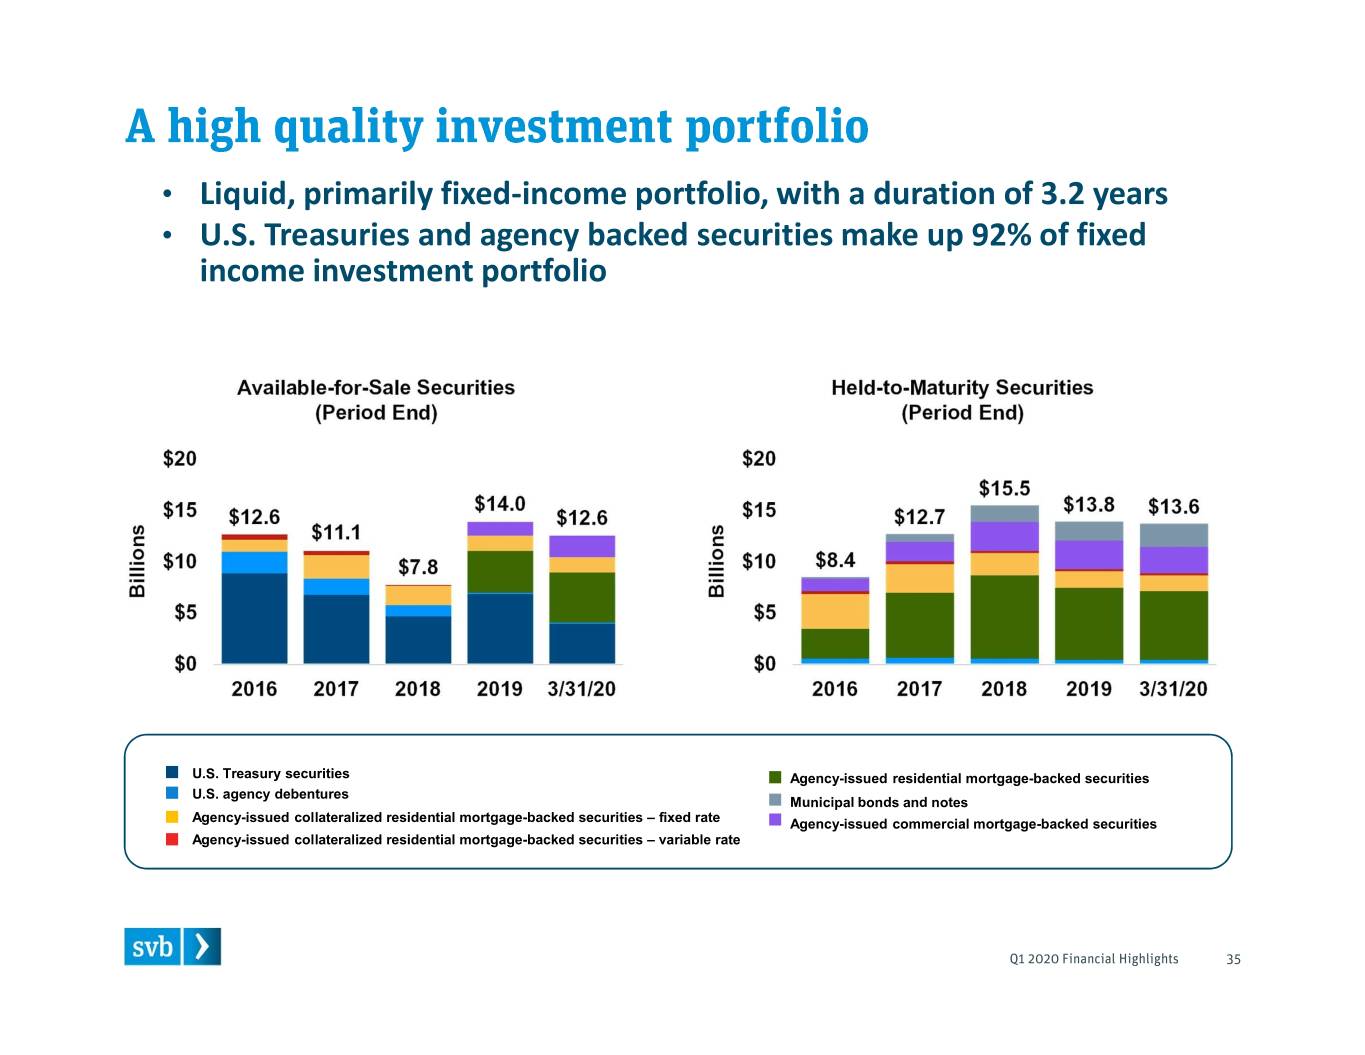
• Liquid, primarily fixed-income portfolio, with a duration of 3.2 years • U.S. Treasuries and agency backed securities make up 92% of fixed income investment portfolio U.S. Treasury securities Agency-issued residential mortgage-backed securities U.S. agency debentures Municipal bonds and notes Agency-issued collateralized residential mortgage-backed securities – fixed rate Agency-issued commercial mortgage-backed securities Agency-issued collateralized residential mortgage-backed securities – variable rate
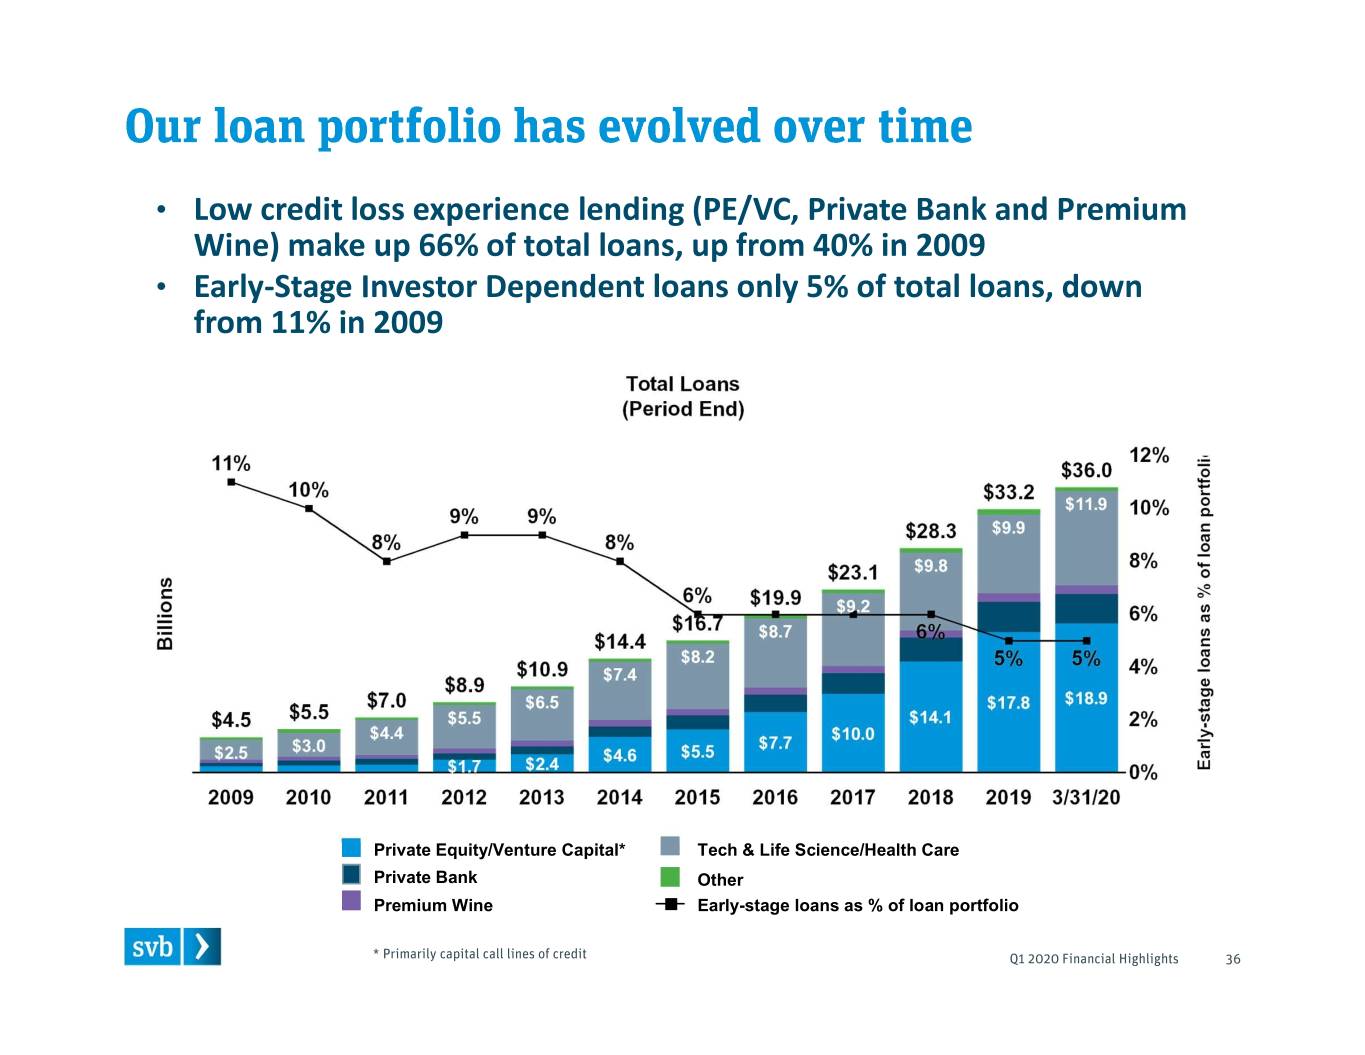
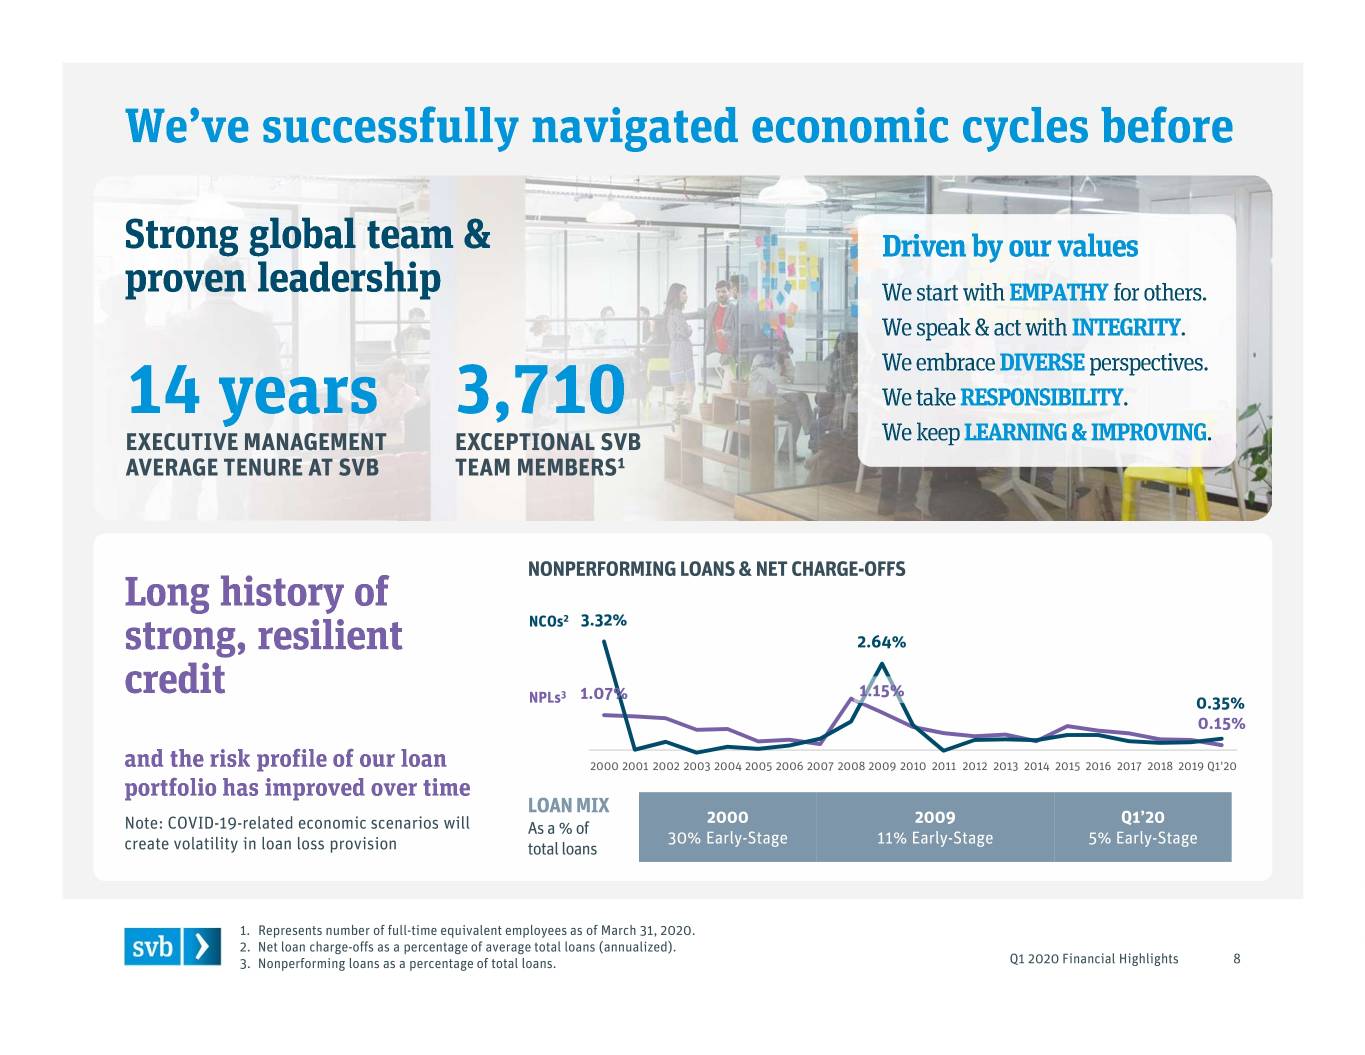
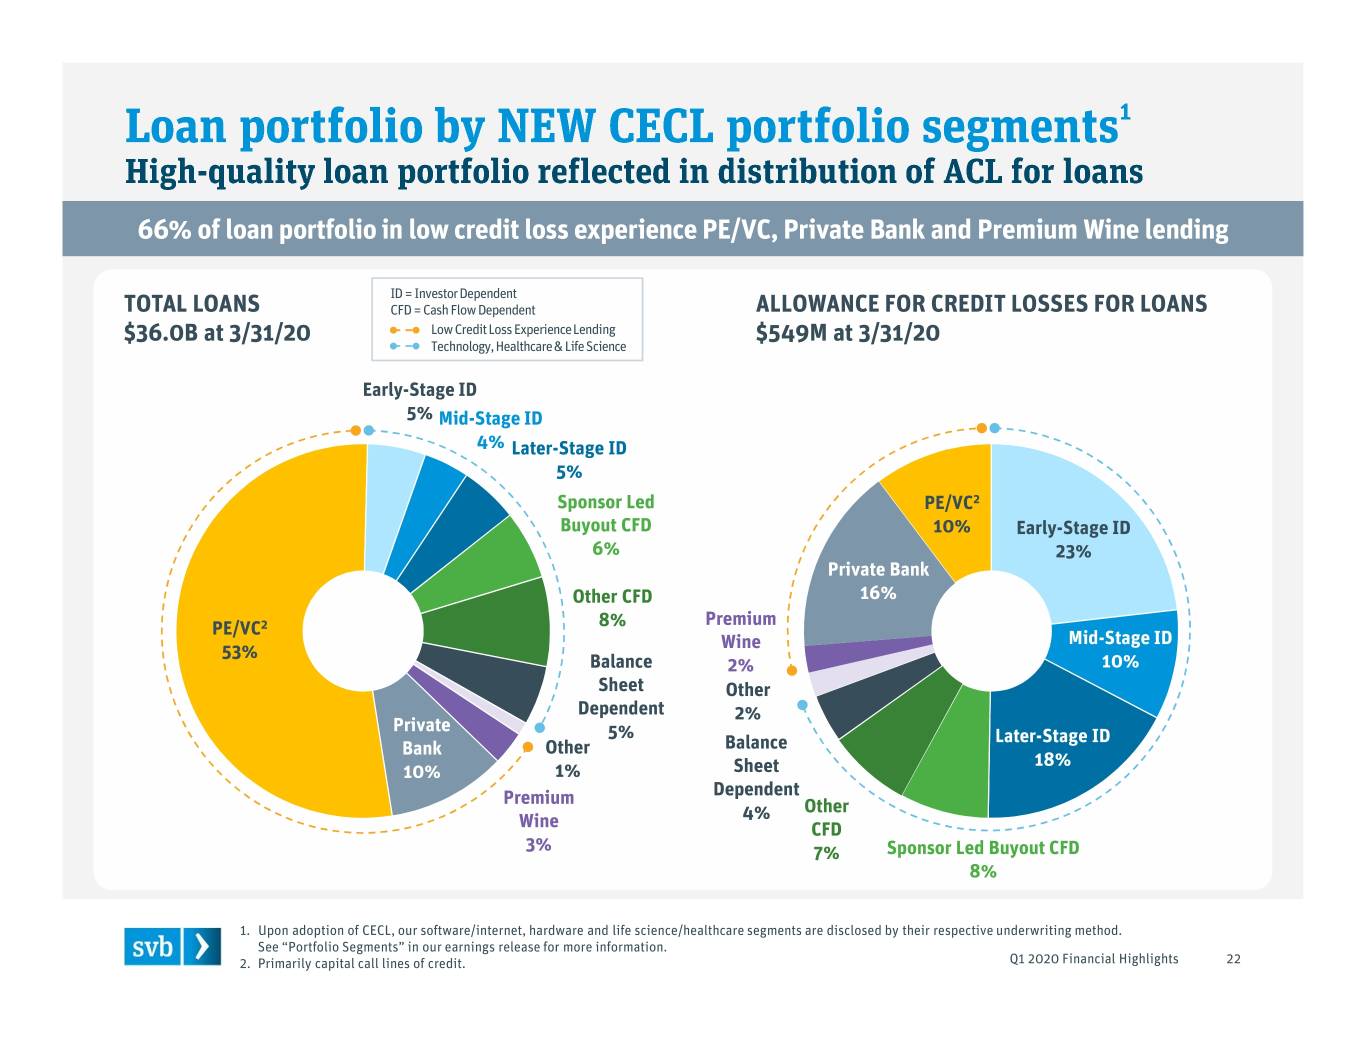
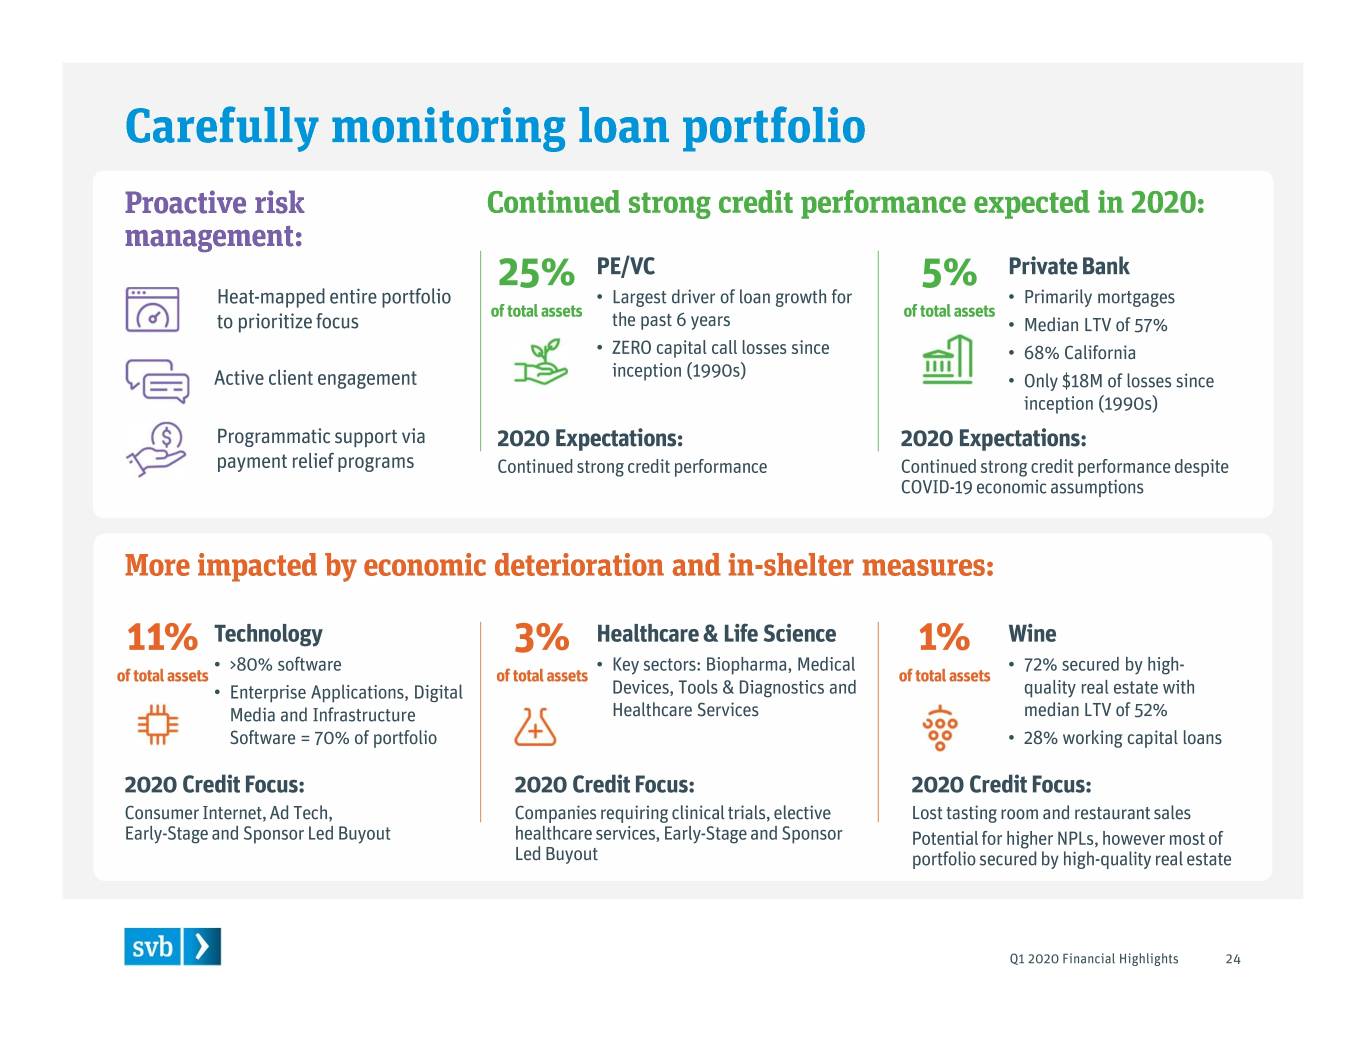
• Low credit loss experience lending (PE/VC, Private Bank and Premium Wine) make up 66% of total loans, up from 40% in 2009 • Early-Stage Investor Dependent loans only 5% of total loans, down from 11% in 2009 Private Equity/Venture Capital* Tech & Life Science/Health Care Private Bank Other Premium Wine Early-stage loans as % of loan portfolio
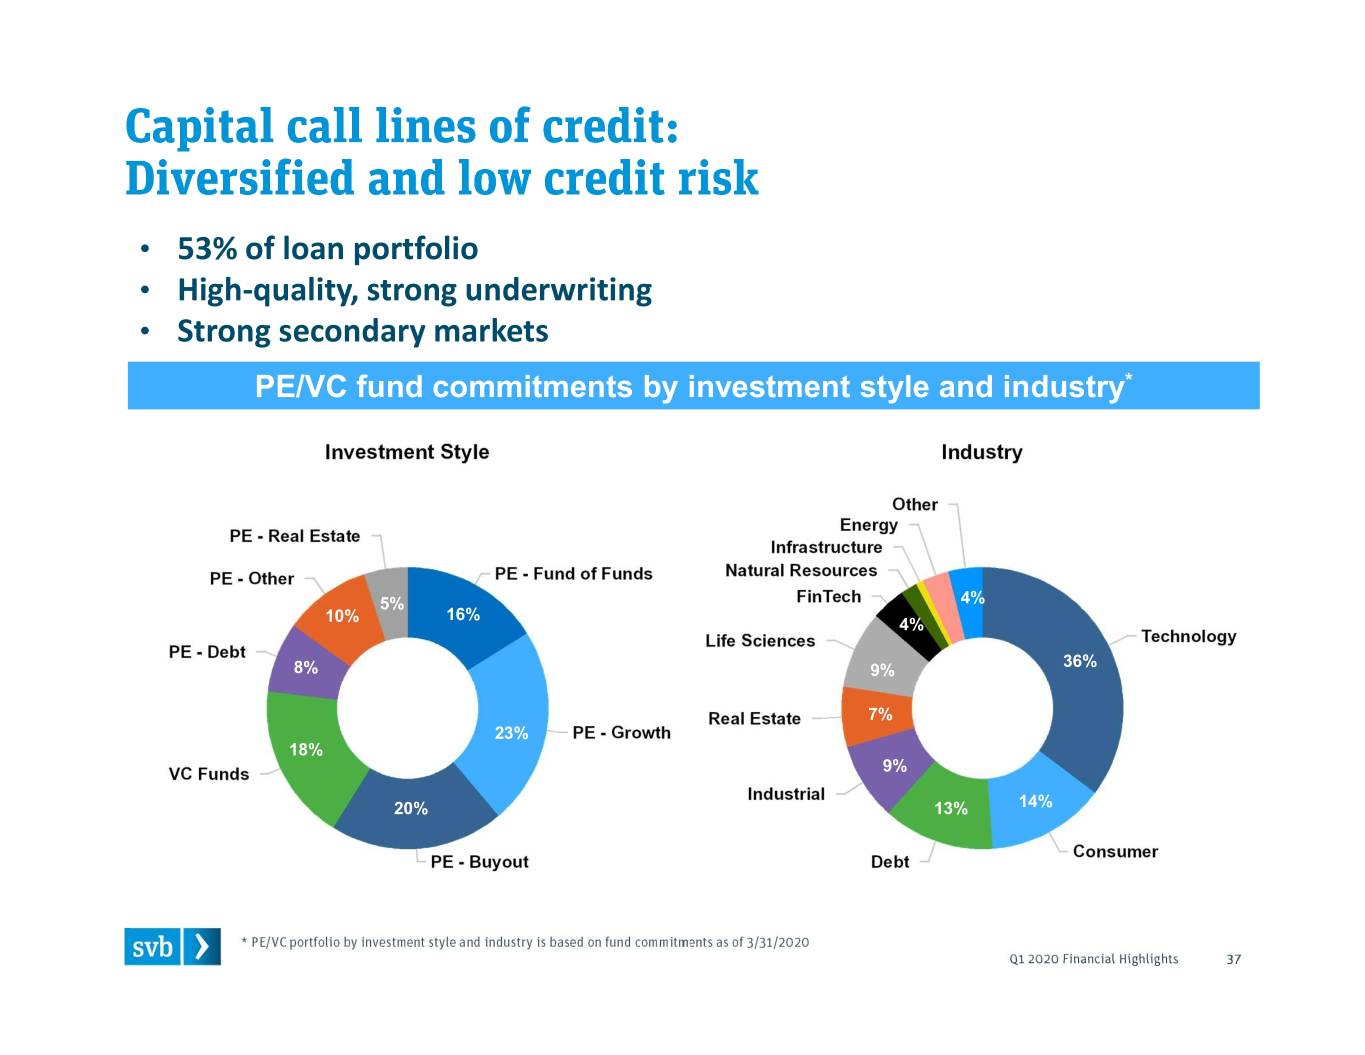
• 53% of loan portfolio • High-quality, strong underwriting • Strong secondary markets PE/VC fund commitments by investment style and industry* 5% 4% 16% 10% 4% 36% 8% 9% 7% 23% 18% 9% 20% 13% 14%
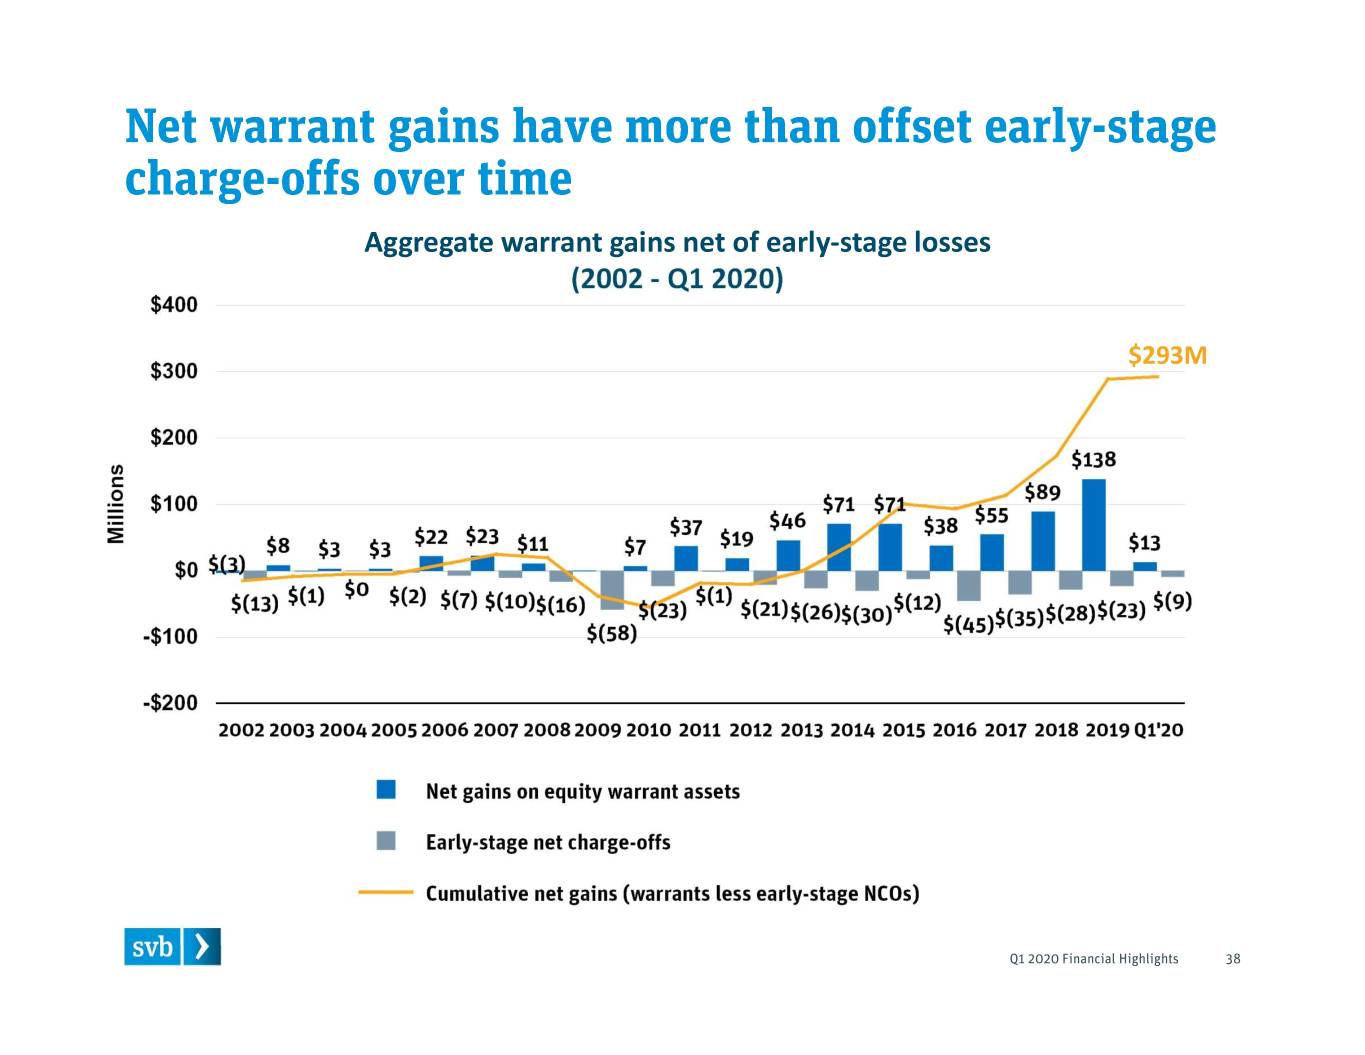
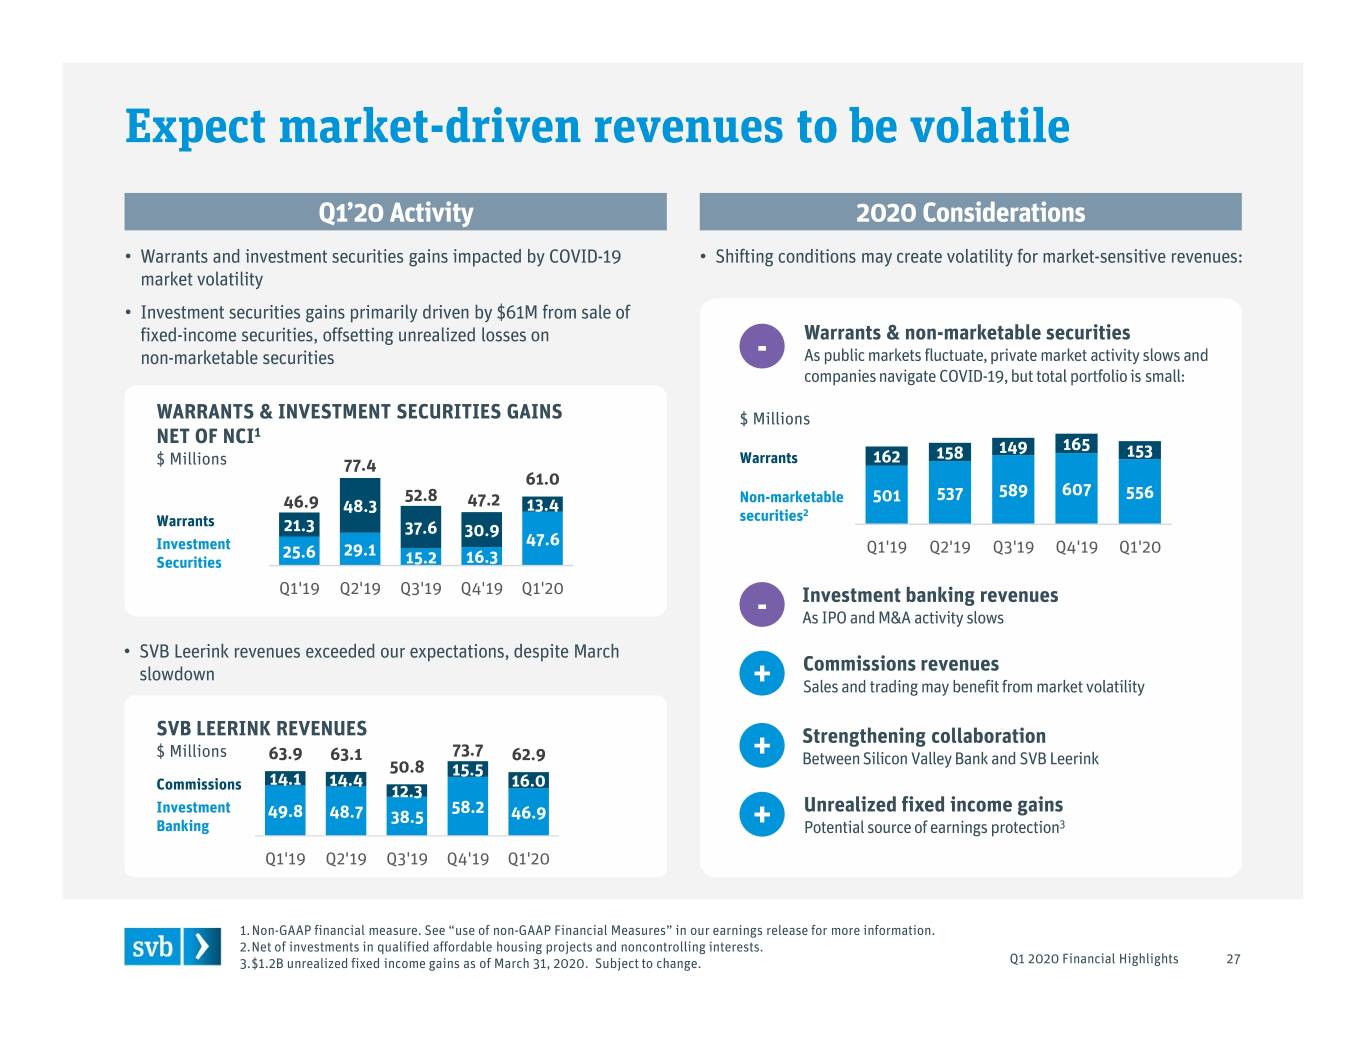
Aggregate warrant gains net of early-stage losses (2002 - Q1 2020) $293M
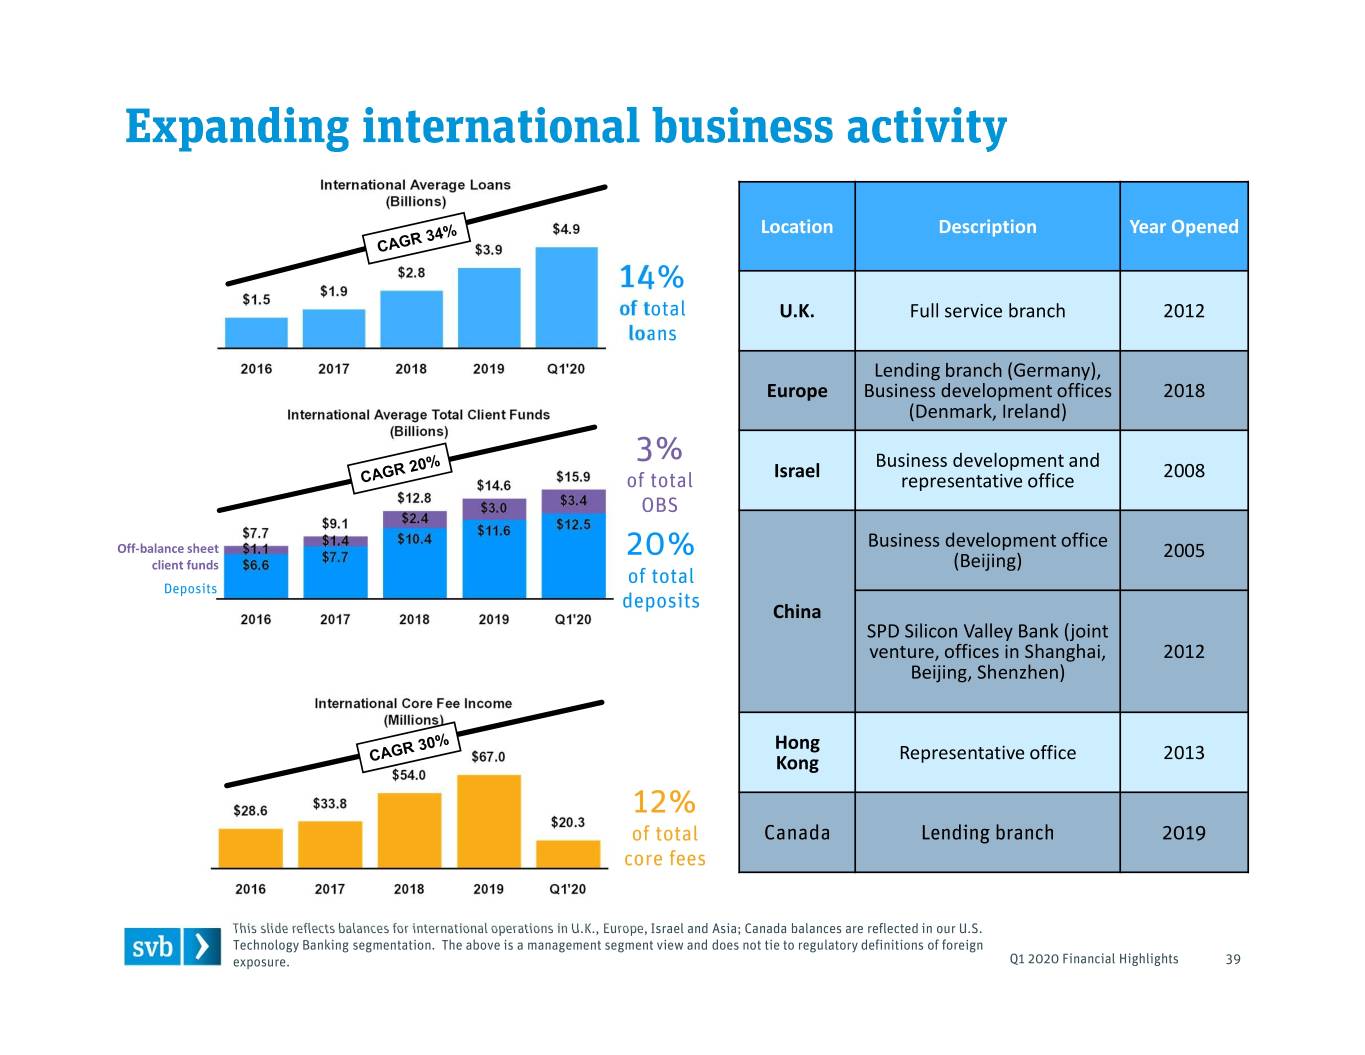
Location Description Year Opened U.K. Full service branch 2012 Lending branch (Germany), Europe Business development offices 2018 (Denmark, Ireland) Business development and Israel representative office 2008 Business development office Off-balance sheet 2005 client funds (Beijing) China SPD Silicon Valley Bank (joint venture, offices in Shanghai, 2012 Beijing, Shenzhen) Hong Kong Representative office 2013
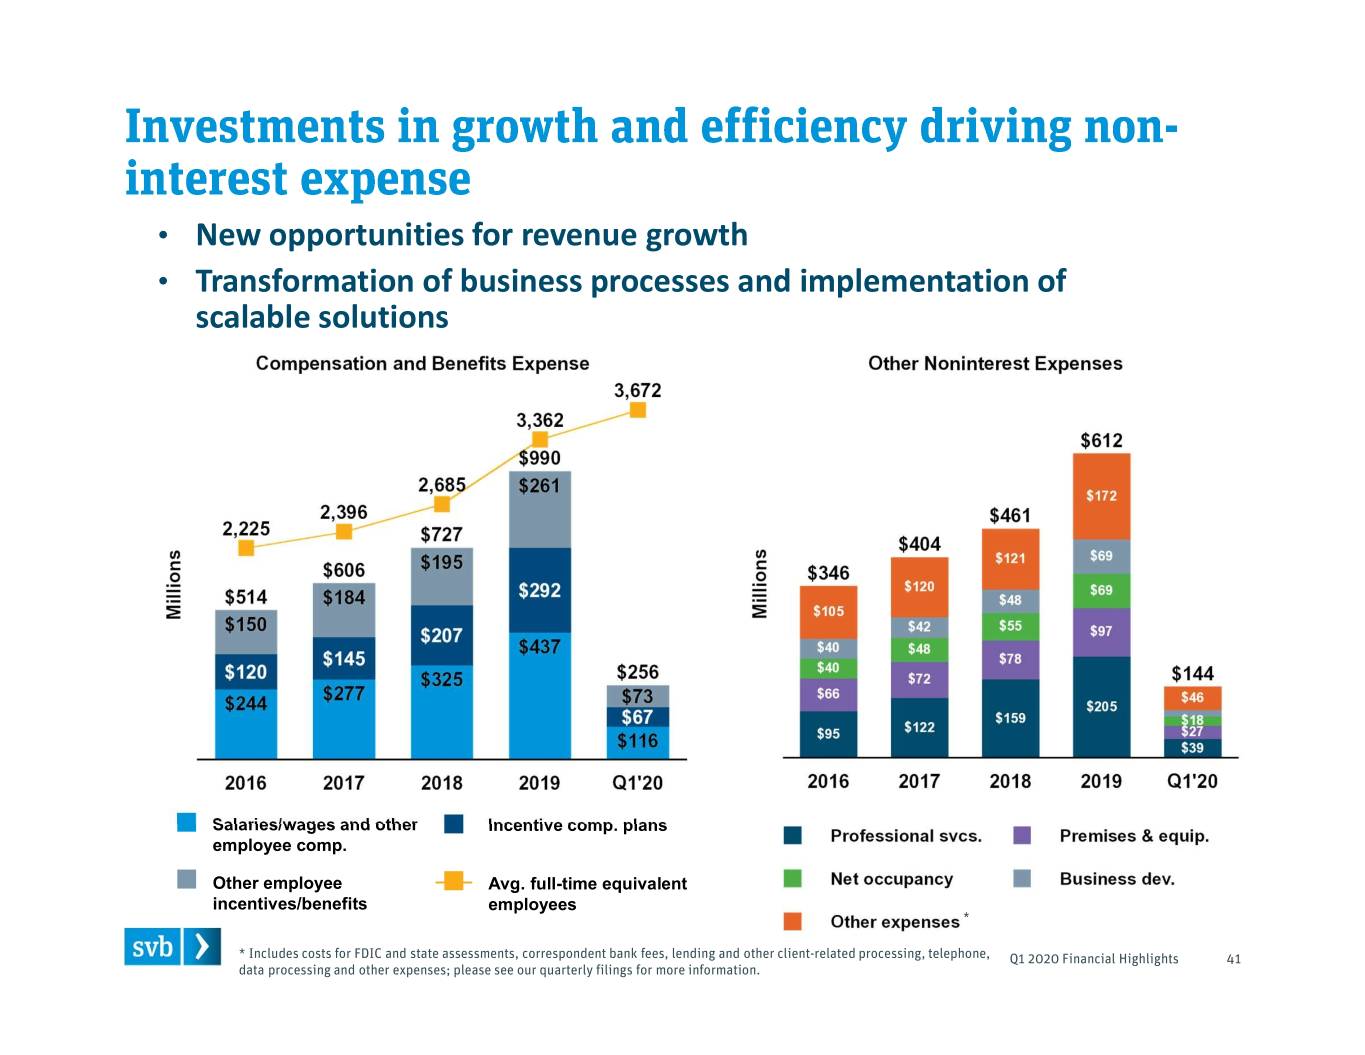
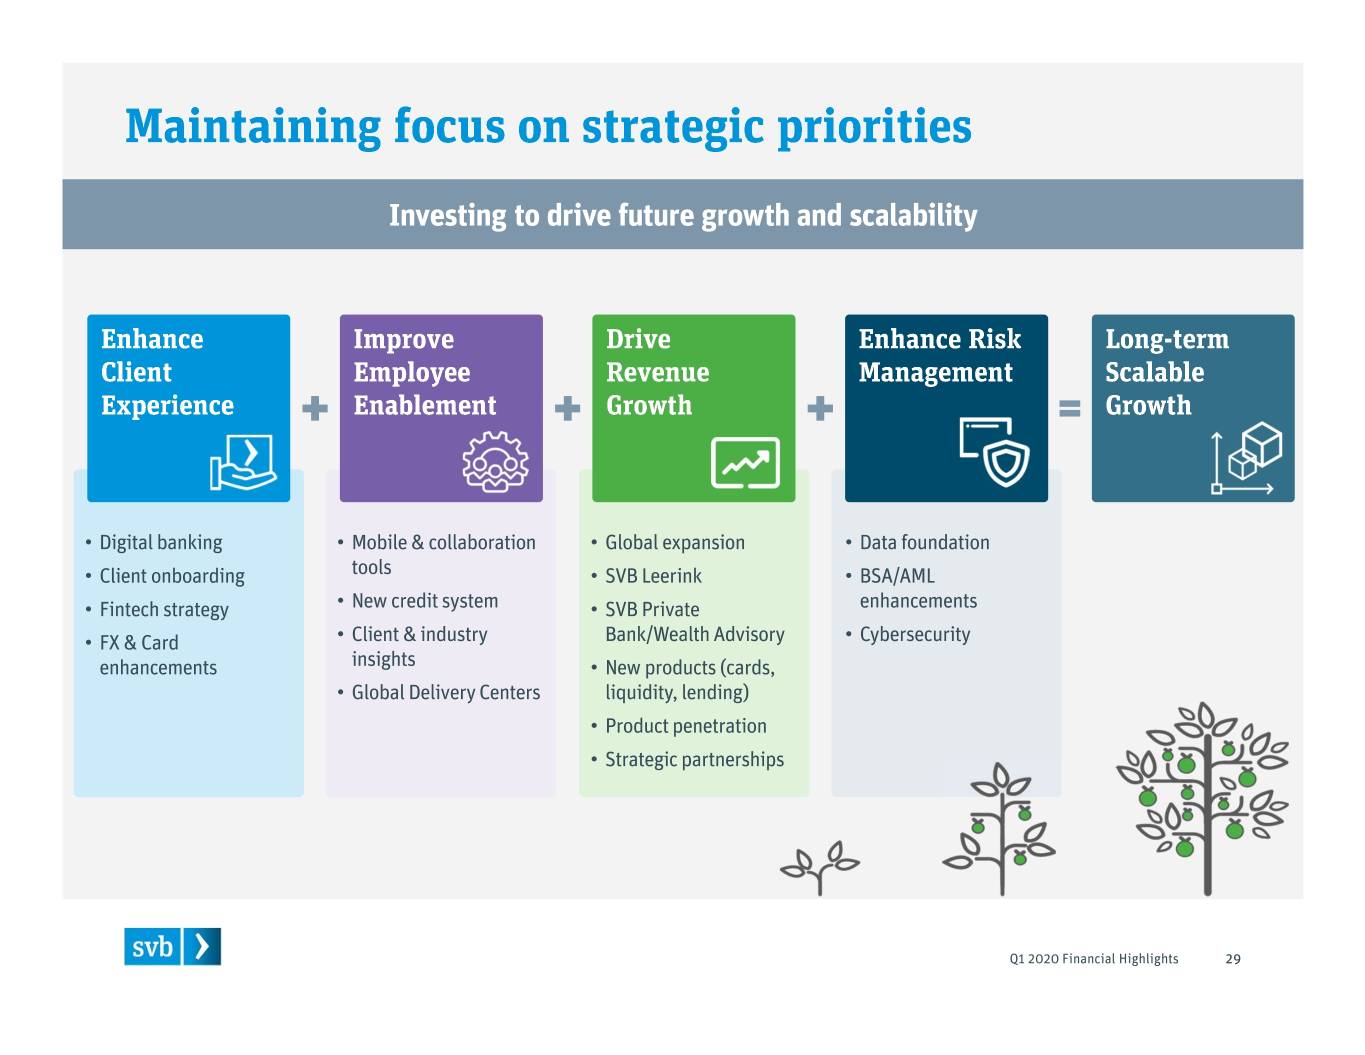
• New opportunities for revenue growth • Transformation of business processes and implementation of scalable solutions Salaries/wages and other Incentive comp. plans employee comp. Other employee Avg. full-time equivalent incentives/benefits employees
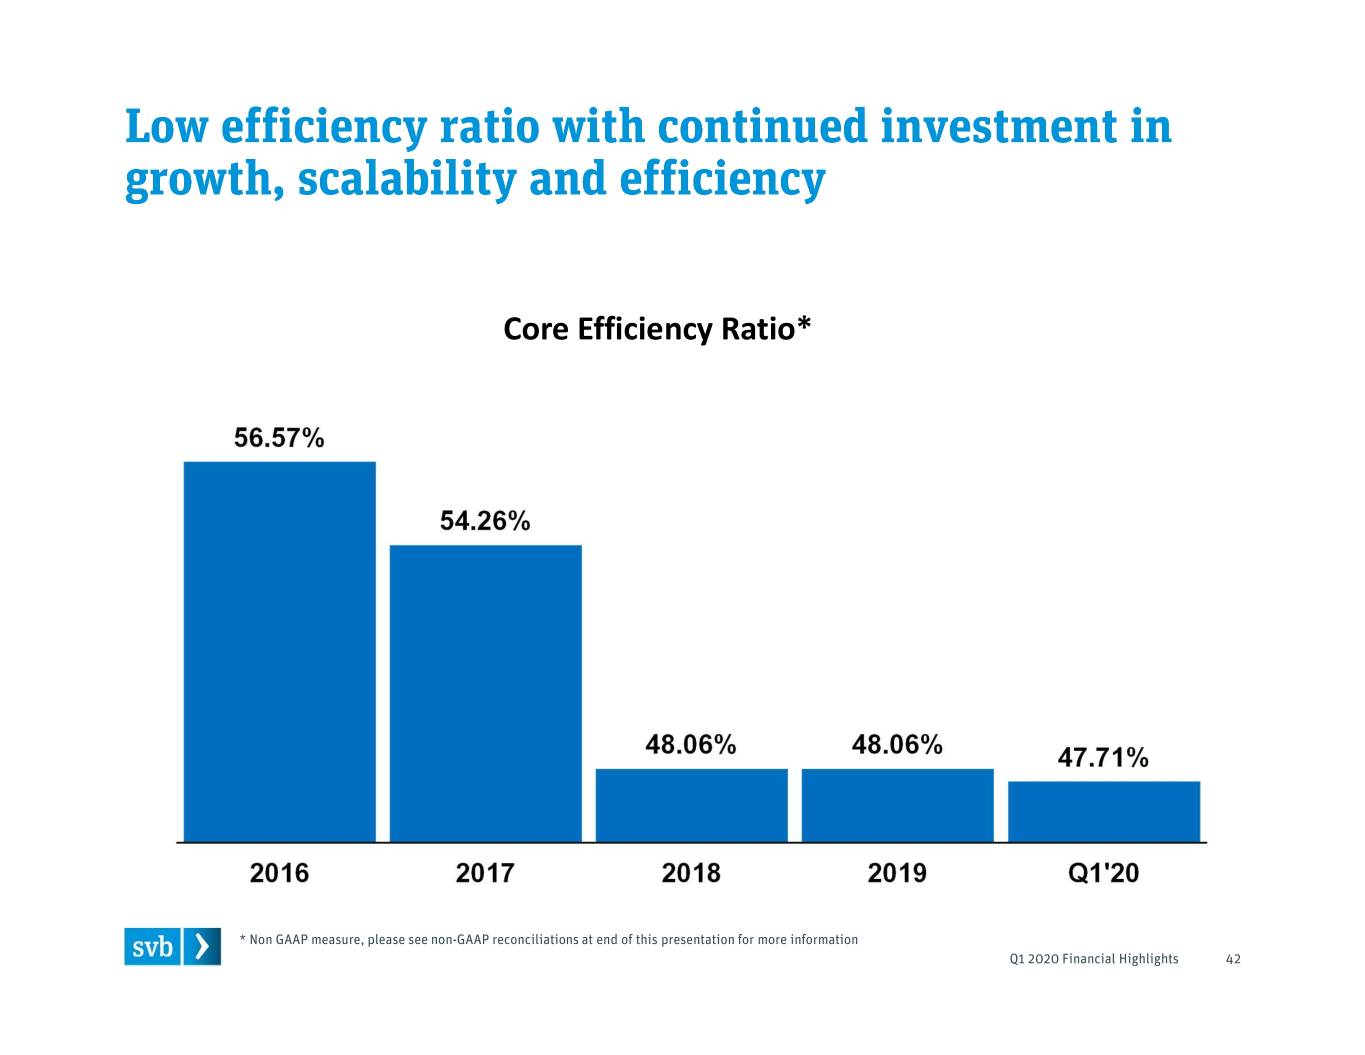
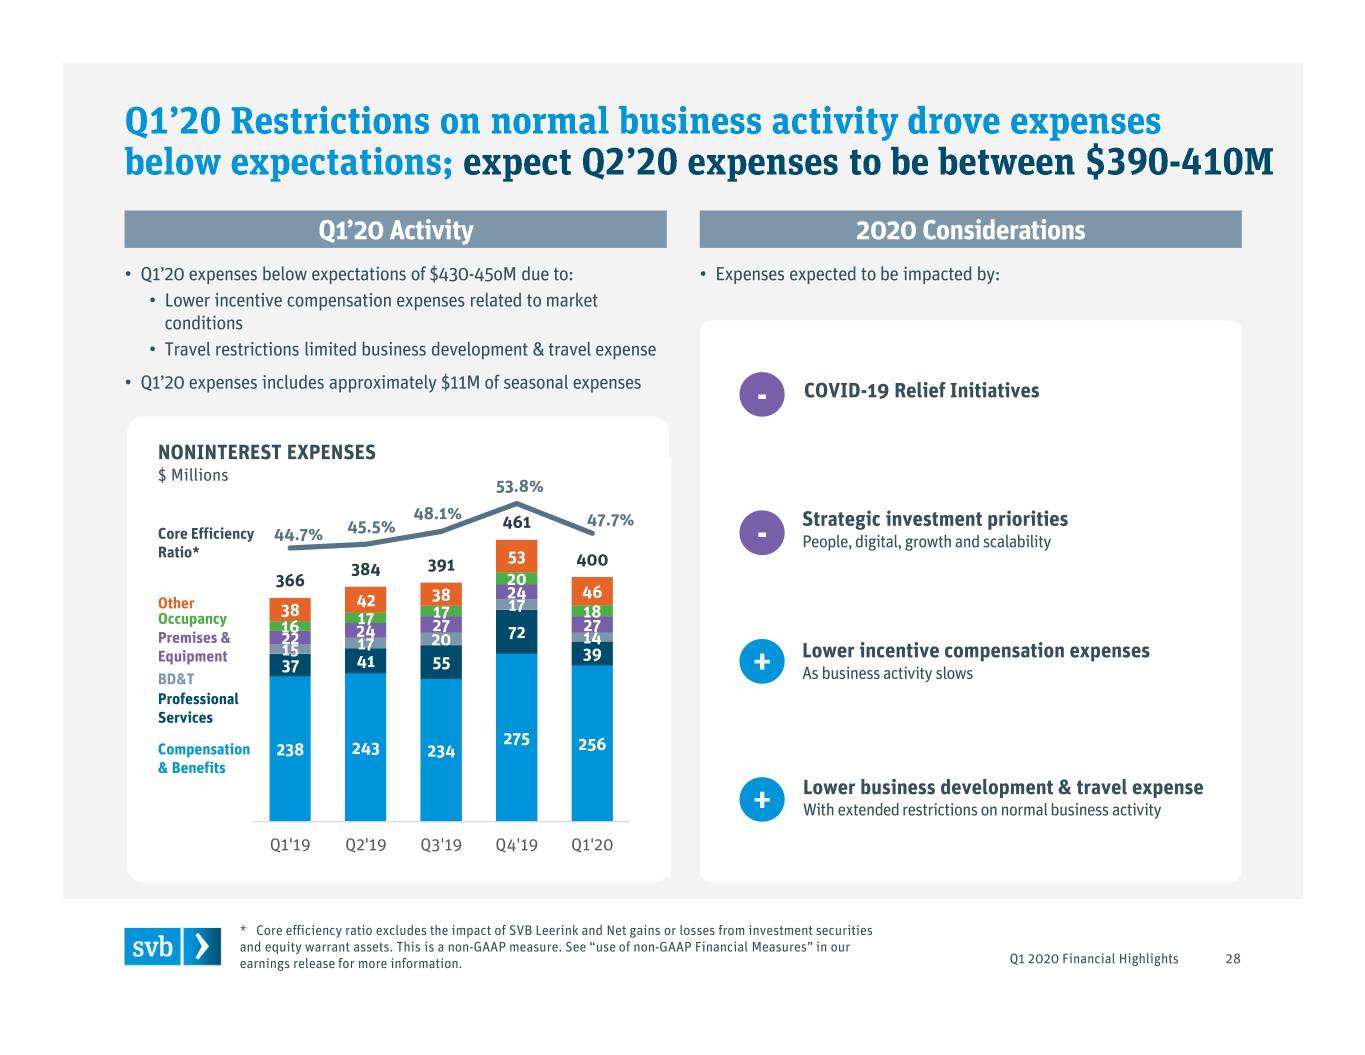
Core Efficiency Ratio*
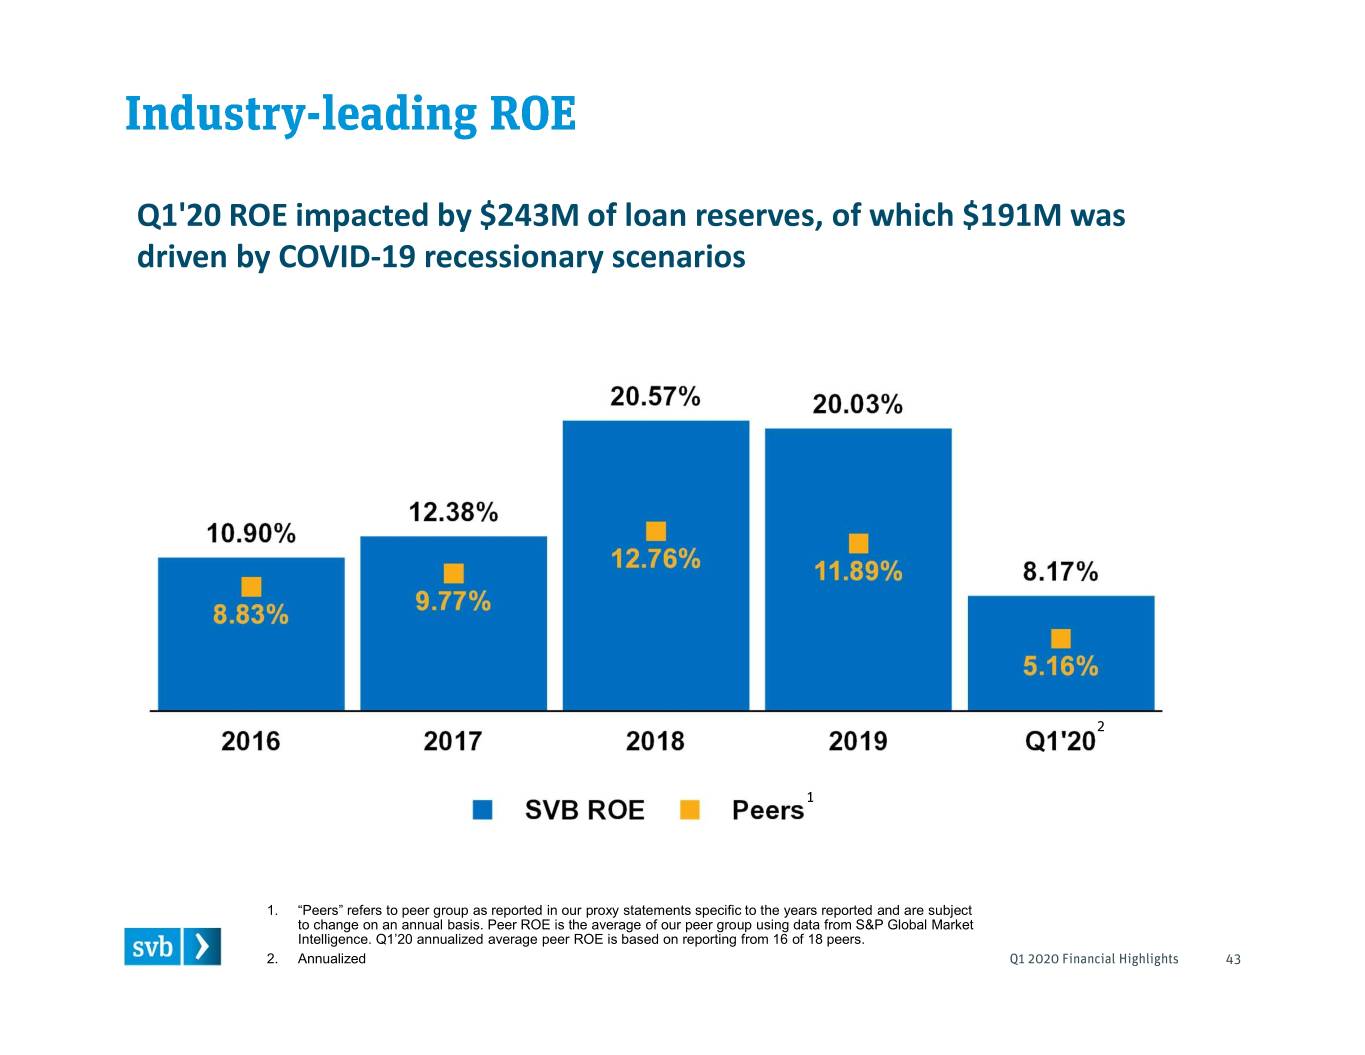
Q1'20 ROE impacted by $243M of loan reserves, of which $191M was driven by COVID-19 recessionary scenarios 1. “Peers” refers to peer group as reported in our proxy statements specific to the years reported and are subject to change on an annual basis. Peer ROE is the average of our peer group using data from S&P Global Market Intelligence. Q1’20 annualized average peer ROE is based on reporting from 16 of 18 peers. 2. Annualized
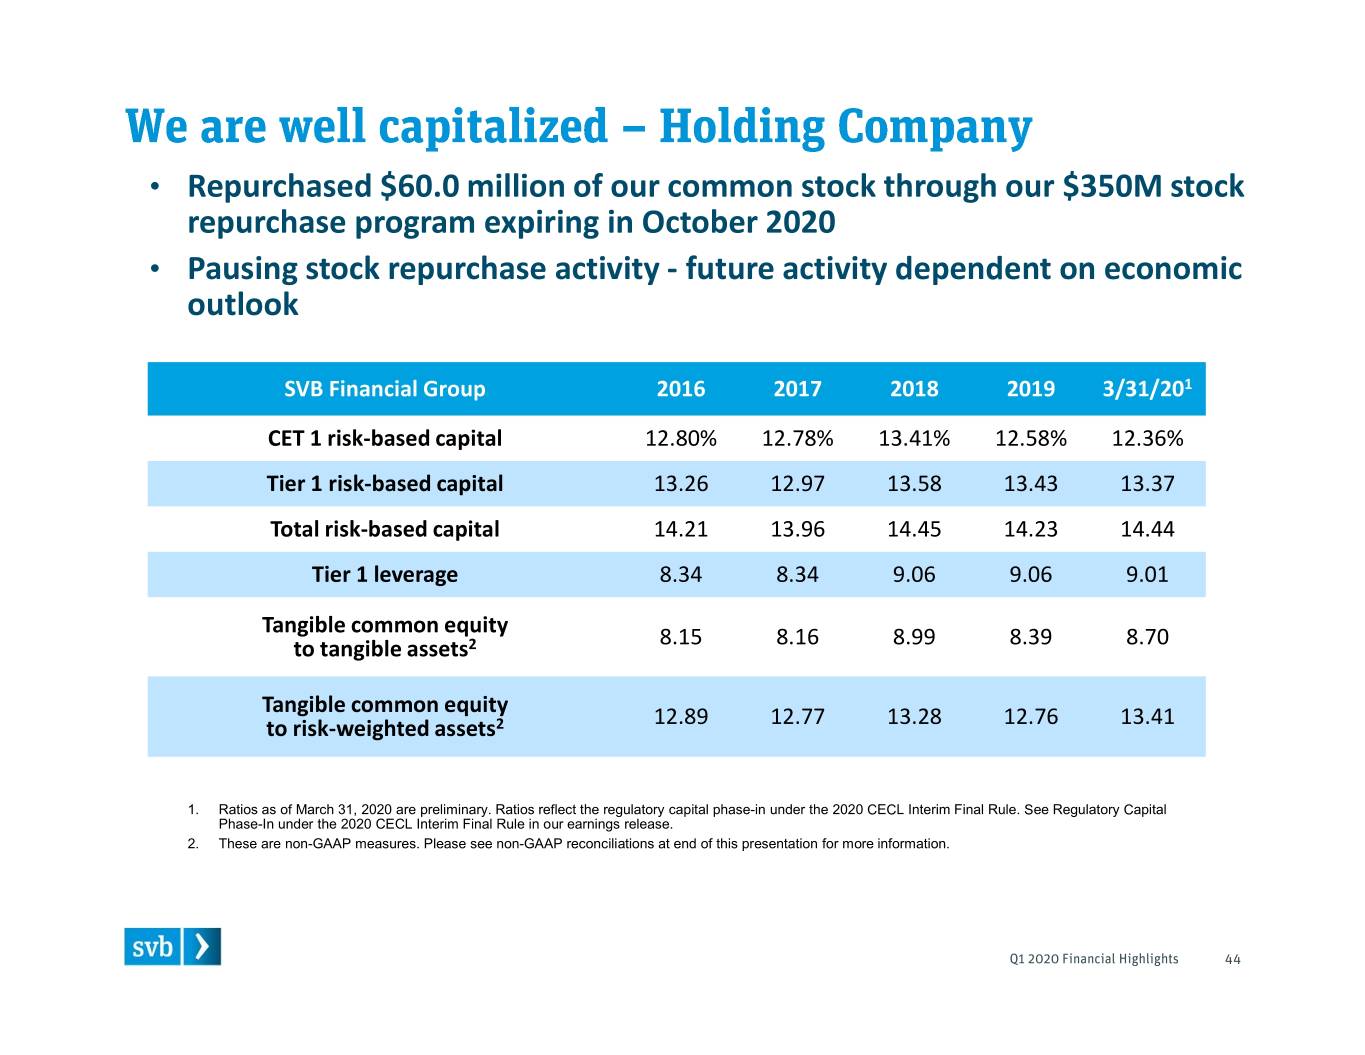
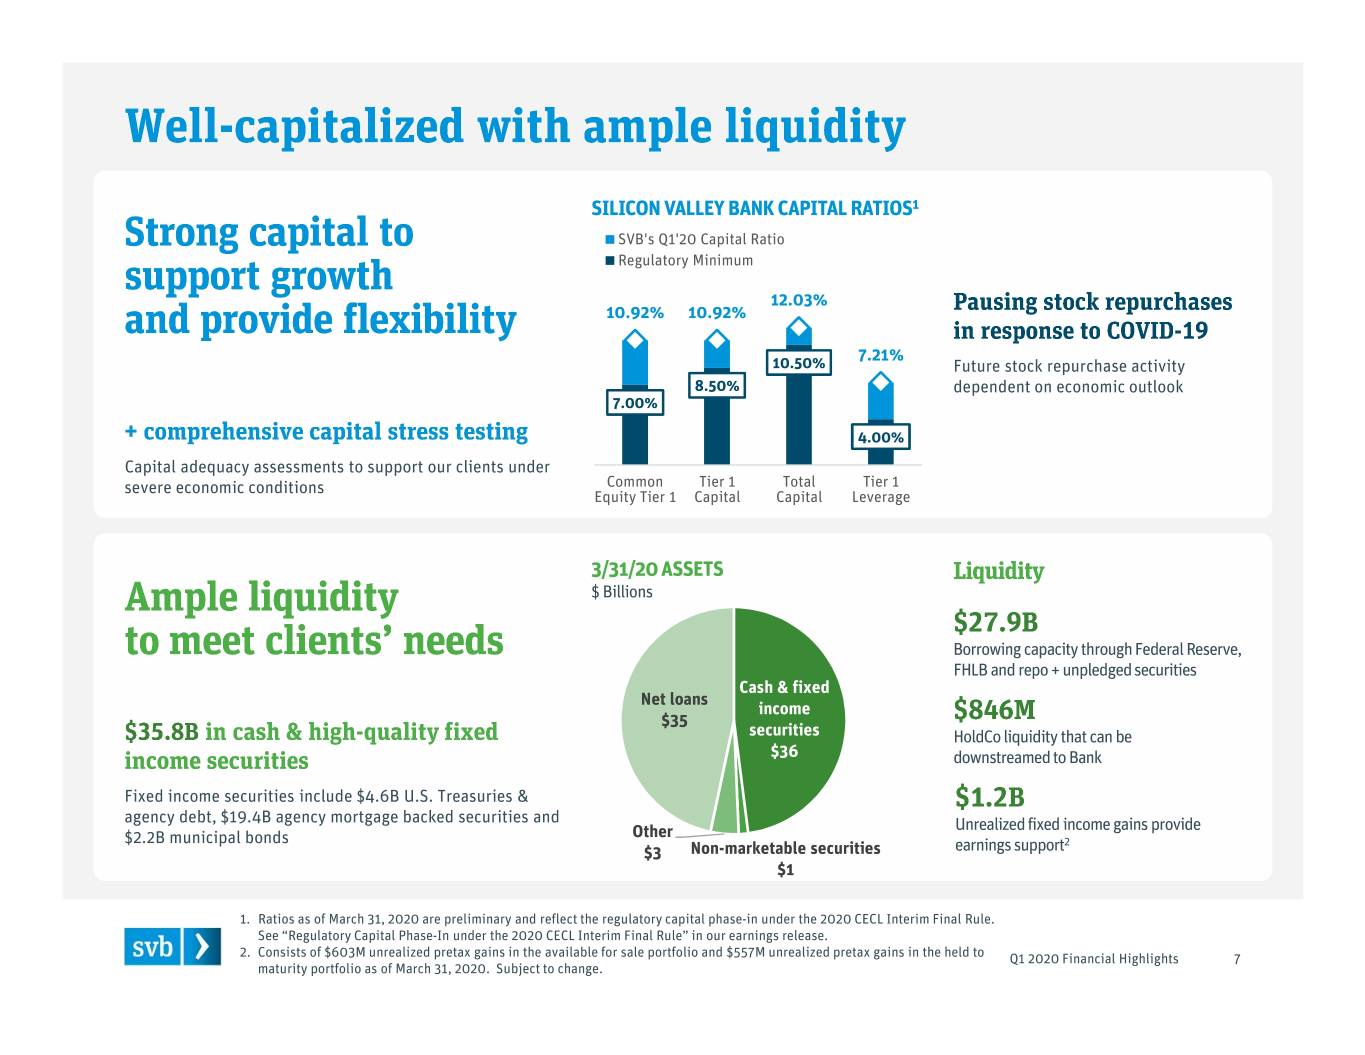
• Repurchased $60.0 million of our common stock through our $350M stock repurchase program expiring in October 2020 • Pausing stock repurchase activity - future activity dependent on economic outlook SVB Financial Group 2016 2017 2018 2019 3/31/201 CET 1 risk-based capital 12.80% 12.78% 13.41% 12.58% 12.36% Tier 1 risk-based capital 13.26 12.97 13.58 13.43 13.37 Total risk-based capital 14.21 13.96 14.45 14.23 14.44 Tier 1 leverage 8.34 8.34 9.06 9.06 9.01 Tangible common equity to tangible assets2 8.15 8.16 8.99 8.39 8.70 Tangible common equity to risk-weighted assets2 12.89 12.77 13.28 12.76 13.41 1. Ratios as of March 31, 2020 are preliminary. Ratios reflect the regulatory capital phase-in under the 2020 CECL Interim Final Rule. See Regulatory Capital Phase-In under the 2020 CECL Interim Final Rule in our earnings release. 2. These are non-GAAP measures. Please see non-GAAP reconciliations at end of this presentation for more information.
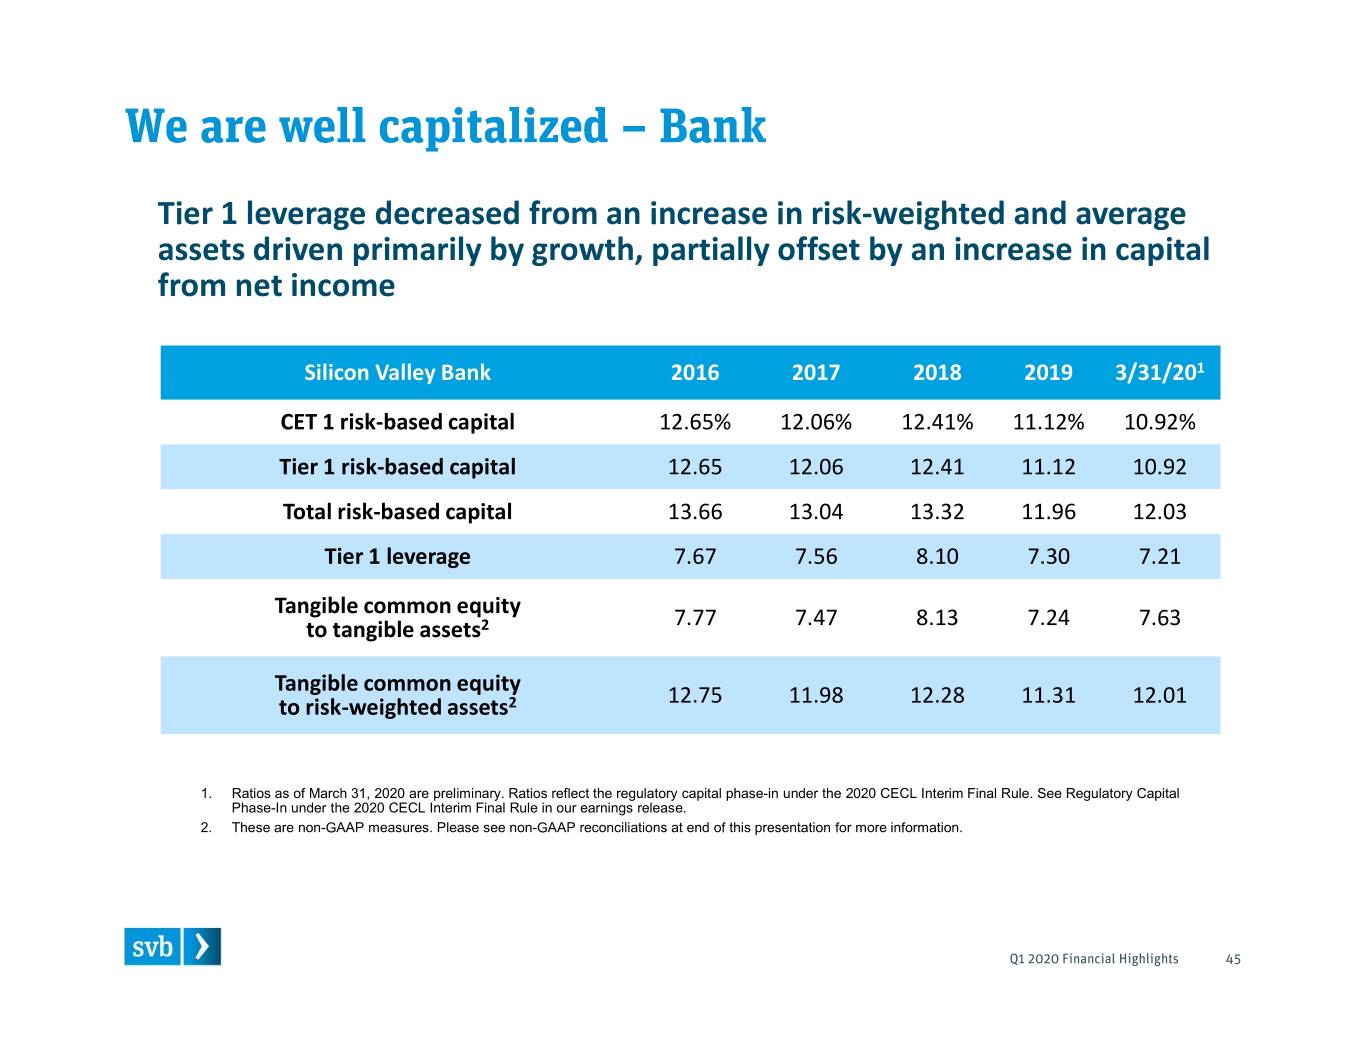
Tier 1 leverage decreased from an increase in risk-weighted and average assets driven primarily by growth, partially offset by an increase in capital from net income Silicon Valley Bank 2016 2017 2018 2019 3/31/201 CET 1 risk-based capital 12.65% 12.06% 12.41% 11.12% 10.92% Tier 1 risk-based capital 12.65 12.06 12.41 11.12 10.92 Total risk-based capital 13.66 13.04 13.32 11.96 12.03 Tier 1 leverage 7.67 7.56 8.10 7.30 7.21 Tangible common equity to tangible assets2 7.77 7.47 8.13 7.24 7.63 Tangible common equity to risk-weighted assets2 12.75 11.98 12.28 11.31 12.01 1. Ratios as of March 31, 2020 are preliminary. Ratios reflect the regulatory capital phase-in under the 2020 CECL Interim Final Rule. See Regulatory Capital Phase-In under the 2020 CECL Interim Final Rule in our earnings release. 2. These are non-GAAP measures. Please see non-GAAP reconciliations at end of this presentation for more information.
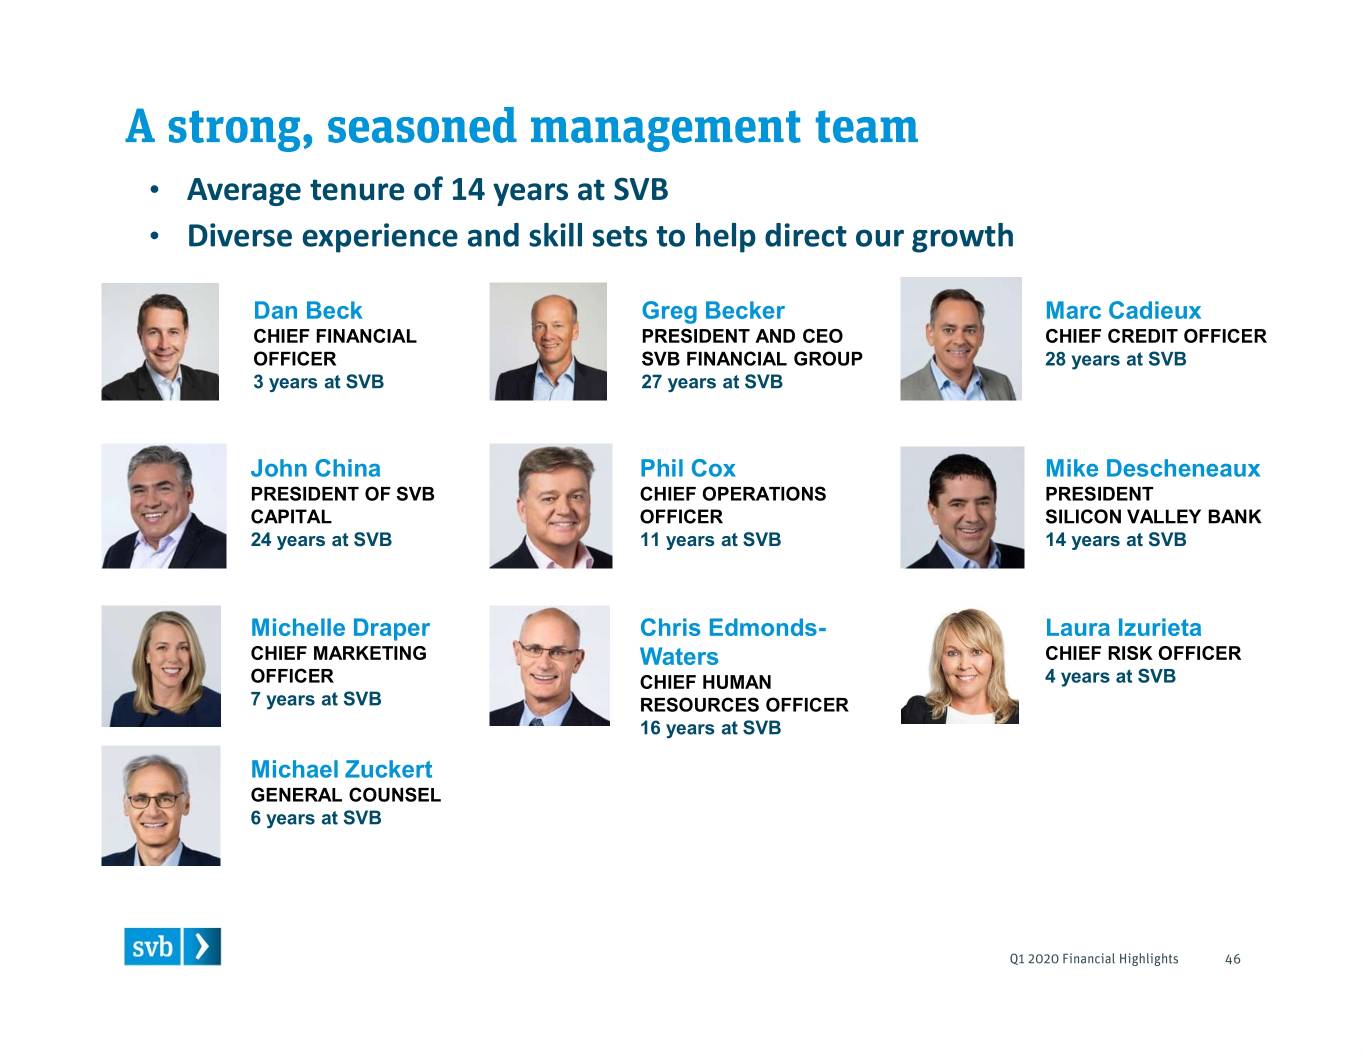
• Average tenure of 14 years at SVB • Diverse experience and skill sets to help direct our growth Dan Beck Greg Becker Marc Cadieux CHIEF FINANCIAL PRESIDENT AND CEO CHIEF CREDIT OFFICER OFFICER SVB FINANCIAL GROUP 28 years at SVB 3 years at SVB 27 years at SVB John China Phil Cox Mike Descheneaux PRESIDENT OF SVB CHIEF OPERATIONS PRESIDENT CAPITAL OFFICER SILICON VALLEY BANK 24 years at SVB 11 years at SVB 14 years at SVB Michelle Draper Chris Edmonds- Laura Izurieta CHIEF MARKETING Waters CHIEF RISK OFFICER OFFICER CHIEF HUMAN 4 years at SVB 7 years at SVB RESOURCES OFFICER 16 years at SVB Michael Zuckert GENERAL COUNSEL 6 years at SVB
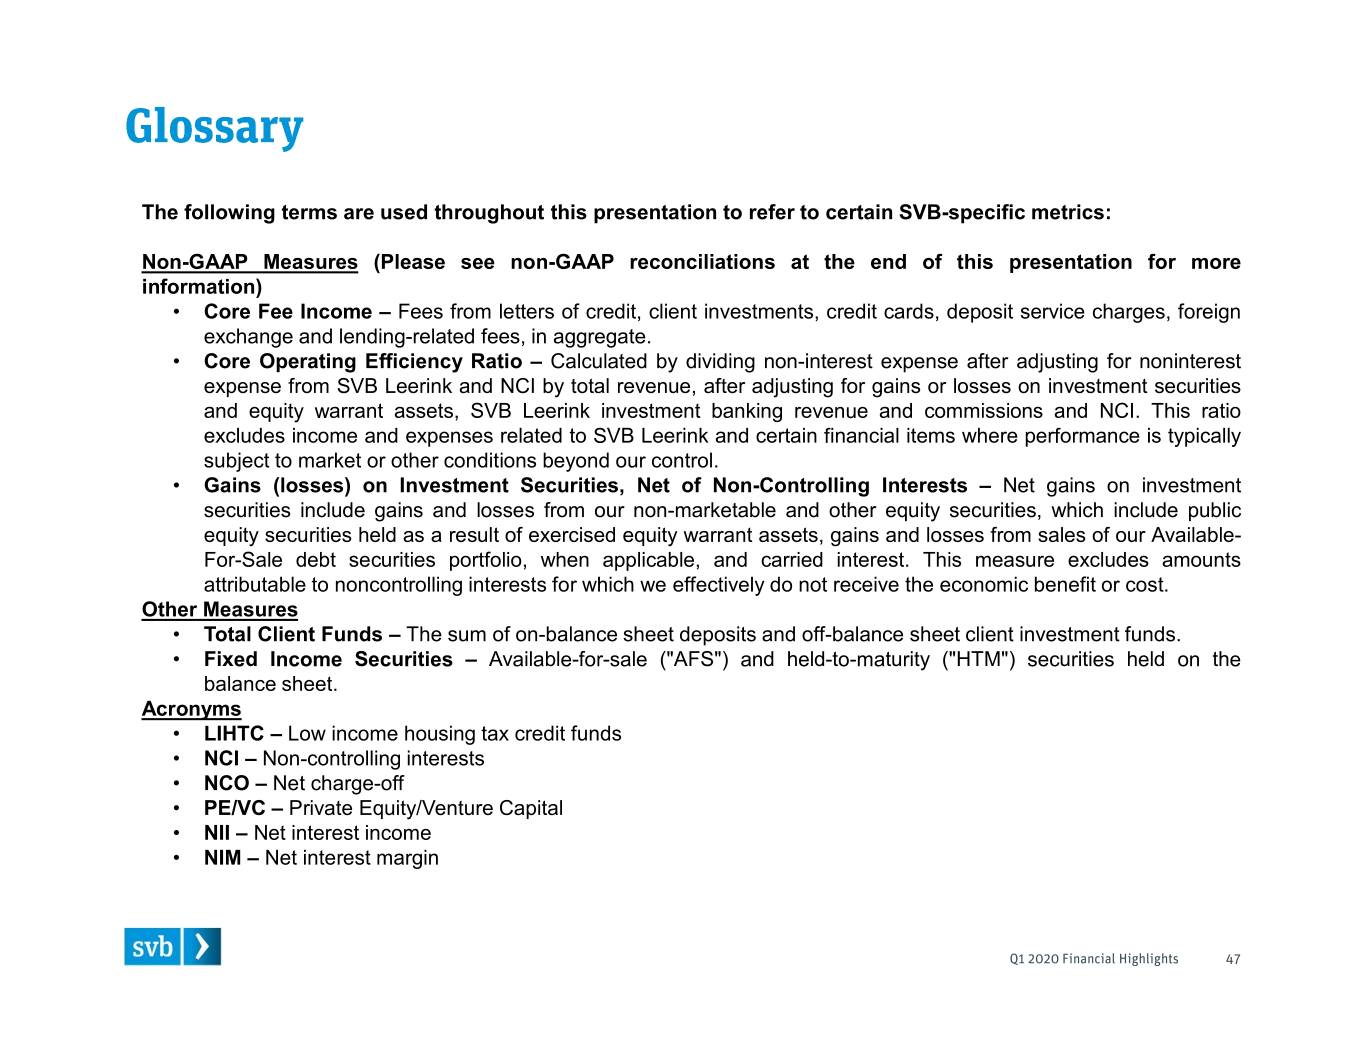
The following terms are used throughout this presentation to refer to certain SVB-specific metrics: Non-GAAP Measures (Please see non-GAAP reconciliations at the end of this presentation for more information) • Core Fee Income – Fees from letters of credit, client investments, credit cards, deposit service charges, foreign exchange and lending-related fees, in aggregate. • Core Operating Efficiency Ratio – Calculated by dividing non-interest expense after adjusting for noninterest expense from SVB Leerink and NCI by total revenue, after adjusting for gains or losses on investment securities and equity warrant assets, SVB Leerink investment banking revenue and commissions and NCI. This ratio excludes income and expenses related to SVB Leerink and certain financial items where performance is typically subject to market or other conditions beyond our control. • Gains (losses) on Investment Securities, Net of Non-Controlling Interests – Net gains on investment securities include gains and losses from our non-marketable and other equity securities, which include public equity securities held as a result of exercised equity warrant assets, gains and losses from sales of our Available- For-Sale debt securities portfolio, when applicable, and carried interest. This measure excludes amounts attributable to noncontrolling interests for which we effectively do not receive the economic benefit or cost. Other Measures • Total Client Funds – The sum of on-balance sheet deposits and off-balance sheet client investment funds. • Fixed Income Securities – Available-for-sale ("AFS") and held-to-maturity ("HTM") securities held on the balance sheet. Acronyms • LIHTC – Low income housing tax credit funds • NCI – Non-controlling interests • NCO – Net charge-off • PE/VC – Private Equity/Venture Capital • NII – Net interest income • NIM – Net interest margin
Non-GAAP Reconciliations
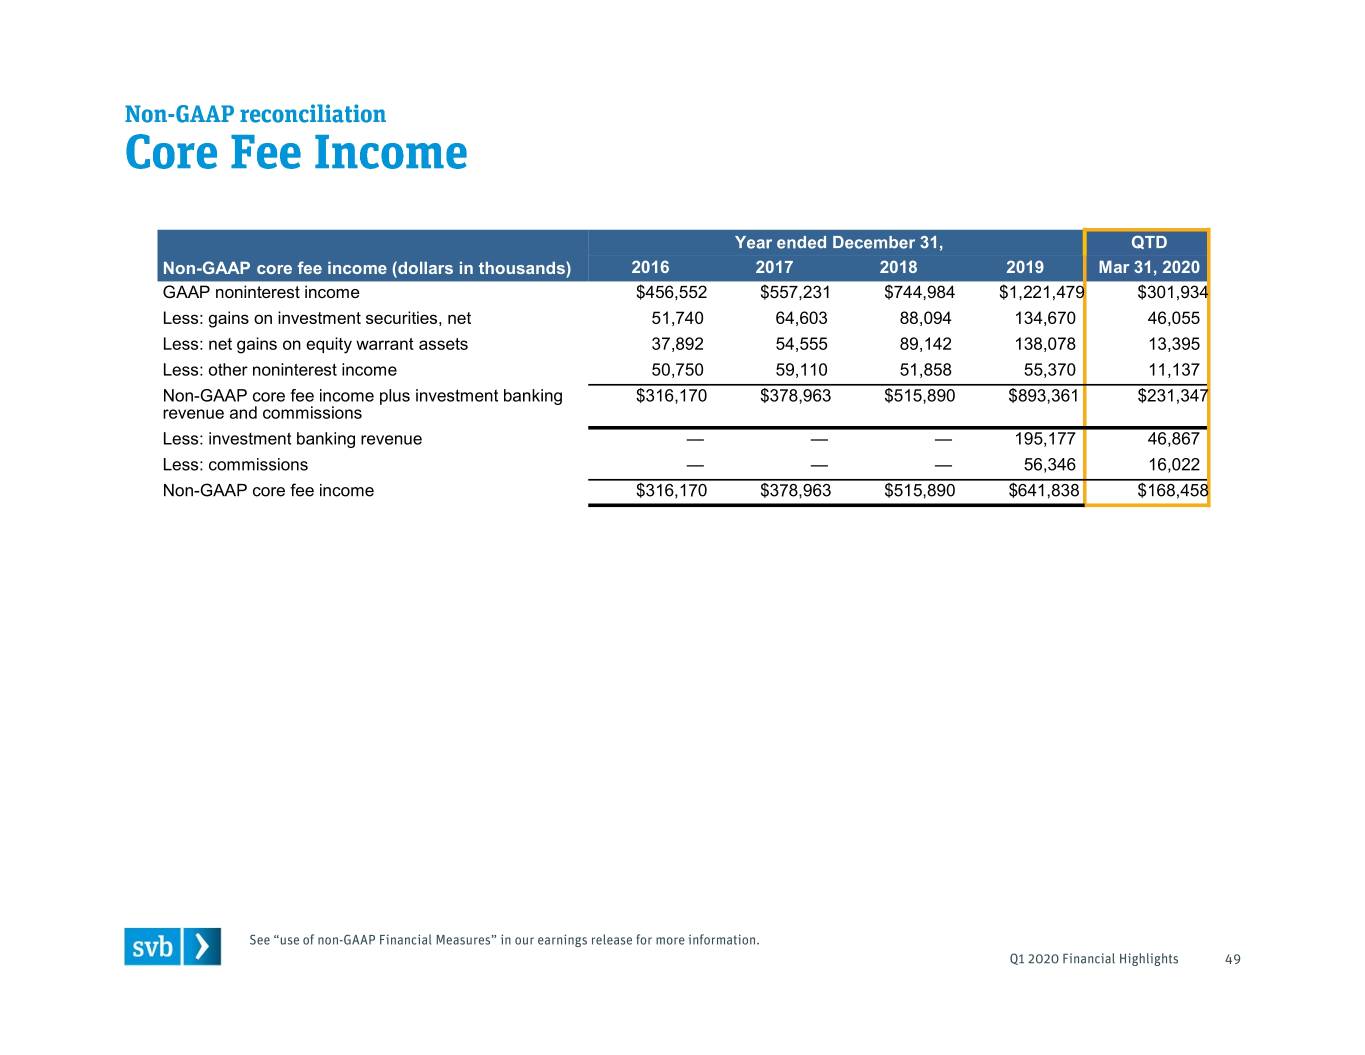
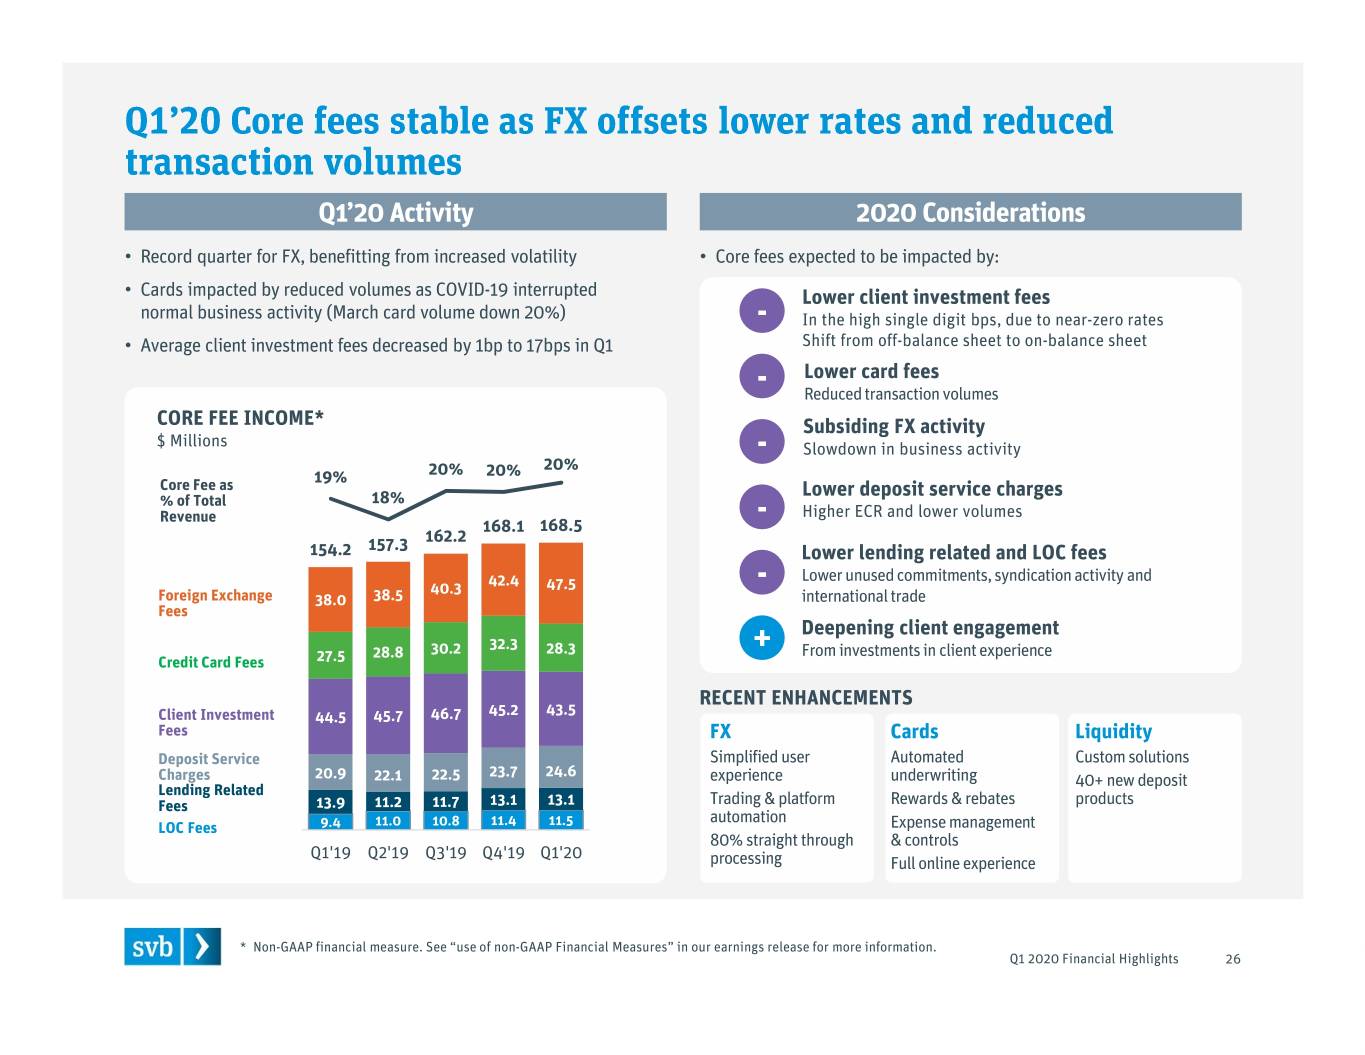
Year ended December 31, QTD Non-GAAP core fee income (dollars in thousands) 2016 2017 2018 2019 Mar 31, 2020 GAAP noninterest income $456,552 $557,231 $744,984 $1,221,479 $301,934 Less: gains on investment securities, net 51,740 64,603 88,094 134,670 46,055 Less: net gains on equity warrant assets 37,892 54,555 89,142 138,078 13,395 Less: other noninterest income 50,750 59,110 51,858 55,370 11,137 Non-GAAP core fee income plus investment banking $316,170 $378,963 $515,890 $893,361 $231,347 revenue and commissions Less: investment banking revenue — — — 195,177 46,867 Less: commissions — — — 56,346 16,022 Non-GAAP core fee income $316,170 $378,963 $515,890 $641,838 $168,458
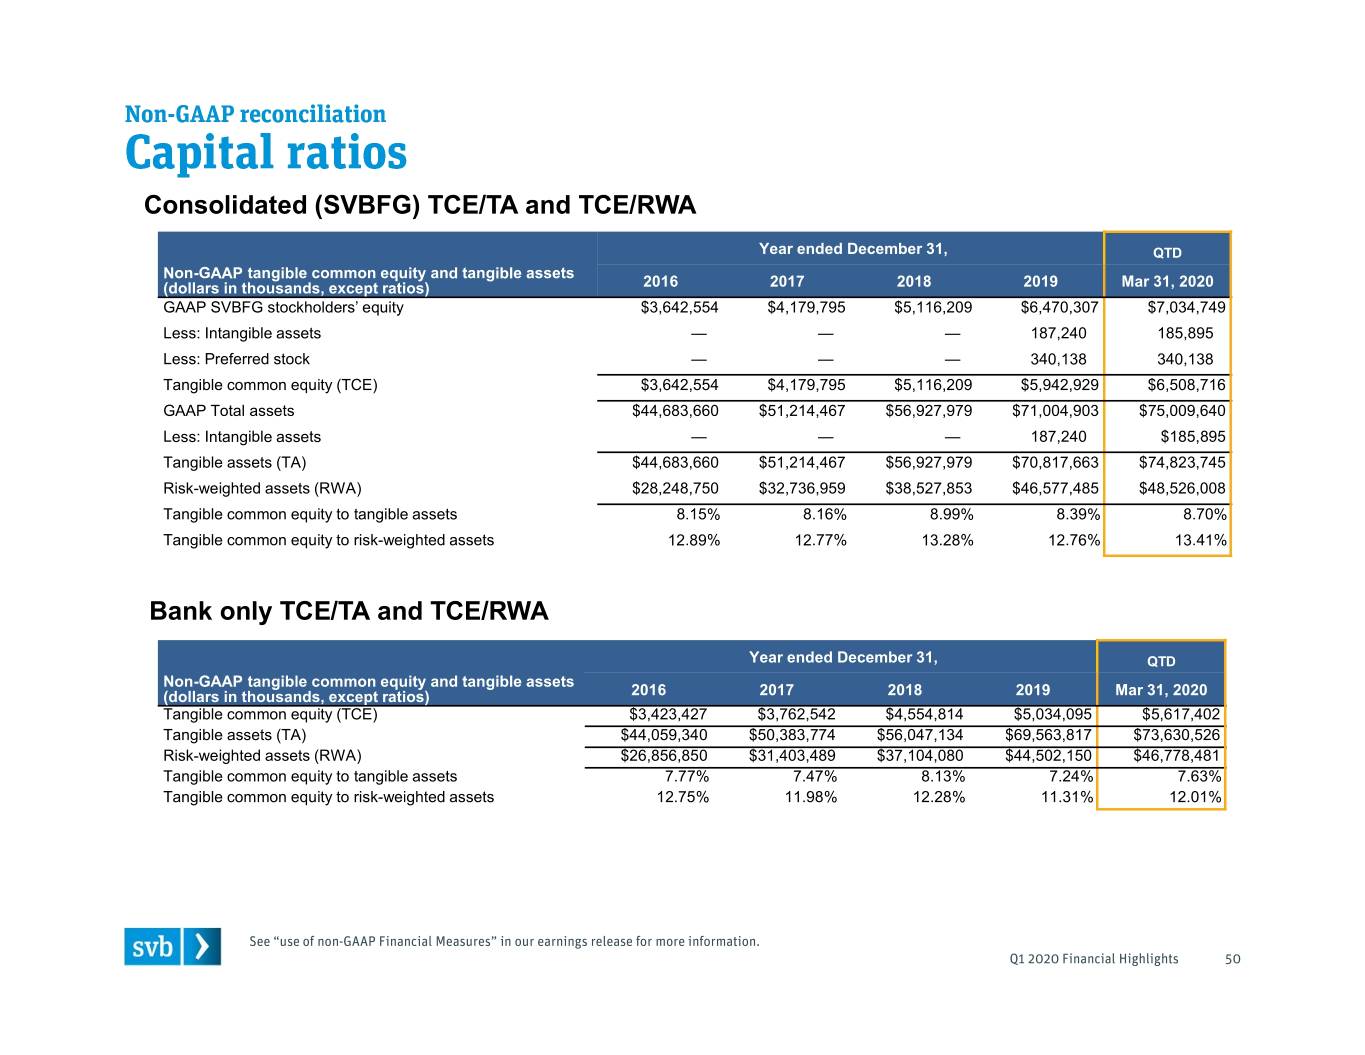
Consolidated (SVBFG) TCE/TA and TCE/RWA Year ended December 31, QTD Non-GAAP tangible common equity and tangible assets (dollars in thousands, except ratios) 2016 2017 2018 2019 Mar 31, 2020 GAAP SVBFG stockholders’ equity $3,642,554 $4,179,795 $5,116,209 $6,470,307 $7,034,749 Less: Intangible assets — — — 187,240 185,895 Less: Preferred stock — — — 340,138 340,138 Tangible common equity (TCE) $3,642,554 $4,179,795 $5,116,209 $5,942,929 $6,508,716 GAAP Total assets $44,683,660 $51,214,467 $56,927,979 $71,004,903 $75,009,640 Less: Intangible assets — — — 187,240 $185,895 Tangible assets (TA) $44,683,660 $51,214,467 $56,927,979 $70,817,663 $74,823,745 Risk-weighted assets (RWA) $28,248,750 $32,736,959 $38,527,853 $46,577,485 $48,526,008 Tangible common equity to tangible assets 8.15% 8.16% 8.99% 8.39% 8.70% Tangible common equity to risk-weighted assets 12.89% 12.77% 13.28% 12.76% 13.41% Bank only TCE/TA and TCE/RWA Year ended December 31, QTD Non-GAAP tangible common equity and tangible assets (dollars in thousands, except ratios) 2016 2017 2018 2019 Mar 31, 2020 Tangible common equity (TCE) $3,423,427 $3,762,542 $4,554,814 $5,034,095 $5,617,402 Tangible assets (TA) $44,059,340 $50,383,774 $56,047,134 $69,563,817 $73,630,526 Risk-weighted assets (RWA) $26,856,850 $31,403,489 $37,104,080 $44,502,150 $46,778,481 Tangible common equity to tangible assets 7.77% 7.47% 8.13% 7.24% 7.63% Tangible common equity to risk-weighted assets 12.75% 11.98% 12.28% 11.31% 12.01%
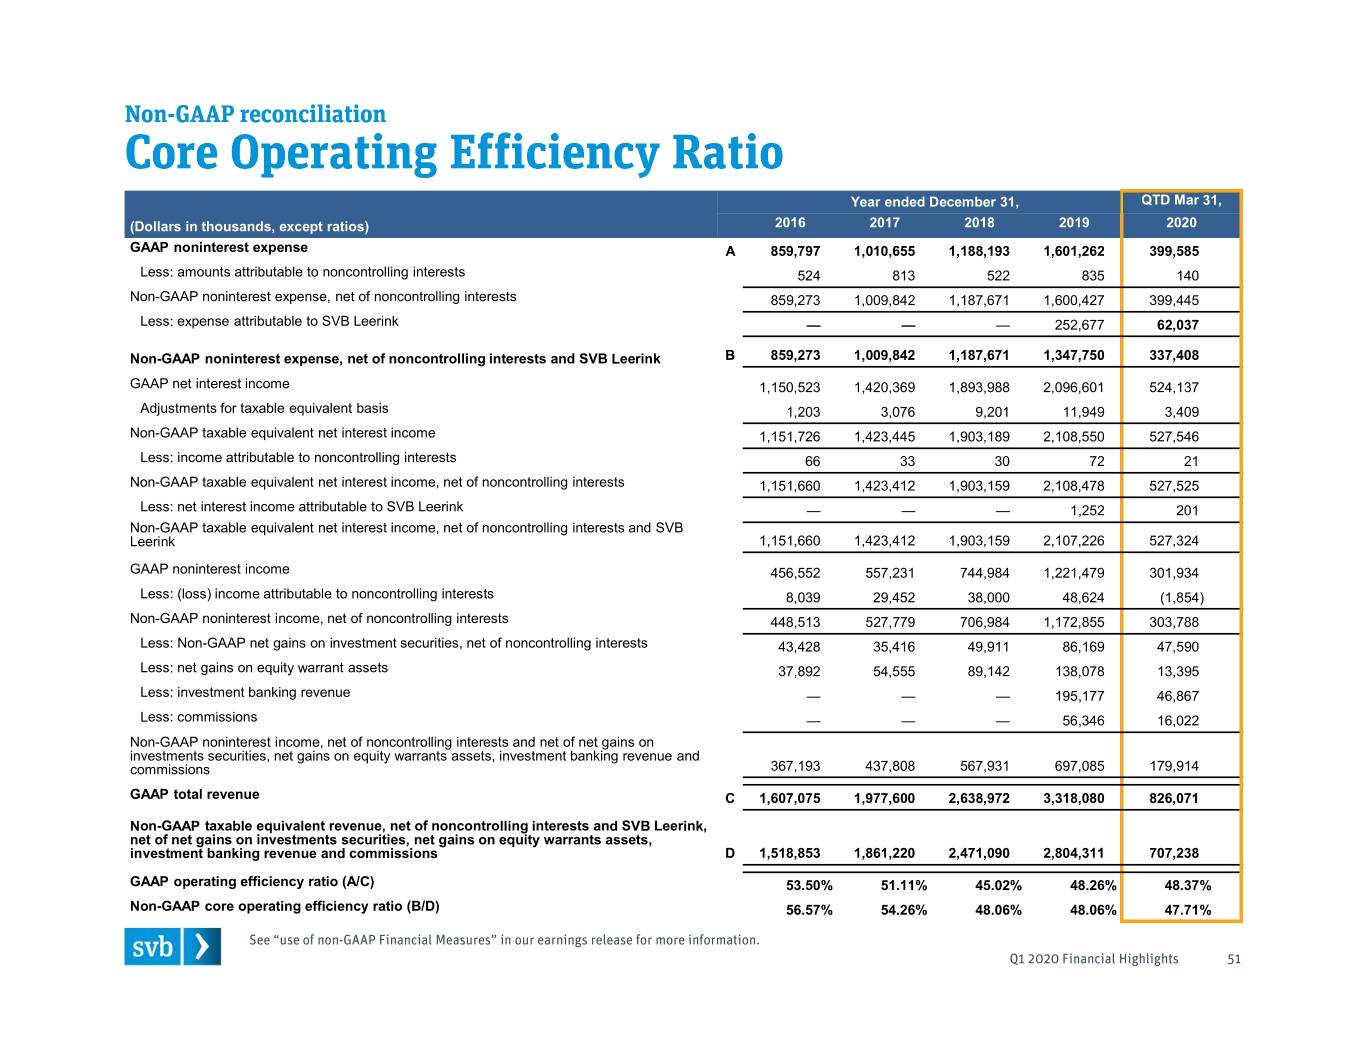
Year ended December 31, QTD Mar 31, (Dollars in thousands, except ratios) 2016 2017 2018 2019 2020 GAAP noninterest expense A 859,797 1,010,655 1,188,193 1,601,262 399,585 Less: amounts attributable to noncontrolling interests 524 813 522 835 140 Non-GAAP noninterest expense, net of noncontrolling interests 859,273 1,009,842 1,187,671 1,600,427 399,445 Less: expense attributable to SVB Leerink —— — 252,677 62,037 Non-GAAP noninterest expense, net of noncontrolling interests and SVB Leerink B 859,273 1,009,842 1,187,671 1,347,750 337,408 GAAP net interest income 1,150,523 1,420,369 1,893,988 2,096,601 524,137 Adjustments for taxable equivalent basis 1,203 3,076 9,201 11,949 3,409 Non-GAAP taxable equivalent net interest income 1,151,726 1,423,445 1,903,189 2,108,550 527,546 Less: income attributable to noncontrolling interests 66 33 30 72 21 Non-GAAP taxable equivalent net interest income, net of noncontrolling interests 1,151,660 1,423,412 1,903,159 2,108,478 527,525 Less: net interest income attributable to SVB Leerink — — — 1,252 201 Non-GAAP taxable equivalent net interest income, net of noncontrolling interests and SVB Leerink 1,151,660 1,423,412 1,903,159 2,107,226 527,324 GAAP noninterest income 456,552 557,231 744,984 1,221,479 301,934 Less: (loss) income attributable to noncontrolling interests 8,039 29,452 38,000 48,624 (1,854) Non-GAAP noninterest income, net of noncontrolling interests 448,513 527,779 706,984 1,172,855 303,788 Less: Non-GAAP net gains on investment securities, net of noncontrolling interests 43,428 35,416 49,911 86,169 47,590 Less: net gains on equity warrant assets 37,892 54,555 89,142 138,078 13,395 Less: investment banking revenue — — — 195,177 46,867 Less: commissions — — — 56,346 16,022 Non-GAAP noninterest income, net of noncontrolling interests and net of net gains on investments securities, net gains on equity warrants assets, investment banking revenue and commissions 367,193 437,808 567,931 697,085 179,914 GAAP total revenue C 1,607,075 1,977,600 2,638,972 3,318,080 826,071 Non-GAAP taxable equivalent revenue, net of noncontrolling interests and SVB Leerink, net of net gains on investments securities, net gains on equity warrants assets, investment banking revenue and commissions D 1,518,853 1,861,220 2,471,090 2,804,311 707,238 GAAP operating efficiency ratio (A/C) 53.50% 51.11% 45.02% 48.26% 48.37% Non-GAAP core operating efficiency ratio (B/D) 56.57% 54.26% 48.06% 48.06% 47.71%
