Attached files
| file | filename |
|---|---|
| EX-99.1 - PRESS RELEASE - Consolidated Communications Holdings, Inc. | exh_991.htm |
| 8-K - FORM 8-K - Consolidated Communications Holdings, Inc. | f8k_043020.htm |
EXHIBIT 99.2

Q1 2020 Earnings April 3 0, 2020

Safe Harbor The Securities and Exchange Commission (“SEC”) encourages companies to disclose forward - looking information so that investors ca n better understand a company’s future prospects and make informed investment decisions. Certain statements in this communication are forward - looki ng statements and are made pursuant to the safe harbor provisions of the Securities Litigation Reform Act of 1995. These forward - looking statemen ts reflect, among other things, our current expectations, plans, strategies, and anticipated financial results. There are a number of risks, uncertaint ies, and conditions that may cause our actual results to differ materially from those expressed or implied by these forward - looking statements. These risks and uncertainties include a number of factors related to our business, including the uncertainties relating to the impact of the novel coronavirus (COVID - 19 ) pandemic on the company’s business, results of operations, cash flows, stock price and employees; economic and financial market conditions ge ner ally and economic conditions in our service areas; various risks to the price and volatility of our common stock; changes in the valuation of pen sion plan assets; the substantial amount of debt and our ability to repay or refinance it or incur additional debt in the future; our need for a si gni ficant amount of cash to service and repay the debt restrictions contained in our debt agreements that limit the discretion of management in operating the busin ess; regulatory changes, including changes to subsidies, rapid development and introduction of new technologies and intense competition in the telecom mun ications industry; risks associated with our possible pursuit of acquisitions; system failures; cyber - attacks, information or security breaches or techno logy failure of ours or of a third party; losses of large customers or government contracts; risks associated with the rights - of - way for the network; disrupt ions in the relationship with third party vendors; losses of key management personnel and the inability to attract and retain highly qualified management a nd personnel in the future; changes in the extensive governmental legislation and regulations governing telecommunications providers and the provision of te lecommunications services; new or changing tax laws or regulations; telecommunications carriers disputing and/or avoiding their obligations to pa y network access charges for use of our network; high costs of regulatory compliance; the competitive impact of legislation and regulatory changes in the telecommunications industry; and liability and compliance costs regarding environmental regulations; and risks associated with discontinuing pay ing dividends on our common stock. A detailed discussion of these and other risks and uncertainties that could cause actual results and events to differ mat erially from such forward - looking statements are discussed in more detail in our filings with the SEC, including our reports on Form 10 - K and Form 10 - Q. Many of these circumstances are beyond our ability to control or predict. Moreover, forward - looking statements necessarily involve assumption s on our part. These forward - looking statements generally are identified by the words “believe,” “expect,” “anticipate,” “estimate,” “project,” “inte nd,” “plan,” “should,” “may,” “will,” “would,” “will be,” “will continue” or similar expressions. Such forward - looking statements involve known and unknown r isks, uncertainties and other factors that may cause actual results, performance or achievements of Consolidated Communications Holdings, Inc. and its subs idi aries to be different from those expressed or implied in the forward - looking statements. All forward - looking statements attributable to us or persons acting on our behalf are expressly qualified in their entirety by the cautionary statements that appear throughout this communication. Furthermore, forw ard - looking statements speak only as of the date they are made. Except as required under the federal securities laws or the rules and regulations of t he SEC, we disclaim any intention or obligation to update or revise publicly any forward - looking statements. You should not place undue reliance on for ward - looking statements.
Non - GAAP Measures This presentation includes certain non - GAAP historical and forward - looking financial measures, including but not limited to “ EBITDA,” “adjusted EBITDA,” “total net debt to last twelve month adjusted EBITDA ratio ,” and “ free cash flow.” In addition to providing key metrics for management to evaluate the Company’s performance, we believes these measurements assist investors in their understanding of operating performance and in identifying historical and prospective trends. A reconciliation of the differences between these non - GAAP financial measures and the most directly comparable financial measures presented in accordance with GAAP are available on the Company’s website at https:// ir.consolidated.com . Non - GAAP measures are not presented to be replacements or alternatives to the GAAP measures, and investors are urged to consider these non - GAAP measures i n addition to, and not in substitution for, measures prepared in accordance with GAAP. Consolidated may present or calculate i ts non - GAAP measures differently from other companies. Consolidated has filed a Form 8 - K reporting the quarterly results for the first quarter of 2020. The 8 - K must be read in conjun ction with this presentation and contains additional important details on the quarterly results. .

• Consumer telecommuting services, bandwidth upgrades, home entertainment • Student Support Program; Keep America Connected; payment flexibility • Commercial bandwidth upgrades, expedite orders, virtualization applications, communications & collaboration, network s ecurity, data center services • No data cap policy • Changing how we do business; further opportunities to gain efficiencies • Consumer order activity up; broadband and bandwidth upgrades • Commercial & Carrier bandwidth upgrades and expedite orders, pressure on small business, slowed equipment sales • Economic impacts unclear; due to lack of visibility Company is withdrawing 2020 financial guidance COVID - 19 Update Company Preparedness and Response • Focused on the safety and health of our employees, customers, business partners • Transitioned to remote work for 60% of employees (90% of office employees) • Provided field employees PPE, implemented social distancing and protection protocols • Currently operating within Pandemic Plan; Response Phase with a focus on business continuity and planning for Recovery Phase Supporting Our Customers COVID - 19 Business I mpacts and I mplications

Consolidated Strategic Imperatives Execute on Disciplined Capital Allocation Plan • Pay down debt to achieve 2020 YE leverage target of <4x net debt to Adjusted EBITDA; refinance no later than mid - 2021 • Utilize substantially all free cash flow to delever and strengthen the balance sheet Leverage Fiber Assets Across Three Customer Groups • Top 10 fiber provider in the U.S.; 23 states; 37,750 fiber route miles • Consumer, Commercial and Carrier growth opportunities • Competitive , next - generation products and services Stabilize EBITDA; Grow Free Cash Flow • Produce stable earnings and cash flow; disciplined investments with the highest return • Strong cash flow generated from wireless partnerships ~$36M in 2019 Strategic Asset Portfolio Review • Continue to evaluate assets for investment or monetization and to ensure all assets have a long - term, strategic fit

First Quarter 2020 Highlights Improving Revenue Trajectory; Achieved stable Adjusted EBITDA Results • Revenue totaled $ 325.7M • Net cash from operating activities was $85.0M • Adjusted EBITDA was $ 131.6M • Cost management; operating expenses declined $17.1M or 7.7% Leveraging Fiber Assets Across Three Customer Groups for Strategic Growth • Data & Transport revenue grew 1.6% • Broadband revenue grew 1.6% • Fiber lit buildings increased 17.1% and 770 fiber - route miles added • Fiber connections to wireless carriers under contract up 4.2% • VoIP revenue increased 13.9% Clear Progress on Capital Allocation Plan • Reduced debt by $43M in Q1; $105.2M since announcing capital allocation plan • Lowered net debt ratio to 4.23x Q1 - 2020 as compared to Q1 - 2019

First Quarter 2020 Results • Improved revenue trends in Q1 driven by broadband and data/transport growth; higher voice retention • Adjusted EBITDA margins improved as a result of improved cost structure, technology and process improvements $ in millions • Cost management resulted in 8 % or $17.1M reduction in operating expenses • Wireless cash distributions totaled $10.1M in Q1 Q1 - 20 Y/Y Total Revenue $325.7 (3.8%) Adjusted EBITDA $131.6 1.0% Adjusted EBITDA margin 40.4% 1.9%
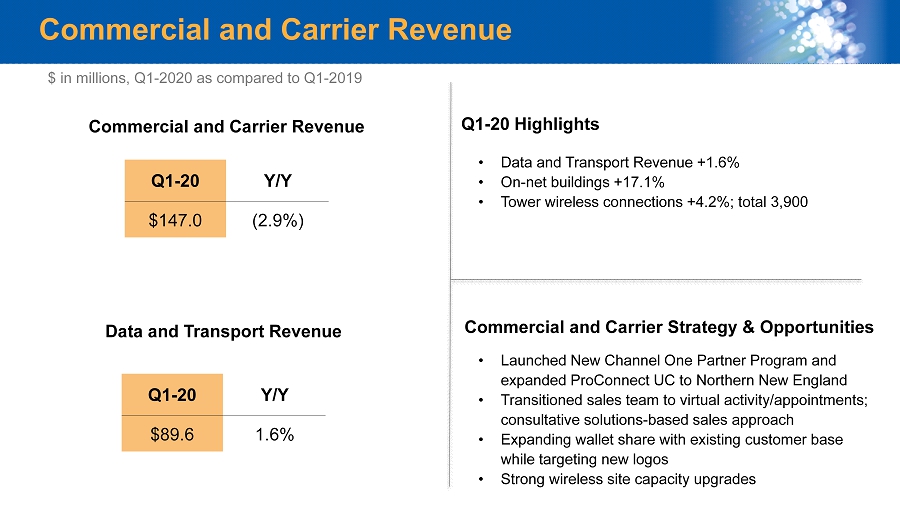
Commercial and Carrier Revenue Data and Transport Revenue $ in millions, Q1 - 2020 as compared to Q1 - 2019 • Data and Transport Revenue +1.6% • On - net buildings +17.1% • Tower wireless connections +4.2%; total 3,900 • Launched New Channel One Partner Program and expanded ProConnect UC to Northern New England • Transitioned sales team to virtual activity/appointments; consultative solutions - based sales approach • Expanding wallet share with existing customer base while targeting new logos • Strong wireless site capacity upgrades Q1 - 20 Highlights Commercial and Carrier Strategy & Opportunities Commercial and Carrier Revenue Q1 - 20 Y/Y $147.0 (2.9%) Q1 - 20 Y/Y $89.6 1.6%

Consumer Revenue • Consumer broadband revenue +1.6% • Consumer ARPU +4.5% • Voice revenue decline improved from 11.9% in Q1 - 19 to 5.9% in Q1 - 20 • Stable installation intervals and improved service experience • CCiTV driving speed upgrades and broadband adds • Lead with broadband, upgrade to faster speeds: 750k homes passed upgraded in past two years • Increase consumer ARPU; reduce churn • Leverage public - private partnerships to expand broadband services economically • CCiTV expansion to new markets in 2020 Broadband Revenue Q1 - 20 Highlights Consumer Strategy and Opportunities Q1 - 20 Y/Y $64.1 1.6% Consumer ARPU $ in millions, Q1 - 2020 as compared to Q1 - 2019 $70.44 $73.52 $70.17 $73.32 Q4-18 Q4-19 Q1-19 Q1-20 + 4.5% + 4.4%

Capital Allocation Plan Focused on Deleveraging First • Target substantially all free cash flow to debt reduction • Focus on maximizing cash position and liquidity • Continue to evaluate opportunistic open market purchases of bonds due 2022 • Target <4x net debt to adjusted EBITDA by 2020 YE Disciplined Capital I nvestments • 60% success - based; 40% maintenance Evaluation of Assets • Review assets for investment or monetization to ensure all assets have a long - term, strategic fit • Senior t erm loan $1,775M; 3% plus LIBOR • Senior unsecured notes $439M; 6.5% • Revolver capacity: $110M: 3% plus 1% LIBOR floor • Refinance no later than mid - 2021 $110 $ 439 $ 1,775 2019 2020 2021 2022 2023 Debt Maturity Profile Revolver Senior Notes Term Loan $ in millions

Capital Investments Driving Highest Returns Investing in Projects with Highest Returns • Capital expenditures support carrier, commercial and broadband success - based, fiber projects • Upgraded 750,000+ passings in last two years; representing 34% of consumer passings . Investments supported broadband revenue and ARPU growth. • Lit buildings increased 17.1% driven by market expansion • Added 770 fiber route miles Capex Q1 - 20 Success - Based: $30 Commercial / Carrier $9 Consumer $21 Other $12 Total $42 $ in millions

Free Cash Flow (1) Includes acquisition and non - recurring related costs, and certain miscellaneous items. Q1 - 20 Adjusted EBITDA $ 131.6 Interest Payments (24.3) Pension and OPEB Payments (8.0) Restructuring, Severance and Other (1) (0.5) Income Tax Payments, net of refunds (0.3) Working Capital and Other (13.5) Cash provided by Operating Activities $ 85.0 Capital expenditures (42.4) Proceeds from sale of assets 2.2 Free Cash Flow $ 44.8 $ in millions

Q&A Q1 2020 Earnings