Attached files
| file | filename |
|---|---|
| 8-K - CTBI 2020 SHAREHOLDERS' PRESENTATION 8-K - COMMUNITY TRUST BANCORP INC /KY/ | ctbi8kshrpres2020.htm |
Exhibit 99.1
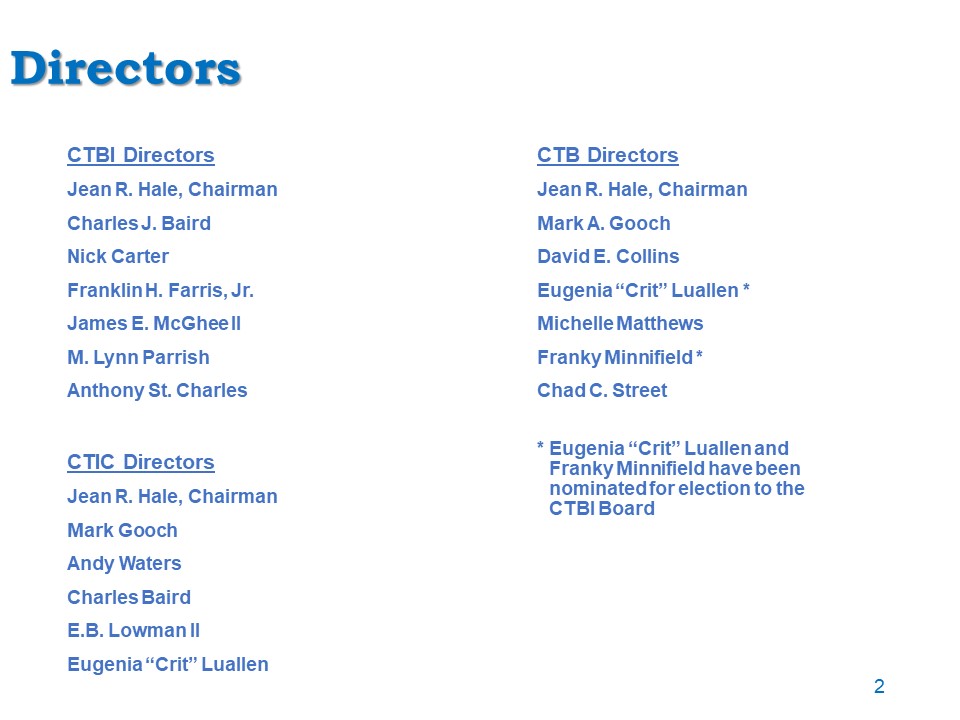
Directors CTBI DirectorsJean R. Hale, ChairmanCharles J. BairdNick CarterFranklin H. Farris, Jr.James E.
McGhee IIM. Lynn ParrishAnthony St. Charles 2 CTB DirectorsJean R. Hale, ChairmanMark A. GoochDavid E. CollinsEugenia “Crit” Luallen *Michelle MatthewsFranky Minnifield *Chad C. Street CTIC DirectorsJean R. Hale, ChairmanMark GoochAndy
WatersCharles BairdE.B. Lowman IIEugenia “Crit” Luallen * Eugenia “Crit” Luallen and Franky Minnifield have been nominated for election to the CTBI Board
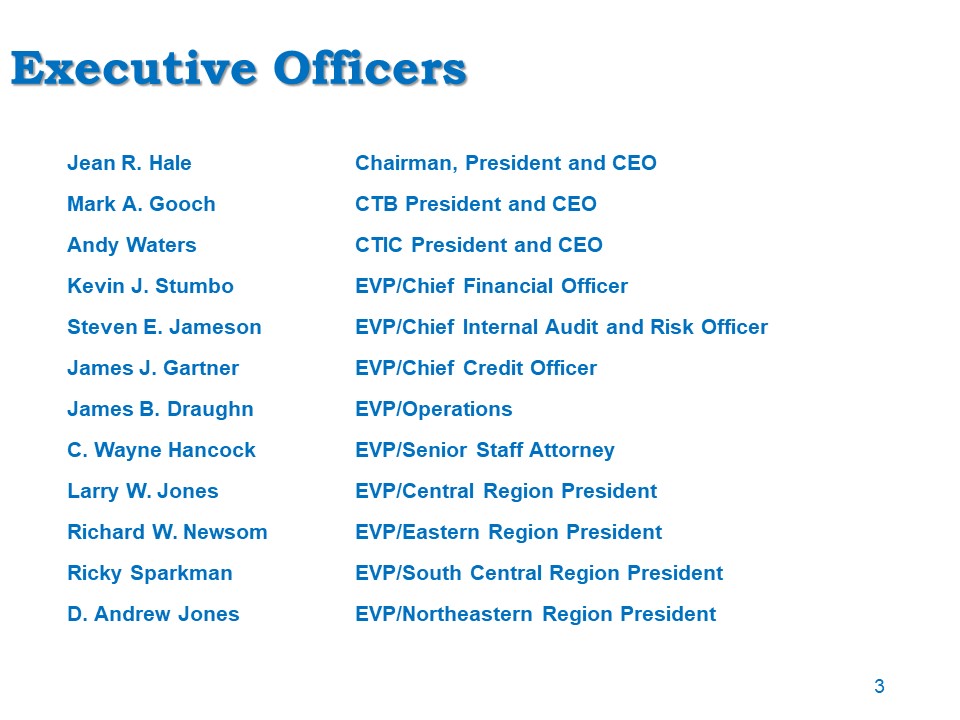
Executive Officers 3 Jean R. Hale Chairman, President and CEOMark A. Gooch CTB President and CEOAndy
Waters CTIC President and CEOKevin J. Stumbo EVP/Chief Financial OfficerSteven E. Jameson EVP/Chief Internal Audit and Risk OfficerJames J. Gartner EVP/Chief Credit OfficerJames B. Draughn EVP/OperationsC. Wayne Hancock EVP/Senior Staff
AttorneyLarry W. Jones EVP/Central Region PresidentRichard W. Newsom EVP/Eastern Region PresidentRicky Sparkman EVP/South Central Region PresidentD. Andrew Jones EVP/Northeastern Region President
“We are all finding ourselves living and operating in unprecedented times as the COVID-19 pandemic is
causing personal and financial hardship to our customers, employees, and communities. During these challenging times, the directors, officers, and employees of Community Trust Bancorp, Inc. have remained focused and committed to supporting all
of our constituents, our shareholders, customers, employees, and communities. We have instituted programs to support our customers with loan modifications, forbearance, and fee waivers and participated in programs like the Paycheck Protection
Program, focused on helping small businesses keep their employees and meet their expenses as they are unable to operate due to mandated closures. We instituted programs supporting our employees focused on healthcare, childcare, and remote and
split schedule work, as well as work space changes that allow for proper social distancing to keep our employees safe as we continue to operate as a critical part of the economy. We continue to support our communities through donations to
non-profit organizations as they strive to continue their commitments of serving those in need. We also continue to manage our company for the long term and our strong capital position and culture of building communities built on trust will
facilitate our ability to manage through these challenging times. Our results for the first quarter were good, but the extraordinary changes in the economic conditions and the implications of the impact of COVID-19 to the future for our
customers had a material impact on our provision for credit losses. We will continue to serve our constituents while we all meet the challenges of living with COVID-19, and we will all be stronger for having met those challenges.” - Jean R.
Hale, Chairman, President, and CEO 4 Message from the CEO
Cautionary Statement Information provided herein by CTBI contains “forward-looking” information. CTBI
cautions that any forward-looking statements made are not guarantees of future performance and that actual results may differ materially from those in the forward-looking statements. Please refer to CTBI’s 2019 Annual Report on Form 10-K,
Cautionary Statement Regarding Forward Looking Statements for additional information. 5
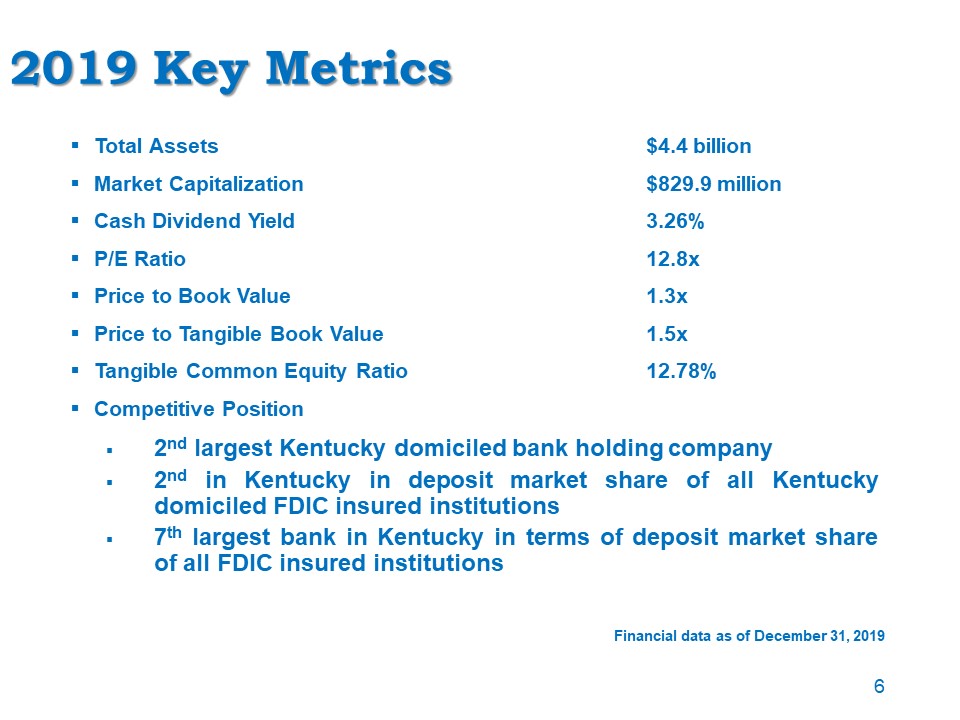
2019 Key Metrics Total Assets $4.4 billionMarket Capitalization $829.9 millionCash Dividend Yield
3.26%P/E Ratio 12.8xPrice to Book Value 1.3xPrice to Tangible Book Value 1.5xTangible Common Equity Ratio 12.78%Competitive Position2nd largest Kentucky domiciled bank holding company 2nd in Kentucky in deposit market share of all Kentucky
domiciled FDIC insured institutions 7th largest bank in Kentucky in terms of deposit market share of all FDIC insured institutions Financial data as of December 31, 2019 6
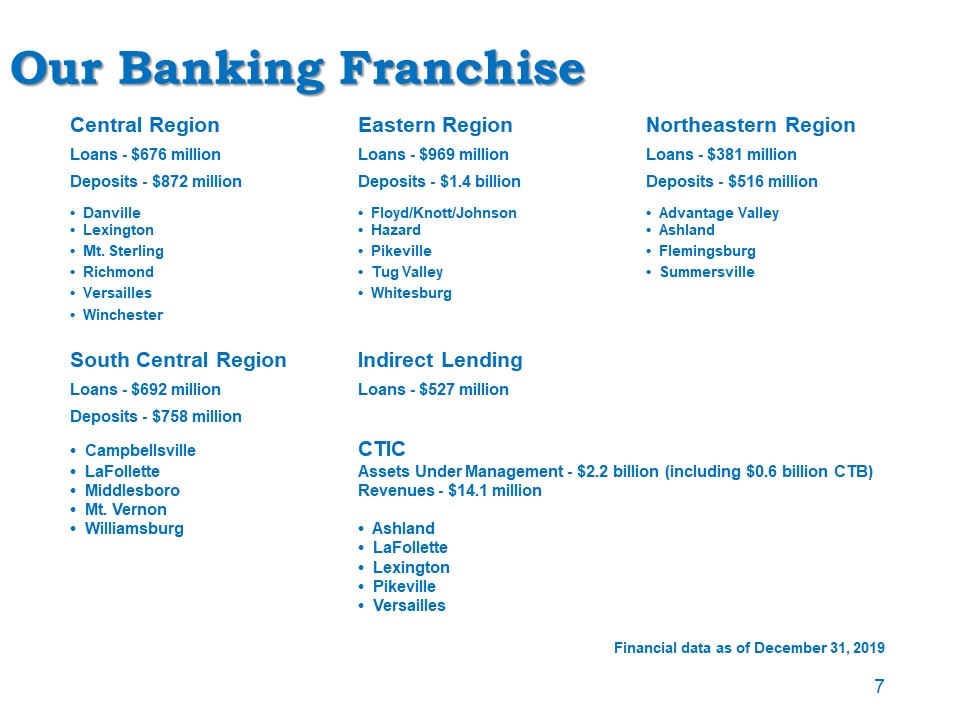
Our Banking Franchise Central Region Eastern Region Northeastern RegionLoans - $676 million Loans - $969
million Loans - $381 millionDeposits - $872 million Deposits - $1.4 billion Deposits - $516 million• Danville • Floyd/Knott/Johnson • Advantage Valley• Lexington • Hazard • Ashland• Mt. Sterling • Pikeville • Flemingsburg• Richmond • Tug Valley
• Summersville• Versailles • Whitesburg• WinchesterSouth Central Region Indirect LendingLoans - $692 million Loans - $527 million Deposits - $758 million• Campbellsville CTIC• LaFollette Assets Under Management - $2.2 billion (including $0.6
billion CTB)• Middlesboro Revenues - $14.1 million• Mt. Vernon • Williamsburg • Ashland • LaFollette • Lexington • Pikeville • Versailles Financial data as of December 31, 2019 7

Trust Assets Under Management & Trust Revenue Includes CTB portfolio Assets in billionsRevenue in
millions 8
2019 Performance
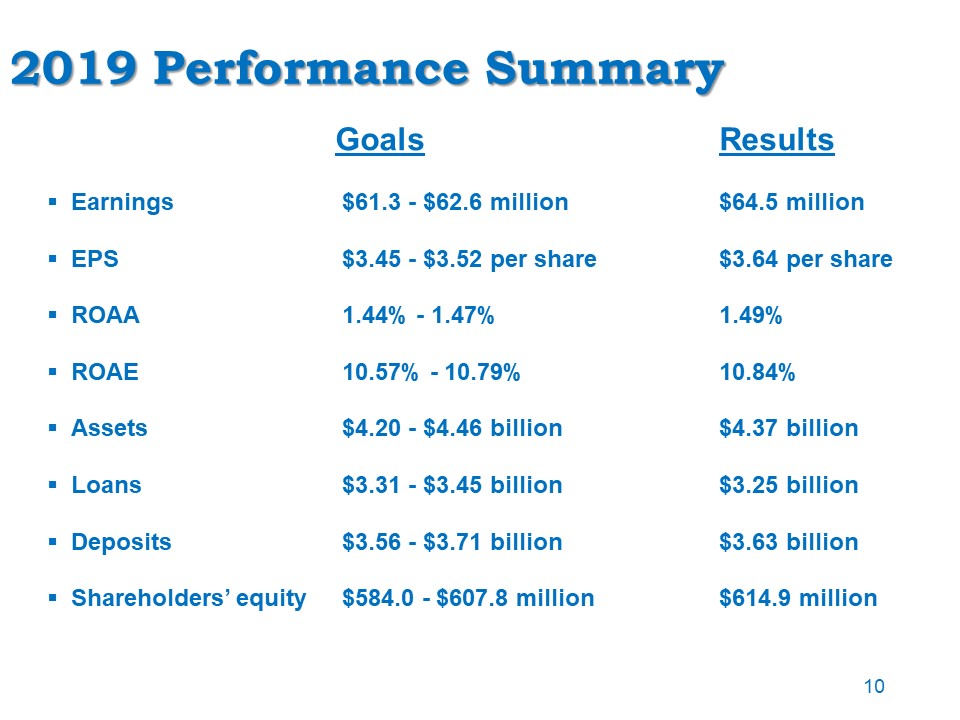
2019 Performance Summary Goals ResultsEarnings $61.3 - $62.6 million $64.5 millionEPS $3.45 - $3.52 per
share $3.64 per shareROAA 1.44% - 1.47% 1.49%ROAE 10.57% - 10.79% 10.84%Assets $4.20 - $4.46 billion $4.37 billionLoans $3.31 - $3.45 billion $3.25 billionDeposits $3.56 - $3.71 billion $3.63 billionShareholders’ equity $584.0 - $607.8 million
$614.9 million 10

Shareholder Value
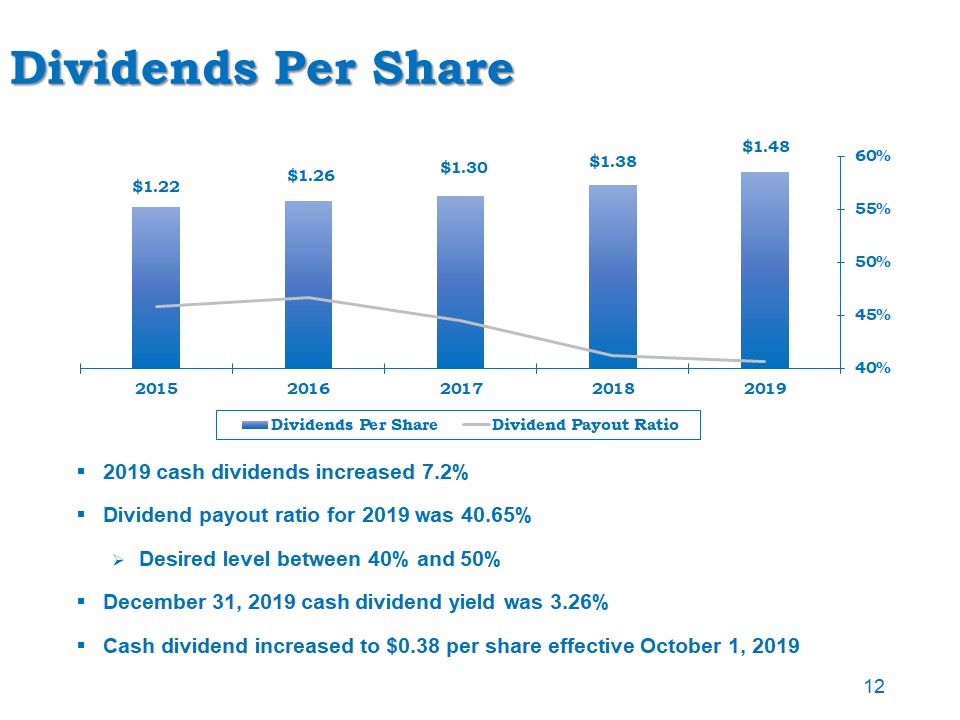
Dividends Per Share 2019 cash dividends increased 7.2%Dividend payout ratio for 2019 was 40.65%Desired
level between 40% and 50%December 31, 2019 cash dividend yield was 3.26%Cash dividend increased to $0.38 per share effective October 1, 2019 12
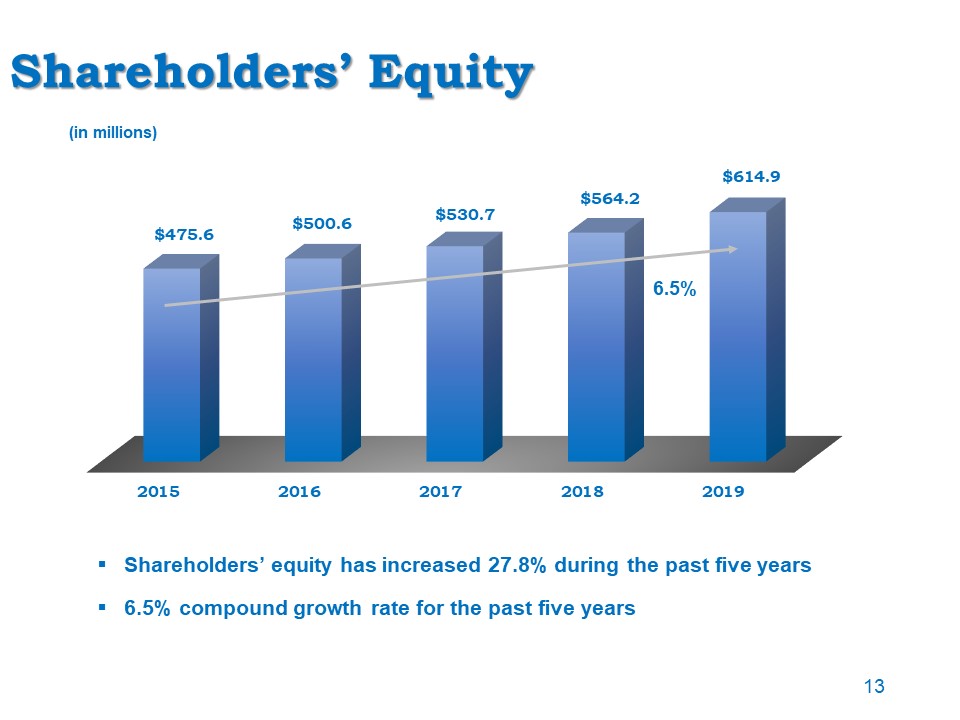
Shareholders’ Equity Shareholders’ equity has increased 27.8% during the past five years6.5% compound
growth rate for the past five years (in millions) 13 6.5%
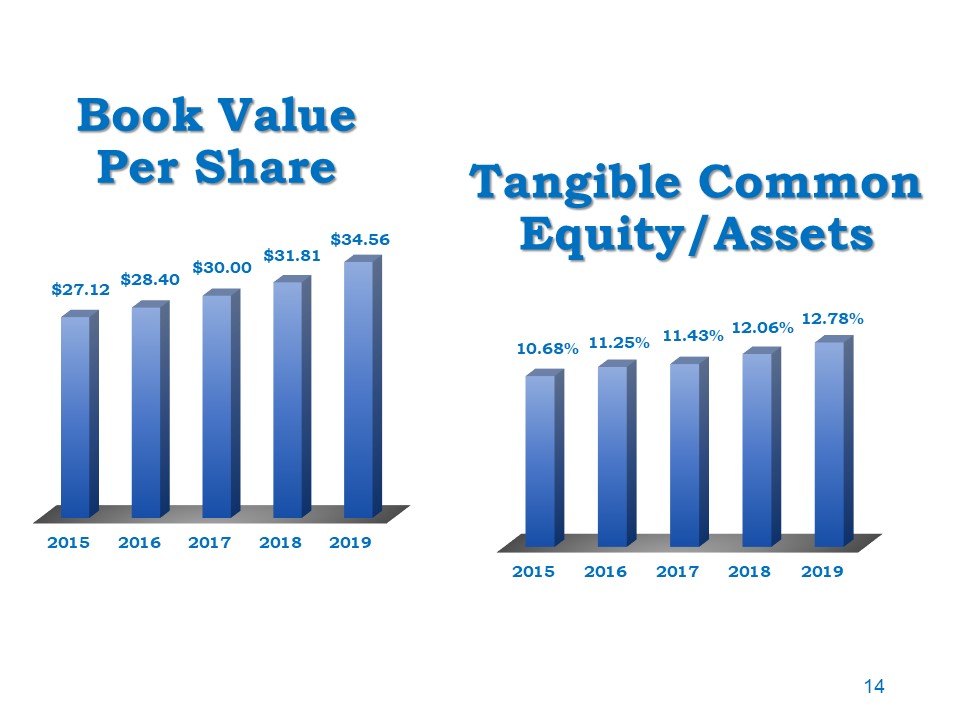
Book Value Per Share Tangible Common Equity/Assets 14
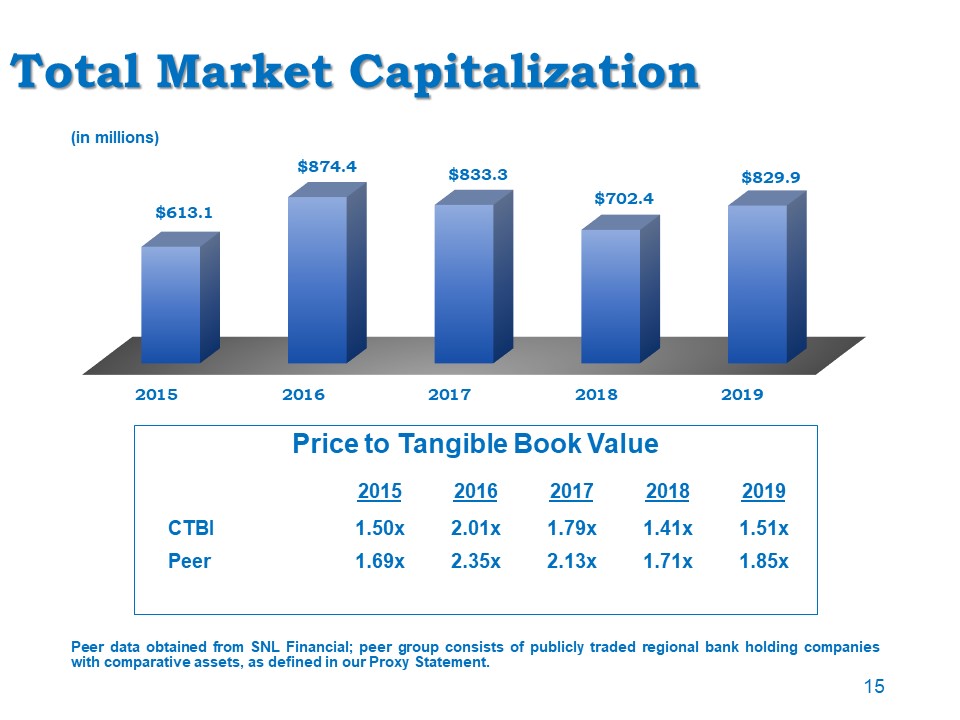
Total Market Capitalization Peer data obtained from SNL Financial; peer group consists of publicly
traded regional bank holding companies with comparative assets, as defined in our Proxy Statement. (in millions) 15 Price to Tangible Book Value 2015 2016 2017 2018 2019 CTBI 1.50x 2.01x 1.79x 1.41x 1.51x Peer 1.69x 2.35x 2.13x 1.71x 1.85x
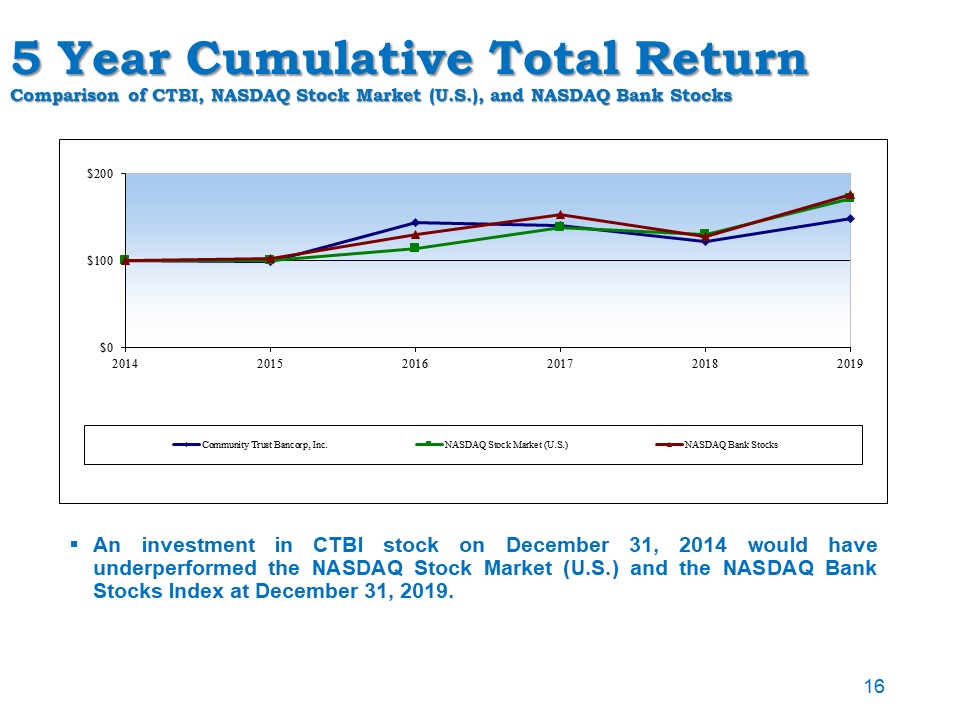
5 Year Cumulative Total ReturnComparison of CTBI, NASDAQ Stock Market (U.S.), and NASDAQ Bank Stocks An
investment in CTBI stock on December 31, 2014 would have underperformed the NASDAQ Stock Market (U.S.) and the NASDAQ Bank Stocks Index at December 31, 2019. 16
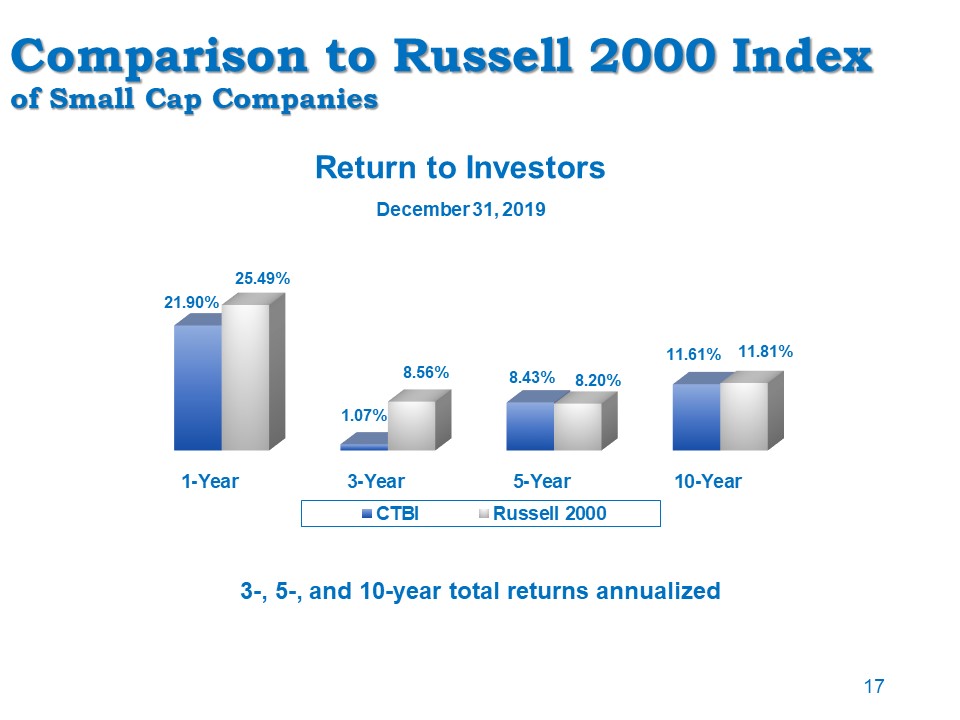
Comparison to Russell 2000 Indexof Small Cap Companies 3-, 5-, and 10-year total returns
annualized Return to Investors 17 December 31, 2019
Core Value Long-Term Investment 12 stock splits and 10 stock dividends39 years of consecutive increases
in cash dividends5-year compound growth rate of cash dividends 4.6%Stock included in the NASDAQ Global Select Market, NASDAQ Dividend Achievers Index, and NASDAQ Bank Stock IndexCTBI shareholders include196 institutional investors (including
CTIC – 9.9%) hold 11.1 million shares (58.7%)291 mutual funds hold 5.0 million shares (28.2%) Data as of December 31, 2019 18
CTBI’s Franchise Value History of solid investor returnsHistorically strong capital positionInvestor
focused dividend policyDividend Achievers IndexConsistent financial performanceCommunity banking strategyEconomic diversity in the markets we serveStrong experienced management team and over 1,000 dedicated employeesOur shareholders 19

Earnings Review
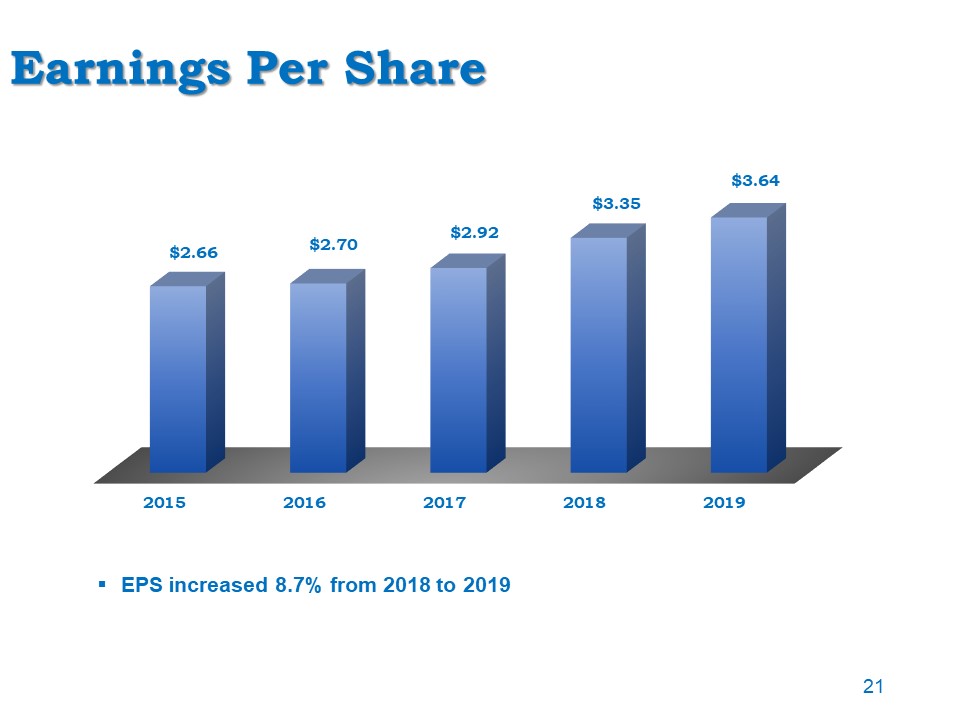
Earnings Per Share EPS increased 8.7% from 2018 to 2019 21
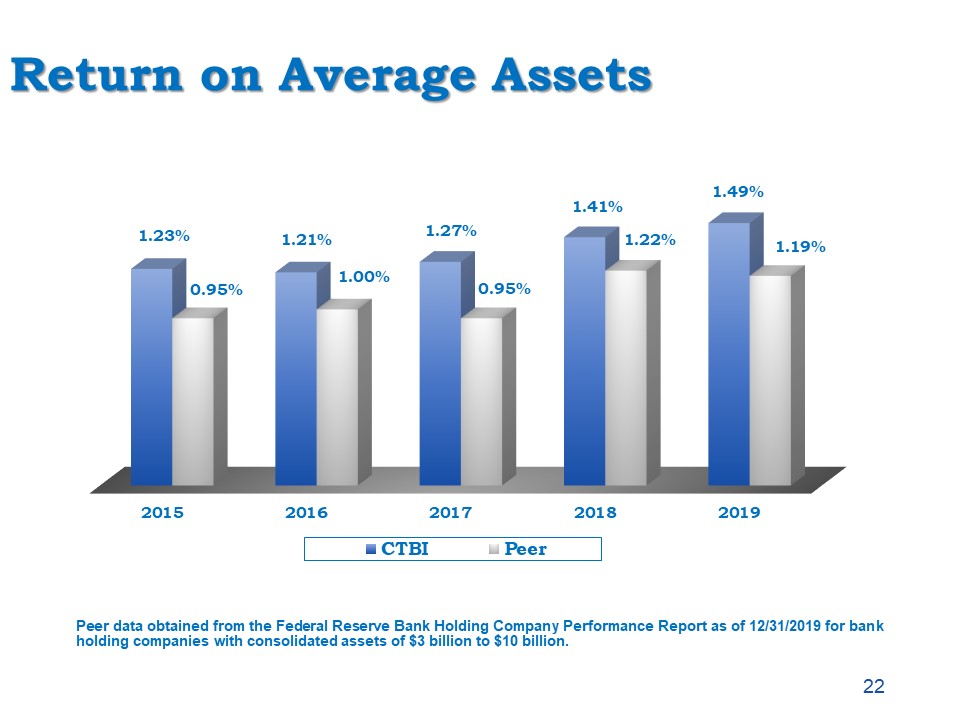
Return on Average Assets Peer data obtained from the Federal Reserve Bank Holding Company Performance
Report as of 12/31/2019 for bank holding companies with consolidated assets of $3 billion to $10 billion. 22
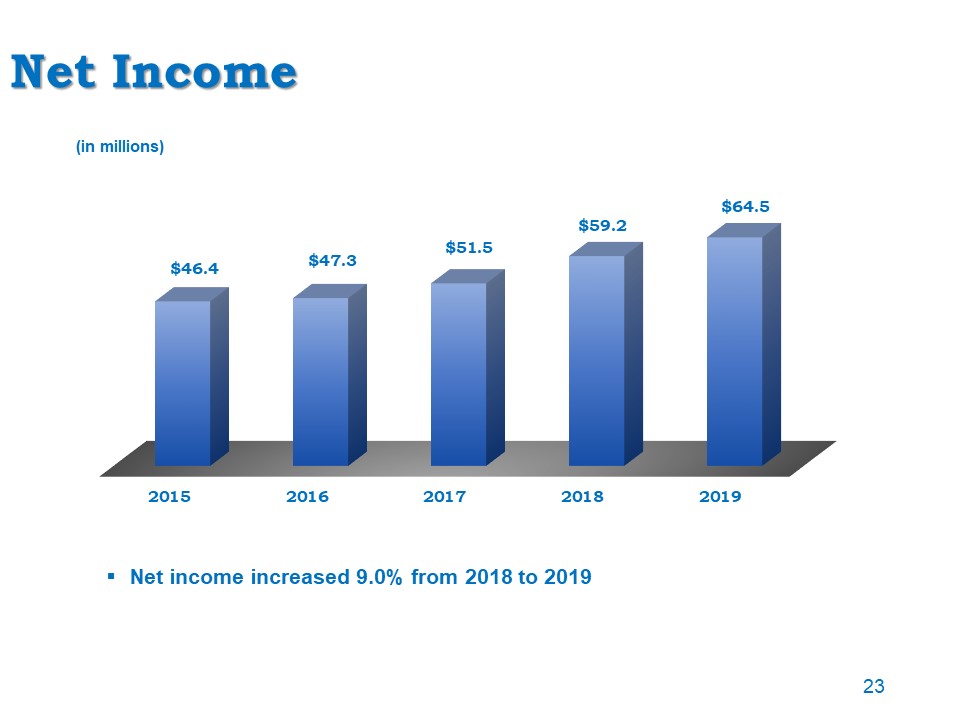
Net Income Net income increased 9.0% from 2018 to 2019 (in millions) 23
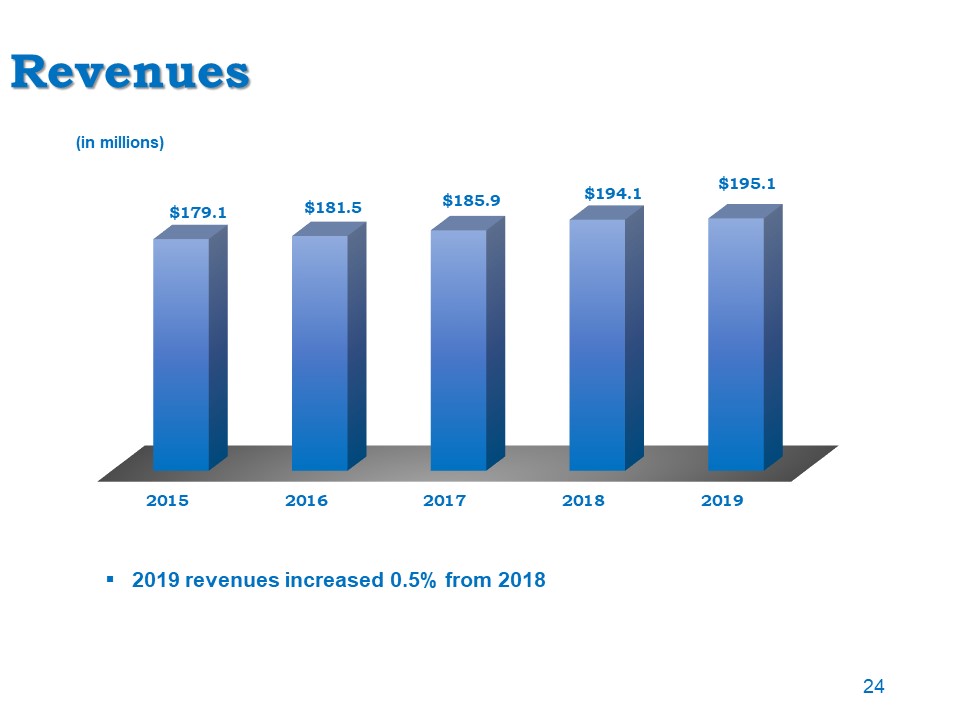
Revenues 2019 revenues increased 0.5% from 2018 (in millions) 24
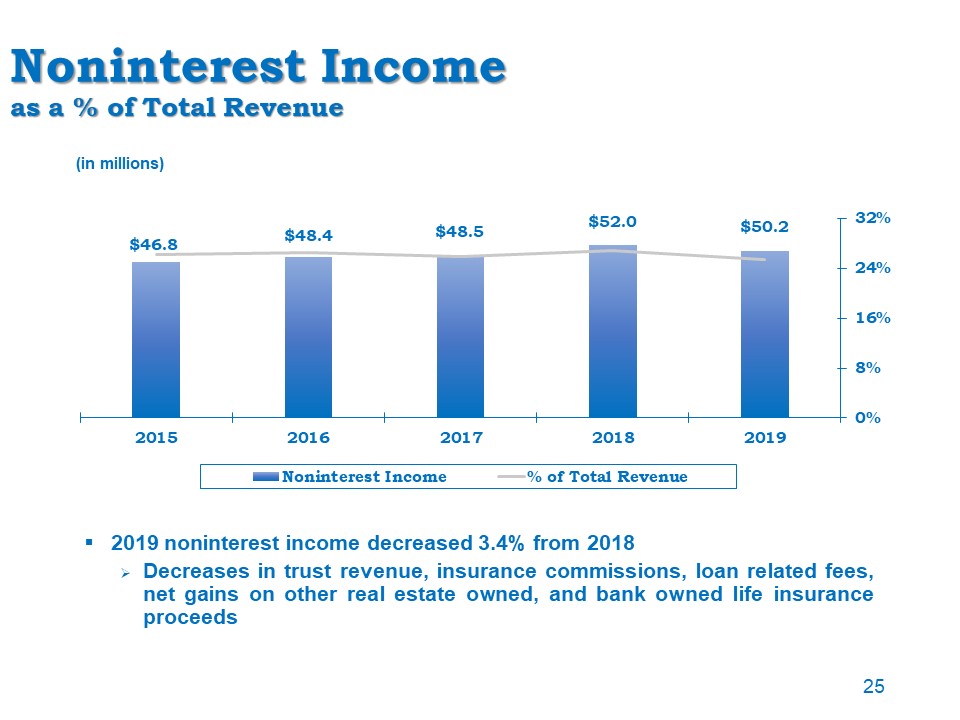
Noninterest Incomeas a % of Total Revenue 2019 noninterest income decreased 3.4% from 2018Decreases in
trust revenue, insurance commissions, loan related fees, net gains on other real estate owned, and bank owned life insurance proceeds (in millions) 25
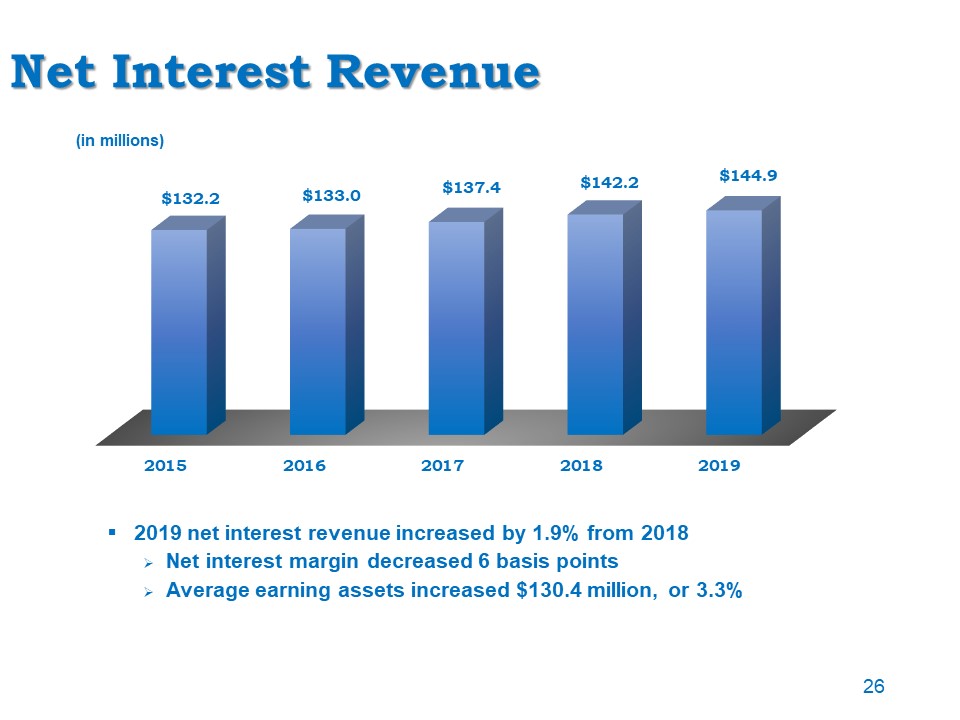
Net Interest Revenue 2019 net interest revenue increased by 1.9% from 2018Net interest margin decreased
6 basis pointsAverage earning assets increased $130.4 million, or 3.3% (in millions) 26
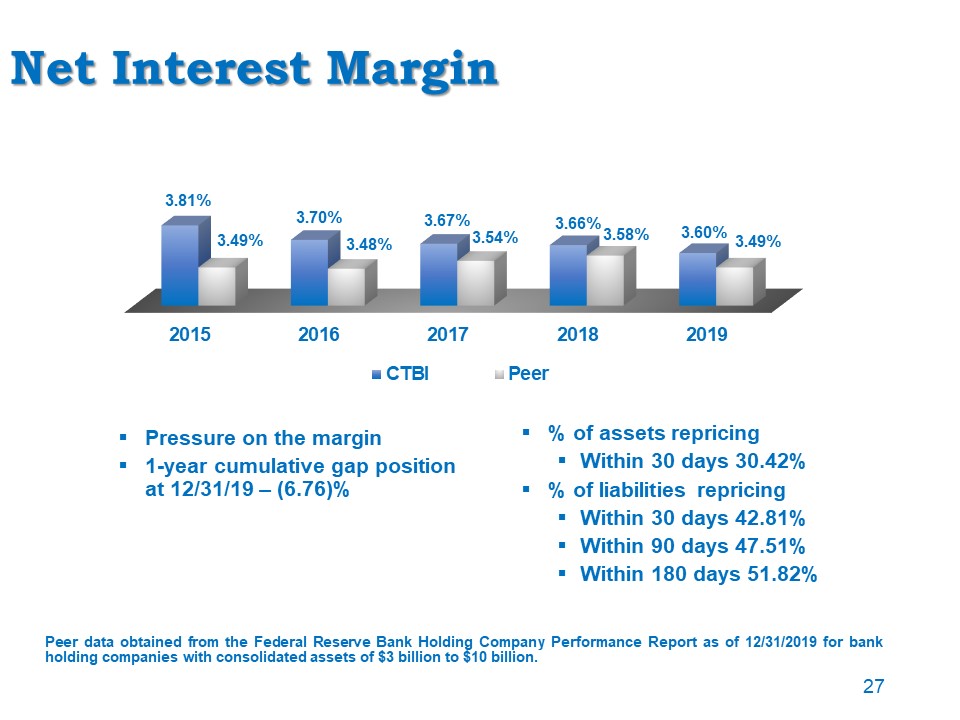
Net Interest Margin Pressure on the margin1-year cumulative gap position at 12/31/19 – (6.76)% Peer
data obtained from the Federal Reserve Bank Holding Company Performance Report as of 12/31/2019 for bank holding companies with consolidated assets of $3 billion to $10 billion. % of assets repricingWithin 30 days 30.42%% of liabilities
repricing Within 30 days 42.81%Within 90 days 47.51%Within 180 days 51.82% 27
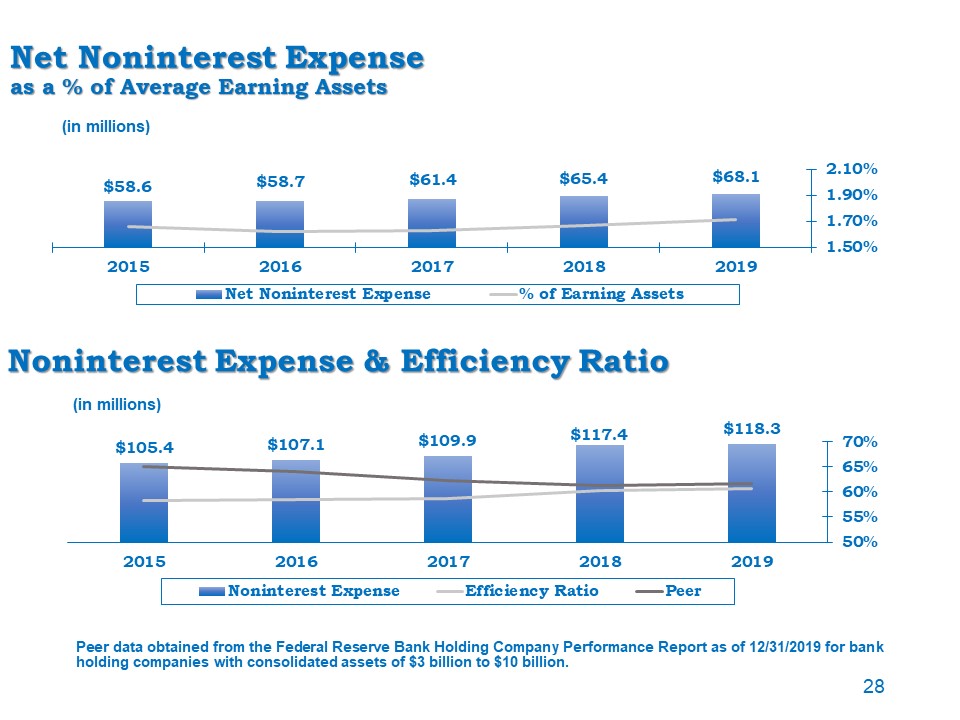
Net Noninterest Expenseas a % of Average Earning Assets Peer data obtained from the Federal Reserve Bank
Holding Company Performance Report as of 12/31/2019 for bank holding companies with consolidated assets of $3 billion to $10 billion. (in millions) 28 Noninterest Expense & Efficiency Ratio (in millions)

Balance Sheet Review
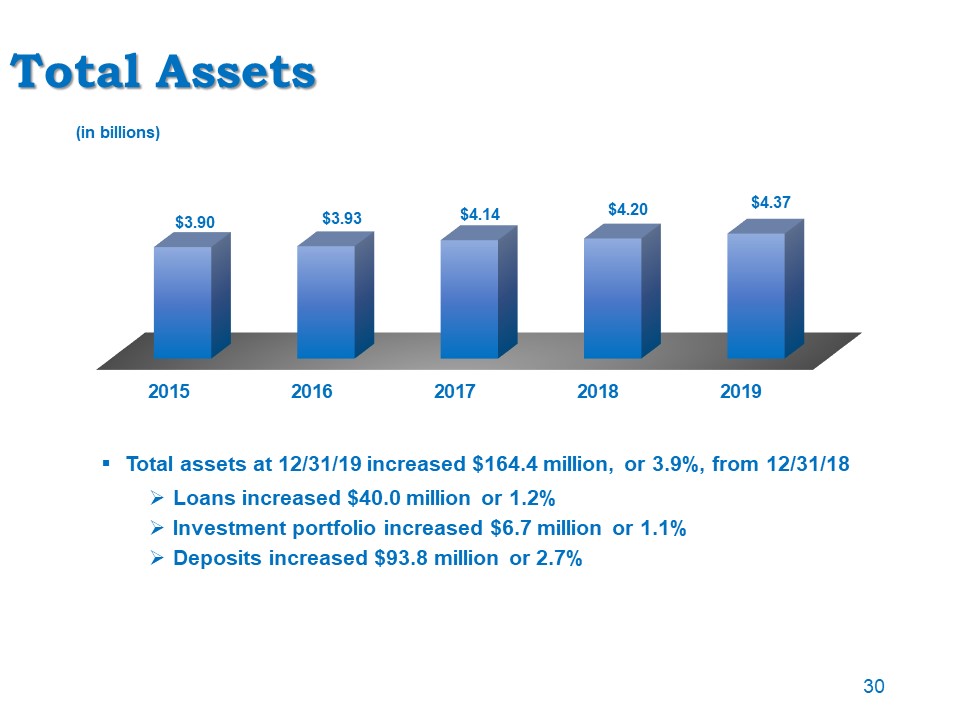
Total Assets Total assets at 12/31/19 increased $164.4 million, or 3.9%, from 12/31/18Loans increased
$40.0 million or 1.2%Investment portfolio increased $6.7 million or 1.1%Deposits increased $93.8 million or 2.7% (in billions) 30

Total Loans Total loans at 12/31/19 increased 1.2% from 12/31/18Loan production for the year totaled
$0.8 billion (in billions) 31 Loan Portfolio Mix December 31, 2019
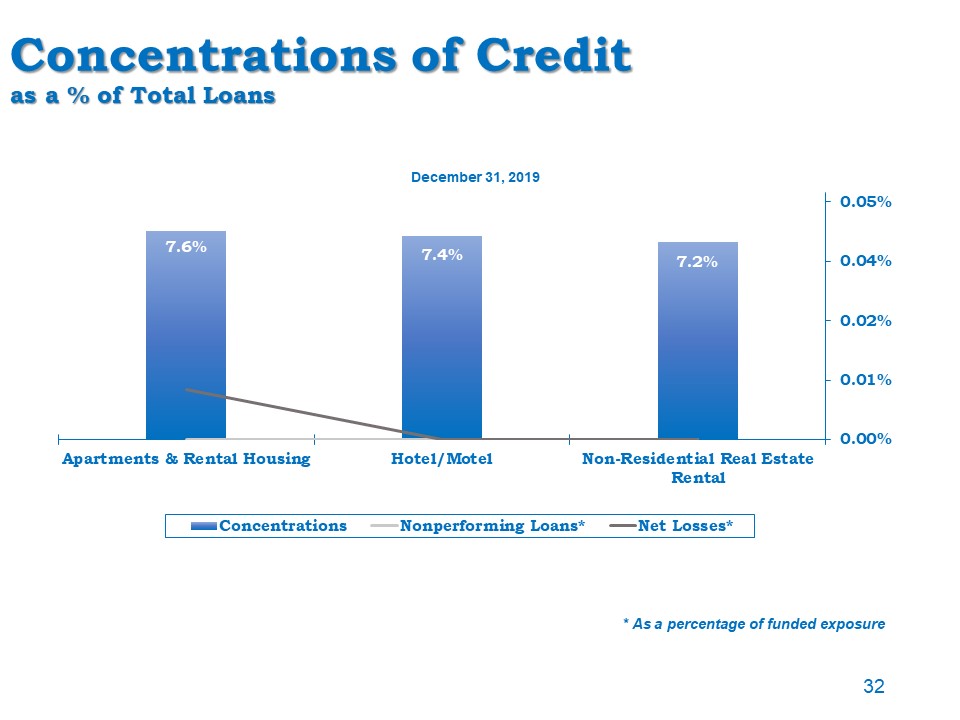
Concentrations of Creditas a % of Total Loans December 31, 2019 * As a percentage of funded
exposure 32
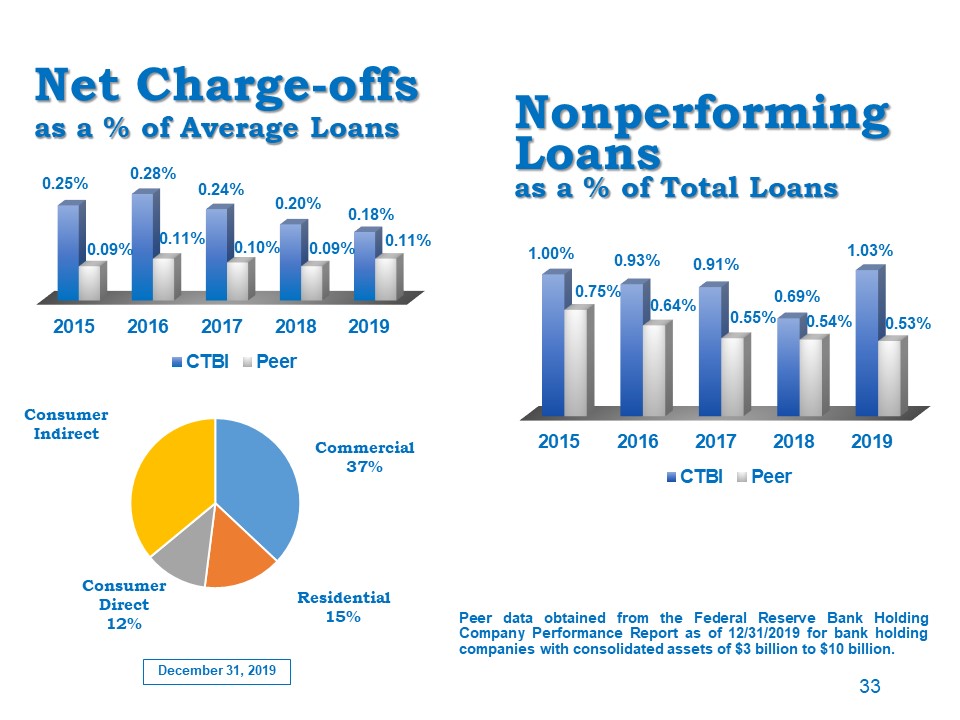
Net Charge-offsas a % of Average Loans Peer data obtained from the Federal Reserve Bank Holding Company
Performance Report as of 12/31/2019 for bank holding companies with consolidated assets of $3 billion to $10 billion. December 31, 2019 33 Nonperforming Loansas a % of Total Loans
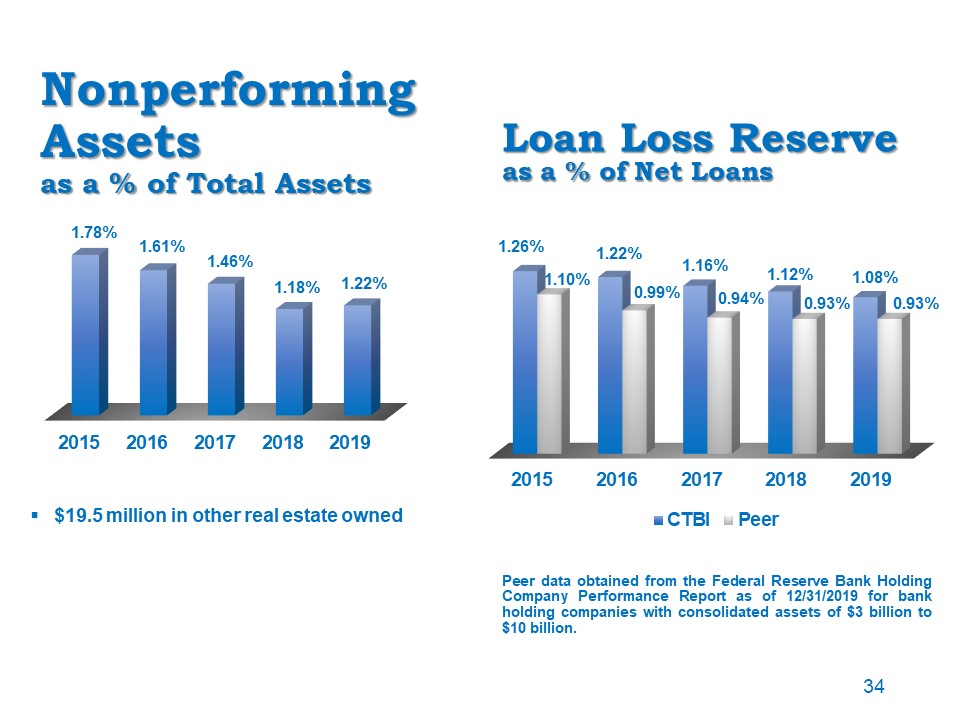
Nonperforming Assetsas a % of Total Assets $19.5 million in other real estate owned 34 Loan Loss
Reserveas a % of Net Loans Peer data obtained from the Federal Reserve Bank Holding Company Performance Report as of 12/31/2019 for bank holding companies with consolidated assets of $3 billion to $10 billion.
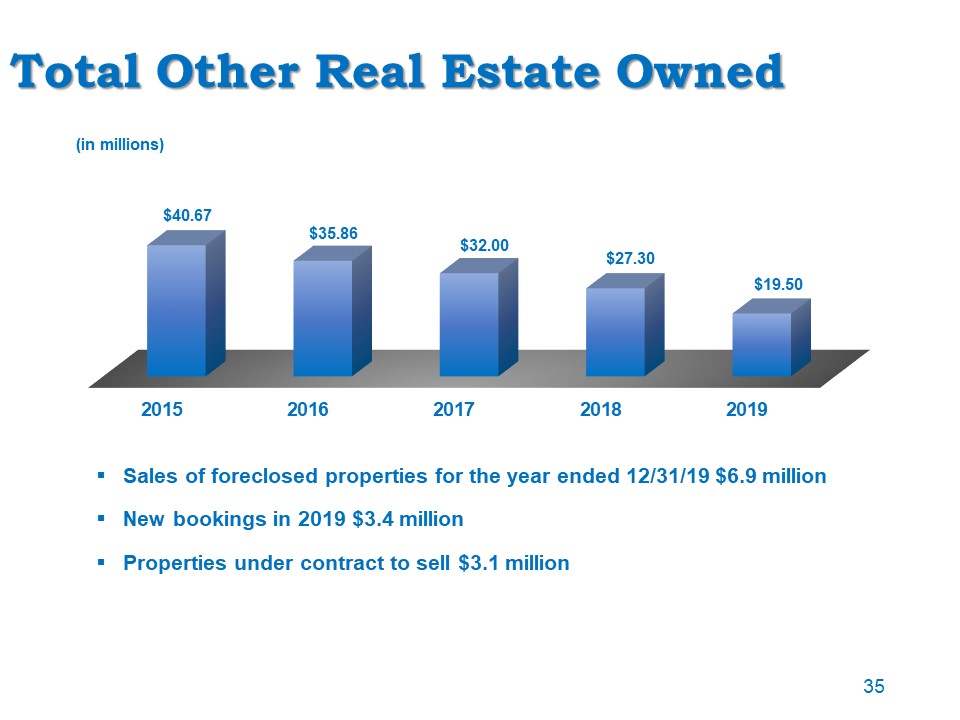
Total Other Real Estate Owned Sales of foreclosed properties for the year ended 12/31/19 $6.9 millionNew
bookings in 2019 $3.4 millionProperties under contract to sell $3.1 million (in millions) 35
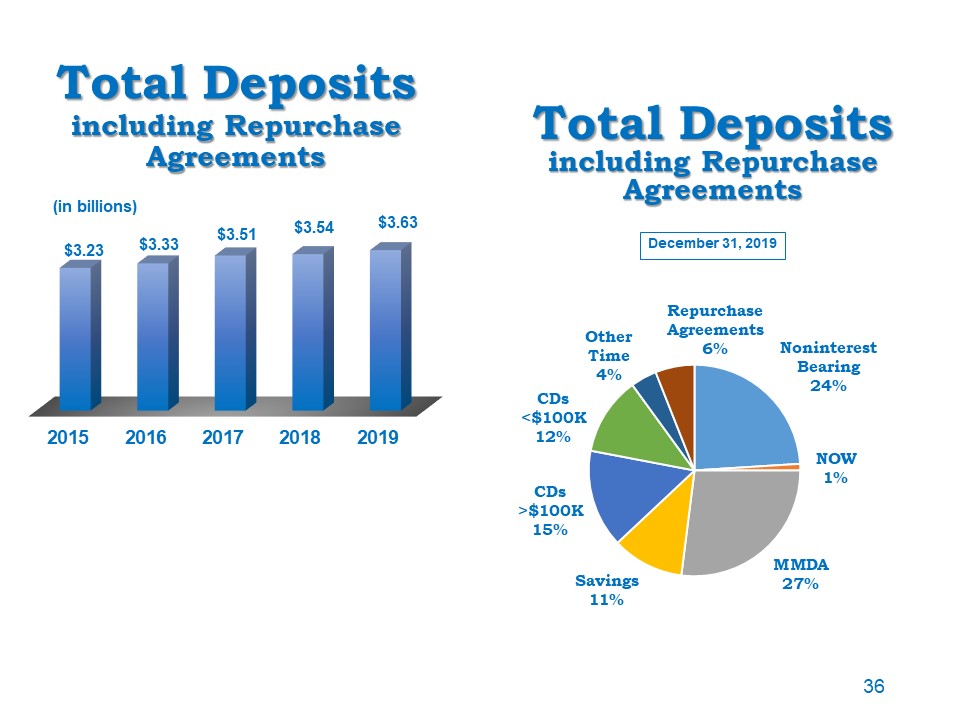
Total Depositsincluding Repurchase Agreements (in billions) 36 Total Depositsincluding Repurchase
Agreements December 31, 2019
1st Quarter 2020 Review
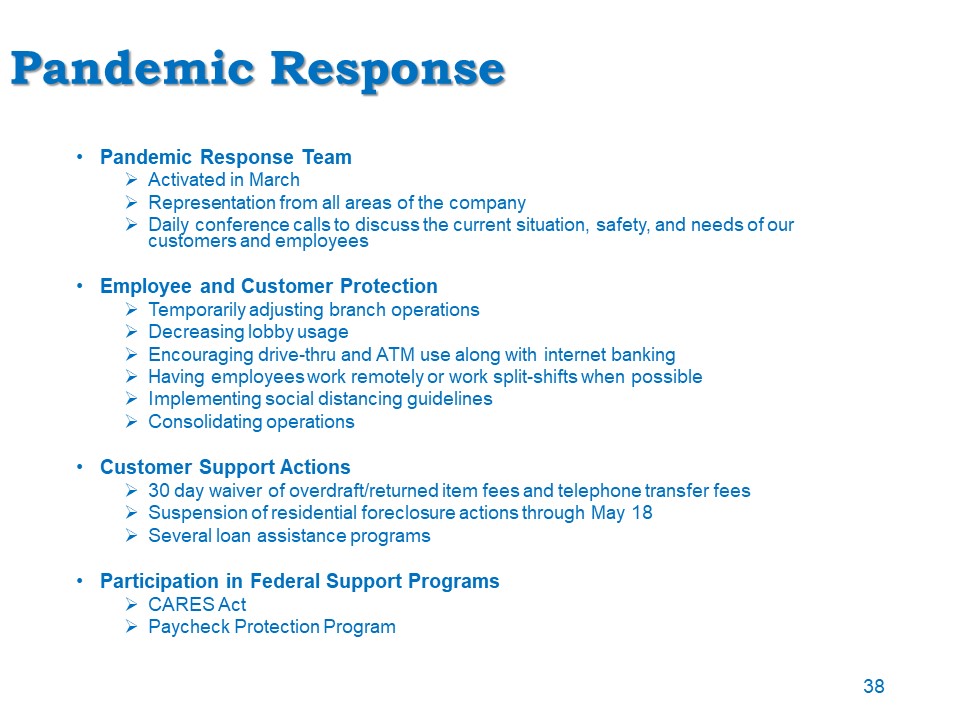
Pandemic Response 38 Pandemic Response TeamActivated in MarchRepresentation from all areas of the
companyDaily conference calls to discuss the current situation, safety, and needs of our customers and employeesEmployee and Customer ProtectionTemporarily adjusting branch operationsDecreasing lobby usageEncouraging drive-thru and ATM use
along with internet bankingHaving employees work remotely or work split-shifts when possibleImplementing social distancing guidelinesConsolidating operationsCustomer Support Actions30 day waiver of overdraft/returned item fees and telephone
transfer feesSuspension of residential foreclosure actions through May 18Several loan assistance programsParticipation in Federal Support ProgramsCARES ActPaycheck Protection Program
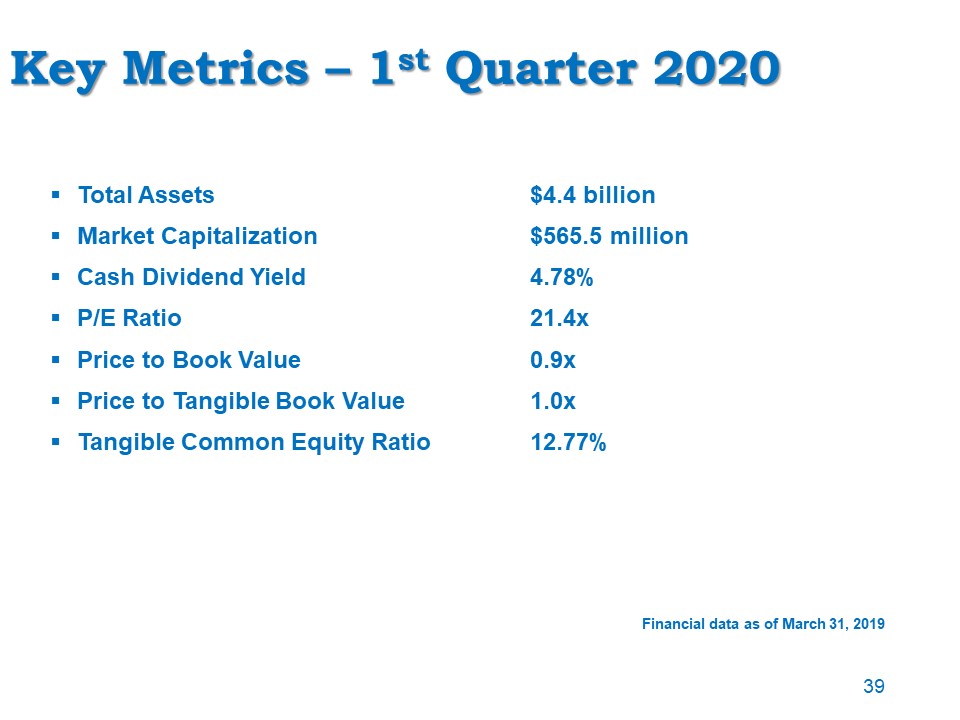
Key Metrics – 1st Quarter 2020 Total Assets $4.4 billionMarket Capitalization $565.5 millionCash
Dividend Yield 4.78%P/E Ratio 21.4xPrice to Book Value 0.9xPrice to Tangible Book Value 1.0xTangible Common Equity Ratio 12.77% Financial data as of March 31, 2019 39
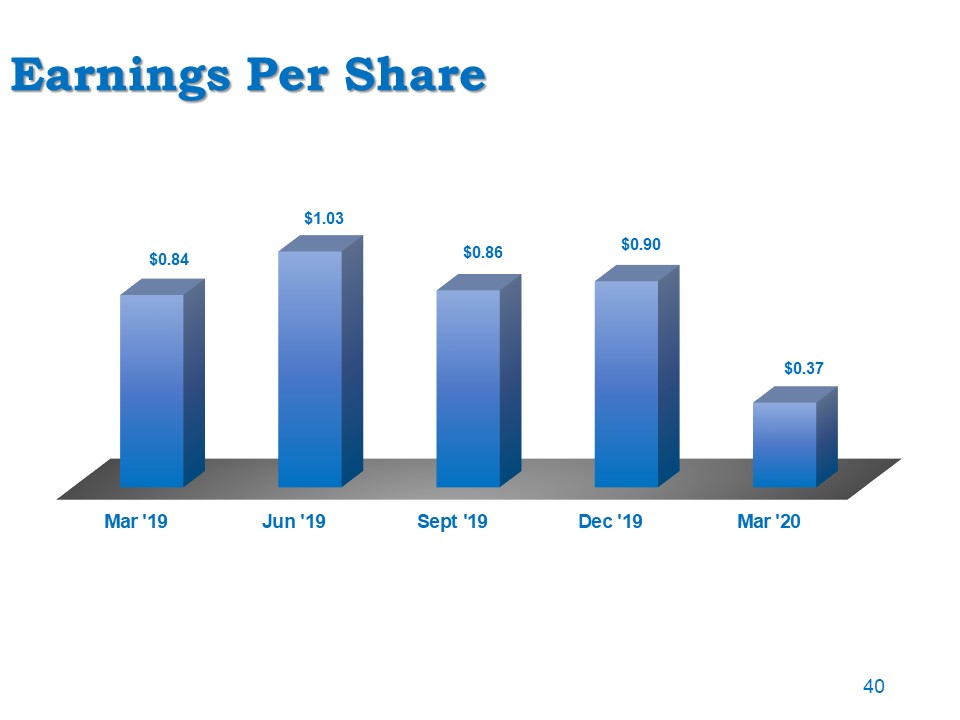
Earnings Per Share 40
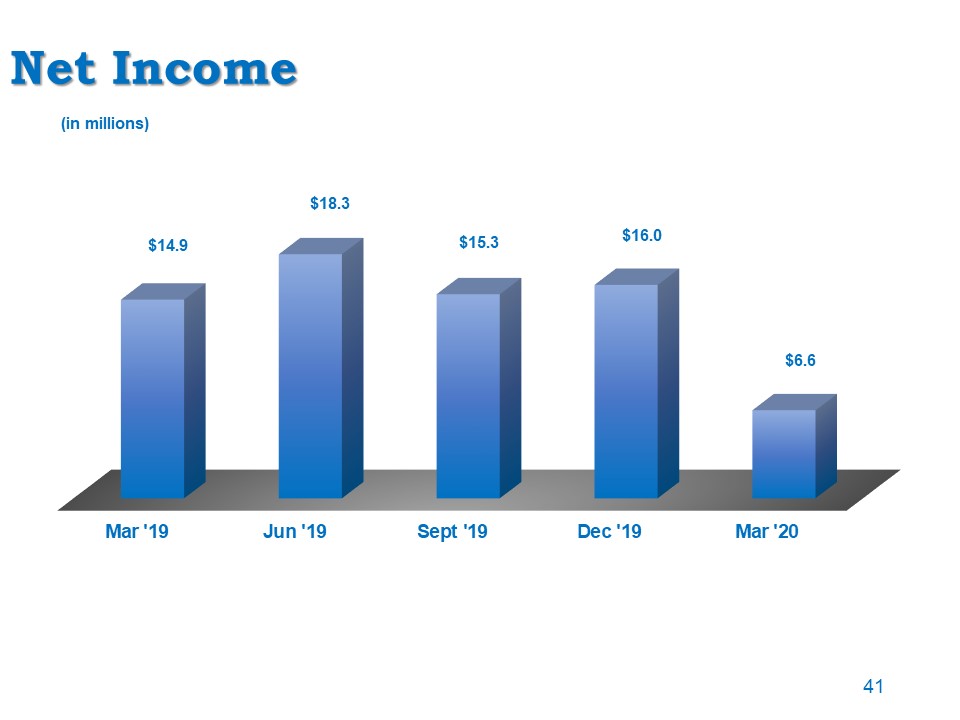
Net Income 41 (in millions)
Earnings $12.7 million charge to earnings for the provision for credit losses as a result of the
COVID-19 pandemicDecrease in noninterest income as a the result of a 30-day waiver of overdraft charges beginning March 23, 2020 in response to the COVID-19 pandemic discussed above and a decline in the fair market value of our mortgage
servicing rightsDecrease in noninterest expense as a result of a decrease in personnel expense, as the cost of group medical and life insurance and bonuses and incentives decreased 42

Noninterest Income 30-day waiver of processing overdraft charges beginning March 23, 2020, resulted in
an estimated $0.3 million loss in revenue in the first quarter of 2020 (with an anticipated $0.7 million additional loss in revenue in April)Decline of $0.8 million in the fair market value of our mortgage servicing rights (in millions) 43
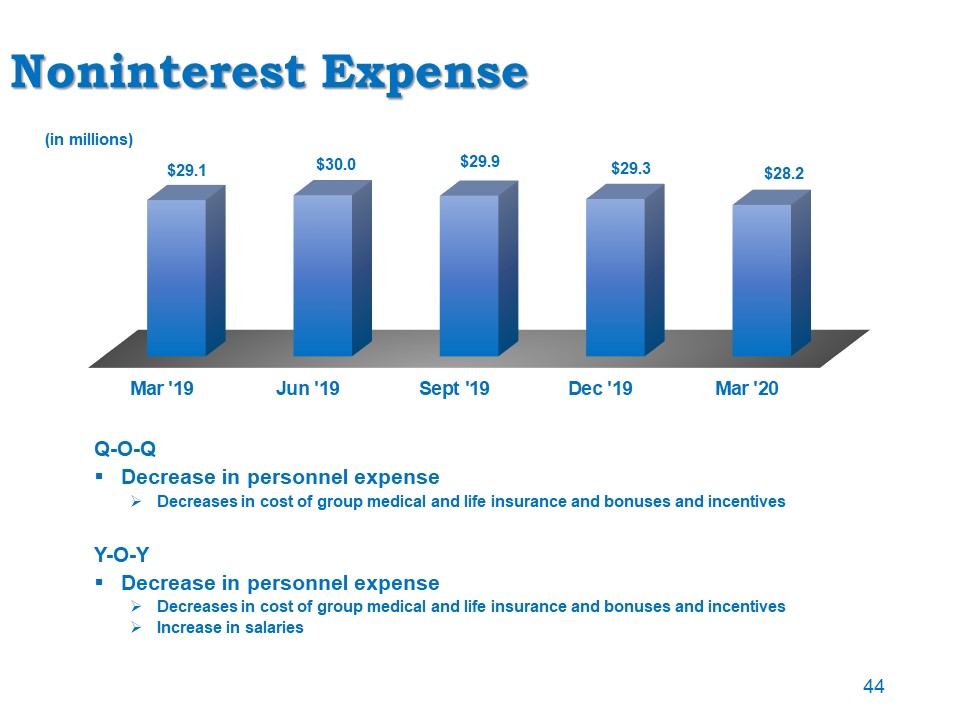
Noninterest Expense Q-O-QDecrease in personnel expenseDecreases in cost of group medical and life
insurance and bonuses and incentivesY-O-YDecrease in personnel expenseDecreases in cost of group medical and life insurance and bonuses and incentivesIncrease in salaries (in millions) 44
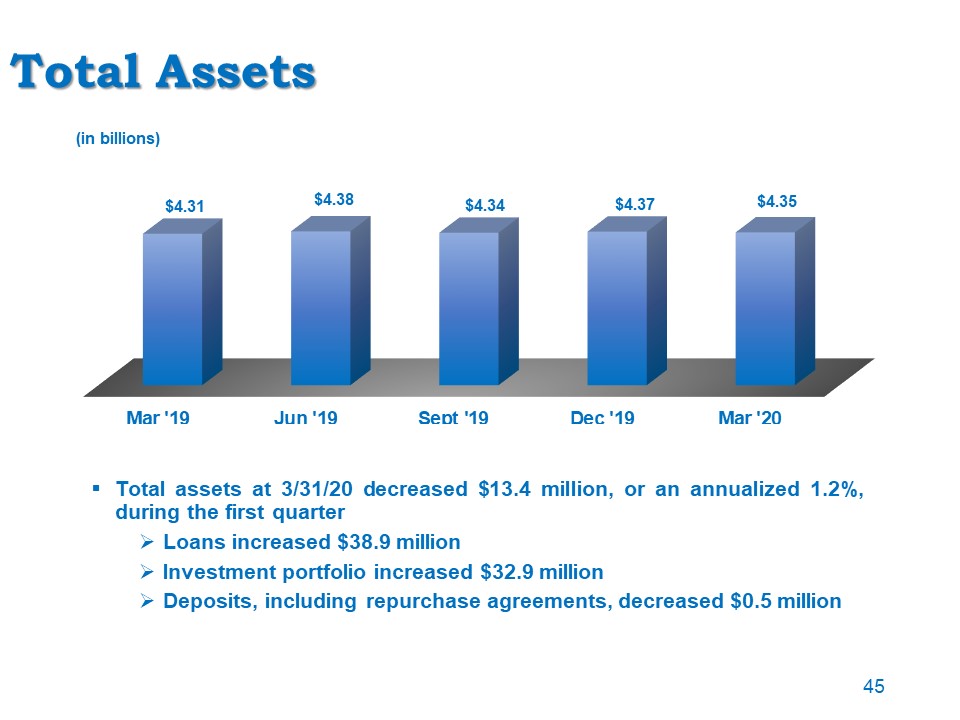
Total Assets Total assets at 3/31/20 decreased $13.4 million, or an annualized 1.2%, during the first
quarterLoans increased $38.9 millionInvestment portfolio increased $32.9 millionDeposits, including repurchase agreements, decreased $0.5 million (in billions) 45
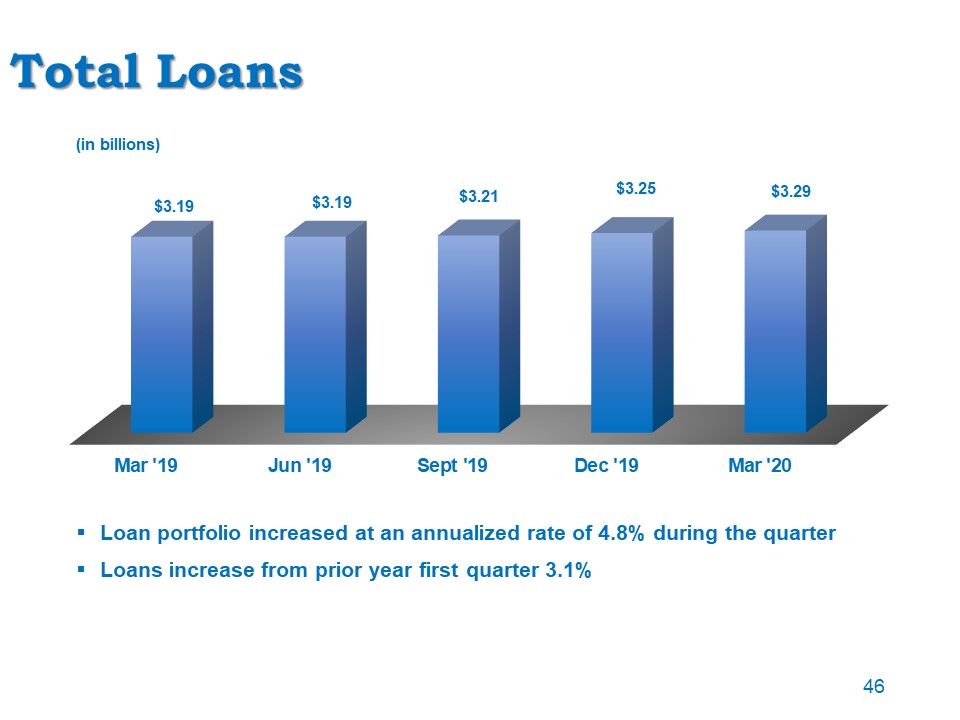
Total Loans Loan portfolio increased at an annualized rate of 4.8% during the quarterLoans increase from
prior year first quarter 3.1% (in billions) 46
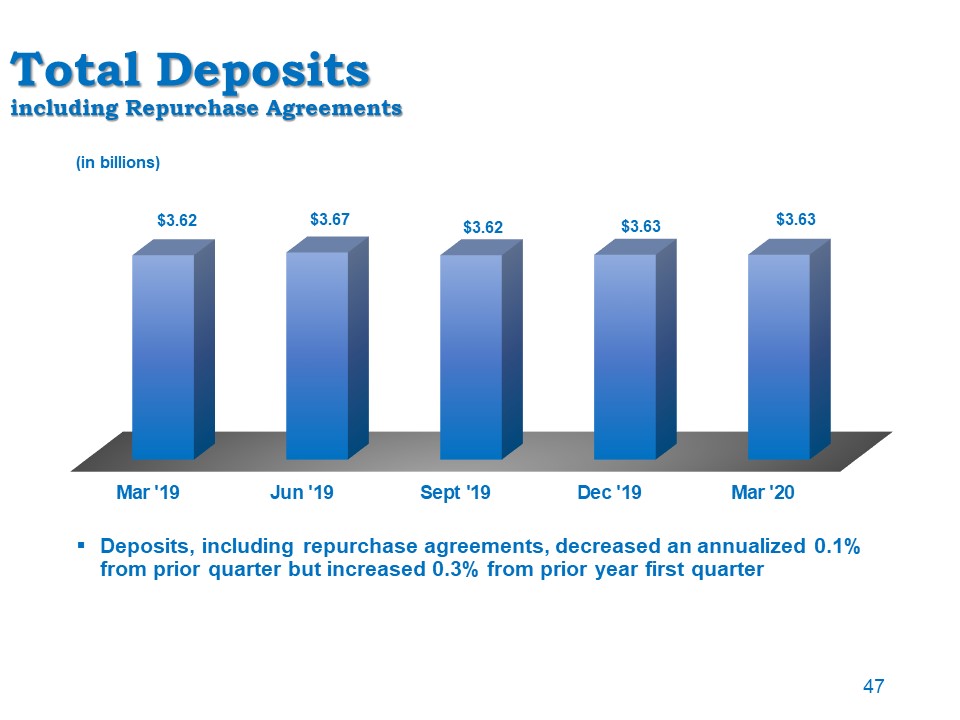
Total Depositsincluding Repurchase Agreements Deposits, including repurchase agreements, decreased an
annualized 0.1% from prior quarter but increased 0.3% from prior year first quarter (in billions) 47
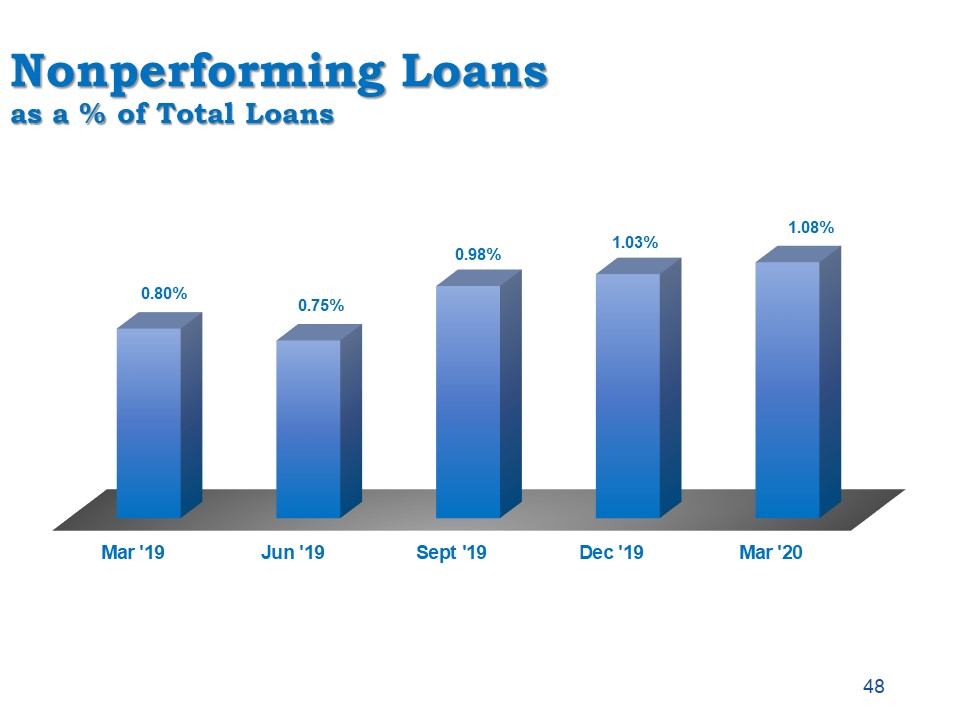
Nonperforming Loansas a % of Total Loans 48

Nonperforming Assetsas a % of Total Assets 49
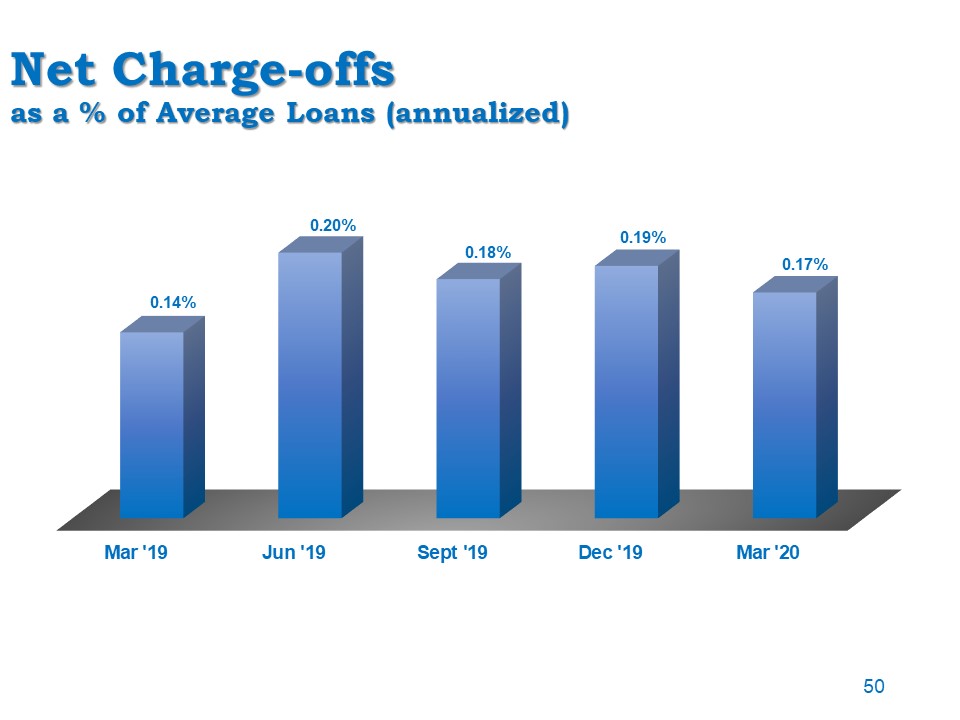
Net Charge-offsas a % of Average Loans (annualized) 50
Allowance for Credit Losses $12.7 million increase in provision for credit losses during the quarter was
directly attributable to the current COVID-19 pandemic and its expected impact on future net charge-offs.Specifically, increases in the allowance for credit losses were recognized in allocations related to concentrations of credit in various
loan portfolio segments severely impacted by the economic impact of the pandemic, as well as a substantial increase in forecasted reserves due to the current and expected increases in unemployment in the nation and in our market footprint.CTBI
adopted ASU-2016-13 (commonly referred to as CECL) effective January 1, 2020.The effect of adoption was a $3.0 million increase in the allowance for credit losses (formerly referred to as the allowance for loan losses). 51

52 Allowance for Credit Losses 4Q19 Probable Incurred Losses January 1, 2020 CECL
Adoption March 31, 2020 CECL (dollars in thousands) Amount % of Portfolio Amount % of Portfolio Amount % of Portfolio Allowance for loan and lease losses transitioned to allowance for credit
losses: Commercial $21,683 1.30% $21,680 1.30% $30,030 1.79% Residential mortgage 5,501 0.61% 7,319 0.81% 7,850 0.86% Consumer direct 1,711 1.16% 1,671 1.13% 2,200 1.51% Consumer
indirect 6,201 1.18% 7,467 1.42% 9,365 1.69% Total allowance for loan and lease losses/allowance for credit losses $35,096 1.08% 38,137 1.17% $49,445 1.50% Reserve for unfunded lending
commitments $274 $386 $404
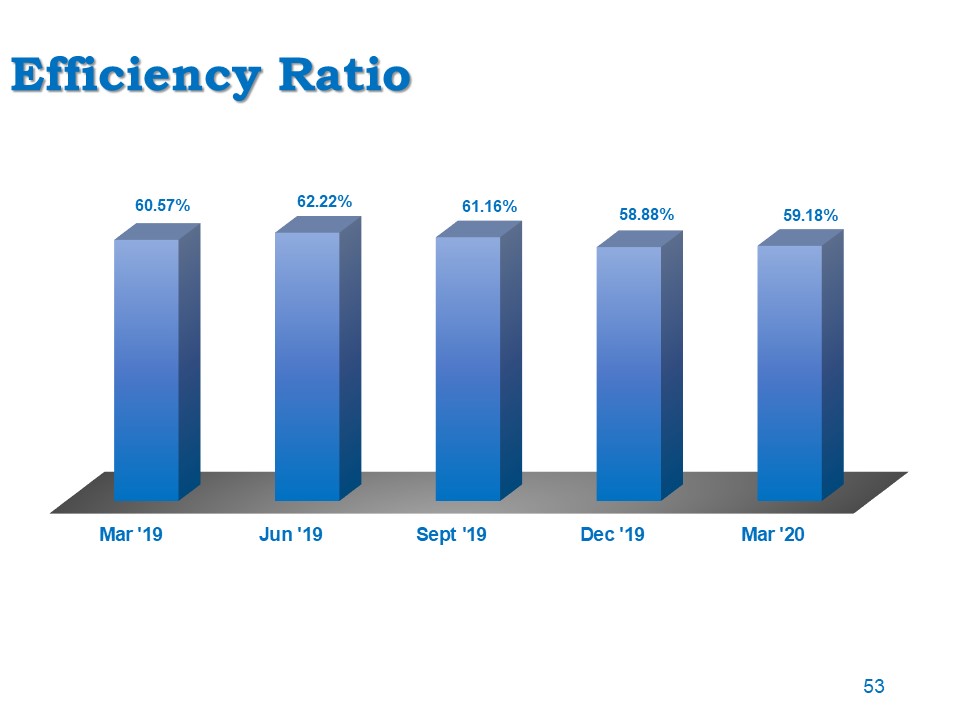
Efficiency Ratio 53
Key Strategic Initiatives
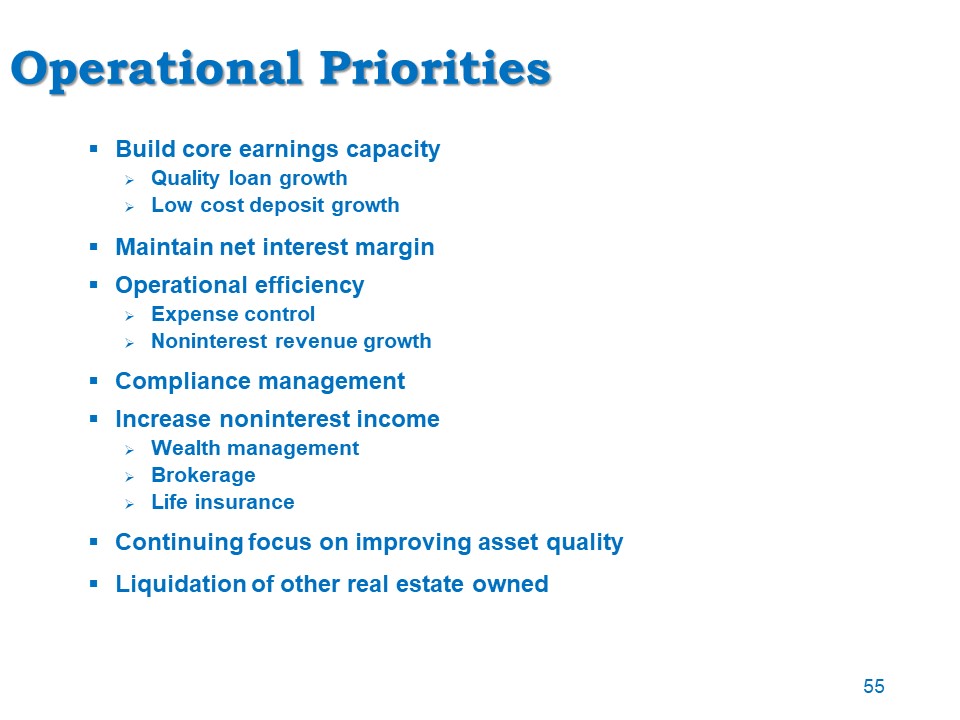
Operational Priorities Build core earnings capacityQuality loan growthLow cost deposit growthMaintain
net interest margin Operational efficiencyExpense controlNoninterest revenue growthCompliance managementIncrease noninterest incomeWealth managementBrokerageLife insuranceContinuing focus on improving asset quality Liquidation of other real
estate owned 55

To Our Shareholders Your management has a Strategic Plan for the performance and operations of your
company. Success will be attained by the execution of this plan, not just by management, but by approximately 1,000 employees. The continuing support by you, our shareholders, by referring your friends, neighbors, and business associates to do
business with your bank, is invaluable to the execution of our plans for the performance of your Company. 56

57