Attached files
| file | filename |
|---|---|
| 8-K - RELIANT BANCORP, INC. 8-K - Reliant Bancorp, Inc. | a52209723.htm |
| EX-99.3 - EXHIBIT 99.3 - Reliant Bancorp, Inc. | a52209723ex99_3.htm |
| EX-99.1 - EXHIBIT 99.1 - Reliant Bancorp, Inc. | a52209723ex99_1.htm |
|
|
Exhibit 99.2
|
Q1 2020 Earnings Presentation April 28, 2020
Safe Harbor Statements Forward-Looking StatementsAll statements, other than statements of historical
fact, included in this presentation and any oral statements made regarding the subject of this presentation, that address activities, events or developments that Reliant Bancorp, Inc. (“Reliant” or the “Company”) expects, believes or
anticipates will or may occur in the future are “forward-looking statements” within the meaning of Section 27A of the Securities Act of 1933, as amended, and Section 21E of the Securities Exchange Act of 1934, as amended, and are made pursuant
to the safe harbor provisions of the Private Securities Litigation Reform Act of 1995, including statements relating to the Transactions (as defined below) being accretive to Reliant’s earnings in 2021, Reliant’s response to the coronavirus
(COVID-19) pandemic, and the Company’s 2020 strategies. The words “believe,” “anticipate,” “expect,” “may,” “will,” “assume,” “should,” “predict,” “could,” “would,” “intend,” “targets,” “estimates,” “projects,” “plans,” and “potential,” and
other similar words and expressions of the future, are intended to identify such forward-looking statements, but other statements not based on historical information may also be considered forward-looking, including statements about the
Company’s future financial and operating results and the Company’s plans, objectives, and intentions. All forward-looking statements are subject to risks, uncertainties, and other factors that may cause the actual results, performance, or
achievements of the Company to differ materially from any results, performance, or achievements expressed or implied by such forward-looking statements. Such risks, uncertainties, and other factors include, among others: (1) the global health
and economic crisis precipitated by the coronavirus (COVID-19) pandemic, (2) actions taken by governments, businesses and individuals in response to the coronavirus (COVID-19) pandemic, (3) the pace of recovery when the coronavirus (COVID-19)
pandemic subsides, (4) the possibility that our asset quality could decline or that we experience greater loan losses than anticipated, (5) increased levels of other real estate, primarily as a result of foreclosures, (6) the impact of
liquidity needs on our results of operations and financial condition, (7) competition from financial institutions and other financial service providers, (8) the effect of interest rate increases on the cost of deposits, (9) unanticipated
weakness in loan demand or loan pricing, (10) lack of strategic growth opportunities or our failure to execute on available opportunities, (11) deterioration in the financial condition of borrowers resulting in significant increases in loan
losses and provisions for those losses, (12) economic crises and associated credit issues in industries most impacted by the coronavirus (COVID-19) pandemic, including the restaurant, hospitality and retail sectors, (13) the ability to grow and
retain low-cost core deposits and retain large, uninsured deposits, (14) our ability to effectively manage problem credits, (15) our ability to successfully implement efficiency initiatives on time and with the results projected, (16) our
ability to successfully develop and market new products and technology, (17) the impact of negative developments in the financial industry and United States and global capital and credit markets, (18) our ability to retain the services of key
personnel, (19) our ability to adapt to technological changes, (20) risks associated with litigation, including the applicability of insurance coverage, (21) the vulnerability of Reliant Bank’s (the “Bank”) network and online banking portals,
and the systems of parties with whom the Company and the Bank contract, to unauthorized access, computer viruses, phishing schemes, spam attacks, human error, natural disasters, power loss, and other security breaches, (22) changes in state and
federal laws, rules, regulations, or policies applicable to banks or bank or financial holding companies, including regulatory or legislative developments, (23) adverse results (including costs, fines, reputational harm, and/or other negative
effects) from current or future litigation, regulatory examinations, or other legal and/or regulatory actions, (24) the risk that expected cost savings and revenue synergies from (a) the merger of the Company and Tennessee Community Bank
Holdings, Inc. (“TCB Holdings”) (the “TCB Holdings Transaction”) or (b) the merger of the Company and First Advantage Bancorp (“FABK”) (the “FABK Transaction” and, together with the TCB Holdings Transaction, collectively, the “Transactions”),
may not be realized or may take longer than anticipated to be realized, (25) the effect of the completion of the Transactions on our customer, supplier, or employee relationships and operating results (including without limitation difficulties
in maintaining relationships with employees and customers), as well as on the market price of the Company’s common stock, (26) the risk that the businesses and operations of TCB Holdings and its subsidiaries and of FABK and its subsidiaries
cannot be successfully integrated with the business and operations of the Company and its subsidiaries or that integration will be more costly or difficult than expected, (27) the amount of costs, fees, expenses, and charges related to the
Transactions, including those arising as a result of unexpected factors or events, (28) reputational risk associated with and the reaction of our customers, suppliers, employees, or other business partners to the Transactions, (29) the risk
associated with Company management’s attention being diverted away from the day-to-day business and operations of the Company to the integration of the Transactions, and (30) general competitive, economic, political, and market conditions,
including economic conditions in the local markets where we operate. Additional factors which could affect the forward-looking statements can be found in the Company’s annual report on Form 10-K, quarterly reports on Form 10-Q, and current
reports on Form 8-K filed with the Securities and Exchange Commission (the “SEC”) and available on the SEC’s website at http://www.sec.gov. The Company believes the forward-looking statements contained herein are reasonable; however, many of
such risks, uncertainties, and other factors are beyond the Company’s ability to control or predict and undue reliance should not be placed on any forward-looking statements, which are based on current expectations and speak only as of the date
that they are made. Therefore, the Company can give no assurance that its future results will be as estimated. The Company does not intend to, and disclaims any obligation to, update or revise any forward-looking statement. Non-GAAP Financial
MeasuresThis presentation contains certain financial measures that are not measures recognized under U.S. generally accepted accounting principles (“GAAP”) and, therefore, are considered non-GAAP financial measures. Members of the Company’s
management use these non-GAAP financial measures in their analysis of the Company’s performance, financial condition, and efficiency of operations. Management of the Company believes that these non-GAAP financial measures provide a greater
understanding of ongoing operations, enhance comparability of results with prior periods, and demonstrate the effects of significant gains and charges in the current period. Management of the Company also believes that investors find these
non-GAAP financial measures useful as they assist investors in understanding underlying operating performance and the analysis of ongoing operating trends. However, the non-GAAP financial measures discussed herein should not be considered in
isolation or as a substitute for the most directly comparable or other financial measures calculated in accordance with GAAP. Moreover, the manner in which the non-GAAP financial measures discussed herein are calculated may differ from that of
other companies reporting measures with similar names. You should understand how such other banking organizations calculate their financial measures similar to, or with names similar to, the non-GAAP financial measures we have discussed herein
when comparing such non-GAAP financial measures.The non-GAAP financial measures contained in this presentation include, without limitation, adjusted net income attributable to common shareholders, adjusted return on average assets (adjusted
ROAA), adjusted return on average equity (adjusted ROAE), adjusted return on average tangible common equity (adjusted ROATCE), ROATCE, adjusted quarterly earnings per share, adjusted net interest rate spread, adjusted net interest margin,
tangible assets, tangible common equity, tangible book value per share (TBVPS), tangible common equity to tangible assets (TCE/TA), adjusted non-interest expense, core bank efficiency ratio, core bank pre-tax, pre-provision income, and
allowance for loan losses plus unamortized loan accretion to total loans. 1

Pandemic - Our Response to COVID-19 EmployeesEnsuring Health and Safety of our Team
Members CommunitiesHelping the Communities we Serve PromiseMeet Needs through Actions Tailored After the Bank’s Values MissionDeliver Customer Service Preserve Capital Manage Expenses CommunitiesHelping the Communities we
Serve CommunitiesHelping the Communities we Serve Remain focused on delivering the bank’s promise to grow a community of friends— one relationship at a time, as we provide essential services to our neighbors and partner with local
non-profits to serve our communities Deployed and continue monitoring federal guidelines for effective protocol, including social distancing, to prevent the spread of the virusImplemented enhanced cleaning procedures with sterilization and
provided protective gear including hand sanitizers and masks Delivering service at all branches via drive thru facilities and lobby visits by appointment. ATMs continually replenished and accessible at all locations. Remote ATM access is also
available at over 32,000 surcharge-free ATMs nationwide through the MoneyPass® networkSuspended share repurchase program during 2020Suspended new capital projectsInstituted a hiring freezeSuspended business travelLimited discretionary
expenditures to only essential items As we navigate this unprecedented time, our commitment and focus on Reliant’s mission remains unchanged — to inspire and empower our employees, deliver exceptional customer experiences and give back to our
communities through involvement and outreach. This duty includes taking quick action to preserve capital and liquidity and aggressively manage expenses. Our employees and customers depend on us to do the right things, so we tailored our action
plan after the bank’s values with a special focus on communication, which is provided weekly via email, internal and external website blogs and CEO Townhall meetings. Each of these channels is used to provide bank updates and aide options as
they become available. 2

Pandemic - Our Response to COVID-19 (Cont’d) EmployeesEnsuring Health and Safety of our Team
Members CommunitiesHelping the Communities we Serve CommunitiesHelping the Communities we Serve CommunitiesHelping the Communities we Serve Adjusted our business model to implement telework for employees whose job
functions can be executed remotely, including virtual meetings using teleconferencing, Teams, Zoom and Go-To-MeetingReinvented employee training modules for virtual deliveryExtended coverage of First Stop Health Benefit to all employees – even
those not enrolled in Reliant’s group medical benefit, to provide virtual medical advice and assistanceEmployees with symptoms or who may have been exposed to the virus are asked to stay home – with full pay As a trusted financial advisor, we
continue to extend credit and are working directly with our customers impacted by COVID-19 to defer payments, modify loan and repayment terms, assist with overdraft/late fees, provide flexibility with early CD withdrawals and otherwise lend
assistance. Promise (cont’d)Meet Needs through Actions Tailored After the Bank’s Values We are serving as a participating lender with SBA’s Paycheck Protection Program to allow small business customers access to funds We are providing
hardship relief to credit cardholders— late fees waived from April 3- May 31 and ability to defer payments for up to three monthsWe have increased efforts to educate customers about digital and alternative options that allow them to bank
remotely, including: Trusted AdvisorWorking Directly With Those Impacted By COVID-19 24/7 Mobile App Online Banking/Bill Pay 24/7 ATMs Tap-To Pay 24/7 Telephone Banking Debit & Credit Cards 3
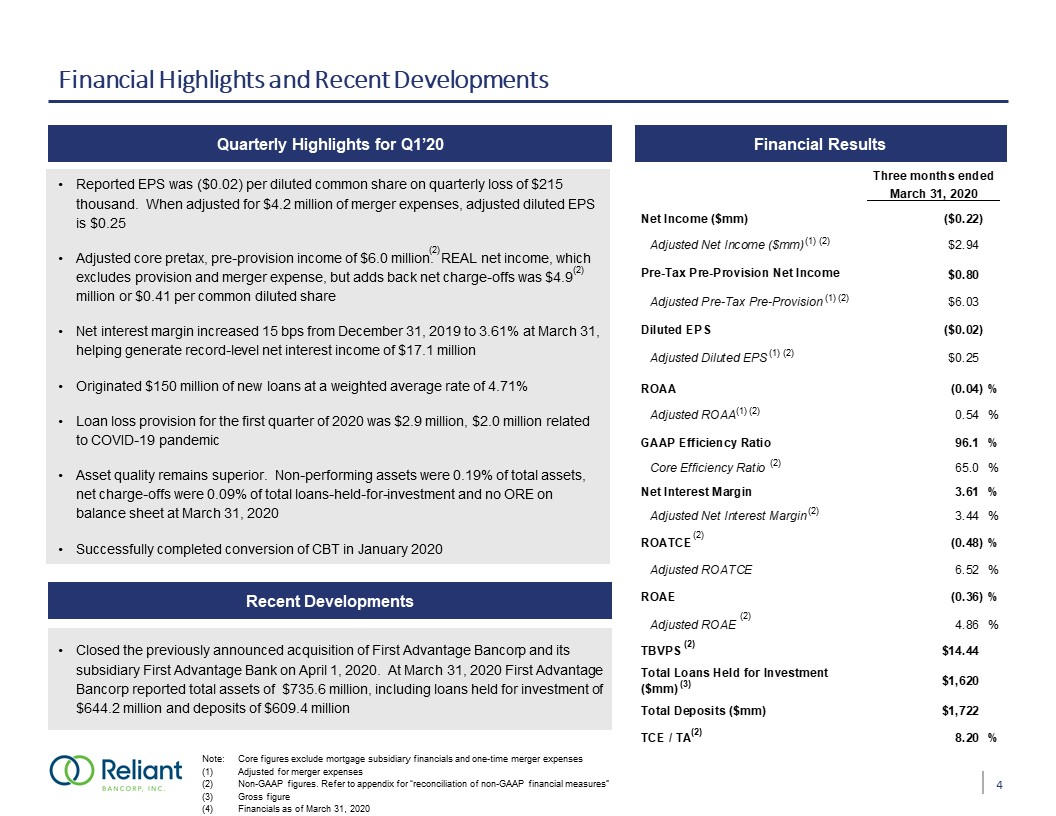
Financial Highlights and Recent Developments Quarterly Highlights for Q1’20 Financial
Results Note: Core figures exclude mortgage subsidiary financials and one-time merger expensesAdjusted for merger expensesNon-GAAP figures. Refer to appendix for “reconciliation of non-GAAP financial measures”Gross figureFinancials as of March
31, 2020 Reported EPS was ($0.02) per diluted common share on quarterly loss of $215 thousand. When adjusted for $4.2 million of merger expenses, adjusted diluted EPS is $0.25Adjusted core pretax, pre-provision income of $6.0 million. REAL
net income, which excludes provision and merger expense, but adds back net charge-offs was $4.9 million or $0.41 per common diluted shareNet interest margin increased 15 bps from December 31, 2019 to 3.61% at March 31, helping generate
record-level net interest income of $17.1 millionOriginated $150 million of new loans at a weighted average rate of 4.71%Loan loss provision for the first quarter of 2020 was $2.9 million, $2.0 million related to COVID-19 pandemicAsset quality
remains superior. Non-performing assets were 0.19% of total assets, net charge-offs were 0.09% of total loans-held-for-investment and no ORE on balance sheet at March 31, 2020Successfully completed conversion of CBT in January 2020 Closed the
previously announced acquisition of First Advantage Bancorp and its subsidiary First Advantage Bank on April 1, 2020. At March 31, 2020 First Advantage Bancorp reported total assets of $735.6 million, including loans held for investment of
$644.2 million and deposits of $609.4 million Recent Developments (3) (2) (2) (1) (1) (1) (1) (2) (2) (2) (2) (2) (2) (2) (2) 4 (2) (2)
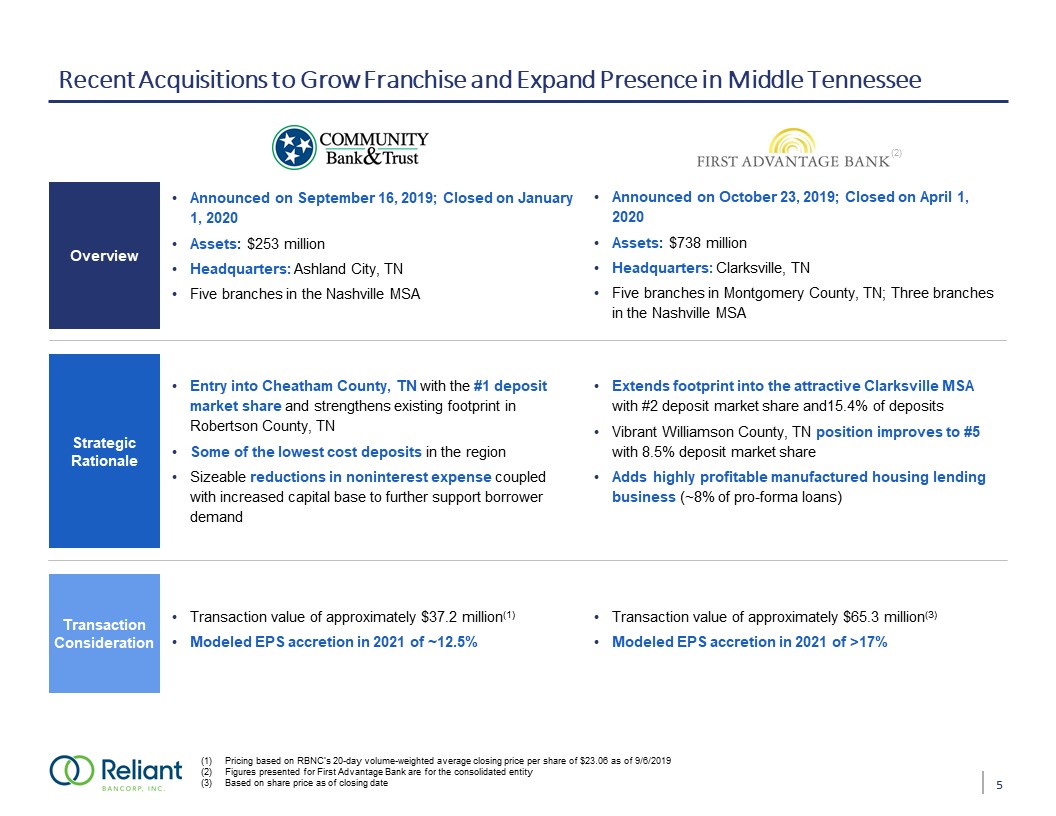
Recent Acquisitions to Grow Franchise and Expand Presence in Middle Tennessee Pricing based on RBNC’s
20-day volume-weighted average closing price per share of $23.06 as of 9/6/2019Figures presented for First Advantage Bank are for the consolidated entityBased on share price as of closing date Announced on September 16, 2019; Closed on January
1, 2020Assets: $253 millionHeadquarters: Ashland City, TN Five branches in the Nashville MSA Announced on October 23, 2019; Closed on April 1, 2020Assets: $738 millionHeadquarters: Clarksville, TN Five branches in Montgomery County, TN; Three
branches in the Nashville MSA Entry into Cheatham County, TN with the #1 deposit market share and strengthens existing footprint in Robertson County, TNSome of the lowest cost deposits in the regionSizeable reductions in noninterest expense
coupled with increased capital base to further support borrower demand Extends footprint into the attractive Clarksville MSA with #2 deposit market share and15.4% of depositsVibrant Williamson County, TN position improves to #5 with 8.5%
deposit market shareAdds highly profitable manufactured housing lending business (~8% of pro-forma loans) Transaction value of approximately $37.2 million(1)Modeled EPS accretion in 2021 of ~12.5% Transaction value of approximately $65.3
million(3)Modeled EPS accretion in 2021 of >17% Overview Strategic Rationale Transaction Consideration (2) 5
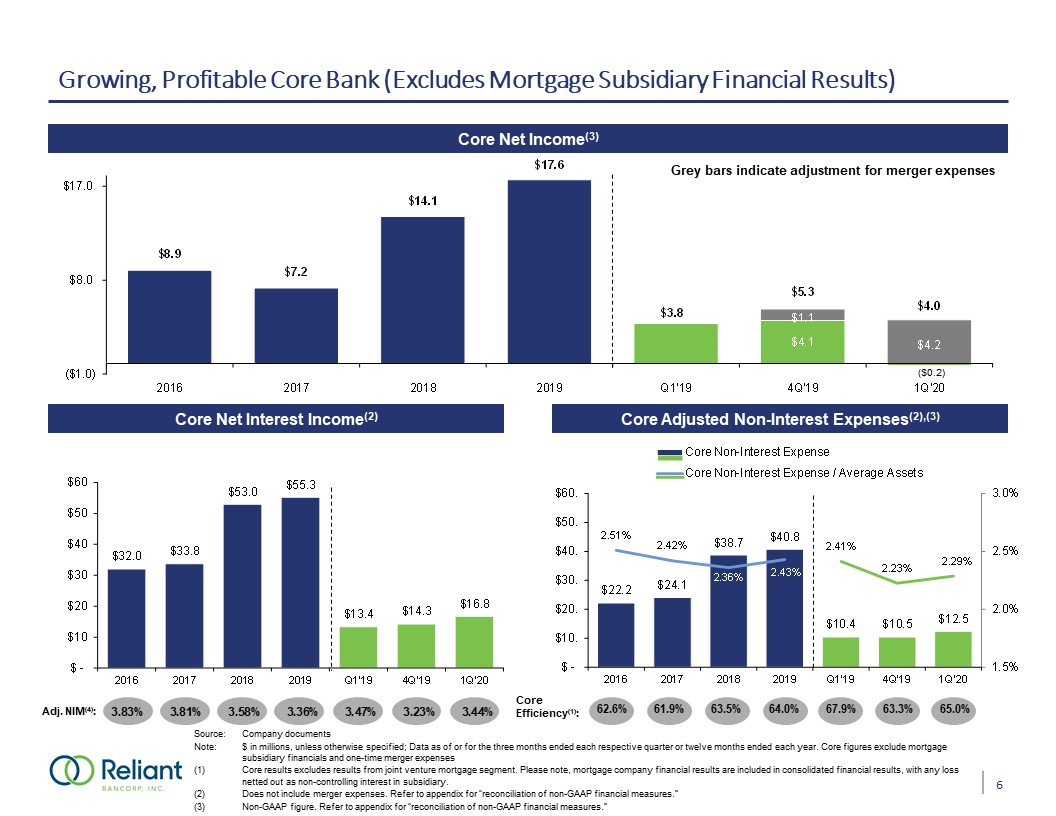
Growing, Profitable Core Bank (Excludes Mortgage Subsidiary Financial Results) Core Net
Income(3) Source: Company documentsNote: $ in millions, unless otherwise specified; Data as of or for the three months ended each respective quarter or twelve months ended each year. Core figures exclude mortgage subsidiary financials and
one-time merger expensesCore results excludes results from joint venture mortgage segment. Please note, mortgage company financial results are included in consolidated financial results, with any loss netted out as non-controlling interest in
subsidiary.Does not include merger expenses. Refer to appendix for “reconciliation of non-GAAP financial measures.”Non-GAAP figure. Refer to appendix for “reconciliation of non-GAAP financial measures.” Core Net Interest Income(2) Core
Adjusted Non-Interest Expenses(2),(3) Adj. NIM(4): Core Efficiency(1): Grey bars indicate adjustment for merger expenses ($0.2) 6
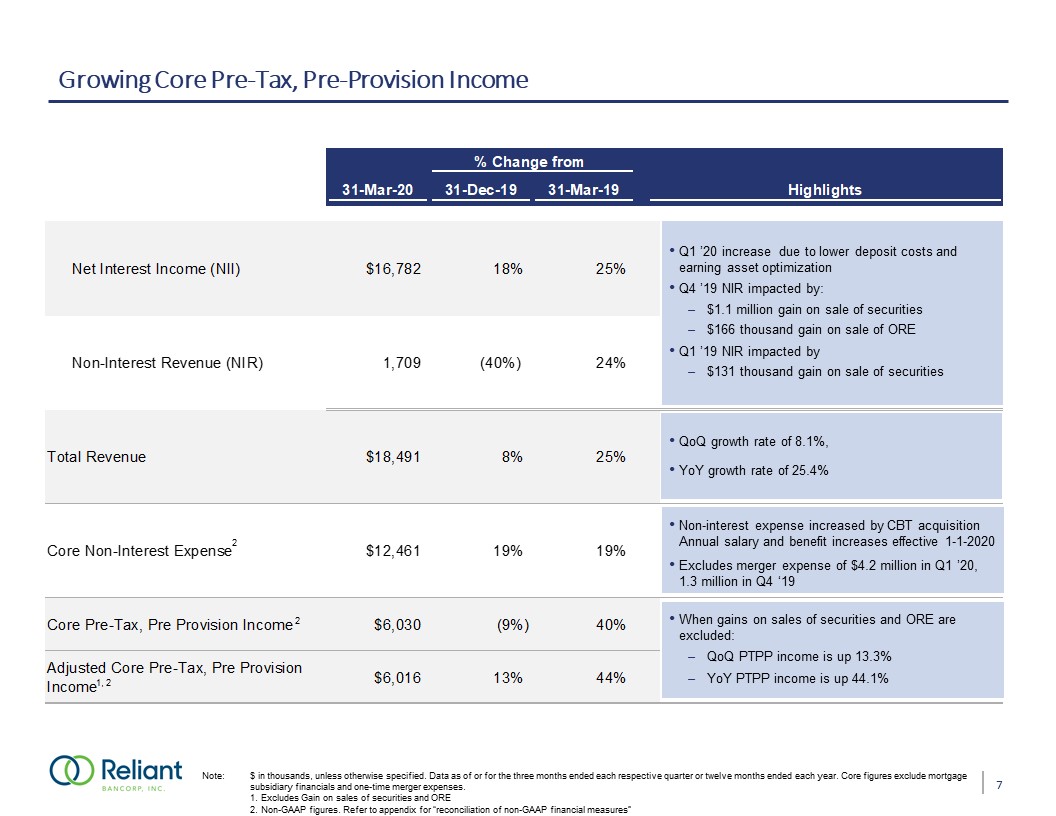
Growing Core Pre-Tax, Pre-Provision Income Q1 ’20 increase due to lower deposit costs and
earning asset optimizationQ4 ’19 NIR impacted by: $1.1 million gain on sale of securities $166 thousand gain on sale of OREQ1 ’19 NIR impacted by$131 thousand gain on sale of securities Q4 19 NII impacted by 1.1 million gain on sale of
securities$166 thousand gain on sale of OREQ1 19 NII impacted by$131 thousand gain on sale of securities QoQ growth rate of 8.1%, YoY growth rate of 25.4% Non-interest expense increased by CBT acquisition Annual salary and benefit increases
effective 1-1-2020Excludes merger expense of $4.2 million in Q1 ’20, 1.3 million in Q4 ‘19 When gains on sales of securities and ORE are excluded:QoQ PTPP income is up 13.3% YoY PTPP income is up 44.1% Note: $ in thousands, unless otherwise
specified. Data as of or for the three months ended each respective quarter or twelve months ended each year. Core figures exclude mortgage subsidiary financials and one-time merger expenses. Excludes Gain on sales of securities and ORE
Non-GAAP figures. Refer to appendix for “reconciliation of non-GAAP financial measures” 1, 7 2 2 2

Diverse Deposit Portfolio Mix Cost of IB Deposits: Cost of Funds: Note: $ in millions, unless
otherwise specified. Data as of or for the three months ended each respective quarter or twelve months ended each year. Reflects consolidated numbers for Reliant Bancorp, Inc. Wholesale and Other Purchased Funds 0.49% 0.73% 1.15% 1.67%
1.58% 1.62% 1.37% 0.40% 0.61% 0.96% 1.42% 1.35% 1.37% 1.12% 0.43% 0.66% 1.07% 1.48% 1.44% 1.43% 1.30% Total Deposits CAGR: 28.4% % of Total Deposits: Wt. Avg. Cost: Wt. Avg. Duration
(Months): 2.35% 2.34% 2.10% 1.85% 1.13% 1.5 3.0 2.2 2.0 2.0 Cost of Total Deposits: 8
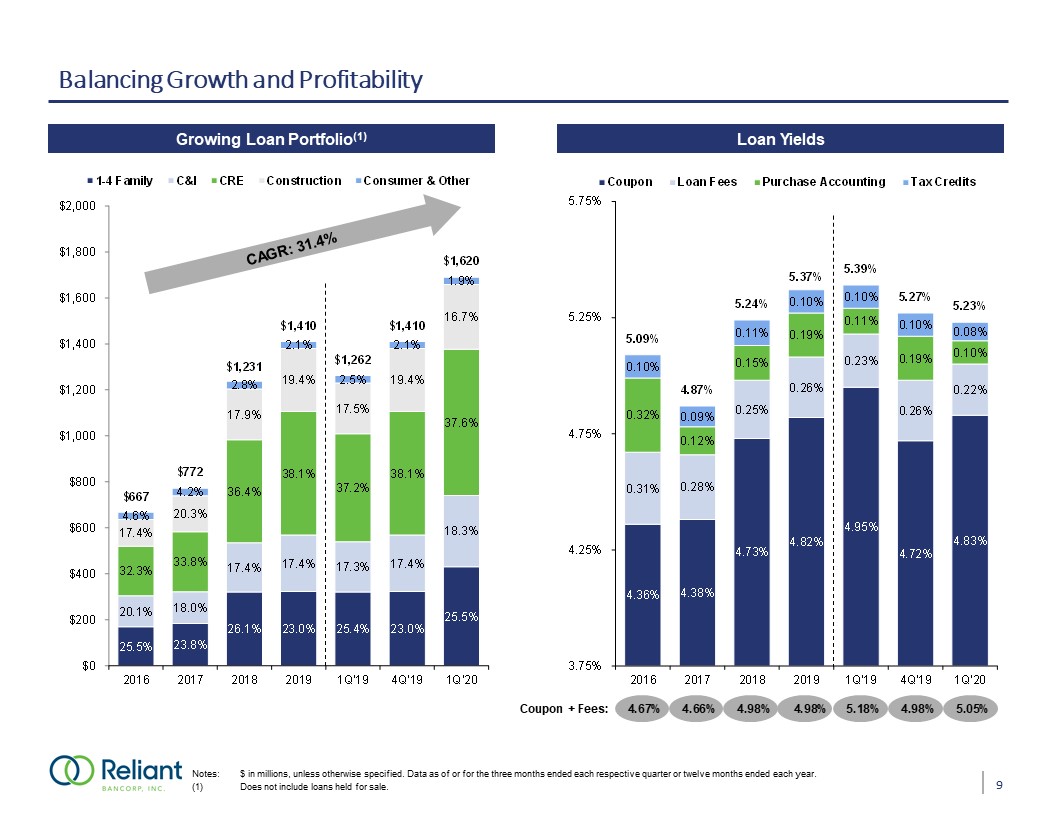
Balancing Growth and Profitability Coupon + Fees: Growing Loan Portfolio(1) Notes: $ in
millions, unless otherwise specified. Data as of or for the three months ended each respective quarter or twelve months ended each year. (1) Does not include loans held for sale. CAGR: 31.4% Loan Yields 9
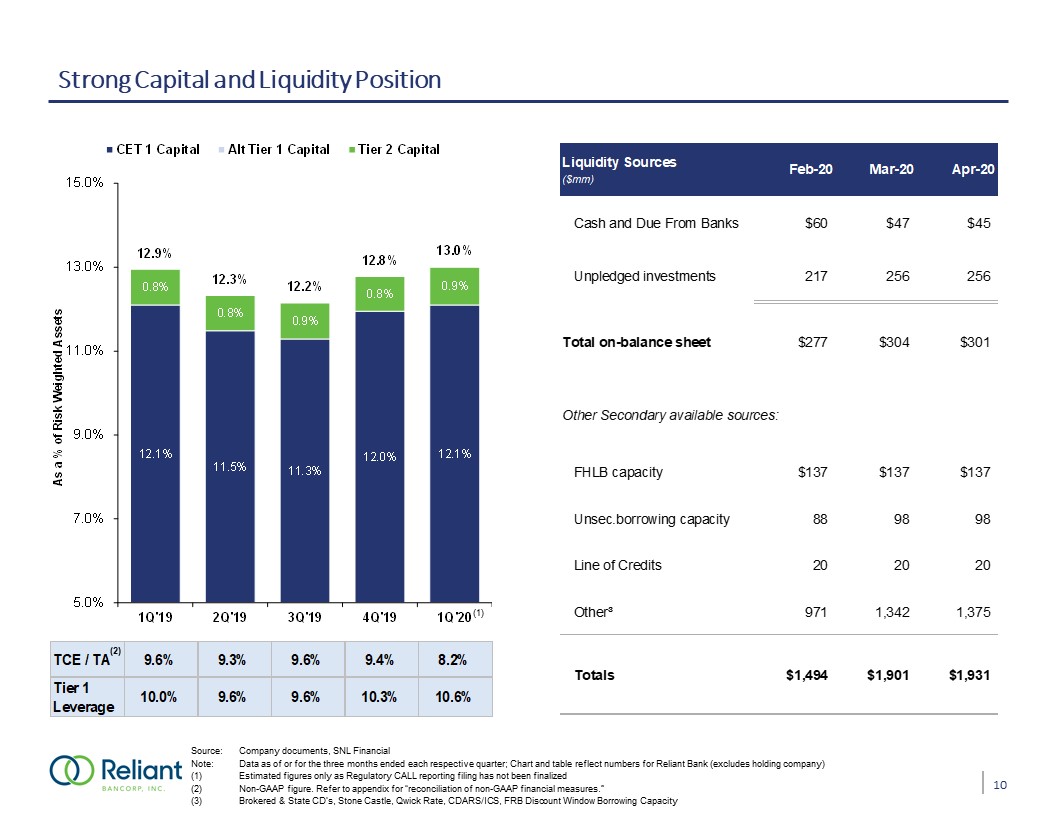
Strong Capital and Liquidity Position Source: Company documents, SNL FinancialNote: Data as of or for
the three months ended each respective quarter; Chart and table reflect numbers for Reliant Bank (excludes holding company)Estimated figures only as Regulatory CALL reporting filing has not been finalized Non-GAAP figure. Refer to appendix for
“reconciliation of non-GAAP financial measures.”Brokered & State CD’s, Stone Castle, Qwick Rate, CDARS/ICS, FRB Discount Window Borrowing Capacity (1) (2) 10
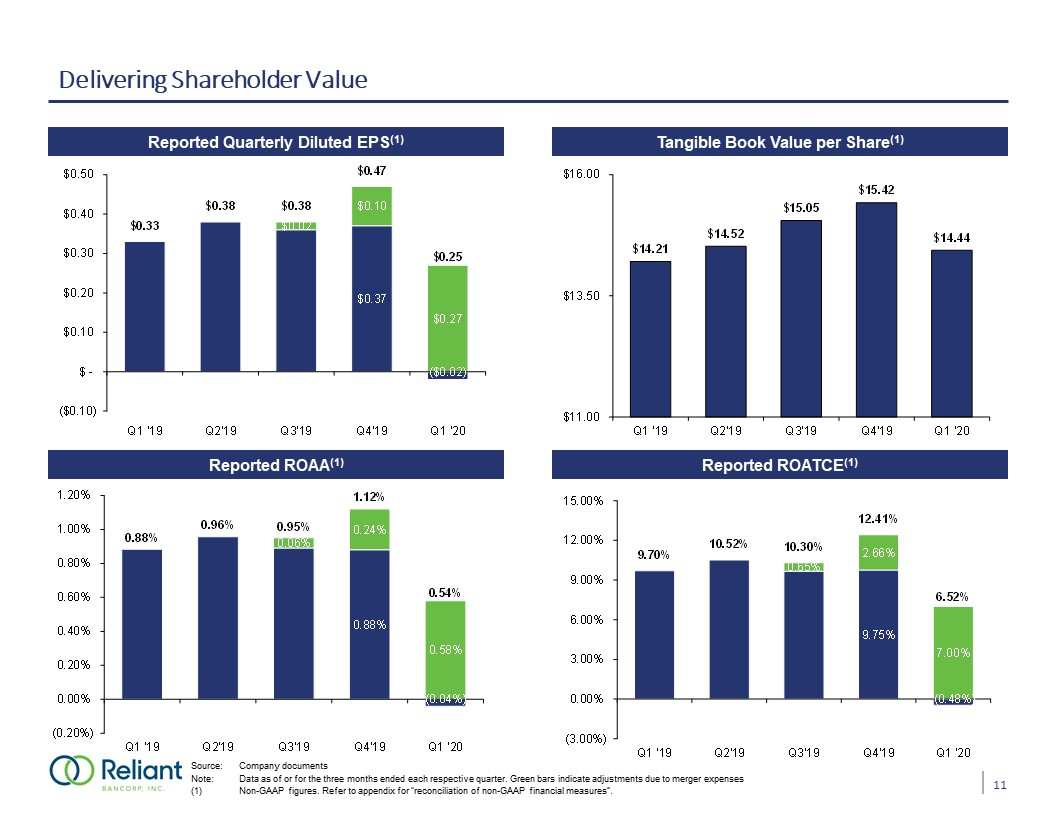
Delivering Shareholder Value Reported Quarterly Diluted EPS(1) Tangible Book Value per
Share(1) Reported ROAA(1) Reported ROATCE(1) Source: Company documentsNote: Data as of or for the three months ended each respective quarter. Green bars indicate adjustments due to merger expenses (1) Non-GAAP figures. Refer to appendix for
“reconciliation of non-GAAP financial measures”. 11
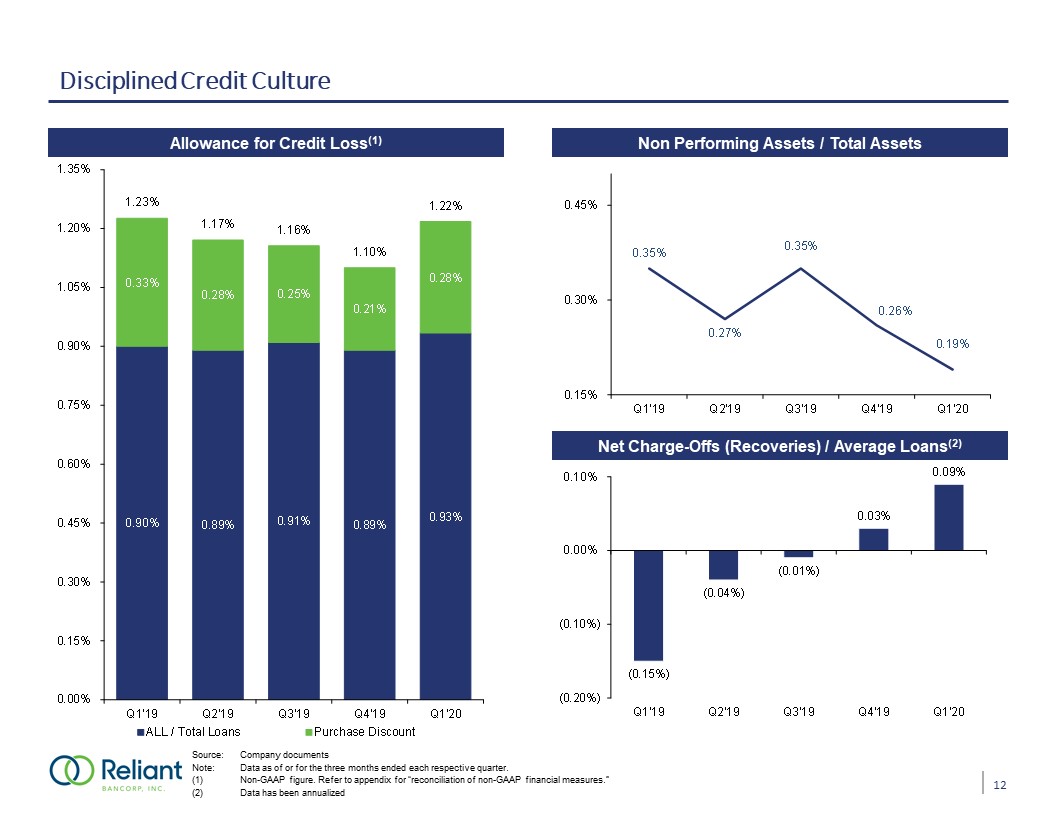
Disciplined Credit Culture Allowance for Credit Loss(1) Net Charge-Offs (Recoveries) / Average
Loans(2) Non Performing Assets / Total Assets Source: Company documentsNote: Data as of or for the three months ended each respective quarter.Non-GAAP figure. Refer to appendix for “reconciliation of non-GAAP financial measures.”Data has been
annualized 12

Reconciliation of Reserves Reserves / Loans (%) (Reserves + Discount) / Loans (%) Note: Data as of
13/31/2019 and as of the three months ended 3/31/20, respectivelyAssumes partial amortization of existing acquired loan discount $2.9 mm $35.0 mm $174.0 mm $2.9 mm $35.0 mm $174.0 mm $1.4 mm Acquired Loan
Discount A B C D E F G H I J K L M N 1 1 13
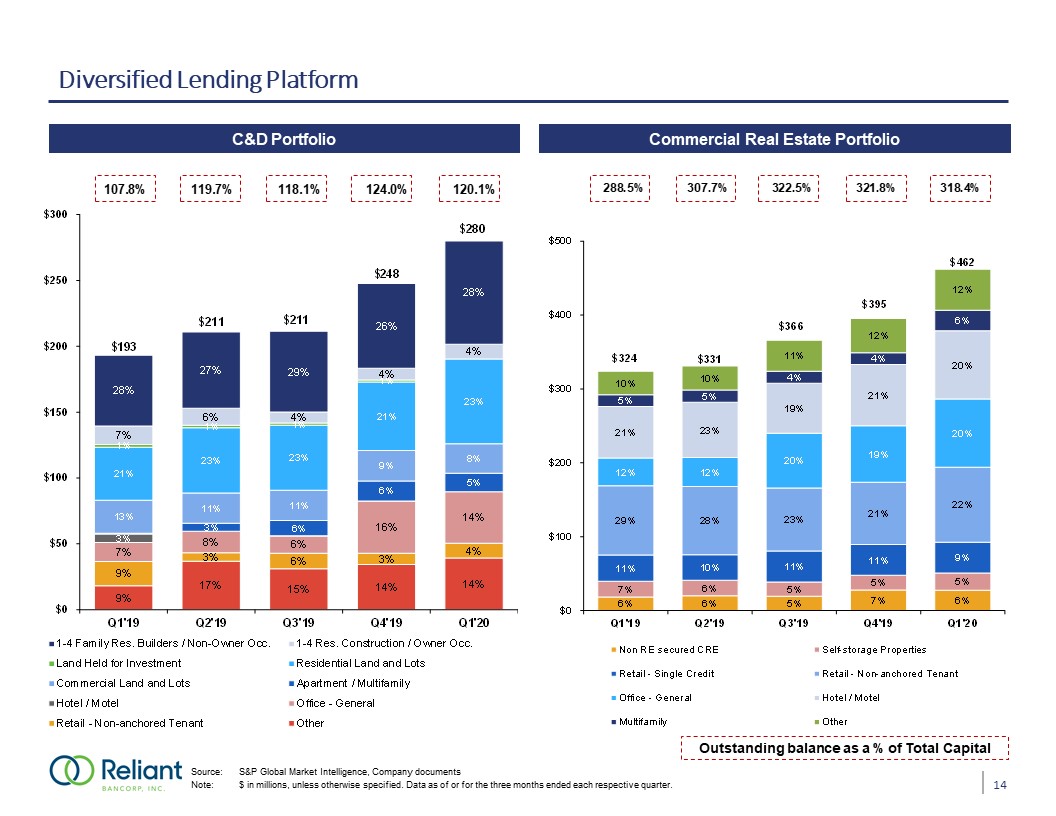
Diversified Lending Platform C&D Portfolio Commercial Real Estate Portfolio Source: S&P Global
Market Intelligence, Company documentsNote: $ in millions, unless otherwise specified. Data as of or for the three months ended each respective quarter. Outstanding balance as a % of Total Capital 14
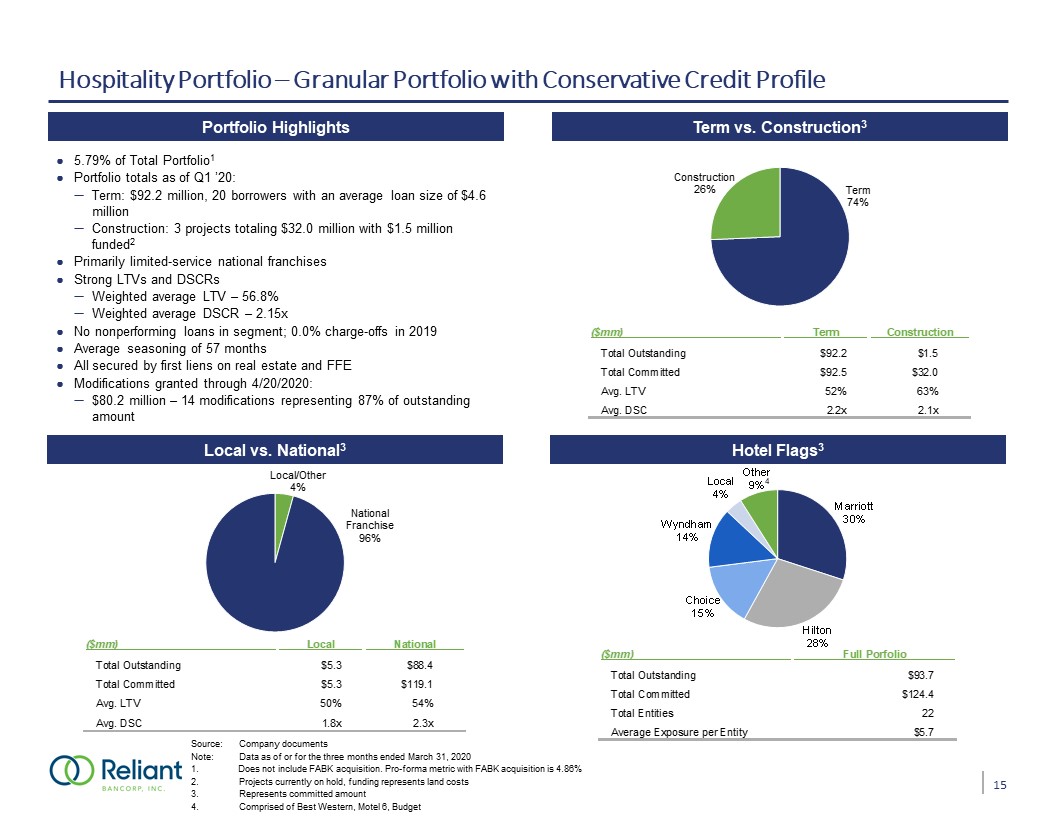
Hospitality Portfolio – Granular Portfolio with Conservative Credit Profile Source: Company
documentsNote: Data as of or for the three months ended March 31, 2020 Does not include FABK acquisition. Pro-forma metric with FABK acquisition is 4.86%Projects currently on hold, funding represents land costs Represents committed
amountComprised of Best Western, Motel 6, Budget Total $93.7 million Total $124.4 million Local vs. National3 Term vs. Construction3 Portfolio Highlights Hotel Flags3 5.79% of Total Portfolio1Portfolio totals as of Q1 ’20: Term: $92.2
million, 20 borrowers with an average loan size of $4.6 millionConstruction: 3 projects totaling $32.0 million with $1.5 million funded2 Primarily limited-service national franchisesStrong LTVs and DSCRsWeighted average LTV – 56.8% Weighted
average DSCR – 2.15xNo nonperforming loans in segment; 0.0% charge-offs in 2019Average seasoning of 57 monthsAll secured by first liens on real estate and FFE Modifications granted through 4/20/2020:$80.2 million – 14 modifications representing
87% of outstanding amount 4 15
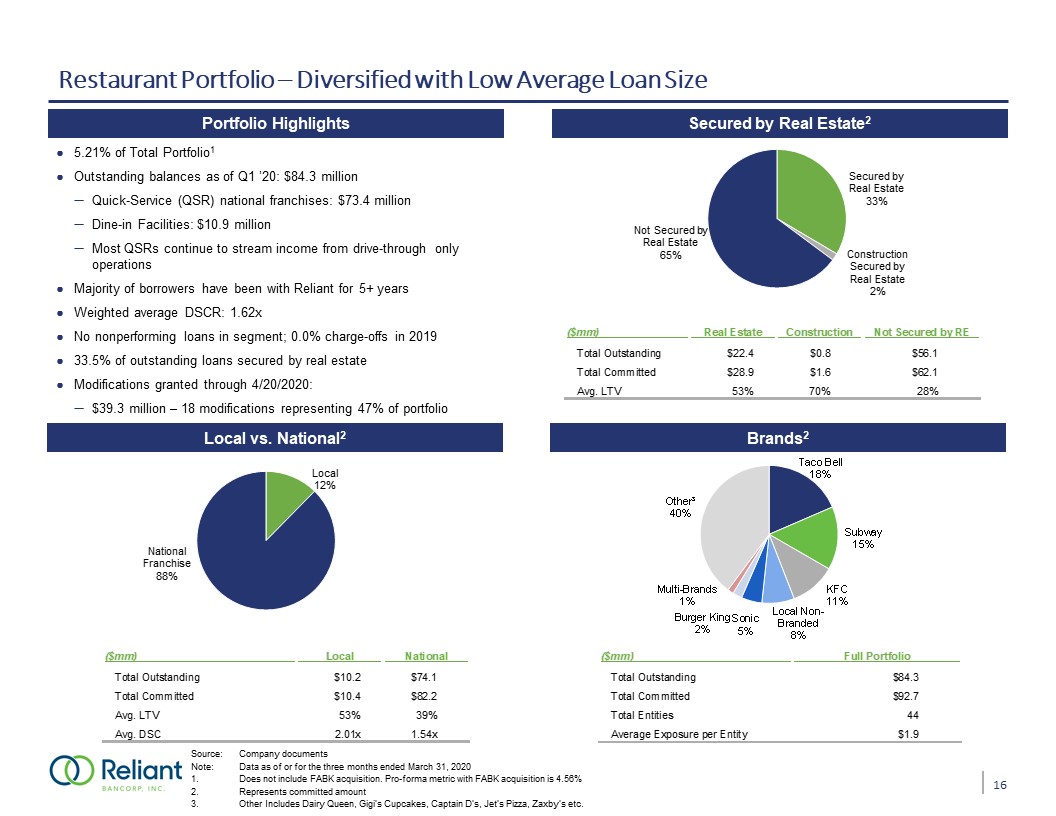
Restaurant Portfolio – Diversified with Low Average Loan Size Source: Company documentsNote: Data as of
or for the three months ended March 31, 2020Does not include FABK acquisition. Pro-forma metric with FABK acquisition is 4.56%Represents committed amountOther Includes Dairy Queen, Gigi’s Cupcakes, Captain D’s, Jet’s Pizza, Zaxby’s etc. Total
$93.7 million Total $124.4 million Portfolio Statistics Burger King Local vs. National2 Secured by Real Estate2 Portfolio Highlights Brands2 5.21% of Total Portfolio1Outstanding balances as of Q1 ’20: $84.3 millionQuick-Service (QSR)
national franchises: $73.4 millionDine-in Facilities: $10.9 millionMost QSRs continue to stream income from drive-through only operationsMajority of borrowers have been with Reliant for 5+ yearsWeighted average DSCR: 1.62x No nonperforming
loans in segment; 0.0% charge-offs in 201933.5% of outstanding loans secured by real estateModifications granted through 4/20/2020:$39.3 million – 18 modifications representing 47% of portfolio DSCR and ‘Other’ brand numbers under
progress 16

Manufactured Housing Portfolio Source: Company documentsNote: Not included in 3/31/2020 loan portfolio
numbers; merger completed 4/1/20201, As of March 31, 2020Secured as personal propertyAnnualized number Total $93.7 million Total $124.4 million Performance Metrics Geographic Distribution Portfolio Highlights Portfolio
Segmentation Specialized lending LOB acquired as part of the acquisition of First Advantage Specialized lending team consists of 30 employees and is housed in Knoxville, TNLends exclusively to fund the acquisition of manufactured homes in 8
states in the Southeast; direct consumer lending Portfolio total - $190.3 million (8.43% of combined portfolios)¹Chattel - $163.5 millionMortgage - $26.8 millionWeighted average interest rate - 8.49%Average loan size - $52,525Average FICO score
for borrower - 665Modifications granted through 4/15/2020 205 loans representing 6% of portfolio ($ in thousands) Total $190,297 17
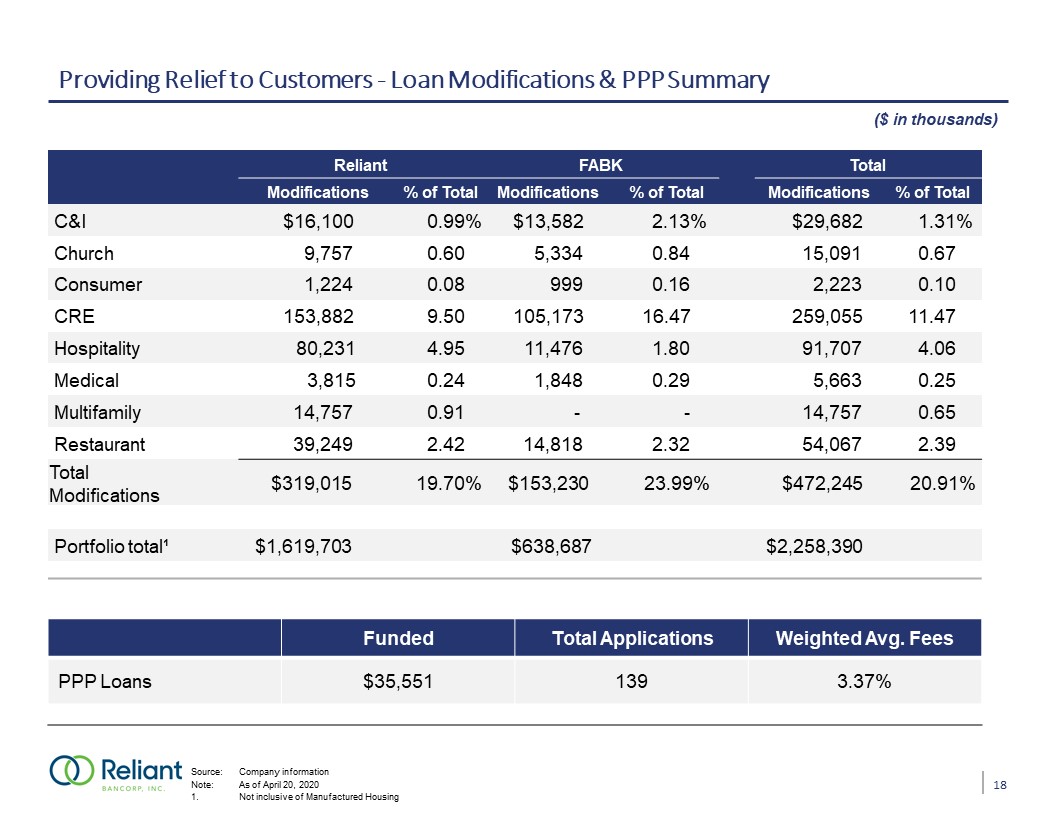
Providing Relief to Customers - Loan Modifications & PPP Summary Q4 19 NII impacted by 1.1 million
gain on sale of securities$166 thousand gain on sale of OREQ1 19 NII impacted by$131 thousand gain on sale of securities Reliant FABK Total Modifications % of Total Modifications % of Total Modifications % of
Total C&I $16,100 0.99% $13,582 2.13% $29,682 1.31% Church 9,757 0.60 5,334 0.84 15,091 0.67 Consumer 1,224 0.08 999 0.16 2,223 0.10 CRE 153,882 9.50 105,173
16.47 259,055 11.47 Hospitality 80,231 4.95 11,476 1.80 91,707 4.06 Medical 3,815 0.24 1,848 0.29 5,663 0.25 Multifamily 14,757 0.91 - - 14,757 0.65 Restaurant
39,249 2.42 14,818 2.32 54,067 2.39 Total Modifications $319,015 19.70% $153,230 23.99% $472,245 20.91% Portfolio total¹ $1,619,703 $638,687 $2,258,390
($ in thousands) Source: Company informationNote: As of April 20, 20201. Not inclusive of Manufactured Housing Funded Total Applications Weighted Avg. Fees PPP Loans $35,551 139 3.37% 18
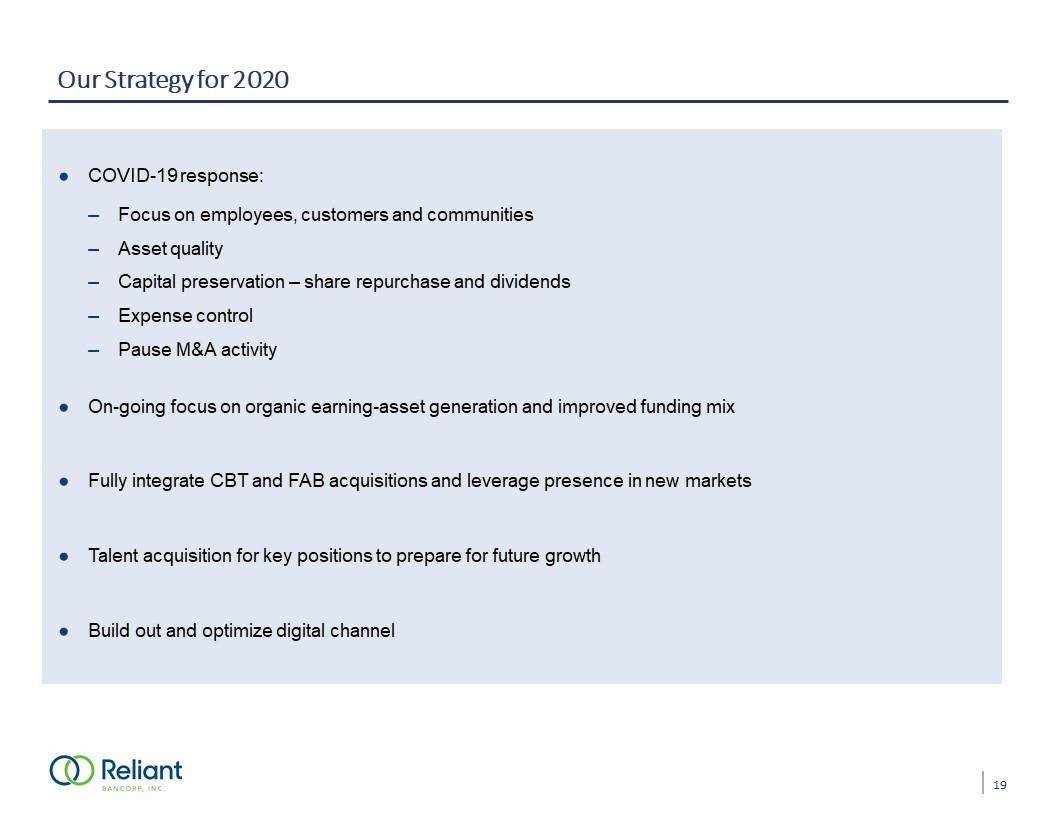
Our Strategy for 2020 COVID-19 response:Focus on employees, customers and communitiesAsset
qualityCapital preservation – share repurchase and dividendsExpense controlPause M&A activityOn-going focus on organic earning-asset generation and improved funding mixFully integrate CBT and FAB acquisitions and leverage presence in new
marketsTalent acquisition for key positions to prepare for future growthBuild out and optimize digital channel 19

Appendix
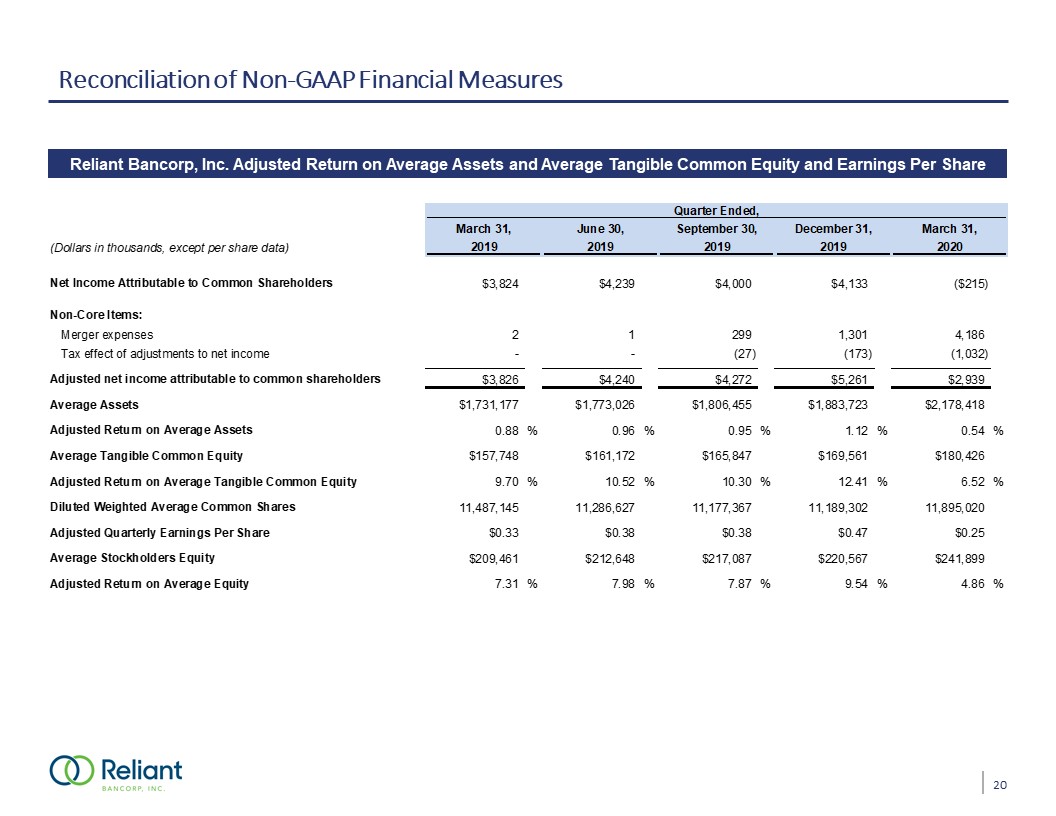
Reconciliation of Non-GAAP Financial Measures Reliant Bancorp, Inc. Adjusted Return on Average Assets
and Average Tangible Common Equity and Earnings Per Share 20
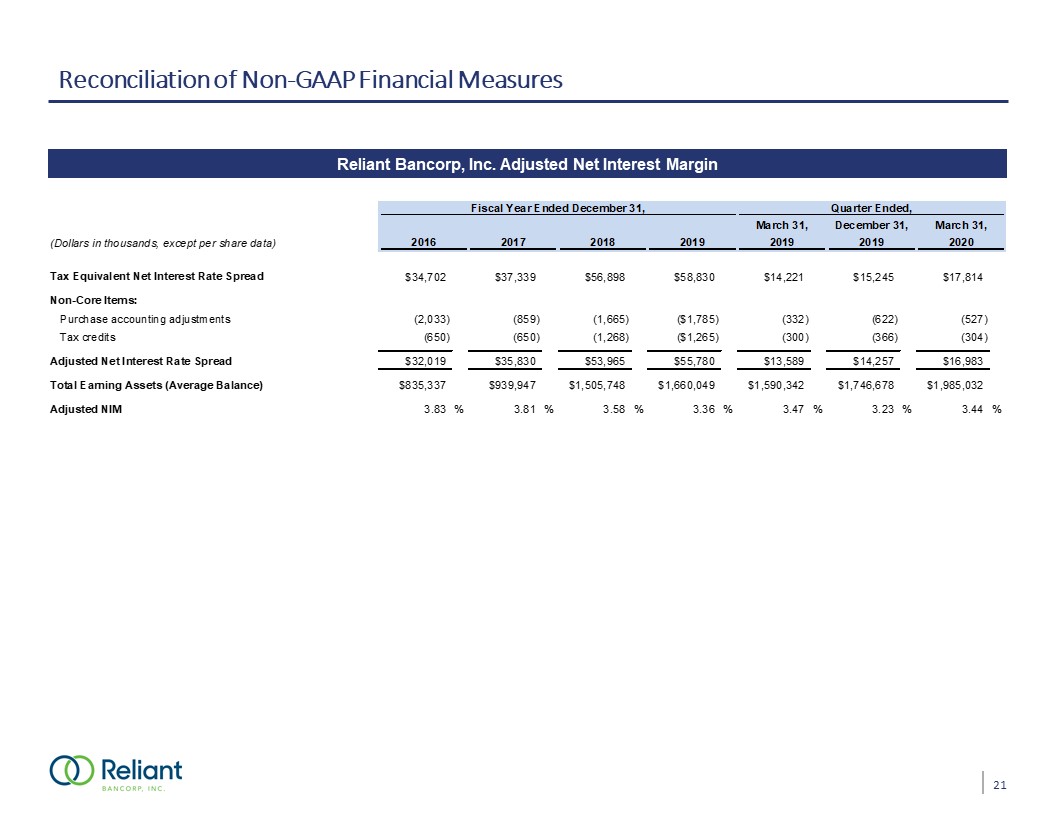
Reconciliation of Non-GAAP Financial Measures Reliant Bancorp, Inc. Adjusted Net Interest Margin 21

Reconciliation of Non-GAAP Financial Measures Reliant Bancorp, Inc. Tangible Common Equity to Tangible
Assets and Tangible Book Value per Share 22
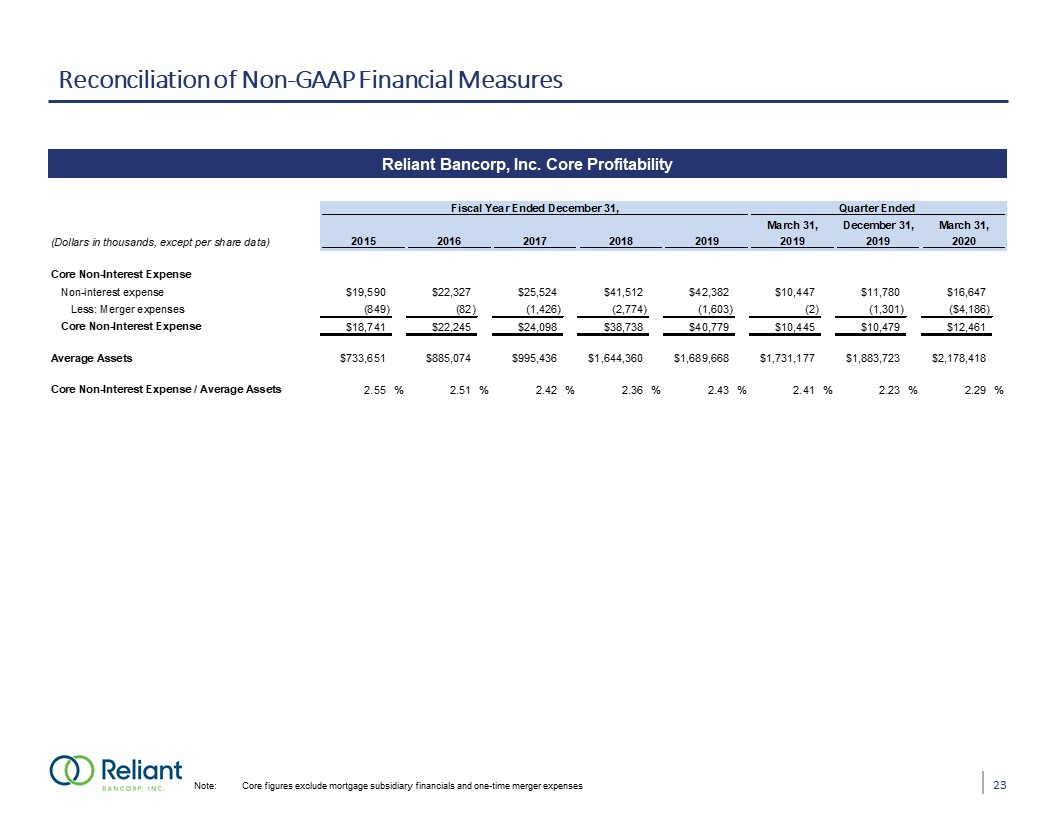
Reconciliation of Non-GAAP Financial Measures Reliant Bancorp, Inc. Core Profitability Note: Core
figures exclude mortgage subsidiary financials and one-time merger expenses 23
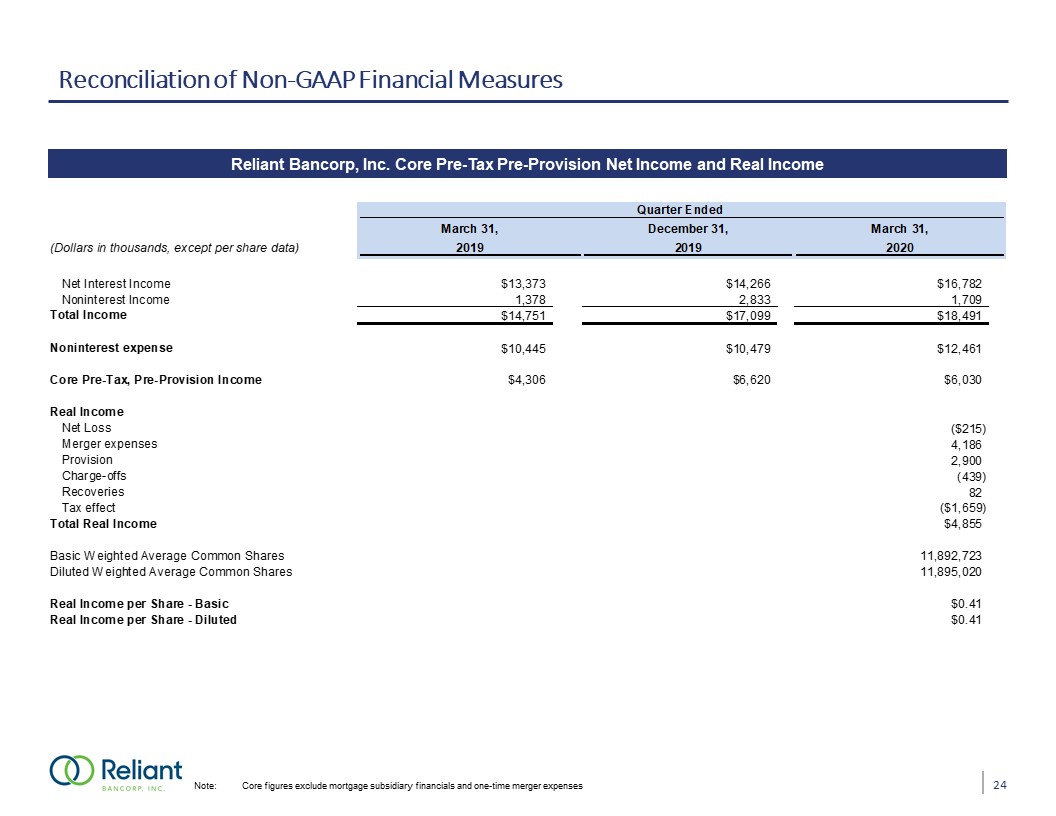
Reconciliation of Non-GAAP Financial Measures Reliant Bancorp, Inc. Core Pre-Tax Pre-Provision Net
Income and Real Income Note: Core figures exclude mortgage subsidiary financials and one-time merger expenses 24

Reconciliation of Non-GAAP Financial Measures Reliant Bancorp, Inc. Core Efficiency Ratio Note: Core
figures exclude mortgage subsidiary financials and one-time merger expenses 25

Reconciliation of Non-GAAP Financial Measures Reliant Bancorp, Inc. Loan Reserves 26