Attached files
| file | filename |
|---|---|
| 8-K - 8-K - MIDWEST HOLDING INC. | mdwt-20200427x8k.htm |
Exhibit 99.1
|
|
© Midwest Holding Inc. Investor Presentation April 2020 |
|
|
Forward-Looking Statements This presentation contains forward-looking statements within the meaning of Section 27A of the Securities Act of 1933, as amended (the “Securities Act”), and Section 21E of the Securities Exchange Act of 1934, as amended (the “Exchange Act”). Statements that are not strictly historical statements constitute forward-looking statements and may often, but not always, be identified by the use of such words such as “expects,” “believes,” “intends,” “anticipates,” “plans,” “estimates,” “potential,” “possible,” or “probable” or statements that certain actions, events or results “may,” “will,” “should,” or “could” be taken, occur or be achieved. The forward-looking statements include statements about pricing assumptions, future operations, estimates of insurance policy production volumes, and estimates of future growth potential. Forward-looking statements are based on expectations and assumptions and analysis made by Midwest Holding Inc. (“Midwest”) in light of experience and perception of limited historical experience, current conditions and expected future developments, as well as other relevant factors. However, whether actual results and developments with conform with expectations is subject to a number of material risks and uncertainties, including adverse changes in the U.S. economy, incorrect estimates of product development, sales and profitability, failure by our reinsurers to meet their obligations, non-performing investments, timing and success of licensing to sell insurance products in other states and adverse effects of any loss of our management team. Midwest’s Annual Report on Form 10-K for the year ended December 31, 2019 and other Securities and Exchange Commission (“SEC”) filings discuss some of the important risk factors identified that may affect our business, results of operations and financial condition. Midwest undertakes no obligation to revise or updated publicly any forward-looking statements except as required by law. Disclaimer |
|
|
Table of Contents Market Environment Company Overview Business Model and Reinsurance Financial Highlights Appendix A: Non-GAAP Reconciliations Appendix B: Public Trading Data 1 2 3 Page 4 7 19 25 34 37 4 5 6 |
|
|
I. Market Environment |
|
|
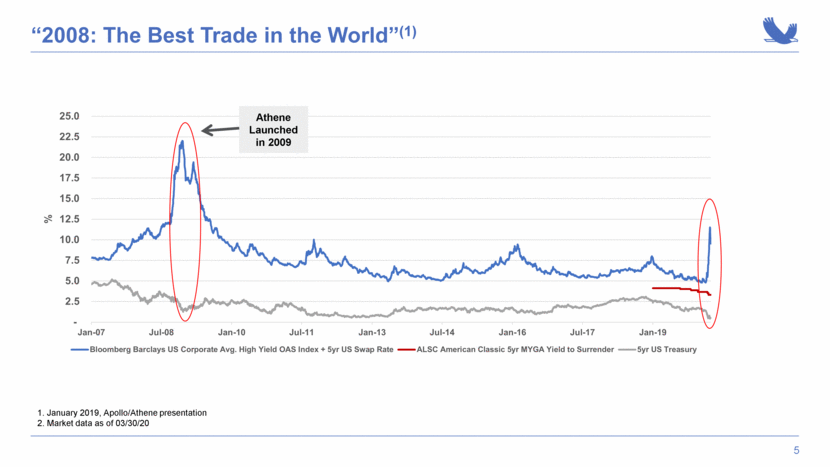
“2008: The Best Trade in the World”(1) Athene Launched in 2009 1. January 2019, Apollo/Athene presentation 2. Market data as of 03/30/20 - 2.5 5.0 7.5 10.0 12.5 15.0 17.5 20.0 22.5 25.0 Jan-07 Jul-08 Jan-10 Jul-11 Jan-13 Jul-14 Jan-16 Jul-17 Jan-19 % Bloomberg Barclays US Corporate Avg. High Yield OAS Index + 5yr US Swap Rate ALSC American Classic 5yr MYGA Yield to Surrender 5yr US Treasury |
|
|
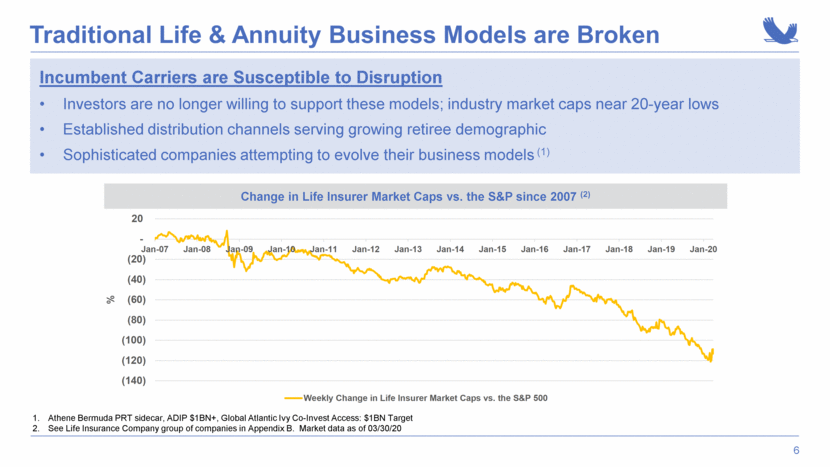
Traditional Life & Annuity Business Models are Broken Incumbent Carriers are Susceptible to Disruption Investors are no longer willing to support these models; industry market caps near 20-year lows Established distribution channels serving growing retiree demographic Sophisticated companies attempting to evolve their business models (1) Change in Life Insurer Market Caps vs. the S&P since 2007 (2) Athene Bermuda PRT sidecar, ADIP $1BN+, Global Atlantic Ivy Co-Invest Access: $1BN Target See Life Insurance Company group of companies in Appendix B. Market data as of 03/30/20 (140) (120) (100) (80) (60) (40) (20) - 20 Jan-07 Jan-08 Jan-09 Jan-10 Jan-11 Jan-12 Jan-13 Jan-14 Jan-15 Jan-16 Jan-17 Jan-18 Jan-19 Jan-20 % Weekly Change in Life Insurer Market Caps vs. the S&P 500 |
|
|
II. Company Overview |
|
|
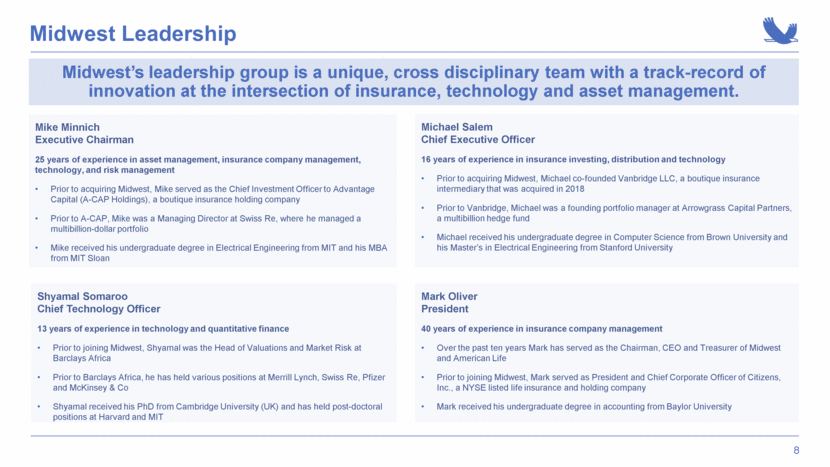
Midwest Leadership Mike Minnich Executive Chairman 25 years of experience in asset management, insurance company management, technology, and risk management Prior to acquiring Midwest, Mike served as the Chief Investment Officer to Advantage Capital (A-CAP Holdings), a boutique insurance holding company Prior to A-CAP, Mike was a Managing Director at Swiss Re, where he managed a multibillion-dollar portfolio Mike received his undergraduate degree in Electrical Engineering from MIT and his MBA from MIT Sloan Mark Oliver President 40 years of experience in insurance company management Over the past ten years Mark has served as the Chairman, CEO and Treasurer of Midwest and American Life Prior to joining Midwest, Mark served as President and Chief Corporate Officer of Citizens, Inc., a NYSE listed life insurance and holding company Mark received his undergraduate degree in accounting from Baylor University Midwest’s leadership group is a unique, cross disciplinary team with a track-record of innovation at the intersection of insurance, technology and asset management. Michael Salem Chief Executive Officer 16 years of experience in insurance investing, distribution and technology Prior to acquiring Midwest, Michael co-founded Vanbridge LLC, a boutique insurance intermediary that was acquired in 2018 Prior to Vanbridge, Michael was a founding portfolio manager at Arrowgrass Capital Partners, a multibillion hedge fund Michael received his undergraduate degree in Computer Science from Brown University and his Master’s in Electrical Engineering from Stanford University Shyamal Somaroo Chief Technology Officer 13 years of experience in technology and quantitative finance Prior to joining Midwest, Shyamal was the Head of Valuations and Market Risk at Barclays Africa Prior to Barclays Africa, he has held various positions at Merrill Lynch, Swiss Re, Pfizer and McKinsey & Co Shyamal received his PhD from Cambridge University (UK) and has held post-doctoral positions at Harvard and MIT |
|
|
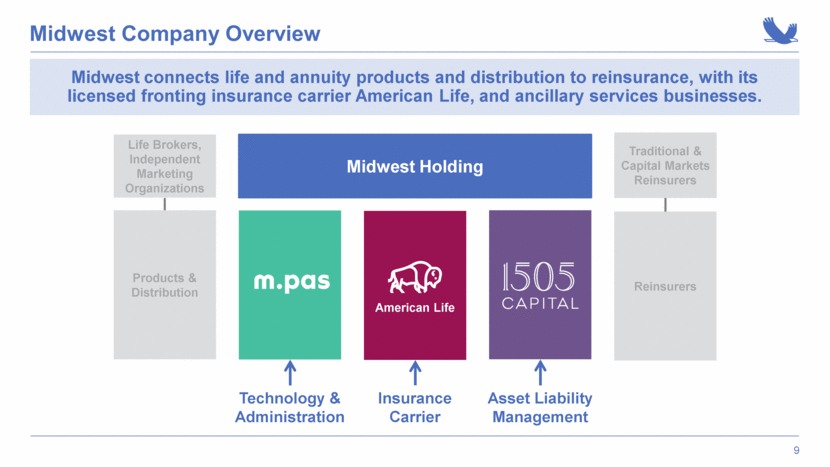
Midwest connects life and annuity products and distribution to reinsurance, with its licensed fronting insurance carrier American Life, and ancillary services businesses. Midwest Company Overview Reinsurers Products & Distribution Asset Liability Management Technology & Administration Insurance Carrier American Life Midwest Holding Life Brokers, Independent Marketing Organizations Traditional & Capital Markets Reinsurers |
|
|
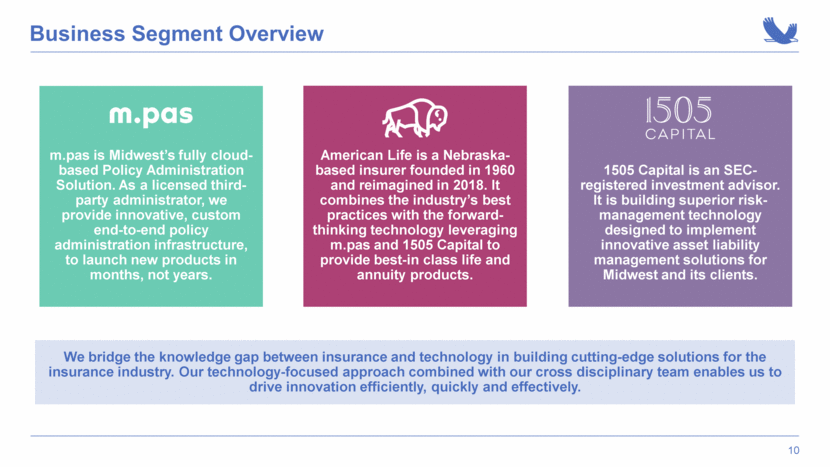
Business Segment Overview American Life is a Nebraska-based insurer founded in 1960 and reimagined in 2018. It combines the industry’s best practices with the forward-thinking technology leveraging m.pas and 1505 Capital to provide best-in class life and annuity products. m.pas is Midwest’s fully cloud-based Policy Administration Solution. As a licensed third-party administrator, we provide innovative, custom end-to-end policy administration infrastructure, to launch new products in months, not years. 1505 Capital is an SEC-registered investment advisor. It is building superior risk-management technology designed to implement innovative asset liability management solutions for Midwest and its clients. We bridge the knowledge gap between insurance and technology in building cutting-edge solutions for the insurance industry. Our technology-focused approach combined with our cross disciplinary team enables us to drive innovation efficiently, quickly and effectively. |
|
|
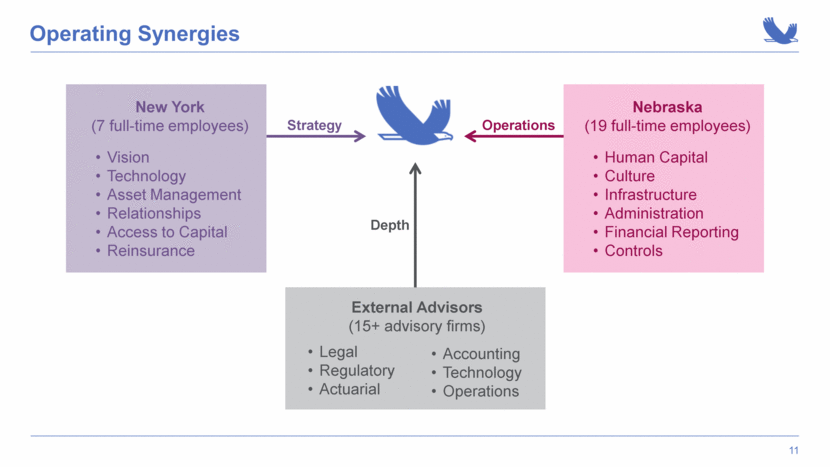
Operating Synergies Accounting Technology Operations External Advisors (15+ advisory firms) Legal Regulatory Actuarial Nebraska (19 full-time employees) Human Capital Culture Infrastructure Administration Financial Reporting Controls New York (7 full-time employees) Vision Technology Asset Management Relationships Access to Capital Reinsurance Strategy Depth Operations |
|
|
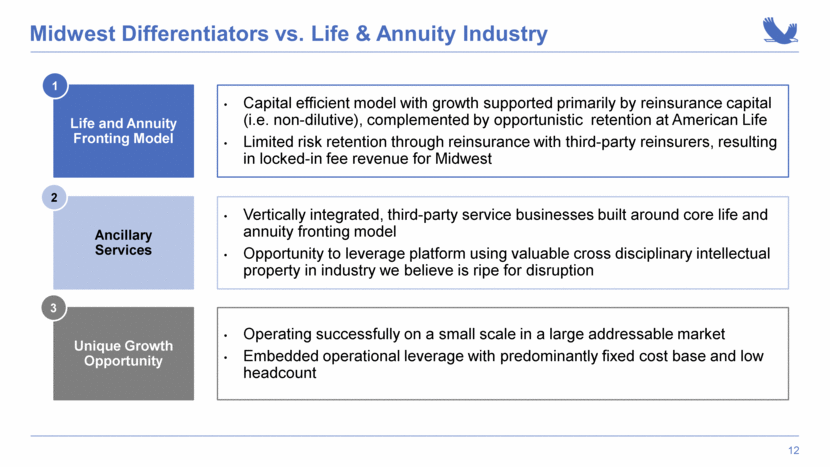
Midwest Differentiators vs. Life & Annuity Industry Life and Annuity Fronting Model Capital efficient model with growth supported primarily by reinsurance capital (i.e. non-dilutive), complemented by opportunistic retention at American Life Limited risk retention through reinsurance with third-party reinsurers, resulting in locked-in fee revenue for Midwest Ancillary Services Vertically integrated, third-party service businesses built around core life and annuity fronting model Opportunity to leverage platform using valuable cross disciplinary intellectual property in industry we believe is ripe for disruption Unique Growth Opportunity Operating successfully on a small scale in a large addressable market Embedded operational leverage with predominantly fixed cost base and low headcount 1 2 3 |
|
|
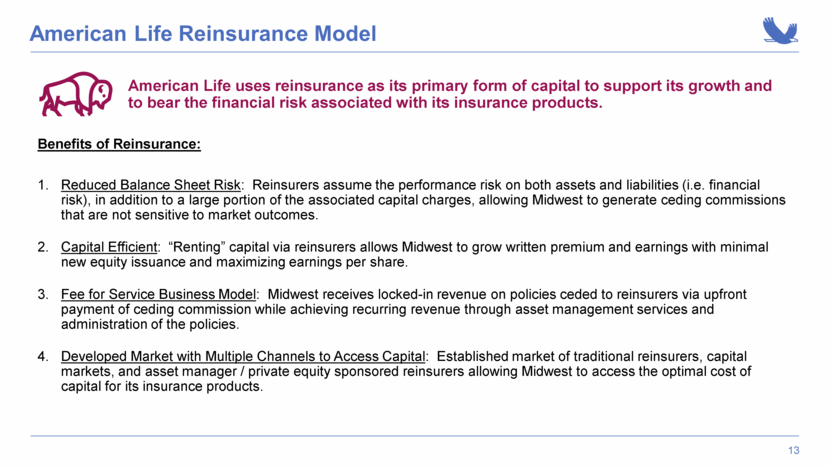
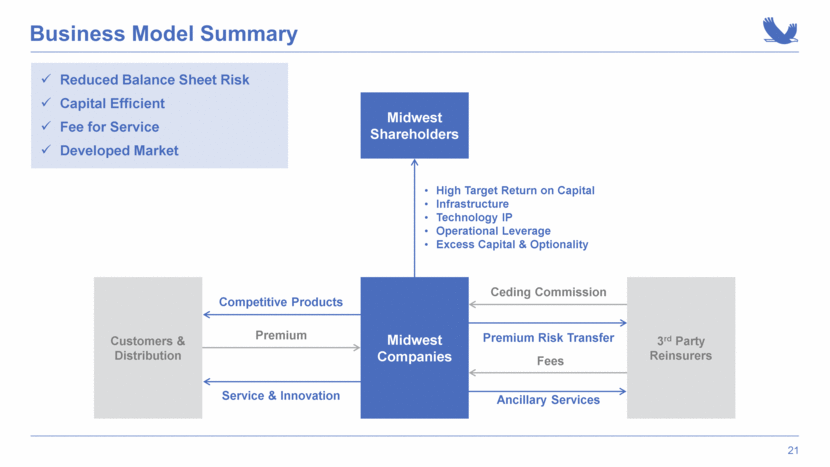
American Life Reinsurance Model Benefits of Reinsurance: Reduced Balance Sheet Risk: Reinsurers assume the performance risk on both assets and liabilities (i.e. financial risk), in addition to a large portion of the associated capital charges, allowing Midwest to generate ceding commissions that are not sensitive to market outcomes. Capital Efficient: “Renting” capital via reinsurers allows Midwest to grow written premium and earnings with minimal new equity issuance and maximizing earnings per share. Fee for Service Business Model: Midwest receives locked-in revenue on policies ceded to reinsurers via upfront payment of ceding commission while achieving recurring revenue through asset management services and administration of the policies. Developed Market with Multiple Channels to Access Capital: Established market of traditional reinsurers, capital markets, and asset manager / private equity sponsored reinsurers allowing Midwest to access the optimal cost of capital for its insurance products. American Life uses reinsurance as its primary form of capital to support its growth and to bear the financial risk associated with its insurance products. |
|
|
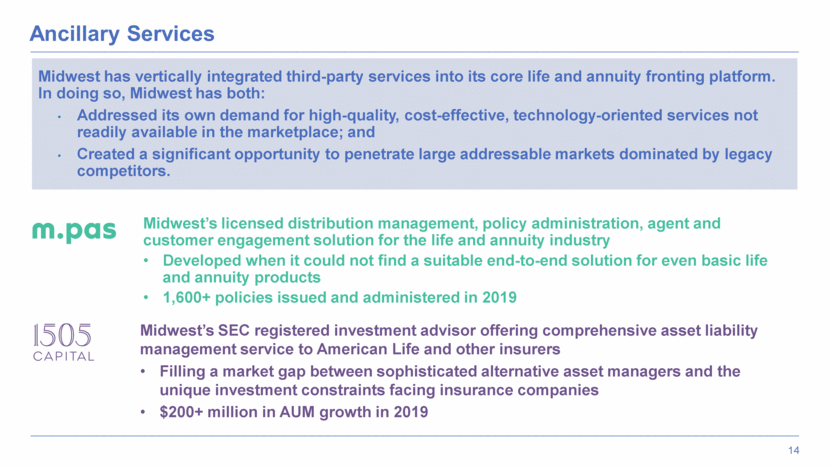
Midwest has vertically integrated third-party services into its core life and annuity fronting platform. In doing so, Midwest has both: Addressed its own demand for high-quality, cost-effective, technology-oriented services not readily available in the marketplace; and Created a significant opportunity to penetrate large addressable markets dominated by legacy competitors. Midwest’s licensed distribution management, policy administration, agent and customer engagement solution for the life and annuity industry Developed when it could not find a suitable end-to-end solution for even basic life and annuity products 1,600+ policies issued and administered in 2019 Ancillary Services Midwest’s SEC registered investment advisor offering comprehensive asset liability management service to American Life and other insurers Filling a market gap between sophisticated alternative asset managers and the unique investment constraints facing insurance companies $200+ million in AUM growth in 2019 |
|
|
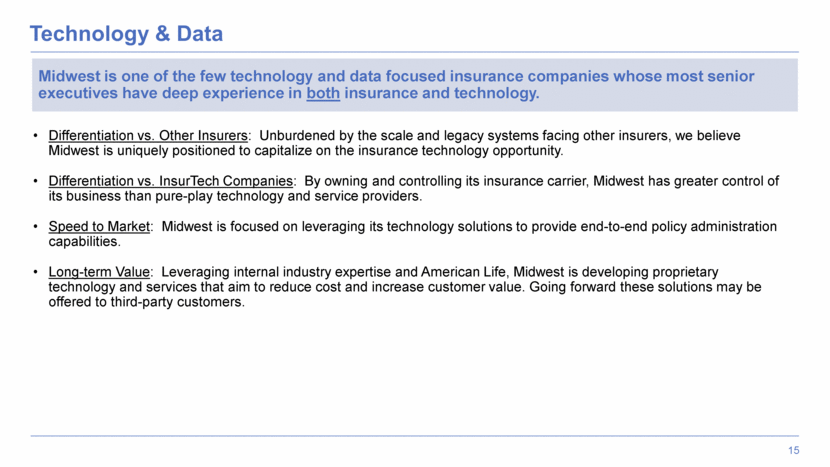
Technology & Data Midwest is one of the few technology and data focused insurance companies whose most senior executives have deep experience in both insurance and technology. Differentiation vs. Other Insurers: Unburdened by the scale and legacy systems facing other insurers, we believe Midwest is uniquely positioned to capitalize on the insurance technology opportunity. Differentiation vs. InsurTech Companies: By owning and controlling its insurance carrier, Midwest has greater control of its business than pure-play technology and service providers. Speed to Market: Midwest is focused on leveraging its technology solutions to provide end-to-end policy administration capabilities. Long-term Value: Leveraging internal industry expertise and American Life, Midwest is developing proprietary technology and services that aim to reduce cost and increase customer value. Going forward these solutions may be offered to third-party customers. |
|
|
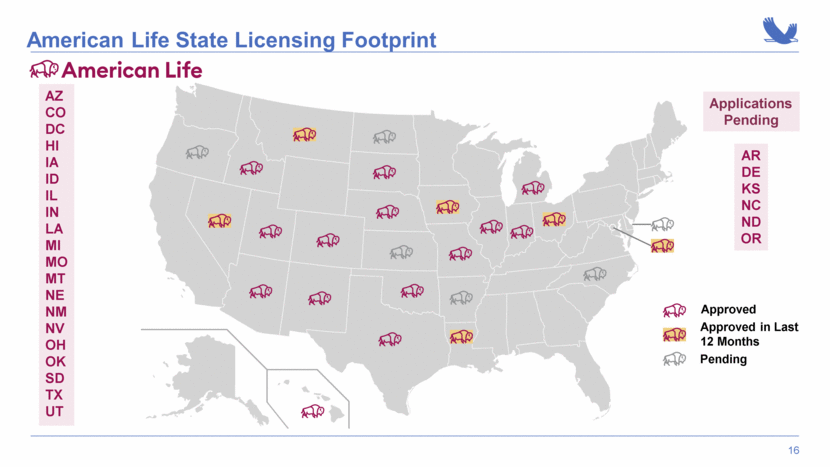
American Life State Licensing Footprint AZ CO DC HI IA ID IL IN LA MI MO MT NE NM NV OH OK SD TX UT AR DE KS NC ND OR Applications Pending Approved Approved in Last 12 Months Pending |
|
|
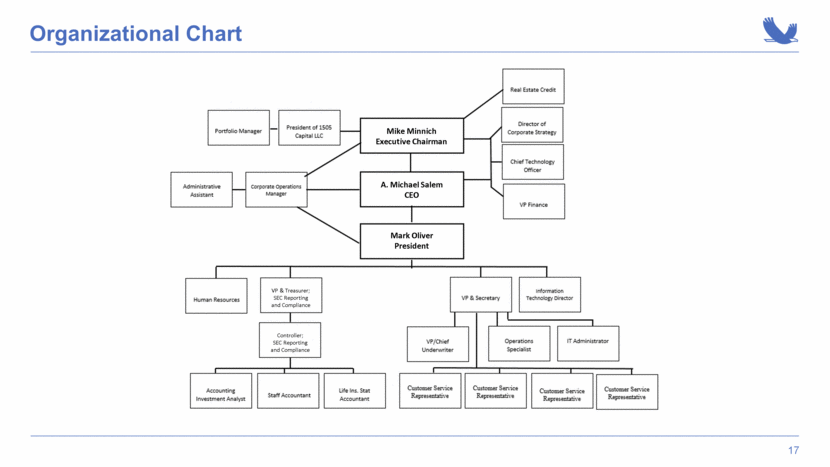
Organizational Chart A Mike Minnich Executive Chairman A. Michael Salem CEO Mark Oliver President VP & Treasurer; SEC Reporting and Compliance Controller; SEC Reporting and Compliance |
|
|
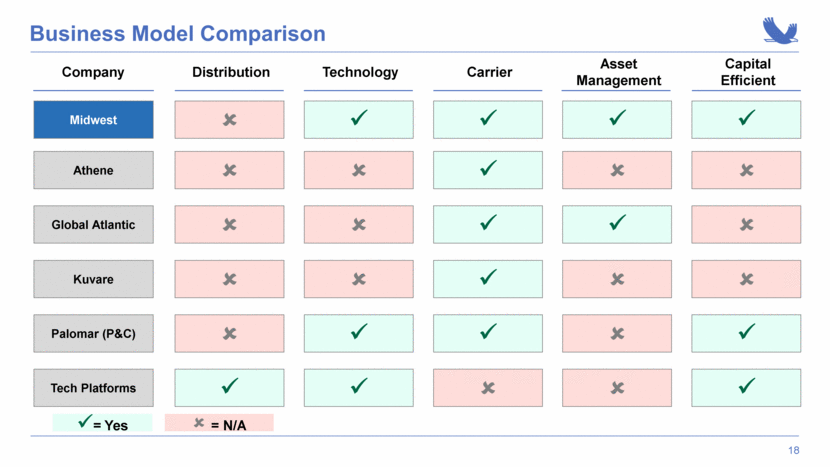
Business Model Comparison Company Distribution Tech Platforms Global Atlantic Palomar (P&C) Midwest Athene Kuvare Technology Carrier Asset Management Capital Efficient = Yes = N/A |
|
|
III. Business Model and Reinsurance |
|
|
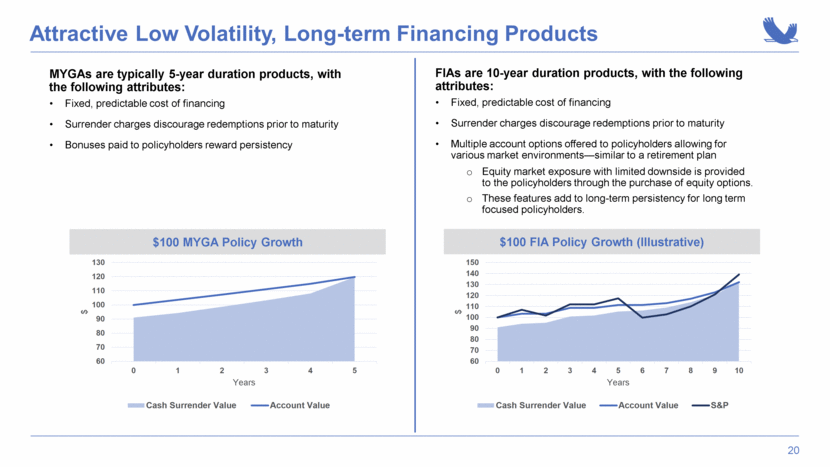
Attractive Low Volatility, Long-term Financing Products MYGAs are typically 5-year duration products, with the following attributes: Fixed, predictable cost of financing Surrender charges discourage redemptions prior to maturity Bonuses paid to policyholders reward persistency FIAs are 10-year duration products, with the following attributes: Fixed, predictable cost of financing Surrender charges discourage redemptions prior to maturity Multiple account options offered to policyholders allowing for various market environments—similar to a retirement plan Equity market exposure with limited downside is provided to the policyholders through the purchase of equity options. These features add to long-term persistency for long term focused policyholders. $100 MYGA Policy Growth $100 FIA Policy Growth (Illustrative) 60 70 80 90 100 110 120 130 0 1 2 3 4 5 $ Years MYGA Policy Growth Cash Surrender Value Account Value 60 70 80 90 100 110 120 130 140 150 0 1 2 3 4 5 6 7 8 9 10 $ Years FIA Policy Growth Cash Surrender Value Account Value S&P |
|
|
Business Model Summary 3rd Party Reinsurers Customers & Distribution Midwest Shareholders Midwest Companies High Target Return on Capital Infrastructure Technology IP Operational Leverage Excess Capital & Optionality Premium Reduced Balance Sheet Risk Capital Efficient Fee for Service Developed Market Service & Innovation Competitive Products Ancillary Services Ceding Commission Premium Risk Transfer Fees |
|
|
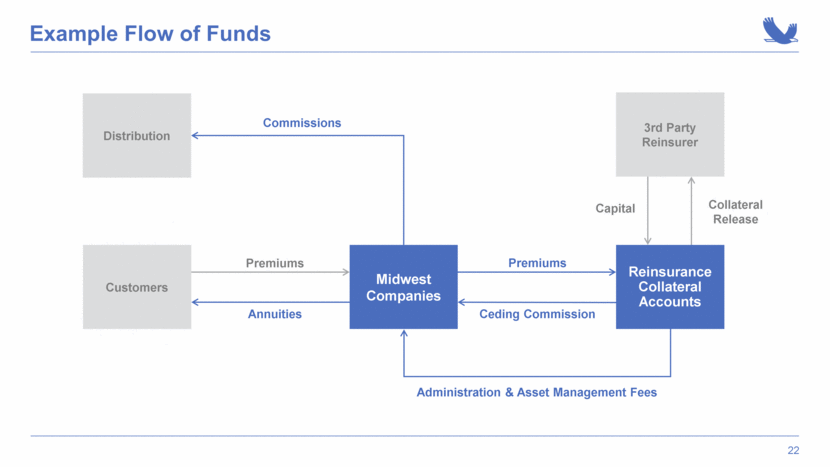
Example Flow of Funds Reinsurance Collateral Accounts 3rd Party Reinsurer Collateral Release Capital Customers Midwest Companies Ceding Commission Premiums Annuities Premiums Distribution Commissions Administration & Asset Management Fees |
|
|
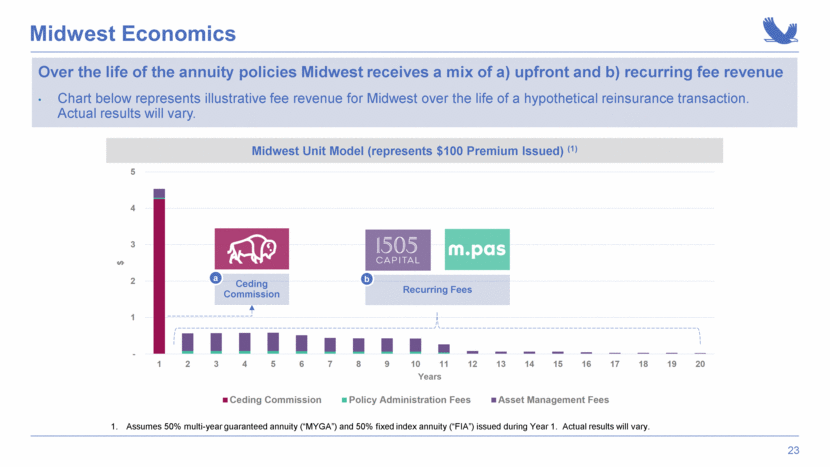
Midwest Economics Over the life of the annuity policies Midwest receives a mix of a) upfront and b) recurring fee revenue Chart below represents illustrative fee revenue for Midwest over the life of a hypothetical reinsurance transaction. Actual results will vary. Midwest Unit Model (represents $100 Premium Issued) (1) Assumes 50% multi-year guaranteed annuity (“MYGA”) and 50% fixed index annuity (“FIA”) issued during Year 1. Actual results will vary. Recurring Fees Ceding Commission a b - 1 2 3 4 5 1 2 3 4 5 6 7 8 9 10 11 12 13 14 15 16 17 18 19 20 $ Years Chart Title Ceding Commission Policy Administration Fees Asset Management Fees |
|
|
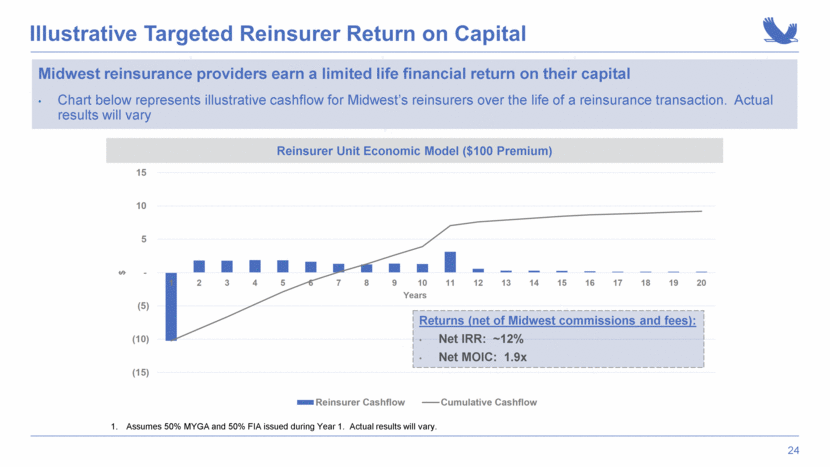
Illustrative Targeted Reinsurer Return on Capital Midwest reinsurance providers earn a limited life financial return on their capital Chart below represents illustrative cashflow for Midwest’s reinsurers over the life of a reinsurance transaction. Actual results will vary Assumes 50% MYGA and 50% FIA issued during Year 1. Actual results will vary. Reinsurer Unit Economic Model ($100 Premium) Returns (net of Midwest commissions and fees): Net IRR: ~12% Net MOIC: 1.9x (15) (10) (5) - 5 10 15 1 2 3 4 5 6 7 8 9 10 11 12 13 14 15 16 17 18 19 20 $ Years Reinsurer Cashflow Cumulative Cashflow |
|
|
IV. Financial Highlights |
|
|
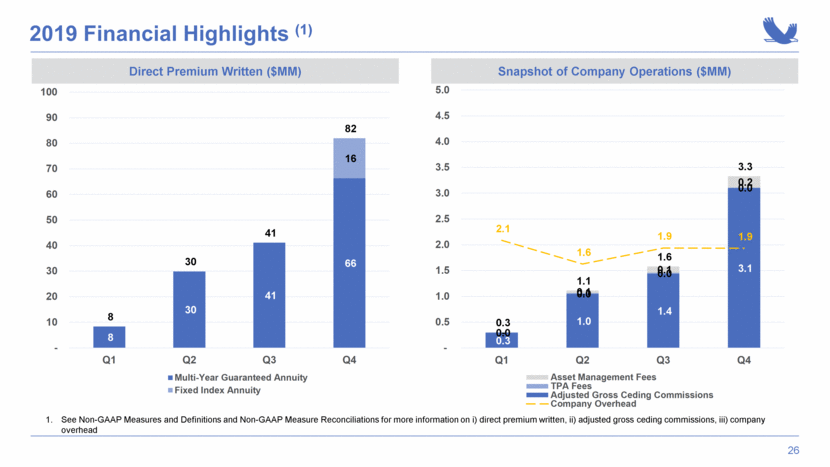
2019 Financial Highlights (1) Direct Premium Written ($MM) Snapshot of Company Operations ($MM) See Non-GAAP Measures and Definitions and Non-GAAP Measure Reconciliations for more information on i) direct premium written, ii) adjusted gross ceding commissions, iii) company overhead 8 30 41 66 16 8 30 41 82 - 10 20 30 40 50 60 70 80 90 100 Q1 Q2 Q3 Q4 Multi-Year Guaranteed Annuity Fixed Index Annuity 0.3 1.0 1.4 3.1 0.0 0.0 0.0 0.0 - 0.1 0.1 0.2 0.3 1.1 1.6 3.3 2.1 1.6 1.9 1.9 - 0.5 1.0 1.5 2.0 2.5 3.0 3.5 4.0 4.5 5.0 Q1 Q2 Q3 Q4 Total Asset Management Fees TPA Fees Adjusted Gross Ceding Commissions Company Overhead |
|
|
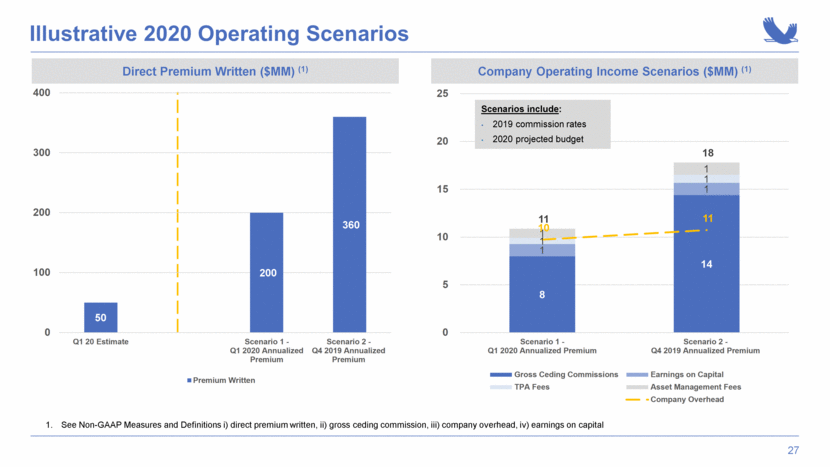
Illustrative 2020 Operating Scenarios Direct Premium Written ($MM) (1) Company Operating Income Scenarios ($MM) (1) See Non-GAAP Measures and Definitions i) direct premium written, ii) gross ceding commission, iii) company overhead, iv) earnings on capital Scenarios include: 2019 commission rates 2020 projected budget 8 14 1 1 1 1 1 1 11 18 10 11 0 5 10 15 20 25 Scenario 1 - Q1 2020 Annualized Premium Scenario 2 - Q4 2019 Annualized Premium Gross Ceding Commissions Earnings on Capital TPA Fees Asset Management Fees Company Overhead 50 200 360 0 100 200 300 400 Q1 20 Estimate Scenario 1 - Q1 2020 Annualized Premium Scenario 2 - Q4 2019 Annualized Premium Premium Written |
|
|
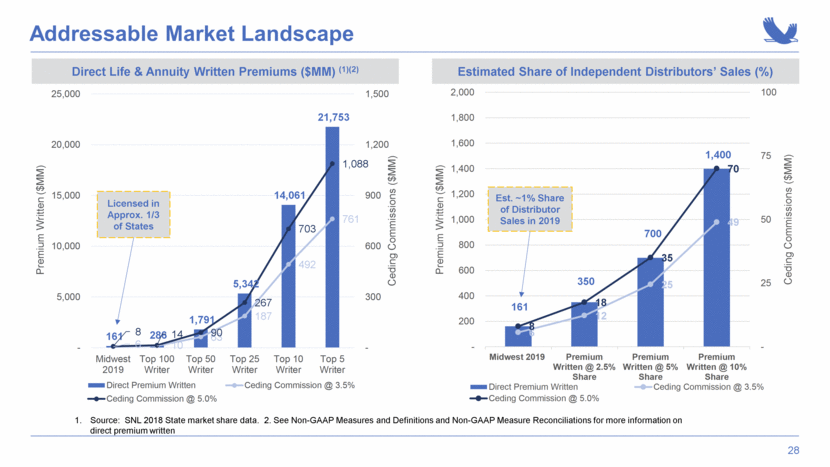
Addressable Market Landscape Direct Life & Annuity Written Premiums ($MM) (1)(2) Source: SNL 2018 State market share data. 2. See Non-GAAP Measures and Definitions and Non-GAAP Measure Reconciliations for more information on direct premium written Estimated Share of Independent Distributors’ Sales (%) Licensed in Approx. 1/3 of States Est. ~1% Share of Distributor Sales in 2019 161 286 1,791 5,342 14,061 21,753 6 10 63 187 492 761 8 14 90 267 703 1,088 - 300 600 900 1,200 1,500 - 5,000 10,000 15,000 20,000 25,000 Midwest 2019 Top 100 Writer Top 50 Writer Top 25 Writer Top 10 Writer Top 5 Writer Ceding Commissions ($MM) Premium Written ($MM) Direct Premium Written Ceding Commission @ 3.5% Ceding Commission @ 5.0% 161 350 700 1,400 6 12 25 49 8 18 35 70 - 25 50 75 100 - 200 400 600 800 1,000 1,200 1,400 1,600 1,800 2,000 Midwest 2019 Premium Written @ 2.5% Share Premium Written @ 5% Share Premium Written @ 10% Share Ceding Commissions ($MM) Premium Written ($MM) Direct Premium Written Ceding Commission @ 3.5% Ceding Commission @ 5.0% |
|
|
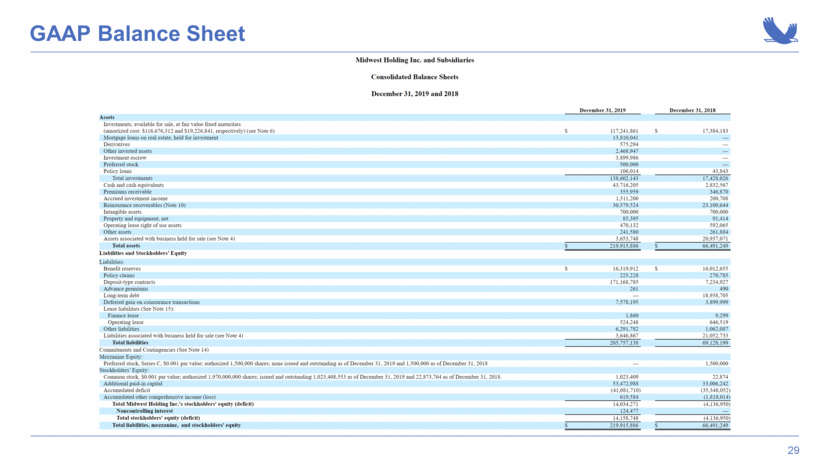
GAAP Balance Sheet |
|
|
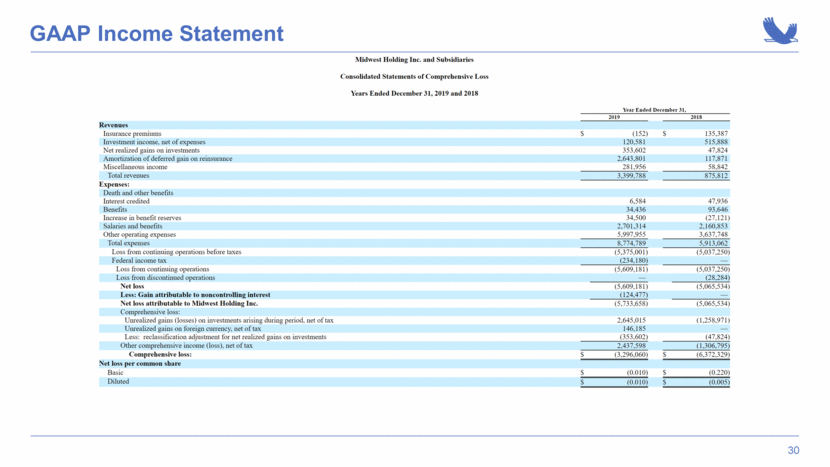
GAAP Income Statement |
|
|
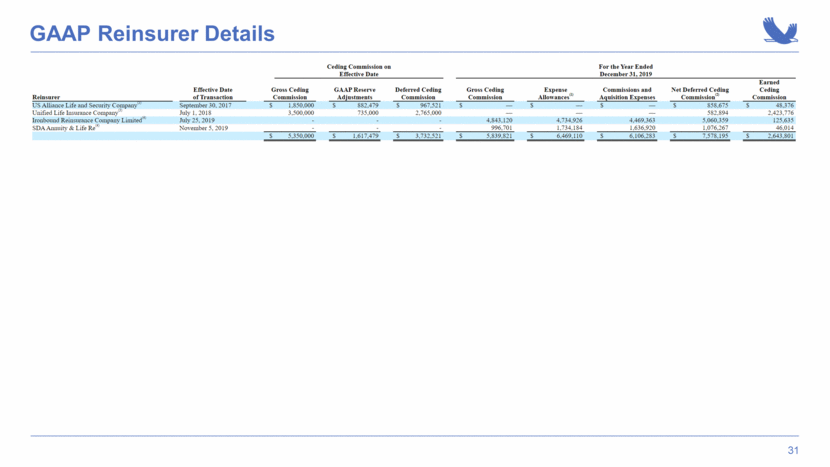
GAAP Reinsurer Details |
|
|
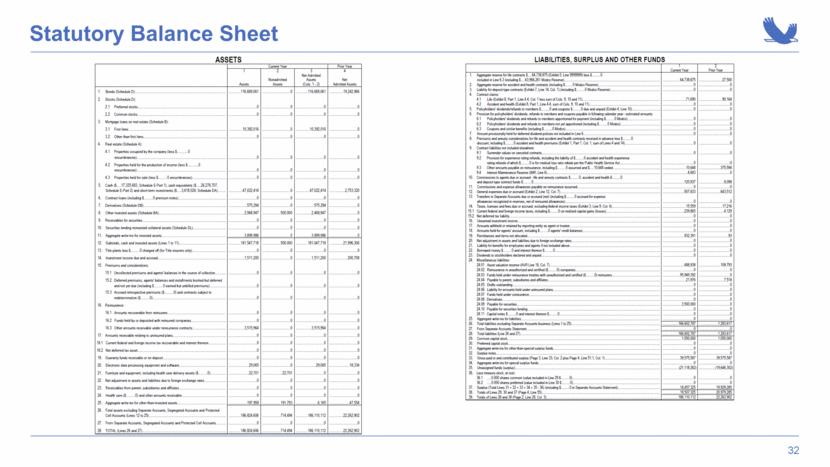
Statutory Balance Sheet |
|
|
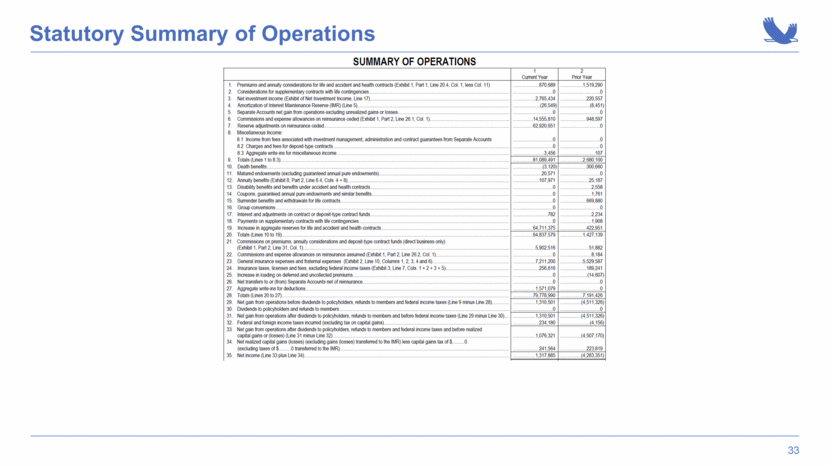
Statutory Summary of Operations |
|
|
V. Appendix A: Non-GAAP Reconciliations |
|
|
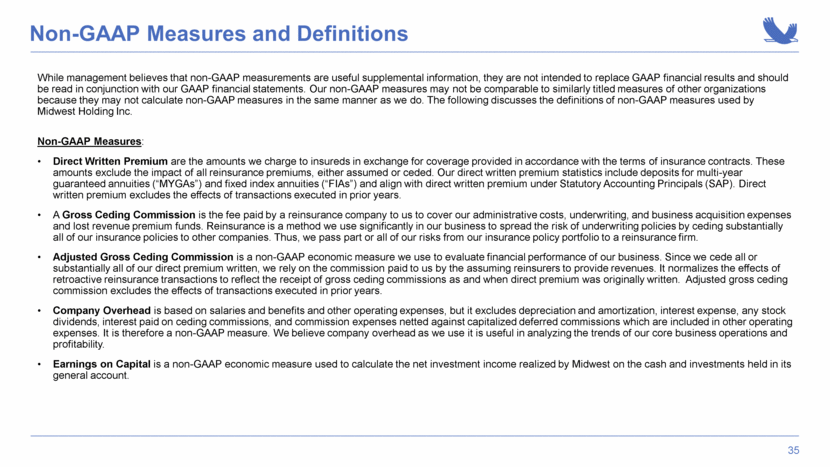
Non-GAAP Measures and Definitions While management believes that non-GAAP measurements are useful supplemental information, they are not intended to replace GAAP financial results and should be read in conjunction with our GAAP financial statements. Our non-GAAP measures may not be comparable to similarly titled measures of other organizations because they may not calculate non-GAAP measures in the same manner as we do. The following discusses the definitions of non-GAAP measures used by Midwest Holding Inc. Non-GAAP Measures: Direct Written Premium are the amounts we charge to insureds in exchange for coverage provided in accordance with the terms of insurance contracts. These amounts exclude the impact of all reinsurance premiums, either assumed or ceded. Our direct written premium statistics include deposits for multi-year guaranteed annuities (“MYGAs”) and fixed index annuities (“FIAs”) and align with direct written premium under Statutory Accounting Principals (SAP). Direct written premium excludes the effects of transactions executed in prior years. A Gross Ceding Commission is the fee paid by a reinsurance company to us to cover our administrative costs, underwriting, and business acquisition expenses and lost revenue premium funds. Reinsurance is a method we use significantly in our business to spread the risk of underwriting policies by ceding substantially all of our insurance policies to other companies. Thus, we pass part or all of our risks from our insurance policy portfolio to a reinsurance firm. Adjusted Gross Ceding Commission is a non-GAAP economic measure we use to evaluate financial performance of our business. Since we cede all or substantially all of our direct premium written, we rely on the commission paid to us by the assuming reinsurers to provide revenues. It normalizes the effects of retroactive reinsurance transactions to reflect the receipt of gross ceding commissions as and when direct premium was originally written. Adjusted gross ceding commission excludes the effects of transactions executed in prior years. Company Overhead is based on salaries and benefits and other operating expenses, but it excludes depreciation and amortization, interest expense, any stock dividends, interest paid on ceding commissions, and commission expenses netted against capitalized deferred commissions which are included in other operating expenses. It is therefore a non-GAAP measure. We believe company overhead as we use it is useful in analyzing the trends of our core business operations and profitability. Earnings on Capital is a non-GAAP economic measure used to calculate the net investment income realized by Midwest on the cash and investments held in its general account. |
|
|
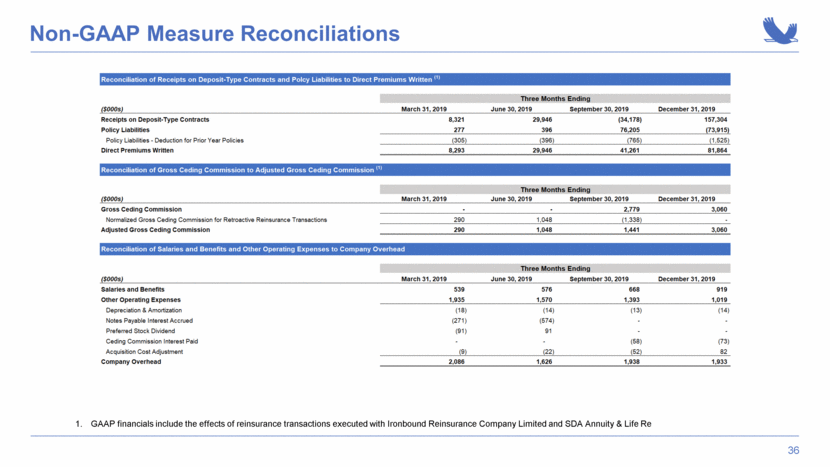
Non-GAAP Measure Reconciliations GAAP financials include the effects of reinsurance transactions executed with Ironbound Reinsurance Company Limited and SDA Annuity & Life Re |
|
|
VI. Appendix B: Public Trading Data |
|
|
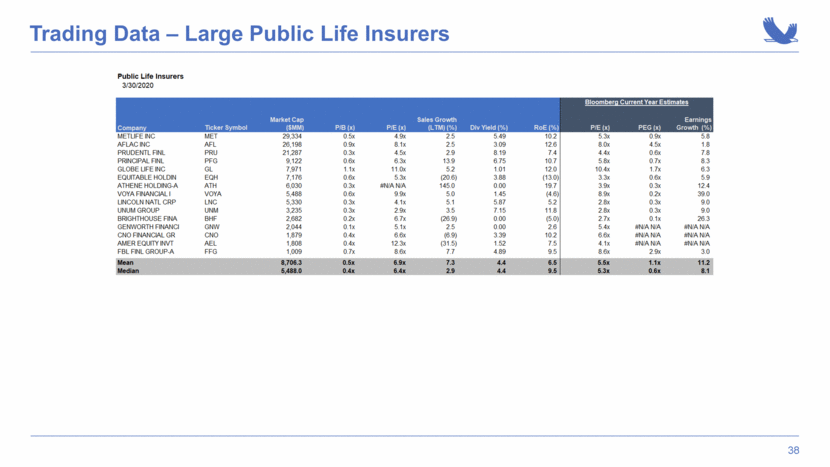
Trading Data – Large Public Life Insurers |

