Attached files
| file | filename |
|---|---|
| 8-K - 8-K - HarborOne Bancorp, Inc. | tmb-20200427x8k.htm |
Exhibit 99.1

HarborOne Bancorp, Inc. Announces 2020 First Quarter Earnings
Contact: Linda Simmons, SVP, CFO
Brockton, Massachusetts (April 27, 2020): HarborOne Bancorp, Inc. (the “Company” or “HarborOne”) (NASDAQ: HONE), the holding company for HarborOne Bank (the “Bank”), announced net income of $4.7 million, or $0.09 per basic and diluted share, for the first quarter of 2020, compared to $4.3 million, or $0.08 per basic and diluted share, for the preceding quarter and $2.1 million, or $0.04 per basic and diluted share, for the same period last year. The results of the quarter reflect charges of $1.5 million to the provision for loan losses and $329,000 to non-interest expense related to the COVID-19 pandemic.
Selected highlights:
|
· |
Total commercial loans amounted to $1.7 billion, up $61.0 million or 4%, from the preceding quarter and up $282.6 million, or 20%, year over year. Commercial credit line utilization remained consistent with preceding and prior year quarters at approximately 41%. |
|
· |
Total deposits amounted to $3.0 billion, up $78.4 million, or 3%, from the preceding quarter and up $184.6 million, or 7%, year over year. |
|
· |
Strong residential real estate mortgage origination activity continued from the preceding quarter amounting to $355.4 million, increasing 125% year over year. |
|
· |
Well positioned with strong capital and liquidity to operate in a challenging and volatile economic environment. |
|
· |
Comprehensive COVID-19 pandemic response for customers, employees and our community, including: |
|
|
Loan deferral and modification programs and access to the U.S. Small Business Administration’s (“SBA”) 7(a) Loan Guaranty Program (the “Paycheck Protection Program”) |
|
|
Expansion of remote work positions, sick time and supplemental compensation for employees providing in-person customer service |
|
|
Supporting customers’ shift to alternative service delivery options |
|
|
Community support through donated funds and respirator masks |
“While the COVID-19 disruption is unprecedented, I’m so proud of how our team has responded. We’ve remained open for business with appointment banking, drive-through service, call center support, and borrower accommodations,” said James Blake, CEO. “We’ve led the market in our response to the SBA’s Paycheck Protection Program, and earned new business as a result, while continuing to support our existing customers.” “Our customers have adapted to the environment, as we’ve seen growth in online account opening, eBanking enrollment, and mobile deposits,” added Joseph Casey, President and COO. “We’re with our customers, and they’re with us.”
Net Interest Income
The Company’s net interest and dividend income was $26.7 million for the quarter ended March 31, 2020, down $1.6 million, or 5.8%, from $28.3 million for the quarter ended December 31, 2019 and up $670,000, or 2.6%, from $26.0 million for the quarter ended March 31, 2019. The tax-equivalent interest rate spread and net interest margin were 2.58% and 2.91%, respectively, for the quarter ended March 31, 2020 compared to 2.70% and 3.08%, respectively, for the quarter ended December 31, 2019, and 2.92% and 3.19%, respectively, for the quarter ended March 31, 2019. Margins have been under pressure since late 2019, which was accelerated by actions by the Board of Governors of the Federal Reserve System (the “Federal Reserve”) in March 2020 to mitigate the economic impact of the COVID-19 pandemic, including cutting the federal funds rate 150 basis points, targeting a 0 to 25 basis points rate. It is expected that the interest rate environment will continue to be volatile, and future net interest margin compression is anticipated in 2020.
The components of the quarter over quarter decrease in net interest and dividend income reflected a $2.6 million, or 6.4%, decrease in interest and dividend income partially offset by a decrease of $920,000, or 8.1%, in total interest expense. Interest on loans in the first quarter included $614,000 in accretion income from the fair value discount on loans acquired from Coastway Bancorp, Inc. (“Coastway”) and $69,000 in prepayment penalties on commercial loans. Accretion income and prepayment penalties in the previous quarter were $1.1 million and $268,000, respectively. The yield on loans was 4.33% for the quarter ended March 31, 2020, down from 4.58% for the quarter ended December 31, 2019. The decrease in interest and dividend income primarily reflected a decrease in interest rates, as adjustable rate loans repriced, resulting in a 37 basis point decrease in the yield on commercial loans and a 19 basis point decrease in the yield on residential real estate loans. The decrease in interest expense primarily reflected a decrease in interest rates, resulting in a 14 basis point decrease in the cost of interest-bearing deposits and a shift in the deposit mix. The average balance of money market accounts decreased quarter over quarter by $31.9 million, while the savings account average balance increased $70.0 million from the preceding quarter. Average FHLB advances decreased $7.8 million and the cost of those funds decreased 12 basis points, resulting in a decrease of $132,000 in interest expense on FHLB borrowings.
The increase in net interest and dividend income from the prior year quarter reflected an $116,000, or 0.3%, increase in total interest and dividend income and a decrease of $554,000, or 5.0%, in total interest expense. The increases in total interest and dividend income reflected an increase in the average balance of interest-earning assets of $371.8 million partially offset by a 48 basis point decrease in the yield on those assets. The increase in average assets largely reflects commercial loan growth. Total interest expense decreased primarily due to a decrease in average FHLB borrowings of $151.2 million and a 26 basis point decrease in the cost of those funds.
Noninterest Income
Noninterest income increased $727,000, or 4.0%, to $18.9 million for the quarter ended March 31, 2020 from $18.1 million for the quarter ended December 31, 2019. The 2020 results included a $2.5 million in net gains on sales and calls of securities, net and the preceding quarter included a $482,000 loss on disposal of asset held for sale. Low mortgage rates continued to provide higher than normal seasonal mortgage origination activity for HarborOne Mortgage, LLC (“HarborOne Mortgage”). The $355.4 million in mortgage loan originations resulted in an increase of $2.5 million in other mortgage banking income. The Federal Reserve’s actions noted above resulted in the 10-year Treasury Constant Maturity rate decreasing 122 basis points from year end 2019 and negatively impacted the fair value of the mortgage servicing rights, resulting in a $4.4 million decrease in their fair value in the first quarter of 2020 as compared to a $625,000 increase in their fair value in the preceding quarter. The 2020 results for HarborOne Mortgage are uncertain in light of the COVID-19 pandemic. Although a low mortgage interest rate environment would normally lead to increased purchase and refinance activity, the impact of social distancing on real estate sales and increased unemployment rates may have a negative impact on mortgage loan originations in 2020.
Noninterest income increased $9.0 million, or 91.7%, as compared to the quarter ended March 31, 2019, primarily due to a $6.0 million, or 132.4%, increase in mortgage banking income. Mortgage banking income increased compared to the same period last year, due to the increase in mortgage origination volume. Mortgage originations increased primarily as a result of lower residential mortgage interest rates and increased refinancing volume. Bank-owned life insurance income increased $298,000 due to a $41.4 million increase in bank- owned life insurance from March 31, 2019 to March 31, 2020. The first quarter of 2020 also included a $2.5 million gain on sale and call of securities, net.
Noninterest Expense
Noninterest expenses were $35.4 million for the quarter ended March 31, 2020, a decrease of $3.3 million, or 8.6%, from the quarter ended December 31, 2019, primarily driven by a $2.5 million decrease in compensation and benefits, a $1.2 million decrease in professional fees, and a $412,000 decrease in loan expense. The decreases were partially offset by an increase of $344,000 in other expenses and a $266,000 increase in deposit insurance. The decrease in compensation and benefits is primarily due to ESOP expense. A full year of expenses was recorded in 2019 for the increase in the ESOP as a result of our second-step offering. The decrease in professional fees is primarily due to a decrease in consulting fees. HarborOne Mortgage recorded $712,000 in consulting expense in the preceding quarter in connection with its review of filings effected by the Home Mortgage Disclosure Act regulation expansion. Loan expense decreased consistent with the decrease in origination volume from the preceding quarter. The increase in other expenses reflects $329,000 in COVID-19 pandemic-related expenses, primarily for compensation to branch personnel and sick time. We anticipate additional COVID-19 pandemic expenses throughout 2020 for personnel, cleaning and other initiatives to support our employees and customers.
Total noninterest expenses increased $2.8 million, or 8.6%, from the quarter ended March 31, 2019. Compensation and benefits increased $1.9 million, other expenses increased $592,000 and professional fees increased $282,000. The increases were partially offset by a $395,000 decrease in deposit insurance. The increase in compensation and benefits primarily reflected the increased volume of residential real estate mortgage originations. The increase in other expenses includes the COVID-19 related expenses noted above and an increase of $196,000 in foreclosed asset expense. The decrease in deposit insurance expense reflects the reduction in assessment rate due to improved capital ratios as a result of the second step conversion.
Income Tax Provision
The effective tax rate was 26.5% for the quarter ended March 31, 2020, compared to 33.6% for the quarter ended December 31, 2019 and 14.7% for the quarter ended March 31, 2019. The preceding quarter’s effective tax rate was impacted by an increase in unfavorable permanent items. The effective tax rate for the quarter ended March 31, 2019 includes a 2014 Massachusetts state tax refund of $320,000 recognized in the quarter.
Provision for Loan Losses and Asset Quality
The Company recorded a provision for loan losses of $3.7 million for the quarter ended March 31, 2020, compared to $1.3 million for the quarter ended December 31, 2019 and $857,000 for the quarter ended March 31, 2019. Allowance for loan losses was $26.4 million, or 0.83%, of total loans at March 31, 2020, compared to $24.1 million, or 0.76%, of total loans at December 31, 2019 and $21.3 million, or 0.71%, of total loans at March 31, 2019. Changes in the provision for loan losses are based on management’s assessment of loan portfolio growth and composition changes, historical charge-off trends, and ongoing evaluation of credit quality and current economic conditions.
The provision for loan losses for the quarter ended March 31, 2020 includes adjustments for our quarterly analysis of our historical and peer loss experience rates, commercial real estate loan growth, an additional provision to cover a $1.2 million commercial real estate loan charge-off unrelated to the COVID-19 pandemic, and a $1.5 million provision directly related to the initial estimate of inherent losses resulting from the impact of the COVID-19 pandemic. The provisions for loan losses for the quarters ended December 31, 2019 and March 31, 2019 primarily reflected commercial real estate loan growth.
In estimating the provision for the COVID-19 pandemic, management considered economic factors, including unemployment rates and the interest rate environment, the volume and dollar amount of requests for payment deferrals, the loan risk profile of each loan type, and if the loans were purchased. The additional provisions provided to each category ranged from 5 to 10 basis points and amounted to allocations of $310,000 to the residential real estate portfolio, $965,000 to the commercial portfolio and $189,000 to the consumer portfolio.
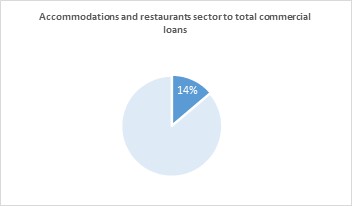
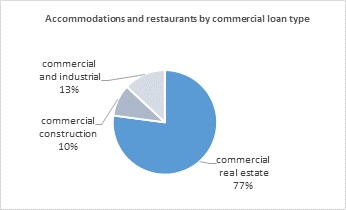
Management continues to evaluate our loan portfolio, particularly the commercial loan portfolio, in light of the expected decrease in economic activity, the mitigating effects of government stimulus and loan modification efforts designed to limit the long term impact of the COVID-19 pandemic. Our commercial loan portfolio is diverse across many sectors and is largely secured by commercial real estate loans, which make up 71.7% of the total commercial loan portfolio. Initial assessments of the impact of the COVID-19 pandemic on the commercial loan portfolio have been focused on sectors that have experienced a direct impact. Management identified the accommodation and food service sector as the most susceptible to immediate increased credit risk. As of March 31, 2020, the commercial portfolio included $233.7 million in accommodation and food service sector loans, representing 13.8% of the total commercial loan portfolio, and is made up of $180.2 million in commercial real estate loans, $23.0 million in commercial construction loans and $30.5 million in commercial and industrial loans.
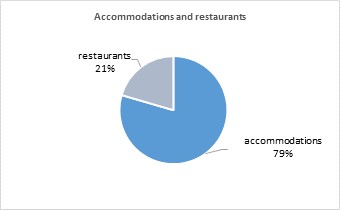
As of March 31, 2020, the accommodation and food service sector breakout is $185.7 million in loans for accommodations, of which $161.2 million, or 86.8%, is in commercial real estate loans secured by hotels and $23.0 million, or 12.4%, is in commercial construction loans secured by hotels, of which $122.0 million, or 65.7%, are secured by national chain hotels. Loans to food services amounts to $47.9 million, of which 39.5% is in commercial real estate loans.
The $1.2 million commercial real estate charge off was on a loan acquired from Coastway, secured by a hotel property, on nonaccrual and included in the accommodation and food services sector in the amount of $3.1 million and whose credit deterioration was unrelated to the COVID-19 pandemic.
The other commercial loan sectors identified as at risk to credit deterioration as a result of the COVID-19 pandemic include the retail sector and the health and social services sector. As of March 31, 2020, the retail sector amounts to $210.6 million, or 12.5%, of the total commercial loan portfolio and includes $188.6 million in commercial real estate loans, $9.7 million in commercial construction loans and $27.3 million in commercial and industrial loans. The commercial real estate loans includes $95.5 million in loans secured by retail space anchored by a diverse mix of national chains and grocery stores. The health and social services sector amounts to $85.5 million, or 5.1%, of total commercial loans, and consists primarily of loans to healthcare and childcare providers.
Our COVID-19 response includes providing access to the Paycheck Protection Program to both our existing customers and new customers, to ensure small businesses in our communities have access to this important life line for their businesses. As of April 16, 2020, we had 691 requests with SBA authorization for Paycheck Protection Program loans totaling approximately $138.8 million. These loans are estimated to result in approximately $4.7 million in processing fee income which will be deferred over the life of the loan. The average authorized loan size is $201,000 and the aggregate number of jobs positively impacted is 11,900.
We are also working with commercial loan customers that may need payment deferrals or other accommodations to keep their loans out of default through the COVID-19 pandemic. As of April 16, 2020 we have processed 8 requests for payment deferrals on commercial loans with a total principal balances of $5.8 million, or 0.3% of total commercial loans, of which $4.3 million are loans included in the retail sector. We also anticipate that 386 loans with an outstanding principal balance of $37.5 million will qualify under the SBA’s debt relief program that provides for the payment of principal and interest for a period of six months.
The residential loan and consumer loan portfolios have not experienced significant credit quality deterioration as of March 31, 2020, but we anticipate that the impact of the COVID-19 pandemic will result in increases in delinquencies, charge-offs and loan modifications in these portfolios through the remainder of the year. As of April 16, 2020, we have processed 82 requests for payment deferrals on residential mortgage loans with a total principal balance of $26.1 million, or 2.4%, of total residential loans and 413 requests for payment deferrals on consumer loans with a total principal balance of $10.0 million, or 2.6%, of total consumer loans. We have also processed 46 requests on sold and bank-serviced residential mortgage loans with a total principal balance of $9.8 million and provided forbearance to 268 borrowers with a total principal balance of $47.8 million that were sold and are serviced by a third party.
Net charge-offs totaled $1.4 million for the quarter ended March 31, 2020, or 0.18%, of average loans outstanding on an annualized basis, compared to $235,000, or 0.03%, of average loans outstanding on an annualized basis, for the quarter ended December 31, 2019 and $230,000, or 0.03%, of average loans outstanding on an annualized basis, for the quarter ended March 31, 2019. The increase in charge-offs is a result of the charge-off noted above.
Total nonperforming assets were $32.1 million at March 31, 2020 compared to $31.0 million at December 31, 2019 and $19.3 million at March 31, 2019. Nonperforming assets as a percentage of total assets were 0.78% at March 31, 2020, 0.76% at December 31, 2019 and 0.53% at March 31, 2019. The increase in nonperforming assets from the prior year quarter was primarily in the commercial loan portfolio. While it is clear that the COVID-19 pandemic had, and will continue to have, a significant economic impact, the ultimate effect on our loan portfolio is uncertain.
Balance Sheet
Total assets increased $42.3 million, or 1.0%, to $4.10 billion at March 31, 2020 from $4.06 billion at December 31, 2019. The increase primarily reflects an increase of $24.8 million in other assets and $10.0 million in net loans. The increase in other assets also reflects a $28.2 million increase in back-to-back commercial loan swap contracts with a corresponding increase in other liabilities.
During the quarter, with intention to reduce credit risk in the investment portfolio, held to maturity securities were sold and as a result the remaining held to maturity securities were transferred to the available for sale category. For the quarter ended March 31, 2020, $70.0 million of securities were sold or called for a net gain of $2.5 million and $62.8 million were purchased.
Net loans increased $10.0 million, or 0.3%, to $3.16 billion at March 31, 2020 from $3.15 billion at December 31, 2019. The net increase in loans for the three months ended March 31, 2020 was primarily due to increases in commercial real estate loans of $42.6 million, commercial and industrial loans of $11.3 million and $7.1 million of commercial construction loans, partially offset by decreases in residential real estate loans of $4.0 million and consumer loans of $44.6 million. Loans held for sale increased $7.8 million, or 7.0%, to $118.3 million at March 31, 2020 from $110.6 million at December 31, 2019.
Total deposits increased $78.4 million, or 2.7%, to $3.02 billion at March 31, 2020 from $2.94 billion at December 31, 2019. Compared to the prior quarter, non-certificate accounts increased $113.2 million, brokered deposits increased $4.3 million and term CDs decreased $39.1 million. FHLB borrowings were $285.1 million at March 31, 2020 and $354.1 million at December 31, 2019.
Total stockholders’ equity was $675.1 million at March 31, 2020 compared to $665.8 million at December 31, 2019 and $363.4 million at March 31, 2019. The tangible common equity to tangible assets ratio was 14.90% at March 31, 2020, 14.81% at December 31, 2019 and 7.99% at March 31, 2019. The increase in stockholders’ equity and ratios from March 31, 2019 to March 31, 2020 primarily reflects the results of the Company’s second step offering, net of the additional ESOP funding. At March 31, 2020, the Company and the Bank had strong capital positions and exceeded all regulatory capital requirements.
About HarborOne Bancorp, Inc.
HarborOne Bancorp, Inc. is the holding company for HarborOne Bank, a Massachusetts-chartered savings bank. HarborOne Bank serves the financial needs of consumers, businesses, and municipalities throughout Eastern Massachusetts and Rhode Island through a network of 25 full-service branches located in Massachusetts and Rhode Island, one limited service branch and a commercial lending office in each of Boston, Massachusetts and Providence, Rhode Island. The Bank also provides a range of educational services through “HarborOne U,” with classes on small business, financial literacy and personal enrichment at two campuses located adjacent to our Brockton and Mansfield locations. HarborOne Mortgage, LLC, a subsidiary of HarborOne Bank, is a full-service mortgage lender with more than 30 offices in Massachusetts, Rhode Island, New Hampshire, Maine, New Jersey and Florida and is licensed to lend in four additional states.
Forward Looking Statements
Certain statements herein constitute forward-looking statements within the meaning of Section 27A of the Securities Act of 1933, as amended, and Section 21E of the Exchange Act and are intended to be covered by the safe harbor provisions of the Private Securities Litigation Reform Act of 1995. Such statements may be identified by words such as “believes,” “will,” “would,” “expects,” “project,” “may,” “could,” “developments,” “strategic,” “launching,” “opportunities,” “anticipates,” “estimates,” “intends,” “plans,” “targets” and similar expressions. These statements are based upon the current beliefs and expectations of the Company’s management and are subject to significant risks and uncertainties. Actual results may differ materially from those set forth in the forward-looking statements as a result of numerous factors. Factors that could cause such differences to exist include, but are not limited to, the negative impacts and disruptions of the COVID-19 pandemic and the measures taken to contain its spread on our employees, customers, business operations, credit quality, financial position, liquidity and results of operations; the length and extent of economic contraction as a result of the COVID-19 pandemic; the effects of continued deterioration in general business and economic conditions on a national basis and in the local markets in which the Company operates, including changes that adversely affect borrowers’ ability to service and repay the Company’s loans; changes in customer behavior due to changing business or economic conditions or legislative or regulatory initiatives; continued turbulence in the capital and debt markets and the impact of such conditions on the Company’s business activities; changes in interest rates; increases in loan default and charge-off rates; decreases in the value of securities in the Company’s investment portfolio; fluctuations in real estate values; the adequacy of loan loss reserves; decreases in deposit levels necessitating increased borrowing to fund loans and investments; competitive pressures from other financial institutions; acquisitions may not produce results at levels or within time frames originally anticipated; operational risks including, but not limited to, cybersecurity incidents, fraud, natural disasters, and future pandemics; changes in regulation; reputational risk relating to the Company’s participation in the Paycheck Protection Program and other pandemic-related legislative and regulatory initiatives and programs; changes in accounting standards and practices; the risk that goodwill and intangibles recorded in the Company’s financial statements will become impaired; demand for loans in the Company’s market area; the Company’s ability to attract and maintain deposits; risks related to the implementation of acquisitions, dispositions, and restructurings; the risk that the Company may not be successful in the implementation of its business strategy; changes in assumptions used in making such forward-looking statements and the risk factors described in the Annual Report on Form 10‑K and Quarterly Reports on Form 10‑Q as filed with the Securities and Exchange Commission (the “SEC”), which are available at the SEC’s website, www.sec.gov. Should one or more of these risks materialize or should underlying beliefs or assumptions prove incorrect, HarborOne Bancorp, Inc.’s actual results could differ materially from those discussed. Readers are cautioned not to place undue reliance on these forward-looking statements, which speak only as of the date of this release. The Company disclaims any obligation to publicly update or revise any forward-looking statements to reflect changes in underlying assumptions or factors, new information, future events or other changes, except as required by law.
Use of Non-GAAP Measures
In addition to results presented in accordance with generally accepted accounting principles (“GAAP”), this press release contains certain non-GAAP financial measures. The Company’s management believes that the supplemental non-GAAP information, which consists of the tax equivalent basis for yields, the efficiency ratio, tangible common equity to tangible assets ratio and tangible book value per share is utilized by regulators and market analysts to evaluate a company’s financial condition and therefore, such information is useful to investors. These disclosures should not be viewed as a substitute for financial results determined in accordance with GAAP, nor are they necessarily comparable to non-GAAP performance measures which may be presented by other companies. Because non-GAAP financial measures are not standardized, it may not be possible to compare these financial measures with other companies’ non-GAAP financial measures having the same or similar names.
HarborOne Bancorp, Inc.
Consolidated Balance Sheet Trend
(Unaudited)
|
|
|
March 31, |
|
December 31, |
|
September 30, |
|
June 30, |
|
March 31, |
|||||
|
(in thousands) |
|
2020 |
|
2019 |
|
2019 |
|
2019 |
|
2019 |
|||||
|
|
|
|
|
|
|
|
|
|
|
|
|
|
|
|
|
|
Assets |
|
|
|
|
|
|
|
|
|
|
|
|
|
|
|
|
|
|
|
|
|
|
|
|
|
|
|
|
|
|
|
|
|
Cash and due from banks |
|
$ |
35,264 |
|
$ |
24,464 |
|
$ |
27,758 |
|
$ |
27,205 |
|
$ |
25,227 |
|
Short-term investments |
|
|
200,156 |
|
|
187,152 |
|
|
210,873 |
|
|
51,502 |
|
|
76,328 |
|
Total cash and cash equivalents |
|
|
235,420 |
|
|
211,616 |
|
|
238,631 |
|
|
78,707 |
|
|
101,555 |
|
|
|
|
|
|
|
|
|
|
|
|
|
|
|
|
|
|
Securities available for sale, at fair value |
|
|
249,789 |
|
|
239,473 |
|
|
204,133 |
|
|
202,457 |
|
|
219,966 |
|
Securities held to maturity, at amortized cost |
|
|
— |
|
|
26,372 |
|
|
27,099 |
|
|
34,752 |
|
|
41,104 |
|
Federal Home Loan Bank stock, at cost |
|
|
13,530 |
|
|
17,121 |
|
|
13,466 |
|
|
14,876 |
|
|
16,134 |
|
Asset held for sale |
|
|
8,536 |
|
|
8,536 |
|
|
— |
|
|
— |
|
|
— |
|
Loans held for sale, at fair value |
|
|
118,316 |
|
|
110,552 |
|
|
102,121 |
|
|
84,651 |
|
|
32,449 |
|
Loans: |
|
|
|
|
|
|
|
|
|
|
|
|
|
|
|
|
Commercial real estate |
|
|
1,212,534 |
|
|
1,169,923 |
|
|
1,085,743 |
|
|
1,025,720 |
|
|
950,331 |
|
Commercial construction |
|
|
160,993 |
|
|
153,907 |
|
|
160,549 |
|
|
157,130 |
|
|
158,504 |
|
Commercial and industrial |
|
|
317,559 |
|
|
306,282 |
|
|
298,652 |
|
|
301,056 |
|
|
299,658 |
|
Total commercial loans |
|
|
1,691,086 |
|
|
1,630,112 |
|
|
1,544,944 |
|
|
1,483,906 |
|
|
1,408,493 |
|
Residential real estate |
|
|
1,101,540 |
|
|
1,105,565 |
|
|
1,118,439 |
|
|
1,125,381 |
|
|
1,118,914 |
|
Consumer |
|
|
391,244 |
|
|
435,881 |
|
|
448,881 |
|
|
456,654 |
|
|
473,122 |
|
Loans |
|
|
3,183,870 |
|
|
3,171,558 |
|
|
3,112,264 |
|
|
3,065,941 |
|
|
3,000,529 |
|
Less: Allowance for loan losses |
|
|
(26,389) |
|
|
(24,060) |
|
|
(23,044) |
|
|
(22,261) |
|
|
(21,282) |
|
Net loans |
|
|
3,157,481 |
|
|
3,147,498 |
|
|
3,089,220 |
|
|
3,043,680 |
|
|
2,979,247 |
|
Mortgage servicing rights, at fair value |
|
|
13,207 |
|
|
17,150 |
|
|
16,067 |
|
|
18,156 |
|
|
20,231 |
|
Goodwill |
|
|
69,802 |
|
|
69,802 |
|
|
69,635 |
|
|
69,635 |
|
|
69,635 |
|
Other intangible assets |
|
|
5,588 |
|
|
6,035 |
|
|
6,482 |
|
|
7,100 |
|
|
7,739 |
|
Other assets |
|
|
229,537 |
|
|
204,766 |
|
|
182,166 |
|
|
183,410 |
|
|
167,936 |
|
Total assets |
|
$ |
4,101,206 |
|
$ |
4,058,921 |
|
$ |
3,949,020 |
|
$ |
3,737,424 |
|
$ |
3,655,996 |
|
|
|
|
|
|
|
|
|
|
|
|
|
|
|
|
|
|
Liabilities and Stockholders' Equity |
|
|
|
|
|
|
|
|
|
|
|
|
|
|
|
|
|
|
|
|
|
|
|
|
|
|
|
|
|
|
|
|
|
Deposits: |
|
|
|
|
|
|
|
|
|
|
|
|
|
|
|
|
Demand deposit accounts |
|
$ |
439,793 |
|
$ |
406,403 |
|
$ |
446,433 |
|
$ |
447,448 |
|
$ |
432,961 |
|
NOW accounts |
|
|
174,971 |
|
|
165,877 |
|
|
143,547 |
|
|
147,058 |
|
|
141,419 |
|
Regular savings and club accounts |
|
|
744,564 |
|
|
626,685 |
|
|
585,327 |
|
|
544,401 |
|
|
497,697 |
|
Money market deposit accounts |
|
|
809,622 |
|
|
856,830 |
|
|
875,804 |
|
|
885,775 |
|
|
842,824 |
|
Term certificate accounts |
|
|
852,274 |
|
|
887,078 |
|
|
873,397 |
|
|
944,923 |
|
|
921,744 |
|
Total deposits |
|
|
3,021,224 |
|
|
2,942,873 |
|
|
2,924,508 |
|
|
2,969,605 |
|
|
2,836,645 |
|
Short-term borrowed funds |
|
|
104,000 |
|
|
183,000 |
|
|
60,000 |
|
|
98,000 |
|
|
126,000 |
|
Long-term borrowed funds |
|
|
181,123 |
|
|
171,132 |
|
|
211,140 |
|
|
211,149 |
|
|
229,935 |
|
Subordinated debt |
|
|
33,938 |
|
|
33,907 |
|
|
33,875 |
|
|
33,843 |
|
|
33,812 |
|
Other liabilities and accrued expenses |
|
|
85,782 |
|
|
62,215 |
|
|
59,943 |
|
|
53,709 |
|
|
66,156 |
|
Total liabilities |
|
|
3,426,067 |
|
|
3,393,127 |
|
|
3,289,466 |
|
|
3,366,306 |
|
|
3,292,548 |
|
|
|
|
|
|
|
|
|
|
|
|
|
|
|
|
|
|
Common stock |
|
|
584 |
|
|
584 |
|
|
584 |
|
|
327 |
|
|
327 |
|
Additional paid-in capital |
|
|
461,616 |
|
|
460,232 |
|
|
458,599 |
|
|
154,730 |
|
|
153,326 |
|
Unearned compensation - ESOP |
|
|
(32,678) |
|
|
(33,137) |
|
|
(33,838) |
|
|
(9,793) |
|
|
(9,942) |
|
Retained earnings |
|
|
242,080 |
|
|
237,356 |
|
|
233,049 |
|
|
225,936 |
|
|
221,155 |
|
Treasury stock |
|
|
(721) |
|
|
(721) |
|
|
(721) |
|
|
(1,548) |
|
|
(1,548) |
|
Accumulated other comprehensive income (loss) |
|
|
4,258 |
|
|
1,480 |
|
|
1,881 |
|
|
1,466 |
|
|
130 |
|
Total stockholders' equity |
|
|
675,139 |
|
|
665,794 |
|
|
659,554 |
|
|
371,118 |
|
|
363,448 |
|
|
|
|
|
|
|
|
|
|
|
|
|
|
|
|
|
|
Total liabilities and stockholders' equity |
|
$ |
4,101,206 |
|
$ |
4,058,921 |
|
$ |
3,949,020 |
|
$ |
3,737,424 |
|
$ |
3,655,996 |
HarborOne Bancorp, Inc.
Consolidated Statements of Net Income - Trend
(Unaudited)
|
|
|
Quarters Ended |
|||||||||||||
|
|
|
March 31, |
|
December 31, |
|
September 30, |
|
June 30, |
|
March 31, |
|||||
|
(in thousands, except share data) |
|
2020 |
|
2019 |
|
2019 |
|
2019 |
|
2019 |
|||||
|
|
|
|
|
|
|
|
|
|
|
|
|
|
|
|
|
|
Interest and dividend income: |
|
|
|
|
|
|
|
|
|
|
|
|
|
|
|
|
Interest and fees on loans |
|
$ |
34,025 |
|
$ |
36,195 |
|
$ |
36,230 |
|
$ |
35,438 |
|
$ |
34,365 |
|
Interest on loans held for sale |
|
|
577 |
|
|
1,120 |
|
|
747 |
|
|
542 |
|
|
358 |
|
Interest on securities |
|
|
1,808 |
|
|
1,580 |
|
|
1,542 |
|
|
1,850 |
|
|
1,847 |
|
Other interest and dividend income |
|
|
759 |
|
|
828 |
|
|
1,211 |
|
|
448 |
|
|
483 |
|
Total interest and dividend income |
|
|
37,169 |
|
|
39,723 |
|
|
39,730 |
|
|
38,278 |
|
|
37,053 |
|
|
|
|
|
|
|
|
|
|
|
|
|
|
|
|
|
|
Interest expense: |
|
|
|
|
|
|
|
|
|
|
|
|
|
|
|
|
Interest on deposits |
|
|
8,693 |
|
|
9,480 |
|
|
9,972 |
|
|
9,362 |
|
|
8,243 |
|
Interest on FHLB borrowings |
|
|
1,253 |
|
|
1,385 |
|
|
1,249 |
|
|
1,679 |
|
|
2,275 |
|
Interest on subordinated debentures |
|
|
523 |
|
|
524 |
|
|
524 |
|
|
524 |
|
|
505 |
|
Total interest expense |
|
|
10,469 |
|
|
11,389 |
|
|
11,745 |
|
|
11,565 |
|
|
11,023 |
|
|
|
|
|
|
|
|
|
|
|
|
|
|
|
|
|
|
Net interest and dividend income |
|
|
26,700 |
|
|
28,334 |
|
|
27,985 |
|
|
26,713 |
|
|
26,030 |
|
|
|
|
|
|
|
|
|
|
|
|
|
|
|
|
|
|
Provision for loan losses |
|
|
3,749 |
|
|
1,251 |
|
|
889 |
|
|
1,750 |
|
|
857 |
|
|
|
|
|
|
|
|
|
|
|
|
|
|
|
|
|
|
Net interest and dividend income, after provision for loan losses |
|
|
22,951 |
|
|
27,083 |
|
|
27,096 |
|
|
24,963 |
|
|
25,173 |
|
|
|
|
|
|
|
|
|
|
|
|
|
|
|
|
|
|
Noninterest income: |
|
|
|
|
|
|
|
|
|
|
|
|
|
|
|
|
Mortgage banking income: |
|
|
|
|
|
|
|
|
|
|
|
|
|
|
|
|
Changes in mortgage servicing rights fair value |
|
|
(4,387) |
|
|
625 |
|
|
(2,474) |
|
|
(2,241) |
|
|
(2,151) |
|
Other |
|
|
14,849 |
|
|
12,365 |
|
|
13,979 |
|
|
10,896 |
|
|
6,653 |
|
Total mortgage banking income |
|
|
10,462 |
|
|
12,990 |
|
|
11,505 |
|
|
8,655 |
|
|
4,502 |
|
|
|
|
|
|
|
|
|
|
|
|
|
|
|
|
|
|
Deposit account fees |
|
|
3,931 |
|
|
4,274 |
|
|
4,186 |
|
|
4,056 |
|
|
3,778 |
|
Income on retirement plan annuities |
|
|
101 |
|
|
102 |
|
|
104 |
|
|
100 |
|
|
96 |
|
Loss on asset held for sale |
|
|
— |
|
|
(482) |
|
|
— |
|
|
— |
|
|
— |
|
Gain on sale and call of securities, net |
|
|
2,525 |
|
|
— |
|
|
77 |
|
|
1,267 |
|
|
— |
|
Bank-owned life insurance income |
|
|
551 |
|
|
343 |
|
|
256 |
|
|
253 |
|
|
253 |
|
Other income |
|
|
1,296 |
|
|
912 |
|
|
1,145 |
|
|
1,387 |
|
|
1,213 |
|
Total noninterest income |
|
|
18,866 |
|
|
18,139 |
|
|
17,273 |
|
|
15,718 |
|
|
9,842 |
|
|
|
|
|
|
|
|
|
|
|
|
|
|
|
|
|
|
Noninterest expenses: |
|
|
|
|
|
|
|
|
|
|
|
|
|
|
|
|
Compensation and benefits |
|
|
21,185 |
|
|
23,719 |
|
|
23,238 |
|
|
20,585 |
|
|
19,245 |
|
Occupancy and equipment |
|
|
4,563 |
|
|
4,366 |
|
|
4,171 |
|
|
4,411 |
|
|
4,448 |
|
Data processing |
|
|
2,180 |
|
|
2,251 |
|
|
2,196 |
|
|
2,199 |
|
|
2,046 |
|
Loan expense |
|
|
1,481 |
|
|
1,893 |
|
|
1,704 |
|
|
1,334 |
|
|
1,271 |
|
Marketing |
|
|
876 |
|
|
771 |
|
|
799 |
|
|
1,177 |
|
|
958 |
|
Professional fees |
|
|
1,228 |
|
|
2,470 |
|
|
889 |
|
|
1,384 |
|
|
946 |
|
Deposit insurance |
|
|
271 |
|
|
5 |
|
|
(225) |
|
|
589 |
|
|
666 |
|
Other expenses |
|
|
3,604 |
|
|
3,260 |
|
|
3,431 |
|
|
3,402 |
|
|
3,012 |
|
Total noninterest expenses |
|
|
35,388 |
|
|
38,735 |
|
|
36,203 |
|
|
35,081 |
|
|
32,592 |
|
|
|
|
|
|
|
|
|
|
|
|
|
|
|
|
|
|
Income before income taxes |
|
|
6,429 |
|
|
6,487 |
|
|
8,166 |
|
|
5,600 |
|
|
2,423 |
|
|
|
|
|
|
|
|
|
|
|
|
|
|
|
|
|
|
Income tax provision |
|
|
1,705 |
|
|
2,180 |
|
|
1,053 |
|
|
819 |
|
|
356 |
|
|
|
|
|
|
|
|
|
|
|
|
|
|
|
|
|
|
Net income |
|
$ |
4,724 |
|
$ |
4,307 |
|
$ |
7,113 |
|
$ |
4,781 |
|
$ |
2,067 |
|
|
|
|
|
|
|
|
|
|
|
|
|
|
|
|
|
|
Earnings per common share (1): |
|
|
|
|
|
|
|
|
|
|
|
|
|
|
|
|
Basic |
|
$ |
0.09 |
|
$ |
0.08 |
|
$ |
0.13 |
|
$ |
0.08 |
|
$ |
0.04 |
|
Diluted |
|
$ |
0.09 |
|
$ |
0.08 |
|
$ |
0.13 |
|
$ |
0.08 |
|
$ |
0.04 |
|
Weighted average shares outstanding (1): |
|
|
|
|
|
|
|
|
|
|
|
|
|
|
|
|
Basic |
|
|
54,392,465 |
|
|
54,208,629 |
|
|
55,638,734 |
|
|
56,704,297 |
|
|
56,666,979 |
|
Diluted |
|
|
54,392,465 |
|
|
54,209,182 |
|
|
55,638,734 |
|
|
56,704,297 |
|
|
56,666,979 |
|
|
|
|
|
|
|
|
|
|
|
|
|
|
|
|
|
|
(1) Share amounts related to periods prior to the date of the completion of the second step offering ("stock offering") (August 14, 2019) have been restated to give retroactive recognition to the exchange ratio applied in the stock offering (1.795431-to-one) |
|||||||||||||||
HarborOne Bancorp, Inc.
Consolidated Statements of Net Income
(Unaudited)
|
|
|
For the Three Months Ended March 31, |
|
|
|
|
|
|||||
|
(dollars in thousands, except share data) |
|
2020 |
|
2019 |
|
$ Change |
|
% Change |
|
|||
|
|
|
|
|
|
|
|
|
|
|
|
|
|
|
Interest and dividend income: |
|
|
|
|
|
|
|
|
|
|
|
|
|
Interest and fees on loans |
|
$ |
34,025 |
|
$ |
34,365 |
|
$ |
(340) |
|
(1.0) |
% |
|
Interest on loans held for sale |
|
|
577 |
|
|
358 |
|
|
219 |
|
61.2 |
|
|
Interest on securities |
|
|
1,808 |
|
|
1,847 |
|
|
(39) |
|
(2.1) |
|
|
Other interest and dividend income |
|
|
759 |
|
|
483 |
|
|
276 |
|
57.1 |
|
|
Total interest and dividend income |
|
|
37,169 |
|
|
37,053 |
|
|
116 |
|
0.3 |
|
|
|
|
|
|
|
|
|
|
|
|
|
|
|
|
Interest expense: |
|
|
|
|
|
|
|
|
|
|
|
|
|
Interest on deposits |
|
|
8,693 |
|
|
8,243 |
|
|
450 |
|
5.5 |
|
|
Interest on FHLB borrowings |
|
|
1,253 |
|
|
2,275 |
|
|
(1,022) |
|
(44.9) |
|
|
Interest on subordinated debentures |
|
|
523 |
|
|
505 |
|
|
18 |
|
3.6 |
|
|
Total interest expense |
|
|
10,469 |
|
|
11,023 |
|
|
(554) |
|
(5.0) |
|
|
|
|
|
|
|
|
|
|
|
|
|
|
|
|
Net interest and dividend income |
|
|
26,700 |
|
|
26,030 |
|
|
670 |
|
2.6 |
|
|
|
|
|
|
|
|
|
|
|
|
|
|
|
|
Provision for loan losses |
|
|
3,749 |
|
|
857 |
|
|
2,892 |
|
337.5 |
|
|
|
|
|
|
|
|
|
|
|
|
|
|
|
|
Net interest and dividend income, after provision for loan losses |
|
|
22,951 |
|
|
25,173 |
|
|
(2,222) |
|
(8.8) |
|
|
|
|
|
|
|
|
|
|
|
|
|
|
|
|
Noninterest income: |
|
|
|
|
|
|
|
|
|
|
|
|
|
Mortgage banking income: |
|
|
|
|
|
|
|
|
|
|
|
|
|
Changes in mortgage servicing rights fair value |
|
|
(4,387) |
|
|
(2,151) |
|
|
(2,236) |
|
(104.0) |
|
|
Other |
|
|
14,849 |
|
|
6,653 |
|
|
8,196 |
|
123.2 |
|
|
Total mortgage banking income |
|
|
10,462 |
|
|
4,502 |
|
|
5,960 |
|
132.4 |
|
|
|
|
|
|
|
|
|
|
|
|
|
|
|
|
Deposit account fees |
|
|
3,931 |
|
|
3,778 |
|
|
153 |
|
4.0 |
|
|
Income on retirement plan annuities |
|
|
101 |
|
|
96 |
|
|
5 |
|
5.2 |
|
|
Gain on sale and call of securities, net |
|
|
2,525 |
|
|
— |
|
|
2,525 |
|
100.0 |
|
|
Bank-owned life insurance income |
|
|
551 |
|
|
253 |
|
|
298 |
|
117.8 |
|
|
Other income |
|
|
1,296 |
|
|
1,213 |
|
|
83 |
|
6.8 |
|
|
Total noninterest income |
|
|
18,866 |
|
|
9,842 |
|
|
9,024 |
|
91.7 |
|
|
|
|
|
|
|
|
|
|
|
|
|
|
|
|
Noninterest expenses: |
|
|
|
|
|
|
|
|
|
|
|
|
|
Compensation and benefits |
|
|
21,185 |
|
|
19,245 |
|
|
1,940 |
|
10.1 |
|
|
Occupancy and equipment |
|
|
4,563 |
|
|
4,448 |
|
|
115 |
|
2.6 |
|
|
Data processing |
|
|
2,180 |
|
|
2,046 |
|
|
134 |
|
6.5 |
|
|
Loan expense |
|
|
1,481 |
|
|
1,271 |
|
|
210 |
|
16.5 |
|
|
Marketing |
|
|
876 |
|
|
958 |
|
|
(82) |
|
(8.6) |
|
|
Professional fees |
|
|
1,228 |
|
|
946 |
|
|
282 |
|
29.8 |
|
|
Deposit insurance |
|
|
271 |
|
|
666 |
|
|
(395) |
|
(59.3) |
|
|
Other expenses |
|
|
3,604 |
|
|
3,012 |
|
|
592 |
|
19.7 |
|
|
Total noninterest expenses |
|
|
35,388 |
|
|
32,592 |
|
|
2,796 |
|
8.6 |
|
|
|
|
|
|
|
|
|
|
|
|
|
|
|
|
Income before income taxes |
|
|
6,429 |
|
|
2,423 |
|
|
4,006 |
|
165.3 |
|
|
|
|
|
|
|
|
|
|
|
|
|
|
|
|
Income tax provision |
|
|
1,705 |
|
|
356 |
|
|
1,349 |
|
378.9 |
|
|
|
|
|
|
|
|
|
|
|
|
|
|
|
|
Net income |
|
$ |
4,724 |
|
$ |
2,067 |
|
$ |
2,657 |
|
128.5 |
% |
|
|
|
|
|
|
|
|
|
|
|
|
|
|
|
Earnings per common share (1): |
|
|
|
|
|
|
|
|
|
|
|
|
|
Basic |
|
$ |
0.09 |
|
$ |
0.04 |
|
|
|
|
|
|
|
Diluted |
|
$ |
0.09 |
|
$ |
0.04 |
|
|
|
|
|
|
|
Weighted average shares outstanding (1): |
|
|
|
|
|
|
|
|
|
|
|
|
|
Basic |
|
|
54,392,465 |
|
|
56,666,979 |
|
|
|
|
|
|
|
Diluted |
|
|
54,392,465 |
|
|
56,666,979 |
|
|
|
|
|
|
|
|
|
|
|
|
|
|
|
|
|
|
|
|
|
(1) Share amounts related to periods prior to the date of the completion of the stock offering (August 14, 2019) have been restated to give retroactive recognition to the exchange ratio applied in the stock offering (1.795431-to-one) |
||||||||||||
HarborOne Bancorp, Inc.
Average Balances / Yields
(Unaudited)
|
|
|
Quarters Ended |
|
||||||||||||||||||||||
|
|
|
March 31, 2020 |
|
December 31, 2019 |
|
March 31, 2019 |
|
||||||||||||||||||
|
|
|
Average |
|
|
|
|
|
Average |
|
|
|
|
|
Average |
|
|
|
|
|
||||||
|
|
|
Outstanding |
|
|
|
Yield/ |
|
Outstanding |
|
|
|
Yield/ |
|
Outstanding |
|
|
|
Yield/ |
|
||||||
|
|
|
Balance |
|
Interest |
|
Cost (6) |
|
Balance |
|
Interest |
|
Cost (6) |
|
Balance |
|
Interest |
|
Cost (6) |
|
||||||
|
|
|
(dollars in thousands) |
|
||||||||||||||||||||||
|
Interest-earning assets: |
|
|
|
|
|
|
|
|
|
|
|
|
|
|
|
|
|
|
|
|
|
|
|
|
|
|
Investment securities (1) |
|
$ |
275,632 |
|
$ |
1,822 |
|
2.66 |
% |
$ |
236,828 |
|
$ |
1,595 |
|
2.67 |
% |
$ |
260,211 |
|
$ |
1,886 |
|
2.94 |
% |
|
Other interest-earning assets |
|
|
186,619 |
|
|
759 |
|
1.64 |
|
|
159,211 |
|
|
828 |
|
2.06 |
|
|
37,971 |
|
|
483 |
|
5.16 |
|
|
Loans held for sale |
|
|
61,548 |
|
|
577 |
|
3.77 |
|
|
115,699 |
|
|
1,120 |
|
3.84 |
|
|
29,333 |
|
|
358 |
|
4.95 |
|
|
Loans |
|
|
|
|
|
|
|
|
|
|
|
|
|
|
|
|
|
|
|
|
|
|
|
|
|
|
Commercial loans (2) |
|
|
1,647,667 |
|
|
18,123 |
|
4.42 |
|
|
1,591,188 |
|
|
19,230 |
|
4.79 |
|
|
1,382,830 |
|
|
17,478 |
|
5.13 |
|
|
Residential real estate loans (2) |
|
|
1,100,177 |
|
|
11,544 |
|
4.22 |
|
|
1,105,025 |
|
|
12,284 |
|
4.41 |
|
|
1,119,045 |
|
|
12,207 |
|
4.42 |
|
|
Consumer loans (2) |
|
|
415,317 |
|
|
4,358 |
|
4.22 |
|
|
442,689 |
|
|
4,681 |
|
4.20 |
|
|
485,735 |
|
|
4,680 |
|
3.91 |
|
|
Total loans |
|
|
3,163,161 |
|
|
34,025 |
|
4.33 |
|
|
3,138,902 |
|
|
36,195 |
|
4.58 |
|
|
2,987,610 |
|
|
34,365 |
|
4.66 |
|
|
Total interest-earning assets |
|
|
3,686,960 |
|
|
37,183 |
|
4.06 |
|
|
3,650,640 |
|
|
39,738 |
|
4.32 |
|
|
3,315,125 |
|
|
37,092 |
|
4.54 |
|
|
Noninterest-earning assets |
|
|
314,193 |
|
|
|
|
|
|
|
288,558 |
|
|
|
|
|
|
|
252,882 |
|
|
|
|
|
|
|
Total assets |
|
$ |
4,001,153 |
|
|
|
|
|
|
$ |
3,939,198 |
|
|
|
|
|
|
$ |
3,568,007 |
|
|
|
|
|
|
|
Interest-bearing liabilities: |
|
|
|
|
|
|
|
|
|
|
|
|
|
|
|
|
|
|
|
|
|
|
|
|
|
|
Savings accounts |
|
$ |
686,031 |
|
|
1,298 |
|
0.76 |
|
$ |
616,008 |
|
|
1,202 |
|
0.77 |
|
$ |
484,963 |
|
|
364 |
|
0.30 |
|
|
NOW accounts |
|
|
158,702 |
|
|
31 |
|
0.08 |
|
|
142,505 |
|
|
28 |
|
0.08 |
|
|
136,954 |
|
|
25 |
|
0.07 |
|
|
Money market accounts |
|
|
835,154 |
|
|
2,583 |
|
1.24 |
|
|
867,066 |
|
|
3,109 |
|
1.42 |
|
|
794,477 |
|
|
2,760 |
|
1.41 |
|
|
Certificates of deposit |
|
|
794,883 |
|
|
4,357 |
|
2.20 |
|
|
811,199 |
|
|
4,725 |
|
2.31 |
|
|
812,992 |
|
|
4,512 |
|
2.25 |
|
|
Brokered deposits |
|
|
92,189 |
|
|
424 |
|
1.85 |
|
|
69,035 |
|
|
416 |
|
2.39 |
|
|
99,341 |
|
|
582 |
|
2.38 |
|
|
Total interest-bearing deposits |
|
|
2,566,959 |
|
|
8,693 |
|
1.36 |
|
|
2,505,813 |
|
|
9,480 |
|
1.50 |
|
|
2,328,727 |
|
|
8,243 |
|
1.44 |
|
|
FHLB advances |
|
|
241,302 |
|
|
1,253 |
|
2.09 |
|
|
249,102 |
|
|
1,385 |
|
2.21 |
|
|
392,483 |
|
|
2,275 |
|
2.35 |
|
|
Subordinated debentures |
|
|
33,919 |
|
|
523 |
|
6.20 |
|
|
33,887 |
|
|
524 |
|
6.13 |
|
|
33,822 |
|
|
505 |
|
6.05 |
|
|
Total borrowings |
|
|
275,221 |
|
|
1,776 |
|
2.60 |
|
|
282,989 |
|
|
1,909 |
|
2.68 |
|
|
426,305 |
|
|
2,780 |
|
2.64 |
|
|
Total interest-bearing liabilities |
|
|
2,842,180 |
|
|
10,469 |
|
1.48 |
|
|
2,788,802 |
|
|
11,389 |
|
1.62 |
|
|
2,755,032 |
|
|
11,023 |
|
1.62 |
|
|
Noninterest-bearing liabilities: |
|
|
|
|
|
|
|
|
|
|
|
|
|
|
|
|
|
|
|
|
|
|
|
|
|
|
Noninterest-bearing deposits |
|
|
419,620 |
|
|
|
|
|
|
|
433,478 |
|
|
|
|
|
|
|
400,573 |
|
|
|
|
|
|
|
Other noninterest-bearing liabilities |
|
|
67,714 |
|
|
|
|
|
|
|
54,022 |
|
|
|
|
|
|
|
52,219 |
|
|
|
|
|
|
|
Total liabilities |
|
|
3,329,514 |
|
|
|
|
|
|
|
3,276,302 |
|
|
|
|
|
|
|
3,207,824 |
|
|
|
|
|
|
|
Total equity |
|
|
671,639 |
|
|
|
|
|
|
|
662,896 |
|
|
|
|
|
|
|
360,183 |
|
|
|
|
|
|
|
Total liabilities and equity |
|
$ |
4,001,153 |
|
|
|
|
|
|
$ |
3,939,198 |
|
|
|
|
|
|
$ |
3,568,007 |
|
|
|
|
|
|
|
Tax equivalent net interest income |
|
|
|
|
|
26,714 |
|
|
|
|
|
|
|
28,349 |
|
|
|
|
|
|
|
26,069 |
|
|
|
|
Tax equivalent interest rate spread (3) |
|
|
|
|
|
|
|
2.58 |
% |
|
|
|
|
|
|
2.70 |
% |
|
|
|
|
|
|
2.92 |
% |
|
Less: tax equivalent adjustment |
|
|
|
|
|
14 |
|
|
|
|
|
|
|
15 |
|
|
|
|
|
|
|
39 |
|
|
|
|
Net interest income as reported |
|
|
|
|
$ |
26,700 |
|
|
|
|
|
|
$ |
28,334 |
|
|
|
|
|
|
$ |
26,030 |
|
|
|
|
Net interest-earning assets (4) |
|
$ |
844,780 |
|
|
|
|
|
|
$ |
861,838 |
|
|
|
|
|
|
$ |
560,093 |
|
|
|
|
|
|
|
Net interest margin (5) |
|
|
|
|
|
|
|
2.91 |
% |
|
|
|
|
|
|
3.08 |
% |
|
|
|
|
|
|
3.18 |
% |
|
Tax equivalent effect |
|
|
|
|
|
|
|
— |
|
|
|
|
|
|
|
— |
|
|
|
|
|
|
|
0.01 |
|
|
Net interest margin on a fully tax equivalent basis |
|
|
|
|
|
|
|
2.91 |
% |
|
|
|
|
|
|
3.08 |
% |
|
|
|
|
|
|
3.19 |
% |
|
Average interest-earning assets to average interest-bearing liabilities |
|
|
129.72 |
% |
|
|
|
|
|
|
130.90 |
% |
|
|
|
|
|
|
120.33 |
% |
|
|
|
|
|
|
|
|
|
|
|
|
|
|
|
|
|
|
|
|
|
|
|
|
|
|
|
|
|
|
|
|
|
Supplemental information: |
|
|
|
|
|
|
|
|
|
|
|
|
|
|
|
|
|
|
|
|
|
|
|
|
|
|
Total deposits, including demand deposits |
|
$ |
2,986,579 |
|
$ |
8,693 |
|
|
|
$ |
2,939,291 |
|
$ |
9,480 |
|
|
|
$ |
2,729,300 |
|
$ |
8,243 |
|
|
|
|
Cost of total deposits |
|
|
|
|
|
|
|
1.17 |
% |
|
|
|
|
|
|
1.28 |
% |
|
|
|
|
|
|
1.22 |
% |
|
Total funding liabilities, including demand deposits |
|
$ |
3,261,800 |
|
$ |
10,469 |
|
|
|
$ |
3,222,280 |
|
$ |
11,389 |
|
|
|
$ |
3,155,605 |
|
$ |
11,023 |
|
|
|
|
Cost of total funding liabilities |
|
|
|
|
|
|
|
1.29 |
% |
|
|
|
|
|
|
1.40 |
% |
|
|
|
|
|
|
1.42 |
% |
|
|
|
|
|
|
|
|
|
|
|
|
|
|
|
|
|
|
|
|
|
|
|
|
|
|
|
|
|
|
|
|
|
|
|
|
|
|
|
|
|
|
|
|
|
|
|
|
|
|
|
|
|
|
|
(1) Includes securities available for sale and securities held to maturity. Interest income from tax exempt securities is computed on a taxable equivalent basis using a tax rate of 21% for the quarters presented. The yield on investments before tax equivalent adjustments for the quarters presented were 2.64%, 2.64%, and 2.88%, respectively. |
|
||||||||||||||||||||||||
|
(2) Includes nonaccruing loan balances and interest received on such loans. |
|
||||||||||||||||||||||||
|
(3) Net interest rate spread represents the difference between the yield on average interest-earning assets and the cost of average interest-bearing liabilities. |
|
||||||||||||||||||||||||
|
(4) Net interest-earning assets represents total interest-earning assets less total interest-bearing liabilities. |
|
||||||||||||||||||||||||
|
(5) Net interest margin represents net interest income divided by average total interest-earning assets. |
|
||||||||||||||||||||||||
|
(6) Annualized. |
|
||||||||||||||||||||||||
HarborOne Bancorp, Inc.
Average Balances and Yield Trend
(Unaudited)
|
|
|
Average Balances - Trend - Quarters Ended |
|
|||||||||||||
|
|
|
March 31, 2020 |
|
December 31, 2019 |
|
September 30, 2019 |
|
June 30, 2019 |
|
March 31, 2019 |
|
|||||
|
|
|
(in thousands) |
|
|||||||||||||
|
Interest-earning assets: |
|
|
|
|
|
|
|
|
|
|
|
|
|
|
|
|
|
Investment securities (1) |
|
$ |
275,632 |
|
$ |
236,828 |
|
$ |
224,379 |
|
$ |
259,151 |
|
$ |
260,211 |
|
|
Other interest-earning assets |
|
|
186,619 |
|
|
159,211 |
|
|
185,063 |
|
|
26,758 |
|
|
37,971 |
|
|
Loans held for sale |
|
|
61,548 |
|
|
115,699 |
|
|
74,327 |
|
|
48,158 |
|
|
29,333 |
|
|
Loans |
|
|
|
|
|
|
|
|
|
|
|
|
|
|
|
|
|
Commercial loans (2) |
|
|
1,647,667 |
|
|
1,591,188 |
|
|
1,511,487 |
|
|
1,445,652 |
|
|
1,382,830 |
|
|
Residential real estate loans (2) |
|
|
1,100,177 |
|
|
1,105,025 |
|
|
1,119,742 |
|
|
1,118,761 |
|
|
1,119,045 |
|
|
Consumer loans (2) |
|
|
415,317 |
|
|
442,689 |
|
|
454,837 |
|
|
459,774 |
|
|
485,735 |
|
|
Total loans |
|
|
3,163,161 |
|
|
3,138,902 |
|
|
3,086,066 |
|
|
3,024,187 |
|
|
2,987,610 |
|
|
Total interest-earning assets |
|
|
3,686,960 |
|
|
3,650,640 |
|
|
3,569,835 |
|
|
3,358,254 |
|
|
3,315,125 |
|
|
Noninterest-earning assets |
|
|
314,193 |
|
|
288,558 |
|
|
278,976 |
|
|
260,864 |
|
|
252,882 |
|
|
Total assets |
|
$ |
4,001,153 |
|
$ |
3,939,198 |
|
$ |
3,848,811 |
|
$ |
3,619,118 |
|
$ |
3,568,007 |
|
|
Interest-bearing liabilities: |
|
|
|
|
|
|
|
|
|
|
|
|
|
|
|
|
|
Savings accounts |
|
$ |
686,031 |
|
$ |
616,008 |
|
$ |
564,040 |
|
$ |
528,360 |
|
$ |
484,963 |
|
|
NOW accounts |
|
|
158,702 |
|
|
142,505 |
|
|
139,773 |
|
|
140,115 |
|
|
136,954 |
|
|
Money market accounts |
|
|
835,154 |
|
|
867,066 |
|
|
879,694 |
|
|
872,653 |
|
|
794,477 |
|
|
Certificates of deposit |
|
|
794,883 |
|
|
811,199 |
|
|
831,262 |
|
|
788,701 |
|
|
812,992 |
|
|
Brokered deposits |
|
|
92,189 |
|
|
69,035 |
|
|
98,278 |
|
|
124,122 |
|
|
99,341 |
|
|
Total interest-bearing deposits |
|
|
2,566,959 |
|
|
2,505,813 |
|
|
2,513,047 |
|
|
2,453,951 |
|
|
2,328,727 |
|
|
FHLB advances |
|
|
241,302 |
|
|
249,102 |
|
|
213,578 |
|
|
291,835 |
|
|
392,483 |
|
|
Subordinated debentures |
|
|
33,919 |
|
|
33,887 |
|
|
33,858 |
|
|
33,826 |
|
|
33,822 |
|
|
Total borrowings |
|
|
275,221 |
|
|
282,989 |
|
|
247,436 |
|
|
325,661 |
|
|
426,305 |
|
|
Total interest-bearing liabilities |
|
|
2,842,180 |
|
|
2,788,802 |
|
|
2,760,483 |
|
|
2,779,612 |
|
|
2,755,032 |
|
|
Noninterest-bearing liabilities: |
|
|
|
|
|
|
|
|
|
|
|
|
|
|
|
|
|
Noninterest-bearing deposits |
|
|
419,620 |
|
|
433,478 |
|
|
515,612 |
|
|
423,462 |
|
|
400,573 |
|
|
Other noninterest-bearing liabilities |
|
|
67,714 |
|
|
54,022 |
|
|
52,357 |
|
|
49,163 |
|
|
52,219 |
|
|
Total liabilities |
|
|
3,329,514 |
|
|
3,276,302 |
|
|
3,328,452 |
|
|
3,252,237 |
|
|
3,207,824 |
|
|
Total equity |
|
|
671,639 |
|
|
662,896 |
|
|
520,359 |
|
|
366,881 |
|
|
360,183 |
|
|
Total liabilities and equity |
|
$ |
4,001,153 |
|
$ |
3,939,198 |
|
$ |
3,848,811 |
|
$ |
3,619,118 |
|
$ |
3,568,007 |
|
|
|
|
|
|
|
|
|
|
|
|
|
|
|
|
|
|
|
|
|
|
Annualized Yield Trend - Quarters Ended |
|
|||||||||||||
|
|
|
March 31, 2020 |
|
December 31, 2019 |
|
September 30, 2019 |
|
June 30, 2019 |
|
March 31, 2019 |
|
|||||
|
Interest-earning assets: |
|
|
|
|
|
|
|
|
|
|
|
|
|
|
|
|
|
Investment securities (1) |
|
|
2.66 |
% |
|
2.67 |
% |
|
2.76 |
% |
|
2.91 |
% |
|
2.94 |
% |
|
Other interest-earning assets |
|
|
1.64 |
% |
|
2.06 |
% |
|
2.59 |
% |
|
6.71 |
% |
|
5.16 |
% |
|
Loans held for sale |
|
|
3.77 |
% |
|
3.84 |
% |
|
3.99 |
% |
|
4.52 |
% |
|
4.95 |
% |
|
Commercial loans (2) |
|
|
4.42 |
% |
|
4.79 |
% |
|
4.93 |
% |
|
5.16 |
% |
|
5.13 |
% |
|
Residential real estate loans (2) |
|
|
4.22 |
% |
|
4.41 |
% |
|
4.50 |
% |
|
4.40 |
% |
|
4.42 |
% |
|
Consumer loans (2) |
|
|
4.22 |
% |
|
4.20 |
% |
|
4.13 |
% |
|
4.01 |
% |
|
3.91 |
% |
|
Total loans |
|
|
4.33 |
% |
|
4.58 |
% |
|
4.66 |
% |
|
4.70 |
% |
|
4.66 |
% |
|
Total interest-earning assets |
|
|
4.06 |
% |
|
4.32 |
% |
|
4.42 |
% |
|
4.58 |
% |
|
4.54 |
% |
|
|
|
|
|
|
|
|
|
|
|
|
|
|
|
|
|
|
|
Interest-bearing liabilities: |
|
|
|
|
|
|
|
|
|
|
|
|
|
|
|
|
|
Savings accounts |
|
|
0.76 |
% |
|
0.77 |
% |
|
0.63 |
% |
|
0.43 |
% |
|
0.30 |
% |
|
NOW accounts |
|
|
0.08 |
% |
|
0.08 |
% |
|
0.07 |
% |
|
0.07 |
% |
|
0.07 |
% |
|
Money market accounts |
|
|
1.24 |
% |
|
1.42 |
% |
|
1.54 |
% |
|
1.56 |
% |
|
1.41 |
% |
|
Certificates of deposit |
|
|
2.20 |
% |
|
2.31 |
% |
|
2.39 |
% |
|
2.35 |
% |
|
2.25 |
% |
|
Brokered deposits |
|
|
1.85 |
% |
|
2.39 |
% |
|
2.47 |
% |
|
2.46 |
% |
|
2.38 |
% |
|
Total interest-bearing deposits |
|
|
1.36 |
% |
|
1.50 |
% |
|
1.57 |
% |
|
1.53 |
% |
|
1.44 |
% |
|
FHLB advances |
|
|
2.09 |
% |
|
2.21 |
% |
|
2.32 |
% |
|
2.31 |
% |
|
2.35 |
% |
|
Subordinated debentures |
|
|
6.20 |
% |
|
6.13 |
% |
|
6.14 |
% |
|
6.21 |
% |
|
6.05 |
% |
|
Total borrowings |
|
|
2.60 |
% |
|
2.68 |
% |
|
2.84 |
% |
|
2.71 |
% |
|
2.64 |
% |
|
Total interest-bearing liabilities |
|
|
1.48 |
% |
|
1.62 |
% |
|
1.69 |
% |
|
1.67 |
% |
|
1.62 |
% |
|
|
|
|
|
|
|
|
|
|
|
|
|
|
|
|
|
|
|
(1) Includes securities available for sale and securities held to maturity. |
|
|||||||||||||||
|
(2) Includes nonaccruing loan balances and interest received on such loans. |
|
|||||||||||||||
HarborOne Bancorp, Inc.
Selected Financial Highlights
(Unaudited)
|
|
|
Quarters Ended |
|
|||||||||||||
|
|
|
March 31, |
|
December 31, |
|
September 30, |
|
June 30, |
|
March 31, |
|
|||||
|
Performance Ratios (annualized): |
|
2020 |
|
2019 |
|
2019 |
|
2019 |
|
2019 |
|
|||||
|
(dollars in thousands) |
|
|
|
|
|
|
|
|
|
|
|
|
|
|
|
|
|
|
|
|
|
|
|
|
|
|
|
|
|
|
|
|
|
|
|
Return on average assets (ROAA) |
|
|
0.47 |
% |
|
0.44 |
% |
|
0.74 |
% |
|
0.53 |
% |
|
0.23 |
% |
|
|
|
|
|
|
|
|
|
|
|
|
|
|
|
|
|
|
|
Return on average equity (ROAE) |
|
|
2.81 |
% |
|
2.60 |
% |
|
5.47 |
% |
|
5.21 |
% |
|
2.30 |
% |
|
|
|
|
|
|
|
|
|
|
|
|
|
|
|
|
|
|
|
Total noninterest expense |
|
$ |
35,388 |
|
$ |
38,735 |
|
$ |
36,203 |
|
$ |
35,081 |
|
$ |
32,592 |
|
|
Less: Amortization of other intangible assets |
|
|
447 |
|
|
448 |
|
|
617 |
|
|
639 |
|
|
640 |
|
|
Total adjusted noninterest expense |
|
$ |
34,941 |
|
$ |
38,287 |
|
$ |
35,586 |
|
$ |
34,442 |
|
$ |
31,952 |
|
|
|
|
|
|
|
|
|
|
|
|
|
|
|
|
|
|
|
|
Net interest and dividend income |
|
$ |
26,700 |
|
$ |
28,334 |
|
$ |
27,985 |
|
$ |
26,713 |
|
$ |
26,030 |
|
|
Total noninterest income |
|
|
18,866 |
|
|
18,139 |
|
|
17,273 |
|
|
15,718 |
|
|
9,842 |
|
|
Total revenue |
|
$ |
45,566 |
|
$ |
46,473 |
|
$ |
45,258 |
|
$ |
42,431 |
|
$ |
35,872 |
|
|
|
|
|
|
|
|
|
|
|
|
|
|
|
|
|
|
|
|
Efficiency ratio (1) |
|
|
76.68 |
% |
|
82.39 |
% |
|
78.63 |
% |
|
81.17 |
% |
|
89.07 |
% |
|
|
|
|
|
|
|
|
|
|
|
|
|
|
|
|
|
|
|
(1) This non-GAAP measure represents adjusted noninterest expense divided by total revenue |
|
|||||||||||||||
|
|
|
At or for the Quarters Ended |
|
|||||||||||||
|
|
|
March 31, |
|
December 31, |
|
September 30, |
|
June 30, |
|
March 31, |
|
|||||
|
Asset Quality |
|
2020 |
|
2019 |
|
2019 |
|
2019 |
|
2019 |
|
|||||
|
(dollars in thousands) |
|
|
|
|
|
|
|
|
|
|
|
|
|
|
|
|
|
|
|
|
|
|
|
|
|
|
|
|
|
|
|
|
|
|
|
Total nonperforming assets |
|
$ |
32,134 |
|
$ |
31,040 |
|
$ |
27,947 |
|
$ |
17,165 |
|
$ |
19,266 |
|
|
|
|
|
|
|
|
|
|
|
|
|
|
|
|
|
|
|
|
Nonperforming assets to total assets |
|
|
0.78 |
% |
|
0.76 |
% |
|
0.71 |
% |
|
0.46 |
% |
|
0.53 |
% |
|
|
|
|
|
|
|
|
|
|
|
|
|
|
|
|
|
|
|
Allowance for loan losses to total loans |
|
|
0.83 |
% |
|
0.76 |
% |
|
0.74 |
% |
|
0.73 |
% |
|
0.71 |
% |
|
|
|
|
|
|
|
|
|
|
|
|
|
|
|
|
|
|
|
Net charge offs |
|
$ |
1,421 |
|
$ |
235 |
|
$ |
106 |
|
$ |
771 |
|
$ |
230 |
|
|
|
|
|
|
|
|
|
|
|
|
|
|
|
|
|
|
|
|
Annualized net charge offs/average loans |
|
|
0.18 |
% |
|
0.03 |
% |
|
0.01 |
% |
|
0.10 |
% |
|
0.03 |
% |
|
|
|
|
|
|
|
|
|
|
|
|
|
|
|
|
|
|
|
Allowance for loan losses to nonperforming loans |
|
|
83.52 |
% |
|
79.35 |
% |
|
83.58 |
% |
|
133.61 |
% |
|
116.41 |
% |
HarborOne Bancorp, Inc.
Selected Financial Highlights
(Unaudited)
|
|
|
March 31, |
|
December 31, |
|
September 30, |
|
June 30, |
|
March 31, |
|
|||||
|
Capital and Share Related |
|
2020 |
|
2019 |
|
2019 |
|
2019 |
|
2019 |
|
|||||
|
(dollars in thousands, except share data) |
|
|
|
|
|
|
|
|
|
|
|
|
|
|
|
|
|
|
|
|
|
|
|
|
|
|
|
|
|
|
|
|
|
|
|
Common stock outstanding (1) |
|
|
58,418,021 |
|
|
58,418,021 |
|
|
58,429,584 |
|
|
58,483,027 |
|
|
58,459,493 |
|
|
|
|
|
|
|
|
|
|
|
|
|
|
|
|
|
|
|
|
Book value per share (1) |
|
$ |
11.56 |
|
$ |
11.40 |
|
$ |
11.29 |
|
$ |
6.35 |
|
$ |
6.22 |
|
|
|
|
|
|
|
|
|
|
|
|
|
|
|
|
|
|
|
|
Tangible common equity: |
|
|
|
|
|
|
|
|
|
|
|
|
|
|
|
|
|
Total stockholders' equity |
|
$ |
675,139 |
|
$ |
665,794 |
|
$ |
659,554 |
|
$ |
371,118 |
|
$ |
363,448 |
|
|
Less: Goodwill |
|
|
69,802 |
|
|
69,802 |
|
|
69,635 |
|
|
69,635 |
|
|
69,635 |
|
|
Less: Other intangible assets (2) |
|
|
5,588 |
|
|
6,035 |
|
|
6,482 |
|
|
7,100 |
|
|
7,739 |
|
|
Tangible common equity |
|
$ |
599,749 |
|
$ |
589,957 |
|
$ |
583,437 |
|
$ |
294,383 |
|
$ |
286,074 |
|
|
|
|
|
|
|
|
|
|
|
|
|
|
|
|
|
|
|
|
Tangible book value per share (1) (3) |
|
$ |
10.27 |
|
$ |
10.10 |
|
$ |
9.99 |
|
$ |
5.03 |
|
$ |
4.89 |
|
|
|
|
|
|
|
|
|
|
|
|
|
|
|
|
|
|
|
|
Tangible assets: |
|
|
|
|
|
|
|
|
|
|
|
|
|
|
|
|
|
Total assets |
|
$ |
4,101,206 |
|
$ |
4,058,921 |
|
$ |
3,949,020 |
|
$ |
3,737,424 |
|
$ |
3,655,996 |
|
|
Less: Goodwill |
|
|
69,802 |
|
|
69,802 |
|
|
69,635 |
|
|
69,635 |
|
|
69,635 |
|
|
Less: Other intangible assets (2) |
|
|
5,588 |
|
|
6,035 |
|
|
6,482 |
|
|
7,100 |
|
|
7,739 |
|
|
Tangible assets |
|
$ |
4,025,816 |
|
$ |
3,983,084 |
|
$ |
3,872,903 |
|
$ |
3,660,689 |
|
$ |
3,578,622 |
|
|
|
|
|
|
|
|
|
|
|
|
|
|
|
|
|
|
|
|
Tangible common equity / tangible assets (4) |
|
|
14.90 |
% |
|
14.81 |
% |
|
15.06 |
% |
|
8.04 |
% |
|
7.99 |
% |
|
|
|
|
|
|
|
|
|
|
|
|
|
|
|
|
|
|
|
(1) Share amounts related to periods prior to the date of the completion of the stock offering (August 14, 2019) have been restated to give retroactive recognition to the exchange ratio applied in the stock offering (1.795431-to-one) |
||||||||||||||||
|
(2) Other intangible assets includes core deposit intangible and noncompete intangible. |
||||||||||||||||
|
(3) This non-GAAP ratio is total stockholders' equity less goodwill and intangible assets divided by common stock outstanding. |
||||||||||||||||
|
(4) This non-GAAP ratio is total stockholders' equity less goodwill and intangible assets to total assets less goodwill and intangible assets. |
||||||||||||||||
HarborOne Bancorp, Inc.
Segments Statements of Net Income
(Unaudited)
|
|
|
HarborOne Mortgage |
|
HarborOne Bank |
||||||||||||||
|
|
|
For the Quarter Ended |
|
For the Quarter Ended |
||||||||||||||
|
|
|
March 31, |
|
December 31, |
|
March 31, |
|
March 31, |
|
December 31, |
|
March 31, |
||||||
|
|
|
2020 |
|
2019 |
|
2019 |
|
2020 |
|
2019 |
|
2019 |
||||||
|
|
|
(in thousands) |
||||||||||||||||
|
|
|
|
|
|
|
|
|
|
|
|
|
|
|
|
|
|
|
|
|
Net interest and dividend income |
|
$ |
281 |
|
$ |
460 |
|
$ |
109 |
|
$ |
26,510 |
|
$ |
27,810 |
|
$ |
26,419 |
|
Provision for loan losses |
|
|
— |
|
|
— |
|
|
— |
|
|
3,749 |
|
|
1,251 |
|
|
857 |
|
Net interest and dividend income, after provision for loan losses |
|
|
281 |
|
|
460 |
|
|
109 |
|
|
22,761 |
|
|
26,559 |
|
|
25,562 |
|
Mortgage banking income: |
|
|
|
|
|
|
|
|
|
|
|
|
|
|
|
|
|
|
|
Changes in mortgage servicing rights fair value |
|
|
(3,217) |
|
|
457 |
|
|
(1,581) |
|
|
(1,170) |
|
|
168 |
|
|
(570) |
|
Other |
|
|
14,898 |
|
|
12,315 |
|
|
6,431 |
|
|
(49) |
|
|
50 |
|
|
222 |
|
Total mortgage banking income (loss) |
|
|
11,681 |
|
|
12,772 |
|
|
4,850 |
|
|
(1,219) |
|
|
218 |
|
|
(348) |
|
Other noninterest income (loss) |
|
|
(122) |
|
|
(25) |
|
|
(12) |
|
|
8,526 |
|
|
5,174 |
|
|
5,352 |
|
Total noninterest income |
|
|
11,559 |
|
|
12,747 |
|
|
4,838 |
|
|
7,307 |
|
|
5,392 |
|
|
5,004 |
|
Noninterest expense |
|
|
10,806 |
|
|
12,257 |
|
|
7,352 |
|
|
24,288 |
|
|
26,161 |
|
|
24,865 |
|
Income (loss) before income taxes |
|
|
1,034 |
|
|
950 |
|
|
(2,405) |
|
|
5,780 |
|
|
5,790 |
|
|
5,701 |
|
Provision (benefit) for income taxes |
|
|
239 |
|
|
179 |
|
|
(845) |
|
|
1,601 |
|
|
1,752 |
|
|
1,446 |
|
Net income (loss) |
|
$ |
795 |
|
$ |
771 |
|
$ |
(1,560) |
|
$ |
4,179 |
|
$ |
4,038 |
|
$ |
4,255 |
|
|
|
|
|
|
|
|
|
|
|
|
|
|
|
|
|
|
|
|