Attached files
| file | filename |
|---|---|
| EX-99.1 - EX-99.1 - HEARTLAND FINANCIAL USA INC | ex991q12020pressrelease.htm |
| 8-K - 8-K - HEARTLAND FINANCIAL USA INC | htlf-20200427.htm |

Heartland Financial USA, Inc. COVID-19 Credit Overview Commercial and Ag Portfolios 1st Quarter 2020

HTLF Customer Segment Profiles Affected by COVID-19 Industry Total Exposure (1) % of Gross Exposure (1) Lodging $498,596 4.47% Multi-Family Properties $436,931 3.92% Retail Properties $408,506 3.66% Retail Trade $367,764 3.30% Restaurants and Bars $247,239 2.22% Nursing Homes / Assisted Living $126,267 1.13% Oil & Gas $56,302 0.50% Childcare Facilities $48,455 0.43% Gaming $34,790 0.31% Industry segments most effected were determined considering the following: Impact of Federal/State stay at home or shelter in place directives Impact of State mandated business closures and restrictions Significant increase in unemployment – reduction in consumer spending and ability to continue to pay rent Implementation of corporate travel restrictions coupled with decline in leisure travel Cancellation of events of all types and sizes Cancellation of schools coupled with a sudden rise in telecommuting Residents within nursing homes/assisted living centers are deemed an at-risk population (1) Outstanding exposure + undisbursed commitments Dollars in thousands As of March 31, 2020 2

COVID Related Loan Modifications Modification Types Balances of % of Total Interest P&I Loans Category Only Payments Loan Category Modified (1) Loans (2) Payment Deferred Other Commercial $509,551 8% 74% 25% 1% Agriculture $3,229 1% 91% 8% 1% Residential $36,377 5% 0% 100% 0% Consumer $7,003 2% 0% 100% 0% Total Modifications $556,160 7% 69% 30% 1% Balances of % of Total High Exposure Loans Segment Commercial Segments Modified (1) Loans (2) Lodging $60,354 15% Multi-Family $21,547 6% Restaurants & Bars $62,026 26% Retail Real Estate $67,519 18% Retail Trade $19,025 7% Comments: Payment modifications are for 90 days with some local exceptions granted Commercial modifications represent 92% of all modifications Heartland is anticipating modifications to continue to increase in the near term (1) Balances of Loans Modified are as of April 23, 2020 (2) Total Loans used for base of calculation are as of March 31, 2020 Dollars in thousands 3

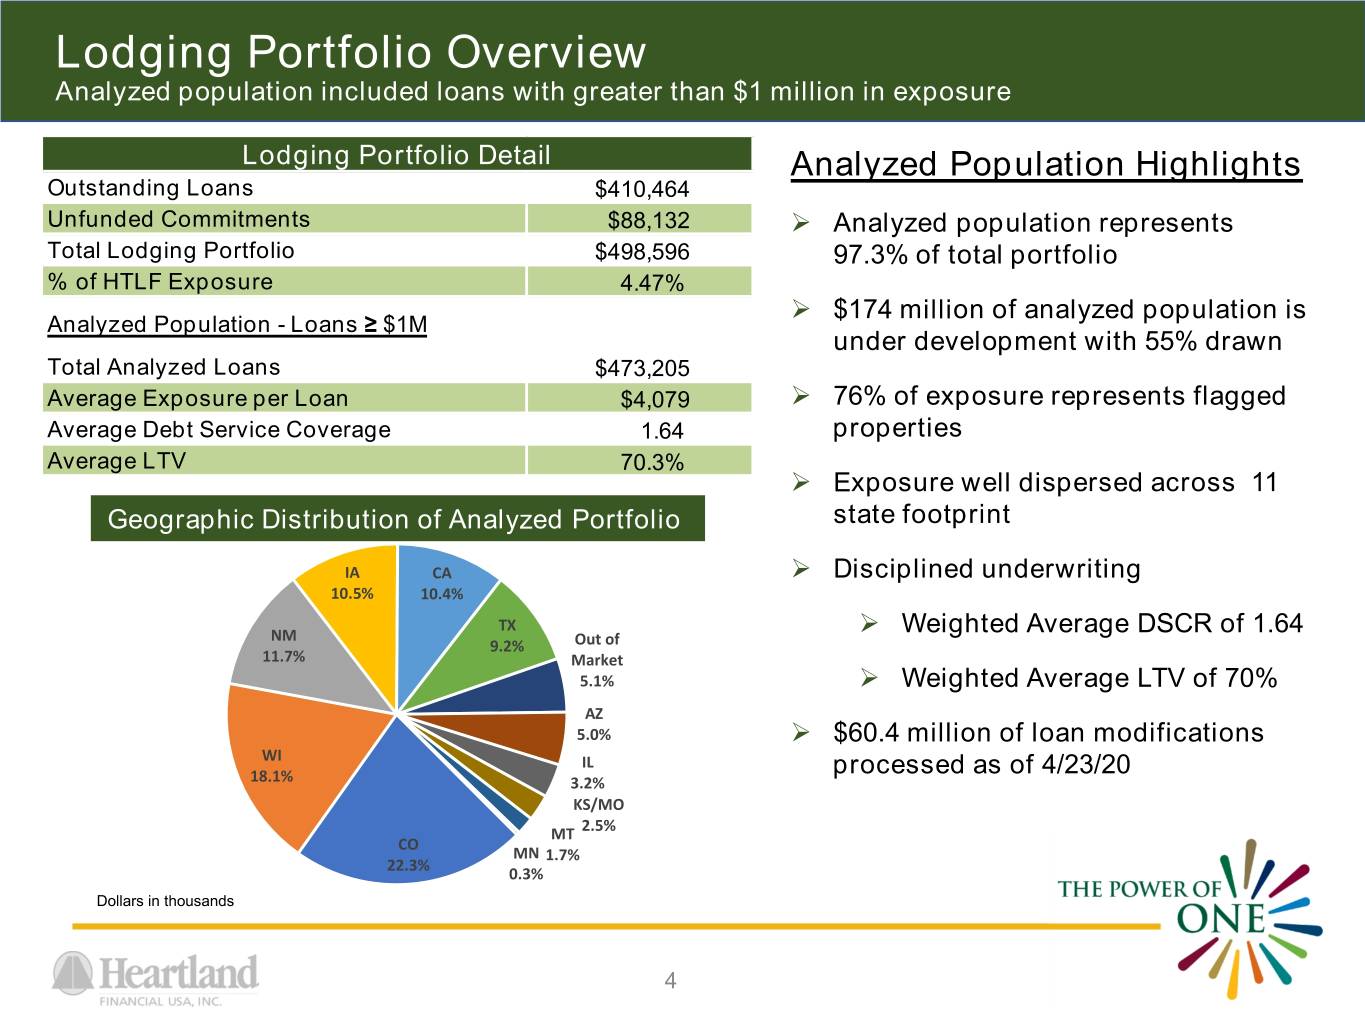
Lodging Portfolio Overview Analyzed population included loans with greater than $1 million in exposure Lodging Portfolio Detail Analyzed Population Highlights Outstanding Loans $410,464 Unfunded Commitments $88,132 Analyzed population represents Total Lodging Portfolio $498,596 97.3% of total portfolio % of HTLF Exposure 4.47% $174 million of analyzed population is Analyzed Population - Loans ≥ $1M under development with 55% drawn Total Analyzed Loans $473,205 Average Exposure per Loan $4,079 76% of exposure represents flagged Average Debt Service Coverage 1.64 properties Average LTV 70.3% Exposure well dispersed across 11 Geographic Distribution of Analyzed Portfolio state footprint IA CA Disciplined underwriting 10.5% 10.4% TX NM Weighted Average DSCR of 1.64 9.2% Out of 11.7% Market 5.1% Weighted Average LTV of 70% AZ 5.0% $60.4 million of loan modifications WI IL processed as of 4/23/20 18.1% 3.2% KS/MO MT 2.5% CO MN 1.7% 22.3% 0.3% Dollars in thousands 4

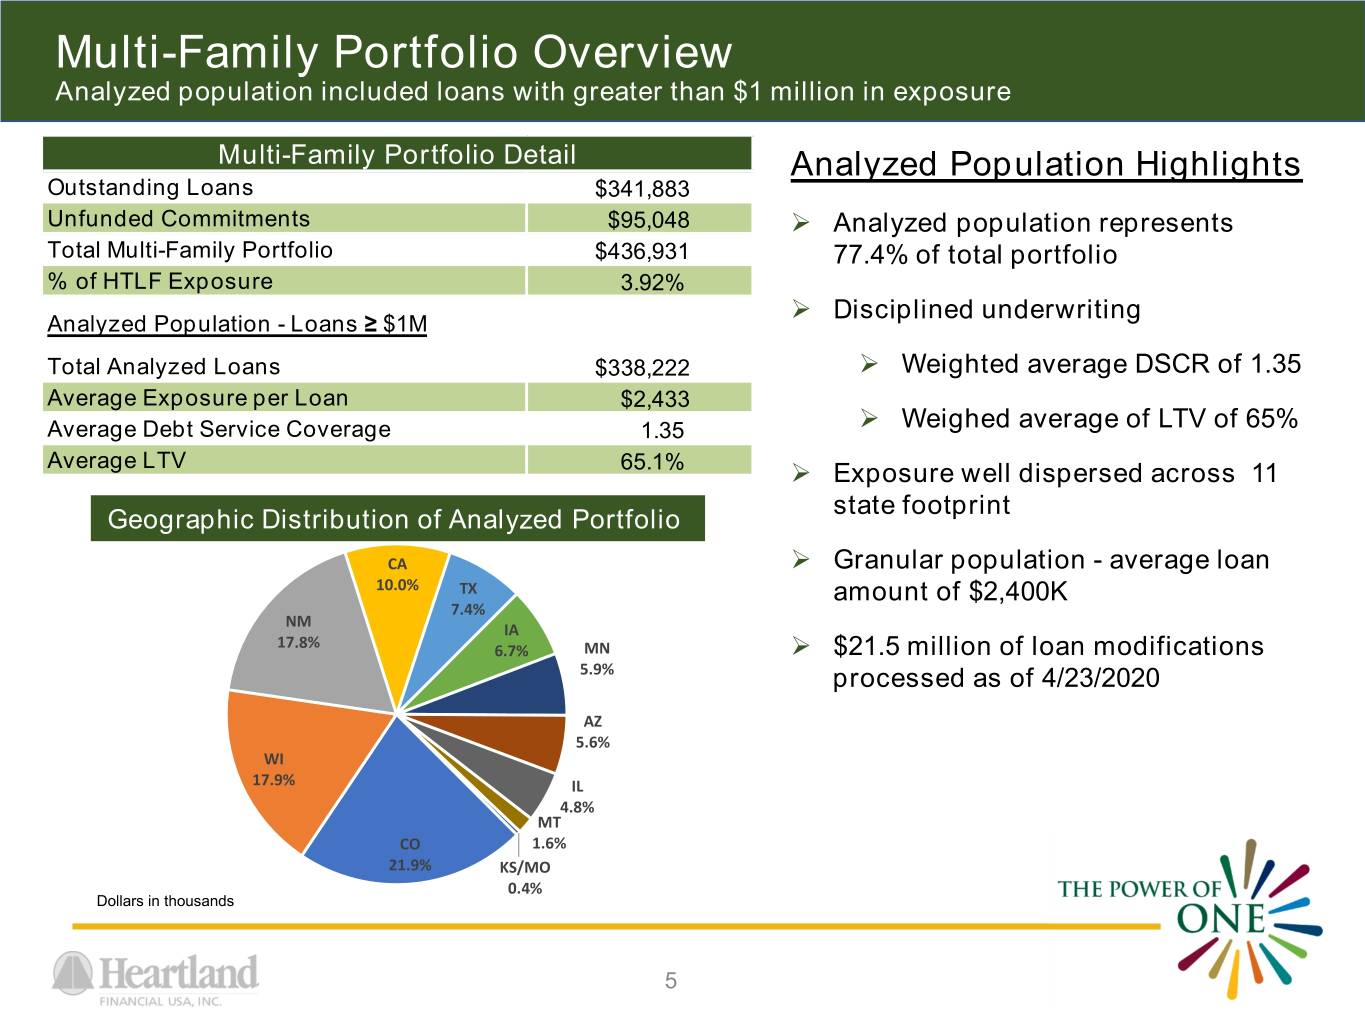
Multi-Family Portfolio Overview Analyzed population included loans with greater than $1 million in exposure Multi-Family Portfolio Detail Analyzed Population Highlights Outstanding Loans $341,883 Unfunded Commitments $95,048 Analyzed population represents Total Multi-Family Portfolio $436,931 77.4% of total portfolio % of HTLF Exposure 3.92% Disciplined underwriting Analyzed Population - Loans ≥ $1M Total Analyzed Loans $338,222 Weighted average DSCR of 1.35 Average Exposure per Loan $2,433 Average Debt Service Coverage 1.35 Weighed average of LTV of 65% Average LTV 65.1% Exposure well dispersed across 11 state footprint Geographic Distribution of Analyzed Portfolio CA Granular population - average loan 10.0% TX amount of $2,400K 7.4% NM IA 17.8% 6.7% MN $21.5 million of loan modifications 5.9% processed as of 4/23/2020 AZ 5.6% WI 17.9% IL 4.8% MT CO 1.6% 21.9% KS/MO 0.4% Dollars in thousands 5

Restaurants & Bars Portfolio Overview Analyzed population included loans with greater than $1 million in exposure Restaurants & Bars Portfolio Detail Analyzed Population Highlights Outstanding Loans $235,662 Unfunded Commitments $11,577 Analyzed population represents Total Restaurants & Bars Portfolio $247,239 77.6% of total portfolio % of HTLF Exposure 2.22% Weighted average DSCR of 2.46 Analyzed Population - Loans ≥ $1M Total Analyzed Loans $154,338 Exposure concentrated in Average Exposure per Loan $1,118 Western/Southwestern states Average Debt Service Coverage 2.46 Granular population - average loan amount of $1,120K Geographic Distribution of Analyzed Portfolio 22% of analyzed exposure represents KS/MO CA 5.8% franchised restaurants NM 8.8% 12.1% IA 5.4% $62.0 million of loan modifications MN processed as of 4/23/2020 5.3% CO WI 22.5% 5.1% AZ 4.5% IL 4.3% TX 26.2% Dollars in thousands 6

Retail Real Estate Portfolio Overview Analyzed population included loans with greater than $1 million in exposure Retail Real Estate Portfolio Detail Analyzed Population Highlights Outstanding Loans $385,618 Unfunded Commitments $22,888 Analyzed population represents Total Retail RE Portfolio $408,506 79.9% of total portfolio % of HTLF Exposure 3.66% Disciplined underwriting Analyzed Population - Loans ≥ $1M Total Analyzed Loans $326,539 Weighted average DSCR of 1.89 Average Exposure per Loan $2,206 Average Debt Service Coverage 1.89 Weighted average LTV of 59% Average LTV 59.0% Exposure concentrated in Western/Southwestern states Geographic Distribution of Analyzed Portfolio CA Average loan amount of $2,200K 12.1% AZ 11.3% $67.5 million of loan modifications MN TX 12.2% 6.9% processed to date as of 4/23/20 KS/MO 5.3% IA 3.6% NM MT 18.8% 3.2% WI 2.6% CO IL 21.7% 2.3% Dollars in thousands 7

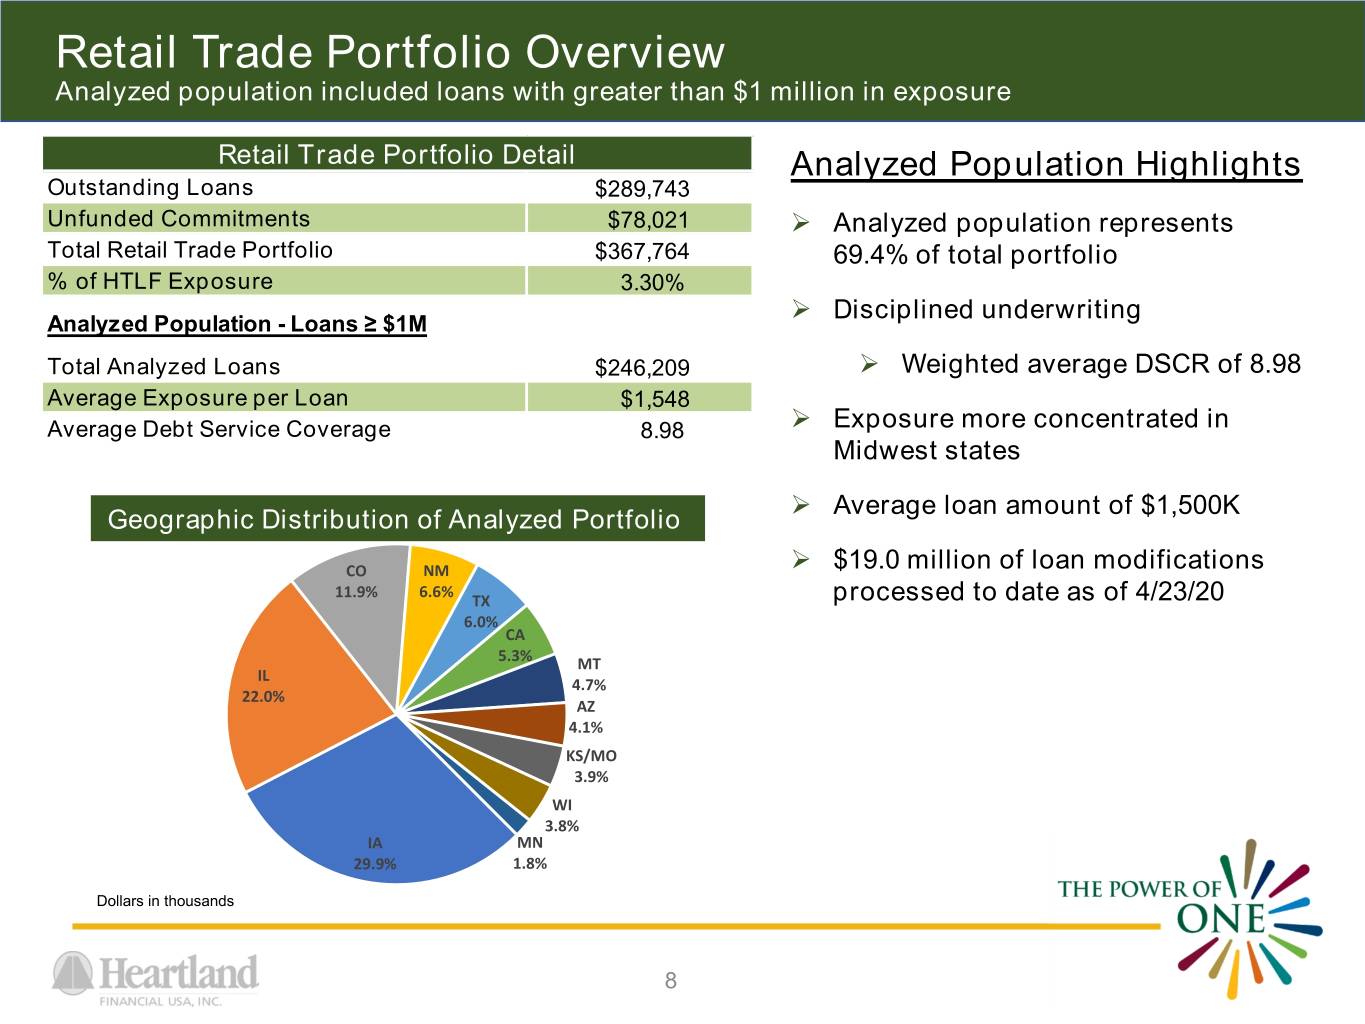
Retail Trade Portfolio Overview Analyzed population included loans with greater than $1 million in exposure Retail Trade Portfolio Detail Analyzed Population Highlights Outstanding Loans $289,743 Unfunded Commitments $78,021 Analyzed population represents Total Retail Trade Portfolio $367,764 69.4% of total portfolio % of HTLF Exposure 3.30% Disciplined underwriting Analyzed Population - Loans ≥ $1M Total Analyzed Loans $246,209 Weighted average DSCR of 8.98 Average Exposure per Loan $1,548 Average Debt Service Coverage 8.98 Exposure more concentrated in Midwest states Average loan amount of $1,500K Geographic Distribution of Analyzed Portfolio CO NM $19.0 million of loan modifications 11.9% 6.6% TX processed to date as of 4/23/20 6.0% CA 5.3% MT IL 4.7% 22.0% AZ 4.1% KS/MO 3.9% WI 3.8% IA MN 29.9% 1.8% Dollars in thousands 8

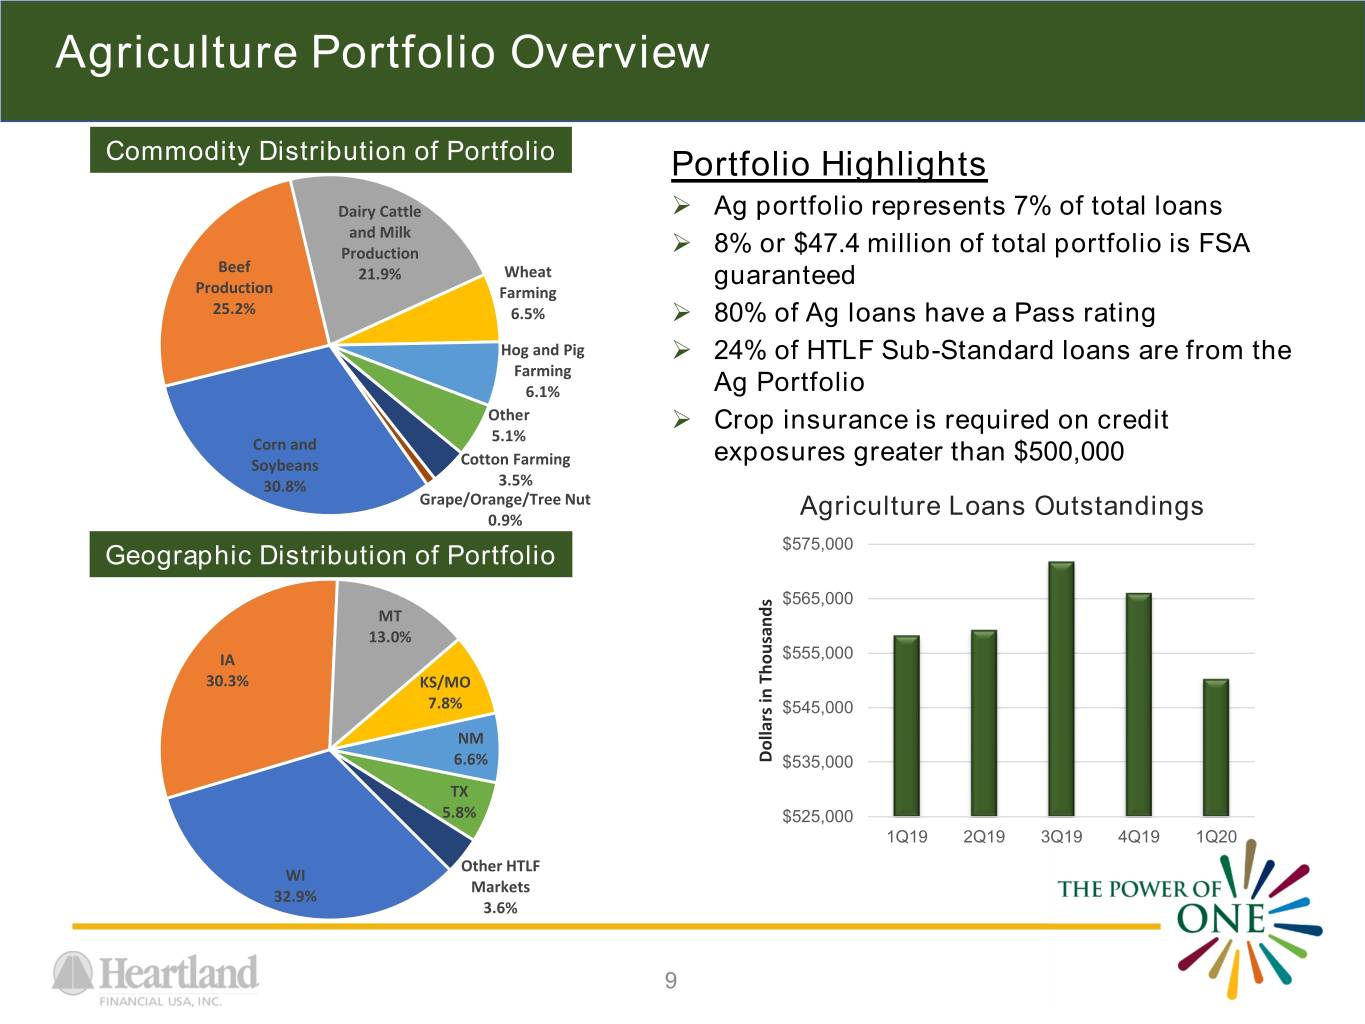
Agriculture Portfolio Overview Commodity Distribution of Portfolio Portfolio Highlights Dairy Cattle Ag portfolio represents 7% of total loans and Milk Production 8% or $47.4 million of total portfolio is FSA Beef 21.9% Wheat guaranteed Production Farming 25.2% 6.5% 80% of Ag loans have a Pass rating Hog and Pig 24% of HTLF Sub-Standard loans are from the Farming 6.1% Ag Portfolio Other Crop insurance is required on credit 5.1% Corn and exposures greater than $500,000 Soybeans Cotton Farming 30.8% 3.5% Grape/Orange/Tree Nut Agriculture Loans Outstandings 0.9% Geographic Distribution of Portfolio $575,000 $565,000 MT 13.0% IA $555,000 30.3% KS/MO 7.8% $545,000 NM 6.6% Dollars Thousands in $535,000 TX 5.8% $525,000 1Q19 2Q19 3Q19 4Q19 1Q20 Other HTLF WI Markets 32.9% 3.6% 9

Safe Harbor Statement This release, and future oral and written statements of Heartland and its management, may contain forward-looking statements within the meaning of the Private Securities Litigation Reform Act of 1995 about Heartland's financial condition, results of operations, plans, objectives, future performance and business. Although these forward-looking statements are based upon the beliefs, expectations and assumptions of Heartland's management, there are a number of factors, many of which are beyond the ability of management to control or predict, that could cause actual results to differ materially from those in its forward-looking statements. These factors, which are detailed below and in the risk factors in Heartland's Annual Report on Form 10-K filed with the Securities and Exchange Commission, contained, among others: (i) the strength of the local and national economy, including to the extent that they are affected by the COVID-19 pandemic and related restrictions on business and consumer activities; (ii) the economic impact of past and any future terrorist threats and attacks and any acts of war; (iii) changes in state and federal laws, regulations and governmental policies as they impact the company's general business, including government programs offering relief from the COVID-19 pandemic; (iv) changes in interest rates and prepayment rates of the company's assets; (v) increased competition in the financial services sector and the inability to attract new customers; (vi) changes in technology and the ability to develop and maintain secure and reliable electronic systems; (vii) the potential impact of acquisitions and Heartland's ability to successfully integrate acquired banks; (viii) the loss of key executives or employees; (ix) changes in consumer spending, including changes resulting from the COVID-19 pandemic; (x) unexpected outcomes of existing or new litigation involving the company, including claims resulting from our participation in and execution of government programs related to the COVID-19 pandemic; and (xi) changes in accounting policies and practices. The COVID-19 pandemic is adversely affecting Heartland and its customers, counterparties, employees and third-party service providers. The pandemic’s severity, its duration and the extent of its impact on Heartland’s business, financial condition, results of operations, liquidity and prospects remain uncertain. Continued deterioration in general business and economic conditions or turbulence in domestic or global financial markets could adversely affect Heartland’s net income and the value of its assets and liabilities, reduce the availability of funding to Heartland, lead to a tightening of credit and increase stock price volatility. Some economists and investment banks also predict that a recession or depression may result from the continued spread of COVID-19 and the economic consequences. All statements in this release, including forward-looking statements, speak only as of the date they are made, and Heartland undertakes no obligation to update any statement in light of new information or future events. 10
