Attached files
| file | filename |
|---|---|
| EX-99.1 - PRESS RELEASE - Midland States Bancorp, Inc. | exh_991.htm |
| 8-K - FORM 8-K - Midland States Bancorp, Inc. | f8k_042320.htm |
EXHIBIT 99.2

1 Midland States Bancorp, Inc. NASDAQ: MSBI First Quarter 2020 Earnings Call
2 Forward - Looking Statements. This presentation may contain forward - looking statements within the meaning of the federal securities laws. Forward - looking statements expressing management’s current expectations, forecasts of future events or long - te rm goals may be based upon beliefs, expectations and assumptions of Midland’s management, and are generally identifiable by the use of words such as “believe,” “expect,” “anticipate,” “plan,” “intend,” “estimate,” “may,” “will,” “would,” “could,” “should” o r o ther similar expressions. All statements in this presentation speak only as of the date they are made, and Midland undertakes no obligation to update any statement. A number of factors, many of which are beyond the ability of Midland to control or predic t, could cause actual results to differ materially from those in its forward - looking statements including the effects of the Corona virus Disease 2019 (COVID - 19) pandemic, including its potential effects on the economic environment, our customers and our operations, as well as any changes to federal, state or local government laws, regulations or orders in connection with the pandemic. These risks and uncertainties should be considered in evaluating forward - looking statements, and undue reliance should not be placed o n such statements. Additional information concerning Midland and its businesses, including additional factors that could materi all y affect Midland’s financial results, are included in Midland’s filings with the Securities and Exchange Commission. Use of Non - GAAP Financial Measures. This presentation may contain certain financial information determined by methods other than in accordance with accounting principles generally accepted in the United States (“GAAP”). These non - GAAP financial measure s include “Adjusted Earnings,” “Adjusted Diluted Earnings Per Share,” “Adjusted Return on Average Assets,” “Adjusted Return on Average Shareholders’ Equity,” “Adjusted Return on Average Tangible Common Equity,” “Efficiency Ratio,” “Tangible Common Equ ity to Tangible Assets,” “Tangible Book Value Per Share,” and “Return on Average Tangible Common Equity.” The Company believes th at these non - GAAP financial measures provide both management and investors a more complete understanding of the Company’s funding profile and profitability. These non - GAAP financial measures are supplemental and are not a substitute for any analysis based on GAAP financial measures. Not all companies use the same calculation of these measures; therefore this presentation m ay not be comparable to other similarly titled measures as presented by other companies. Reconciliations of these non - GAAP measures are provided in the Appendix section of this presentation.
3 COVID - 19 RESPONSE OVERVIEW
4 Our COVID - 19 Response: Employees • Regular meetings of Pandemic Response Team • Employee awareness campaign initiated based on CDC guidelines • All non - essential business travel suspended • Free COVID - 19 testing added to health care plans and sick time benefits expanded • 9 temporary branch closures • Remaining branches operating with reduced schedules • Bank branch lobbies temporarily closed with customer needs primarily serviced by drive - through facilities • Rotating staff model implemented at branches to minimize employee exposure • Approximately 95% of non - retail employees working from home
5 Our COVID - 19 Response: Clients • $263 million in PPP loans approved through April 16, 2020 • $665 million in loan payment deferral requests received, including equipment finance loans and leases • Credit line utilization rates remained steady at 66 - 68% throughout March • New consumer deposit and commercial treasury management account openings remaining relatively consistent with pre - crisis levels • Debit card transaction and check processing volumes down notably during last week of March • 1Q20 residential mortgage loan locks more than doubled from prior quarter • Discussions held with approximately 80% of wealth management clients with vast majority remaining consistent with investment strategy
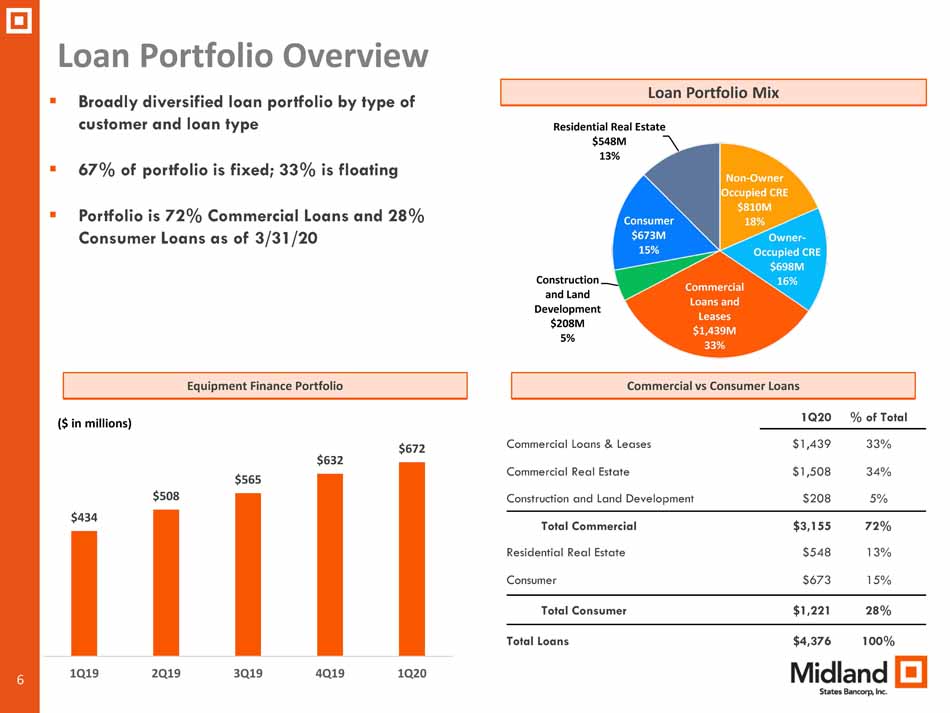
6 ▪ Broadly diversified loan portfolio by type of customer and loan type ▪ 67% of portfolio is fixed; 33% is floating ▪ Portfolio is 72% Commercial Loans and 28% Consumer Loans as of 3/31/20 Loan Portfolio Overview Loan Portfolio Mix Non - Owner Occupied CRE $810M 18% Owner - Occupied CRE $698M 16% Commercial Loans and Leases $1,439M 33% Construction and Land Development $208M 5% Consumer $673M 15% Residential Real Estate $548M 13% $434 $508 $565 $632 $672 1Q19 2Q19 3Q19 4Q19 1Q20 Commercial vs Consumer Loans ($ in millions) Equipment Finance Portfolio 1Q20 % of Total Commercial Loans & Leases $1,439 33% Commercial Real Estate $1,508 34% Construction and Land Development $208 5% Total Commercial $3,155 72% Residential Real Estate $548 13% Consumer $673 15% Total Consumer $1,221 28% Total Loans $4,376 100%
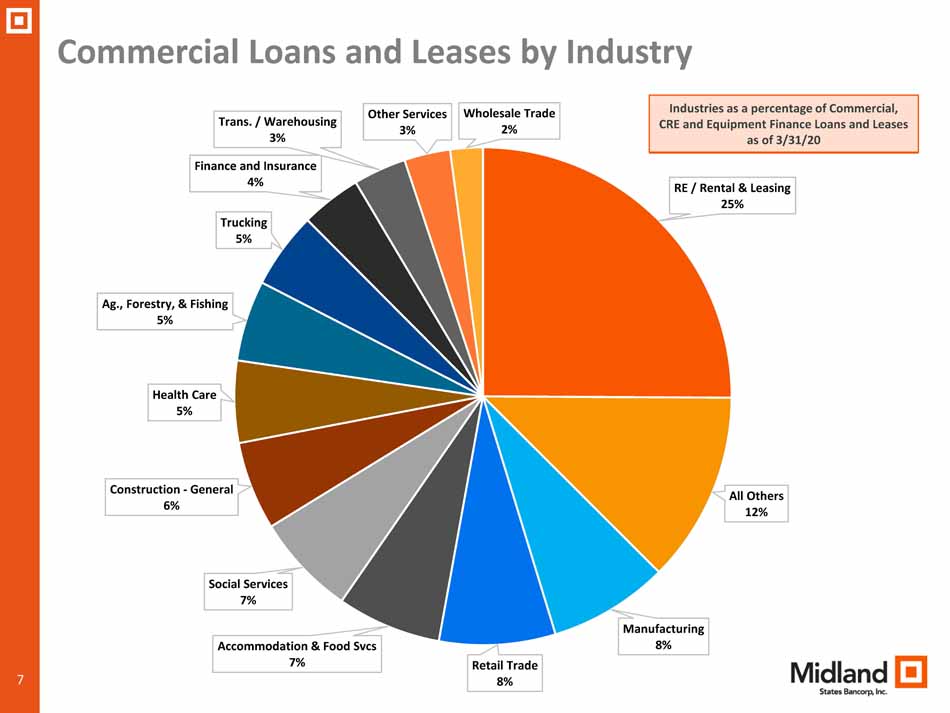
7 Commercial Loans and Leases by Industry 7 RE / Rental & Leasing 25% All Others 12% Manufacturing 8% Retail Trade 8% Accommodation & Food Svcs 7% Social Services 7% Construction - General 6% Health Care 5% Ag., Forestry, & Fishing 5% Trucking 5% Finance and Insurance 4% Trans. / Warehousing 3% Other Services 3% Wholesale Trade 2% Industries as a percentage of Commercial, CRE and Equipment Finance Loans and Leases as of 3/31/20
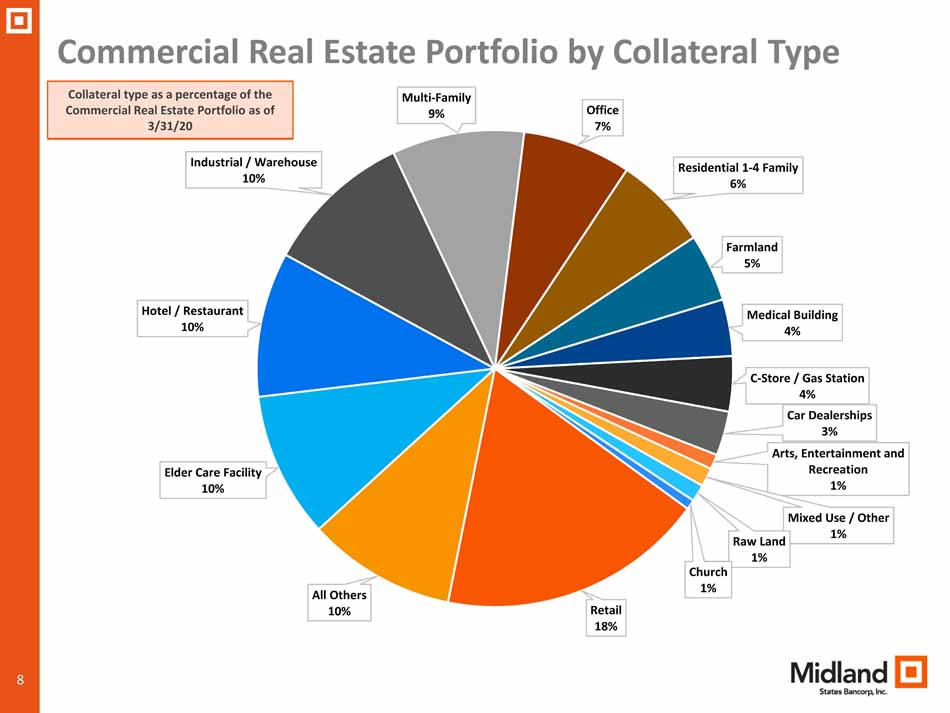
8 Commercial Real Estate Portfolio by Collateral Type 8 Retail 18% All Others 10% Elder Care Facility 10% Hotel / Restaurant 10% Industrial / Warehouse 10% Multi - Family 9% Office 7% Residential 1 - 4 Family 6% Farmland 5% Medical Building 4% C - Store / Gas Station 4% Car Dealerships 3% Arts, Entertainment and Recreation 1% Mixed Use / Other 1% Raw Land 1% Church 1% Collateral type as a percentage of the Commercial Real Estate Portfolio as of 3/31/20
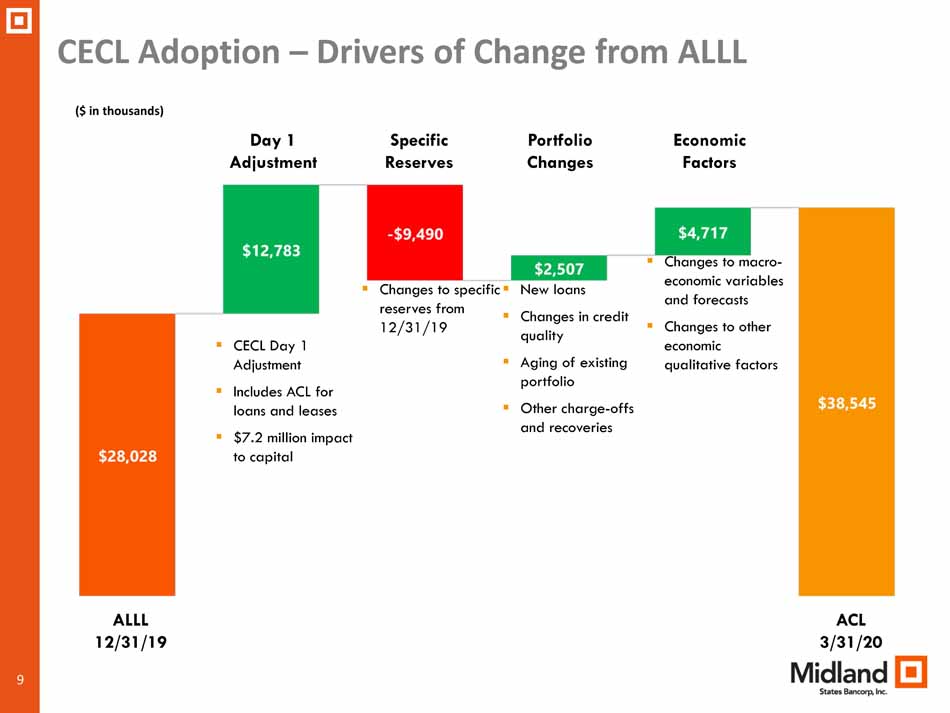
9 CECL Adoption – Drivers of Change from ALLL ALLL 12/31/19 ACL 3/31/20 Day 1 Adjustment Specific Reserves Portfolio Changes Economic Factors ▪ CECL Day 1 Adjustment ▪ Includes ACL for loans and leases ▪ $7.2 million impact to capital ▪ Changes to specific reserves from 12/31/19 ▪ New loans ▪ Changes in credit quality ▪ Aging of existing portfolio ▪ Other charge - offs and recoveries ▪ Changes to macro - economic variables and forecasts ▪ Changes to other economic qualitative factors ($ in thousands)
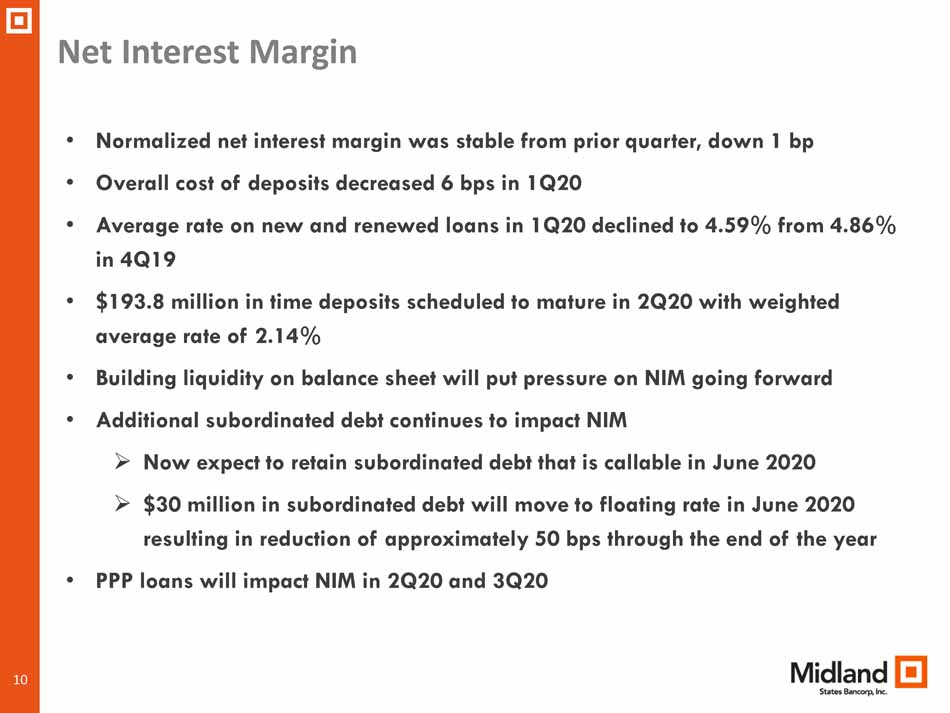
10 Net Interest Margin • Normalized net interest margin was stable from prior quarter, down 1 bp • Overall cost of deposits decreased 6 bps in 1Q20 • Average rate on new and renewed loans in 1Q20 declined to 4.59% from 4.86% in 4Q19 • $193.8 million in time deposits scheduled to mature in 2Q20 with weighted average rate of 2.14% • Building liquidity on balance sheet will put pressure on NIM going forward • Additional subordinated debt continues to impact NIM » Now expect to retain subordinated debt that is callable in June 2020 » $30 million in subordinated debt will move to floating rate in June 2020 resulting in reduction of approximately 50 bps through the end of the year • PPP loans will impact NIM in 2Q20 and 3Q20
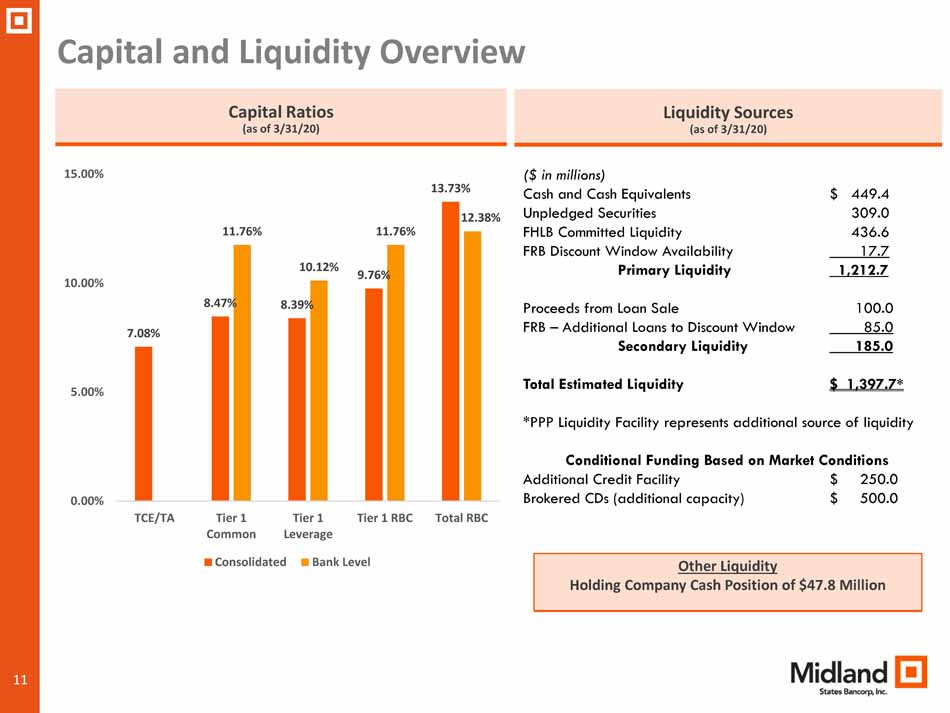
11 Capital and Liquidity Overview Capital Ratios (as of 3/31/20) Liquidity Sources (as of 3/31/20) 7.08% 8.47% 8.39% 9.76% 13.73% 11.76% 10.12% 11.76% 12.38% 0.00% 5.00% 10.00% 15.00% TCE/TA Tier 1 Common Tier 1 Leverage Tier 1 RBC Total RBC Consolidated Bank Level ($ in millions) Cash and Cash Equivalents $ 449.4 Unpledged Securities 309.0 FHLB Committed Liquidity 436.6 FRB Discount Window Availability 17.7 Primary Liquidity 1,212.7 Proceeds from Loan Sale 100.0 FRB – Additional Loans to Discount Window 85.0 Secondary Liquidity 185.0 Total Estimated Liquidity $ 1,397.7* *PPP Liquidity Facility represents additional source of liquidity Conditional Funding Based on Market Conditions Additional Credit Facility $ 250.0 Brokered CDs (additional capacity) $ 500.0 Other Liquidity Holding Company Cash Position of $47.8 Million

12 FIRST QUARTER 2020 FINANCIAL REVIEW
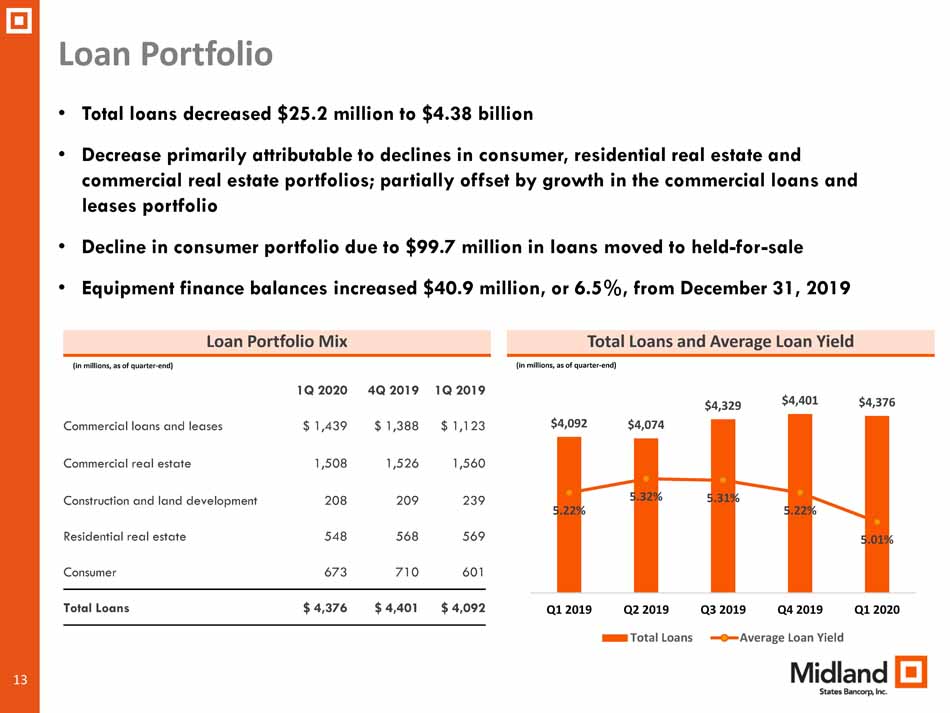
13 1Q 2020 4Q 2019 1Q 2019 Commercial loans and leases $ 1,439 $ 1,388 $ 1,123 Commercial real estate 1,508 1,526 1,560 Construction and land development 208 209 239 Residential real estate 548 568 569 Consumer 673 710 601 Total Loans $ 4,376 $ 4,401 $ 4,092 Loan Portfolio Total Loans and Average Loan Yield • Total loans decreased $25.2 million to $4.38 billion • Decrease primarily attributable to declines in consumer, residential real estate and commercial real estate portfolios; partially offset by growth in the commercial loans and leases portfolio • Decline in consumer portfolio due to $99.7 million in loans moved to held - for - sale • Equipment finance balances increased $40.9 million, or 6.5%, from December 31, 2019 Loan Portfolio Mix (in millions, as of quarter - end) (in millions, as of quarter - end) $4,092 $4,074 $4,329 $4,401 $4,376 5.22% 5.32% 5.31% 5.22% 5.01% Q1 2019 Q2 2019 Q3 2019 Q4 2019 Q1 2020 Total Loans Average Loan Yield
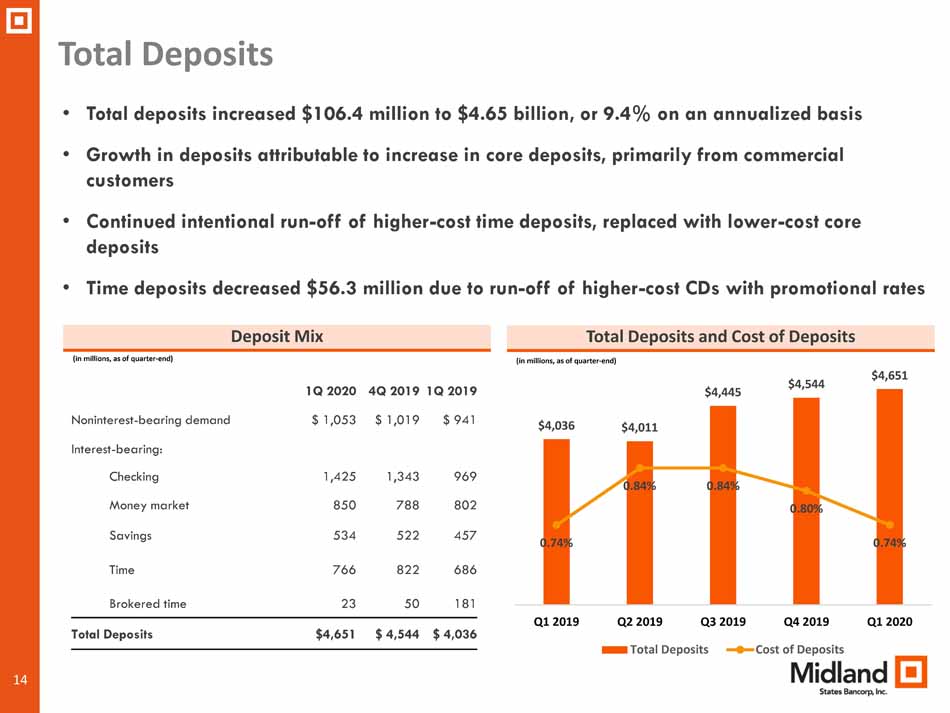
14 1Q 2020 4Q 2019 1Q 2019 Noninterest - bearing demand $ 1,053 $ 1,019 $ 941 Interest - bearing: Checking 1,425 1,343 969 Money market 850 788 802 Savings 534 522 457 Time 766 822 686 Brokered time 23 50 181 Total Deposits $4,651 $ 4,544 $ 4,036 Total Deposits Total Deposits and Cost of Deposits • Total deposits increased $106.4 million to $4.65 billion, or 9.4% on an annualized basis • Growth in deposits attributable to increase in core deposits, primarily from commercial customers • Continued intentional run - off of higher - cost time deposits, replaced with lower - cost core deposits • Time deposits decreased $56.3 million due to run - off of higher - cost CDs with promotional rates Deposit Mix (in millions, as of quarter - end) (in millions, as of quarter - end) $4,036 $4,011 $4,445 $4,544 $4,651 0.74% 0.84% 0.84% 0.80% 0.74% Q1 2019 Q2 2019 Q3 2019 Q4 2019 Q1 2020 Total Deposits Cost of Deposits
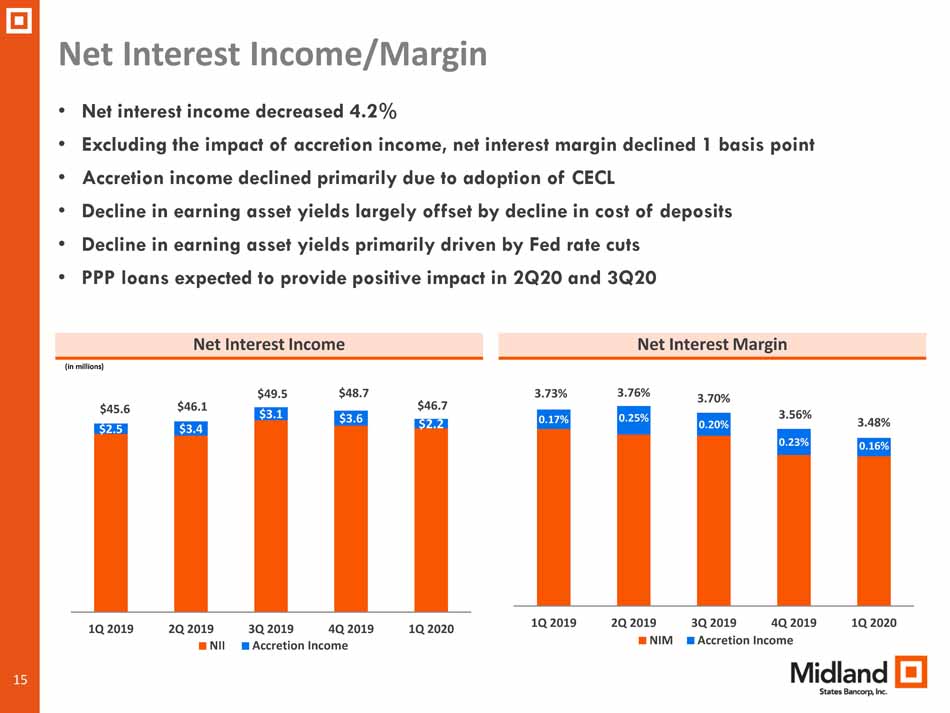
15 $2.5 $3.4 $3.1 $3.6 $2.2 $45.6 $46.1 $49.5 $48.7 $46.7 1Q 2019 2Q 2019 3Q 2019 4Q 2019 1Q 2020 NII Accretion Income 0.17% 0.25% 0.20% 0.23% 0.16% 3.73% 3.76% 3.70% 3.56% 3.48% 1Q 2019 2Q 2019 3Q 2019 4Q 2019 1Q 2020 NIM Accretion Income • Net interest income decreased 4.2% • Excluding the impact of accretion income, net interest margin declined 1 basis point • Accretion income declined primarily due to adoption of CECL • Decline in earning asset yields largely offset by decline in cost of deposits • Decline in earning asset yields primarily driven by Fed rate cuts • PPP loans expected to provide positive impact in 2Q20 and 3Q20 Net Interest Income/Margin Net Interest Margin Net Interest Income (in millions)
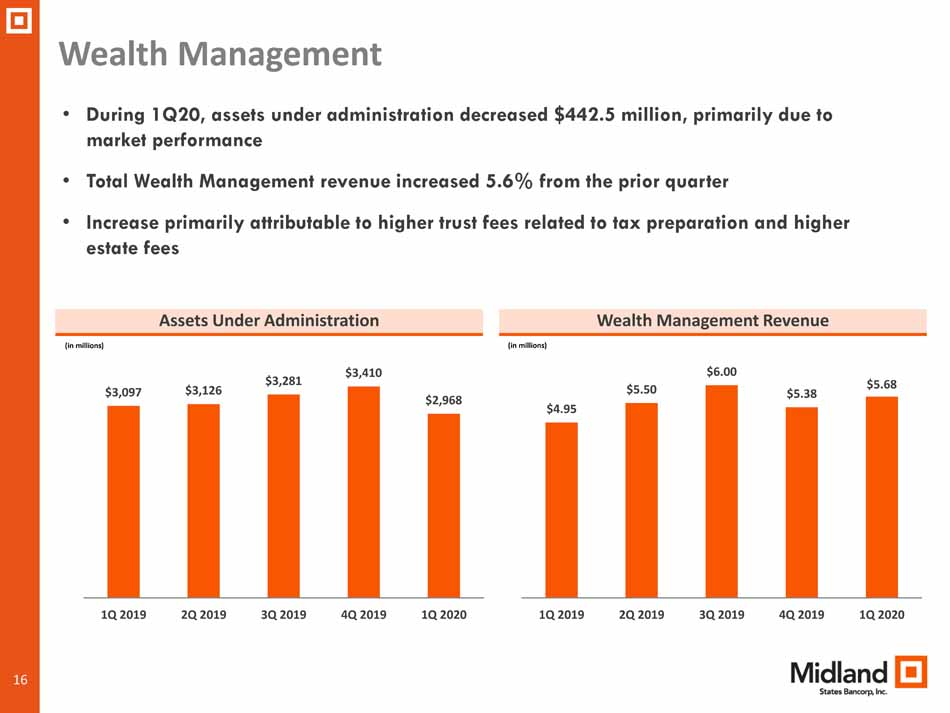
16 $4.95 $5.50 $6.00 $5.38 $5.68 1Q 2019 2Q 2019 3Q 2019 4Q 2019 1Q 2020 $3,097 $3,126 $3,281 $3,410 $2,968 1Q 2019 2Q 2019 3Q 2019 4Q 2019 1Q 2020 • During 1Q20, assets under administration decreased $442.5 million, primarily due to market performance • Total Wealth Management revenue increased 5.6% from the prior quarter • Increase primarily attributable to higher trust fees related to tax preparation and higher estate fees Wealth Management Wealth Management Revenue Assets Under Administration (in millions) (in millions )
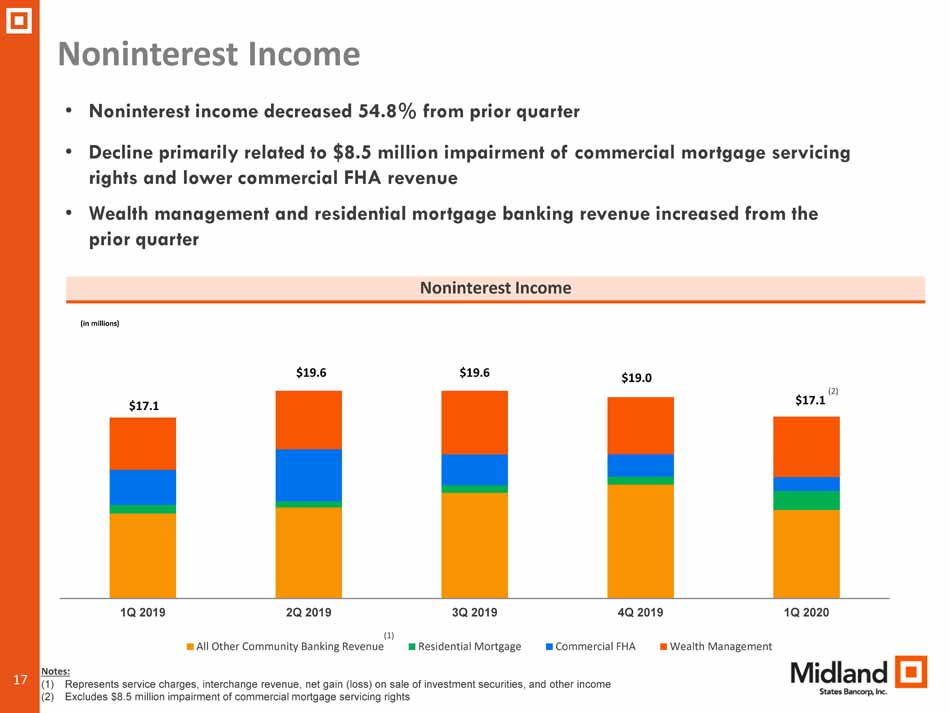
17 Noninterest Income • Noninterest income decreased 54.8% from prior quarter • Decline primarily related to $8.5 million impairment of commercial mortgage servicing rights and lower commercial FHA revenue • Wealth management and residential mortgage banking revenue increased from the prior quarter Noninterest Income (in millions) $17.1 $19.6 $19.6 $19.0 $17.1 1Q 2019 2Q 2019 3Q 2019 4Q 2019 1Q 2020 All Other Community Banking Revenue Residential Mortgage Commercial FHA Wealth Management Notes: (1) Represents service charges, interchange revenue, net gain (loss) on sale of investment securities, and other income (2) Excludes $8.5 million impairment of commercial mortgage servicing rights (1) (2)
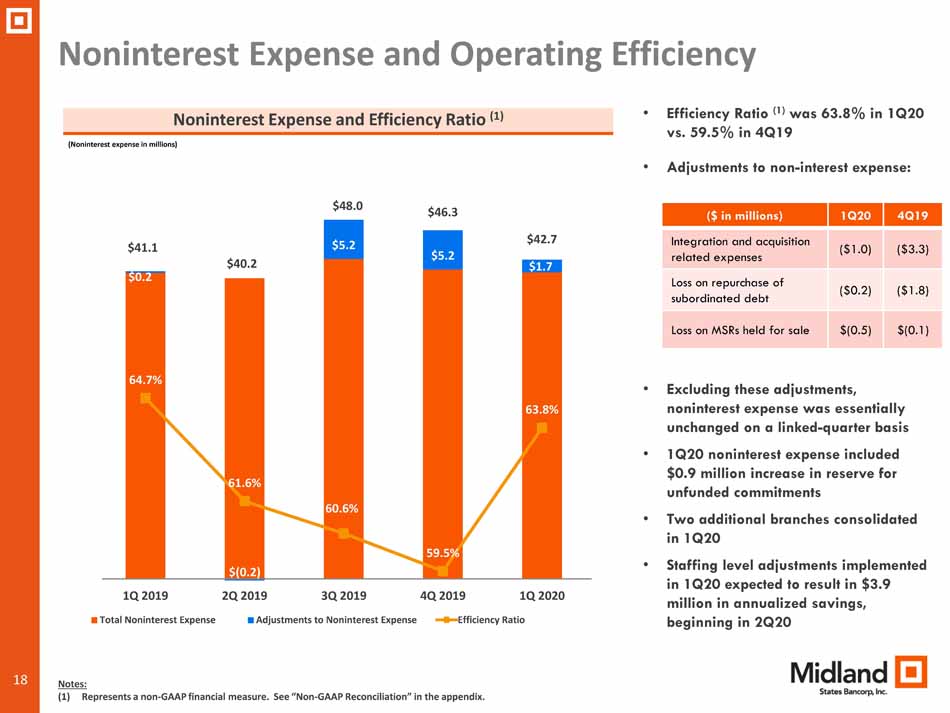
18 Noninterest Expense and Operating Efficiency • Efficiency Ratio (1) was 63.8% in 1Q20 vs. 59.5% in 4Q19 • Adjustments to non - interest expense: • Excluding these adjustments, noninterest expense was essentially unchanged on a linked - quarter basis • 1Q20 noninterest expense included $0.9 million increase in reserve for unfunded commitments • Two additional branches consolidated in 1Q20 • Staffing level adjustments implemented in 1Q20 expected to result in $3.9 million in annualized savings, beginning in 2Q20 Noninterest Expense and Efficiency Ratio (1) (Noninterest expense in millions) $0.2 $(0.2) $5.2 $5.2 $1.7 $41.1 $40.2 $48.0 $46.3 $42.7 64.7% 61.6% 60.6% 59.5% 63.8% ($1.00) 1Q 2019 2Q 2019 3Q 2019 4Q 2019 1Q 2020 Total Noninterest Expense Adjustments to Noninterest Expense Efficiency Ratio Notes: (1) Represents a non - GAAP financial measure. See “Non - GAAP Reconciliation” in the appendix. ($ in millions) 1Q20 4Q19 Integration and acquisition related expenses ($1.0) ($3.3) Loss on repurchase of subordinated debt ($0.2) ($1.8) Loss on MSRs held for sale $(0.5) $(0.1)
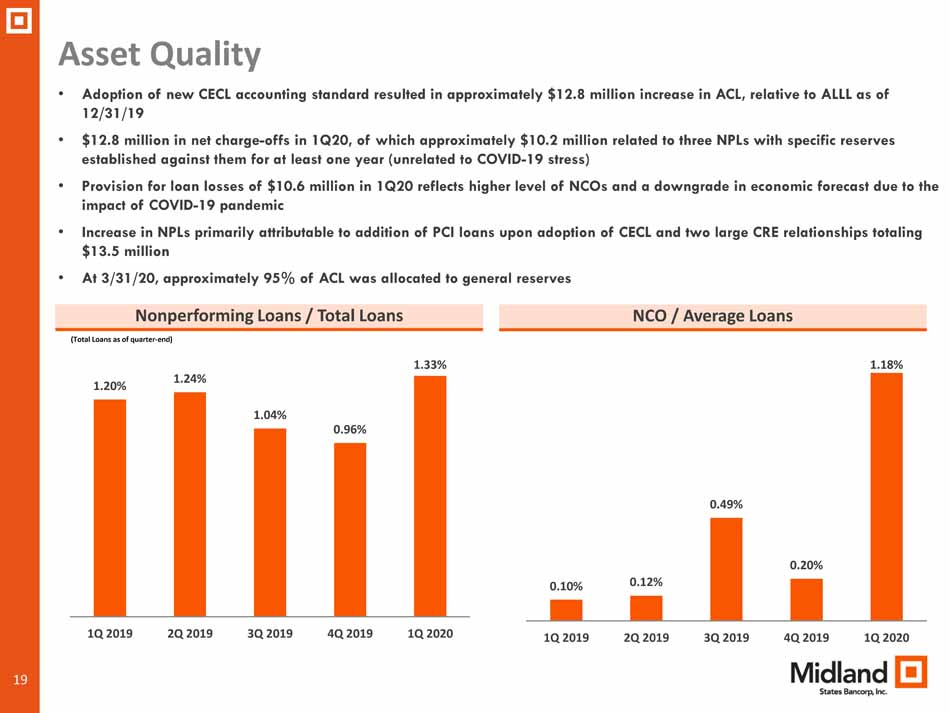
19 Asset Quality NCO / Average Loans • Adoption of new CECL accounting standard resulted in approximately $12.8 million increase in ACL, relative to ALLL as of 12/31/19 • $12.8 million in net charge - offs in 1Q20, of which approximately $10.2 million related to three NPLs with specific reserves established against them for at least one year (unrelated to COVID - 19 stress) • Provision for loan losses of $10.6 million in 1Q20 reflects higher level of NCOs and a downgrade in economic forecast due to the impact of COVID - 19 pandemic • Increase in NPLs primarily attributable to addition of PCI loans upon adoption of CECL and two large CRE relationships totali ng $13.5 million • At 3/31/20, approximately 95% of ACL was allocated to general reserves Nonperforming Loans / Total Loans (Total Loans as of quarter - end) 1.20% 1.24% 1.04% 0.96% 1.33% 1Q 2019 2Q 2019 3Q 2019 4Q 2019 1Q 2020 0.10% 0.12% 0.49% 0.20% 1.18% 1Q 2019 2Q 2019 3Q 2019 4Q 2019 1Q 2020

20 APPENDIX
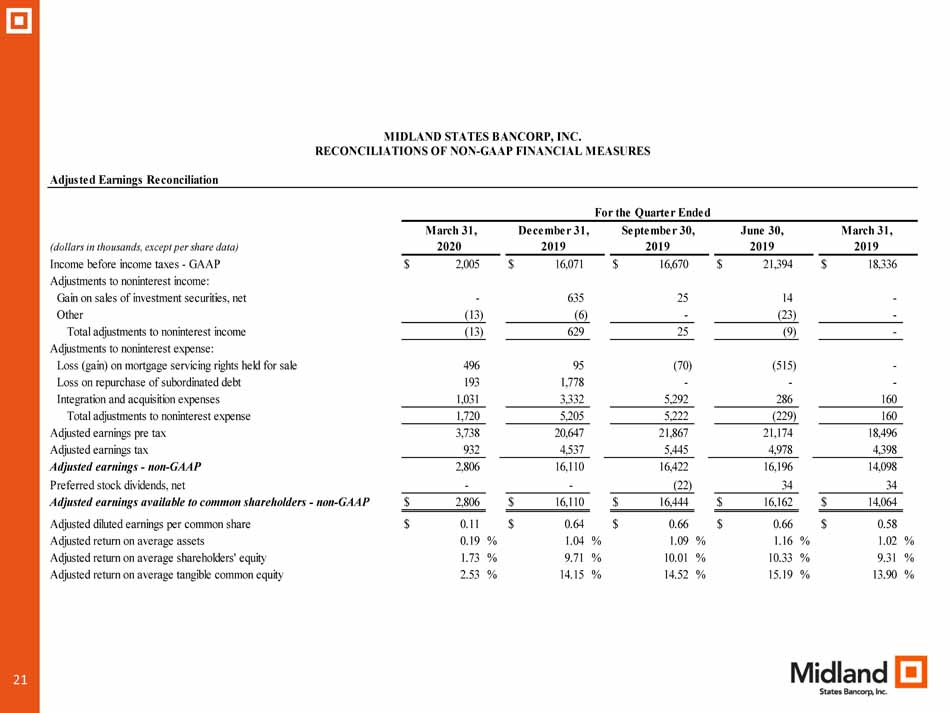
21 21 Adjusted Earnings Reconciliation (dollars in thousands, except per share data) Income before income taxes - GAAP $ 2,005 $ 16,071 $ 16,670 $ 21,394 $ 18,336 Adjustments to noninterest income: Gain on sales of investment securities, net - 635 25 14 - Other (13) (6) - (23) - Total adjustments to noninterest income (13) 629 25 (9) - Adjustments to noninterest expense: Loss (gain) on mortgage servicing rights held for sale 496 95 (70) (515) - Loss on repurchase of subordinated debt 193 1,778 - - - Integration and acquisition expenses 1,031 3,332 5,292 286 160 Total adjustments to noninterest expense 1,720 5,205 5,222 (229) 160 Adjusted earnings pre tax 3,738 20,647 21,867 21,174 18,496 Adjusted earnings tax 932 4,537 5,445 4,978 4,398 Adjusted earnings - non-GAAP 2,806 16,110 16,422 16,196 14,098 Preferred stock dividends, net - - (22) 34 34 Adjusted earnings available to common shareholders - non-GAAP $ 2,806 $ 16,110 $ 16,444 $ 16,162 $ 14,064 Adjusted diluted earnings per common share $ 0.11 $ 0.64 $ 0.66 $ 0.66 $ 0.58 Adjusted return on average assets 0.19 % 1.04 % 1.09 % 1.16 % 1.02 % Adjusted return on average shareholders' equity 1.73 % 9.71 % 10.01 % 10.33 % 9.31 % Adjusted return on average tangible common equity 2.53 % 14.15 % 14.52 % 15.19 % 13.90 % MIDLAND STATES BANCORP, INC.RECONCILIATIONS OF NON-GAAP FINANCIAL MEASURES For the Quarter Ended 2020 2019 2019 2019 2019 March 31, December 31, September 30, June 30, March 31,
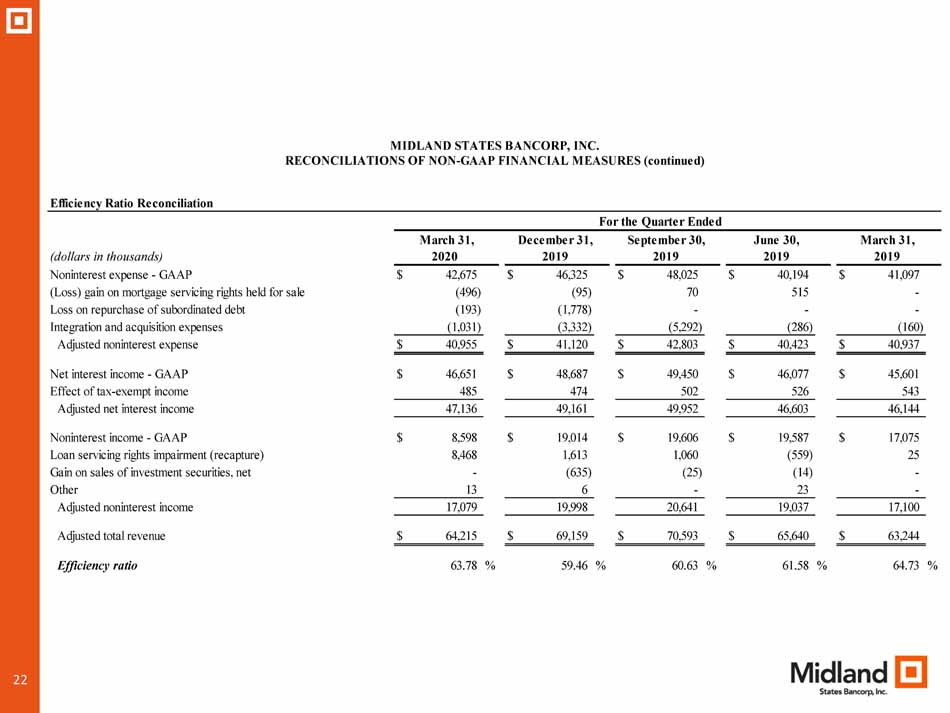
22 22 Efficiency Ratio Reconciliation (dollars in thousands) Noninterest expense - GAAP $ 42,675 $ 46,325 $ 48,025 $ 40,194 $ 41,097 (Loss) gain on mortgage servicing rights held for sale (496) (95) 70 515 - Loss on repurchase of subordinated debt (193) (1,778) - - - Integration and acquisition expenses (1,031) (3,332) (5,292) (286) (160) Adjusted noninterest expense $ 40,955 $ 41,120 $ 42,803 $ 40,423 $ 40,937 Net interest income - GAAP $ 46,651 $ 48,687 $ 49,450 $ 46,077 $ 45,601 Effect of tax-exempt income 485 474 502 526 543 Adjusted net interest income 47,136 49,161 49,952 46,603 46,144 Noninterest income - GAAP $ 8,598 $ 19,014 $ 19,606 $ 19,587 $ 17,075 Loan servicing rights impairment (recapture) 8,468 1,613 1,060 (559) 25 Gain on sales of investment securities, net - (635) (25) (14) - Other 13 6 - 23 - Adjusted noninterest income 17,079 19,998 20,641 19,037 17,100 Adjusted total revenue $ 64,215 $ 69,159 $ 70,593 $ 65,640 $ 63,244 Efficiency ratio 63.78 % 59.46 % 60.63 % 61.58 % 64.73 % MIDLAND STATES BANCORP, INC.RECONCILIATIONS OF NON-GAAP FINANCIAL MEASURES (continued) For the Quarter Ended 2020 2019 2019 2019 2019 March 31, December 31, September 30, June 30, March 31,
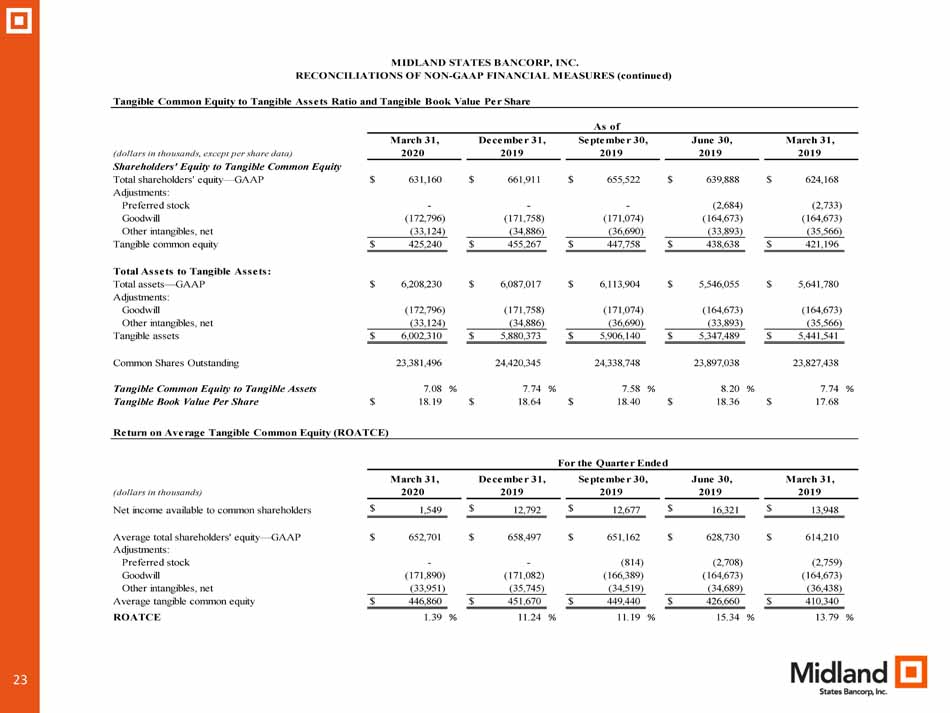
23 23 Tangible Common Equity to Tangible Assets Ratio and Tangible Book Value Per Share (dollars in thousands, except per share data) Shareholders' Equity to Tangible Common Equity Total shareholders' equity—GAAP $ 631,160 $ 661,911 $ 655,522 $ 639,888 $ 624,168 Adjustments: Preferred stock - - - (2,684) (2,733) Goodwill (172,796) (171,758) (171,074) (164,673) (164,673) Other intangibles, net (33,124) (34,886) (36,690) (33,893) (35,566) Tangible common equity $ 425,240 $ 455,267 $ 447,758 $ 438,638 $ 421,196 Total Assets to Tangible Assets: Total assets—GAAP $ 6,208,230 $ 6,087,017 $ 6,113,904 $ 5,546,055 $ 5,641,780 Adjustments: Goodwill (172,796) (171,758) (171,074) (164,673) (164,673) Other intangibles, net (33,124) (34,886) (36,690) (33,893) (35,566) Tangible assets $ 6,002,310 $ 5,880,373 $ 5,906,140 $ 5,347,489 $ 5,441,541 Common Shares Outstanding 23,381,496 24,420,345 24,338,748 23,897,038 23,827,438 Tangible Common Equity to Tangible Assets 7.08 % 7.74 % 7.58 % 8.20 % 7.74 % Tangible Book Value Per Share $ 18.19 $ 18.64 $ 18.40 $ 18.36 $ 17.68 Return on Average Tangible Common Equity (ROATCE) (dollars in thousands) Net income available to common shareholders $ 1,549 $ 12,792 $ 12,677 $ 16,321 $ 13,948 Average total shareholders' equity—GAAP $ 652,701 $ 658,497 $ 651,162 $ 628,730 $ 614,210 Adjustments: Preferred stock - - (814) (2,708) (2,759) Goodwill (171,890) (171,082) (166,389) (164,673) (164,673) Other intangibles, net (33,951) (35,745) (34,519) (34,689) (36,438) Average tangible common equity $ 446,860 $ 451,670 $ 449,440 $ 426,660 $ 410,340 ROATCE 1.39 % 11.24 % 11.19 % 15.34 % 13.79 % MIDLAND STATES BANCORP, INC. RECONCILIATIONS OF NON-GAAP FINANCIAL MEASURES (continued) As of March 31, December 31, September 30, June 30, March 31, 2020 2019 2019 2019 2019 For the Quarter Ended 2020 2019 2019 2019 2019 March 31, December 31, September 30, June 30, March 31,