Attached files
| file | filename |
|---|---|
| 8-K - 8-K - OLD SECOND BANCORP INC | osbc-20200422x8k.htm |

|
|
|
|
|
(NASDAQ:OSBC) |
Exhibit 99.1 |
|
|
|
|
|
|
Contact: |
Bradley S. Adams |
For Immediate Release |
|
|
Chief Financial Officer |
April 22, 2020 |
|
|
(630) 906-5484 |
|
Old Second Reports First Quarter Net Income of $275,000, or $0.01 per Diluted Share, Driven by Provision for Credit Losses of $8.0 million
AURORA, IL, April 22, 2020 – Old Second Bancorp, Inc. (the “Company,” “we,” “us,” and “our”) (NASDAQ: OSBC), the parent company of Old Second National Bank (the “Bank”), today announced financial results for the first quarter of 2020. Our net income was $275,000, or $0.01 per diluted share, for the first quarter of 2020, compared to net income of $9.5 million, or $0.31 per diluted share, for the fourth quarter of 2019, and net income of $8.5 million, or $0.28 per diluted share, for the first quarter of 2019. Net income for the first quarter of 2020 includes a ($0.19) per diluted share impact of additional provisions for credit losses for loans and unfunded commitments, and a ($0.05) per diluted share impact stemming from mark to market losses on mortgage servicing rights (“MSRs”), both due to changes in economic conditions and market interest rates related to the COVID-19 pandemic.
Operating Results
|
· |
First quarter 2020 net income was $275,000, reflecting a decrease in earnings of $9.3 million from the fourth quarter of 2019, and a decrease in earnings of $8.2 million from the first quarter of 2019. First quarter 2020 financial results were negatively impacted primarily by provision for credit losses of $8.0 million, due to the allowances recorded upon our adoption of the new current expected credit losses accounting standard (“CECL”), effective January 1, 2020. Also contributing to the decrease in net income in the first quarter of 2020 was the recognition of $635,000 in deferred issuance costs due to the redemption of our 7.80% cumulative trust preferred securities issued by Old Second Capital Trust I and related junior subordinated debentures, resulting in $32.6 million of debt retirement, and $2.1 million of mark to market losses on MSRs. |
|
· |
Net interest and dividend income was $22.7 million for the first quarter of 2020, a decrease of $531,000, or 2.3%, from $23.2 million for the fourth quarter of 2019, and a decrease of $1.4 million, or 5.7%, from the first quarter of 2019. Net interest and dividend income in the first quarter of 2020 was negatively impacted by interest rate reductions related to COVID-19, which more than offset increases in interest income due to loan growth in the year over year period. The recognition of $635,000 in deferred issuance costs due to the redemption of the Old Second Capital Trust I trust preferred securities and related debentures also reduced net interest and dividend income in the first quarter of 2020. |
|
· |
Provision for credit losses was $8.0 million for the first quarter of 2020, consisting of $5.5 million related to loans and $2.5 million related to unfunded commitments, compared to a provision for loan losses of $150,000 in the fourth quarter of 2019, and $450,000 in the first quarter of 2019. We adopted the new CECL accounting standard effective January 1, 2020, which measures the allowance based on management’s best estimate of lifetime expected credit losses inherent in our lending activities, resulting in a $5.9 million allowance related to loans and a $1.7 million allowance related to unfunded commitments for the first quarter of 2020. Provision expense in the first quarter of 2020 was impacted by both the adoption of the new CECL methodology and the expected impact, as of March 31, 2020, of the COVID-19 pandemic on future losses. |
|
· |
Noninterest income was $6.3 million for the first quarter of 2020, a decrease of $2.9 million, or 31.6%, compared to $9.2 million for the fourth quarter of 2019, and a decrease of $160,000, or 2.5%, compared to $6.5 million for the first quarter of 2019. The decrease compared to the linked quarter and year over year quarter was primarily due to $2.1 million of mark to market losses on MSRs in the first quarter of 2020, compared to $240,000 of mark to market gains on MSRs in the fourth quarter of 2019, and $819,000 of mark to market losses on MSRs in the first quarter of 2019, related primarily to movements in interest rates. |
1
|
· |
Noninterest expense was $21.0 million for the first quarter of 2020, an increase of $1.2 million, or 5.9%, compared to $19.8 million for the fourth quarter of 2019, and an increase of $1.8 million, or 9.4%, from $19.2 million for the first quarter of 2019. The increase compared to the linked quarter and the year over year quarter was primarily attributable to increases in salaries and employee benefits and occupancy, furniture and equipment expense, partially offset by decreases in advertising expense, as well as deferred director compensation related expense and consulting fees (both included within other expense). |
|
· |
The provision for income taxes was a net benefit of $281,000 for the first quarter of 2020, compared to tax expense of $2.9 million for the fourth quarter of 2019, and $2.4 million for the first quarter of 2019. The decrease in tax expense was due to a decrease of $12.5 million and $10.9 million in pretax income compared to the fourth quarter of 2019, and first quarter of 2019, respectively. |
|
· |
During the first quarter of 2020, we repurchased 312,723 shares of our common stock at a weighted average price of $7.06 per share pursuant to our stock repurchase program. |
|
· |
On April 21, 2020, our Board of Directors declared a cash dividend of $0.01 per share payable on May 11, 2020, to stockholders of record as of May 1, 2020. |
COVID-19 Operational Update
During this unprecedented time, the health and safety of our customers and employees remain our top priority.
|
· |
We have established client assistance programs, including offering commercial, consumer, and mortgage loan payment deferrals for certain clients. We have also suspended late fees for consumer loans through June 30, 2020. |
|
· |
We have paused new foreclosure and repossession actions until June 30, 2020, and will continue to re-evaluate based on the ongoing COVID-19 pandemic. |
|
· |
We are participating in the Coronavirus Aid, Relief and Economic Security Act (“CARES” Act). As of April 21, 2020, we had processed 129 loan applications for the SBA Paycheck Protection Program, representing a total of $78.7 million. We remain ready to continue to fund eligible client requests if Congress appropriates additional funds. |
President and Chief Executive Officer Jim Eccher said “Old Second has taken a number of steps to protect our employees, customers and communities. For our customers, our branch drive-up services remain open and available, and our branch lobbies continue to be available by appointment. We are continuing to work with our customers who have been directly impacted by the pandemic by offering the ability to defer payments as appropriate. In addition, the vast majority of our staff has been working remotely for well over a month without issue. Old Second is proud to serve our communities and I couldn’t be prouder of the efforts of our employees in supporting our customers and each other in what is proving to be difficult times.”
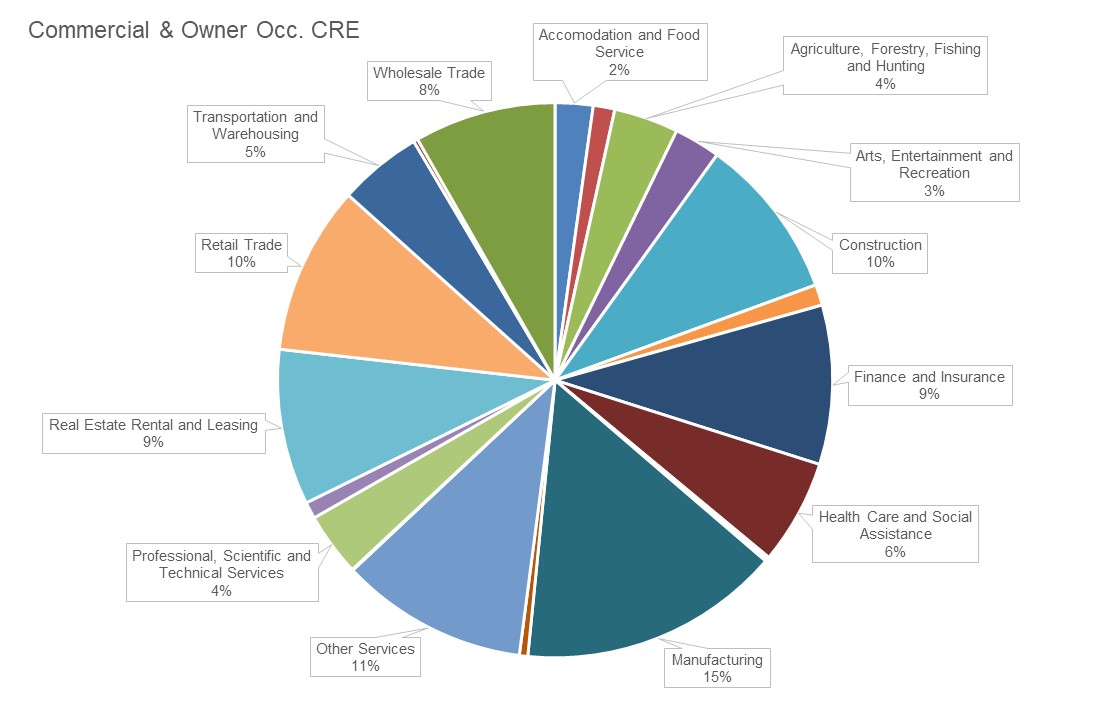
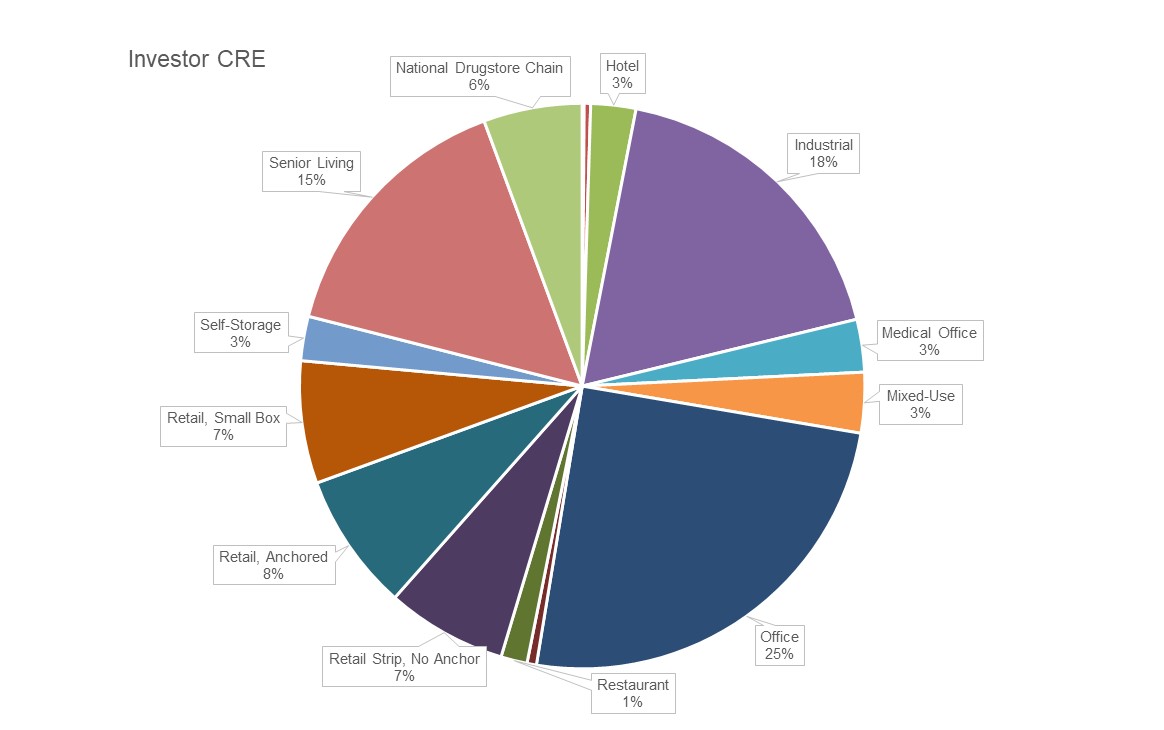
Eccher continued, “We are fortunate that our core lending strengths have steered us clear of many of the industries most impacted by the pandemic. We currently have zero direct energy or aircraft exposures in our loan portfolio. Our hotel lending is limited to three mature credits at low loan to value ratios totaling approximately $14 million. Our direct restaurant exposure is less than $20 million across both our real estate and C&I portfolios and a significant percentage is focused in major fast food franchises. We realize the potential that these industries have to be significantly impacted in the short-term but we believe few sectors will be spared difficulty in the intermediate-term from the implications of rising unemployment and falling consumer and commercial demand. Our base economic forecast at March 31, 2020 contemplated a significant decrease in GDP and an unemployment rate percentage in the high-single to low double-digits both in 2020 and over the life of our loan portfolios.
“Results this quarter reflect continued strength across our business lines on a core, pre-provision basis with strong margin and loan growth trends. The provision for loan loss this quarter reflects the expected impact our economic assumptions could have on our customers. Old Second continues to maintain very strong liquidity and capital positions and we are committed to supporting our customers in this difficult time.”
2
Loan Concentration Mix as of March 31, 2020
3
Capital Ratios
|
|
Minimum Capital |
|
Well Capitalized |
|
|
|
|
|
|
|
|
|
||
|
|
Adequacy with |
|
Under Prompt |
|
|
|
|
|
|
|
|
|
||
|
|
Capital Conservation |
|
Corrective Action |
|
March 31, |
|
December 31, |
|
March 31, |
|||||
|
|
Buffer, if applicable1 |
|
Provisions2 |
|
2020 |
|
2019 |
|
2019 |
|||||
|
The Company |
|
|
|
|
|
|
|
|
|
|
|
|
|
|
|
Common equity tier 1 capital ratio |
7.00 |
% |
|
N/A |
|
|
10.63 |
% |
|
11.14 |
% |
|
9.75 |
% |
|
Total risk-based capital ratio |
10.50 |
% |
|
N/A |
|
|
12.96 |
% |
|
14.53 |
% |
|
13.17 |
% |
|
Tier 1 risk-based capital ratio |
8.50 |
% |
|
N/A |
|
|
11.71 |
% |
|
13.65 |
% |
|
12.30 |
% |
|
Tier 1 leverage ratio |
4.00 |
% |
|
N/A |
|
|
10.39 |
% |
|
11.93 |
% |
|
10.44 |
% |
|
|
|
|
|
|
|
|
|
|
|
|
|
|
|
|
|
The Bank |
|
|
|
|
|
|
|
|
|
|
|
|
|
|
|
Common equity tier 1 capital ratio |
7.00 |
% |
|
6.50 |
% |
|
12.67 |
% |
|
14.35 |
% |
|
13.60 |
% |
|
Total risk-based capital ratio |
10.50 |
% |
|
10.00 |
% |
|
13.92 |
% |
|
15.23 |
% |
|
14.47 |
% |
|
Tier 1 risk-based capital ratio |
8.50 |
% |
|
8.00 |
% |
|
12.67 |
% |
|
14.35 |
% |
|
13.60 |
% |
|
Tier 1 leverage ratio |
4.00 |
% |
|
5.00 |
% |
|
11.18 |
% |
|
12.50 |
% |
|
11.54 |
% |
1 Amounts are shown inclusive of a capital conservation buffer of 2.50%. Under the Federal Reserve’s Small Bank Holding Company Policy Statement, the Company is not subject to the minimum capital adequacy and capital conservation buffer capital requirements at the holding company level, unless otherwise advised by the Federal Reserve (such capital requirements are applicable only at the Bank level). Although the minimum regulatory capital requirements are not applicable to the Company or the Tier 1 Leverage ratio, we calculate these ratios for our own planning and monitoring purposes.
2 The prompt corrective action provisions are only applicable at the Bank level.
|
· |
The ratios shown above exceed levels required to be considered “well capitalized.” |
Asset Quality & Earning Assets
|
· |
Nonperforming loans totaled $17.6 million at March 31, 2020, compared to $15.8 million at December 31, 2019, and $14.9 million at March 31, 2019. Credit metrics continue to be relatively stable regarding nonperforming loan levels, and management is carefully monitoring loans considered to be in a classified status. Nonperforming loans, as a percent of total loans were 0.9% at March 31, 2020 and 0.8% at December 31, 2019 and March 31, 2019. Our adoption of CECL on January 1, 2020, resulted in a change in the accounting for purchased credit impaired (“PCI”) loans, which are now considered purchased credit deteriorated (“PCD”) loans under CECL. Prior to January 1, 2020, past due and nonaccrual loan excluded PCI loans, even if contractually past due or if we did not expect to receive payment in full, as we were accreting interest income over the expected life of the loans. PCD loans acquired in our acquisition of ABC Bank totaled $11.0 million, net of purchase accounting adjustments, at March 31, 2020. Similar to PCI loans, we do not consider PCD loans, which showed evidence of deteriorated credit quality at acquisition, to be nonperforming assets. |
|
· |
OREO assets totaled $5.0 million at both March 31, 2020, and December 31, 2019, and $6.4 million at March 31, 2019. We recorded writedowns of $158,000 in the first quarter of 2020, compared to $120,000 in the fourth quarter of 2019. We had, no writedowns in the first quarter of 2019. Nonperforming assets, as a percent of total loans plus OREO, were 1.2% at March 31, 2020, and 1.1% at December 31, 2019 and March 31, 2019. |
|
· |
Total loans were $1.96 billion at March 31, 2020, reflecting an increase of $26.4 million compared to December 31, 2019, and an increase of $54.1 million compared to March 31, 2019. Growth in the year over year period was due primarily to organic growth in our commercial, leases, and real estate-commercial portfolios. Average loans (including loans held-for-sale) for the first quarter of 2020 were $1.95 billion, reflecting an increase of $42.1 million from the fourth quarter of 2019 and an increase of $49.9 million from the first quarter of 2019. |
4
|
· |
Available-for-sale securities totaled $449.7 million at March 31, 2020, compared to $484.6 million at December 31, 2019, and $509.1 million at March 31, 2019. Total securities available-for-sale decreased $35.0 million from the linked quarter due to sales and paydowns of $34.0 million. A decline of $59.4 million was realized in the year over year quarter due primarily to security sales recorded in the third quarter of 2019 and first quarter of 2020, and unrealized losses on mark to market valuation. |
Net Interest Income
|
Analysis of Average Balances, |
|||||||||||||||||||||||
|
Tax Equivalent Income / Expense and Rates |
|||||||||||||||||||||||
|
(Dollars in thousands - unaudited) |
|||||||||||||||||||||||
|
|
|||||||||||||||||||||||
|
|
Quarters Ended |
||||||||||||||||||||||
|
|
March 31, 2020 |
|
December 31, 2019 |
|
March 31, 2019 |
||||||||||||||||||
|
|
Average |
|
Income / |
|
Rate |
|
Average |
|
Income / |
|
Rate |
|
Average |
|
Income / |
|
Rate |
||||||
|
|
Balance |
|
Expense |
|
% |
|
Balance |
|
Expense |
|
% |
|
Balance |
|
Expense |
|
% |
||||||
|
Assets |
|
|
|
|
|
|
|
|
|
|
|
|
|
|
|
|
|
|
|
|
|
|
|
|
Interest earning deposits with financial institutions |
$ |
27,989 |
|
$ |
75 |
|
1.08 |
|
$ |
27,720 |
|
$ |
115 |
|
1.65 |
|
$ |
18,842 |
|
$ |
114 |
|
2.45 |
|
Securities: |
|
|
|
|
|
|
|
|
|
|
|
|
|
|
|
|
|
|
|
|
|
|
|
|
Taxable |
|
273,429 |
|
|
2,163 |
|
3.18 |
|
|
285,437 |
|
|
2,323 |
|
3.23 |
|
|
236,882 |
|
|
2,414 |
|
4.13 |
|
Non-taxable (TE)1 |
|
202,289 |
|
|
1,842 |
|
3.66 |
|
|
200,365 |
|
|
1,857 |
|
3.68 |
|
|
276,609 |
|
|
2,656 |
|
3.89 |
|
Total securities (TE)1 |
|
475,718 |
|
|
4,005 |
|
3.39 |
|
|
485,802 |
|
|
4,180 |
|
3.41 |
|
|
513,491 |
|
|
5,070 |
|
4.00 |
|
Dividends from FHLBC and FRBC |
|
9,917 |
|
|
125 |
|
5.07 |
|
|
9,763 |
|
|
143 |
|
5.81 |
|
|
11,463 |
|
|
149 |
|
5.27 |
|
Loans and loans held-for-sale1, 2 |
|
1,945,383 |
|
|
23,636 |
|
4.89 |
|
|
1,903,290 |
|
|
23,623 |
|
4.92 |
|
|
1,895,512 |
|
|
24,126 |
|
5.16 |
|
Total interest earning assets |
|
2,459,007 |
|
|
27,841 |
|
4.55 |
|
|
2,426,575 |
|
|
28,061 |
|
4.59 |
|
|
2,439,308 |
|
|
29,459 |
|
4.90 |
|
Cash and due from banks |
|
32,549 |
|
|
- |
|
- |
|
|
34,417 |
|
|
- |
|
- |
|
|
33,749 |
|
|
- |
|
- |
|
Allowance for loan and lease losses |
|
(23,507) |
|
|
- |
|
- |
|
|
(20,063) |
|
|
- |
|
- |
|
|
(19,235) |
|
|
- |
|
- |
|
Other noninterest bearing assets |
|
172,712 |
|
|
- |
|
- |
|
|
173,249 |
|
|
- |
|
- |
|
|
181,767 |
|
|
- |
|
- |
|
Total assets |
$ |
2,640,761 |
|
|
|
|
|
|
$ |
2,614,178 |
|
|
|
|
|
|
$ |
2,635,589 |
|
|
|
|
|
|
|
|
|
|
|
|
|
|
|
|
|
|
|
|
|
|
|
|
|
|
|
|
|
|
|
Liabilities and Stockholders' Equity |
|
|
|
|
|
|
|
|
|
|
|
|
|
|
|
|
|
|
|
|
|
|
|
|
NOW accounts |
$ |
422,065 |
|
$ |
233 |
|
0.22 |
|
$ |
417,198 |
|
$ |
300 |
|
0.29 |
|
$ |
448,518 |
|
$ |
379 |
|
0.34 |
|
Money market accounts |
|
280,828 |
|
|
236 |
|
0.34 |
|
|
288,376 |
|
|
285 |
|
0.39 |
|
|
299,305 |
|
|
270 |
|
0.37 |
|
Savings accounts |
|
322,618 |
|
|
166 |
|
0.21 |
|
|
305,374 |
|
|
121 |
|
0.16 |
|
|
307,740 |
|
|
122 |
|
0.16 |
|
Time deposits |
|
448,763 |
|
|
1,766 |
|
1.58 |
|
|
437,236 |
|
|
1,805 |
|
1.64 |
|
|
445,076 |
|
|
1,618 |
|
1.47 |
|
Interest bearing deposits |
|
1,474,274 |
|
|
2,401 |
|
0.66 |
|
|
1,448,184 |
|
|
2,511 |
|
0.69 |
|
|
1,500,639 |
|
|
2,389 |
|
0.65 |
|
Securities sold under repurchase agreements |
|
47,825 |
|
|
116 |
|
0.98 |
|
|
45,146 |
|
|
146 |
|
1.28 |
|
|
45,157 |
|
|
149 |
|
1.34 |
|
Other short-term borrowings |
|
23,069 |
|
|
109 |
|
1.90 |
|
|
28,772 |
|
|
144 |
|
1.99 |
|
|
98,328 |
|
|
606 |
|
2.50 |
|
Junior subordinated debentures |
|
47,200 |
|
|
1,364 |
|
11.62 |
|
|
57,728 |
|
|
933 |
|
6.41 |
|
|
57,692 |
|
|
927 |
|
6.52 |
|
Senior notes |
|
44,284 |
|
|
673 |
|
6.11 |
|
|
44,258 |
|
|
673 |
|
6.03 |
|
|
44,171 |
|
|
672 |
|
6.17 |
|
Notes payable and other borrowings |
|
14,762 |
|
|
130 |
|
3.54 |
|
|
8,768 |
|
|
72 |
|
3.26 |
|
|
15,273 |
|
|
116 |
|
3.08 |
|
Total interest bearing liabilities |
|
1,651,414 |
|
|
4,793 |
|
1.17 |
|
|
1,632,856 |
|
|
4,479 |
|
1.09 |
|
|
1,761,260 |
|
|
4,859 |
|
1.12 |
|
Noninterest bearing deposits |
|
676,755 |
|
|
- |
|
- |
|
|
678,136 |
|
|
- |
|
- |
|
|
625,423 |
|
|
- |
|
- |
|
Other liabilities |
|
28,490 |
|
|
- |
|
- |
|
|
28,026 |
|
|
- |
|
- |
|
|
13,750 |
|
|
- |
|
- |
|
Stockholders' equity |
|
284,102 |
|
|
- |
|
- |
|
|
275,160 |
|
|
- |
|
- |
|
|
235,156 |
|
|
- |
|
- |
|
Total liabilities and stockholders' equity |
$ |
2,640,761 |
|
|
|
|
|
|
$ |
2,614,178 |
|
|
|
|
|
|
$ |
2,635,589 |
|
|
|
|
|
|
Net interest income (GAAP) |
|
|
|
$ |
22,658 |
|
|
|
|
|
|
$ |
23,189 |
|
|
|
|
|
|
$ |
24,037 |
|
|
|
Net interest margin (GAAP) |
|
|
|
|
|
|
3.71 |
|
|
|
|
|
|
|
3.79 |
|
|
|
|
|
|
|
4.00 |
|
|
|
|
|
|
|
|
|
|
|
|
|
|
|
|
|
|
|
|
|
|
|
|
|
|
Net interest income (TE)1 |
|
|
|
$ |
23,048 |
|
|
|
|
|
|
$ |
23,582 |
|
|
|
|
|
|
$ |
24,600 |
|
|
|
Net interest margin (TE)1 |
|
|
|
|
|
|
3.77 |
|
|
|
|
|
|
|
3.86 |
|
|
|
|
|
|
|
4.09 |
|
Interest bearing liabilities to earning assets |
|
67.16 |
% |
|
|
|
|
|
|
67.29 |
% |
|
|
|
|
|
|
72.20 |
% |
|
|
|
|
1 Tax equivalent (TE) basis is calculated using a marginal tax rate of 21% in 2020 and 2019. See the discussion entitled “Non-GAAP Presentations” below and the table on page 18 that provides a reconciliation of each non-GAAP measure to the most comparable GAAP equivalent.
2 Interest income from loans is shown on a tax equivalent basis, which is a non-GAAP financial measure as discussed in the table on page 16, and includes fees of $294,000 for the first quarter of 2020, $397,000 for the fourth quarter of 2019, and $229,000 for the first quarter of 2019. Nonaccrual loans are included in the above stated average balances.
Net interest income (TE) was $23.0 million for the first quarter of 2020, which reflects a decrease of $534,000 compared to the fourth quarter of 2019, and a decrease of $1.6 million compared to the first quarter of 2019. The tax equivalent adjustment for the first quarter of 2020 was $390,000, compared to $393,000 for the fourth quarter of 2019, and $563,000 for the first quarter of 2019. Average interest earning assets increased $32.4 million to $2.46 billion for the first quarter of 2020, compared to the fourth quarter of 2019, primarily due to loan growth. Average interest earning
5
assets increased $19.7 million in the first quarter of 2020, compared to the first quarter of 2019. Average loans, including loans held-for-sale, increased $42.1 million for the first quarter of 2020, compared to the fourth quarter of 2019, and increased $49.9 million compared to the first quarter of 2019. Growth in volumes of earning assets for the first quarter of 2020 was more than offset by a decline in yields. The yield on average earning assets decreased four basis points in the first quarter of 2020, compared to the fourth quarter of 2019, and decreased 35 basis points compared to the first quarter of 2019, primarily due to the lowering of interest rates by the Federal Reserve Bank in the first quarter of 2020 in response to the COVID-19 pandemic, and rate reductions in the second half of 2019.
Total securities income was $4.0 million in the first quarter of 2020, a decrease of $175,000 compared to the fourth quarter of 2019, and a decrease of $1.1 million compared to the first quarter of 2019, due primarily to reductions in yields and volumes. Security sales and paydowns in the first quarter of 2020 totaled $34.0 million, which were partially offset by a $6.0 million purchase of a tax anticipation warrant. Our overall yield on tax equivalent municipal securities was 3.66% for the first quarter of 2020, compared to 3.68% for the fourth quarter of 2019, and 3.89% for the first quarter of 2019. Taxable security yields also declined in the first quarter of 2020, resulting in a decrease to the overall tax equivalent yield for the total securities portfolio of three basis points from December 31, 2019, and 61 basis points from March 31, 2019.
Average interest bearing liabilities increased $18.9 million in the first quarter of 2020, compared to the fourth quarter of 2019, primarily driven by a $26.1 million increase in interest bearing deposits. Average interest bearing liabilities decreased $109.8 million in the first quarter of 2020, compared to the first quarter of 2019, primarily driven by a $26.4 million reduction in interest bearing deposits, and a $75.3 million decrease in other short term borrowings. The cost of interest bearing liabilities for the first quarter of 2020 increased by eight basis points from the fourth quarter of 2019, and increased five basis points from the first quarter of 2019. Growth in our average noninterest bearing demand deposits of $51.3 million in the year over year quarter has assisted us in controlling our cost of funds stemming from average interest bearing deposits, which totaled 0.66% for the first quarter of 2020, 0.69% for the fourth quarter of 2019, and 0.65% for the first quarter of 2019.
For the first quarter of 2020, average other short-term borrowings, which consisted solely of FHLBC advances, totaled $23.1 million, compared to $28.8 million for the fourth quarter of 2019, and $98.3 million for the first quarter of 2019. Average rates paid on short-term FHLBC advances decreased from 2.5% in the first quarter of 2019 to 1.99% in the fourth quarter of 2019, and to 1.90% in the first quarter of 2020, reflecting the falling interest rate environment. In March 2020, we redeemed our Old Second Capital Trust I trust preferred securities and related junior subordinated debentures, which resulted in a payment of $33.0 million, including accrued interest. The redemption was funded with cash on hand and a $20.0 million term note issued at one month Libor plus 1.75%, with principal and interest payable over the next three years, included within notes payable and other borrowings. Due to the redemption, we recognized the remaining unamortized deferred issuance costs of $635,000 recorded on the junior subordinated debentures in March 2020, increasing our cost of funds by 15 basis points for the first quarter of 2020.
Our net interest margin (TE) decreased nine basis points to 3.77% for the first quarter of 2020, compared to 3.86% for the fourth quarter of 2019, and decreased 32 basis points compared to 4.09% for the first quarter of 2019. The reductions were due primarily to falling interest rates and the redemption of our junior subordinated debentures noted above.
6
Noninterest Income
|
|
|
|
|
|
|
|
|
|
|
|
1st Quarter 2020 |
|
||
|
Noninterest Income |
|
Three Months Ended |
|
Percent Change From |
|
|||||||||
|
(dollars in thousands) |
|
March 31, |
|
December 31, |
|
March 31, |
|
4th Quarter |
|
1st Quarter |
|
|||
|
|
|
2020 |
|
2019 |
|
2019 |
|
2019 |
|
2019 |
|
|||
|
Trust income |
|
$ |
1,532 |
|
$ |
1,700 |
|
$ |
1,486 |
|
(9.9) |
|
3.1 |
|
|
Service charges on deposits |
|
|
1,726 |
|
|
1,874 |
|
|
1,862 |
|
(7.9) |
|
(7.3) |
|
|
Residential mortgage banking revenue |
|
|
|
|
|
|
|
|
|
|
|
|
|
|
|
Secondary mortgage fees |
|
|
270 |
|
|
151 |
|
|
136 |
|
78.8 |
|
98.5 |
|
|
Mortgage servicing rights mark to market (loss) gain |
|
|
(2,134) |
|
|
240 |
|
|
(819) |
|
N/M |
|
N/M |
|
|
Mortgage servicing income |
|
|
468 |
|
|
473 |
|
|
457 |
|
(1.1) |
|
2.4 |
|
|
Net gain on sales of mortgage loans |
|
|
2,246 |
|
|
1,113 |
|
|
762 |
|
101.8 |
|
194.8 |
|
|
Total residential mortgage banking revenue |
|
|
850 |
|
|
1,977 |
|
|
536 |
|
(57.0) |
|
58.6 |
|
|
Securities gain, net |
|
|
(24) |
|
|
35 |
|
|
27 |
|
(168.6) |
|
N/M |
|
|
Change in cash surrender value of BOLI |
|
|
(49) |
|
|
370 |
|
|
458 |
|
(113.2) |
|
(110.7) |
|
|
Death benefit realized on BOLI |
|
|
- |
|
|
872 |
|
|
- |
|
N/M |
|
N/M |
|
|
Card related income |
|
|
1,287 |
|
|
1,428 |
|
|
1,285 |
|
(9.9) |
|
0.2 |
|
|
Other income |
|
|
1,000 |
|
|
986 |
|
|
828 |
|
1.4 |
|
20.8 |
|
|
Total noninterest income |
|
$ |
6,322 |
|
$ |
9,242 |
|
$ |
6,482 |
|
(31.6) |
|
(2.5) |
|
N/M - Not meaningful.
Noninterest income decreased $2.9 million, or 31.6%, in the first quarter of 2020, compared to the fourth quarter of 2019, primarily driven by $2.1 million of mark to market losses on MSRs in the first quarter of 2020 due to market interest rate reductions, $49,000 in market interest rate-driven losses on the cash surrender value of BOLI in the first quarter of 2020, and a $872,000 BOLI death benefit recorded in the fourth quarter of 2019 that was not repeated in the first quarter of 2020. These variances were partially offset by a $1.1 million increase in net gain on sales of mortgage loans in the first quarter of 2020 compared to the fourth quarter of 2019.
Noninterest income decreased $160,000, or 2.5%, in the year over year period, primarily driven by $2.1 million of mark to market losses on MSRs in the first quarter of 2020, compared to $819,000 of losses in the first quarter of 2019. Partially offsetting the year over year losses was growth in trust income of $46,000, secondary mortgage fees of $134,000, net gain on the sale of mortgage loans of $1.5 million, and other income of $172,000. The increase in other income for the first quarter of 2020, compared to the first quarter of 2019, was primarily attributable to an increase in commercial loan interest rate swap fees of $147,000.
7
Noninterest Expense
|
|
|
|
|
|
|
|
|
|
|
|
1st Quarter 2020 |
|
||
|
Noninterest Expense |
|
Three Months Ended |
|
Percent Change From |
|
|||||||||
|
(dollars in thousands) |
|
March 31, |
|
December 31, |
|
March 31, |
|
4th Quarter |
|
1st Quarter |
|
|||
|
|
|
2020 |
|
2019 |
|
2019 |
|
2019 |
|
2019 |
|
|||
|
Salaries |
|
$ |
9,761 |
|
$ |
9,315 |
|
$ |
8,634 |
|
4.8 |
|
13.1 |
|
|
Officers incentive |
|
|
958 |
|
|
680 |
|
|
882 |
|
40.9 |
|
8.6 |
|
|
Benefits and other |
|
|
2,199 |
|
|
1,613 |
|
|
2,096 |
|
36.3 |
|
4.9 |
|
|
Total salaries and employee benefits |
|
|
12,918 |
|
|
11,608 |
|
|
11,612 |
|
11.3 |
|
11.2 |
|
|
Occupancy, furniture and equipment expense |
|
|
2,301 |
|
|
2,140 |
|
|
1,989 |
|
7.5 |
|
15.7 |
|
|
Computer and data processing |
|
|
1,335 |
|
|
1,285 |
|
|
1,332 |
|
3.9 |
|
0.2 |
|
|
FDIC insurance |
|
|
57 |
|
|
- |
|
|
174 |
|
N/M |
|
(67.2) |
|
|
General bank insurance |
|
|
246 |
|
|
246 |
|
|
250 |
|
- |
|
(1.6) |
|
|
Amortization of core deposit intangible asset |
|
|
128 |
|
|
129 |
|
|
132 |
|
(0.8) |
|
(3.0) |
|
|
Advertising expense |
|
|
109 |
|
|
250 |
|
|
234 |
|
(56.4) |
|
(53.4) |
|
|
Card related expense |
|
|
532 |
|
|
596 |
|
|
355 |
|
(10.7) |
|
49.9 |
|
|
Legal fees |
|
|
131 |
|
|
195 |
|
|
126 |
|
(32.8) |
|
4.0 |
|
|
Other real estate owned expense, net |
|
|
237 |
|
|
99 |
|
|
50 |
|
N/M |
|
N/M |
|
|
Other expense |
|
|
3,008 |
|
|
3,280 |
|
|
2,940 |
|
(8.3) |
|
2.3 |
|
|
Total noninterest expense |
|
$ |
21,002 |
|
$ |
19,828 |
|
$ |
19,194 |
|
5.9 |
|
9.4 |
|
|
Efficiency ratio (GAAP)1 |
|
|
66.28 |
% |
|
62.65 |
% |
|
60.72 |
% |
|
|
|
|
|
Adjusted efficiency ratio (non-GAAP)2 |
|
|
65.48 |
% |
|
61.24 |
% |
|
59.42 |
% |
|
|
|
|
1 The efficiency ratio shown in the table above is a GAAP financial measure calculated as noninterest expense, excluding amortization of core deposits and OREO expenses, divided by the sum of net interest income and total noninterest income less any BOLI death benefit recorded, net gains or losses on securities and mark to market gains or losses on MSRs.
2 The adjusted efficiency ratio shown in the table above is a non-GAAP financial measure calculated as noninterest expense, excluding amortization of core deposits and OREO expenses, divided by the sum of net interest income on a fully tax equivalent basis, total noninterest income less net gains or losses on securities and mark to market gains or losses on MSRs, and includes a tax equivalent adjustment on the change in cash surrender value of BOLI. See the discussion entitled “Non-GAAP Presentations” below and the table on page 18 that provides a reconciliation of each non-GAAP financial measure to the most comparable GAAP equivalent.
Noninterest expense for the first quarter of 2020 increased $1.2 million, or 5.9%, compared to the fourth quarter of 2019, and increased $1.8 million, or 9.4%, compared to the first quarter of 2019. The linked quarter increase is primarily attributable to a $1.3 million increase in salaries and employee benefits, a $161,000 increase in occupancy, furniture and equipment, and a $138,000 increase in other real estate owned expense primarily due to a valuation writedown on one property, which was partially offset by decreases of $141,000 in advertising expense and $272,000 in other expense. Other expense decreased in the first quarter of 2020, compared to the fourth quarter of 2019, due to a market interest rate driven decline in the valuation of deferred director compensation and a reduction in consulting fees.
The year over year increase in noninterest expense is primarily attributable to growth in our commercial lending team in mid-2019, which resulted in higher salaries and employee benefits in the first quarter of 2020. In addition, repairs and planned maintenance on bank owned properties occurred in the first quarter of 2020, which resulted in higher occupancy, furniture and equipment expense. Card related expense also increased year over year due to growth in transactional volumes and system upgrades, as well as other real estate owned expense due to property valuation writedowns in 2020. Partially offsetting the year over year increases were decreases in FDIC insurance and advertising expense.
8
Earning Assets
|
|
|
|
|
|
|
|
|
|
|
|
March 31, 2020 |
|
||
|
Loans |
|
As of |
|
Percent Change From |
|
|||||||||
|
(dollars in thousands) |
|
March 31, |
|
December 31, |
|
March 31, |
|
December 31, |
|
March 31, |
|
|||
|
|
|
2020 |
|
2019 |
|
2019 |
|
2019 |
|
2019 |
|
|||
|
Commercial |
|
$ |
364,904 |
|
$ |
332,842 |
|
$ |
324,450 |
|
9.6 |
|
12.5 |
|
|
Leases |
|
|
125,418 |
|
|
119,751 |
|
|
87,730 |
|
4.7 |
|
43.0 |
|
|
Real estate - commercial |
|
|
850,703 |
|
|
865,599 |
|
|
835,904 |
|
(1.7) |
|
1.8 |
|
|
Real estate - construction |
|
|
76,784 |
|
|
69,617 |
|
|
94,787 |
|
10.3 |
|
(19.0) |
|
|
Real estate - residential |
|
|
389,005 |
|
|
396,901 |
|
|
399,866 |
|
(2.0) |
|
(2.7) |
|
|
HELOC |
|
|
122,485 |
|
|
123,457 |
|
|
133,859 |
|
(0.8) |
|
(8.5) |
|
|
Other1 |
|
|
15,244 |
|
|
12,258 |
|
|
14,018 |
|
24.4 |
|
8.7 |
|
|
Total loans, excluding deferred loan costs and PCD |
|
|
1,944,543 |
|
|
1,920,425 |
|
|
1,890,614 |
|
1.3 |
|
2.9 |
|
|
Net deferred loan costs |
|
|
1,662 |
|
|
1,786 |
|
|
1,681 |
|
(6.9) |
|
(1.1) |
|
|
Total loans, excluding PCD2 |
|
|
1,946,205 |
|
|
1,922,211 |
|
|
1,892,295 |
|
1.2 |
|
2.8 |
|
|
PCD loans, net of purchase accounting adjustments |
|
|
10,999 |
|
|
8,601 |
|
|
10,851 |
|
27.9 |
|
1.4 |
|
|
Total loans |
|
$ |
1,957,204 |
|
$ |
1,930,812 |
|
$ |
1,903,146 |
|
1.4 |
|
2.8 |
|
1 Other class includes consumer and overdrafts.
2 As a result of our adoption of the new CECL accounting standard effective January 1, 2020, loans formerly referred to as PCI loans are considered PCD loans under CECL for the three months ended March 31, 2020.
Total loans increased by $26.4 million at March 31, 2020, compared to December 31, 2019, and increased $54.1 million for the year over year period. Growth in the year over year period was primarily due to organic growth in our commercial, leases and real estate-commercial loan portfolios. As required by CECL, the balance (or amortized cost basis) of PCD loans are carried on a gross basis (rather than net of the associated credit loss estimate), and the expected credit losses for PCD loans are estimated and separately recognized as part of the allowance for credit losses. Accordingly, at January 1, 2020, $2.5 million of purchase accounting adjustments related to PCD loans were reclassified to the allowance for credit losses from loans, resulting in an increase to total PCD loans.
|
|
|
|
|
|
|
|
|
|
|
|
March 31, 2020 |
||
|
Securities |
|
As of |
|
Percent Change From |
|||||||||
|
(dollars in thousands) |
|
March 31, |
|
December 31, |
|
March 31, |
|
December 31, |
|
March 31, |
|||
|
|
|
2020 |
|
2019 |
|
2019 |
|
2019 |
|
2019 |
|||
|
Securities available-for-sale, at fair value |
|
|
|
|
|
|
|
|
|
|
|
|
|
|
U.S. Treasury |
|
$ |
4,152 |
|
$ |
4,036 |
|
$ |
3,960 |
|
2.9 |
|
4.8 |
|
U.S. government agencies |
|
|
7,723 |
|
|
8,337 |
|
|
10,360 |
|
(7.4) |
|
(25.5) |
|
U.S. government agency mortgage-backed |
|
|
17,255 |
|
|
16,588 |
|
|
15,306 |
|
4.0 |
|
12.7 |
|
States and political subdivisions |
|
|
255,095 |
|
|
249,175 |
|
|
281,172 |
|
2.4 |
|
(9.3) |
|
Collateralized mortgage obligations |
|
|
53,403 |
|
|
57,984 |
|
|
64,330 |
|
(7.9) |
|
(17.0) |
|
Asset-backed securities |
|
|
77,727 |
|
|
81,844 |
|
|
70,811 |
|
(5.0) |
|
9.8 |
|
Collateralized loan obligations |
|
|
34,339 |
|
|
66,684 |
|
|
63,151 |
|
(48.5) |
|
(45.6) |
|
Total securities available-for-sale |
|
$ |
449,694 |
|
$ |
484,648 |
|
$ |
509,090 |
|
(7.2) |
|
(11.7) |
|
|
|
|
|
|
|
|
|
|
|
|
|
|
|
Our securities portfolio was $449.7 million as of March 31, 2020, a decrease of $35.0 million from $484.6 million as of December 31, 2019, and a decrease of $59.4 million from March 31, 2019. The decrease in the portfolio during the first quarter of 2020 was due to $34.0 million of security sales and paydowns, as well as unrealized mark to market losses of $6.4 million, partially offset by a $6.0 million tax anticipation warrant purchase. Security sales recorded in the first quarter of 2020 resulted in net security losses of $24,000, compared to $35,000 of net security gains in the fourth quarter of 2019, and $27,000 of net security gains in the first quarter of 2019.
9
Asset Quality
|
|
|
|
|
|
|
|
|
|
|
|
March 31, 2020 |
||
|
Nonperforming assets |
|
As of |
|
Percent Change From |
|||||||||
|
(dollars in thousands) |
|
March 31, |
|
December 31, |
|
March 31, |
|
December 31, |
|
March 31, |
|||
|
|
|
2020 |
|
2019 |
|
2019 |
|
2019 |
|
2019 |
|||
|
Nonaccrual loans |
|
$ |
15,257 |
|
$ |
12,432 |
|
$ |
13,383 |
|
22.7 |
|
14.0 |
|
Performing troubled debt restructured loans accruing interest |
|
|
934 |
|
|
872 |
|
|
1,550 |
|
7.1 |
|
(39.7) |
|
Loans past due 90 days or more and still accruing interest |
|
|
1,406 |
|
|
2,545 |
|
|
4 |
|
(44.8) |
|
N/M |
|
Total nonperforming loans |
|
|
17,597 |
|
|
15,849 |
|
|
14,937 |
|
11.0 |
|
17.8 |
|
Other real estate owned |
|
|
5,049 |
|
|
5,004 |
|
|
6,365 |
|
0.9 |
|
(20.7) |
|
Total nonperforming assets |
|
$ |
22,646 |
|
$ |
20,853 |
|
$ |
21,302 |
|
8.6 |
|
6.3 |
|
|
|
|
|
|
|
|
|
|
|
|
|
|
|
|
PCD loans, net of purchase accounting adjustments |
|
$ |
10,999 |
|
$ |
8,601 |
|
$ |
10,851 |
|
27.9 |
|
1.4 |
|
|
|
|
|
|
|
|
|
|
|
|
|
|
|
|
|
|
|
|
|
|
|
|
|
|
|
|
|
|
|
30-89 days past due loans |
|
$ |
16,173 |
|
$ |
14,390 |
|
$ |
7,544 |
|
|
|
|
|
Nonaccrual loans to total loans |
|
|
0.8 |
% |
|
0.6 |
% |
|
0.7 |
% |
|
|
|
|
Nonperforming loans to total loans |
|
|
0.9 |
% |
|
0.8 |
% |
|
0.8 |
% |
|
|
|
|
Nonperforming assets to total loans plus OREO |
|
|
1.2 |
% |
|
1.1 |
% |
|
1.1 |
% |
|
|
|
|
Purchased credit-deteriorated loans to total loans |
|
|
0.6 |
% |
|
0.4 |
% |
|
0.6 |
% |
|
|
|
|
|
|
|
|
|
|
|
|
|
|
|
|
|
|
|
Allowance for credit losses |
|
$ |
30,045 |
|
$ |
19,789 |
|
$ |
19,316 |
|
|
|
|
|
Allowance for credit losses to total loans |
|
|
1.5 |
% |
|
1.0 |
% |
|
1.0 |
% |
|
|
|
|
Allowance for credit losses to nonaccrual loans |
|
|
196.9 |
% |
|
159.2 |
% |
|
144.3 |
% |
|
|
|
N/M - Not meaningful.
Nonperforming loans consist of nonaccrual loans, performing troubled debt restructured loans accruing interest and loans 90 days or more past due and still accruing interest. We do not consider PCD (or PCI loans for periods before March 31, 2020), which showed evidence of deteriorated credit quality at acquisition, to be nonperforming assets as long as their cash flows and the timing of such cash flows continue to be estimable and probable of collection. Nonperforming loans to total loans was 0.8% in each of the first quarter of 2020, fourth quarter of 2019, and the first quarter of 2019. Nonperforming assets to total loans plus OREO remained relatively stable and ended at 1.1% in the first quarter of 2020, fourth quarter of 2019 and the first quarter of 2019, as our loan portfolio grew year over year, and we continued OREO liquidations and recorded writedowns. Our allowance for loan and lease losses to total loans was 1.5% as of March 31, 2020, and 1.0% as of both December 31, 2019, and March 31, 2019.
10
The following table shows classified assets by segment for the following periods.
|
|
|
|
|
|
|
|
|
|
|
|
March 31, 2020 |
|
||
|
Classified loans |
|
As of |
|
Percent Change From |
|
|||||||||
|
(dollars in thousands) |
|
March 31, |
|
December 31, |
|
March 31, |
|
December 31, |
|
March 31, |
|
|||
|
|
|
2020 |
|
2019 |
|
2019 |
|
2019 |
|
2019 |
|
|||
|
Commercial |
|
$ |
11,267 |
|
$ |
11,688 |
|
$ |
7,075 |
|
(3.6) |
|
59.3 |
|
|
Leases |
|
|
264 |
|
|
329 |
|
|
114 |
|
(19.8) |
|
131.6 |
|
|
Real estate-commercial, nonfarm |
|
|
11,290 |
|
|
11,672 |
|
|
22,079 |
|
(3.3) |
|
(48.9) |
|
|
Real estate-commercial, farm |
|
|
2,237 |
|
|
1,210 |
|
|
1,222 |
|
84.9 |
|
83.1 |
|
|
Real estate-construction |
|
|
219 |
|
|
262 |
|
|
2,589 |
|
(16.4) |
|
(91.5) |
|
|
Real estate-residential: |
|
|
|
|
|
|
|
|
|
|
|
|
|
|
|
Investor |
|
|
1,377 |
|
|
1,390 |
|
|
991 |
|
(0.9) |
|
39.0 |
|
|
Multi-Family |
|
|
511 |
|
|
503 |
|
|
487 |
|
1.6 |
|
4.9 |
|
|
Owner occupied |
|
|
4,254 |
|
|
3,631 |
|
|
4,728 |
|
17.2 |
|
(10.0) |
|
|
HELOC |
|
|
1,661 |
|
|
1,969 |
|
|
1,966 |
|
(15.6) |
|
(15.5) |
|
|
Other1 |
|
|
349 |
|
|
359 |
|
|
28 |
|
(2.8) |
|
N/M |
|
|
Total classified loans, excluding PCD loans |
|
|
33,429 |
|
|
33,013 |
|
|
41,279 |
|
1.3 |
|
(19.0) |
|
|
PCD loans, net of purchase accounting adjustments |
|
|
10,999 |
|
|
8,601 |
|
|
10,851 |
|
27.9 |
|
1.4 |
|
|
Total classified loans |
|
$ |
44,428 |
|
$ |
41,614 |
|
$ |
52,130 |
|
6.8 |
|
(14.8) |
|
N/M - Not meaningful.
1 Other class includes consumer and overdrafts.
Classified loans include nonaccrual, performing troubled debt restructurings, PCD loans (formerly PCI loans, as applicable), and all other loans considered substandard. Classified loans totaled $44.4 million as of March 31, 2020, an increase of $2.8 million, or 6.8%, from the prior linked quarter, and a decrease of $7.7 million, or 14.8%, from the first quarter of 2019. All PCD loans stem from our acquisition of ABC Bank in 2018.
Allowance for Credit Losses on Loans
The allowance for credit losses (“ACL”) on loans was $19.8 million at December 31, 2019. Upon adoption of CECL on January 1, 2020 (Day One), we recognized an increase in our ACL on outstanding loans of $5.9 million and an increase in our allowance for credit losses on unfunded commitments of $1.7 million as a cumulative effect adjustment from change in accounting policies. Approximately $2.5 million of the increase to the ACL resulted from the transfer of the non-accretable purchase accounting adjustments on PCD loans. The Day One adjusting entries resulted in a $3.8 million reduction to retained earnings, and a deferred tax asset adjustment of $1.4 million. At March 31, 2020, the ACL on loans totaled $30.0 million, and the allowance for credit losses on unfunded commitments, included in other liabilities, totaled $4.2 million. This reserve build was driven by the $8.0 million provision expense in the first quarter of 2020, augmented by the previously mentioned impact from CECL adoption on January 1, 2020. The total increase in the allowance for credit losses reflects forecasted credit deterioration due to the COVID-19 pandemic. Our allowance for credit losses on loans to total loans was 1.5% as of March 31, 2020, compared to 1.0% at both December 31, 2019 and March 31, 2019.
11
Net Charge-off Summary
|
Loan Charge-offs, net of recoveries |
Quarters Ended |
|||||||||||||
|
(dollars in thousands) |
March 31, |
|
% of |
|
December 31, |
|
% of |
|
March 31, |
|
% of |
|||
|
|
2020 |
|
Total 2 |
|
2019 |
|
Total 2 |
|
2019 |
|
Total 2 |
|||
|
Commercial |
$ |
85 |
|
7.6 |
|
$ |
(18) |
|
(150.0) |
|
$ |
(18) |
|
(12.9) |
|
Leases |
|
- |
|
- |
|
|
2 |
|
16.7 |
|
|
- |
|
- |
|
Real estate-commercial, nonfarm |
|
|
|
|
|
|
|
|
|
|
|
|
|
|
|
Owner general purpose |
|
- |
|
- |
|
|
91 |
|
758.3 |
|
|
87 |
|
62.1 |
|
Owner special purpose |
|
1,108 |
|
98.8 |
|
|
494 |
|
N/M |
|
|
(3) |
|
(2.1) |
|
Non-owner general purpose |
|
(8) |
|
(0.7) |
|
|
(20) |
|
(166.7) |
|
|
(15) |
|
(10.7) |
|
Non-owner special purpose |
|
- |
|
- |
|
|
(615) |
|
N/M |
|
|
139 |
|
99.3 |
|
Retail properties |
|
- |
|
- |
|
|
- |
|
- |
|
|
- |
|
- |
|
Total real estate-commercial, nonfarm |
|
1,100 |
|
98.1 |
|
|
(50) |
|
591.6 |
|
|
208 |
|
148.6 |
|
Real estate-construction |
|
|
|
|
|
|
|
|
|
|
|
|
|
|
|
Homebuilder |
|
- |
|
- |
|
|
- |
|
- |
|
|
(1) |
|
(0.7) |
|
Land |
|
- |
|
- |
|
|
- |
|
- |
|
|
- |
|
- |
|
Commercial speculative |
|
- |
|
- |
|
|
- |
|
- |
|
|
2 |
|
1.4 |
|
All other |
|
- |
|
- |
|
|
1 |
|
8.3 |
|
|
- |
|
- |
|
Total real estate-construction |
|
- |
|
- |
|
|
1 |
|
8.3 |
|
|
1 |
|
0.7 |
|
Real estate-residential |
|
|
|
|
|
|
|
|
|
|
|
|
|
|
|
Investor |
|
(21) |
|
(1.9) |
|
|
15 |
|
125.0 |
|
|
(10) |
|
(7.1) |
|
Multi-Family |
|
- |
|
- |
|
|
(7) |
|
(58.3) |
|
|
(8) |
|
(5.7) |
|
Owner occupied |
|
(22) |
|
(2.0) |
|
|
72 |
|
600.0 |
|
|
(14) |
|
(10.0) |
|
Total real estate-residential |
|
(43) |
|
(3.9) |
|
|
80 |
|
666.7 |
|
|
(32) |
|
(22.8) |
|
HELOC |
|
(58) |
|
(5.2) |
|
|
(53) |
|
(441.7) |
|
|
(46) |
|
(32.9) |
|
Other1 |
|
38 |
|
3.4 |
|
|
50 |
|
416.7 |
|
|
27 |
|
19.3 |
|
Net charge-offs / (recoveries) |
$ |
1,122 |
|
100.0 |
|
$ |
12 |
|
100.00 |
|
$ |
140 |
|
100.00 |
N/M - Not meaningful.
1 Other class includes consumer and overdrafts.
2 Represents the percentage of net charge-offs attributable to each category of loans.
Gross charge-offs for the first quarter of 2020 were $1.4 million, compared to $835,000 for the fourth quarter of 2019, and $345,000 for the first quarter of 2019. Gross recoveries were $278,000 for the first quarter of 2020, compared to $823,000 for the fourth quarter of 2019 and $205,000 for the first quarter of 2019. Continued recoveries are indicative of the ongoing aggressive efforts by management to effectively manage and resolve prior charge-offs.
Deposits
Total deposits were $2.20 billion at March 31, 2020, an increase of $68.9 million compared to December 31, 2019, resulting from net increases in demand deposits of $32.8 million, savings, NOW and money market accounts of $28.3 million, and time deposits of $7.8 million. Total deposits increased $72.1 million in the year over year period driven primarily by growth in demand deposits of $72.7 million.
Borrowings
As of March 31, 2020, we had $6.4 million in other short-term borrowings compared to $48.5 million as of December 31, 2019, and $85.0 million as of March 31, 2019. Due to growth in deposits, our need for short-term funding declined in the first quarter of 2020.
We are indebted on senior notes totaling $44.3 million, net of deferred issuance costs, as of March 31, 2020. We are also indebted on $25.8 million of junior subordinated debentures, net of deferred issuance costs, which is related to the trust preferred securities issued by our statutory trust subsidiary, Old Second Capital Trust II. On March 2, 2020, we redeemed the trust preferred securities issued by Old Second Capital Trust I and related junior subordinated debentures, which resulted in a decrease in junior subordinated debentures of $32.0 million. Notes payable and other borrowings totaled $26.6 million as of March 31, 2020, and is comprised of a $20.0 million term note we originated to facilitate the redemption of our trust preferred securities issued by Old Second Capital Trust I and related junior subordinated debentures, and $6.6 million of a long-term FHLBC advance acquired in our ABC Bank acquisition that matures on February 2, 2026.
12
Non-GAAP Presentations: Management has disclosed in this earnings release certain non-GAAP financial measures to evaluate and measure our performance, including the presentation of net interest income and net interest margin on a fully taxable equivalent basis and our efficiency ratio calculations. The net interest margin is calculated by dividing net interest income on a tax equivalent basis by average earning assets for the period. Management believes this measure provides investors with information regarding balance sheet profitability. Consistent with industry practice, management has disclosed the efficiency ratio including and excluding certain items, which is discussed in the noninterest expense presentation on page 8. These non-GAAP financial measures should not be considered as a substitute for GAAP financial measures, and we strongly encourage investors to review the GAAP financial measures included in this earnings release and not to place undue reliance upon any single financial measure. In addition, because non-GAAP financial measures are not standardized, it may not be possible to compare the non-GAAP financial measures presented in this earnings release with other companies’ non-GAAP financial measures having the same or similar names. The tables on page 18 provide a reconciliation of each non-GAAP financial measure to the most comparable GAAP equivalent.
Forward-Looking Statements: This earnings release and statements by our management may contain forward-looking statements within the Private Securities Litigation Reform Act of 1995. Forward looking statements can be identified by words such as “anticipated,” “expects,” “intends,” “believes,” “may,” “likely,” “will” or other statements that indicate future periods. Such forward-looking statements are subject to risks, uncertainties, and other factors, which could cause actual results to differ materially from future results expressed or implied by such forward-looking statements. The following factors, among others, could cause actual results to differ materially from the anticipated results or other expectations expressed in the forward-looking statements, (1) the strength of the United States economy in general and the strength of the local economies in which we conduct our operations may be different than expected, including, but not limited to, due to the negative impacts and disruptions resulting from the recent outbreak of the novel coronavirus, or COVID-19, on the economies and communities we serve, which may have an adverse impact on the our business, operations and performance, and could have a negative impact on our credit portfolio, share price, borrowers, and on the economy as a whole, both domestically and globally; (2) the rate of delinquencies and amounts of charge-offs, the level of allowance for credit loss, the rates of loan growth, or adverse changes in asset quality in our loan portfolio, which may result in increased credit risk-related losses and expenses; (3) changes in legislation, regulation, policies, or administrative practices, whether by judicial, governmental, or legislative action, including, but not limited to, the Coronavirus Aid, Relief, and Economic Security Act, or the “CARES Act”; (4) adverse conditions in the stock market, the public debt market and other capital markets (including changes in interest rate conditions) could have a negative impact on us; and (5) changes in interest rates, which may affect our net income, prepayment penalty income, mortgage banking income, and other future cash flows, or the market value of our assets, including our investment securities. Additional risks and uncertainties are contained in the “Risk Factors” and forward-looking statements disclosure in our most recent Annual Report on Form 10-K and Quarterly Reports on Form 10-Q. The inclusion of this forward-looking information should not be construed as a representation by us or any person that future events, plans, or expectations contemplated by us will be achieved. We undertake no obligation to publicly update or revise any forward-looking statements, whether as a result of new information, future events, or otherwise, except as required by law.
Conference Call
We will host an earnings call on Thursday, April 23, 2020, at 11:00 a.m. Eastern Time (10:00 a.m. Central Time). Investors may listen to our earnings call via telephone by dialing 844-602-0380. Investors should call into the dial-in number set forth above at least 10 minutes prior to the scheduled start of the call.
A replay of the earnings call will be available until 11:00 a.m. Eastern Time (10:00 a.m. Central Time) on May 7, 2020, by dialing 877-481-4010, using Conference ID: 33876.
13
Old Second Bancorp, Inc. and Subsidiaries
(In thousands)
|
|
|
(unaudited) |
|
|
|
|
|
|
|
March 31, |
|
December 31, |
||
|
|
|
2020 |
|
2019 |
||
|
Assets |
|
|
|
|
|
|
|
Cash and due from banks |
|
$ |
27,627 |
|
$ |
34,096 |
|
Interest earning deposits with financial institutions |
|
|
45,511 |
|
|
16,536 |
|
Cash and cash equivalents |
|
|
73,138 |
|
|
50,632 |
|
Securities available-for-sale, at fair value |
|
|
449,694 |
|
|
484,648 |
|
Federal Home Loan Bank Chicago ("FHLBC") and Federal Reserve Bank Chicago ("FRBC") stock |
|
|
9,917 |
|
|
9,917 |
|
Loans held-for-sale |
|
|
10,049 |
|
|
3,061 |
|
Loans |
|
|
1,957,204 |
|
|
1,930,812 |
|
Less: allowance for credit losses on loans |
|
|
30,045 |
|
|
19,789 |
|
Net loans |
|
|
1,927,159 |
|
|
1,911,023 |
|
Premises and equipment, net |
|
|
44,579 |
|
|
44,354 |
|
Other real estate owned |
|
|
5,049 |
|
|
5,004 |
|
Mortgage servicing rights, net |
|
|
4,108 |
|
|
5,935 |
|
Goodwill and core deposit intangible |
|
|
21,147 |
|
|
21,275 |
|
Bank-owned life insurance ("BOLI") |
|
|
61,714 |
|
|
61,763 |
|
Deferred tax assets, net |
|
|
14,292 |
|
|
11,459 |
|
Other assets |
|
|
35,964 |
|
|
26,474 |
|
Total assets |
|
$ |
2,656,810 |
|
$ |
2,635,545 |
|
|
|
|
|
|
|
|
|
Liabilities |
|
|
|
|
|
|
|
Deposits: |
|
|
|
|
|
|
|
Noninterest bearing demand |
|
$ |
702,598 |
|
$ |
669,795 |
|
Interest bearing: |
|
|
|
|
|
|
|
Savings, NOW, and money market |
|
|
1,043,572 |
|
|
1,015,285 |
|
Time |
|
|
449,472 |
|
|
441,669 |
|
Total deposits |
|
|
2,195,642 |
|
|
2,126,749 |
|
Securities sold under repurchase agreements |
|
|
51,236 |
|
|
48,693 |
|
Other short-term borrowings |
|
|
6,375 |
|
|
48,500 |
|
Junior subordinated debentures |
|
|
25,773 |
|
|
57,734 |
|
Senior notes |
|
|
44,297 |
|
|
44,270 |
|
Notes payable and other borrowings |
|
|
26,609 |
|
|
6,673 |
|
Other liabilities |
|
|
41,101 |
|
|
25,062 |
|
Total liabilities |
|
|
2,391,033 |
|
|
2,357,681 |
|
|
|
|
|
|
|
|
|
Stockholders’ Equity |
|
|
|
|
|
|
|
Common stock |
|
|
34,957 |
|
|
34,854 |
|
Additional paid-in capital |
|
|
121,081 |
|
|
120,657 |
|
Retained earnings |
|
|
209,915 |
|
|
213,723 |
|
Accumulated other comprehensive (loss) income |
|
|
(1,819) |
|
|
4,562 |
|
Treasury stock |
|
|
(98,357) |
|
|
(95,932) |
|
Total stockholders’ equity |
|
|
265,777 |
|
|
277,864 |
|
Total liabilities and stockholders’ equity |
|
$ |
2,656,810 |
|
$ |
2,635,545 |
14
Old Second Bancorp, Inc. and Subsidiaries
Consolidated Statements of Income
(In thousands, except share data)
|
|
|
|
(unaudited) |
|
|||
|
|
|
Three Months Ended March 31, |
|
||||
|
|
|
2020 |
|
2019 |
|
||
|
Interest and dividend income |
|
|
|
|
|
|
|
|
Loans, including fees |
|
$ |
23,597 |
|
$ |
24,099 |
|
|
Loans held-for-sale |
|
|
36 |
|
|
22 |
|
|
Securities: |
|
|
|
|
|
|
|
|
Taxable |
|
|
2,163 |
|
|
2,414 |
|
|
Tax exempt |
|
|
1,455 |
|
|
2,098 |
|
|
Dividends from FHLBC and FRBC stock |
|
|
125 |
|
|
149 |
|
|
Interest bearing deposits with financial institutions |
|
|
75 |
|
|
114 |
|
|
Total interest and dividend income |
|
|
27,451 |
|
|
28,896 |
|
|
Interest expense |
|
|
|
|
|
|
|
|
Savings, NOW, and money market deposits |
|
|
635 |
|
|
771 |
|
|
Time deposits |
|
|
1,766 |
|
|
1,618 |
|
|
Securities sold under repurchase agreements |
|
|
116 |
|
|
149 |
|
|
Other short-term borrowings |
|
|
109 |
|
|
607 |
|
|
Junior subordinated debentures |
|
|
1,364 |
|
|
927 |
|
|
Senior notes |
|
|
673 |
|
|
672 |
|
|
Notes payable and other borrowings |
|
|
130 |
|
|
116 |
|
|
Total interest expense |
|
|
4,793 |
|
|
4,860 |
|
|
Net interest and dividend income |
|
|
22,658 |
|
|
24,036 |
|
|
Provision for credit losses |
|
|
7,984 |
|
|
450 |
|
|
Net interest and dividend income after provision for credit losses |
|
|
14,674 |
|
|
23,586 |
|
|
Noninterest income |
|
|
|
|
|
|
|
|
Trust income |
|
|
1,532 |
|
|
1,486 |
|
|
Service charges on deposits |
|
|
1,726 |
|
|
1,862 |
|
|
Secondary mortgage fees |
|
|
270 |
|
|
136 |
|
|
Mortgage servicing rights mark to market loss |
|
|
(2,134) |
|
|
(819) |
|
|
Mortgage servicing income |
|
|
468 |
|
|
457 |
|
|
Net gain on sales of mortgage loans |
|
|
2,246 |
|
|
762 |
|
|
Securities (losses) gains, net |
|
|
(24) |
|
|
27 |
|
|
Change in cash surrender value of BOLI |
|
|
(49) |
|
|
458 |
|
|
Card related income |
|
|
1,287 |
|
|
1,285 |
|
|
Other income |
|
|
1,000 |
|
|
828 |
|
|
Total noninterest income |
|
|
6,322 |
|
|
6,482 |
|
|
Noninterest expense |
|
|
|
|
|
|
|
|
Salaries and employee benefits |
|
|
12,918 |
|
|
11,612 |
|
|
Occupancy, furniture and equipment |
|
|
2,301 |
|
|
1,989 |
|
|
Computer and data processing |
|
|
1,335 |
|
|
1,332 |
|
|
FDIC insurance |
|
|
57 |
|
|
174 |
|
|
General bank insurance |
|
|
246 |
|
|
250 |
|
|
Amortization of core deposit intangible |
|
|
128 |
|
|
132 |
|
|
Advertising expense |
|
|
109 |
|
|
234 |
|
|
Card related expense |
|
|
532 |
|
|
355 |
|
|
Legal fees |
|
|
131 |
|
|
126 |
|
|
Other real estate expense, net |
|
|
237 |
|
|
50 |
|
|
Other expense |
|
|
3,008 |
|
|
2,940 |
|
|
Total noninterest expense |
|
|
21,002 |
|
|
19,194 |
|
|
(Loss) income before income taxes |
|
|
(6) |
|
|
10,874 |
|
|
(Benefit from) provision for income taxes |
|
|
(281) |
|
|
2,406 |
|
|
Net income |
|
$ |
275 |
|
$ |
8,468 |
|
|
|
|
|
|
|
|
|
|
|
Basic earnings per share |
|
$ |
0.01 |
|
$ |
0.28 |
|
|
Diluted earnings per share |
|
|
0.01 |
|
|
0.28 |
|
|
Dividends declared per share |
|
|
0.01 |
|
|
0.01 |
|
|
Ending common shares outstanding |
|
29,706,390 |
|
29,895,022 |
|
|
Weighted-average basic shares outstanding |
|
29,929,763 |
|
29,845,653 |
|
|
Weighted-average diluted shares outstanding |
|
30,490,605 |
|
30,343,631 |
|
15
Old Second Bancorp, Inc. and Subsidiaries
Quarterly Consolidated Average Balance
(In thousands, unaudited)
|
|
|
|
2019 |
|
2,020 |
|
|
|||||||||
|
Assets |
|
1st Qtr |
|
2nd Qtr |
|
3rd Qtr |
|
4th Qtr |
|
1st Qtr |
|
|||||
|
Cash and due from banks |
|
$ |
33,749 |
|
$ |
33,618 |
|
$ |
34,315 |
|
$ |
34,417 |
|
$ |
32,549 |
|
|
Interest earning deposits with financial institutions |
|
|
18,842 |
|
|
19,053 |
|
|
21,425 |
|
|
27,720 |
|
|
27,989 |
|
|
Cash and cash equivalents |
|
|
52,591 |
|
|
52,671 |
|
|
55,740 |
|
|
62,137 |
|
|
60,538 |
|
|
|
|
|
|
|
|
|
|
|
|
|
|
|
|
|
|
|
|
Securities available-for-sale, at fair value |
|
|
513,491 |
|
|
520,006 |
|
|
494,050 |
|
|
485,802 |
|
|
475,718 |
|
|
FHLBC and FRBC stock |
|
|
11,463 |
|
|
11,317 |
|
|
10,398 |
|
|
9,763 |
|
|
9,917 |
|
|
Loans held-for-sale |
|
|
1,853 |
|
|
2,870 |
|
|
4,462 |
|
|
3,441 |
|
|
3,623 |
|
|
Loans |
|
|
1,893,659 |
|
|
1,894,454 |
|
|
1,890,992 |
|
|
1,899,849 |
|
|
1,941,760 |
|
|
Less: allowance for credit losses on loans |
|
|
19,235 |
|
|
19,435 |
|
|
19,452 |
|
|
20,063 |
|
|
23,507 |
|
|
Net loans |
|
|
1,874,424 |
|
|
1,875,019 |
|
|
1,871,540 |
|
|
1,879,786 |
|
|
1,918,253 |
|
|
|
|
|
|
|
|
|
|
|
|
|
|
|
|
|
|
|
|
Premises and equipment, net |
|
|
42,270 |
|
|
42,271 |
|
|
42,754 |
|
|
43,614 |
|
|
44,613 |
|
|
Other real estate owned |
|
|
6,779 |
|
|
6,012 |
|
|
5,427 |
|
|
4,961 |
|
|
5,127 |
|
|
Mortgage servicing rights, net |
|
|
7,334 |
|
|
6,551 |
|
|
5,578 |
|
|
5,447 |
|
|
5,053 |
|
|
Goodwill and core deposit intangible |
|
|
21,747 |
|
|
21,618 |
|
|
21,476 |
|
|
21,337 |
|
|
21,208 |
|
|
Bank-owned life insurance ("BOLI") |
|
|
61,661 |
|
|
62,124 |
|
|
62,445 |
|
|
62,259 |
|
|
61,873 |
|
|
Deferred tax assets, net |
|
|
20,878 |
|
|
16,458 |
|
|
13,750 |
|
|
12,738 |
|
|
9,682 |
|
|
Other assets |
|
|
21,098 |
|
|
19,041 |
|
|
20,820 |
|
|
22,893 |
|
|
25,156 |
|
|
Total other assets |
|
|
181,767 |
|
|
174,075 |
|
|
172,250 |
|
|
173,249 |
|
|
172,712 |
|
|
Total assets |
|
$ |
2,635,589 |
|
$ |
2,635,958 |
|
$ |
2,608,440 |
|
$ |
2,614,178 |
|
$ |
2,640,761 |
|
|
|
|
|
|
|
|
|
|
|
|
|
|
|
|
|
|
|
|
Liabilities |
|
|
|
|
|
|
|
|
|
|
|
|
|
|
|
|
|
Deposits: |
|
|
|
|
|
|
|
|
|
|
|
|
|
|
|
|
|
Noninterest bearing demand |
|
$ |
625,423 |
|
$ |
645,580 |
|
$ |
651,863 |
|
$ |
678,136 |
|
$ |
676,755 |
|
|
Interest bearing: |
|
|
|
|
|
|
|
|
|
|
|
|
|
|
|
|
|
Savings, NOW, and money market |
|
|
1,055,563 |
|
|
1,044,950 |
|
|
1,011,717 |
|
|
1,010,948 |
|
|
1,025,511 |
|
|
Time |
|
|
445,076 |
|
|
422,975 |
|
|
420,429 |
|
|
437,236 |
|
|
448,763 |
|
|
Total deposits |
|
|
2,126,062 |
|
|
2,113,505 |
|
|
2,084,009 |
|
|
2,126,320 |
|
|
2,151,029 |
|
|
|
|
|
|
|
|
|
|
|
|
|
|
|
|
|
|
|
|
Securities sold under repurchase agreements |
|
|
45,157 |
|
|
44,184 |
|
|
40,342 |
|
|
45,146 |
|
|
47,825 |
|
|
Other short-term borrowings |
|
|
98,328 |
|
|
93,369 |
|
|
75,310 |
|
|
28,772 |
|
|
23,069 |
|
|
Junior subordinated debentures |
|
|
57,692 |
|
|
57,704 |
|
|
57,716 |
|
|
57,728 |
|
|
47,200 |
|
|
Senior Notes |
|
|
44,171 |
|
|
44,196 |
|
|
44,222 |
|
|
44,258 |
|
|
44,284 |
|
|
Notes payable and other borrowings |
|
|
15,273 |
|
|
13,101 |
|
|
10,973 |
|
|
8,768 |
|
|
14,762 |
|
|
Other liabilities |
|
|
13,750 |
|
|
19,586 |
|
|
30,329 |
|
|
28,026 |
|
|
28,490 |
|
|
Total liabilities |
|
|
2,400,433 |
|
|
2,385,645 |
|
|
2,342,901 |
|
|
2,339,018 |
|
|
2,356,659 |
|
|
|
|
|
|
|
|
|
|
|
|
|
|
|
|
|
|
|
|
Stockholders' equity |
|
|
|
|
|
|
|
|
|
|
|
|
|
|
|
|
|
Common stock |
|
|
34,775 |
|
|
34,825 |
|
|
34,825 |
|
|
34,845 |
|
|
34,900 |
|
|
Additional paid-in capital |
|
|
119,051 |
|
|
119,381 |
|
|
120,076 |
|
|
120,517 |
|
|
120,829 |
|
|
Retained earnings |
|
|
180,398 |
|
|
188,453 |
|
|
199,228 |
|
|
209,942 |
|
|
215,467 |
|
|
Accumulated other comprehensive (loss) income |
|
|
(3,102) |
|
|
3,705 |
|
|
7,417 |
|
|
5,806 |
|
|
9,131 |
|
|
Treasury stock |
|
|
(95,966) |
|
|
(96,051) |
|
|
(96,007) |
|
|
(95,950) |
|
|
(96,225) |
|
|
Total stockholders' equity |
|
|
235,156 |
|
|
250,313 |
|
|
265,539 |
|
|
275,160 |
|
|
284,102 |
|
|
Total liabilities and stockholders' equity |
|
$ |
2,635,589 |
|
$ |
2,635,958 |
|
$ |
2,608,440 |
|
$ |
2,614,178 |
|
$ |
2,640,761 |
|
|
|
|
|
|
|
|
|
|
|
|
|
|
|
|
|
|
|
|
Total Earning Assets |
|
$ |
2,439,308 |
|
$ |
2,447,700 |
|
$ |
2,421,327 |
|
$ |
2,426,575 |
|
$ |
2,459,007 |
|
|
Total Interest Bearing Liabilities |
|
|
1,761,260 |
|
|
1,720,479 |
|
|
1,660,709 |
|
|
1,632,856 |
|
|
1,651,414 |
|
16
Old Second Bancorp, Inc. and Subsidiaries
Quarterly Consolidated Statements of Income
(In thousands, except per share data, unaudited)
|
|
|
|
|
|
|
|
|
|
|
|
|
|
|
|
|
|
|
|
|
2019 |
|
2,020 |
|
|
||||||||||
|
|
|
1st Qtr |
|
2nd Qtr |
|
3rd Qtr |
|
4th Qtr |
|
1st Qtr |
|
|||||
|
Interest and Dividend Income |
|
|
|
|
|
|
|
|
|
|
|
|
|
|
|
|
|
Loans, including fees |
|
$ |
24,099 |
|
$ |
24,924 |
|
$ |
25,109 |
|
$ |
23,587 |
|
$ |
23,597 |
|
|
Loans held-for-sale |
|
|
22 |
|
|
31 |
|
|
47 |
|
|
33 |
|
|
36 |
|
|
Securities: |
|
|
|
|
|
|
|
|
|
|
|
|
|
|
|
|
|
Taxable |
|
|
2,414 |
|
|
2,223 |
|
|
2,296 |
|
|
2,323 |
|
|
2,163 |
|
|
Tax exempt |
|
|
2,098 |
|
|
2,141 |
|
|
1,719 |
|
|
1,467 |
|
|
1,455 |
|
|
Dividends from FHLB and FRBC stock |
|
|
149 |
|
|
156 |
|
|
154 |
|
|
143 |
|
|
125 |
|
|
Interest bearing deposits with financial institutions |
|
|
114 |
|
|
111 |
|
|
119 |
|
|
115 |
|
|
75 |
|
|
Total interest and dividend income |
|
|
28,896 |
|
|
29,586 |
|
|
29,444 |
|
|
27,668 |
|
|
27,451 |
|
|
Interest Expense |
|
|
|
|
|
|
|
|
|
|
|
|
|
|
|
|
|
Savings, NOW, and money market deposits |
|
|
771 |
|
|
759 |
|
|
724 |
|
|
706 |
|
|
635 |
|
|
Time deposits |
|
|
1,618 |
|
|
1,641 |
|
|
1,672 |
|
|
1,805 |
|
|
1,766 |
|
|
Securities sold under repurchase agreements |
|
|
149 |
|
|
147 |
|
|
135 |
|
|
146 |
|
|
116 |
|
|
Other short-term borrowings |
|
|
607 |
|
|
575 |
|
|
429 |
|
|
144 |
|
|
109 |
|
|
Junior subordinated debentures |
|
|
927 |
|
|
931 |
|
|
933 |
|
|
933 |
|
|
1,364 |
|
|
Senior notes |
|
|
672 |
|
|
672 |
|
|
682 |
|
|
673 |
|
|
673 |
|
|
Notes payable and other borrowings |
|
|
116 |
|
|
107 |
|
|
89 |
|
|
72 |
|
|
130 |
|
|
Total interest expense |
|
|
4,860 |
|
|
4,832 |
|
|
4,664 |
|
|
4,479 |
|
|
4,793 |
|
|
Net interest and dividend income |
|
|
24,036 |
|
|
24,754 |
|
|
24,780 |
|
|
23,189 |
|
|
22,658 |
|
|
Provision for credit losses |
|
|
450 |
|
|
450 |
|
|
550 |
|
|
150 |
|
|
7,984 |
|
|
Net interest and dividend income after provision for credit losses |
|
|
23,586 |
|
|
24,304 |
|
|
24,230 |
|
|
23,039 |
|
|
14,674 |
|
|
Noninterest Income |
|
|
|
|
|
|
|
|
|
|
|
|
|
|
|
|
|
Trust income |
|
|
1,486 |
|
|
1,739 |
|
|
1,730 |
|
|
1,700 |
|
|
1,532 |
|
|
Service charges on deposits |
|
|
1,862 |
|
|
1,959 |
|
|
2,020 |
|
|
1,874 |
|
|
1,726 |
|
|
Secondary mortgage fees |
|
|
136 |
|
|
203 |
|
|
282 |
|
|
151 |
|
|
270 |
|
|
Mortgage servicing rights mark to market (loss) gain |
|
|
(819) |
|
|
(1,137) |
|
|
(946) |
|
|
240 |
|
|
(2,134) |
|
|
Mortgage servicing income |
|
|
457 |
|
|
491 |
|
|
460 |
|
|
473 |
|
|
468 |
|
|
Net gain on sales of mortgage loans |
|
|
762 |
|
|
1,163 |
|
|
2,074 |
|
|
1,113 |
|
|
2,246 |
|
|
Securities gains (losses), net |
|
|
27 |
|
|
986 |
|
|
3,463 |
|
|
35 |
|
|
(24) |
|
|
Change in cash surrender value of BOLI |
|
|
458 |
|
|
320 |
|
|
267 |
|
|
370 |
|
|
(49) |
|
|
Death benefit realized on BOLI |
|
|
- |
|
|
- |
|
|
- |
|
|
872 |
|
|
- |
|
|
Card related income |
|
|
1,285 |
|
|
1,553 |
|
|
1,595 |
|
|
1,428 |
|
|
1,287 |
|
|
Other income |
|
|
828 |
|
|
866 |
|
|
988 |
|
|
986 |
|
|
1,000 |
|
|
Total noninterest income |
|
|
6,482 |
|
|
8,143 |
|
|
11,933 |
|
|
9,242 |
|
|
6,322 |
|
|
Noninterest Expense |
|
|
|
|
|
|
|
|
|
|
|
|
|
|
|
|
|
Salaries and employee benefits |
|
|
11,612 |
|
|
11,587 |
|
|
12,062 |
|
|
11,608 |
|
|
12,918 |
|
|
Occupancy, furniture and equipment |
|
|
1,989 |
|
|
1,925 |
|
|
2,235 |
|
|
2,140 |
|
|
2,301 |
|
|
Computer and data processing |
|
|
1,332 |
|
|
1,524 |
|
|
1,490 |
|
|
1,285 |
|
|
1,335 |
|
|
FDIC insurance |
|
|
174 |
|
|
116 |
|
|
(114) |
|
|
- |
|
|
57 |
|
|
General bank insurance |
|
|
250 |
|
|
236 |
|
|
270 |
|
|
246 |
|
|
246 |
|
|
Amortization of core deposit intangible |
|
|
132 |
|
|
121 |
|
|
157 |
|
|
129 |
|
|
128 |
|
|
Advertising expense |
|
|
234 |
|
|
381 |
|
|
360 |
|
|
250 |
|
|
109 |
|
|
Card related expense |
|
|
355 |
|
|
474 |
|
|
531 |
|
|
596 |
|
|
532 |
|
|
Legal fees |
|
|
126 |
|
|
243 |
|
|
111 |
|
|
195 |
|
|
131 |
|
|
Other real estate expense, net |
|
|
50 |
|
|
248 |
|
|
26 |
|
|
99 |
|
|
237 |
|
|
Other expense |
|
|
2,940 |
|
|
3,271 |
|
|
2,826 |
|
|
3,280 |
|
|
3,008 |
|
|
Total noninterest expense |
|
|
19,194 |
|
|
20,126 |
|
|
19,954 |
|
|
19,828 |
|
|
21,002 |
|
|
Income (loss) before income taxes |
|
|
10,874 |
|
|
12,321 |
|
|
16,209 |
|
|
12,453 |
|
|
(6) |
|
|
Provision for (benefit from) income taxes |
|
|
2,406 |
|
|
3,043 |
|
|
4,036 |
|
|
2,917 |
|
|
(281) |
|
|
Net income |
|
$ |
8,468 |
|
$ |
9,278 |
|
$ |
12,173 |
|
$ |
9,536 |
|
$ |
275 |
|
|
|
|
|
|
|
|
|
|
|
|
|
|
|
|
|
|
|
|
Basic earnings per share |
|
$ |
0.28 |
|
$ |
0.31 |
|
$ |
0.41 |
|
$ |
0.32 |
|
$ |
0.01 |
|
|
Diluted earnings per share |
|
|
0.28 |
|
|
0.31 |
|
|
0.40 |
|
|
0.31 |
|
|
0.01 |
|
|
Dividends paid per share |
|
|
0.01 |
|
|
0.01 |
|
|
0.01 |
|
|
0.01 |
|
|
0.01 |
|
17
Reconciliation of Non-GAAP Financial Measures
The tables below provide a reconciliation of each non-GAAP financial measure to the most comparable GAAP measure for the periods indicated. Dollar amounts below in thousands:
|
|
|
Quarters Ended |
|
|||||||
|
|
|
March 31, |
|
December 31, |
|
March 31, |
|
|||
|
|
|
2020 |
|
2019 |
|
2019 |
|
|||
|
Net Interest Margin |
|
|
|
|
|
|
|
|
|
|
|
Interest income (GAAP) |
|
$ |
27,451 |
|
$ |
27,668 |
|
$ |
28,896 |
|
|
Taxable-equivalent adjustment: |
|
|
|
|
|
|
|
|
|
|
|
Loans |
|
|
3 |
|
|
3 |
|
|
5 |
|
|
Securities |
|
|
387 |
|
|
390 |
|
|
558 |
|
|
Interest income (TE) |
|
|
27,841 |
|
|
28,061 |
|
|
29,459 |
|
|
Interest expense (GAAP) |
|
|
4,793 |
|
|
4,479 |
|
|
4,859 |
|
|
Net interest income (TE) |
|
$ |
23,048 |
|
$ |
23,582 |
|
$ |
24,600 |
|
|
Net interest income (GAAP) |
|
$ |
22,658 |
|
$ |
23,189 |
|
$ |
24,037 |
|
|
Average interest earning assets |
|
$ |
2,459,007 |
|
$ |
2,426,575 |
|
$ |
2,439,308 |
|
|
Net interest margin (GAAP) |
|
|
3.71 |
% |
|
3.79 |
% |
|
4.00 |
% |
|
Net interest margin (TE) |
|
|
3.77 |
% |
|
3.86 |
% |
|
4.09 |
% |
|
|
|
GAAP |
|
Non-GAAP |
|
||||||||||||||
|
|
|
|
Three Months Ended |
|
|
Three Months Ended |
|
||||||||||||
|
|
|
March 31, |
|
December 31, |
|
March 31, |
|
March 31, |
|
December 31, |
|
March 31, |
|
||||||
|
|
|
2020 |
|
2019 |
|
2019 |
|
2020 |
|
2019 |
|
2019 |
|
||||||
|
Efficiency Ratio / Adjusted Efficiency Ratio |
|
|
|
|
|
|
|
|
|
|
|
|
|
|
|
|
|
|
|
|
Noninterest expense |
|
$ |
21,002 |
|
$ |
19,828 |
|
$ |
19,194 |
|
$ |
21,002 |
|
$ |
19,828 |
|
$ |
19,194 |
|
|
Less amortization of core deposit |
|
|
128 |
|
|
129 |
|
|
132 |
|
|
128 |
|
|
129 |
|
|
132 |
|
|
Less other real estate expense, net |
|
|
237 |
|
|
99 |
|
|
50 |
|
|
237 |
|
|
99 |
|
|
50 |
|
|
Noninterest expense less adjustments |
|
$ |
20,637 |
|
$ |
19,600 |
|
$ |
19,012 |
|
$ |
20,637 |
|
$ |
19,600 |
|
$ |
19,012 |
|
|
|
|
|
|
|
|
|
|
|
|
|
|
|
|
|
|
|
|
|
|
|
Net interest income |
|
$ |
22,658 |
|
$ |
23,189 |
|
$ |
24,036 |
|
$ |
22,658 |
|
$ |
23,189 |
|
$ |
24,036 |
|
|
Taxable-equivalent adjustment: |
|
|
|
|
|
|
|
|
|
|
|
|
|
|
|
|
|
|
|
|
Loans |
|
|
N/A |
|
|
N/A |
|
|
N/A |
|
|
3 |
|
|
3 |
|
|
5 |
|
|
Securities |
|
|
N/A |
|
|
N/A |
|
|
N/A |
|
|
387 |
|
|
390 |
|
|
558 |
|
|
Net interest income including adjustments |
|
|
22,658 |
|
|
23,189 |
|
|
24,036 |
|
|
23,048 |
|
|
23,582 |
|
|
24,599 |
|
|
Noninterest income |
|
|
6,322 |
|
|
9,242 |
|
|
6,482 |
|
|
6,322 |
|
|
9,242 |
|
|
6,482 |
|
|
Less death benefit related to BOLI |
|
|
- |
|
|
872 |
|
|
- |
|
|
- |
|
|
872 |
|
|
- |
|
|
Less securities (losses) gains, net |
|
|
(24) |
|
|
35 |
|
|
27 |
|
|
(24) |
|
|
35 |
|
|
27 |
|
|
Less MSRs mark to market (loss) gain |
|
|
(2,134) |
|
|
240 |
|
|
(819) |
|
|
(2,134) |
|
|
240 |
|
|
(819) |
|
|
Taxable-equivalent adjustment: |
|
|
|
|
|
|
|
|
|
|
|
|
|
|
|
|
|
|
|
|
Change in cash surrender value of BOLI |
|
|
N/A |
|
|
N/A |
|
|
N/A |
|
|
(13) |
|
|
330 |
|
|
122 |
|
|
Noninterest income (less) / including adjustments |
|
|
8,480 |
|
|
8,095 |
|
|
7,274 |
|
|
8,467 |
|
|
8,425 |
|
|
7,396 |
|
|
|
|
|
|
|
|
|
|
|
|
|
|
|
|
|
|
|
|
|
|
|
Net interest income including adjustments plus noninterest income (less) / including adjustments |
|
$ |
31,138 |
|
$ |
31,284 |
|
$ |
31,310 |
|
$ |
31,515 |
|
$ |
32,007 |
|
$ |
31,995 |
|
|
Efficiency ratio / Adjusted efficiency ratio |
|
|
66.28 |
% |
|
62.65 |
% |
|
60.72 |
% |
|
65.48 |
% |
|
61.24 |
% |
|
59.42 |
% |
18