Attached files
| file | filename |
|---|---|
| EX-99.1 - EXHIBIT 99.1 - COMMUNITY BANK SYSTEM, INC. | tm2016286d1_ex99-1.htm |
| 8-K - FORM 8-K - COMMUNITY BANK SYSTEM, INC. | tm2016286d1_8k.htm |
Exhibit 99.2

APRIL 2020 COVID - 19 PANDEMIC RESPONSE

1 FORWARD - LOOKING STATEMENT This presentation contains forward - looking statements within the meaning of the Private Securities Litigation Reform Act of 1995. These statements are based on the current beliefs and expectations of CBU’s management and are subject to significant risks and uncertainties. Actual results may differ from those set forth in the forward - looking statements. The following factors, among others, could cause the actual results of CBU’s operations to differ materially from its expectations: the effect of the COVID - 19 pandemic, including the negative impacts and disruptions on CBU’s colleagues, the communities CBU serves, and the domestic and global economy, which may have an adverse effect on CBU’s business; current and future economic and market conditions, including the effects of declines in housing prices, high unemployment rates, U.S. fiscal debt, budget and tax matters, geopolitical matters, and any slowdown in global economic growth; fiscal and monetary policies of the Federal Reserve Board; the effect of changes in the level of checking or savings account deposits on CBU’s funding costs and net interest margin; future provisions for credit losses on loans and debt securities; changes in nonperforming assets; the effect of a fall in stock market prices on CBU’s fee income businesses, including its employee benefit services, wealth management, and insurance businesses; the successful integration of operations of its acquisitions; competition; changes in legislation or regulatory requirements; and the timing for receiving regulatory approvals and completing pending transactions. For more information about factors that could cause actual results to differ materially from CBU’s expectations, refer to its reports filed with the Securities and Exchange Commission, including the discussion under “Risk Factors” in the Annual Report on Form 10 - K for the year ended December 31, 2019, as filed with the Securities and Exchange Commission and available on its website at www.sec.gov. Further, any forward - looking statement speaks only as of the date on which it is made, and CBU undertakes no obligation to update any forward - looking statement to reflect events or circumstances after the date on which the statement is made or to reflect the occurrence of unanticipated events.

2 COVID - 19 VIRUS DEVELOPMENTS The World Health Organization declared COVID - 19 virus to be a global pandemic on March 11, 2020. T he rapid spread of the COVID - 19 virus in the United States invoked various Federal and State Authorities to make emergency declarations and issue executive orders to limit the spread of disease. Concerns about the spread of the disease and its anticipated negative impact on economic activity, severely disrupted both domestic and international financial markets. As the COVID - 19 events unfolded throughout the first quarter of 2020, the Company implemented various plans, strategies and protocols to protect its employees, maintain services for customers, assure the functional continuity of its operating systems, controls and processes, and mitigate financial risks posed by changing market conditions. Although there is a high degree of uncertainty around the magnitude and duration of the economic impact of the COVID - 19 pandemic, the Company’s management believes that its financial position, including high levels of capital and liquidity, will allow it to successfully endure the negative economic impacts of the crisis .

3 COMPANY RESPONSE TO COVID - 19 • Appointed an internal task force comprised of the Company’s management to address both operational and financial risks posed by COVID - 19 • Modified branch operations • Branch lobbies available, but on an appointment only basis • Primarily drive thru transactions • Increased emphasis on digital banking platforms • Implemented physical separation of critical operational workforce for Bank and non - Bank financial services subsidiaries • Expanded paid time off and health benefits for employees • Implemented work from home strategy • The majority of the Company’s non - branch and non - critical operational employees are working remotely • S uspended work related travel • Adopted self - quarantine procedures • Implemented enhanced cleaning protocols • Redeployed staff to critical customer service operations to expedite payment deferral requests and Paycheck Protection Program (PPP) lending efforts

4 $479 $607 $876 $1,198 $1,855 $1,977 7.77% 8.23% 9.29% 10.55% 10.80% 11.10% 5.28% 6.14% 7.68% 9.24% 10.01% 10.78% 0% 2% 4% 6% 8% 10% 12% 14% $0 $400 $800 $1,200 $1,600 $2,000 2007 2010 2013 2016 2019 Q1 2020 $ in Millions Shareholders' Equity Tier I Ratio Tangible Equity/Tangible Assets STRONG CAPITAL POSITION (unaudited) The Company’s capital planning and capital management activities, coupled with its historically strong earnings performance and prudent dividend practices, have allowed it to build and maintain strong capital reserves. At March 31, 2020, all of the Company’s regulatory capital ratios significantly exceed all well - capitalized standards. Note: Tangible Equity and Tangible Assets are non - GAAP measures. Please see the Appendix for details.

5 Liquidity Sources March 31, 2020 $ in Thousands Cash and Cash Equivalents (net of float & reserves) $458,890 FHLB Borrowing Capacity $1,826,357 FRB Borrowing Availability $260,435 Investments 1 US Gov’t & Agency $2,139,079 MBS & CMO (less 5% haircut ) $473,658 Municipals $481,797 Corporates $2,508 Less: Pledged Securities $(1,594,694) Net Unpledged Securities $1,502,348 Total Liquidity Sources $4,048,030 (1) Includes $152 million of unrealized gains on securities; excludes municipal qualified school construction bonds, equity s ecu rities and other investments LIQUIDITY POSITION & SOURCES (unaudited)

6 4,292 loans representing $587 million in loan balances granted loan payment deferrals (as of April 15, 2020) • The Company anticipates that the number and amount of COVID - 19 financial hardship payment deferral requests will increase significantly during the second quarter of 2020. • Estimated 1,395 Paycheck Protection Program (PPP) loan applications, representing $352 million, have received SBA authorization through April 15, 2020 to provide support to the businesses in our communities Portfolio # of Loans Customer Loan Balances $ in Millions % of P ortfolio Outstandings (as of 3/31/20) Business Lending 1,018 $ 447 16.0% Consumer Mortgage & Home Equity 1,194 $ 106 3.8% Consumer Installment 2,080 $ 34 2.7% Total 4,292 $ 587 8.6% Note: The Company does not have a credit card receivables portfolio CUSTOMER SUPPORT (unaudited)

7 COVID - 19 Related Industry Exposure $ in Millions March 31, 2020 NAICS code based loan data “Exposure” includes both the outstanding and available portions of the loan commitment (1) Retail excludes Furniture Stores and Grocery Stores but includes loans secured by non - owner - occupied commercial real estate that are secured by retail properties (2) Lodging excludes RV Parks and Campgrounds (3) Healthcare excludes Hospitals (4) Arts, Entertainment, and Recreation excludes Casinos (5) Food Services includes Full & Limited Service Restaurants, Alcoholic Beverage Bars and Snack/Non - Alcoholic Beverage Bars (6) Educational Services excludes Public Elementary and Secondary Schools (7) Transportation excludes General & Specialized Freight Trucking, Freight Transport and Warehousing/Storage Industry Real Estate Secured Non Real Estate Secured Total Loans Outstanding % of Total Loans Outstanding Remaining Availability Total Exposure Retail 1 $168 $93 $261 3.8% $70 $331 Lodging 2 $222 $1 $223 3.3% $19 $242 Manufacturing $62 $95 $157 2.3% $70 $227 Construction $30 $102 $133 1.9% $85 $217 Healthcare 3 $108 $38 $147 2.1% $35 $181 Furniture Stores $89 $3 $91 1.3% $6 $97 Arts, Entertainment & Recreation 4 $35 $7 $42 0.6% $14 $57 Dairy Farms $32 $11 $43 0.6% $4 $47 Food Services 5 $27 $11 $38 0.6% $5 $43 Casinos $10 $20 $29 0.4% $10 $39 Educational Services 6 $7 $12 $19 0.3% $12 $31 Transportation 7 $2 $16 $18 0.3% $8 $26 TOTAL EXPOSURE $ 792 $ 409 $1,201 17.6% $ 338 $1,538 BALANCE SHEET EXPOSURE (unaudited)
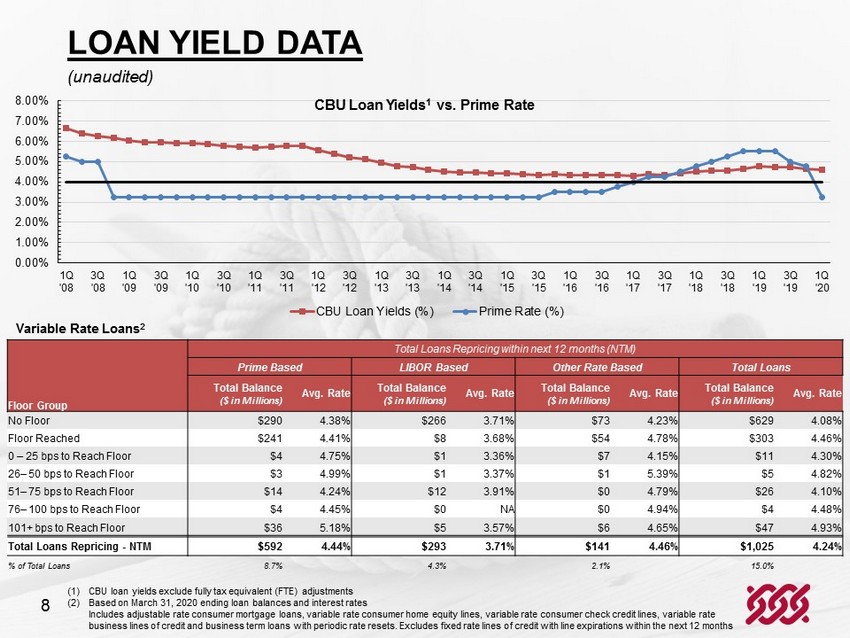
8 (1) CBU loan yields exclude fully tax equivalent (FTE) adjustments (2) Based on March 31, 2020 ending loan balances and interest rates Includes adjustable rate consumer mortgage loans, variable rate consumer home equity lines, variable rate consumer check cred it lines, variable rate business lines of credit and business term loans with periodic rate resets. Excludes fixed rate lines of credit with line exp ira tions within the next 12 months 0.00% 1.00% 2.00% 3.00% 4.00% 5.00% 6.00% 7.00% 8.00% 1Q '08 3Q '08 1Q '09 3Q '09 1Q '10 3Q '10 1Q '11 3Q '11 1Q '12 3Q '12 1Q '13 3Q '13 1Q '14 3Q '14 1Q '15 3Q '15 1Q '16 3Q '16 1Q '17 3Q '17 1Q '18 3Q '18 1Q '19 3Q '19 1Q '20 CBU Loan Yields 1 vs. Prime Rate CBU Loan Yields (%) Prime Rate (%) Variable Rate Loans 2 Total Loans Repricing within next 12 months (NTM) Prime Based LIBOR Based Other Rate Based Total Loans Floor Group Total Balance ($ in Millions ) Avg. Rate Total Balance ($ in Millions ) Avg. Rate Total Balance ($ in Millions ) Avg. Rate Total Balance ($ in Millions ) Avg. Rate No Floor $290 4.38% $266 3.71% $73 4.23% $629 4.08% Floor Reached $241 4.41% $8 3.68% $54 4.78% $303 4.46% 0 – 25 bps to Reach Floor $4 4.75% $1 3.36% $7 4.15% $11 4.30% 26 – 50 bps to Reach Floor $3 4.99% $1 3.37% $1 5.39% $5 4.82% 51 – 75 bps to Reach Floor $14 4.24% $12 3.91% $0 4.79% $26 4.10% 76 – 100 bps to Reach Floor $4 4.45% $0 NA $0 4.94% $4 4.48% 101+ bps to Reach Floor $36 5.18% $5 3.57% $6 4.65% $47 4.93% Total Loans Repricing - NTM $ 592 4.44% $293 3.71% $141 4.46% $ 1,025 4.24% % of Total Loans 8.7% 4.3% 2.1% 15.0% LOAN YIELD DATA (unaudited)

9 FUTURE EXPECTATIONS The COVID - 19 crisis is expected to continue to impact the Company’s financial results, as well as demand for its services and products during the second quarter of 2020 and potentially beyond. The short and long - term implications of the COVID - 19 crisis, and related monetary and fiscal stimulus measures, on the Company’s future earnings results, allowance for credit losses, capital reserves , and liquidity are unknown at this time.

10 APPENDIX: TANGIBLE EQUITY COMPONENTS (unaudited ) 2007 2010 2013 2016 2019 Q1 2020 Total assets Total assets (GAAP) $4,697,502 $5,444,506 $7,095,864 $8,666,437 $11,410,295 $11,808,983 Intangible assets (256,216) (311,714) (390,499) (480,844) (836,923) (832,919) Deferred taxes on intangible assets 12,390 20,765 32,339 43,504 44,742 44,494 Total tangible assets (non - GAAP) 4,453,676 5,153,557 6,737,704 8,229,097 10,618,114 11,020,558 Total common equity Shareholders' Equity (GAAP) 478,784 607,528 875,812 1,198,100 1,855,234 1,976,631 Intangible assets (256,216) (311,714) (390,499) (480,844) (836,923) (832,919) Deferred taxes on intangible assets 12,390 20,765 32,339 43,504 44,742 44,494 Total tangible common equity (non - GAAP) 234,958 316,579 517,652 760,760 1,063,053 1,188,206 Net tangible equity - to - assets ratio at quarter end Total tangible common equity (non - GAAP) - numerator $234,958 $316,579 $517,652 $760,760 $1,063,053 $1,188,206 Total tangible assets (non - GAAP) - denominator 4,453,676 5,153,557 6,737,704 8,229,097 10,618,114 11,020,558 Net tangible equity - to - assets ratio at quarter end (non - GAAP) 5.28% 6.14% 7.68% 9.24% 10.01% 10.78%

APRIL 2020 Investor Relations Contact Mr. Joseph E. Sutaris EVP & Chief Financial Officer Joseph.Sutaris@cbna.com (315) 445 - 7396