Attached files
| file | filename |
|---|---|
| 8-K - 8-K - WESTERN ALLIANCE BANCORPORATION | coverpage-pressrelease.htm |
| EX-99.1 - EXHIBIT 99.1 - WESTERN ALLIANCE BANCORPORATION | pressrelease-3312020.htm |

EARNINGS CALL 1st QUARTER 2020 April 17, 2020

Forward-Looking Statements This release contains forward-looking statements that relate to expectations, beliefs, projections, future plans and strategies, anticipated events or trends and similar expressions concerning matters that are not historical facts. Examples of forward-looking statements include, among others, statements we make regarding our expectations with regard to our business, financial and operating results, future economic performance and dividends, and the impact to the Company’s allowance and provision for credit losses and capital levels under the new current expected credit loss (CECL) accounting standard. The forward- looking statements contained herein reflect our current views about future events and financial performance and are subject to risks, uncertainties, assumptions and changes in circumstances that may cause our actual results to differ significantly from historical results and those expressed in any forward-looking statement. Some factors that could cause actual results to differ materially from historical or expected results include, among others: the risk factors discussed in the Company’s Annual Report on Form 10-K for the year ended December 31, 2019 as filed with the Securities and Exchange Commission; the potential adverse effects of the ongoing COVID-19 pandemic and any governmental or societal responses thereto, or other unusual and infrequently occurring events; changes in general economic conditions, either nationally or locally in the areas in which we conduct or will conduct our business; inflation, interest rate, market and monetary fluctuations; increases in competitive pressures among financial institutions and businesses offering similar products and services; higher defaults on our loan portfolio than we expect; changes in management’s estimate of the adequacy of the allowance for credit losses; legislative or regulatory changes including in response to the COVID-19 pandemic such as the Coronavirus Aid, Relief and Economic Security Act (“CARES Act”) and the rules and regulations that may be promulgated thereunder; or changes in accounting principles, policies or guidelines (including changes related to CECL); supervisory actions by regulatory agencies which may limit our ability to pursue certain growth opportunities, including expansion through acquisitions; additional regulatory requirements resulting from our continued growth; management’s estimates and projections of interest rates and interest rate policy; the execution of our business plan; and other factors affecting the financial services industry generally or the banking industry in particular. Any forward-looking statement made by us in this release is based only on information currently available to us and speaks only as of the date on which it is made. We do not intend and disclaim any duty or obligation to update or revise any industry information or forward-looking statements, whether written or oral, that may be made from time to time, set forth in this press release to reflect new information, future events or otherwise. Non-GAAP Financial Measures This presentation contains both financial measures based on GAAP and non-GAAP based financial measures, which are used where management believes them to be helpful in understanding the Company’s results of operations or financial position. Where non-GAAP financial measures are used, the comparable GAAP financial measure, as well as the reconciliation to the comparable GAAP financial measure, can be found in the Company's press release as of and for the quarter ended March 31, 2020. These disclosures should not be viewed as a substitute for operating results determined in accordance with GAAP, nor are they necessarily comparable to non-GAAP performance measures that may be presented by other companies. 2 2

Impact and Response to COVID-19 Pandemic Western Alliance is actively engaged with our people, customers and the communities we serve to help weather the current environment and be best positioned for future recovery. . Focusing on well-being of our people, customers and communities − Mandatory work from home, and COVID prevention recommendations − Employees remain healthy and engaged . Business continuity plan operating as expected . Began preparing early (Mid- to late-January) − Assessed potential risks and mitigants Overview of − Segregated portfolio into risk segments with senior SMEs leading monitoring & mitigation WAL’s strategy COVID-19 − Accelerated implementing risk management actions in mid-February Response − Tightened underwriting standards . Prioritizing asset quality, capital, and liquidity access − Arrived in position of strength and uniquely prepared to address what’s ahead − Current TCE / TA of 9.4%, in excess of peer levels − Significant liquidity access: Robust and diverse deposit sources and $10Bn of available liquidity − Stable asset quality entering into recession 3 Note: Peers consist of 55 major exchange traded banks with total assets between $15B and $150B as of December 31, 2019, excluding target banks of pending acquisitions; S&P Global Market Intelligence. 3

Impact and Response to COVID-19 Pandemic (cont’d) . Implemented broad-based risk management strategy to manage credit segments on real-time basis . Borrower-Level Strategies: Direct customer dialogue to develop long-term contingency financial plans Credit − Risk management conversations with all borrowers >$3MM exposure (86% of portfolio) & − Focused on monitoring “Burn Months” through the crisis Risk Management − Encouraging full use of borrower cash resources to solve shortfall Strategy . Prioritized PPP loans guaranteed by SBA to provide expedient liquidity to impacted borrowers . Streamlined Loan Modification Process: Partner with clients. Assess willingness and capacity to support business interests . Prioritized organizational initiatives to COVID-19 Mitigating Action (as of April 15, 2020) support PPP rollout CARES Act / PPP Modifications . To date, successfully approved 3/31/2020 Requested Processing >2,600 PPP applications totaling Outstanding # $MM # $MM $1.5BN Segments CARES Arizona $3,960 1,040 $393 68 $135 Act . See significant benefits for larger customers under the Main Street Nevada $2,297 525 $250 51 $162 Relief Lending Program No Cal $1,429 483 $369 5 $17 So Cal $2,263 450 $213 3 $5 NBLs $13,217 295 $365 3 $11 Total $23,166 2,794 $1,589 130 $330 4 4
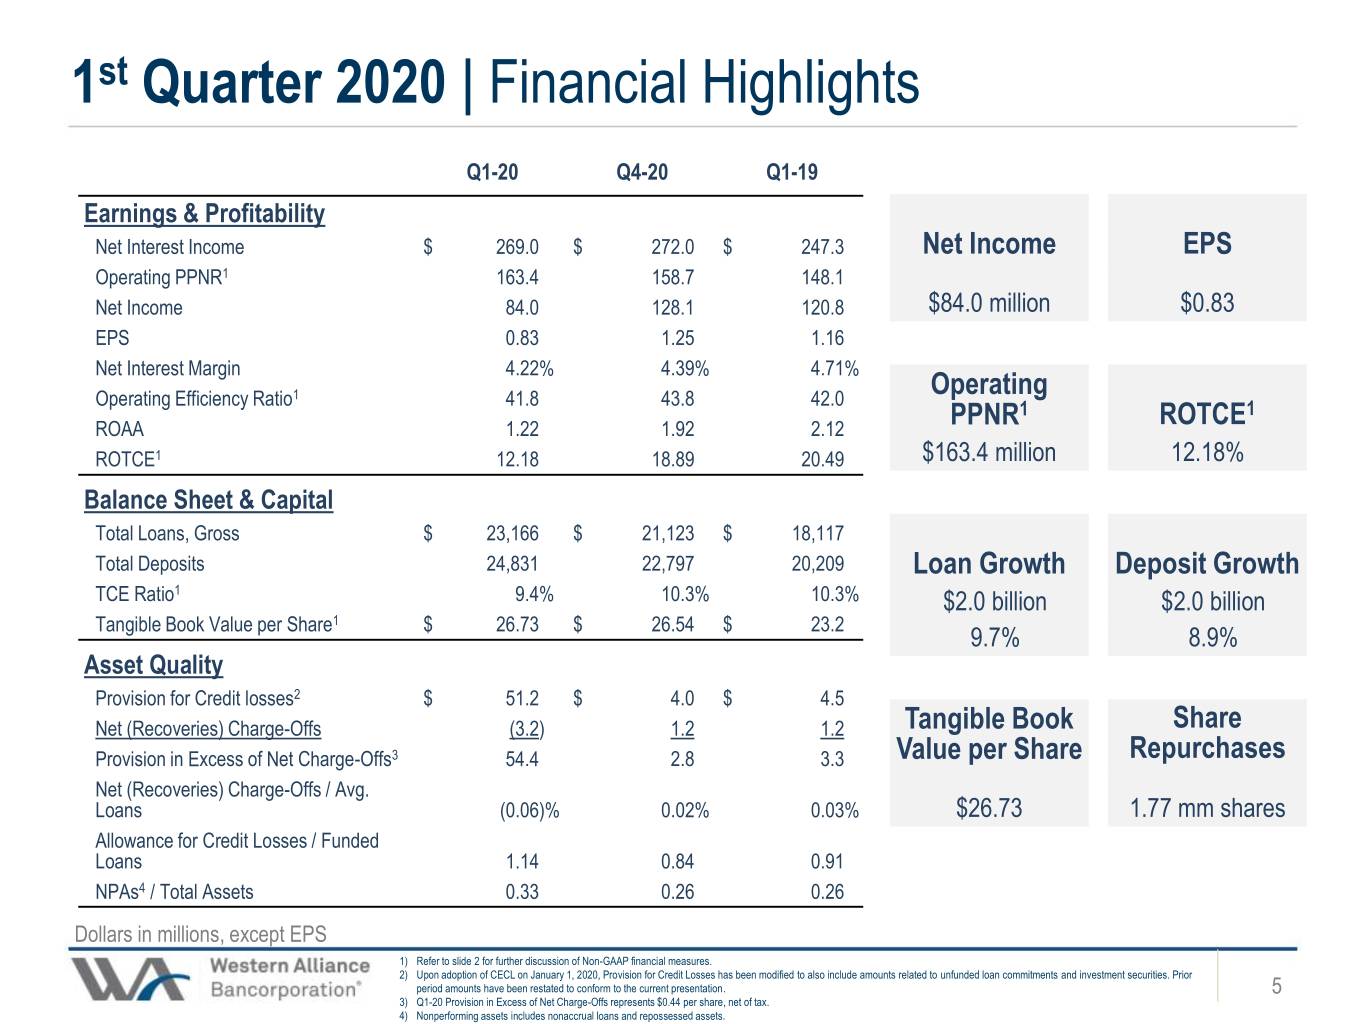
1st Quarter 2020 | Financial Highlights Q1-20 Q4-20 Q1-19 Earnings & Profitability Net Interest Income $ 269.0 $ 272.0 $ 247.3 Net Income EPS Operating PPNR1 163.4 158.7 148.1 Net Income 84.0 128.1 120.8 $84.0 million $0.83 EPS 0.83 1.25 1.16 Net Interest Margin 4.22% 4.39% 4.71% 1 Operating Operating Efficiency Ratio 41.8 43.8 42.0 1 1 ROAA 1.22 1.92 2.12 PPNR ROTCE ROTCE1 12.18 18.89 20.49 $163.4 million 12.18% Balance Sheet & Capital Total Loans, Gross $ 23,166 $ 21,123 $ 18,117 Total Deposits 24,831 22,797 20,209 Loan Growth Deposit Growth TCE Ratio1 9.4% 10.3% 10.3% $2.0 billion $2.0 billion Tangible Book Value per Share1 $ 26.73 $ 26.54 $ 23.2 9.7% 8.9% Asset Quality Provision for Credit losses2 $ 51.2 $ 4.0 $ 4.5 Net (Recoveries) Charge-Offs (3.2) 1.2 1.2 Tangible Book Share Provision in Excess of Net Charge-Offs3 54.4 2.8 3.3 Value per Share Repurchases Net (Recoveries) Charge-Offs / Avg. Loans (0.06)% 0.02% 0.03% $26.73 1.77 mm shares Allowance for Credit Losses / Funded Loans 1.14 0.84 0.91 NPAs4 / Total Assets 0.33 0.26 0.26 5 Dollars in millions, except EPS 1) Refer to slide 2 for further discussion of Non-GAAP financial measures. 2) Upon adoption of CECL on January 1, 2020, Provision for Credit Losses has been modified to also include amounts related to unfunded loan commitments and investment securities. Prior period amounts have been restated to conform to the current presentation. 5 3) Q1-20 Provision in Excess of Net Charge-Offs represents $0.44 per share, net of tax. 4) Nonperforming assets includes nonaccrual loans and repossessed assets.

Quarterly Consolidated Financial Results Q1-20 Q4-19 Q1-19 Q1 2020 Highlights Interest Income $ 307.2 $ 315.4 $ 291.2 • Net Interest Income decreased Interest Expense (38.2) (43.4) (43.8) $3.0MM primarily as a result of Net Interest Income $ 269.0 $ 272.0 $ 247.3 decreased yields on loans and one less day in the quarter, partially offset Operating Non-Interest Income 16.3 15.5 12.6 by lower rates on deposits and interest Net Operating Revenue1 $ 285.3 $ 287.5 $ 259.9 expense on borrowings Salaries and Employee Benefits 72.1 73.9 68.6 • Provision for Credit Losses increased Deposit Costs 7.3 6.8 5.7 $47.2MM due to adoption of CECL Other 42.5 48.1 37.5 and emerging risks in the pandemic Operating Non-Interest Expense1 $ (121.9) $ (128.8) $ (111.8) crisis Operating Pre-Provision Net Revenue1 $ 163.4 $ 158.7 $ 148.1 • Operating PPNR increased $4.7MM Provision for Credit Losses2 (51.2) (4.0) (4.5) primarily as a result of a decrease in (Loss) Gain on Sales & Valuation of operating expenses Assets (9.8) (0.5) 2.7 • Loss on Sales and Valuation of Assets Pre-Tax Income $ 102.4 $ 154.3 $ 146.3 consists of FMV losses of $10.4MM on Income Tax (18.5) (26.2) (25.5) equity securities and $0.9MM on HFS Net Income $ 84.0 $ 128.1 $ 120.8 loans, partially offset by a $1.5MM gain on sale of OREO Diluted Shares 101.7 102.1 104.5 • Diluted shares decreased 1.7% as a Earnings Per Share $ 0.83 $ 1.25 $ 1.16 result of opportunistic share repurchases 6 Dollars in millions, except EPS 1) Refer to slide 2 for further discussion of Non-GAAP financial measures. 2) Upon adoption of CECL on January 1, 2020, Provision for Credit Losses has been modified to also include amounts related to unfunded 6 loan commitments and investment securities. Prior period amounts have been restated to conform to the current presentation.

CECL and Allowance for Credit Losses (“ACL”) ACL Reserve Build Q1 2020 Highlights • CECL adoption impact of $37MM comprised of ACL for Loans, Unfunded Loan Commitments and HTM Securities, $19.1MM, $15.1MM and $2.6MM, respectively − Capital impact related to CECL adoption is phased in over 5 Q4-19 Adoption 1/1/2020 Balance Sheet Outlook Q1-20 years Impact Growth Adjustment & Other • Provision expense of $51.2MM for Allowance for Credit Losses Q1, mainly driven by balance sheet $300 $268 growth ($24MM) and change in $3 $250 $30 macroeconomic outlook ($30MM), $214 $3 offset by net recoveries of $3.2MM $200 $177 $180 $181 $184 $24 $7 $7 $11 ACL $13 $9 $9 $9 • ACL balance of $268MM at Q1-20, $150 $9 an increase of $54MM, driven by $235 $100 $187 the provision expense and $3.2MM $155 $160 $165 $168 $50 of net recoveries $0 Q1-19 Q2-19 Q3-19 Q4-19 1/1/2020 Q1-20 Allowance for Loan & Lease Losses Unfunded Loan Commits. 1 Credit Discounts HTM Securities 7 Dollars in millions 1) Included as a component of other liabilities on the balance sheet 7

Net Interest Drivers Total Investments and Yield Loans and Yield Q1 2020 Highlights Spot Spot • Loan yields decreased 31 Rate Rate bps points following 2.95% 5.02% declines across most loan types, mainly driven by a decline in LIBOR and a flattening yield curve • Cost of interest-bearing deposits decreased 18 bps due to repricing efforts in a lower rate environment, Interest Bearing Deposits Deposits, Borrowings, and driving total cost of funds and Cost Cost of Liability Funding down 11 bps to 0.64% • Decline from Q1-20 cost of interest-bearing deposits to Spot Rate a spot rate of 48 bps (spot Spot 0.48% Rate rate of 0.29%, including 0.37% non-interest DDA) driven by posted rate changes and pushing out high cost deposits 8 Dollars in billions, unless otherwise indicated Non-Interest Bearing Deposits Total Borrowings 8
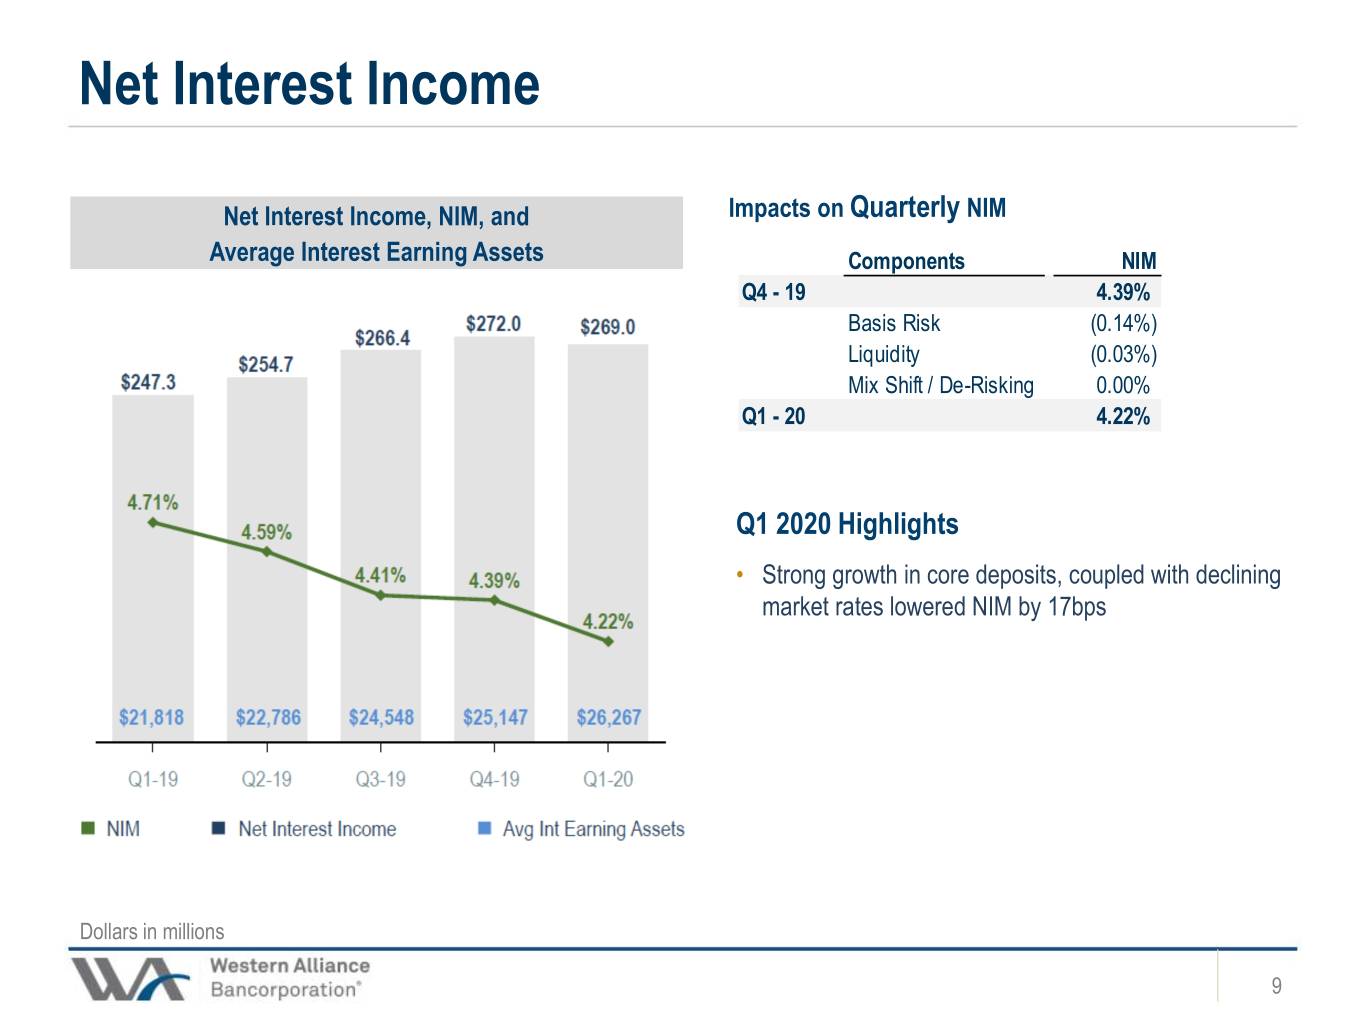
Net Interest Income Net Interest Income, NIM, and Impacts on Quarterly NIM Average Interest Earning Assets Components NIM Q4 - 19 4.39% Basis Risk (0.14%) Liquidity (0.03%) Mix Shift / De-Risking 0.00% Q1 - 20 4.22% Q1 2020 Highlights • Strong growth in core deposits, coupled with declining market rates lowered NIM by 17bps Dollars in millions 9 9
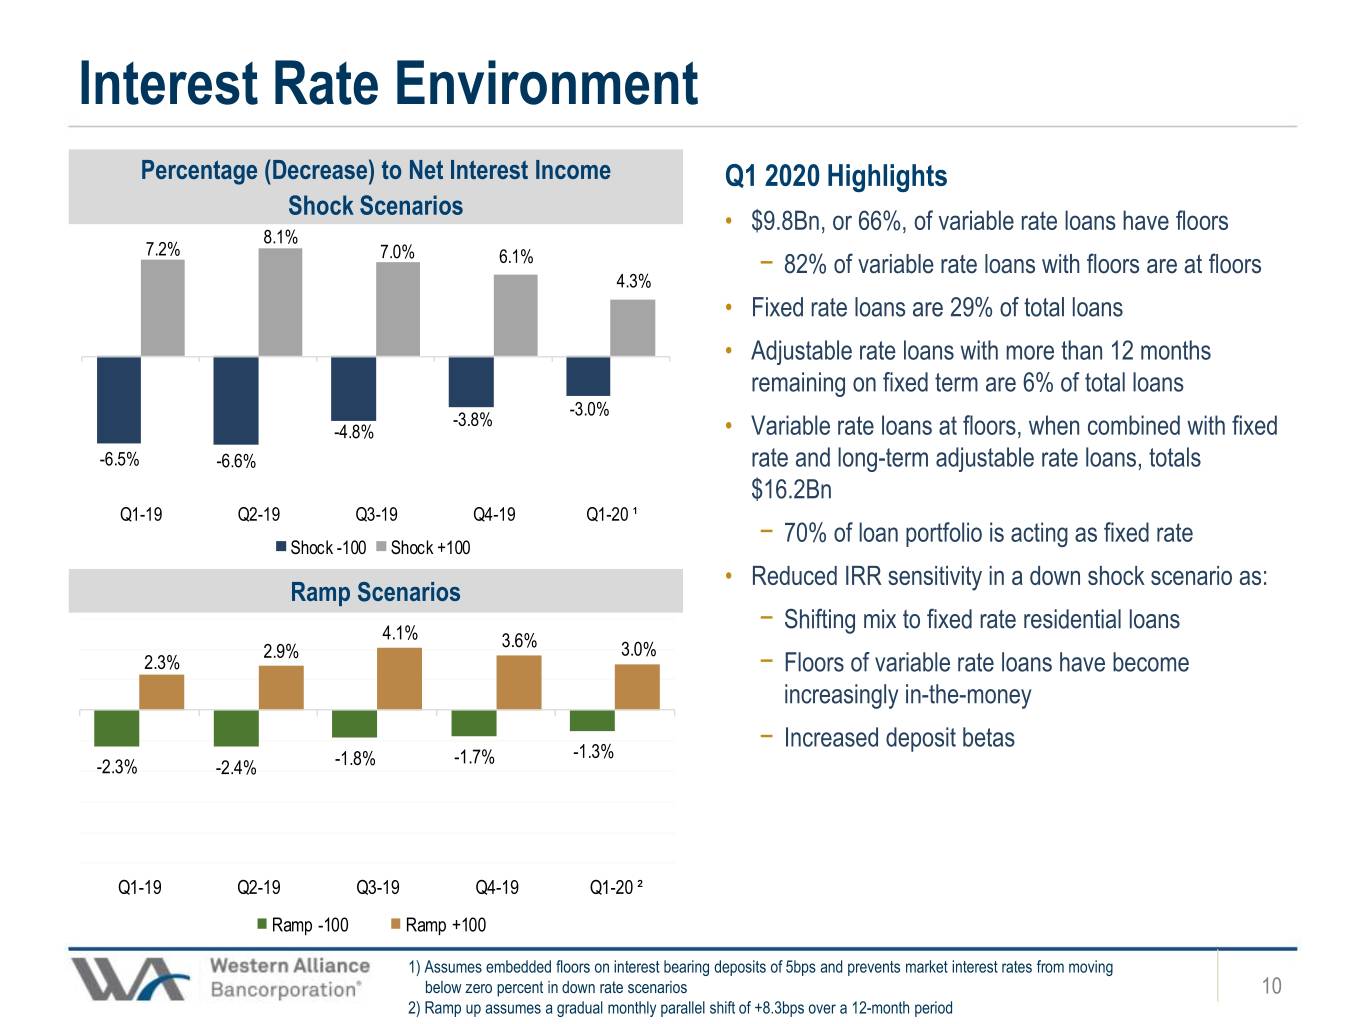
Interest Rate Environment Percentage (Decrease) to Net Interest Income Q1 2020 Highlights Shock Scenarios • $9.8Bn, or 66%, of variable rate loans have floors 8.1% 7.2% 7.0% 6.1% − 82% of variable rate loans with floors are at floors 4.3% • Fixed rate loans are 29% of total loans • Adjustable rate loans with more than 12 months remaining on fixed term are 6% of total loans -3.0% -3.8% -4.8% • Variable rate loans at floors, when combined with fixed -6.5% -6.6% rate and long-term adjustable rate loans, totals $16.2Bn Q1-19 Q2-19 Q3-19 Q4-19 Q1-20 ¹ − 70% of loan portfolio is acting as fixed rate Shock -100 Shock +100 • Reduced IRR sensitivity in a down shock scenario as: Ramp Scenarios − Shifting mix to fixed rate residential loans 4.1% 3.6% 2.9% 3.0% 2.3% − Floors of variable rate loans have become increasingly in-the-money − Increased deposit betas -1.7% -1.3% -2.3% -2.4% -1.8% Q1-19 Q2-19 Q3-19 Q4-19 Q1-20 ² Ramp -100 Ramp +100 10 1) Assumes embedded floors on interest bearing deposits of 5bps and prevents market interest rates from moving below zero percent in down rate scenarios 1010 2) Ramp up assumes a gradual monthly parallel shift of +8.3bps over a 12-month period

Operating Expenses and Efficiency1 Operating Expenses and Efficiency Ratio Q1 2020 Highlights • The operating efficiency ratio1 decreased 200 basis points to 41.8% compared to the prior quarter and 20 basis points over the same period last year • Improved efficiency was driven by a decrease in compensation and other non-interest expenses 11 Dollars in millions 1) Refer to slide 2 for further discussion of Non-GAAP financial measures. 1111 11
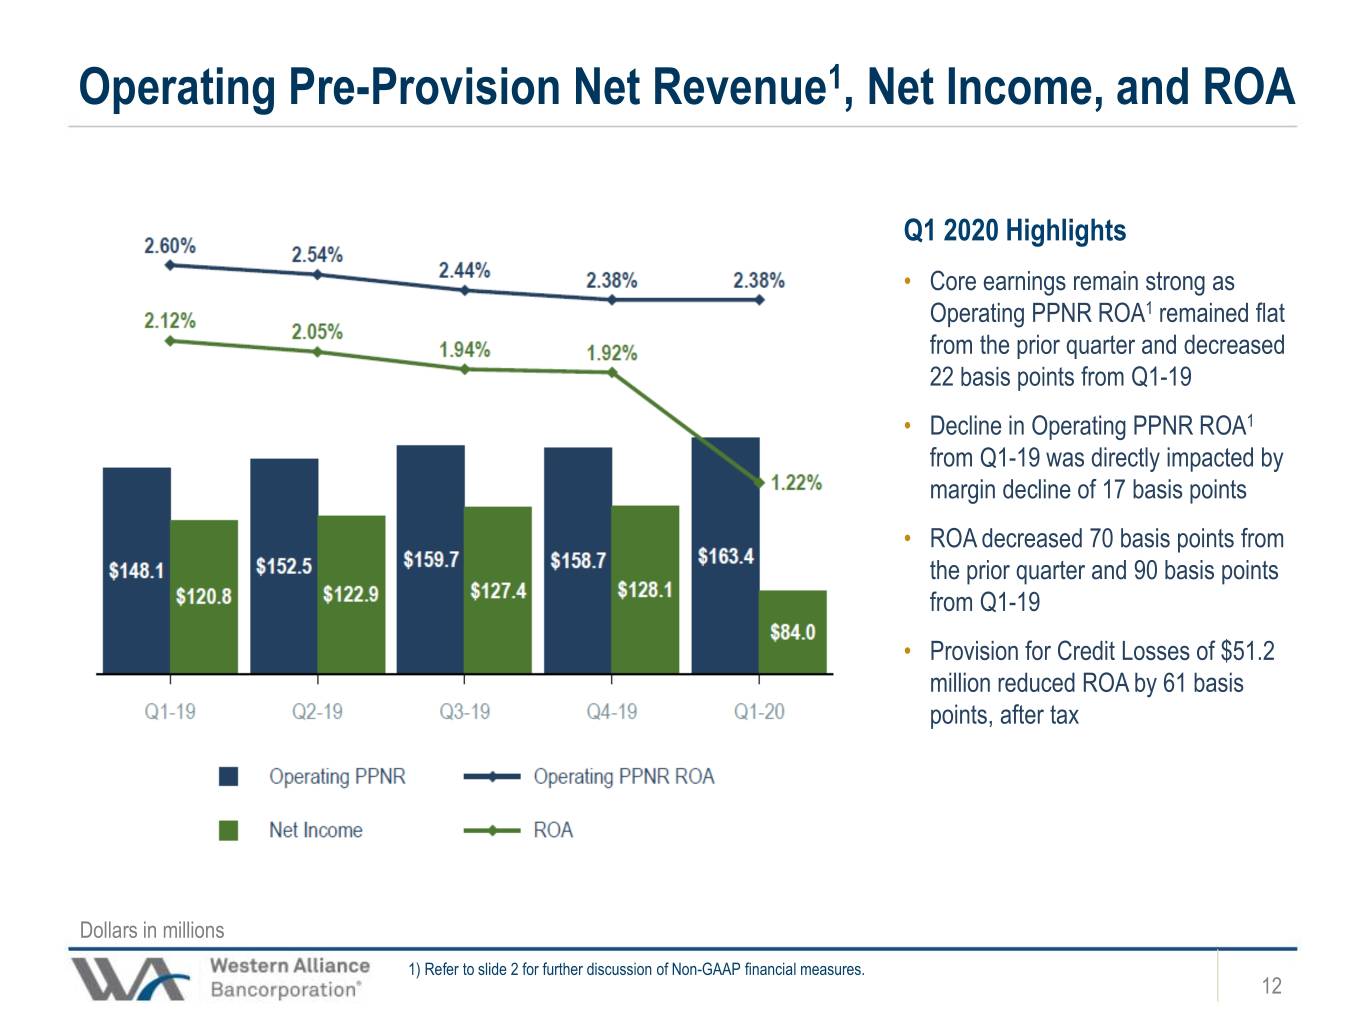
Operating Pre-Provision Net Revenue1, Net Income, and ROA Q1 2020 Highlights • Core earnings remain strong as Operating PPNR ROA1 remained flat from the prior quarter and decreased 22 basis points from Q1-19 • Decline in Operating PPNR ROA1 from Q1-19 was directly impacted by margin decline of 17 basis points • ROA decreased 70 basis points from the prior quarter and 90 basis points from Q1-19 • Provision for Credit Losses of $51.2 million reduced ROA by 61 basis points, after tax Dollars in millions 12 1) Refer to slide 2 for further discussion of Non-GAAP financial measures. 1212
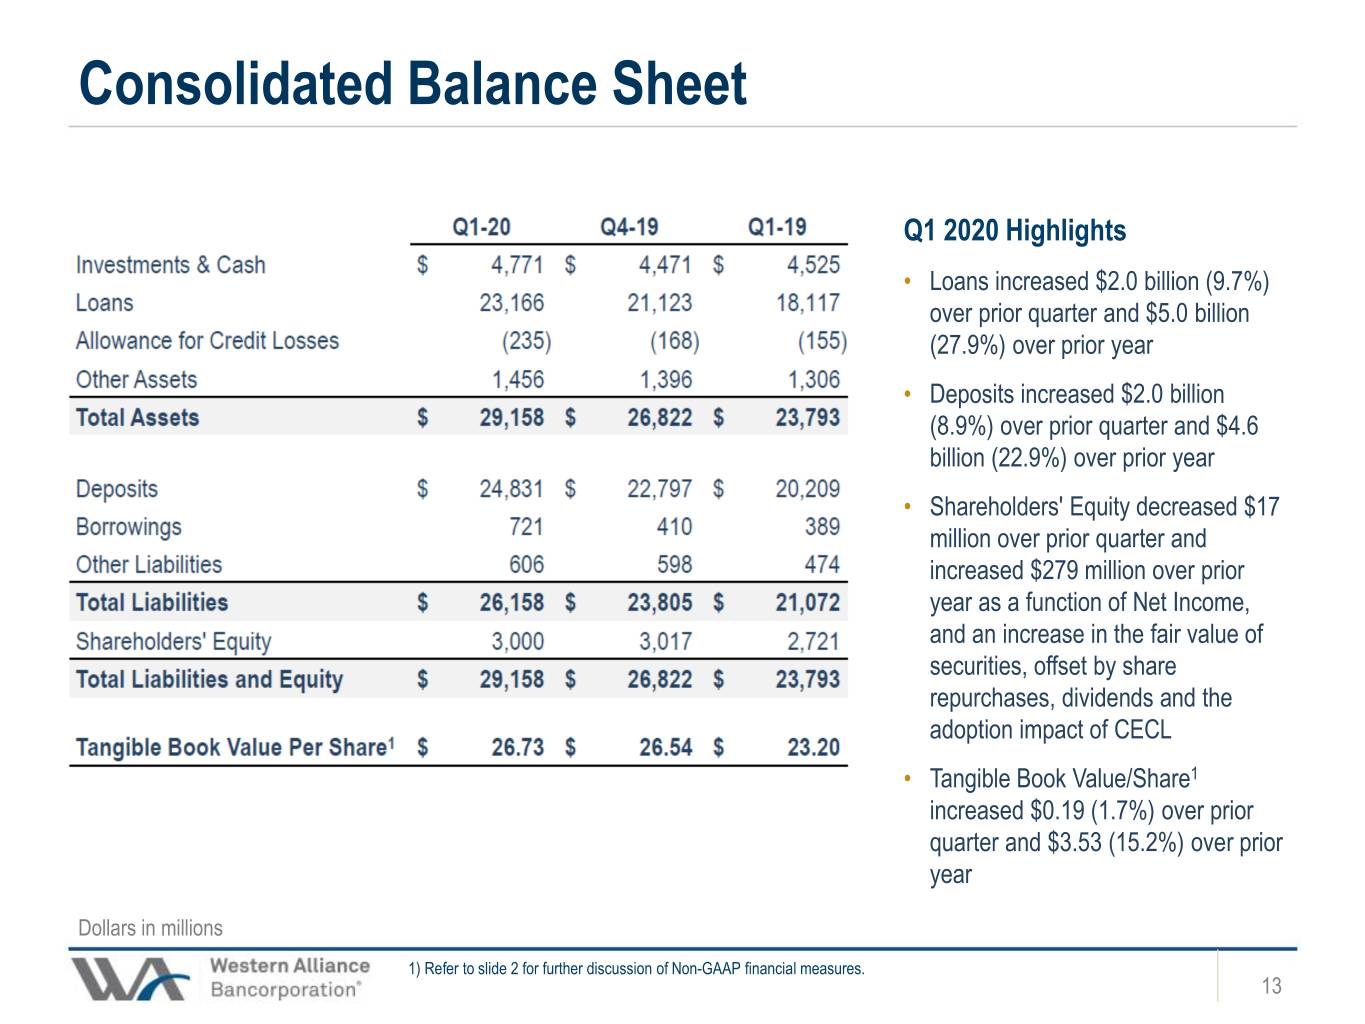
Consolidated Balance Sheet Q1 2020 Highlights • Loans increased $2.0 billion (9.7%) over prior quarter and $5.0 billion (27.9%) over prior year • Deposits increased $2.0 billion (8.9%) over prior quarter and $4.6 billion (22.9%) over prior year • Shareholders' Equity decreased $17 million over prior quarter and increased $279 million over prior year as a function of Net Income, and an increase in the fair value of securities, offset by share repurchases, dividends and the adoption impact of CECL • Tangible Book Value/Share1 increased $0.19 (1.7%) over prior quarter and $3.53 (15.2%) over prior year Dollars in millions 13 1) Refer to slide 2 for further discussion of Non-GAAP financial measures. 1313

Five Quarter Deposit Growth and Composition $4.6 Billion Year Over Year Growth Highlights Total Deposits $20.2 $21.4 $22.4 $22.8 $24.8 Qtr. Change +$1.0 +$1.2 +$1.0 +$0.4 +$2.0 Quarter-over-quarter deposit growth of $2.0 billion driven by (in millions): Non-Interest Bearing DDA $ 1,349 Interest Bearing DDA 818 CDs 10 Offset by decreases in: Savings and MMDA (143) Total $ 2,034 Year-over-year deposit growth of $4.6 billion driven by all deposit types (in millions): Non-Interest Bearing DDA $ 2,207 Savings and MMDA 1,180 Interest-Bearing DDA 1,079 CDs 156 Total $ 4,622 Dollars in billions, unless otherwise indicated 14 1414
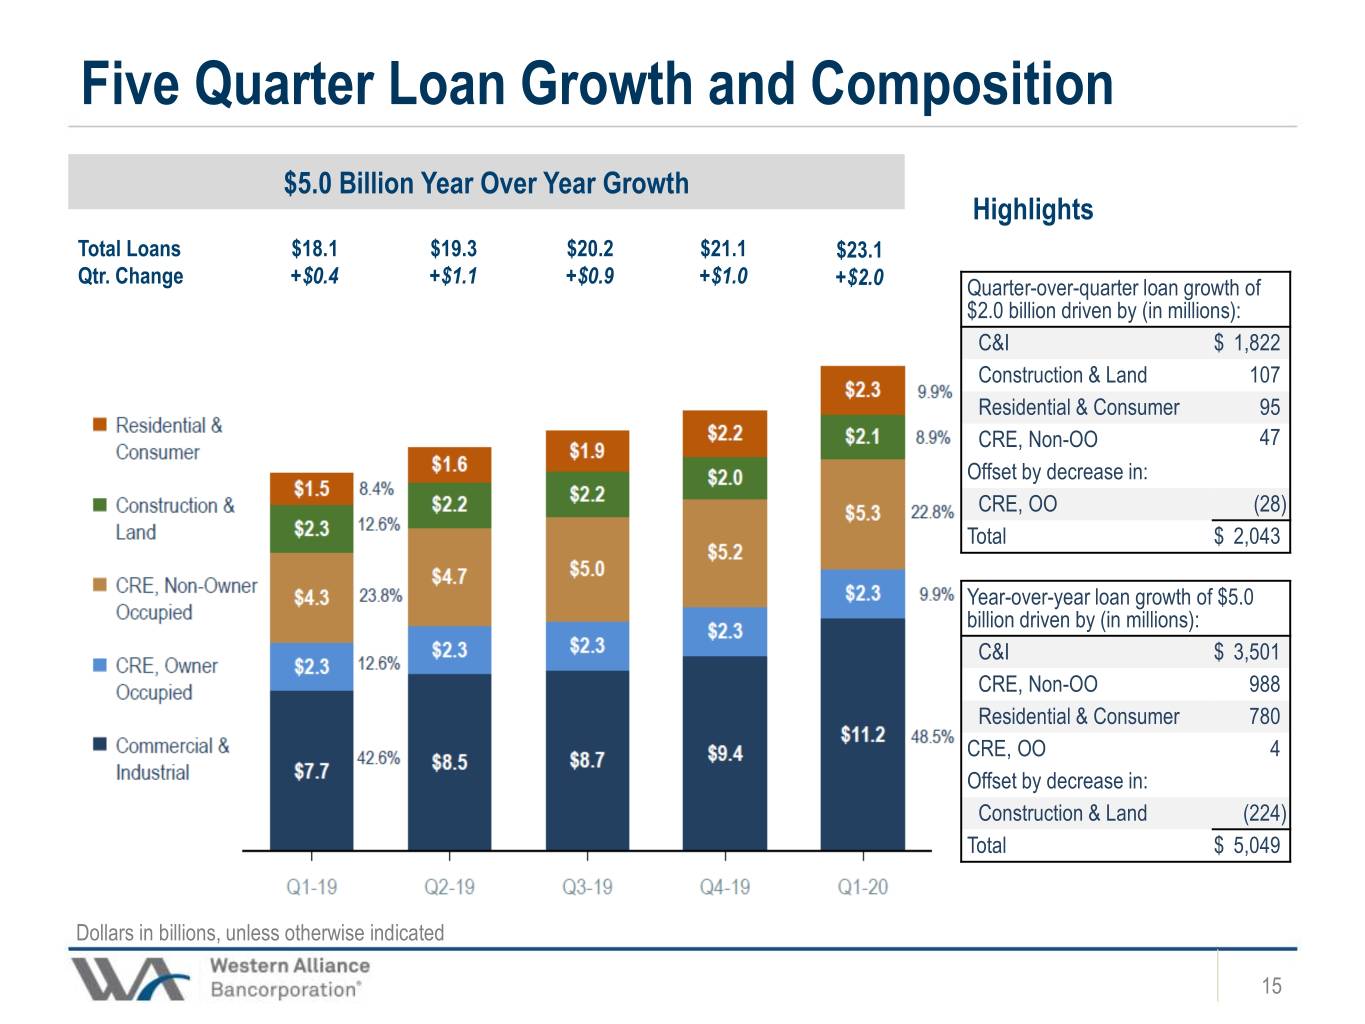
Five Quarter Loan Growth and Composition $5.0 Billion Year Over Year Growth Highlights Total Loans $18.1 $19.3 $20.2 $21.1 $23.1 Qtr. Change +$0.4 +$1.1 +$0.9 +$1.0 +$2.0 Quarter-over-quarter loan growth of $2.0 billion driven by (in millions): C&I $ 1,822 Construction & Land 107 Residential & Consumer 95 CRE, Non-OO 47 Offset by decrease in: CRE, OO (28) Total $ 2,043 Year-over-year loan growth of $5.0 billion driven by (in millions): C&I $ 3,501 CRE, Non-OO 988 Residential & Consumer 780 CRE, OO 4 Offset by decrease in: Construction & Land (224) Total $ 5,049 15 Dollars in billions, unless otherwise indicated 1515

Adversely Graded Loans and Non-Performing Assets Adversely Graded Loans and OREO Q1 2020 Highlights $500 • Total Adversely Graded Loans plus OREO of $351MM (1.20% to Total Assets) increased $10MM in Q1 $450 $439 $399 • NPAs of $97MM (33bps to Total Assets) increased $400 $27MM in Q1 primarily due to HFS loan moving to non- $351 $358 $341 accrual status $350 $234 $300 $198 $134 $104 Asset Quality Ratios $250 $180 2.00% Adversely $200 Graded Loans $150 1.50% 1.67% $150 1.50% 1.58% $162 $131 $139 $91 1.00% 1.27% $100 1.20% 0.27% 0.25% 0.26% 0.33% $50 $86 0.50% 0.26% $44 $52 $50 $56 NPAs $16 $14 $11 $0 $18 $18 0.00% Q1-19 Q2-19 Q3-19 Q4-19 Q1-20 Q1-19 Q2-19 Q3-19 Q4-19 Q1-20 Adversely Graded Loans and OREO to Total Assets OREO Non-Performing Loans 1 NPAs to Total Assets Classified Accruing Loans Special Mention Loans Dollars in millions 16 1) Includes HFS loans 1616
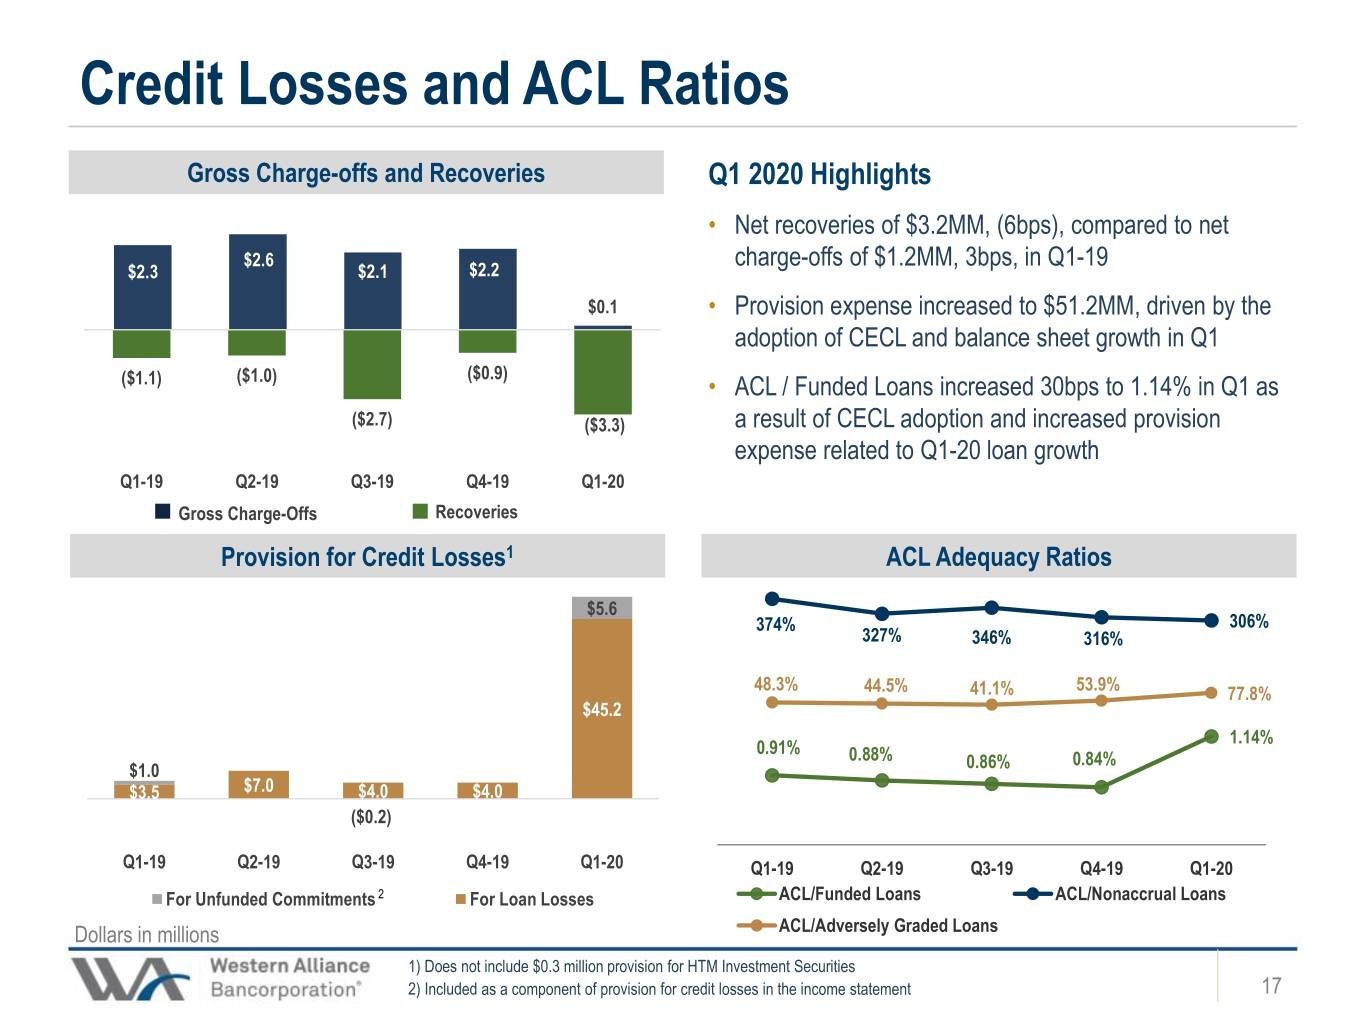
Credit Losses and ACL Ratios Gross Charge-offs and Recoveries Q1 2020 Highlights $3.0 • Net recoveries of $3.2MM, (6bps), compared to net $3.0$2.0 $2.6 charge-offs of $1.2MM, 3bps, in Q1-19 $2.3 $2.1 $2.2 $1.0 $1.0 $0.1 • Provision expense increased to $51.2MM, driven by the $0.0 adoption of CECL and balance sheet growth in Q1 ($1.0) -$1.0 ($0.9) ($1.1) ($1.0) • ACL / Funded Loans increased 30bps to 1.14% in Q1 as ($3.0)-$2.0 ($2.7) ($3.3) a result of CECL adoption and increased provision -$3.0 ($5.0) expense related to Q1-20 loan growth -$4.0 Q1-19 Q2-19 Q3-19 Q4-19 Q1-20 Gross Charge-Offs Recoveries Provision for Credit Losses1 ACL Adequacy Ratios 2.00% 400% $5.6 374% 306% 327% 346% 316% 200% 1.50% 48.3% 53.9% 44.5% 41.1% 77.8% $45.2 0% 1.14% 0.91% 0.88% 0.84% $1.0 1.00% 0.86% $3.5 $7.0 $4.0 $4.0 -200% ($0.2) 0.50% -400% Q1-19 Q2-19 Q3-19 Q4-19 Q1-20 Q1-19 Q2-19 Q3-19 Q4-19 Q1-20 For Unfunded Commitments 2 For Loan Losses ACL/Funded Loans ACL/Nonaccrual Loans 17 Dollars in millions ACL/Adversely Graded Loans 1) Does not include $0.3 million provision for HTM Investment Securities 2) Included as a component of provision for credit losses in the income statement 1717
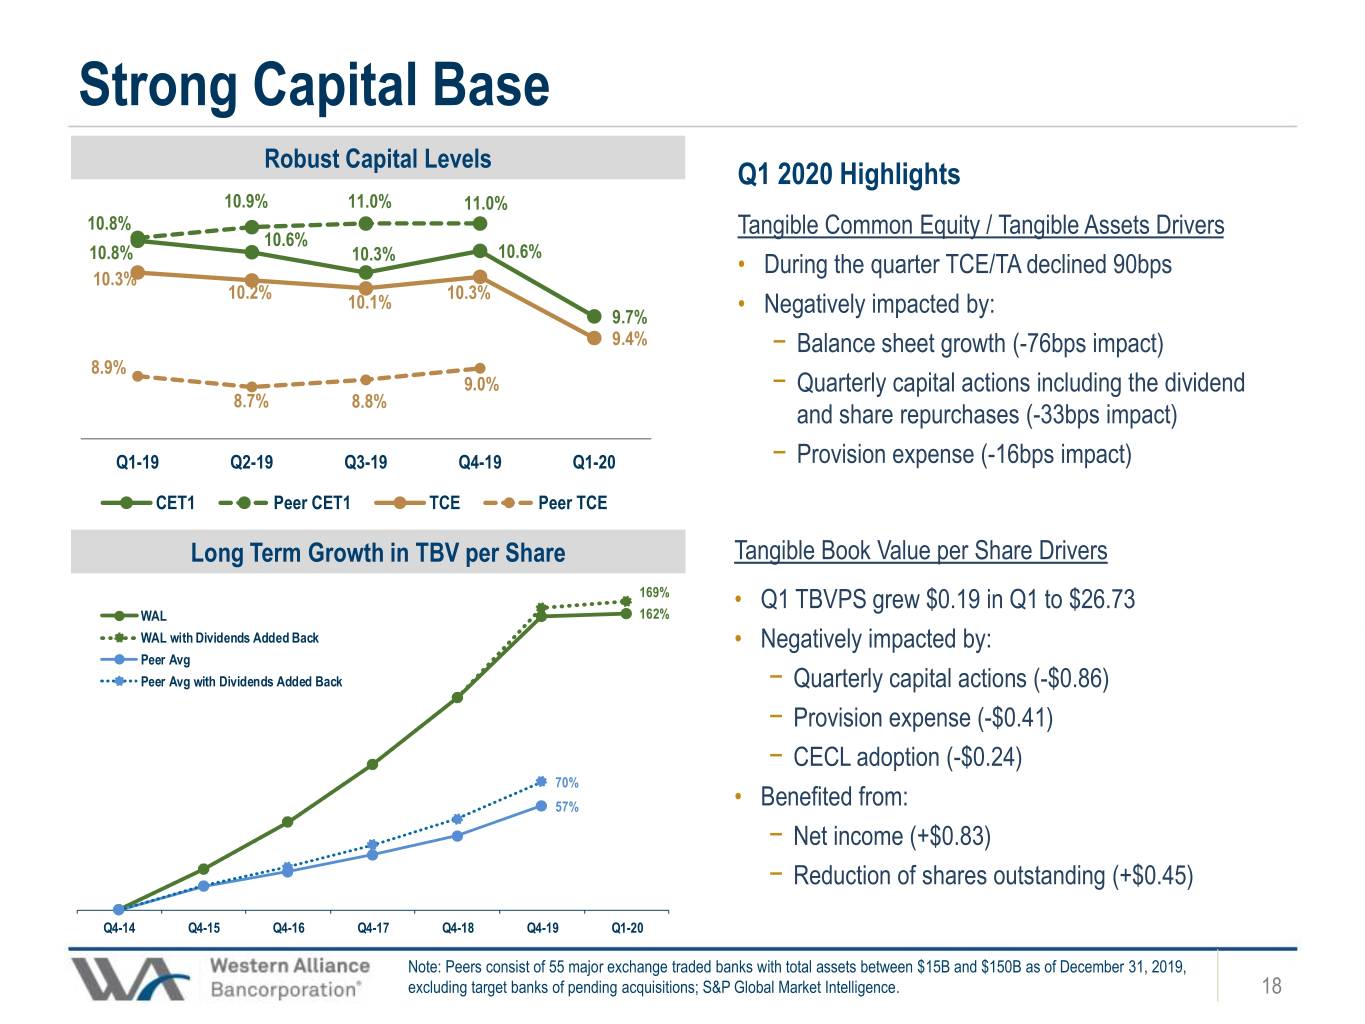
Strong Capital Base Robust Capital Levels Q1 2020 Highlights 10.9% 11.0% 11.0% 10.8% Tangible Common Equity / Tangible Assets Drivers 10.6% 10.8% 10.3% 10.6% • During the quarter TCE/TA declined 90bps 10.3% 10.2% 10.3% 10.1% 9.7% • Negatively impacted by: 9.4% − Balance sheet growth (-76bps impact) 8.9% 9.0% − Quarterly capital actions including the dividend 8.7% 8.8% and share repurchases (-33bps impact) Q1-19 Q2-19 Q3-19 Q4-19 Q1-20 − Provision expense (-16bps impact) CET1 Peer CET1 TCE Peer TCE Long Term Growth in TBV per Share Tangible Book Value per Share Drivers 169% • Q1 TBVPS grew $0.19 in Q1 to $26.73 WAL 162% WAL with Dividends Added Back • Negatively impacted by: Peer Avg Peer Avg with Dividends Added Back − Quarterly capital actions (-$0.86) − Provision expense (-$0.41) − CECL adoption (-$0.24) 70% 57% • Benefited from: − Net income (+$0.83) − Reduction of shares outstanding (+$0.45) Q4-14 Q4-15 Q4-16 Q4-17 Q4-18 Q4-19 Q1-20 18 Note: Peers consist of 55 major exchange traded banks with total assets between $15B and $150B as of December 31, 2019, excluding target banks of pending acquisitions; S&P Global Market Intelligence. 1818

Ample Liquidity Access Liquidity Access Investment Portfolio • Loan growth funded through core deposits • Total Carrying Value of Investment Portfolio ($4.7Bn) • Access to $10Bn of liquidity • 96.3% of the rated portfolio is investment grade • $7.0Bn in unused borrowing capacity Corporates, − Federal Reserve: $1.3Bn Preferreds, Other, 1.9% 1.7% − FHLB: $4.3Bn Agency 2.7% CMBS, 2.2% − Correspondent banks: $1.4Bn Low Income • $2.6Bn unpledged marketable securities Housing Tax Credit, 8.0% • Cash of $416MM Agency MBS/ CMOs, Low Income 31.7% Housing Tax Exempt, 10.9% Munis, 15.9% Private Label CMOs, 25.0% 19 1919

Hotel Franchise Finance Overview Financial flexibility is maximized through deep industry expertise, strong operating partners, and conservative underwriting structure Hotels By Product Q1 2020 Highlights As of 3/31/2020 • Direct dialogue with sophisticated sponsors drives plan to # of Avg. conserve cash and fund operations ($ in million) Hotels Commitment Outstanding Outstanding • 65% LTC discipline supports thoughtful structures through CRE Investor (Term Loan) 163 $1,881 $1,810 $11.1 the trough 1 Proj. Improvements (PIPs) N/A $122 $23 $0.8 • $1.98Bn (8.5%) of loan portfolio Construction 12 $297 $126 $10.7 • Q1 total net loan growth of $48MM C&I 0 $25 $19 $19.0 • PIPs and Construction loans allow checkpoint on draws Total 175 $2,325 $1,978 $11.3 Conservative underwriting provides meaningful cash flow cushion; focused on Loan-to-Cost Geographic Diversification DSCR Debt Yield LTV Weighted Avg.: 1.9x 11.3% 60.7% AZ, 11% CA, 6% 22.1% • 52% of >12% States <3%, ≥1.60x 26% commitments 51.8% 10% - 12.0% <65% NY, 7% 1.30x - 1.59x in Top 25 9.25% - 9.99% 72.6% 1.00x - 1.29x 41.2% GA, 7% MSAs 65% - 75% MA, 3% < 9.25% <1.0x PA, 4% • 70% in Top 50 Const. Const. 21.4% 7.9% >75% MSAs LA, 4% FL, 6% N/A N/A 7.1% 20.5% IL, 4% TX, 6% 7.9% 26.3% NJ, 4% TN, 5% 6.3% 6.3% IN, 4% MI, 5% 20 5.4% 5.4% 1.1% 1) PIP notes are always part of a larger hotel term loan facility; therefore, 28 hotels with PIPs are included in CRE Investor 2020

Technology & Innovation Overview Primarily focused on established growth companies with successful products and strong investor support, which provides greater operating and financial flexibility Tech. & Innovation Loans by Segment Q1 2020 Highlights Subscription & • $2.1bn (8.9%) of loan portfolio Capital Call Lines • Q1 total net loan growth of $502MM 21% − 73% in Technology; $176MM attributed to LOC Legacy Solar 4% drawdowns Life Technology − 25% subscription and capital call lines Sciences 66% 9% • Total portfolio commitments grew 9.1% to $3.4Bn in Q1 • Total portfolio utilization increased to 59.8% from Technology Lending 49.3% Stage 1 • Warrant income totaled $1.1MM in Q1 3% Cash Flow • There were no Tech & Innovation charge-offs or Stage 3 6% Other 15% 13% recoveries in Q1 2020 Working Venture • Seeing continued Sponsor support Capital Debt 7% 43% Stage 2 Recurring 82% Revenue 31% Note: Stage 1: Early stage/emerging growth companies with at least $5MM in sales. Stage 2: Later stage growth companies; typically have had multiple rounds of investment, a successful product introduction, sufficient revenues to demonstrate product acceptance, and a path to 21 profitability. Stage 3: Public or privately held; financial statements show history of profits to cover debt and capex obligations.
Management Outlook • Pre-Provision Net Revenue • Asset Quality • Capital and Liquidity 22 2222

Questions and Answers 2323
