Attached files
| file | filename |
|---|---|
| EX-99.1 - EXHIBIT 99.1 - RITE AID CORP | tm2015873d1_ex99-1.htm |
| 8-K - FORM 8-K - RITE AID CORP | tm2015873-1_8k.htm |
Exhibit 99.2

April 16, 2020 Supplemental Presentation Fourth Quarter Fiscal 2020
Cautionary Statement Regarding Forward Looking Statements Statements in this presentation that are not historical, are forward - looking statements made pursuant to the safe harbor provisions of the Private Securities Litigation Reform Act of 1995 . Such statements include, but are not limited to, statements regarding Rite Aid’s outlook and guidance for fiscal 2021 ; the impact of the recent global coronavirus (“COVID - 19 ”) ; and any assumptions underlying any of the foregoing . Words such as “anticipate,” “believe,” “continue,” “could,” “estimate,” “expect,” “intend,” “may,” “plan,” “predict,” “project,” “should,” and “will” and variations of such words and similar expressions are intended to identify such forward - looking statements . These forward - looking statements are not guarantees of future performance and involve risks, assumptions and uncertainties, including, but not limited to : the impact of the COVID - 19 pandemic on our workforce, operations, stores, expenses and supply chain, and the operations of our customers, suppliers and business partners ; our ability to successfully implement our new business strategy (including any delays as a result of COVID - 19 ) and improve the operating performance of our stores ; our high level of indebtedness and our ability to satisfy our obligations and the other covenants contained in our debt agreements ; general competitive, economic, industry, market, political (including healthcare reform), and regulatory conditions, as well as factors specific to the markets in which we operate ; the impact of private and public third - party payers continued reduction in prescription drug reimbursements and efforts to encourage mail order ; our ability to manage expenses and our investments in working capital ; our ability to achieve the benefits of our efforts to reduce the costs of our generic and other drugs ; outcomes of legal and regulatory matters ; our ability to partner and have relationships with health plans and health systems ; risks related to the pending sale of the remaining Rite Aid distribution center and related assets to WBA, including the possibility that the transaction may not close ; and the continued integration of our new senior management team and our ability to realize the benefits from our organizational restructuring . These and other risks, assumptions and uncertainties are more fully described in Item 1 A (Risk Factors) of our most recent Annual Report on Form 10 - K and in other documents that we file or furnish with the Securities and Exchange Commission (the “SEC”), which you are encouraged to read . Should one or more of these risks or uncertainties materialize, or should underlying assumptions prove incorrect, actual results may vary materially from those indicated or anticipated by such forward - looking statements . Accordingly, you are cautioned not to place undue reliance on these forward - looking statements, which speak only as of the date they are made . The degree to which COVID - 19 may affect Rite Aid’s results and operations, including its ability to achieve its outlook for fiscal 2021 , will depend on future developments, which are highly uncertain, including, but not limited to, the duration and spread of the outbreak, its severity, the actions to contain the virus or treat its impact (including travel bans and restrictions, quarantines, shelter - in - place orders and shutdowns), and how quickly and to what extent normal economic and operating conditions can resume . As a result, the impact on Rite Aid’s financial and operating results cannot be reasonably estimated with specificity at this time, but the impact could be material . Additionally, the impact of COVID - 19 could heighten many of the risk factors described in our Annual Report on Form 10 - K . Rite Aid expressly disclaims any current intention to update publicly any forward - looking statement after the distribution of this presentation, whether as a result of new information, future events, changes in assumptions or otherwise . Safe Harbor Statement 2
Cautionary Note Regarding Pro Forma Information The following presentation provides certain pro forma information regarding the impact of Rite Aid’s pending sale of a distribution center and assets to WBA on Rite Aid’s results of operations and capital structure . The pro forma information is for illustrative purposes only, was prepared by management in response to investor inquiries and is based upon a number of assumptions . The pro forma information assumes the completion of all the asset sales when they actually take place over an extended period of time . Additional items that may require adjustments to the pro forma information may be identified and could result in material changes to the information contained herein . The information in this presentation is not necessarily indicative of what actual financial results of Rite Aid would have been had the sale occurred on the dates or for the periods indicated, nor does it purport to project the financial results of Rite Aid for any future periods or as of any date . Such pro forma information has not been prepared in conformity with Regulation S - X . Rite Aid’s independent auditors have not audited, reviewed, compiled or performed any procedures with respect to this preliminary financial information . Accordingly, they do not express an opinion or provide any form of assurance with respect thereto . The information in this presentation should not be viewed in replacement of results prepared in compliance with Generally Accepted Accounting Principles or any pro forma financial statements subsequently required by the rules and regulations of the SEC . Safe Harbor Statement (cont.) 3
The following presentation includes the non - GAAP financial measures, Adjusted EBITDA, Adjusted Net Income (Loss), Adjusted Net Income (Loss) per Diluted Share, Adjusted EBITDA Gross Profit and Adjusted EBITDA SG&A . Rite Aid defines Adjusted EBITDA as net income (loss) excluding the impact of income taxes, interest expense, depreciation and amortization, LIFO adjustments, charges or credits for facility closing and impairment, goodwill and intangible asset impairment charges, inventory write - downs related to store closings, gains or losses on debt retirements, the WBA merger termination fee, and other items (including stock - based compensation expense, merger and acquisition - related costs, a non - recurring litigation settlement, severance, restructuring - related costs and costs related to facility closures and gain or loss on sale of assets) . The current calculation of Adjusted EBITDA reflects a modification made in the third quarter of fiscal 2019 to eliminate the add back of revenue deferrals related to our customer loyalty program and to present amounts previously included within other as separate reconciling items . The presentation includes a reconciliation of Adjusted EBITDA to net income (loss), which is the most directly comparable GAAP financial measure . Adjusted Net Income (Loss) and Adjusted Net Income (Loss) per Diluted Share exclude amortization expense, merger and acquisition - related costs, a non - recurring litigation settlement, gains or losses on debt retirements, LIFO adjustments, goodwill and intangible asset impairment charges, restructuring - related costs and the WBA merger termination fee . The current calculations of Adjusted Net Income (Loss) and Adjusted Net Income (Loss) per Diluted Share reflect a modification made in the third quarter of fiscal 2019 to add back all amortization expenses rather than the amortization of EnvisionRx/Elixir intangible assets only . Additionally, the add back of LIFO (credit) charge when calculating Adjusted EBITDA, Adjusted Net Income (Loss) and Adjusted Net Income (Loss) per Diluted Share removes the entire impact of LIFO (credits) charges, and effectively reflects Rite Aid’s results as if the company was on a FIFO inventory basis . The presentation includes a reconciliation of Adjusted Net Income (Loss) to net income (loss), which is the most directly comparable GAAP financial measure . Adjusted EBITDA Gross Profit includes LIFO adjustments, depreciation and amortization (COGS portion only) and other items . The presentation includes a reconciliation of Adjusted EBITDA Gross Profit to Revenue, which is the most directly comparable GAAP financial measure . Adjusted EBITDA SG&A excludes depreciation and amortization (SG&A portion only), stock - based compensation expense, merger and acquisition - related costs, litigation settlement and other items . The presentation includes a reconciliation of Adjusted EBITDA SG&A to Revenue, which is the most directly comparable GAAP financial measure . Non - GAAP Financial Measures 4
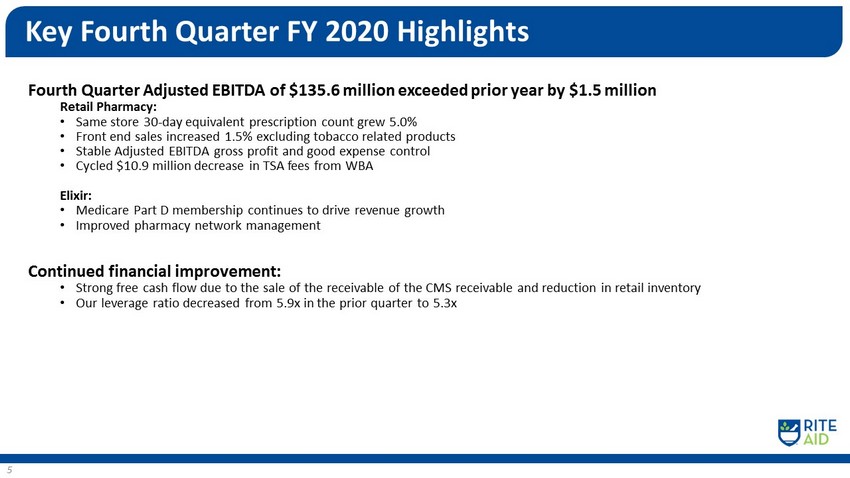
Fourth Quarter Adjusted EBITDA of $135.6 million exceeded prior year by $1.5 million Retail Pharmacy: • Same store 30 - day equivalent prescription count grew 5.0% • Front end sales increased 1.5% excluding tobacco related products • Stable Adjusted EBITDA gross profit and good expense control • Cycled $10.9 million decrease in TSA fees from WBA Elixir: • Medicare Part D membership continues to drive revenue growth • Improved pharmacy network management oved pharmacy network performance Continued financial improvement: • Strong free cash flow due to the sale of the receivable of the CMS receivable and reduction in retail inventory • Our leverage ratio decreased from 5.9x in the prior quarter to 5.3x Key Fourth Quarter FY 2020 Highlights 5

($ in millions, except per share amounts) Q4 Fiscal 2020 Summary 6 13 Weeks Ended February 29, 2020 13 Weeks Ended March 2, 2019 Revenues $ 5,727.2 $ 5,379.6 Net Loss $ (343.5) $ (255.6) Net Loss per Diluted Share $ (6.43) $ (4.83) Adjusted Net Loss per Diluted Share $ (0.37) $ (0.25) Adjusted EBITDA $ 135.6 2.37% $ 134.1 2.49% Note: Data on this slide and throughout the presentation is on a continuing operations basis.

($ in thousands) Q 4 - Fiscal 2020 Reconciliation of Net Loss to Adjusted EBITDA 7 13 Weeks Ended February 29, 2020 13 Weeks Ended March 2, 2019 Net Loss $ (343,461) $ (255,629) Adjustments: Interest expense 53,429 52,695 Income tax expense 351,729 195,004 Depreciation and amortization 79,300 86,925 LIFO (credit) charge (72,357) 4,043 Lease termination and impairment charges 40,728 55,898 Merger and Acquisition - related costs - 4,602 Stock - based compensation expense 2,489 552 Restructuring - related costs 11,872 4,704 Inventory write - downs related to store closings 569 7,933 Loss (g ain) on sale of assets, net 9,896 (26,806) Other 1,390 4,159 Adjusted EBITDA $ 135,584 $ 134,080 Percent of revenues 2.37% 2.49%
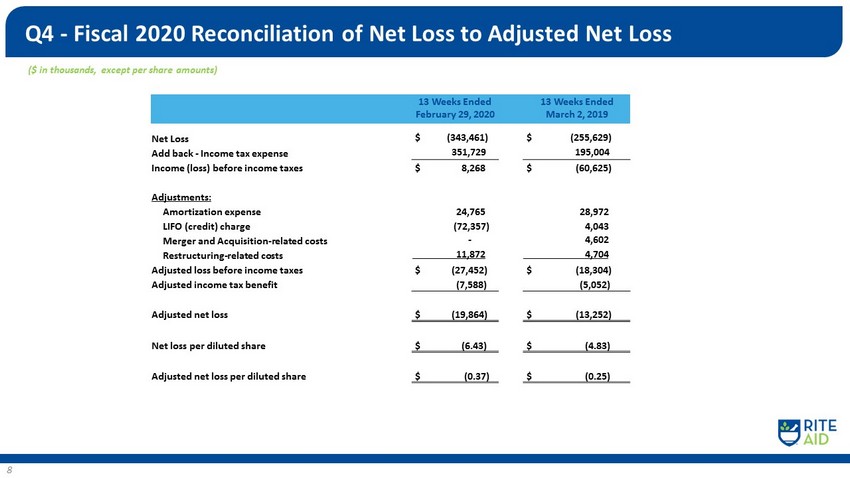
($ in thousands, except per share amounts) Q4 - Fiscal 2020 Reconciliation of Net Loss to Adjusted Net Loss 8 13 Weeks Ended February 29, 2020 13 Weeks Ended March 2, 2019 Net Loss $ (343,461) $ (255,629) Add back - Income tax expense 351,729 195,004 Income (loss) before income taxes $ 8,268 $ (60,625) Adjustments: Amortization expense 24,765 28,972 LIFO (credit) charge (72,357) 4,043 Merger and Acquisition - related costs - 4,602 Restructuring - related costs 11,872 4,704 Adjusted loss before income taxes $ (27,452) $ (18,304) Adjusted income tax benefit (7,588) (5,052) Adjusted net loss $ (19,864) $ (13,252) Net loss per diluted share $ (6.43) $ (4.83) Adjusted net loss per diluted share $ (0.37) $ (0.25)
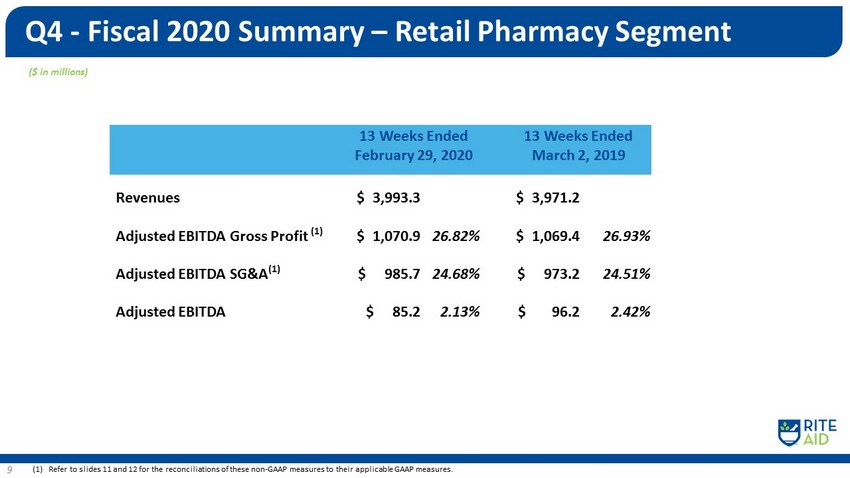
Q4 - Fiscal 2020 Summary – Retail Pharmacy Segment 9 (1) Refer to slides 11 and 12 for the reconciliations of these non - GAAP measures to their applicable GAAP measures. ($ in millions) 13 Weeks Ended February 29 , 2020 13 Weeks Ended March 2, 2019 Revenues $ 3,993.3 $ 3,971.2 Adjusted EBITDA Gross Profit (1) $ 1,070.9 26.82% $ 1,069.4 26.93% Adjusted EBITDA SG&A (1) $ 985.7 24.68% $ 973.2 24.51% Adjusted EBITDA $ 85.2 2.13% $ 96.2 2.42%
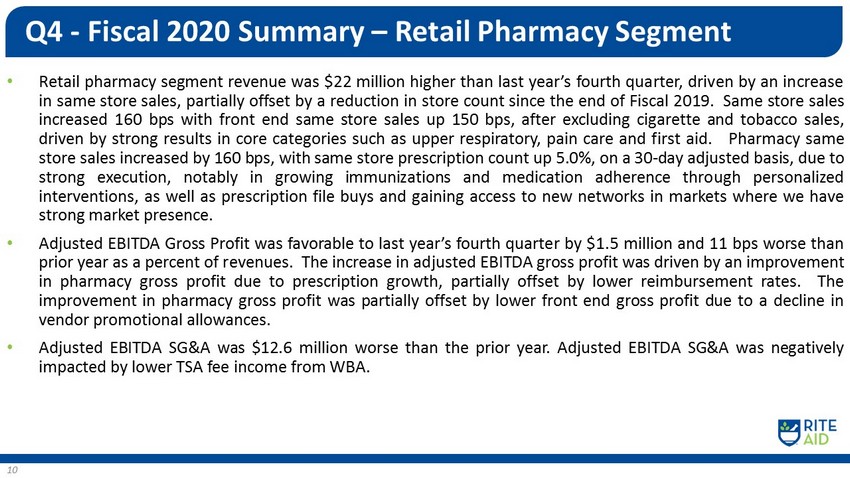
• Retail pharmacy segment revenue was $ 22 million higher than last year’s fourth quarter, driven by an increase in same store sales, partially offset by a reduction in store count since the end of Fiscal 2019 . Same store sales increased 160 bps with front end same store sales up 150 bps, after excluding cigarette and tobacco sales, driven by strong results in core categories such as upper respiratory, pain care and first aid . Pharmacy same store sales increased by 160 bps, with same store prescription count up 5 . 0 % , on a 30 - day adjusted basis, due to strong execution, notably in growing immunizations and medication adherence through personalized interventions, as well as prescription file buys and gaining access to new networks in markets where we have strong market presence . • Adjusted EBITDA Gross Profit was favorable to last year’s fourth quarter by $ 1 . 5 million and 11 bps worse than prior year as a percent of revenues . The increase in adjusted EBITDA gross profit was driven by an improvement in pharmacy gross profit due to prescription growth, partially offset by lower reimbursement rates . The improvement in pharmacy gross profit was partially offset by lower front end gross profit due to a decline in vendor promotional allowances . • Adjusted EBITDA SG&A was $ 12 . 6 million worse than the prior year . Adjusted EBITDA SG&A was negatively impacted by lower TSA fee income from WBA . Q4 - Fiscal 2020 Summary – Retail Pharmacy Segment 10
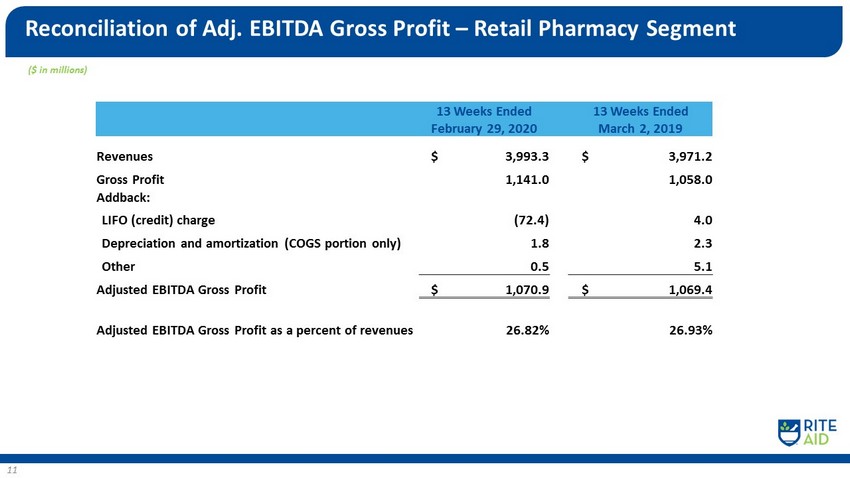
($ in millions) Reconciliation of Adj. EBITDA Gross Profit – Retail Pharmacy Segment 11 13 Weeks Ended February 29, 2020 13 Weeks Ended March 2, 2019 Revenues $ 3,993.3 $ 3,971.2 Gross Profit 1,141.0 1,058.0 Addback: LIFO (credit) charge (72.4) 4.0 Depreciation and amortization (COGS portion only) 1.8 2.3 Other 0.5 5.1 Adjusted EBITDA Gross Profit $ 1,070.9 $ 1,069.4 Adjusted EBITDA Gross Profit as a percent of revenues 26.82% 26.93%
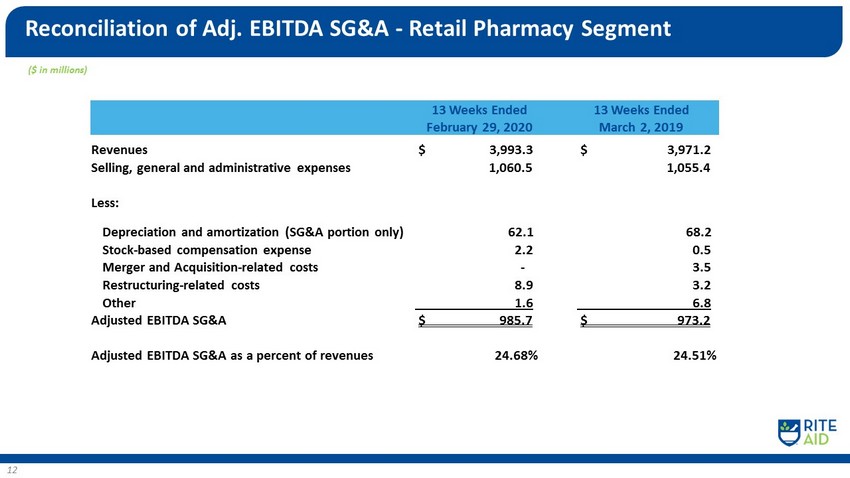
($ in millions) Reconciliation of Adj. EBITDA SG&A - Retail Pharmacy Segment 12 13 Weeks Ended February 29, 2020 13 Weeks Ended March 2, 2019 Revenues $ 3,993.3 $ 3,971.2 Selling, general and administrative expenses 1,060.5 1,055.4 Less: Depreciation and amortization (SG&A portion only) 62.1 68.2 Stock - based compensation expense 2.2 0.5 Merger and Acquisition - related costs - 3.5 Restructuring - related costs 8.9 3.2 Other 1.6 6.8 Adjusted EBITDA SG&A $ 985.7 $ 973.2 Adjusted EBITDA SG&A as a percent of revenues 24.68% 24.51%

($ in millions) Pharmacy Services Segment Results 13 13 Weeks Ended February 29, 2020 13 Weeks Ended March 2, 2019 Revenues $ 1,801.1 $ 1,463.3 Cost of Revenues 1,675.5 1,357.0 Gross Profit 125.6 106.3 Selling, General and Administrative Expenses (93.8) (87.8) Loss on sale of assets, net (18.4) - Addback: Depreciation and Amortization 15.4 16.5 Loss on sale of assets, net 18.4 - Restructuring - related costs 3.0 1.5 Other 0.2 1.3 Adjusted EBITDA - Pharmacy Services Segment $ 50.4 $ 37.8
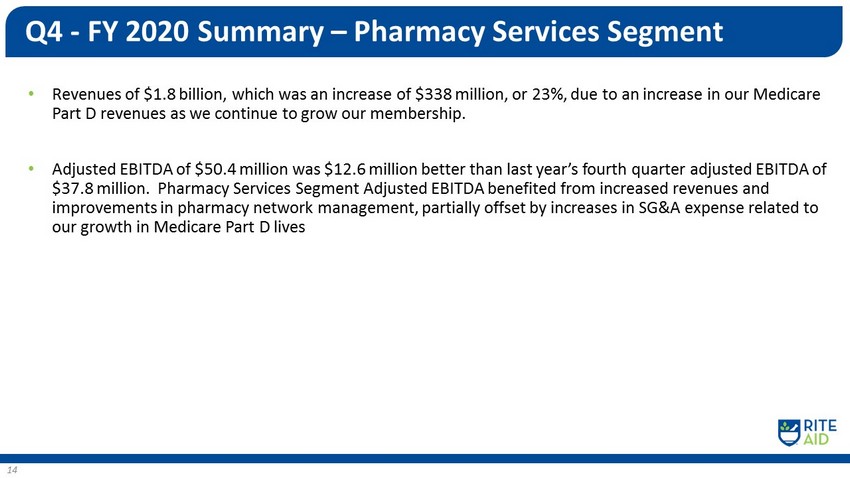
• R evenues of $1.8 billion, which was an increase of $338 million, or 23%, due to an increase in our Medicare Part D revenues as we continue to grow our membership. • Adjusted EBITDA of $50.4 million was $12.6 million better than last year’s fourth quarter adjusted EBITDA of $37.8 million. Pharmacy Services Segment Adjusted EBITDA benefited from increased revenues and improvements in pharmacy network management, partially offset by increases in SG&A expense related to our growth in Medicare Part D lives Q4 - FY 2020 Summary – Pharmacy Services Segment 14

Comparable Store Sales Growth 15 FRONT END SALES - 1.8% - 0.1% - 1.5% - 1.9% - 0.3% - 1.8% - 0.5% 0.3% - 0.6% 1.0% 1.50% Q1 Q2 Q3 Q4 Q1 Q2 Q3 Q4 0.1% - 0.1% 1.6% 3.1% 2.1% 2.3% 1.5% 0.1% 1.6% - 1.5% 1.1% 2.4% 0.8% 3.7% 2.7% 2.8% 5.0% Excluding cigarette and tobacco products (1) Script count growth shown on a 30 - day equivalent basis.

($ in thousands) Capitalization Table 16 Secured Debt: Senior secured revolving credit facility due December 2023 $ 630,833 $ 850,931 FILO term loan due December 2023 446,954 446,082 1,077,787 1,297,013 Unsecured Guaranteed Debt : 6.125% senior secured notes due April 2023 1,145,060 1,736,508 7.5% senior secured notes due July 2025 589,073 - 1,734,133 1,736,508 Unsecured Unguaranteed Debt: 7.7% notes due February 2027 236,478 293,705 6.875% fixed - rate senior notes due December 2028 28,870 127,358 265,348 421,063 Lease financing obligations 28,166 40,176 Total Debt: 3,105,434 3,494,760 Current maturities of long - term debt and lease financing obligations (8,840) (16,111) Long - term debt & lease financing obligations, less current maturities 3,096,594 3,478,649 Total debt and lease financing obligations, continuing operations Less: current maturities of long - term debt and lease financing obligations , continuing operations 3,105,434 3,494,760 Long - term debt & lease financing obligations, less current maturities, continuing operations (8,840) (16,111) $ 3,096,594 $ 3,478,649 Total Debt gross 3,148,043 3,541,666 Less: Unamortized debt issue costs (42,609) (46,906) Total Debt per balance sheet $ 3,105,434 $ 3,494,760 February 29, 2020 March 2, 2019
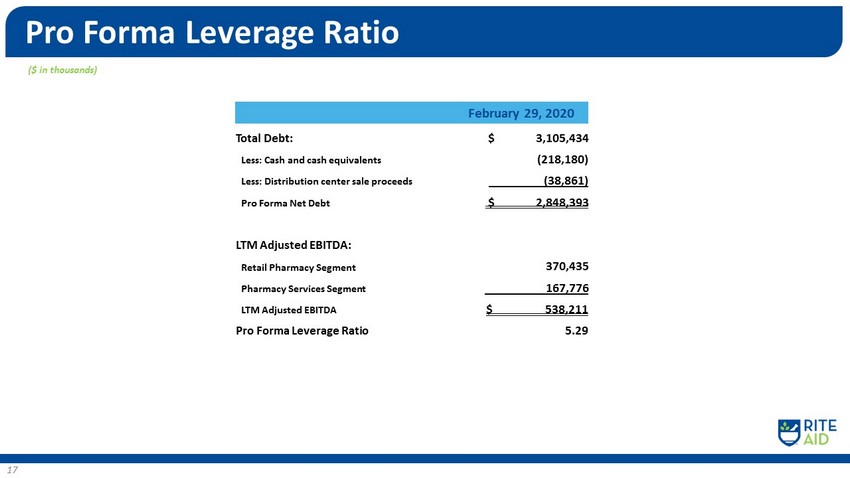
($ in thousands) Pro Forma Leverage Ratio 17 February 29, 2020 Total Debt: $ 3,105,434 Less: Cash and cash equivalents (218,180) Less: Distribution center sale proceeds (38,861) Pro Forma Net Debt $ 2,848,393 LTM Adjusted EBITDA: Retail Pharmacy Segment 370,435 Pharmacy Services Segment 167,776 LTM Adjusted EBITDA $ 538,211 Pro Forma Leverage Ratio 5.29
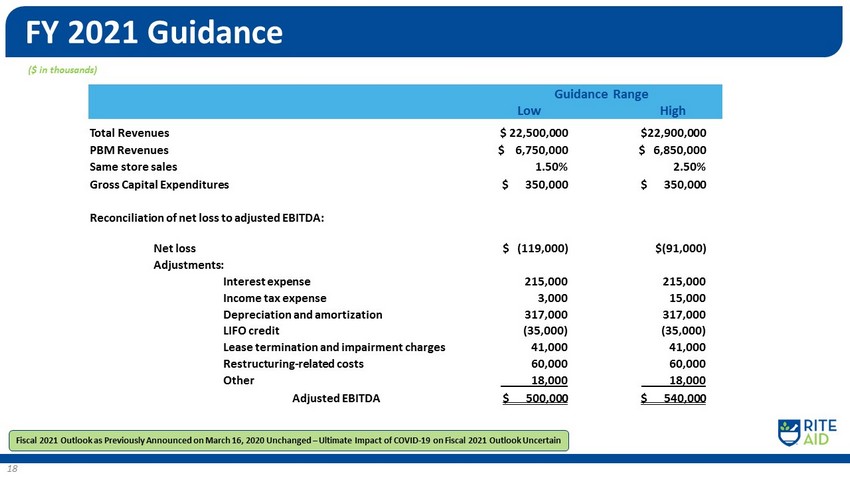
($ in thousands) FY 2021 Guidance 18 Total Revenues $ 22,500,000 $22,900,000 PBM Revenues $ 6,750,000 $ 6,850,000 Same store sales 1.50 % 2.50 % Gross Capital Expenditures $ 350,000 $ 350,000 Reconciliation of net loss to adjusted EBITDA: Net loss $ (119,000 ) $(91,000 ) Adjustments: Interest expense 215,000 215,000 Income tax expense 3,000 15,000 Depreciation and amortization 317,000 317,000 LIFO credit (35,000) (35,000) Lease termination and impairment charges 41,000 41,000 Restructuring - related costs 60,000 60,000 Other 18,000 18,000 Adjusted EBITDA $ 500,000 $ 540,000 Guidance Range Low High Fiscal 2021 Outlook as Previously Announced on March 16, 2020 Unchanged – Ultimate Impact of COVID - 19 on Fiscal 2021 Outlook Unc ertain
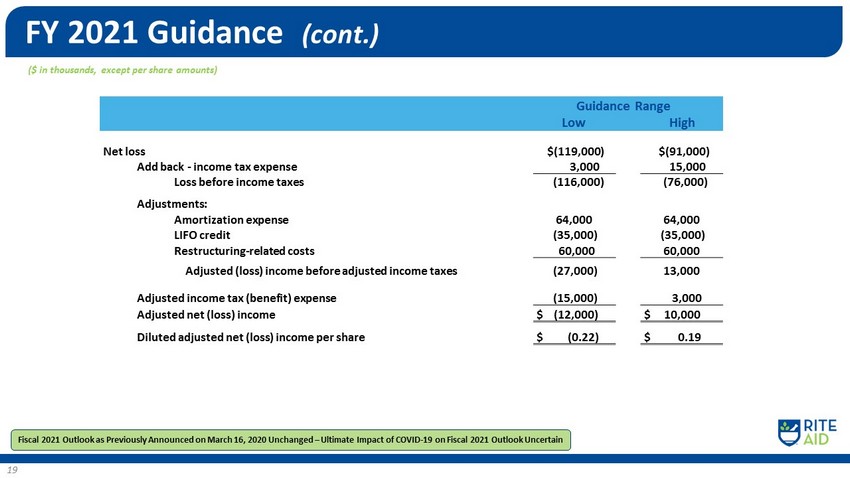
($ in thousands, except per share amounts) FY 2021 Guidance (cont.) 19 Net loss $(119,000) $(91,000 ) Add back - income tax expense 3,000 15,000 Loss before income taxes (116,000 ) (76,000 ) Adjustments: Amortization expense 64,000 64 ,000 LIFO credit (35,000) (35,000) Restructuring - related costs 60,000 60,000 Adjusted (loss) income before adjusted income taxes (27,000) 13,000 Adjusted income tax (benefit) expense (15,000) 3,000 Adjusted net (loss) income $ (12,000) $ 10,000 Diluted adjusted net (loss) income per share $ (0.22) $ 0.19 Guidance Range Low High Fiscal 2021 Outlook as Previously Announced on March 16, 2020 Unchanged – Ultimate Impact of COVID - 19 on Fiscal 2021 Outlook Unc ertain

($ in thousands) FY 2021 Guidance (cont.) 20 Guidance Range Low High Adjusted EBITDA $ 500,000 $ 540,000 Cash interest expense (210,000) (210,000) Restructuring - related costs (60,000) (60,000) Closed store rent (30,000) (30,000) Working capital benefit 200,000 210,000 Cash flow from operations 400,000 450,000 Gross capital expenditures (350,000) (350,000) Free cash flow $ 50,000 $ 100,000 Fiscal 2021 Outlook as Previously Announced on March 16, 2020 Unchanged – Ultimate Impact of COVID - 19 on Fiscal 2021 Outlook Unc ertain
• Working with the White House COVID - 19 Response Working Group to pilot new testing models . • Announcing plans to hire an additional 5,000 full and part - time associates to support store and distribution center teams . • Implementing Hero Pay and Hero Bonus programs, along with increasing our associate discount to 35%, to show appreciation for the exceptional commitment of Rite Aid associates on the front lines . • Instituting a “Pandemic Pay” policy that ensures associates are compensated if diagnosed with the virus or quarantined because of exposure . • Implementing specific internal protocols to keep associates safe and ready to serve customers, including the installation of Plexiglas shields at pharmacy and front - end counters to provide additional protection . • Ensuring contact - less capabilities at our stores for prescription pickup and payment. RITE AID ON THE FRONT LINES OF THE COVID - 19 CRISIS 21

• Launching a new telehealth service RediClinic@Home to better serve patient needs . • Designating 9 a.m. to 10 a.m. as a senior shopping hour to limit exposure for customers 60 and older and offering a 30% discount to wellness+ rewards members every Wednesday in April . • Establishing social distancing procedures that include marking floor areas in front of the pharmacy and front - end counters with tape to ensure 6 - foot separation . • Waiving delivery - service fees for eligible prescriptions . • Following enhanced cleaning and sanitization protocols designed specifically to prevent the spread of a wide spectrum of viruses, including COVID - 19 and influenza. COVID - 19 CRISIS (cont.) 22
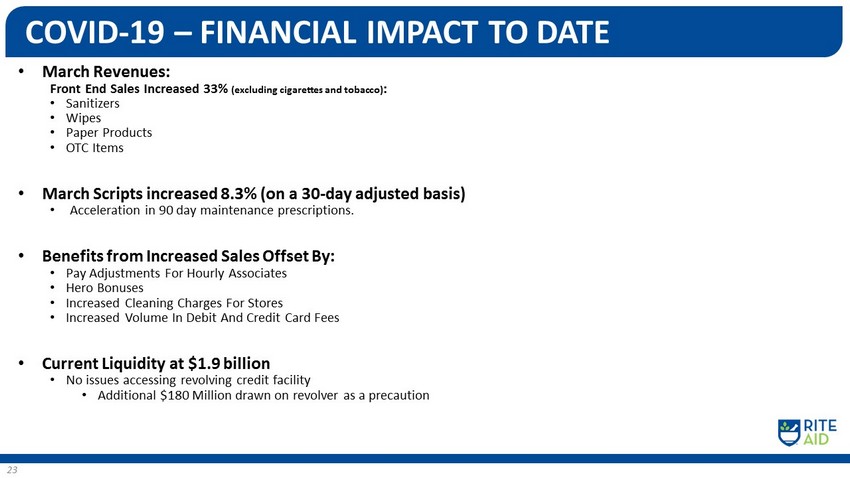
COVID - 19 – FINANCIAL IMPACT TO DATE • March Revenues: Front End Sales Increased 33% (excluding cigarettes and tobacco) : • Sanitizers • Wipes • Paper Products • OTC Items • March Scripts increased 8.3 % (on a 30 - day adjusted basis) • Acceleration in 90 day maintenance prescriptions . • Benefits from Increased Sales Offset By: • Pay Adjustments For H ourly A ssociates • Hero Bonuses • Increased Cleaning Charges For Stores • Increased Volume In Debit And Credit Card Fees • Current Liquidity at $1.9 billion • No issues accessing revolving credit facility • Additional $180 Million drawn on revolver as a precaution (cont.) 23

COVID - 19 IMPACT ON OUTLOOK At this time, the impact of COVID - 19 on fiscal 2021 Adjusted EBITDA has not been material, as increased sales volumes in March are expected to be offset by declines in sales during the remainder of the first quarter of fiscal 2021 and the cost investments described above . At this time, the company does not have enough information about the ultimate impact of COVID - 19 on Fiscal 2021 results to justify changing guidance . It is important to note that the impacts of COVID - 19 on our business are fluid and difficult to predict and these estimates could materially change . Factors that could cause our estimates for fiscal 2021 to materially change include a deterioration in front - end sales and prescriptions due to prolonged social distancing measures, a reduction in members at our Pharmacy Services Segment commercial clients and disruptions to our front - end or pharmaceutical supply chain . 24