Attached files
| file | filename |
|---|---|
| 8-K/A - 8-K/A - SPIRIT REALTY CAPITAL, INC. | src-8ka_20200413.htm |

Spirit Business Update April 2020 Exhibit 99.1
STATEMENT REGARDING PRELIMINARY Q1 2020 ESTIMATES Unless otherwise indicated or unless the context requires otherwise, all references in this presentation to “Spirit,” “our company,” “we,” “us,” or “our” refer to Spirit Realty Capital, Inc., together with its consolidated subsidiaries, including Spirit Realty, L.P. This presentation contains estimates regarding our company and our portfolio as of and for the quarter ended March 31, 2020 based on information currently available to management. Such estimates are preliminary and subject to completion, including the completion of customary financial statement closing and review procedures as of and for the quarter ended March 31, 2020 and disclosures required by U.S. generally accepted accounting principles (“GAAP”) and rules and regulations promulgated by the U.S. Securities and Exchange Commission (the “SEC”). As a result, such preliminary estimates may vary from our actual financial results as of and for the quarter ended March 31, 2020. Further, such preliminary estimates are not a comprehensive statement or estimate of our financial condition or results of operations as of and for the quarter ended March 31, 2020. Such preliminary estimates should not be viewed as a substitute for complete interim or full year financial statements prepared in accordance with GAAP, and they are not necessarily indicative of the results to be achieved in any future period. Accordingly, you should not place undue reliance on such preliminary estimates. The preliminary estimates included in this presentation, which are the responsibility of our management, were prepared by our management and are based upon a number of assumptions. Additional items that may require adjustments to such preliminary estimates may be identified and could result in material changes to such preliminary estimates. See the risk factors described under the caption “Item 1A. Risk Factors” in our Combined Annual Report on Form 10-K for the year ended December 31, 2019, as supplemented by the risk factor described under the caption “Item 8.01 Other Events” in our Current Report on Form 8-K filed with the SEC on March 16, 2020.
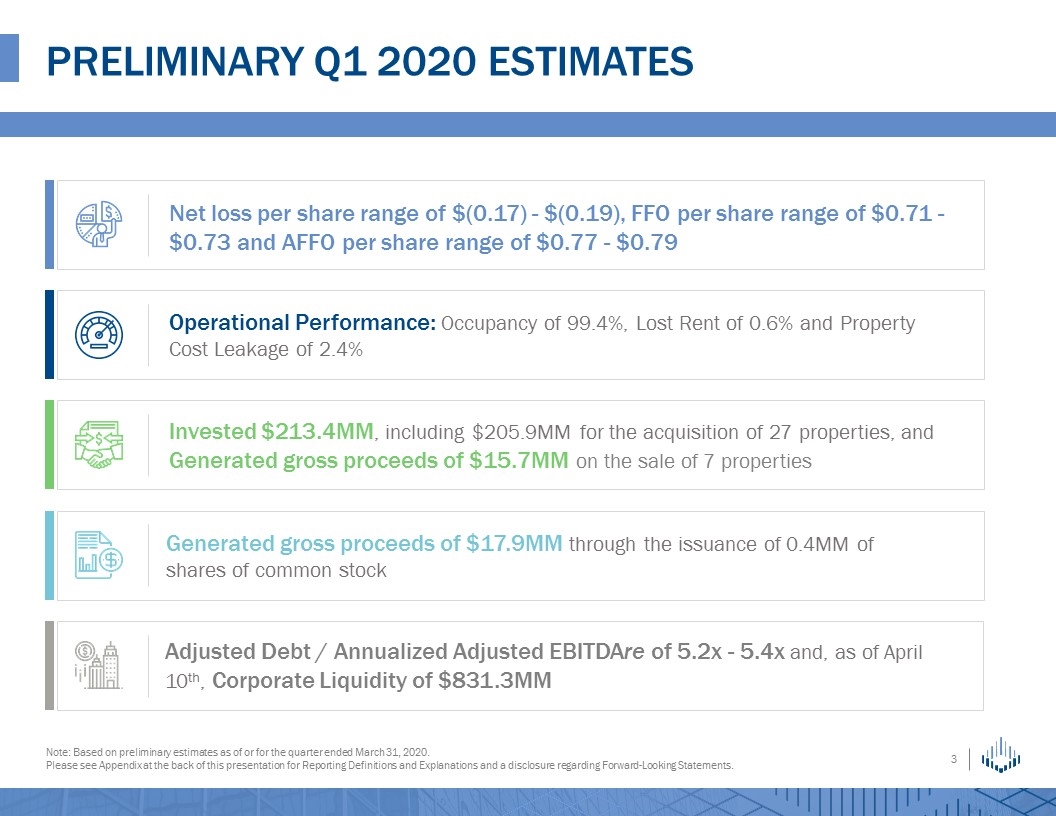
Preliminary Q1 2020 estimates Note: Based on preliminary estimates as of or for the quarter ended March 31, 2020. Please see Appendix at the back of this presentation for Reporting Definitions and Explanations and a disclosure regarding Forward-Looking Statements. Net loss per share range of $(0.17) - $(0.19), FFO per share range of $0.71 - $0.73 and AFFO per share range of $0.77 - $0.79 Operational Performance: Occupancy of 99.4%, Lost Rent of 0.6% and Property Cost Leakage of 2.4% Invested $213.4MM, including $205.9MM for the acquisition of 27 properties, and Generated gross proceeds of $15.7MM on the sale of 7 properties Generated gross proceeds of $17.9MM through the issuance of 0.4MM of shares of common stock Adjusted Debt / Annualized Adjusted EBITDAre of 5.2x - 5.4x and, as of April 10th, Corporate Liquidity of $831.3MM
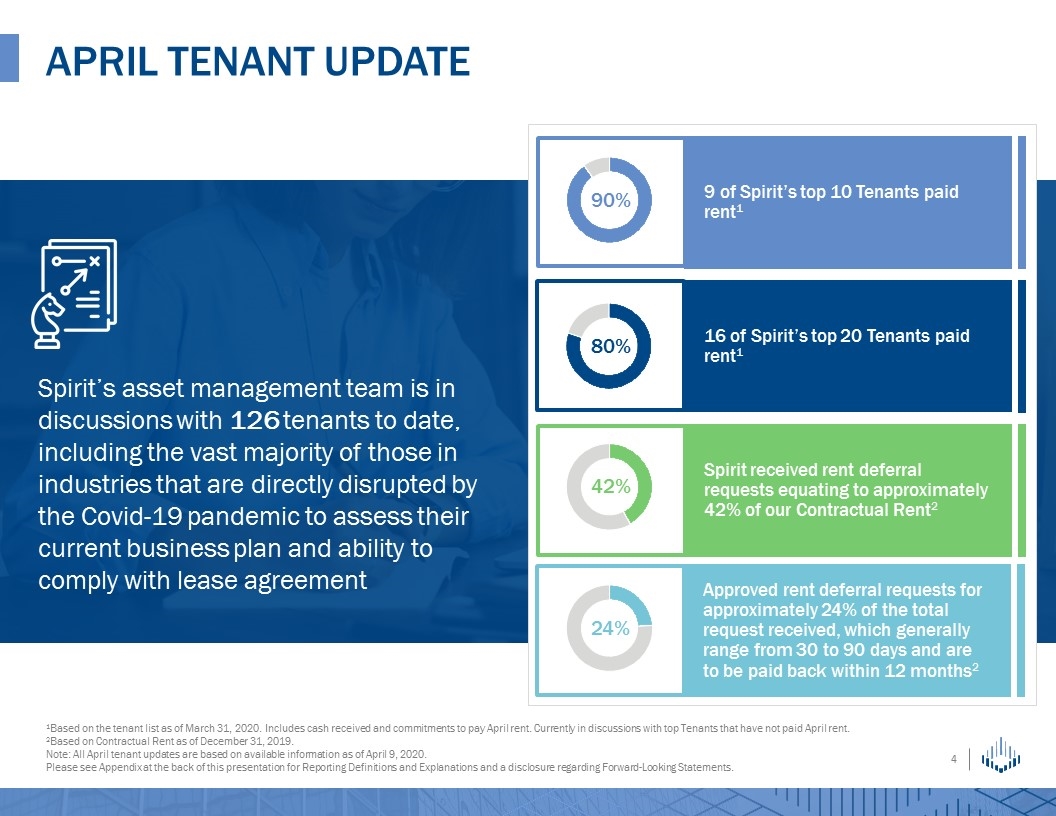
Spirit’s asset management team is in discussions with 126 tenants to date, including the vast majority of those in industries that are directly disrupted by the Covid-19 pandemic to assess their current business plan and ability to comply with lease agreement April tenant update 9 of Spirit’s top 10 Tenants paid rent1 Spirit received rent deferral requests equating to approximately 42% of our Contractual Rent2 90% 80% 42% 16 of Spirit’s top 20 Tenants paid rent1 Approved rent deferral requests for approximately 24% of the total request received, which generally range from 30 to 90 days and are to be paid back within 12 months2 24% 1Based on the tenant list as of March 31, 2020. Includes cash received and commitments to pay April rent. Currently in discussions with top Tenants that have not paid April rent. 2Based on Contractual Rent as of December 31, 2019. Note: All April tenant updates are based on available information as of April 9, 2020. Please see Appendix at the back of this presentation for Reporting Definitions and Explanations and a disclosure regarding Forward-Looking Statements.
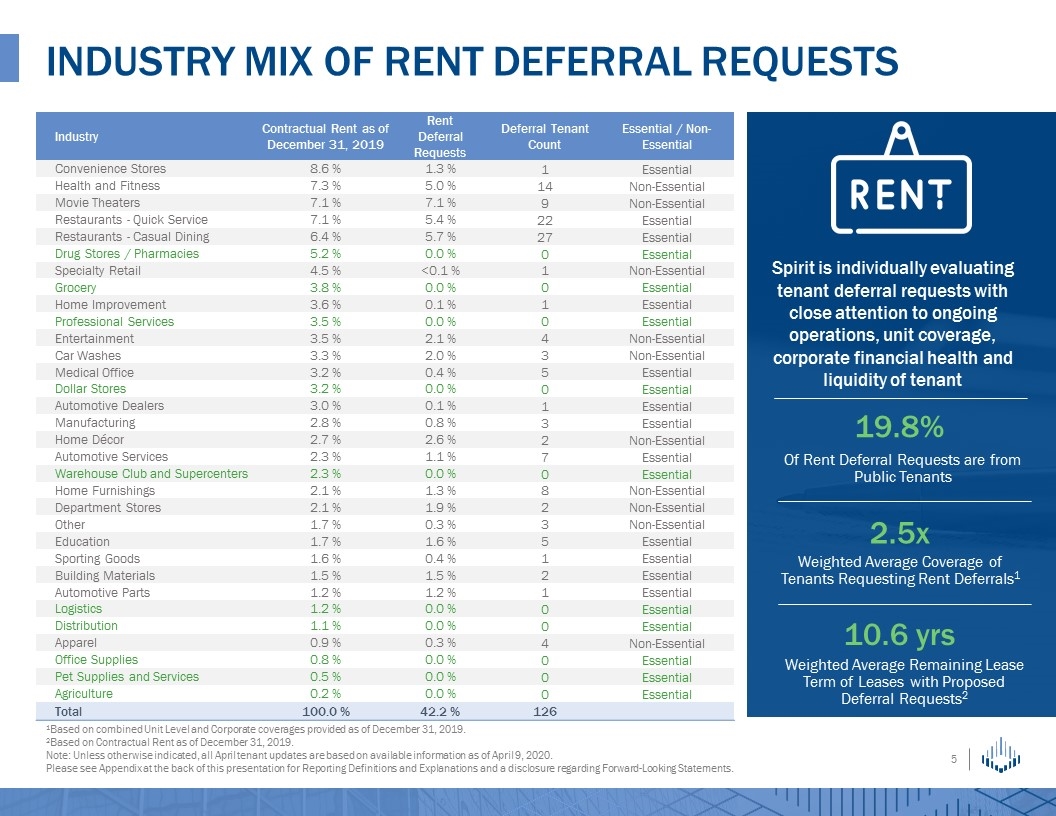
Industry mix of RENT DEFERRAL requests 1Based on combined Unit Level and Corporate coverages provided as of December 31, 2019. 2Based on Contractual Rent as of December 31, 2019. Note: Unless otherwise indicated, all April tenant updates are based on available information as of April 9, 2020. Please see Appendix at the back of this presentation for Reporting Definitions and Explanations and a disclosure regarding Forward-Looking Statements. Industry Contractual Rent as of December 31, 2019 Rent Deferral Requests Deferral Tenant Count Essential / Non-Essential Convenience Stores 8.6 % 1.3 % 1 Essential Health and Fitness 7.3 % 5.0 % 14 Non-Essential Movie Theaters 7.1 % 7.1 % 9 Non-Essential Restaurants - Quick Service 7.1 % 5.4 % 22 Essential Restaurants - Casual Dining 6.4 % 5.7 % 27 Essential Drug Stores / Pharmacies 5.2 % 0.0 % 0 Essential Specialty Retail 4.5 % <0.1 % 1 Non-Essential Grocery 3.8 % 0.0 % 0 Essential Home Improvement 3.6 % 0.1 % 1 Essential Professional Services 3.5 % 0.0 % 0 Essential Entertainment 3.5 % 2.1 % 4 Non-Essential Car Washes 3.3 % 2.0 % 3 Non-Essential Medical Office 3.2 % 0.4 % 5 Essential Dollar Stores 3.2 % 0.0 % 0 Essential Automotive Dealers 3.0 % 0.1 % 1 Essential Manufacturing 2.8 % 0.8 % 3 Essential Home Décor 2.7 % 2.6 % 2 Non-Essential Automotive Services 2.3 % 1.1 % 7 Essential Warehouse Club and Supercenters 2.3 % 0.0 % 0 Essential Home Furnishings 2.1 % 1.3 % 8 Non-Essential Department Stores 2.1 % 1.9 % 2 Non-Essential Other 1.7 % 0.3 % 3 Non-Essential Education 1.7 % 1.6 % 5 Essential Sporting Goods 1.6 % 0.4 % 1 Essential Building Materials 1.5 % 1.5 % 2 Essential Automotive Parts 1.2 % 1.2 % 1 Essential Logistics 1.2 % 0.0 % 0 Essential Distribution 1.1 % 0.0 % 0 Essential Apparel 0.9 % 0.3 % 4 Non-Essential Office Supplies 0.8 % 0.0 % 0 Essential Pet Supplies and Services 0.5 % 0.0 % 0 Essential Agriculture 0.2 % 0.0 % 0 Essential Total 100.0 % 42.2 % 126 Spirit is individually evaluating tenant deferral requests with close attention to ongoing operations, unit coverage, corporate financial health and liquidity of tenant Weighted Average Remaining Lease Term of Leases with Proposed Deferral Requests2 Weighted Average Coverage of Tenants Requesting Rent Deferrals1 2.5x Of Rent Deferral Requests are from Public Tenants 19.8% 10.6 yrs
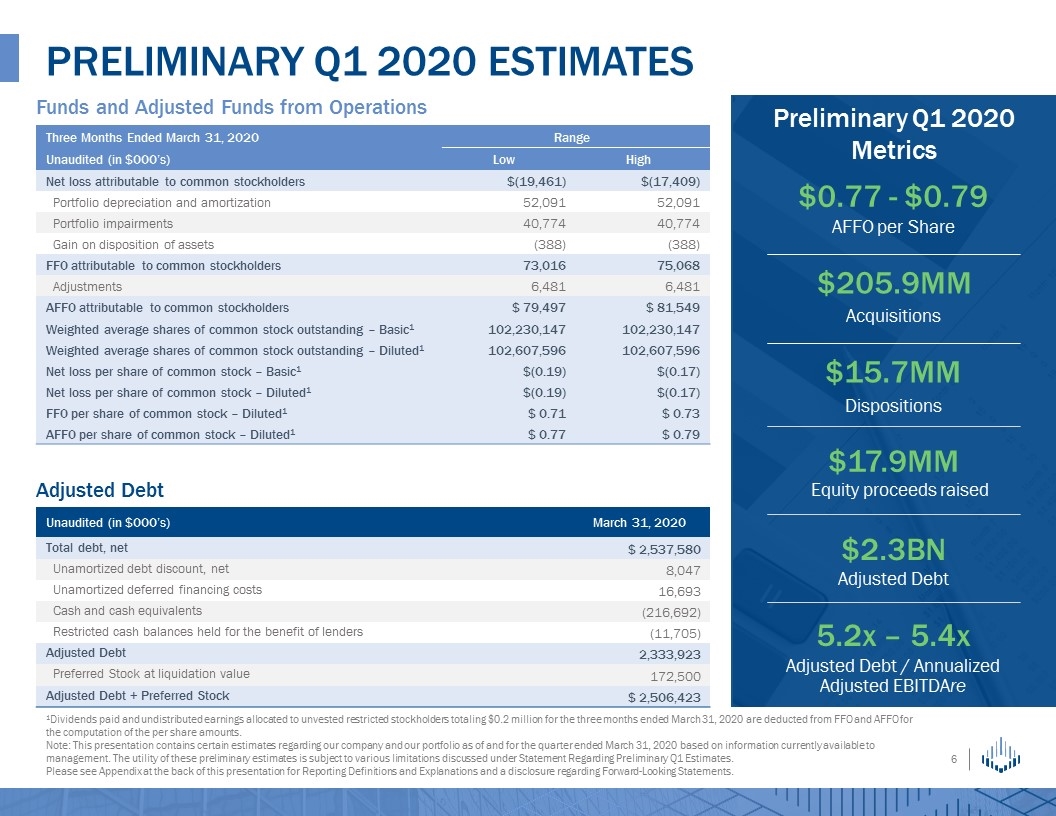
Funds and Adjusted Funds from Operations Adjusted Debt Preliminary q1 2020 estimates 1Dividends paid and undistributed earnings allocated to unvested restricted stockholders totaling $0.2 million for the three months ended March 31, 2020 are deducted from FFO and AFFO for the computation of the per share amounts. Note: This presentation contains certain estimates regarding our company and our portfolio as of and for the quarter ended March 31, 2020 based on information currently available to management. The utility of these preliminary estimates is subject to various limitations discussed under Statement Regarding Preliminary Q1 Estimates. Please see Appendix at the back of this presentation for Reporting Definitions and Explanations and a disclosure regarding Forward-Looking Statements. Adjusted Debt $2.3BN AFFO per Share $0.77 - $0.79 Three Months Ended March 31, 2020 Range Unaudited (in $000’s) Low High Net loss attributable to common stockholders $(19,461) $(17,409) Portfolio depreciation and amortization 52,091 52,091 Portfolio impairments 40,774 40,774 Gain on disposition of assets (388) (388) FFO attributable to common stockholders 73,016 75,068 Adjustments 6,481 6,481 AFFO attributable to common stockholders $ 79,497 $ 81,549 Weighted average shares of common stock outstanding – Basic1 102,230,147 102,230,147 Weighted average shares of common stock outstanding – Diluted1 102,607,596 102,607,596 Net loss per share of common stock – Basic1 $(0.19) $(0.17) Net loss per share of common stock – Diluted1 $(0.19) $(0.17) FFO per share of common stock – Diluted1 $ 0.71 $ 0.73 AFFO per share of common stock – Diluted1 $ 0.77 $ 0.79 Unaudited (in $000’s) March 31, 2020 Total debt, net $ 2,537,580 Unamortized debt discount, net 8,047 Unamortized deferred financing costs 16,693 Cash and cash equivalents (216,692) Restricted cash balances held for the benefit of lenders (11,705) Adjusted Debt 2,333,923 Preferred Stock at liquidation value 172,500 Adjusted Debt + Preferred Stock $ 2,506,423 Preliminary Q1 2020 Metrics Acquisitions $205.9MM Dispositions $15.7MM Equity proceeds raised $17.9MM Adjusted Debt / Annualized Adjusted EBITDAre 5.2x – 5.4x
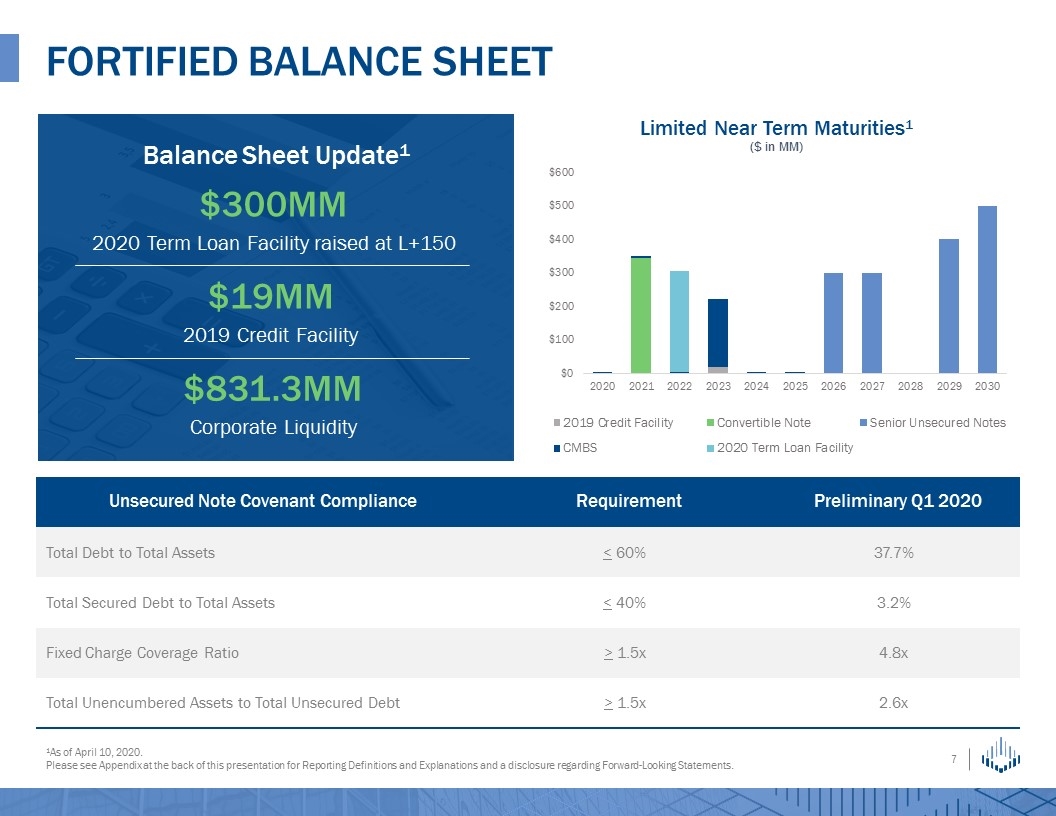
Balance Sheet Update1 Fortified balance sheet 1As of April 10, 2020. Please see Appendix at the back of this presentation for Reporting Definitions and Explanations and a disclosure regarding Forward-Looking Statements. Unsecured Note Covenant Compliance Requirement Preliminary Q1 2020 Total Debt to Total Assets < 60% 37.7% Total Secured Debt to Total Assets < 40% 3.2% Fixed Charge Coverage Ratio > 1.5x 4.8x Total Unencumbered Assets to Total Unsecured Debt > 1.5x 2.6x Limited Near Term Maturities1 ($ in MM) $300MM 2020 Term Loan Facility raised at L+150 $831.3MM Corporate Liquidity $19MM 2019 Credit Facility
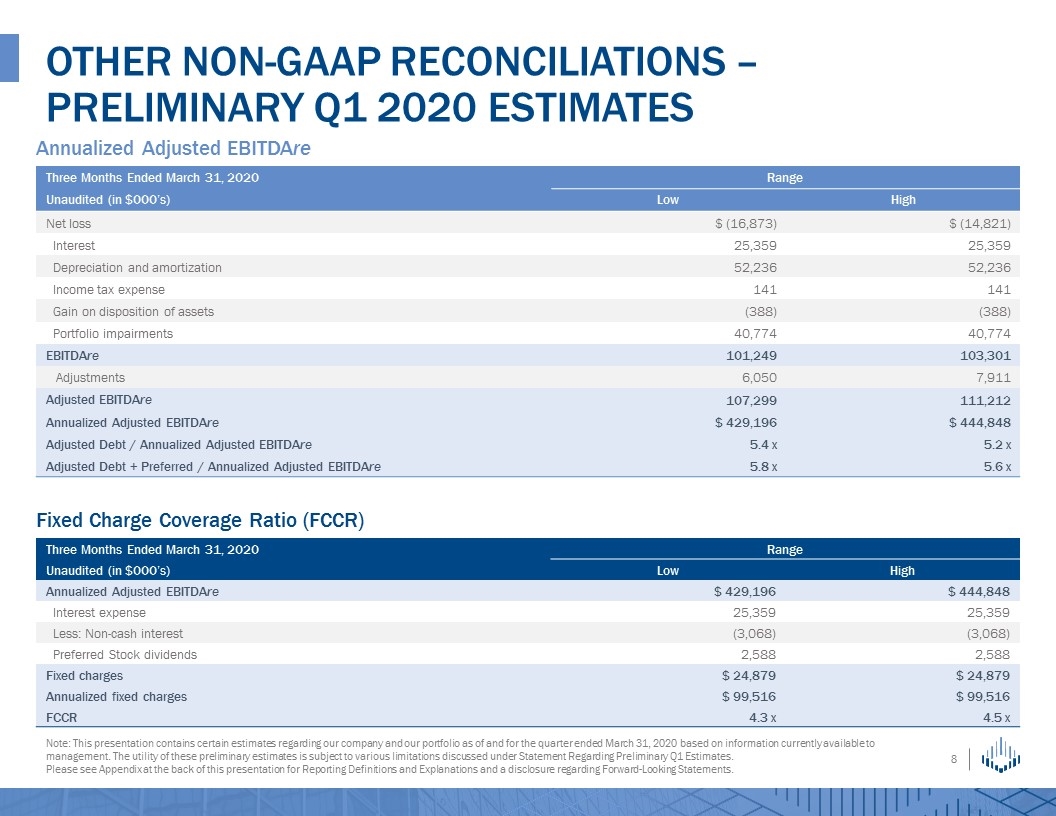
Annualized Adjusted EBITDAre Fixed Charge Coverage Ratio (FCCR) Other NON-GAAP RECONCILIATIONS – Preliminary Q1 2020 Estimates Note: This presentation contains certain estimates regarding our company and our portfolio as of and for the quarter ended March 31, 2020 based on information currently available to management. The utility of these preliminary estimates is subject to various limitations discussed under Statement Regarding Preliminary Q1 Estimates. Please see Appendix at the back of this presentation for Reporting Definitions and Explanations and a disclosure regarding Forward-Looking Statements. Three Months Ended March 31, 2020 Range Unaudited (in $000’s) Low High Annualized Adjusted EBITDAre $ 429,196 $ 444,848 Interest expense 25,359 25,359 Less: Non-cash interest (3,068) (3,068) Preferred Stock dividends 2,588 2,588 Fixed charges $ 24,879 $ 24,879 Annualized fixed charges $ 99,516 $ 99,516 FCCR 4.3 x 4.5 x Three Months Ended March 31, 2020 Range Unaudited (in $000’s) Low High Net loss $ (16,873) $ (14,821) Interest 25,359 25,359 Depreciation and amortization 52,236 52,236 Income tax expense 141 141 Gain on disposition of assets (388) (388) Portfolio impairments 40,774 40,774 EBITDAre 101,249 103,301 Adjustments 6,050 7,911 Adjusted EBITDAre 107,299 111,212 Annualized Adjusted EBITDAre $ 429,196 $ 444,848 Adjusted Debt / Annualized Adjusted EBITDAre 5.4 x 5.2 x Adjusted Debt + Preferred / Annualized Adjusted EBITDAre 5.8 x 5.6 x
Appendix
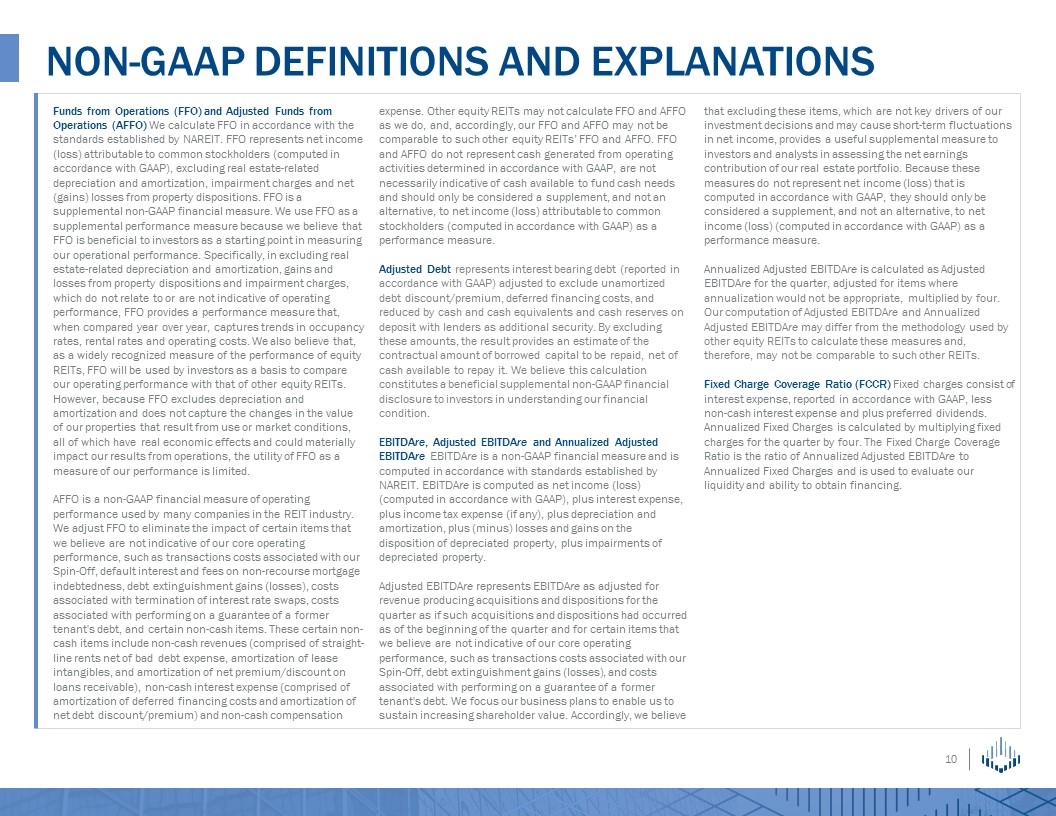
NON-GAAP DEFINITIONS AND EXPLANATIONS Funds from Operations (FFO) and Adjusted Funds from Operations (AFFO) We calculate FFO in accordance with the standards established by NAREIT. FFO represents net income (loss) attributable to common stockholders (computed in accordance with GAAP), excluding real estate-related depreciation and amortization, impairment charges and net (gains) losses from property dispositions. FFO is a supplemental non-GAAP financial measure. We use FFO as a supplemental performance measure because we believe that FFO is beneficial to investors as a starting point in measuring our operational performance. Specifically, in excluding real estate-related depreciation and amortization, gains and losses from property dispositions and impairment charges, which do not relate to or are not indicative of operating performance, FFO provides a performance measure that, when compared year over year, captures trends in occupancy rates, rental rates and operating costs. We also believe that, as a widely recognized measure of the performance of equity REITs, FFO will be used by investors as a basis to compare our operating performance with that of other equity REITs. However, because FFO excludes depreciation and amortization and does not capture the changes in the value of our properties that result from use or market conditions, all of which have real economic effects and could materially impact our results from operations, the utility of FFO as a measure of our performance is limited. AFFO is a non-GAAP financial measure of operating performance used by many companies in the REIT industry. We adjust FFO to eliminate the impact of certain items that we believe are not indicative of our core operating performance, such as transactions costs associated with our Spin-Off, default interest and fees on non-recourse mortgage indebtedness, debt extinguishment gains (losses), costs associated with termination of interest rate swaps, costs associated with performing on a guarantee of a former tenant's debt, and certain non-cash items. These certain non-cash items include non-cash revenues (comprised of straight-line rents net of bad debt expense, amortization of lease intangibles, and amortization of net premium/discount on loans receivable), non-cash interest expense (comprised of amortization of deferred financing costs and amortization of net debt discount/premium) and non-cash compensation expense. Other equity REITs may not calculate FFO and AFFO as we do, and, accordingly, our FFO and AFFO may not be comparable to such other equity REITs’ FFO and AFFO. FFO and AFFO do not represent cash generated from operating activities determined in accordance with GAAP, are not necessarily indicative of cash available to fund cash needs and should only be considered a supplement, and not an alternative, to net income (loss) attributable to common stockholders (computed in accordance with GAAP) as a performance measure. Adjusted Debt represents interest bearing debt (reported in accordance with GAAP) adjusted to exclude unamortized debt discount/premium, deferred financing costs, and reduced by cash and cash equivalents and cash reserves on deposit with lenders as additional security. By excluding these amounts, the result provides an estimate of the contractual amount of borrowed capital to be repaid, net of cash available to repay it. We believe this calculation constitutes a beneficial supplemental non-GAAP financial disclosure to investors in understanding our financial condition. EBITDAre, Adjusted EBITDAre and Annualized Adjusted EBITDAre EBITDAre is a non-GAAP financial measure and is computed in accordance with standards established by NAREIT. EBITDAre is computed as net income (loss) (computed in accordance with GAAP), plus interest expense, plus income tax expense (if any), plus depreciation and amortization, plus (minus) losses and gains on the disposition of depreciated property, plus impairments of depreciated property. Adjusted EBITDAre represents EBITDAre as adjusted for revenue producing acquisitions and dispositions for the quarter as if such acquisitions and dispositions had occurred as of the beginning of the quarter and for certain items that we believe are not indicative of our core operating performance, such as transactions costs associated with our Spin-Off, debt extinguishment gains (losses), and costs associated with performing on a guarantee of a former tenant's debt. We focus our business plans to enable us to sustain increasing shareholder value. Accordingly, we believe that excluding these items, which are not key drivers of our investment decisions and may cause short-term fluctuations in net income, provides a useful supplemental measure to investors and analysts in assessing the net earnings contribution of our real estate portfolio. Because these measures do not represent net income (loss) that is computed in accordance with GAAP, they should only be considered a supplement, and not an alternative, to net income (loss) (computed in accordance with GAAP) as a performance measure. Annualized Adjusted EBITDAre is calculated as Adjusted EBITDAre for the quarter, adjusted for items where annualization would not be appropriate, multiplied by four. Our computation of Adjusted EBITDAre and Annualized Adjusted EBITDAre may differ from the methodology used by other equity REITs to calculate these measures and, therefore, may not be comparable to such other REITs. Fixed Charge Coverage Ratio (FCCR) Fixed charges consist of interest expense, reported in accordance with GAAP, less non-cash interest expense and plus preferred dividends. Annualized Fixed Charges is calculated by multiplying fixed charges for the quarter by four. The Fixed Charge Coverage Ratio is the ratio of Annualized Adjusted EBITDAre to Annualized Fixed Charges and is used to evaluate our liquidity and ability to obtain financing.
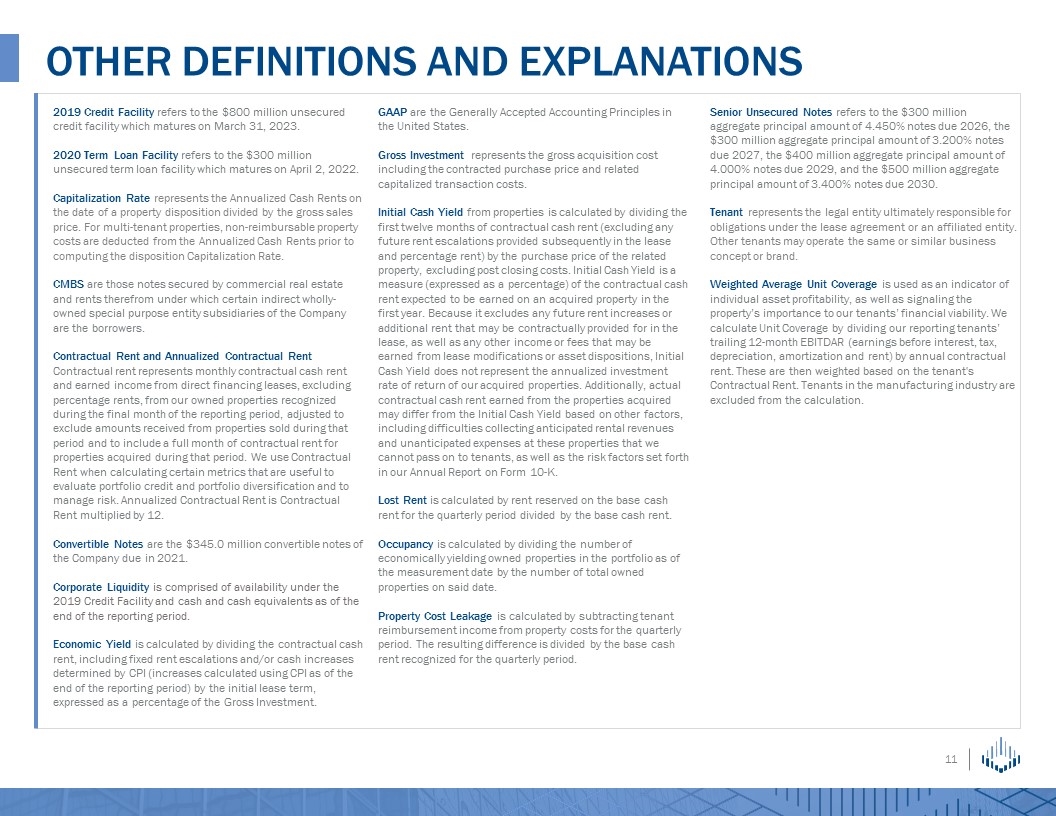
OTHER DEFINITIONS AND EXPLANATIONS 2019 Credit Facility refers to the $800 million unsecured credit facility which matures on March 31, 2023. 2020 Term Loan Facility refers to the $300 million unsecured term loan facility which matures on April 2, 2022. Capitalization Rate represents the Annualized Cash Rents on the date of a property disposition divided by the gross sales price. For multi-tenant properties, non-reimbursable property costs are deducted from the Annualized Cash Rents prior to computing the disposition Capitalization Rate. CMBS are those notes secured by commercial real estate and rents therefrom under which certain indirect wholly-owned special purpose entity subsidiaries of the Company are the borrowers. Contractual Rent and Annualized Contractual Rent Contractual rent represents monthly contractual cash rent and earned income from direct financing leases, excluding percentage rents, from our owned properties recognized during the final month of the reporting period, adjusted to exclude amounts received from properties sold during that period and to include a full month of contractual rent for properties acquired during that period. We use Contractual Rent when calculating certain metrics that are useful to evaluate portfolio credit and portfolio diversification and to manage risk. Annualized Contractual Rent is Contractual Rent multiplied by 12. Convertible Notes are the $345.0 million convertible notes of the Company due in 2021. Corporate Liquidity is comprised of availability under the 2019 Credit Facility and cash and cash equivalents as of the end of the reporting period. Economic Yield is calculated by dividing the contractual cash rent, including fixed rent escalations and/or cash increases determined by CPI (increases calculated using CPI as of the end of the reporting period) by the initial lease term, expressed as a percentage of the Gross Investment. GAAP are the Generally Accepted Accounting Principles in the United States. Gross Investment represents the gross acquisition cost including the contracted purchase price and related capitalized transaction costs. Initial Cash Yield from properties is calculated by dividing the first twelve months of contractual cash rent (excluding any future rent escalations provided subsequently in the lease and percentage rent) by the purchase price of the related property, excluding post closing costs. Initial Cash Yield is a measure (expressed as a percentage) of the contractual cash rent expected to be earned on an acquired property in the first year. Because it excludes any future rent increases or additional rent that may be contractually provided for in the lease, as well as any other income or fees that may be earned from lease modifications or asset dispositions, Initial Cash Yield does not represent the annualized investment rate of return of our acquired properties. Additionally, actual contractual cash rent earned from the properties acquired may differ from the Initial Cash Yield based on other factors, including difficulties collecting anticipated rental revenues and unanticipated expenses at these properties that we cannot pass on to tenants, as well as the risk factors set forth in our Annual Report on Form 10-K. Lost Rent is calculated by rent reserved on the base cash rent for the quarterly period divided by the base cash rent. Occupancy is calculated by dividing the number of economically yielding owned properties in the portfolio as of the measurement date by the number of total owned properties on said date. Property Cost Leakage is calculated by subtracting tenant reimbursement income from property costs for the quarterly period. The resulting difference is divided by the base cash rent recognized for the quarterly period. Senior Unsecured Notes refers to the $300 million aggregate principal amount of 4.450% notes due 2026, the $300 million aggregate principal amount of 3.200% notes due 2027, the $400 million aggregate principal amount of 4.000% notes due 2029, and the $500 million aggregate principal amount of 3.400% notes due 2030. Tenant represents the legal entity ultimately responsible for obligations under the lease agreement or an affiliated entity. Other tenants may operate the same or similar business concept or brand. Weighted Average Unit Coverage is used as an indicator of individual asset profitability, as well as signaling the property’s importance to our tenants’ financial viability. We calculate Unit Coverage by dividing our reporting tenants’ trailing 12-month EBITDAR (earnings before interest, tax, depreciation, amortization and rent) by annual contractual rent. These are then weighted based on the tenant's Contractual Rent. Tenants in the manufacturing industry are excluded from the calculation.
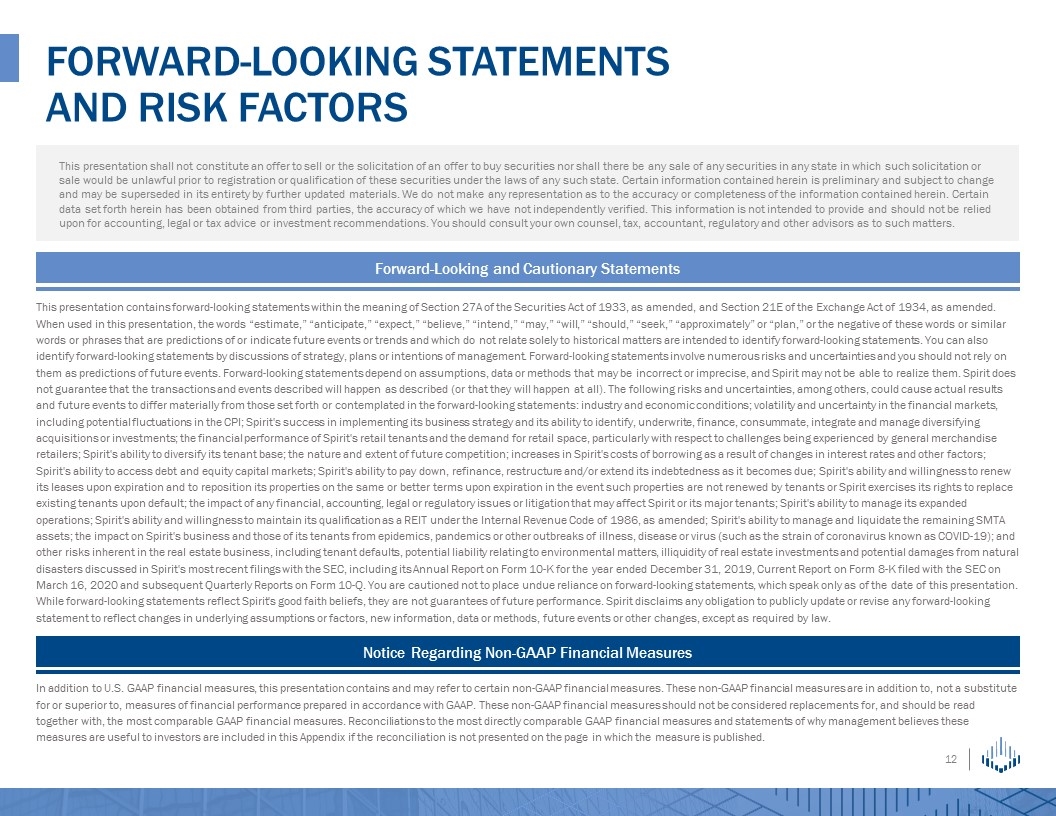
FORWARD-LOOKING STATEMENTS AND RISK FACTORS This presentation shall not constitute an offer to sell or the solicitation of an offer to buy securities nor shall there be any sale of any securities in any state in which such solicitation or sale would be unlawful prior to registration or qualification of these securities under the laws of any such state. Certain information contained herein is preliminary and subject to change and may be superseded in its entirety by further updated materials. We do not make any representation as to the accuracy or completeness of the information contained herein. Certain data set forth herein has been obtained from third parties, the accuracy of which we have not independently verified. This information is not intended to provide and should not be relied upon for accounting, legal or tax advice or investment recommendations. You should consult your own counsel, tax, accountant, regulatory and other advisors as to such matters. This presentation contains forward-looking statements within the meaning of Section 27A of the Securities Act of 1933, as amended, and Section 21E of the Exchange Act of 1934, as amended. When used in this presentation, the words “estimate,” “anticipate,” “expect,” “believe,” “intend,” “may,” “will,” “should,” “seek,” “approximately” or “plan,” or the negative of these words or similar words or phrases that are predictions of or indicate future events or trends and which do not relate solely to historical matters are intended to identify forward-looking statements. You can also identify forward-looking statements by discussions of strategy, plans or intentions of management. Forward-looking statements involve numerous risks and uncertainties and you should not rely on them as predictions of future events. Forward-looking statements depend on assumptions, data or methods that may be incorrect or imprecise, and Spirit may not be able to realize them. Spirit does not guarantee that the transactions and events described will happen as described (or that they will happen at all). The following risks and uncertainties, among others, could cause actual results and future events to differ materially from those set forth or contemplated in the forward-looking statements: industry and economic conditions; volatility and uncertainty in the financial markets, including potential fluctuations in the CPI; Spirit's success in implementing its business strategy and its ability to identify, underwrite, finance, consummate, integrate and manage diversifying acquisitions or investments; the financial performance of Spirit's retail tenants and the demand for retail space, particularly with respect to challenges being experienced by general merchandise retailers; Spirit's ability to diversify its tenant base; the nature and extent of future competition; increases in Spirit's costs of borrowing as a result of changes in interest rates and other factors; Spirit's ability to access debt and equity capital markets; Spirit's ability to pay down, refinance, restructure and/or extend its indebtedness as it becomes due; Spirit's ability and willingness to renew its leases upon expiration and to reposition its properties on the same or better terms upon expiration in the event such properties are not renewed by tenants or Spirit exercises its rights to replace existing tenants upon default; the impact of any financial, accounting, legal or regulatory issues or litigation that may affect Spirit or its major tenants; Spirit's ability to manage its expanded operations; Spirit's ability and willingness to maintain its qualification as a REIT under the Internal Revenue Code of 1986, as amended; Spirit's ability to manage and liquidate the remaining SMTA assets; the impact on Spirit's business and those of its tenants from epidemics, pandemics or other outbreaks of illness, disease or virus (such as the strain of coronavirus known as COVID-19); and other risks inherent in the real estate business, including tenant defaults, potential liability relating to environmental matters, illiquidity of real estate investments and potential damages from natural disasters discussed in Spirit's most recent filings with the SEC, including its Annual Report on Form 10-K for the year ended December 31, 2019, Current Report on Form 8-K filed with the SEC on March 16, 2020 and subsequent Quarterly Reports on Form 10-Q. You are cautioned not to place undue reliance on forward-looking statements, which speak only as of the date of this presentation. While forward-looking statements reflect Spirit's good faith beliefs, they are not guarantees of future performance. Spirit disclaims any obligation to publicly update or revise any forward-looking statement to reflect changes in underlying assumptions or factors, new information, data or methods, future events or other changes, except as required by law. Forward-Looking and Cautionary Statements Notice Regarding Non-GAAP Financial Measures In addition to U.S. GAAP financial measures, this presentation contains and may refer to certain non-GAAP financial measures. These non-GAAP financial measures are in addition to, not a substitute for or superior to, measures of financial performance prepared in accordance with GAAP. These non-GAAP financial measures should not be considered replacements for, and should be read together with, the most comparable GAAP financial measures. Reconciliations to the most directly comparable GAAP financial measures and statements of why management believes these measures are useful to investors are included in this Appendix if the reconciliation is not presented on the page in which the measure is published.
