Attached files
| file | filename |
|---|---|
| 8-K - FORM 8-K - Nikola Corp | tm2014949-1_8k.htm |
Exhibit 99.1

Nikola corporation Analyst day presentationApril 6th, 2020

DISCLAIMERS FOR ANALYST PRESENTATION:This presentation (this “Presentation”) is provided for informational purposes only and has been prepared to assist interested parties in making their own evaluation with respect to the proposed business combination between Nikola Motor Corporation (“Nikola” or the “Company”) and VectoIQ Acquisition Corp. (“VectoIQ”) and related transactions (the “Proposed Transactions”) and for no other purpose.No representations or warranties, express or implied are given in, or in respect of, this Presentation. To the fullest extent permitted by law in no circumstances will VectoIQ, Nikola or any of their respective subsidiaries, stockholders, affiliates, representatives, partners, directors, officers, employees, advisers or agents be responsible or liable for any direct, indirect or consequential loss or loss of profit arising from the use of this Presentation, its contents, its omissions, reliance on the information contained within it, or on opinions communicated in relation thereto or otherwise arising in connection therewith. Industry and market data used in this Presentation have been obtained from third-party industry publications and sources as well as from research reports prepared for other purposes. Neither VectoIQ nor Nikola has independently verified the data obtained from these sources and cannot assure you of the data’s accuracy or completeness. This data is subject to change. In addition, this Presentation does not purport to be all-inclusive or to contain all of the information that may be required to make a full analysis of Nikola or the Proposed Transactions. Viewers of this Presentation should each make their own evaluation of Nikola and of the relevance and adequacy of the information and should make such other investigations as they deem necessary.Important Information and Where to Find ItIn connection with the Proposed Transactions, VectoIQ has filed a registration statement on Form S-4, including a proxy statement/prospectus/information statement (the “Registration Statement”), with the SEC, which includes a preliminary proxy statement to be distributed to holders of VectoIQ’s common stock in connection with VectoIQ’s solicitation of proxies for the vote by VectoIQ’s stockholders with respect to the Proposed Transactions and other matters as described in the Registration Statement, a prospectus relating to the offer of the securities to be issued to the Company’s stockholders in connection with the Proposed Transactions, and an information statement to Company’s stockholders regarding the Proposed Transactions. After the Registration Statement has been declared effective, VectoIQ will mail a definitive proxy statement/prospectus, when available, to its stockholders. Investors and security holders and other interested parties are urged to read the proxy statement/prospectus/information statement, and any amendments thereto and any other documents filed with the SEC when they become available, carefully and in their entirety because they contain important information about VectoIQ, the Company and the Proposed Transactions. Investors and security holders may obtain free copies of the preliminary proxy statement/prospectus/information statement and definitive proxy statement/prospectus/information statement (when available) and other documents filed with the SEC by VectoIQ through the website maintained by the SEC at http://www.sec.gov, or by directing a request to: VectoIQ Acquisition Corp., 1354 Flagler Drive, Mamaroneck, NY 10543.Participants in the SolicitationVectoIQ and the Company and their respective directors and certain of their respective executive officers and other members of management and employees may be considered participants in the solicitation of proxies with respect to the Proposed Transactions. Information about the directors and executive officers of VectoIQ is set forth in the Registration Statement and other relevant materials to be filed with the SEC regarding the Proposed Transactions. Stockholders, potential investors and other interested persons should read the Registration Statement carefully before making any voting or investment decisions. These documents can be obtained free of charge from the sources indicated above.No Offer or SolicitationThis Presentation shall not constitute an offer to sell or the solicitation of an offer to buy any securities, nor shall there be any sale of securities in any jurisdiction in which such offer, solicitation or sale would be unlawful prior to registration or qualification under the securities laws of any such jurisdiction. No offering of securities shall be made except by means of a prospectus meeting the requirements of Section 10 of the Securities Act.

Forward-Looking StatementsThis Presentation includes certain statements that are not historical facts but are forward-looking statements for purposes of the safe harbor provisions under the United States Private Securities Litigation Reform Act of 1995. Forward-looking statements generally are accompanied by words such as “believe,” “may,” “will,” “estimate,” “continue,” “anticipate,” “intend,” “expect,” “should,” “would,” “plan,” “predict,” “potential,” “seem,” “seek,” “future,” “outlook,” and similar expressions that predict or indicate future events or trends or that are not statements of historical matters. These forward-looking statements include, but are not limited to, statements regarding estimates and forecasts of revenue and other financial and performance metrics, projections of market opportunity and expectations, timing of various business milestones, and projected business model and related assumptions; VectoIQ’s ability to consummate a transaction with the Company; VectoIQ’s ability to obtain the financing necessary to consummate the Proposed Transactions; and the expected timing of completion of the Proposed Transactions. These statements are based on various assumptions and on the current expectations of VectoIQ’s and the Company’s management and are not predictions of actual performance. These forward- looking statements are provided for illustrative purposes only and are not intended to serve as, and must not be relied on by any investor as, a guarantee, an assurance, a prediction or a definitive statement of fact or probability. Actual events and circumstances are difficult or impossible to predict and will differ from assumptions. Many actual events and circumstances are beyond the control of VectoIQ and the Company. These forward looking statements are subject to a number of risks and uncertainties, including general economic, financial, legal, political and business conditions and changes in domestic and foreign markets; the potential effects of COVID-19; the outcome of judicial proceedings to which the Company is, or may become a party; the inability of the parties to enter into definitive agreements or successfully or timely consummate the Proposed Transactions or to satisfy the other conditions to the closing of the Proposed Transactions, including the risk that any required regulatory approvals are not obtained, are delayed or are subject to unanticipated conditions that could adversely affect the combined company; the risk that the approval of the stockholders of VectoIQ for the Proposed Transactions is not obtained; failure to realize the anticipated benefits of the Proposed Transactions, including as a result of a delay in consummating the Proposed Transaction or difficulty in, or costs associated with, integrating the businesses of VectoIQ and the Company; the amount of redemption requests made by VectoIQ’s stockholders; the occurrence of events that may give rise to a right of one or both of VectoIQ and the Company to terminate the Business Combination Agreement; risks related to the rollout of the Company’s business and the timing of expected business milestones; changes in the assumptions underlying the Company’s expectations regarding its future business or business model; the availability of capital; the effects of competition on the Company’s future business; and those factors discussed in the Registration Statement under the heading “Risk Factors,” and other documents of VectoIQ filed, or to be filed, with the SEC. If the risks materialize or assumptions prove incorrect, actual results could differ materially from the results implied by these forward-looking statements. There may be additional risks that neither VectoIQ nor the Company presently do not know or that VectoIQ and the Company currently believe are immaterial that could also cause actual results to differ from those contained in the forward-looking statements. In addition, forward-looking statements reflect VectoIQ’s and the Company’s expectations, plans or forecasts of future events and views as of the date of this Presentation. VectoIQ and the Company anticipate that subsequent events and developments will cause their assessments to change. However, while VectoIQ and the Company may elect to update these forward-looking statements at some point in the future, VectoIQ and the Company specifically disclaim any obligation to do so. These forward-looking statements should not be relied upon as representing VectoIQ’s or the Company’s assessments as of any date subsequent to the date of this Presentation. Accordingly, undue reliance should not be placed upon the forward-looking statements.Use of ProjectionsThis Presentation contains projected financial information with respect to Nikola. Such projected financial information constitutes forward-looking information, and is for illustrative purposes only and should not be relied upon as necessarily being indicative of future results. The assumptions and estimates underlying such financial forecast information are inherently uncertain and are subject to a wide variety of significant business, economic, competitive and other risks and uncertainties. See “Forward-Looking Statements” above. Actual results may differ materially from the results contemplated by the financial forecast information contained in this Presentation, and the inclusion of such information in this Presentation should not be regarded as a representation by any person that the results reflected in such forecasts will be achieved.Financial Information; Non-GAAP Financial MeasuresThe financial information and data contained in this Presentation is unaudited and does not conform to Regulation S-X. Accordingly, such information and data may not be included in, may be adjusted in or may be presented differently in, the Registration Statement or any other document to be filed by VectoIQ with the SEC. Some of the financial information and data contained in this Presentation, such as EBIT, EBITDA and EBITDA Margin, has not been prepared in accordance with United States generally accepted accounting principles (“GAAP”). VectoIQ and Nikola believe these non-GAAP measures of financial results provide useful information to management and investors regarding certain financial and business trends relating to Nikola’s financial condition and results of operations. Nikola’s management uses these non-GAAP measures for trend analyses, for purposes of determining management incentive compensation, and for budgeting and planning purposes. VectoIQ and Nikola believe that the use of these non-GAAP financial measures provides an additional tool for investors to use in evaluating projected operating results and trends in and in comparing Nikola’s financial measures with other similar companies, many of which present similar non-GAAP financial measures to investors. Management does not consider these non-GAAP measures in isolation or as an alternative to financial measures determined in accordance with GAAP. The principal limitation of these non-GAAP financial measures is that they exclude significant

expenses and income that are required by GAAP to be recorded in Nikola’s financial statements. In addition, they are subject to inherent limitations as they reflect the exercise of judgments by management about which expense and income are excluded or included in determining these non-GAAP financial measures. In order to compensate for these limitations, management presents non-GAAP financial measures in connection with GAAP results. You should review Nikola’s audited financial statements, which are included in the Registration Statement.TrademarksThis Presentation contains trademarks, service marks, trade names and copyrights of VectoIQ, Nikola and other companies, which are the property of their respective owners.

Key LeadershipTrevor Milton Nikola CEO(1) • Visionary leader with passion for innovation and disruption • Directs research, development and prototype assembly of the Nikola portfolio • Prior to Nikola, Trevor was the CEO of dHybrid Systems, LLC, a natural gas storage technology company that was acquired by Worthington Industries, Inc.Mark Russell Nikola President(1) • Over 20 years of experience building and managing companies in the manufacturing industry • Served as president and COO of Worthington Industries (NYSE:WOR) from 2012-2018 • Previously served as GM of Engineered Aerospace Products at Alcoa. Inc (NYSE:AA) • Education: BS from Weber State University and JD from Brigham Young UniversityKim Brady Nikola CFO • Over 20 years of experience in private equity and investment banking • Served as Sr. Managing Director at Solic Capital• Previously served as CFO and GM for various companies in manufacturing, business services, and healthcare • Education: BS from Brigham Young University and MBA from Northwestern’s Kellogg Graduate School of ManagementSteve Girsky VectoIQ Acquisition Corp CEO(1) • 30 years of experience working with corporate board executives, labor leaders, OEM leaders, suppliers, dealers, and national policy makers • Institutional Investor top-ranked auto analyst for many years • Former GM Vice Chairman; helped lead GM out of bankruptcy, stabilized its European operations and led overall GM strategy • Current and former public boards:1. Trevor Milton to assume Executive Chairman role, Mark Russell to assume Chief Executive Officer role and Steve Girsky to join Nikola board post-closing

0 Zero EmissionsAn opportunity to invest in scalable clean technology1 One global truck platformTwo market solutions: BEV for short haul and FCEV for long haul applicationsThree Core Business offerings: BEV, FCEV, and Hydrogen production and refueling

i. Nikola company introduction

We are NikolaA unique business model…Vision: to be the zero emissions commercial transportation system leaderAddressing Huge “Green-to-Wheel” Commercial Vehicle Ecosystem TAM • Estimated $600B+ Global TAM comprised of both vehicle and energy supply(1) • Tightening global emissions standards require a zero emissions solutions over the near-termIndustry Leading Technology Portfolio to Address Specific Use Cases • BEV truck with best-in-class range and capabilities, ideally suited for shorter-haul applications • World’s most advanced Hydrogen (H2) FCEV Truck, ideally suited for long-haul applicationsEnabled by World Class Partnerships and Investments by Strategic Players • Partnership and European JV with CNHI IVECO, a global Commercial Vehicle OEM • Strong partnerships throughout transportation ecosystem to de-risk businessPace-Setting Speed-to-Market • Planned 2021 BEV launch • Planned 2023 FCEV launch and H2 station operationsMeeting Strong Demand from Blue Chip Customers • $10B+ FCEV pre-order book (2+ years of orders), with robust demand for newly introduced BEV truck • Anheuser-Busch piloting fleet and H2 station operationsOn a Path to Effectively Scale Green Energy Storage to Ultimately Transform Transportation Fueling Landscape • Partnered with NEL to develop first-in-kind H2 station infrastructureWith a Deep Roster of Management Talent to Pursue Vision of Zero Emission Transportation Ecosystem1. $600B TAM includes truck, repair & maintenance and fuel based on proprietary research from ACT Research

Powered by a unique business strategyTogether, the distinct business offerings enable disruption across the “Green-to-Wheel” value chainKey nikola Facts Overview of Strategic Partnerships • Founded in 2015 by Trevor Milton • Based in Phoenix, AZ with ~250 employees • +14,000 FCEV truck reservations to-date (~$10B sales value), with robust demand for newly-introduced BEV truck • +$500M of capital raised to-date(1)Core business Platform enabledBEV Truck• BEV powered truck • Industry-leading range of up to 300 miles • Leverage existing FCEV work and partnership with CNHI to co-develop BEV truck for production in the next 12 – 18 monthsShorter-haulFCEV Truck• H2 FCEV powered truck • 500 – 750 mile range • Attractive “bundle pricing” model (truck, fuel, maintenance)Long-haulH2 Stations• Economically produce H2 fuel via electrolysis • Initial methodical roll-out of targeted station development along “dedicated routes” • Electricity input (grid, solar, wind) purchased via long-term supply agreementsH2 Production and Refueling of FCEVAutonomous Ready• Level 4 hardware standard • Automatic braking and lane keeping • Full fleet management solutions and data capturing • Over-the-air software updatesCapacity-as-a-ServiceGrid Storage and BEV Charging• Leverage technology and infrastructure to act as a grid buffer and to capture intermittent energy sources • Provide BEV charging solutions to short-haul customersEnergy-as-a-ServiceComplementary offerings: with significant overlap inSignificantly increasesAdditional growth opportunities based on truckcomponents; BEV and FCEV address different use casesaddressable market vs. truck offering aloneand H2station platform1. Amount includes in-kind contribution of services from CNHI (see slide 12 for additional detail); does not include capital from VectoIQ transaction

demonstrating significant growth and progress on vision since 2015Over $500M raised to date to support commercialization of unique business modelTrevor Milton founds NikolaPrototype of Nikola One UnveiledBosch co- development and strategic supply chain partnership establishedSigned binding agreement to provide Anheuser- Busch with up to 800 trucksUnveiled fully operational Nikola Two Alpha trucks at Nikola World; most advanced FCEV truck on the planet2015 2016 2017 2018 2019Build-out of team, hired: – Chief Engineer – Chief Designer – Battery EngineerSigned sales and service agreement with Ryder SystemsNel announced as sole equipment supplier for hydrogen stationsSigned Hydrogen Station Development agreement with NelEntered North America production alliance and European joint venture with CNHI IvecoN/AN/A~7,900 FCEV$16M Series A @ $300M pre-money valuation~8,200 FCEV$44M Series B @ $900M pre-money valuation~14,000 FCEV$214M Series C @ $1.1B pre-money valuationReservation book frozen; negotiating with strategic fleet partners for launch and pursuing binding contractsSecured $250M investment from CNHI Iveco as part of Series D representing a pre-money valuation of $3B

Technology portfolio addresses complementary use cases general technology comparisonNikola is the only company offering both BEV and FCEV solutions; addressing both short-haul and long-haul marketsHydrogen-ELECTRIC 100% Battery Electric Dieselprimary power unit (ppu) Hydrogen Fuel Cell Battery Diesel EngineRefuel/Charge time 10-15 minutes Several Hours 10-15 minutes Complementary Use Cases500-750 miles (Long-haul)100-300 miles (Medium-/Short-haul) 500-750 milesRefill affect on electrical gridHydrogen stations act as buffer & balance gridRecharge to be managed within grid load capacityN/APPU Sustainability profileHydrogen is the most abundant element on planetDependent on further advances in technologyAccess to oil reserves can be costly and prices are highly volatileImpact on Emissions Zero emission vehicle Zero emission vehicleHeavy emission vehicle unlikely to adhere to future regulations on emissions standardsEst. Vehicle weight ~22,000-24,000 lbs ~25,000-27,000 lbs ~17,000-19,000 lbsEst. hauling capacity(1) ~56,000-58,000 lbs ~53,000-55,000 lbs ~61,000-63,000 lbs1. Estimated hauling capacity includes both cargo capacity and the weight of the trailer

World class strategic partnerships…Marquee Co-Development PartnersNikola’s extensive network of strategic partnerships significantly reduces execution risks, improves commercialization timeline, and provides long-term competitive advantage• International leader in the development, manufacture, marketing, and servicing of a vast range of light, medium, and heavy commercial vehicles• Series D investor and partner in 50/50 European joint venture and North American production alliance• Leading global supplier of technology and services to automotive, industrial, energy, building technology, and consumer end markets with ~410,000 employees and ~$90B in annual revenue• Series B and C investor and powertrain design (e.g., fuel cell, battery, VCU) co-development partner- Any related IP will be jointly owned by NikolaOther Key Industry Partners• One of the world´s largest and most recognized photovoltaic manufacturers and energy providers• Series C investor and exclusive solar panel provider• Largest producer of electrolyzers and other hydrogen equipment• Series C investor and hydrogen production equipment supplier (electrolyzers and other components for hydrogen stations)• Leading global supplier of braking control components and air management systems to medium- and heavy-duty trucks• Series B investor in Nikola and brake traction and stability control system developer• #1 global engineering service provider to the Commercial Vehicle industry for cab development• Cab and Chassis engineer• Largest truck leasing company in the U.S. with over 800 service centers and 6,000 highly trained technicians• Exclusive sales and service partner• World's largest independent company for the development, simulation and testing of powertrains• Designer and developer of first-in-class vehicle and hydrogen fuel cell test facility

…anchored by landmark partnership with cnhi ivecoPartnership with CNHI Iveco significantly de-risks North America production execution and accelerates penetration of attractive European marketWho is CNHI Iveco? One of World’s Leading Capital Good Companies with Annual Revenue of $30B+ • CNHI’s Iveco business is a leading truck, bus, and light commercial vehicle manufacturer in Europe, South America, and Asia with 175,000+ annual unit volume(1)• Currently the leader in CNG/LNG alternative propulsion for the European trucks market, complementary to investment in Nikola BEV and FCEV technology• Announced plan to spin-off as an independent company in 2021Investment Summary CNHI Iveco’s invested $250M in Nikola as Part of Series D Round • $100M cash investment• $150M investment in form of in-kind services related to North America engineering and production• Announced September 3, 2019Additional Details• CNHI Iveco engineers to embed with Nikola team to develop production-ready truck and leverage its expertise across all elements of the manufacturing process• Nikola/CNHI Iveco product to be produced on dedicated lines within existing Iveco manufacturing facilitiesPartnership and JV North America Engineering and Production Alliance (100% of N.A. Business Retained by Nikola) • Significantly de-risks Nikola operational execution by leveraging the expertise and capabilities of one of the world’s leading commercial vehicle manufacturers• CNHI Iveco to provide $150M of engineering and production to support bringing Nikola trucks to marketEurope Joint Venture (50/50 Split)• Allows Nikola to accelerate penetration of attractive European addressable market while minimizing execution risk and optimizing Nikola management bandwidth• Nikola and CNHI’s Iveco truck business to operate 50/50 joint venture leveraging Iveco’s engineering expertise and existing production and sales/service footprintSignificant potential financial contribution from joint venture is incremental to existing Nikola North America modelKey Benefits• Production alliance significantly de-risks truck manufacturing execution by providing:- Global license to the S-Way platform – the most recently introduced Class 8 truck in the world - Ability to leverage existing parts bin and capture purchasing savings - Access to engineering support - Potential assembly capabilities• Enables Nikola to enter significantly larger European market1. CNHI delivered ~175,900 vehicles in 2018; includes trucks, buses, light commercial, and specialty vehicles

Robust blue chip demand for a zero emissions transportation solutionNikola has over 14,000 FCEV truck pre-orders, with robust demand for newly introduced BEV truckSummary of FCEV truck Reservations prior to book freeze in fall 2019Additional reservations detail# of Trucks • Nikola BEV demand: following unveiling of Nikola BEV truck in Fall 2019, company has been engaged with potential strategic customersFCEV reservation book frozen; negotiating with strategic fleet partners to convert pre-orders to binding contracts with deposits for initial FCEV rollout- Discussion focused on multi-thousand truck pre-orders with binding contracts with significant deposits 12 months prior to deliveryAll Other Reservations Holders ~5,300 36%Other Fleets with at least 100 TrucksTotal 14,602 FCEV trucks~$10.2B realizable valueLarge U.S. Fleet Owner ~5,000 34%Large Truck Leasing- Robust BEV demand projected to fill first 2 – 3 years of production • FCEV demand equally robust, with reservation book projected to fill first 2+ years of productionThemes Driving Demand • Commercial vehicle purchasing decision driven by Total Cost of Ownership (TCO) of vehicle, including cost of truck, fuel, and maintenance - Nikola’s unique FCEV Bundled Lease model ensures TCO cost parity with diesel as well as TCO consistency and predictability for fleet operatorsReserved ~1,500 10%Large Equipment Providers ~500 4%AB Inbev 800 6%Companies ~1,500 10%• Corporations are increasing focus and efforts to reduce greenhouse emissions in their value chains• AB Inbev pre-order for 800 trucks represents a binding order • Majority of FCEV reservations (~65%) reflect large corporate customers with investment grade credit ratings

Other Nikola Programs Nikola can leverage zero emission powertrain expertise to address transportation adjacenciesBadger & PowerSports Strategy• Programs provide significant benefit to core semi-truck and H2 station programs, including:Badger Pickup Truck- Branding halo, driving awareness of Nikola and its industry-defining technology- R&D synergies on electric drivetrain, battery technology, and other core components• Nikola is pursuing business models for Badger and PowerSports that will provide financial upside with minimal• 600 miles on blended FCEV / BEV • 300 miles on BEV alone • Operates on blended FCEV / BEV or BEV only by touch of a buttonPowerSports• 906 HP peak / 455 HP continuous • 980 ft. lbs. of torque • 160 kWh, flooded module - lithium-ion battery and 120 kW fuel cellcapital outlay or management distraction• Management team remains focused on core semi-truck and H2 station programs and executing on Nikola’s business planFULLY-ELECTRIC FOUR-SEATER OHVMichael Erickson, President of Powersports• Leads Nikola PowerSports business • An energy and powersports industry veteranMILITARY GRADE FULLY-ELECTRIC TACTICAL OHVANDREW CHRISTIAN, VP, BD / DEFENSE POWERSPORTS• Retired from Marine Corps with 28+ years of active duty service • Marine Special Operations Officer and combat veteranFULLY-ELECTRIC SIT-DOWN PERSONAL WATERCRAFTJordan darling, Vp, Powersports• Oversees PowerSports division of both UTVs and watercraft • Founder of Free Form Factory

Deep bench of experienced management key to making the vision a realityTrevor Milton Executive Chairman(1)Nikola’s management team brings together proven leaders with deep industry and domain expertiseMARK RUSSELL President & CEO(1)KIM BRADY CHIEF FINANCIAL OFFICERDane Davis Chief Technology officerUMRAN ASHRAF HEAD OF VEHICLE ENGINEERINGCorporate FunctionsBritton Worthen Chief Legal OfficerJoseph Pike Chief Human Resources OfficerElizabeth Fretheim Head of Business DevelopmentVince Caramella Head of marketingSafety, Supply Chain, and HydrogenNha Nguyen Safety OfficerMike Chaffins Senior Director, Supply Chain and PurchasingDale Prows Head of Hydrogen Supply chainLivio Gambone Head of Hydrogen StorageDesign, Powertrain, and SoftwareKevin Lynk Chief engineer, powertrainVaroujan Sarkissian Head of Vehicle Electrical and ControlsErik Tuft Senior DesignerIsaac sloan Chief Software ArchitectVehicle EngineeringRon Johnson Senior Technical Lead, ChassisChristopher Eckert Senior Technical Lead, CabSaeid Emami Senior Technical Lead, CAEAlain Hadorn Senior Director, Program Management and Quality1. Titles reflect roles post-closing

ii. Nikola Market overview and business model summary

Overview of Nikola's Addressable marketNikola can service estimated $600B TAM with BEV and unique FCEV bundle pricing model that includes truck, fuel, and maintenanceBEV / FCEV Market opportunity(1)Key drivers for zero emission commercial vehicle demandGlobal Class 8 Truck Market: • ~$600B Total Addressable Market(2) / ~7M Trucks in ServiceBEV Short-haul Focus: U.S. Class 8 Truck MarketGlobal Heavy Duty Truck Market• Commercial vehicle buying decision driven by Total Cost of Ownership (TCO)• The largest Class 8 fleets are replaced every 3-5 years on average — adoption of new technology is expected to be rapid once it passes TCO parity threshold• Increasingly stringent global emissions standards will increase comparative advantage of zero emissions vehicles relative to diesel• ~$130B TAM(2) / ~2M Trucks in ServiceU.S. Class 8 Truck Market• In some cases, such as city centers, diesel will be banned entirely• Governments, fleet owners, and other stakeholders are demanding a zero emissions solutionBreakdown of U.S. Class 8 $130B TAMN.A. CLASS 8 TRUCK SEGMENT STRATEGY FOR INITIAL ROLLOUT OF FCEV 1,800,000 CLASS 8 semi-TRUCKSService and Maintenance $29B 22%Diesel $63B 49%Truck $37B 29%~75% 1,350,000 TRUCKSOn the road daily(1)~25%+ 450,000 TRUCKS RUN ON DEDICATED ROUTES• Dedicated routes are primarily comprised of private fleets and dedicated operations of large for-hire carriers • For initial rollout of FCEV, Nikola will target the largest private and dedicated fleets with either nationwide or significant regional distribution networks • Focus on dedicated routes allows for targeted, capital-efficient deployment of hydrogen stations1. Includes both short-haul and long-haul heavy duty truck markets 2. Including vehicle, fuel, and service & maintenance; based on proprietary research from ACT Research

SELECT medium and heavy duty bev and fcev announcementsNikola is positioned to be a first mover in both BEV and FCEV, with an advanced state of truck developmentBev announcementseActros Class 8 Truck Serial production 2021CF Electric Short Haul and Refuse Fleet trials 2019• Market is awakening to the vast potential of BEV and FCEV heavy duty trucks• Nikola trucks are in advanced stages of development and testing and are expected to meet specific use case needs, supporting potential rapid market adoptionTruckseCascadia Class 8 Truck Serial production 2021E-Fuso Vision One Class 8 Truck Serial production 2021FL and FE Medium and Heavy Duty Serial production March 2020Z.E. Lineup Short Haul and Refuse Pre-series model testing 2H19LR Refuse Refuse Testing 2020AEOS Class 7 Truck Announced production 2020ET-1 Class 8 Truck Announced production 2019Plan to spend €1B+ in electro mobility by 2025Semi Class 8 Truck Limited production 2020International eMV Medium Duty Production 2021Fcev announcementsSame Truck GroupFCEV Truck Heavy Duty Limited production Q4 2019 (10 units)H2 XCIENT Heavy Duty Production 2023Trucks Announced goal to have H2 series- production vehicles by the end of the 2020sFCEV Truck Class 8 Truck No announced production

Nikola’s advantage: BUNDLED FCEV OFFERING significantly more attractive than DIESELTHE INDUSTRY’S FIRST-EVER “BUNDLED PRICING”– 7-year lease/700,000 miles– Lease includes the cost of truck, hydrogen fuel, repair, and maintenance– Lease model eliminates payback period and technology risk for customers, enabling more rapid adoptionPROJECTED NIKOLA FCEV VS. DIESEL COST PER MILE $1.20Increasing cost of diesel operations due to tightening emission standards reinforces Nikola’s bundled FCEV TCO advantage vs. traditional diesel truck ownershipTotal cost of ownership certainty Historically, diesel fuel has comprised anywhere from 40-60% of total ownership costs(1). Nikola’s Bundled Lease offers operators complete cost predictability at cost parity with dieselBetter Performance Outperforms diesel and battery trucks in range, horsepower and torque. Shorter recharge time than battery electric trucksEnhanced Safety 6x2 drive, torque vectoring, faster stopping, lower center of gravity$1.00$0.80$0.60$0.40$0.20$0.00Total TCO: $0.95 per MileIncludes all vehicle, service & maintenance, and fuel costsNIKNOIKLOALFACEVTotal TCO(2): ~$0.97 per MileFuel Cost: ~$0.51 per MileService & Maint: ~$0.21 per MileVehicle Payments: ~0.26 per MileTraditional DieselHydrogen Safer than Diesel Lower vapor pressure, will not form combustible mixture with air, harder to ignite, hydrogen dissipates into atmosphere Extensive safety testing performed by third-party expertsEnvironmentally Friendly Zero emissions and nearly silent. Hydrogen stations powered by renewablesAutonomous Ready Enhanced autopilot, automatic braking, and automatic lane keeping standard on each vehicleTCO Certainty TCO Volatility1. Based on prior 7 years’ data from ATRI, excluding driver costs 2. Cost per mile data is based on proprietary research from ACT Research and ATRI’s 2018 Operational Cost of Trucking; fuel is based on the prior 7 years’ average given volatility of input costs

single fcev truck lease unit economicsEach individual FCEV truck lease is anticipated to have steady cash generation over the life of the leasePROJECTED CASH GENERATED PER TRUCK LEASE$665,000$188,17$230,63Projected Nikola Lease Model Economics(1)Gross Revenue $665,000Materials $173,624Labor - direct and indirect 7,500Warranty Expense @ 3.0% of Truck Revenue 7,050Truck Cost $188,174Nikola Cost per kg of Hydrogen $2.47 x kg of Hydrogen used over 700,000 miles @ 7.5 Miles/kg 93,333 Hydrogen Cost Per Truck Lease(2) $230,637$46,760$26,365$173,064Service & Maintenance Cost @ $0.067/Mile $46,760Total Service & Maintenance Cost $46,760Total Cost of Nikola Lease $465,571Vehicle Profit Per Nikola Lease (Before Corporate G&A)(3) $199,429 Vehicle Profit Margin 30.0%LEASETRUCKTOTALSERVICE,STATIONCASH PERREVENUEMATERIALS & FUELING COST LABORMAINT. AND OTHERCAPEX PER LEASETRUCK LEASEStation CapEx per Lease(4) $26,365 Cash Generated per Truck Lease(5) $173,0641. Analysis does not include potential financing charges that may be incurred to securitize and monetize some portion of the Nikola lease 2. Hydrogen fuel cost includes all hydrogen station related operating expenses including electricity costs, water costs, station personnel cost, and hydrogen station maintenance 3. Vehicle profit presented before corporate general and administrative expenses 4. Assumes each station has a 21-year useful life and supports 210 truck leases during each 7-year lease period 5. Does not include any potential upside from truck residual value at the end of the lease

FcEV Truck demand catalyzes build out of hydrogen infrastructureBenefits of Hydrogen Production and Refueling• Fast refuel time – similar to today’s refueling time for diesel engines• Hydrogen fuel can be produced from a variety of renewable sources• Hydrogen production serves as a load balancing mechanism for the grid-enabling further incorporation of renewable power sources• Hydrogen can provide an effective form of storage for intermittent energy sourcesHydrogen is an efficient storage method of renewable electricity, with potential to reduce stress on gridLeading the Charge for Industry Standards• Nikola and other industry leaders signed an MOU in early 2019 to assist in standardization and increase the speed to market for critical hydrogen fueling components• Nikola team member is the chair of the ISO/TC 197 international working group that will be responsible for standardizing the consortium’s effortsHydrogen as energy storageWater HydrogenElectrolysis process utilizes water and electricity to create Hydrogen and OxygenFuel CellElectricityWater (By-product)Partnership with NEL provides access to deep electrolysis H2 production expertise to deliver zero emissions transportation ecosystem90+ Years of Experience>3,500 Electrolyzers Delivered~50 H2 Fueling Stations InstalledElectricityOxygen (By-product)Customers in 80+ CountriesDesigned 1st Country-Wide H2 Network(1)1. NEL designed Danish planned H2 network, expected to initially consist of 11 stations utilizing NEL’s electrolysis technology
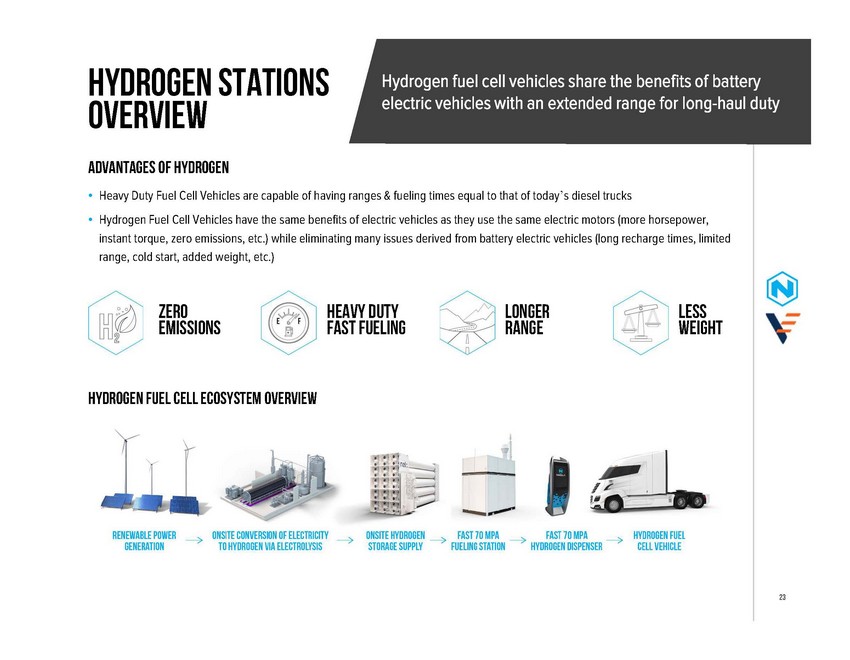
Hydrogen stations overviewHydrogen fuel cell vehicles share the benefits of battery electric vehicles with an extended range for long-haul dutyADVANTAGES OF HYDROGEN• Heavy Duty Fuel Cell Vehicles are capable of having ranges & fueling times equal to that of today’s diesel trucks• Hydrogen Fuel Cell Vehicles have the same benefits of electric vehicles as they use the same electric motors (more horsepower, instant torque, zero emissions, etc.) while eliminating many issues derived from battery electric vehicles (long recharge times, limited range, cold start, added weight, etc.)ZERO EMISSIONSHEAVY DUTY FAST FUELINGLONGER RANGELESS WEIGHTHYDROGEN FUEL CELL ECOSYSTEM OVERVIEW

H2 Station Roll-out DEDICATED SINGLE-STATION strategyTargeting dedicated routes segment enables a focused roll out of H2 station network to optimally manage capital outlayHYDROGEN STATION ROLL-OUT STRATEGY• Hydrogen fueling stations will be built one at a time along dedicated routes, based on customer need and network optimizationPROJECTED TOTAL STATION CAPEXOne Time Station Related CapexStati on Producti on and Fuel i ng Equi pment(1)$ 14,860,000• ~450,000 trucks, or ~25% of total fleets(2),Land and Bui l di ng 1,750,000operate along dedicated routes, typically between a plant and distribution center alongTotal Station CapEx$ 16,610,000major freight corridors210 Trucks x 3 Product Cycl es 630• Initial build out of ~1,200 station equivalents(3) will be developed to serve this section of the market (based on 210 trucks per 8,000kg station)Total Station Capex per 7-year Truck Lease$ 26,365• Station locations determined by pre-orders, selecting customers with routes along the most trafficked freight corridors• First stations may potentially operate as hubs, allowing fleets to refuel within a 250-mile radius• Projected average one-time station capex ofKey Hydrogen Station Components$16.6M expected to support 630 leases over 21 years – improvements in technology are expected to reduce capex by 10% in 2025 and beyondNEL A-485 electrolyzer 1,000kg/day 2.2MW50MPa Hydrogen StorageDual H2Station® Fueling 1,000kg/day two dispensers1. Includes transformer/rectifier, electrolyzers, supply compressors, hydrogen storage, fueling station equipment, dispensers and installation 2. Management/industry source estimate 3. Equivalent of 1,200 stations producing 8,000kg; actual number of locations will likely vary as some stations will produce >8,000kgs

H2 Station Roll-out DEDICATED SINGLE-STATION strategyTargeting dedicated routes segment enables a focused roll out of H2 station network to optimally manage capital outlayHYDROGEN STATION ROLL-OUT STRATEGY• Hydrogen fueling stations will be built one at a time along dedicated routes, based on customer need and network optimizationPROJECTED TOTAL STATION CAPEXOne Time Station Related CapexStati on Producti on and Fuel i ng Equi pment(1)$ 14,860,000• ~450,000 trucks, or ~25% of total fleets(2),Land and Bui l di ng 1,750,000operate along dedicated routes, typically between a plant and distribution center alongTotal Station CapEx$ 16,610,000major freight corridors210 Trucks x 3 Product Cycl es 630• Initial build out of ~1,200 station equivalents(3) will be developed to serve this section of the market (based on 210 trucks per 8,000kg station)Total Station Capex per 7-year Truck Lease$ 26,365• Station locations determined by pre-orders, selecting customers with routes along the most trafficked freight corridors• First stations may potentially operate as hubs, allowing fleets to refuel within a 250-mile radius• Projected average one-time station capex ofKey Hydrogen Station Components$16.6M expected to support 630 leases over 21 years – improvements in technology are expected to reduce capex by 10% in 2025 and beyondNEL A-485 electrolyzer 1,000kg/day 2.2MW50MPa Hydrogen StorageDual H2Station® Fueling 1,000kg/day two dispensers1. Includes transformer/rectifier, electrolyzers, supply compressors, hydrogen storage, fueling station equipment, dispensers and installation 2. Management/industry source estimate 3. Equivalent of 1,200 stations producing 8,000kg; actual number of locations will likely vary as some stations will produce >8,000kgs

Station infrastructure and developmentPartnered with NEL to develop first-in-kind hydrogen station infrastructureNikola Demo Station DevelopmentDemo Station: Nikola HQ (Phoenix, AZ)• Station Timing: completed Q1 2019• Station Offers: H2 storage and dispensing• Other: onsite storage 1,000 kgR&D 8-Ton Station: R&D Facility (Phoenix, AZ)• Station Timing: begin Q2 2020, complete by Q4 2021• Station Offers: H2 production, storage, and dispensing• Other: (8) 1-ton electrolysers onsite capable of producing 8,000 kgs of hydrogen per dayAB 8-Ton Pilot Station: Van Nuys, CA• Station Timing: begin Q4 2020, complete by mid-2022• Station Offers: H2 production, storage, and dispensing• Other: (8) 1-ton electrolysers onsite capable of producing 8,000 kgs of hydrogen per dayDemo Station #1

Dedicated fcev fleet roll out case study Anheuser-Busch (AB) AB PILOT STATIONInitial site selection determined based on customers’ dedicated routes• Currently working with Nel to build 8-ton hydrogen station near the Anheuser-Busch brewery in Van Nuys, CA• Station capable of producing 8,000 kgs of hydrogen per day• Station expected to be fully commissioned in 2022• Fleet Test Beta Trucks with AB Starting mid-2021 utilizing Phoenix hydrogen station until Van Nuys station complete in 2022• Nikola’s first two stations are planned to support approx. 400 miles interstate along I-10 between AB’s Van Nuys, CA brewery and a third- party distribution partner located in Chandler, AZANHEUSER-BUSCH STATION LOCATIONS• AB to convert entire distribution fleet (approx. 800 trucks) to Nikola trucks• AB has 12 breweries and 6 distribution centers located across the United States• Nikola anticipates developing a hydrogen station near each brewery location to provide access to each distribution center• Additional stations may be developed at certain distribution centers depending on the roundtrip length of the lane

iiI. Nikola Truck Development strategy and timeline

North America BEV truck Timeline Projected Road Map to Fleet Testing (2020 – 2021)Nikola’s partnership with Iveco accelerates the development and production of a BEV truck, shortening its go-to-market strategy by 1 to 1 ½ years• Plan: Take the current Iveco S-Way platform and electrify the powertrain • Iveco Responsibilities: Cab, chassis, and vehicle integration • Nikola Responsibilities: e-Axle (motors and inverters), battery pack, BMS, vehicle controls strategy, and infotainment • Production Strategy: 1) import units from Iveco’s Ulm Facility, 2) CKD production in US, 3) full production in US • Projected Schedule: o Unveil first truck in Hanover on Sept. 24, 2020 o Utilize Iveco’s Ulm facility in Germany for prototype, pre-series, and low volume builds in 2020 and 2021 o Begin limited testing with fleets in Q4 2020 o Enter low volume production in Q1 20212020 20212022Jan Feb Mar Apr May Jun July Aug Sept Oct Nov Dec Jan Feb Mar Apr May Jun July Aug Sept Oct Nov Dec Jan Feb Mar Apr May JunMilestonesStart Pilot BuildsIAA Hanover ShowSOP (US MARKET - EU BUILD)SOP (US MARKET - US BUILD)Engineering/ DesignPurchasing/ SourcingENGINEERING & DEVELOPMENTRELEASE ENGINEERINGSUPPLIER IDENTIFICATION / SOURCING SUPPLIER TOOLING BUILD COMPONENT / SUB-ASSEMBLY BUILD APQP PROCESSPROTOTYPE BUILDS / 3 BUCKETS OF 4Vehicle BuildPRE-SERIES BUILD Fleet Test UnitsPRODUCTION BUILDS (ULM, GERMANY)PRODUCTION (COOLIDGE, AZ)Vehicle ValidationCOMPONENT & BENCH VALIDATIONVEHICLE VALIDATIONPPAP Window

North America FCEV truck Timeline Projected Road Map to Commercialization (2020 – 2023)Low volume production for FCEV trucks expected to begin in Q1 2023• To achieve SOP milestone, Nikola’s engineering, manufacturing, and testing must have a coordinated and collaborative understanding of the overall vehicle architecture• Production-intent builds expected to begin at Beta Phase (2H 2021)20202021 20222023Apr May Jun July Aug Sept Oct Nov Dec Jan Feb Mar Apr May Jun July Aug Sept Oct Nov Dec Jan Feb Mar Apr May Jun July Aug Sept Oct Nov Dec Jan Feb Mar Apr May Jun July Aug SeptMilestonesArchitectural Freeze Start Pilot BuildsSOP (Low Volume)Engineering/ DesignENGINEERING & DEVELOPMENTENGINEERING & DEVELOPMENTRELEASE ENGINEERINGPurchasing/ SourcingSOFT TOOLING BUILD COMP./SUB ASSM. BUILDSUPPLIER INDENTIFICATION & SOURCINGPROTOTYPE BUILDPRODUCTION TOOLING BUILDCOMP./SUB ASSM. BUILDGAMMA (7 units)Vehicle BuildBETA BUILDTEST FLEET MILEAGE ACCUMULATIONPRE-SERIESPRODUCTION BUILDCOMPONENT VALIDATIONValidationDESIGN VALIDATIONDESIGN VALIDATIONVEHICLE VALIDATIONVEHICLE VALIDATION

IV. Financials, transaction overview and valuation

North America FINANCIAL OVERVIEWNORTH AMERICA FINANCIAL SUMMARY $M, Unless otherwise notedFinancial projections below only cover North America business and do not reflect potential upside from 50/50 JV in Europe or government incentives2020P 2021P 2022P 2023P 2024P Key Income Statement DriversBEV Trucks Sold (# of Units) - 600 1,200 3,500 7,000 FCEV Trucks Sold (# of Units) - - - 2,000 5,000 H2 Stations Completed (# of Units) - - - 10 24Income Statement ItemsBEV Truck Revenue - $150 $300 $875 $1,750 FCEV Truck Revenue - - - 470 1,175 FCEV Service & Maintenance Revenue - - - 13 56 FCEV Hydrogen Revenue - - - 56 245 Total Revenue - 150 300 1,414 3,226 % Growth nm nm 100.0% 371.4% 128.1%(-) Cost of Goods Sold - (112) (242) (1,113) (2,507) Gross Profit - 38 58 301 719 Gross Profit Margin nm 25.2% 19.2% 21.3% 22.3%(-) Operating Expenses (222) (303) (274) (416) (574) EBIT (222) (265) (216) (114) 145 EBIT Margin nm (176.9%) (72.0%) (8.1%) 4.5%(+) Depreciation & Amortization 11 20 41 48 68 EBITDA ($211) ($245) ($175) ($66) $213 EBITDA Margin nm (163.3%) (58.4%) (4.6%) 6.6%Balance Sheet and Cash Flow ItemsNet Working Capital ($9) $20 $41 $201 $476 % of Revenue nm 13.4% 13.8% 14.2% 14.8%Truck Manufacturing Facility, Equipment & Other Capex (156) (293) (196) (64) (34) H2 Stations & Equipment Capex - (6) (100) (305) (639) Total Capital Expenditures ($156) ($298) ($296) ($368) ($673) % of Revenue nm 198.7% 98.6% 26.0% 20.9%• North America BEV production projected to begin in 2021; North America FCEV production projected to begin in 2023 • $3.2B of revenue expected by 2024 • Expected steady state EBITDA margins of >25%

Proposed transaction overviewTransaction Structure• On March 2, 2020, Nikola and VectoIQ agreed to enter into a business combination• The transaction is expected to close in Q2 2020• It is anticipated that the post-closing company will be a Delaware corporation, retain the Nikola name, and be listed on the NASDAQValuation• Transaction implies a fully diluted pro forma enterprise value of ~$3.3 billion (~1.0x based on 2024E revenue of ~$3.2 billion)• Existing Nikola shareholders expected to receive 79.6% of the pro forma equity and $70 million cash(1)Capital Structure• The transaction will be funded by a combination of VectoIQ cash held in a trust account, VectoIQ common stock, and proceeds from VectoIQ PIPE• Transaction will result in $709 million cash on the balance sheet to fund growth(2)1. Including Series D investors. Excluding potential dilution from out-of-the-money VectoIQ warrants. Assumes no redemptions by VectoIQ’s existing public shareholders 2. Based on $237 million cash in trust, $67 million cash from Nikola balance sheet, 52.5 million shares at $10/share PIPE ($525 million) less $50 million transaction expenses and $70 million cash to seller. Assumes no redemptions by VectoIQ’s existing public shareholders
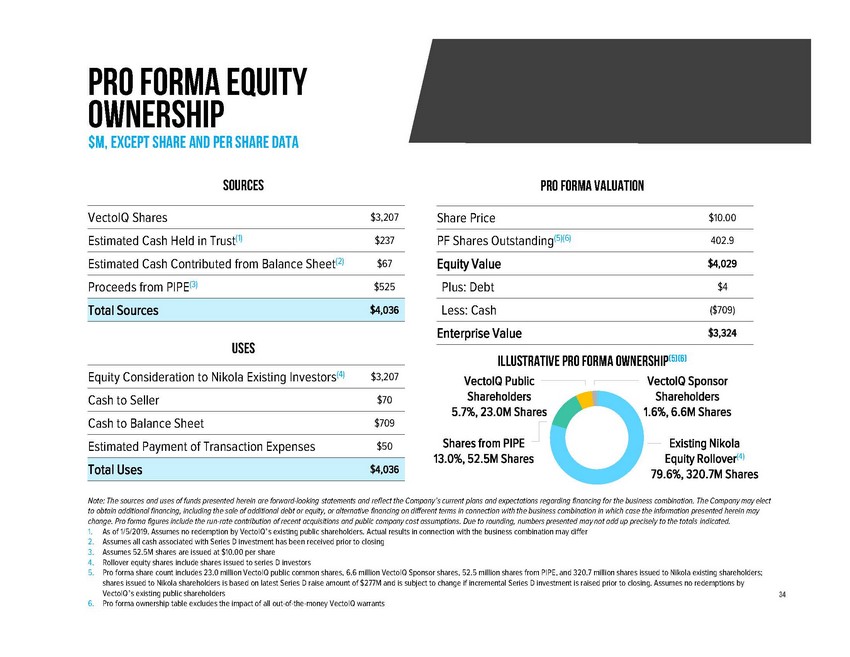
Pro forma equity ownership $M, except Share and per share dataSourcesVectoIQ Shares $3,207Estimated Cash Held in Trust(1) $237Estimated Cash Contributed from Balance Sheet(2) $67Proceeds from PIPE(3) $525Total Sources $4,036UsesPro Forma ValuationShare Price $10.00PF Shares Outstanding(5)(6) 402.9Equity Value $4,029Plus: Debt $4Less: Cash ($709)Enterprise Value $3,324Illustrative Pro Forma Ownership(5)(6)Equity Consideration to Nikola Existing Investors(4) $3,207Cash to Seller $70Cash to Balance Sheet $709Estimated Payment of Transaction Expenses $50Total Uses $4,036VectoIQ Public Shareholders 5.7%, 23.0M SharesShares from PIPE 13.0%, 52.5M SharesVectoIQ Sponsor Shareholders 1.6%, 6.6M SharesExisting Nikola Equity Rollover(4) 79.6%, 320.7M SharesNote: The sources and uses of funds presented herein are forward-looking statements and reflect the Company’s current plans and expectations regarding financing for the business combination. The Company may elect to obtain additional financing, including the sale of additional debt or equity, or alternative financing on different terms in connection with the business combination in which case the information presented herein may change. Pro forma figures include the run-rate contribution of recent acquisitions and public company cost assumptions. Due to rounding, numbers presented may not add up precisely to the totals indicated. 1. As of 1/5/2019. Assumes no redemption by VectoIQ’s existing public shareholders. Actual results in connection with the business combination may differ 2. Assumes all cash associated with Series D investment has been received prior to closing 3. Assumes 52.5M shares are issued at $10.00 per share 4. Rollover equity shares include shares issued to series D investors 5. Pro forma share count includes 23.0 million VectoIQ public common shares, 6.6 million VectoIQ Sponsor shares, 52.5 million shares from PIPE, and 320.7 million shares issued to Nikola existing shareholders; shares issued to Nikola shareholders is based on latest Series D raise amount of $277M and is subject to change if incremental Series D investment is raised prior to closing. Assumes no redemptions by VectoIQ’s existing public shareholders 6. Pro forma ownership table excludes the impact of all out-of-the-money VectoIQ warrants

Discounted Future Value of Nikola North America TRuckCoValuation of North America TruckCo alone is highly attractive; H2 station network, Europe JV, autonomous ready trucks, and grid storage components of business offer substantial potential incremental value2027E NIKOLA NORTH AMERICA TRUCKCO EBITDA WALK DISCOUNTED FUTURE VALUE SENSITIVITY ANALYSESBased on n.a. businessBEV Trucks2020E EV assuming 2027E Nikola TruckCo EBITDA of $1,352M ($B)2027E TruckCo EBITDA MultipleUnits Sold 14,000 Revenue per Unit ($) 250,000 2027E BEV Truck Revenue ($M) 3,500FCEV TrucksUnits Sold 30,000 Revenue per Unit ($)(1) 235,000 2027E FCEV Truck Revenue ($M) 7,0502027E Total TruckCo Revenue ($M) 10,550 Illustrative EBITDA Margin(2) 12.8% 2027E Illustrative EBITDA ($M) 1,352Illustrative EBITDA Margin conservatively assumes WholeCo OpEx cost structure applies to TruckCo businessSummary of analysis approach7.0x 8.0x 9.0x15.0% 3.6 4.1 4.620.0% 2.6 3.0 3.425.0% 2.0 2.3 2.62020E EV assuming 2027E EBITDA Multiple of 8.0x ($B)2027E TruckCo EBITDA%Δ: (25%) 0% 25%2027E EBITDA: 1,014 1,352 1,69015.0% 3.1 4.1 5.120.0% 2.3 3.0 3.825.0% 1.7 2.3 2.8• Analysis applies an NTM EBITDA multiple based on incumbent truck OEM normalized trading levels in order to imply a 2027E future enterprise value that is discounted back to January 2020 using an illustrative discount rate • This future value is then sensitized across a range of EBITDA multiples, EBITDA variances, and discount ratesKey takeaways • TruckCo alone supports a ~$3B valuation, even with a conservative assumption that TruckCo is valued similar to incumbent Truck OEMs1. FCEV Revenue per Unit based on truck contribution from overall lifetime value of FCEV bundled lease 2. Illustrative TruckCo EBITDA margin calculated using 2027E TruckCo Gross Margin burdened by WholeCo OpEx allocated by relative revenue contribution and TruckCo D&A added back

Operational Benchmarking Nikola metrics Do not include Potential incremental upside from 50/50 Europe jvNikola’s projected growth and future margin profile expected to be best-in-class compared to key peersREVENUE GROWTH 2022E - 2025E CAGR for Nikola; 2019A - 2021E for Peers (%)165.9493.2Median: 46.1% Median: 28.2% Median: (5.2%)46.124.744.331.025.514.4(1.5) (4.3) (6.1)(11.0)NMC SPCE NIO TSLA NEL PLUG BLDP BE 8TRA NAV VOLV B PCAREBITDA MARGIN 2020E for Peers (%)~25.0Median: (20.2%) Median: (6.0%) Median: 10.8%11.813.0NM6.2 4.512.7 12.0 9.77.9(52.4)(16.5) (17.2)2025E Run-Rate TSLA NIO SPCE PLUG BE NEL BLDP VOLV B PCAR 8TRA NAVMarket data as of March 27, 2020Future Transportation Peers(1)Fuel Cell Technology Peers(2)Commercial Vehicle Peers(3)1. Future Transportation Peers include NIO (NIO), Tesla (TSLA), and Virgin Galactic (SPCE) 2. Fuel Cell Technology Peers include Ballard (BLDP), Bloom Energy (BE), Nel (NEL), and Plug Power (PLUG) 3. Commercial Vehicle Peers include Navistar (NAV), PACCAR (PCAR), Traton (8TRA), and Volvo (VOLV B)

Valuation Benchmarking Nikola metrics Do not include Potential incremental upside from 50/50 Europe jvCurrent ~$3Bn valuation implies a 1.0x 2024E revenue multiple, well below future transportation peers current valuation levelEV / REVENUE 2020E for Peers (x)Median: 3.4x Median: 8.3x Median: 0.5x 600+11.12.4 1.0 0.63.4 2.714.812.44.2 1.90.6 0.5 0.5 0.22022E 2023E 2024E 2025E SPCE TSLA NIO NEL BLDP PLUG BE PCAR NAV VOLV B 8TRAEV / EBITDA 2020E for Peers (x)Median: 55.0x Median: 5.0x 67.742.2NM NM15.65.026.4NM NMNM NM7.0 5.9 4.1 1.72022E 2023E 2024E 2025E TSLA NIO SPCE PLUG BE BLDP NEL PCAR NAV VOLV B 8TRAMarket data as of March 27, 2020Future Transportation Peers(1)Fuel Cell Technology Peers(2)Commercial Vehicle Peers(3)1. Future Transportation Peers include NIO (NIO), Tesla (TSLA), and Virgin Galactic (SPCE) 2. Fuel Cell Technology Peers include Ballard (BLDP), Bloom Energy (BE), Nel (NEL), and Plug Power (PLUG) 3. Commercial Vehicle Peers include Navistar (NAV), PACCAR (PCAR), Traton (8TRA), and Volvo (VOLV B); EV and EBITDA adjusted for captive finance segment and pension/OPEB liabilities

V. Business Model Walkthrough
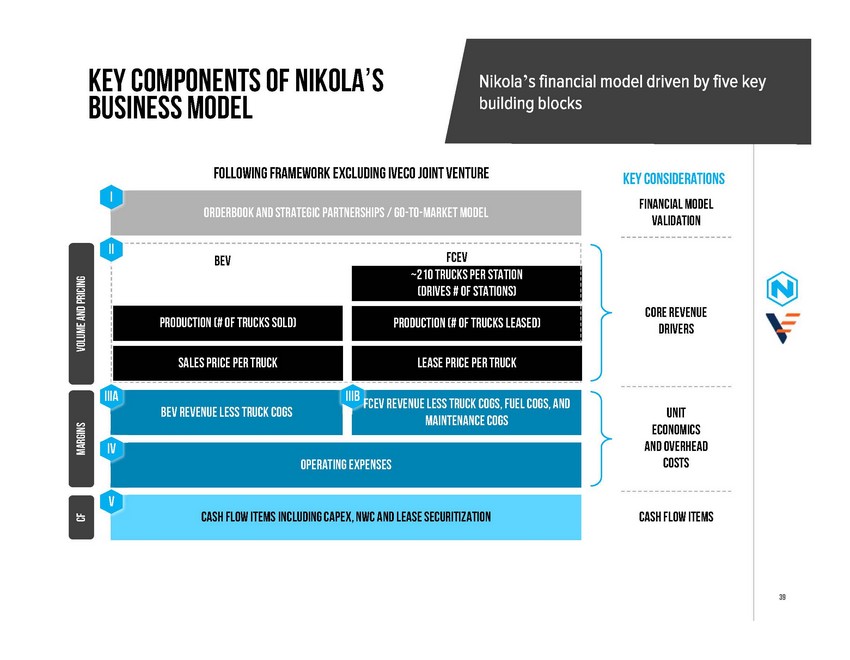
Key Components of Nikola’s Business ModelNikola’s financial model driven by five key building blocksFOLLOWING FRAMEWORK EXCLUDING IVECO JOINT VENTUREI Orderbook and strategic partnerships / go-to-market modelKey considerationsfinancial model validationII BEVProduction (# of Trucks Sold)FCEV ~210 Trucks per station (drives # of stations) Production (# of trucks leased)Core revenue driversSales Price per truckLease price per truckIIIaIVIIIb FCEV revenue less truck cogs, fuel cogs, and BEV Revenue less truck cogs maintenance cogsOperating expensesUnit economics and overhead costsV Cash flow items including capex, nwc and lease securitizationCash flow items

FCEV Reservations OverviewNikola’s reservation book is predominantly comprised of large fleet operatorsaccumulated Fcev reservationsFCEV reservations Breakdown~7,900+33%~8,200~14,000ALL OTHER RESERVATION HOLDERS~65% LARGE FLEET OPERATORSLARGE U.S. FLEET OWNER36% Breakdown of FCEV reservations34%2016 2017 2018Key considerations • Reservation book frozen in fall 2019 to focus on strategic fleet owners (as partners) for launch and pursing binding contracts • Majority of reservations represent large fleet operators (~65%)OTHER FLEETS WITH >100 TRUCKS RESERVED10%4% 6%10%LARGE TRUCK LEASING COMPANIES• Anheuser-Busch order is binding; all others non-binding • Returned initial reservation deposits, primarily made by smaller carriers, to focus on large dedicated fleet segment for initial roll-out • Provides Nikola maximum flexibility to deliver initial leased trucks to “blue chip” customers for dedicated routes that best fit Nikola’s H2 station roll-out plansLARGE EQUIPMENT PROVIDERSExecution of current reservations would cover expected production plan until end of 2025

Production Timeline OverviewBEV Production for the U.S. market expected to start up in 1H 2021, followed by planned FCEV production start in Q1 20232020 2021 2022 2023European production for U.S.U.S. production for U.S.BEV initially produced in Europe for the U.S. marketBEV production start in EUROPEBEV production start in U.S.Fcev production startBEV SOP at Iveco’s facility in Ulm, GermanyBEV SOP at Nikola’s Coolidge facilityFCEV SOP at Nikola’s Coolidge facility2H 2020Coolidge phase iCoolidge Phase II developmentCompletion of Coolidge facility (capacity of 50,000 trucks p.a.)Target customersSales channelStrategic fleet ownersNikola managed strategic salesLarge investment grade u.s. fleet ownersDirect sales and Sales through third partiesmarketing channelSocial media / Expo Mass mediaNikola expects to initially leverage existing Iveco facility in Ulm, Germany, before moving production to Coolidge, AZ, U.S. with phase I development expected finished by end of 2021

Opportunities for Incremental Upside to Nikola’s Business modelNikola’s current framework does not take into account several significant opportunities for incremental upsidei Ii IIiEurope Joint-venture with IvecoResidual Value of FCEV trucksAutonomous driving• Joint Venture with CNHI Iveco to de-risk truck manufacturing execution • Joint Venture structure requires minimal incremental investment from Nikola • Products to be produced in existing CNHI Iveco facilities and utilize its extensive distribution and service network • Planned start of BEV and FCEV Nikola Tre production in Europe from Q1 2022 and 2H 2023, respectively• Nikola’s model assumes $0 residual value for FCEV trucks that are coming off lease • After the initial 7 year, or 700,000 mile lease, there will likely be an opportunity to re-sale or re-lease the asset to capture incremental upside • Opportunity to recycle and refurbish certain components of Nikola’s FCEV after one lease cycle which could help drive down average BOM cost for Nikola’s FCEV• Nikola’s vehicles are designed with a space claim for an autonomous driving hardware suite • Our dedicated route customers, operating point-to-point, provides ideal testing environment for development of autonomous driving technology • Our commercial agreement with Anheuser-Busch (“AB”), allows Nikola to charge an additional rate per mile driven autonomouslyIV powersportsV Other incremental upside opportunities• PowerSports has a world-class management team that will operate with high degree of independence • Nikola is pursuing a business model for PowerSports that will provide financial upside with minimal capital outlay or management distraction (i.e. OEM partnership, JV, etc.)• Government Incentives –for the manufacturing and production of zero-emissions vehicles and hydrogen stations and clean energy not included in Nikola’s model • Customer Deposits – During initial production Nikola will likely require a significant deposit to secure final customer orders prior to vehicle delivery • Nikola Badger – Represents significant potential upside, but will only be produced via partnership with third-party OEM thus ensuring minimal capital outlay or management distraction

Expected Sales Volumes & Plant Utilization Volumes Do not include Potential incremental upside from 50/50 Europe jvNikola expects to reach full plant utilization for BEV and FCEV production by 2028 and 2027, respectivelyBEV FCEVSALES VOLUME (# OF VEHICLES) SALES VOLUME (# OF VEHICLES)~30,000~600~1,200~3,500Expected to reach full utilization in 2028~15,000~2,000 0~5,000Expected to reach full utilization in 2027202120222023Full plant production202220232024Full plant production• First BEV truck sales expected in 2021 • Sales based on number of trucks produced in period and an average time in inventory of ~9 days • It is expected that plant will reach full BEV capacity in 2028, producing ~15,000 trucks per annum• First FCEV truck sales expected in 2023 • Sales based on number of trucks produced in period and an average time in inventory of ~9 days • FCEV volumes expected to exceed BEV volumes in 2026 • Plant expected to reach full FCEV capacity in 2027, producing ~30,000 trucks per annumIllustrative Purposes only; actuals may vary

Expected BEV Costs of Goods soldBEV COGS are mainly comprised of materials, resulting in expected vehicle gross profit margin of ~22.5% - 30% at steady-stateBEV COGS components as % of truck priceKey considerationsPRICEMATERIALS (COGS)~63 – 70%~$250k1 • Initial price point • Sales price in-line with market competition• Material COGS estimated bottom-up taking count of all required components, quantity needed and total purchase price (based on 2 input from industry suppliers) • Battery pack represents the single largest cost itemOTHER (COGS)~7%• Other COGS is split between direct labor cost (~32%), indirect labor cost (~11%) and cost of warranty (~57%) 3 • Labor cost estimated based on number of manufacturing and plant personnel needed to produce planned BEV volume • Warranty estimated based on historical cost for HD truck OEMs1GROSS PROFIT2~22.5 – 30%TRUCK COGS BOOKED IN P&L SIMULTANEOUSLY AS TRUCK SALE !INVENTORY COSTS INCURRED AS BEV TRUCKS ARE PRODUCED !1. Warranty Week: Automotive OEM Warranty Report (4 April 2019); Warranty Week: Automotive OEM Warranty Report (21 July 2016) 2. Illustrative Gross Profit does not include plant depreciation expensesIllustrative Purposes only; actuals may vary! P&L effect ! Cash flow effect

FCEV Lease Revenue ModelRevenue from FCEV leases is allocated between truck, fuel and servicePreliminary total Revenue per fcev lease1Tota~l66l5ease revenue 1Revenue allocated to fuel Miles included per leaseLifetime of lease7 YEARSRevenue first year of leaseRevenue per mile per lease ~$0.95Miles included per lease 700KTotal lease revenueTruck price ~$235k (~35%)700KMiles driven per kg H2 fuel 2 ~7.5 Fuel revenue ~$350K Revenue per kg H fuel 2 (~53%) $3.7531 ~$235,000 Full truck price recognized on P&L year lease commences (i.e. $235K) Revenue p.a. 2 ~$50,000 Revenue recognized on P&L per annum Revenue p.a. 3 ~$11,500 Revenue recognized on P&L per annum~$665K For illustrative purposes only2~$80k (~12%)lease Payment Made by customer Each monthLease revenue is allocated between the three components: truck, fuel and service. Full value of truck revenue is recognized on P&L in the year the lease commences, while fuel and service revenues are spread out across the lease lifetime21. Allocation of total lease revenue not final / under consideration 2. Actual pricing will vary dependent on customerIllustrative Purposes only; actuals may vary

Expected FCEV Costs of Goods soldFCEV COGS are driven by materials, yielding an expected vehicle contribution margin of ~16.5 - 24% at steady-statecomponents of FCEV COGS as % of Truck priceKey considerationsPRICEMATERIALS (COGS)~70 – 77%~$235k1 • Initial price point • Sales price in-line with market competition• Material COGS estimated bottom-up taking count of all required components, quantity needed and total purchase price (based on 2 input from industry suppliers) • Hydrogen tanks and fuel cell represent the largest cost itemsOTHER (COGS)~6 – 6.5%• Other COGS are split between direct labor cost (~40%), indirect labor cost (~10%) and cost of warranty (~50%) 3 • Labor cost estimated based on number of manufacturing and plant personnel needed to produce expected FCEV volume • Warranty estimated based on historical cost for truck OEMs1GROSS PROFIT2~16.5 – 24%TRUCK COGS BOOKED IN P&L SIMULTANEOUSLY WITH LEASE STARTS ! INVENTORY COSTS INCURRED AS FCEV TRUCKS ARE PRODUCED !1. Warranty Week: Automotive OEM Warranty Report (4 April 2019); Warranty Week: Automotive OEM Warranty Report (21 July 2016)! P&L effect ! Cash flow effect2. Illustrative vehicle contribution based on lease revenue allocated to truck (revenue allocation still under consideration) does not include plant depreciation expensesIllustrative Purposes only; actuals may vary

Expected Fueling Costs of Goods soldProjected FCEV fueling contribution margin of ~33%; electricity comprises majority of fuel production COGSfcev fueling costs (COGS) per kg h2 fuel producedKey considerationsWaterStation personnel5Electrolyzers Maintenance• Electrolyzer maintenance cost estimated as % of total 1 hydrogen station capex4 1 2Electrolyzers insurance~$2.50 per KG hydrogen produced• Electrolyzer insurance cost estimated as % of total 2 hydrogen station capex3Electricity• Electricity consumption cost estimated based on 3 expected electricity price times quantity required to produce one kg of hydrogenKg h2 fuel included per fcev lease: ~93,000Expected Contribution Margin • $350K fuel revenue per FCEV lease • Implies ~$3.75 revenue per KG H2 produced • At ~$2.50 COGS per KG, implies a contribution margin of ~33% before station capex amortization4 • Water cost estimated based on expected price of water multiplied by quantity required to produce one kg of H25 • Station personnel cost based on the expectation that 3 FTEs will be required to operate each hydrogen stationFUEL COGS BOOKED IN P&L AS INCURRED ! FUEL COGS INCURRED AS HYDROGEN IS PRODUCED AT STATIONS ! ! P&L effect ! Cash flow effect

Expected Cost of Service and MaintenanceProjected cost of service and maintenance of ~$0.07 per mile for FCEV trucks (~60% lower than diesel)Partnership with RyderExpected fcev service and maintenance cost per 1,000 driven miles as % of diesel truck Service and maintenance cost• Signed service agreement with Ryder Systems in 2016• Ryder to act as service and maintenance provider of leased FCEV trucks• Ryder is one of the largest truck leasing companies in the U.S. with over 800 service centers and 6,000 highly trained technicians~$170-60%Expected Service and maintenance cost per leaseService and maintenance cost per mileMiles included per leaseService and maintenance cost per lease~40%~$0.07 700K~$47K! S&M COGS BOOKED IN P&L AS INCURRED! S&M COGS INCURRED AS SERVICE & MAINTENANCE IS PROVIDED! P&L effect ! Cash flow effect Source: Arthur D. Little: Battery Electric Vehicles vs. Internal Combustion Engine Vehicles (November 2016)DIESEL FCEVFCEV trucks expected to have substantially lower service and maintenance cost per mile than diesel trucks, mainly due to their relatively simple mechanical process compared to ICE vehicles with more moving partsIllustrative Purposes only; actuals may vary
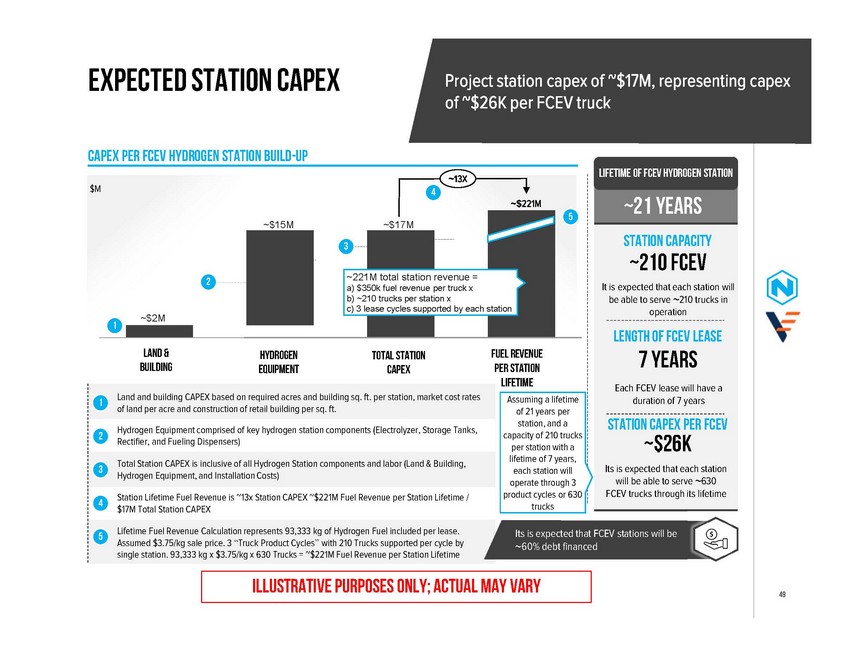
Expected Station CapexProject station capex of ~$17M, representing capex of ~$26K per FCEV truckCapex per fcev hydrogen station build-up$M~$15M~$17M3~13X 4~$221MLifetime of fcev hydrogen station~21 YEARSStation capacity ~210 FCEV2~$2M 1~221M total station revenue = a) $350k fuel revenue per truck x b) ~210 trucks per station x c) 3 lease cycles supported by each stationIt is expected that each station will be able to serve ~210 trucks in operationLength of fcev leaseLAND & BUILDINGHYDROGEN EQUIPMENTTOTAL STATION CAPEXFUEL REVENUE PER STATION LIFETIME7 YEARSEach FCEV lease will have a1 Land and building CAPEX based on required acres and building sq. ft. per station, market cost rates of land per acre and construction of retail building per sq. ft.Hydrogen Equipment comprised of key hydrogen station components (Electrolyzer, Storage Tanks,2 Rectifier, and Fueling Dispensers)3 Total Station CAPEX is inclusive of all Hydrogen Station components and labor (Land & Building, Hydrogen Equipment, and Installation Costs)4 Station Lifetime Fuel Revenue is ~13x Station CAPEX ~$221M Fuel Revenue per Station Lifetime / $17M Total Station CAPEXAssuming a lifetime of 21 years per station, and a capacity of 210 trucks per station with a lifetime of 7 years, each station will operate through 3 product cycles or 630 trucksduration of 7 yearsStation Capex per fcev ~$26KIts is expected that each station will be able to serve ~630 FCEV trucks through its lifetime5 Lifetime Fuel Revenue Calculation represents 93,333 kg of Hydrogen Fuel included per lease. Assumed $3.75/kg sale price. 3 “Truck Product Cycles” with 210 Trucks supported per cycle by single station. 93,333 kg x $3.75/kg x 630 Trucks = ~$221M Fuel Revenue per Station LifetimeIts is expected that FCEV stations will be ~60% debt financedIllustrative Purposes only; actual may vary

FCEV Contribution Margin BreakdownFCEV truck contribution margin expected to be in the range of ~25 - 34% at steady-stateIllustrative Cash Generated per truck lease at full truck plant and hydrogen station utilization~$665K~$185K~27 - 30%~25 - 34% lease contribution margin before corporate G&APage: 47~$230K~33 - 36%Page: 48Service & maintenance @ ~$0.07 / mile~$45K~7 - 9%Page: 49~$200K~$25K ~4%Page: 50~$175K~25 - 34%Nikola plans to partly monetize lease revenue up-front through lease securitization~20 - 30%LEASE REVENUE TRUCK COST TOTAL FUELING COST1SERVICE & MAINTENANCELEASE CONTRIBUTION MARGIN (BEFORE CORPORATE G&A)2STATION CAPEX PER LEASE3CASH MARGIN PER TRUCK LEASE4Note: Analysis does not include potential financing charges that may be incurred to securitize and monetize some portion of the Nikola lease 1. Hydrogen fuel cost includes all hydrogen station related operating expenses including electricity costs, water costs, station personnel cost, and hydrogen station maintenance 2. Vehicle profit presented before corporate general and administrative expenses 3. Assumes each station has a 21-year useful life and supports 210 truck leases during each 7-year lease period 4. Does not include any potential upside from truck residual value at the end of the leaseIllustrative Purposes only; ACTUALS MAY VARY

Overview of Nikola’s Operating ExpensesNikola’s operating expenses are comprised of non- capitalized R&D, SG&A expenses and personnel costBreakdown of operating expenses1 Nikola organization personnel expensesexecutiveOperating expenses are comprised of non- capitalized R&D, SG&A expenses and personnel costFinance / legal hr Hydrogen / fuels / station developmentEngineering / development2 Non-capitalized R&DIncludes purchased components, computer supplies, equipment rental, support and maintenance, external development as well as equipment, tools and software which are not capitalized3 SG&A expensesITsalesSales commission & customertravelmarketingProfessional servicesoperationsrelationsOther admin.occupancymarketing
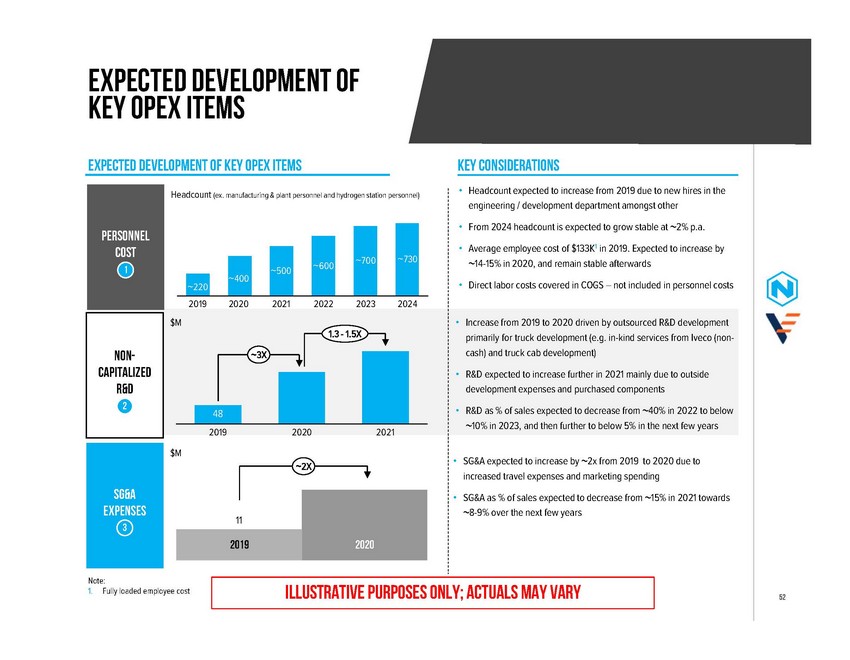
Expected development of key opex itemsExpected development of key opex itemsHeadcount (ex. manufacturing & plant personnel and hydrogen station personnel)Key considerations• Headcount expected to increase from 2019 due to new hires in the engineering / development department amongst otherPersonnel cost 1~220~400~500~600~700 ~730• From 2024 headcount is expected to grow stable at ~2% p.a.• Average employee cost of $133K1 in 2019. Expected to increase by ~14-15% in 2020, and remain stable afterwards• Direct labor costs covered in COGS – not included in personnel costsNon- capitalized R&D 22019 2020 2021 2022 2023 2024$M 1.3 - 1.5X~3X482019 2020 2021• Increase from 2019 to 2020 driven by outsourced R&D development primarily for truck development (e.g. in-kind services from Iveco (non- cash) and truck cab development)• R&D expected to increase further in 2021 mainly due to outside development expenses and purchased components• R&D as % of sales expected to decrease from ~40% in 2022 to below ~10% in 2023, and then further to below 5% in the next few years$MSG&A expenses 3~2X11• SG&A expected to increase by ~2x from 2019 to 2020 due to increased travel expenses and marketing spending• SG&A as % of sales expected to decrease from ~15% in 2021 towards ~8-9% over the next few years2019 2020Note: 1. Fully loaded employee cost Illustrative Purposes only; actuals may vary
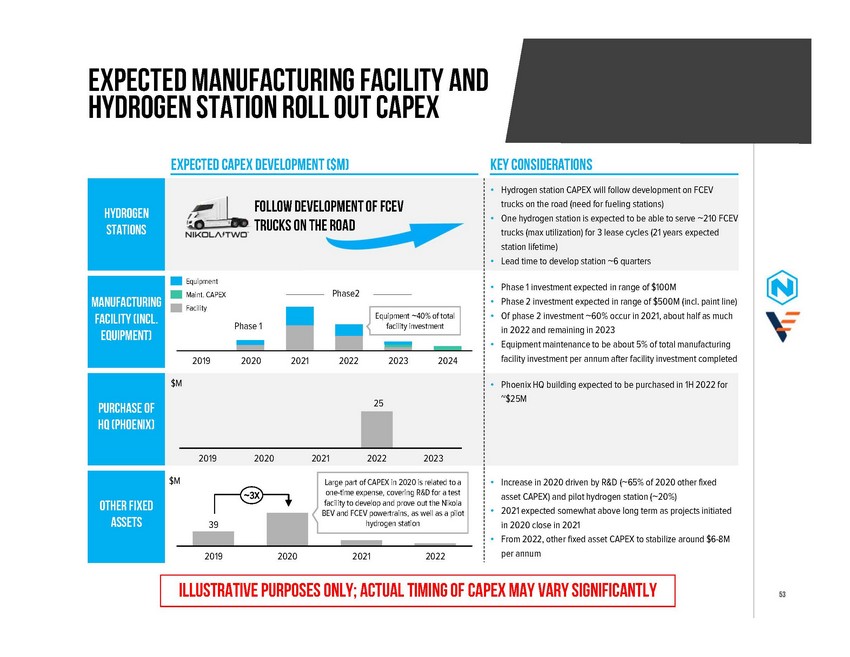
Expected manufacturing facility and hydrogen station roll out CapexExpected capex development ($m)Key considerationsHydrogen stationsFOLLOW DEVELOPMENT OF FCEV TRUCKS ON THE ROAD• Hydrogen station CAPEX will follow development on FCEV trucks on the road (need for fueling stations) • One hydrogen station is expected to be able to serve ~210 FCEV trucks (max utilization) for 3 lease cycles (21 years expected station lifetime) • Lead time to develop station ~6 quartersManufacturing facility (incl. equipment)Equipment Maint. CAPEX FacilityPhase 1Phase2Equipment ~40% of total facility investment• Phase 1 investment expected in range of $100M • Phase 2 investment expected in range of $500M (incl. paint line) • Of phase 2 investment ~60% occur in 2021, about half as much in 2022 and remaining in 2023 • Equipment maintenance to be about 5% of total manufacturingPurchase of HQ (Phoenix)2019$M2020202120222023252024facility investment per annum after facility investment completed• Phoenix HQ building expected to be purchased in 1H 2022 for ~$25M201920202021 2022 2023$MOther fixed assets392019~3X2020Large part of CAPEX in 2020 is related to a one-time expense, covering R&D for a test facility to develop and prove out the Nikola BEV and FCEV powertrains, as well as a pilot hydrogen station2021 2022• Increase in 2020 driven by R&D (~65% of 2020 other fixed asset CAPEX) and pilot hydrogen station (~20%) • 2021 expected somewhat above long term as projects initiated in 2020 close in 2021 • From 2022, other fixed asset CAPEX to stabilize around $6-8M per annumIllustrative Purposes only; actual timing of capex may vary significantly

manufacturing facility and hydrogen station Asset LifeHydrogen stations and manufacturing facility expected to have lifetimes of ~21 years and ~30 years, respectivelyDepreciation related to h2 stations Depreciation related to remaining business operationsassetsHydrogen stationsManufacturing facilityManufacturing Equipment hqOther fixed assetsDepreciable assets• Electrolyzers• Installation• Buildings• Transformer / rectifier• Manufacturing facilities in Coolidge, AZ, including primary power hookup, a central energy plant and site development• Equipment used in manufacturing facility, including body and assembly, sequencing and warehousing, paint and office• Purchase of current HQ in Phoenix, AZ • Expected purchased in 1H 2022• Includes leasehold improvements, furniture and fixtures, software, capital equipment (R&D), pilot hydrogen station and computers / IT and otherAsset lifetime~21 years~30 years~14 years~30 yearsVariousDepreciationStraight lineNote: Depreciation expenses are included as part of COGS. Hydrogen station depreciation included as part of hydrogen station COGS. Manufacturing facility, manufacturing equipment and HQ to be allocated between BEV and FCEV trucks sold in period. Other fixed asset depreciation included as part of operating expenses

Expected Net Working Capital RequirementsNikola’s net working capital is expected to be driven by FCEV lease salesNet working capital considerationsNwc Description• BEV sold directly, but for FCEV lease in addition to traditional working capital items, Nikola’s NWC includes “net investment in leases” as the lease revenue is spread over the leasing period of 7 years • Net investment in leases comprises the total amount of lease revenue allocated to FCEV truck, net of cash payment received in current year (i.e. 1/7 of ~$235K as lease commences). Hence, the remaining 6/7 of lease value is allocated to net investment in leases (split between current1 and long-term2 assets) • As such NWC is expected to increase in line with annual FCEV volume growthNet investment in leases Remaining working capital assets Remaining working capital liabilitiesNwc excl. investment in leases expected• NWC excluding investment in leases expected to be around 13 - 14 % of revenues in 2021 and 2022• NWC excluding investment in leases expected to be around ~4% of sales when production plants reach full capacityNWC EXCLUDING INVESTMENT IN LEASES AS % OF REVENUEdevelopmentTotal NWC 2020 expected to be between ($8M) and ($10M)2020~13%2021~14%2022Note: 1. Cash flow from net investment in lease expected within one year 2. Cash flow from net investment in lease not due within one yearIllustrative Purposes only; actuals may vary

Overview of FCEV Lease SecuritizationNikola is expected to securitize FCEV leases to receive an initial cash inflow of ~$160K per leaseCash flow structure from securitizationSecuritization structure1 Initial cash flow (loan, ~$160K) from lenders channeled through SPV to Nikola as securitized FCEV lease2 Truck lessees make monthly lease payments into SPV3 Cash flow from leases used to cover hydrogen and maintenance cost relating to securitized leases2$MonthlyOriginate / serviceMonthlyTruck LesseesUp frontMgmt.4 Cash flow from leases used for monthly interest and amortization of initial loan (~$160K per lease)lease paymentsresidual 5 cash flow$ $ 1cash proceedscontract5 Residual cash flow channeled to Nikola per monthMonthlySpecial purpose vehicle 3 Up frontExpected financing conditions and costs4 debt service$ $ cash 1 proceeds$ Monthly expensesSecuritization loan per lease~$160kAnnual interest rate~7%lendersHydrogen fuelmaintenanceLoan duration~7 yearsAdequate Coverage70% LTV; 1.7x DSCRleases Bank account trucksIllustrative Purposes only; actuals may vary

FCEV LEASE P&L recognition and cash flow TimingFCEV lease securitization is expected to balance the upfront cash requirement of FCEV truck manufacturingTiming of FCEV LEASE P&L recognition and cash flow• The table below illustrates the expected timing of cash flows from the FCEV lease (excluding operating expenses), as well as the P&L recognition of the lease • Additionally, table highlights expected cash flow impact of lease securitization • For all other items with P&L or cash flow impact, refer to sections IV (operating expenses) and V (CAPEX, depreciation and NWC) • Figures in the table below are illustrative and based on mid-range of expected cost levels (where applicable)! Time recognition on P&L! Timing of cash flowLease lifetime Lease lifetimeYear of lease Truck revenue Fueling revenue S&M Revenue Truck COGS Fueling Cogs S&M COGS Securitization (loan) Securitization interest payment Securitization Principal payment SUM P&L vs. CashFlow1 2 3 4 5 6 7235 - - - - - -50 50 50 50 50 50 5011 11 11 11 11 11 11-188 - - - - - --33 -33 -33 -33 -33 -33 -33-7 -7 -7 -7 -7 -7 -7 n.a. n.a. n.a. n.a. n.a. n.a. n.a. -10 -9 -7 -6 -4 -2 -1 n.a. n.a. n.a. n.a. n.a. n.a. n.a. 58 12 14 15 17 19 20+66 -11 -11 -11 -11 -11 -111 2 3 4 5 6 734 34 34 34 34 34 3450 50 50 50 50 50 5011 11 11 11 11 11 11-188 - - - - - --33 -33 -33 -33 -33 -33 -33-7 -7 -7 -7 -7 -7 -7160 - - - - - --10 -9 -7 -6 -4 -2 -1-23 -23 -23 -23 -23 -23 -23-6 23 25 26 28 30 31Total PER LEASE+ ~$235k+ ~$350k+ ~$80k- ~$188k- ~$231k- ~$47k+ ~$160k- ~$40k- ~$160k159KNote: 1. Numbers is table illustrates approx. amounts to which Nikola on average expects to receive from one FCEV lease 2. Numbers in table per lease year does not sum to total lease value due to roundingIllustrative Purposes only1,2

T R A N S P O R T I N G T H E F U T U R E T O N O W .