Attached files
| file | filename |
|---|---|
| 8-K - FORM 8-K - VORNADO REALTY TRUST | tm2014788-1_8k.htm |
Exhibit 99.1
To Our Shareholders
While most of this letter is business as usual…today nothing is usual. We are now in the eye of the COVID-19 storm – a black swan apocalypse. Life as we know it is upside down, people are hurting, businesses are hurting, the future is uncertain. As our first priority we are following all protocols and taking all measures to protect our employees, our tenants and our communities. We pray for the health and safety of all and we commend and admire the talent and courage of our healthcare providers. Vornado is in a strong position to weather the storm and we will continue to do our part to help mitigate the impact.
Net Income attributable to common shares for the year ended December 31, 2019 was $3,097.8 million, $16.21 per diluted share, compared to $384.8 million, $2.01 per diluted share, for the previous year. This increase is primarily attributable to the Retail Joint Venture transaction. See page 9.
Funds from Operations, as Adjusted (an apples-to-apples comparison of our continuing business, eliminating certain one-timers) for the year ended December 31, 2019 was $666.2 million, $3.49 per diluted share, compared to $713.5 million, $3.73 per diluted share, for the previous year, a 6.4% decrease per share. This decrease is detailed on page 5.
Funds from Operations, as Reported (apples-to-apples including one-timers) for the year ended December 31, 2019 was $1,003.4 million, $5.25 per diluted share, compared to $729.7 million, $3.82 per diluted share, for the previous year. See page 5 for a reconciliation of Funds from Operations, as Reported, to Funds from Operations, as Adjusted.
Here are our financial results (presented in Net Operating Income format) by business unit:
| Net Operating Income(1) | ||||||||||||||||||||||||||||
| ($ IN MILLIONS) | 2019 Same Store % Increase/ (Decrease) |
% of 2019 NOI |
Increase/ (Decrease) 2019/2018 |
2019 | 2018 | 2017 | ||||||||||||||||||||||
| NOI -
Cash Basis(1) |
NOI(1) | |||||||||||||||||||||||||||
| Net Operating Income: | ||||||||||||||||||||||||||||
| New York: | ||||||||||||||||||||||||||||
| Office(2) | 2.8 | % | 2.2 | % | 59.9 | % | (2.2 | ) | 717.7 | 719.9 | 699.1 | |||||||||||||||||
| Retail(2) | 1.1 | % | (2.2 | )% | 20.4 | % | (16.2 | ) | 244.2 | 260.4 | 270.8 | |||||||||||||||||
| Retail Joint Venture | N/A | N/A | N/A | (80.4 | ) | 35.8 | 116.2 | 111.2 | ||||||||||||||||||||
| Residential | 0.4 | % | 1.2 | % | 1.9 | % | (0.1 | ) | 23.4 | 23.5 | 24.4 | |||||||||||||||||
| Alexander’s | 0.1 | % | (0.1 | )% | 3.7 | % | (0.8 | ) | 44.3 | 45.1 | 47.3 | |||||||||||||||||
| Hotel Pennsylvania | (41.1 | )% | (37.9 | )% | 0.6 | % | (4.5 | ) | 7.4 | 11.9 | 13.3 | |||||||||||||||||
| Total New York | 1.6 | % | 0.5 | % | 86.5 | % | (104.2 | ) | 1,072.8 | 1,177.0 | 1,166.1 | |||||||||||||||||
| TheMART | 18.6 | % | 15.9 | % | 8.5 | % | 11.2 | 102.1 | 90.9 | 102.3 | ||||||||||||||||||
| 555 California Street | 12.7 | % | 9.7 | % | 5.0 | % | 5.0 | 59.7 | 54.7 | 47.6 | ||||||||||||||||||
| 100.0 | % | (88.0 | ) | 1,234.6 | 1,322.6 | 1,316.0 | ||||||||||||||||||||||
| Other (see below for details) | (34.8 | ) | 25.2 | 60.0 | 85.4 | |||||||||||||||||||||||
| Total Net Operating Income | (122.8 | ) | 1,259.8 | 1,382.6 | 1,401.4 | |||||||||||||||||||||||
Other Net Operating Income is comprised of:
| ($ in millions) | 2019 | 2018 | 2017 | |||||||||
| Pennsylvania REIT (converted to marketable securities March 2019, sold January 23, 2020) | 9.8 | 20.0 | 21.1 | |||||||||
| 666 Fifth Avenue Office Condominium (sold August 3, 2018) | -- | 12.1 | 20.6 | |||||||||
| Urban Edge Properties (sold March 4, 2019) | 4.9 | 11.8 | 14.5 | |||||||||
| Other | 10.5 | 16.1 | 29.2 | |||||||||
| Total | 25.2 | 60.0 | 85.4 | |||||||||
This letter and this Annual Report contain forward-looking statements as such term is defined in Section 27A of the Securities Act of 1933, as amended, and Section 21E of the Securities Exchange Act of 1934, as amended. Forward-looking statements are not guarantees of performance. The Company’s future results, financial condition and business may differ materially from those expressed in these forward-looking statements. These forward-looking statements are subject to numerous assumptions, risks and uncertainties, including the impact of the COVID-19 virus on us, our tenants and the local and national economies. Many of the factors that will determine these items are beyond our ability to control or predict. For further discussion of many of these factors, see “Forward-Looking Statements” and “Item 1A. Risk Factors” in the Company’s Annual Report on Form 10-K for the year ended December 31, 2019, a copy of which accompanies this letter or can be viewed at www.vno.com.
| 1 | Straight-lining of rents and amortization of below-market leases, net are excluded from NOI - Cash Basis. |
| 2 | On April 18, 2019 we completed the transfer of a 45.4% common equity interest in Vornado’s portfolio of flagship high street retail assets on Upper Fifth Avenue and Times Square to a group of institutional investors (“Retail Joint Venture”). The historical financial results of the portion of the Retail Joint Venture assets that were transferred have been removed from the Office and Retail lines and reflected on the Retail Joint Venture line for all periods presented. |
4
The following chart reconciles Funds from Operations, as Reported to Funds from Operations, as Adjusted:
| ($ IN MILLIONS, EXCEPT PER SHARE) | 2019 | 2018 | ||||||
| Funds from Operations, as Reported | 1,003.4 | 729.7 | ||||||
| Less adjustments for certain items that impact FFO: | ||||||||
| After-tax gain on sale of 220 Central Park South units | 502.6 | 67.3 | ||||||
| Acquisition related costs | (4.6 | ) | (3.3 | ) | ||||
| Prepayment penalty on redemption of $400 million 5% senior unsecured notes | (22.5 | ) | -- | |||||
| Real Estate Fund | (48.8 | ) | (23.7 | ) | ||||
| Non-cash impairment loss and related write-off on 608 Fifth Avenue | (77.1 | ) | -- | |||||
| 666 Fifth Avenue Office Condominium | -- | 3.1 | ||||||
| Gain on repayment of loan - 666 Fifth Avenue Office | -- | 7.3 | ||||||
| Previously capitalized internal leasing costs | -- | 5.5 | ||||||
| Transfer taxes | -- | (23.5 | ) | |||||
| Preferred shares issuance costs | -- | (14.5 | ) | |||||
| Other, primarily noncontrolling interests’ share of above adjustments | (12.4 | ) | (2.0 | ) | ||||
| Total adjustments | 337.2 | 16.2 | ||||||
| Funds from Operations, as Adjusted | 666.2 | 713.5 | ||||||
| Funds from Operations, as Adjusted per share | 3.49 | 3.73 | ||||||
Funds from Operations, as Adjusted decreased by $47.3 million in 2019 to $3.49 from $3.73 per share, a decrease of $0.24 per share, or 6.4%. Here is the detail of this decrease:
| Increase/(Decrease) | ||||||||
| ($ IN MILLIONS, EXCEPT PER SHARE) | Amount | Per Share | ||||||
| Same Store Operations: | ||||||||
| New York: | ||||||||
| Office | 14.4 | 0.07 | ||||||
| Residential | 0.3 | -- | ||||||
| Street Retail | (5.6 | ) | (0.03 | ) | ||||
| Hotel Penn | (4.5 | ) | (0.02 | ) | ||||
| theMART | 13.6 | 0.06 | ||||||
| 555 California Street | 5.3 | 0.03 | ||||||
| Interest expense | 47.6 | 0.23 | ||||||
| Interest income | (12.9 | ) | (0.06 | ) | ||||
| Asset sales (see page 9) | (50.6 | ) | (0.25 | ) | ||||
| General and Administrative expenses | (21.6 | ) | (0.11 | ) | ||||
| THE PENN DISTRICT out of service | (10.9 | ) | (0.05 | ) | ||||
| Other | (22.4 | ) | (0.11 | ) | ||||
| Decrease in FFO, as Adjusted | (47.3 | ) | (0.24 | ) | ||||
5
Report Card
We manage the business for long-term wealth creation. We cannot directly influence share price, but surely our share price over time is a report card on our performance. Since I have run Vornado from 1980, total shareholder returns have been 14.8% per annum, but sub-par lately. Dividends have represented 3.8 percentage points of Vornado’s annual return.
Here is a chart that shows Vornado’s total return to shareholders compared to our New York-centric peers and two REIT indices for various periods ending December 31, 2019:
Vornado | NY REIT Peers(3) | Office REIT Index | MSCI Index | |||||||||||||
| One-year | 12.0 | % | 15.1 | % | 31.4 | % | 25.8 | % | ||||||||
| Three-year | (11.9 | )% | (8.8 | )% | 18.3 | % | 26.2 | % | ||||||||
| Five-year | (9.2 | )% | (11.1 | )% | 34.2 | % | 40.5 | % | ||||||||
| Ten-year | 82.2 | % | -- | 139.2 | % | 208.7 | % | |||||||||
| Fifteen-year | 109.9 | % | -- | 154.4 | % | 212.2 | % | |||||||||
| Twenty-year | 569.9 | % | -- | 468.9 | % | 732.4 | % | |||||||||
Our stock price for the last five years has been disappointing and, in my mind, disconnected from the value of our assets. The graph below demonstrates that case. Over the last ten years, NAV(4) (a surrogate for private market values) has compounded at 17.4% but stock price at only 2.7%. In my letter to shareholders two years ago, I made the point that public shareholders seem to price CBD office buildings at a significant discount to private value. That pricing mismatch has been chronic and continues. Something is obviously wrong.

The graph above stops at year end prior to the COVID-19 health crisis and stock market sell-off. Obviously, everything is now different. Vornado’s stock price as of this writing is $37.60. It is difficult to even guesstimate NAV, but I suggest that even in these volatile times, our NAV is still significantly higher than our stock price.
3 Comprised of New York City-centric peers, SL Green, Empire State Realty Trust and Paramount Group.
4 Per Green Street Advisors.
5 NAV has been reduced by $10 for the Urban Edge spin-off and $23 for the JBG SMITH spin-off.
6

731 Lexington Avenue
7
Growth
As is our custom, we present the chart below that traces our ten-year record of growth, both in absolute dollars and per share amounts:
| ($
AND SHARES IN MILLIONS, EXCEPT PER | NOI(6) | FFO, As Adjusted | Shares | ||||||||||||||||||||||
| SHARE DATA) | Amount | % Change | Amount | % Change | Per Share | Outstanding | |||||||||||||||||||
| 2019 | 1,198.3 | (0.6 | %) | 666.2 | (6.6 | %)(7) | 3.49 | (7) | 203.1 | ||||||||||||||||
| 2018 | 1,205.5 | (0.6 | %) | 713.5 | 0.1 | % | 3.73 | 202.3 | |||||||||||||||||
| 2017 | 1,212.7 | 3.5 | % | 712.9 | 4.7 | % | 3.73 | 201.6 | |||||||||||||||||
| 2016 | 1,171.5 | 2.1 | % | 681.0 | 4.7 | % | 3.58 | 200.5 | |||||||||||||||||
| 2015 | 1,147.9 | 8.7 | % | 650.3 | 21.5 | % | 3.43 | 199.9 | |||||||||||||||||
| 2014 | 1,056.5 | 5.4 | % | 535.1 | 8.0 | % | 2.84 | 198.5 | |||||||||||||||||
| 2013 | 1,002.0 | 12.8 | % | 495.6 | 29.5 | % | 2.64 | 197.8 | |||||||||||||||||
| 2012 | 888.3 | 0.7 | % | 382.8 | 2.9 | % | 2.05 | 197.3 | |||||||||||||||||
| 2011 | 882.3 | 2.6 | % | 371.9 | 6.0 | % | 1.94 | 196.5 | |||||||||||||||||
| 2010 | 859.8 | 3.1 | % | 350.7 | 48.6 | % | 1.85 | 195.7 | |||||||||||||||||
Selling assets for a good price is a good thing, but it does (unless proceeds are reinvested at higher yields) punish our earnings. The table below compares our published FFO period-by-period to what our FFO might have been had we not sold or spun assets:
| FFO, As Adjusted Per Share | FFO, As Adjusted Including Sold Properties Per Share | ||||||||
| 2019 | $ | 3.49 | $ | 6.79 | |||||
| 2018 | 3.73 | 6.92 | |||||||
| 2017 | 3.73 | 6.86 | |||||||
| 2016 | 3.58 | 6.50 | |||||||
| 2015 | 3.43 | 6.28 | |||||||
6 All years include only the properties owned at the end of 2019.
7 Actual FFO, As Adjusted in 2018 was $3.73 per share and actual FFO, As Adjusted in 2019 was $3.49 per share. In our fourth quarter earnings conference call, we estimated that 2020 FFO, As Adjusted would be $3.21 per share (as a result of the effect of COVID-19, this estimate is no longer valid and cannot be relied on). The table below, which we filed in an 8-K on March 2, 2020, is included to reconcile these amounts.
FFO, As Adjusted – bridge 2018-2020
($ in millions, except per share amounts)
| Amount | Per Share | |||||||
| 2018 FFO, As Adjusted | 713.5 | 3.73 | ||||||
| Asset sales: | ||||||||
| LXP | ||||||||
| UE | ||||||||
| Retail JV | ||||||||
| 330 Madison Avenue | ||||||||
| 3040 M Street | ||||||||
| PREIT | ||||||||
| Total asset sales | (80.6 | ) | ||||||
| PENN1 and PENN2 out of service | (33.7 | ) | ||||||
| Retail bankruptcies (Forever 21 and Topshop) | (23.3 | ) | ||||||
| G&A expense (primarily non-cash stock based compensation associated with leadership changes) | (13.8 | ) | ||||||
| Other (primarily net interest savings of 27.2) | 24.7 | |||||||
| Business growth | 26.9 | |||||||
| 2020 Budgeted FFO, As Adjusted (no longer valid) | 613.7 | 3.21 | ||||||
8
Acquisitions/Dispositions
Here is a ten-year schedule of acquisitions and dispositions.(8)
| Number of | Net Acquisitions/ | |||||||||||||||||||
| ($ IN MILLIONS) | Transactions | (Dispositions) | Acquisitions | Dispositions | Gain | |||||||||||||||
| 2019 | 7 | (2,818.6 | ) | 67.1 | 2,885.7 | 1,384.1 | ||||||||||||||
| 2018 | 9 | 336.0 | 573.5 | 237.5 | 170.4 | |||||||||||||||
| 2017 | 9 | (5,901.9 | ) | 145.7 | 6,047.6 | 5.1 | ||||||||||||||
| 2016 | 11 | (875.1 | ) | 147.4 | 1,022.5 | 664.4 | ||||||||||||||
| 2015 | 25 | (3,717.1 | ) | 955.8 | 4,672.9 | 316.7 | ||||||||||||||
| 2014 | 17 | (412.3 | ) | 648.1 | 1,060.4 | 523.4 | ||||||||||||||
| 2013 | 26 | (616.5 | ) | 813.3 | 1,429.8 | 434.1 | ||||||||||||||
| 2012 | 33 | 142.9 | 1,365.2 | 1,222.3 | 454.0 | |||||||||||||||
| 2011 | 19 | 1,109.9 | 1,499.1 | 389.2 | 137.8 | |||||||||||||||
| 2010 | 20 | 404.6 | 542.4 | 137.8 | 56.8 | |||||||||||||||
| 176 | (12,348.1 | ) | 6,757.6 | 19,105.7 | 4,416.8 | |||||||||||||||
Over the ten-year period, our dispositions totaled $19.1 billion and we were a net seller of $12.3 billion. Our acquisition activity has ebbed in response to a rising market. We have pushed away from acquisitions that are off-the-fairway, non-strategic or over-priced.(9) From 2012 our disposition activity (including our two spin-offs) has increased as we have implemented our strategic simplification.
2019 includes $2.665 billion for the Retail Joint Venture (resulting in a gain of $1.205 billion)(10) and $100 million for 330 Madison Avenue, both sold at a 4.5% cap rate, as well as 3040 M Street and 86th and Madison Avenue. 2017 includes $5.997 billion for the JBG SMITH spin-off and 2015 includes $3.700 billion for the Urban Edge Properties spin-off. No gain was recognized on the spin-offs.
Timing is crucial in investing (just look at the performance of the various vintages of private equity investments). Looking back, our best investments and largest returns were made by loading it in at the right time and the right time has always been when the economy is just coming out of recession.
Spring Cleaning
In 2019, we sold 18.5 million common shares of Lexington Realty Trust (NYSE:LXP) realizing net proceeds of $167.7 million. This sale resulted in a financial statement gain of $16.1 million.
We also sold 5.7 million common shares of Urban Edge Properties (NYSE:UE) realizing net proceeds of $108.5 million. This sale resulted in a financial statement gain of $62.4 million. In accordance with requirements of the tax-free spin-off, these shares had to be sold by the end of 2019. The sale in no way reflects on our thinking about the prospects of UE.
In January 2020 we sold 6.3 million common shares of Pennsylvania Real Estate Trust (NYSE:PEI) realizing net proceeds of $28.4 million. This sale resulted in a financial statement loss of $4.9 million.
These sales, together with previous activity, put us far along in cashing out the non-core, for-sale list.
The action here takes place on the 45th floor where our acquisitions/dispositions team resides. Thanks to Michael Franco and EVP Mark Hudspeth and to SVPs Cliff Broser, Adam Green, Mario Ramirez, Michael Schnitt, Jared Toothman and the rest of the team.
| 8 | Excludes marketable securities. |
| 9 | It is very, very hard to push away at cycle tops when all around you are buying and celebrating and buying again and celebrating again. |
| 10 | The total gain reported in our published documents was $2.571 billion, the difference being the gain recognized on the step up in basis to fair value of the retained portion of the assets. |
9
Capital Markets
At year-end, we had $3.8 billion of immediate liquidity comprised of $1.6 billion of cash, restricted cash and marketable securities and $2.2 billion available on our $2.75 billion revolving credit facilities. Today, we have $3.3 billion of immediate liquidity. We also have $9.0 billion of unencumbered assets.
Since January 1, 2019, we have executed 13 capital markets transactions totaling $5.0 billion. Our capital markets team had another banner year. Thank you to EVP Mark Hudspeth and SVPs Richard Reczka and Jan LaChapelle.
In December, a joint venture in which we have a 49.9% interest, completed an $85.5 million refinancing of 50-70 West 93rd Street, a 325-unit Manhattan residential complex. The five-year interest-only loan carries an interest rate of LIBOR plus 1.53%, which was swapped to a fixed rate of 3.14%, and matures in December 2024. The loan replaces the previous $80 million loan that bore interest at LIBOR plus 1.70% and was scheduled to mature in August 2021, as extended.
In November, a joint venture in which we have a 20.1% interest, completed an $800 million refinancing of 650 Madison Avenue, a 601,000 square foot Manhattan office and retail property. The ten-year interest-only loan carries a fixed rate of 3.49% and matures in December 2029. The loan replaces the previous $800 million loan that bore interest at a fixed rate of 4.39% and was scheduled to mature in October 2020.
In November, Vornado Capital Partners Real Estate Fund completed a $145.1 million refinancing of the Lucida, a 155,000 square foot Manhattan retail and residential property. The interest-only loan carries a current rate of 3.51% (LIBOR plus 1.85%) and matures in November 2022, with two one-year extension options. The loan replaces the previous $146 million loan that bore interest at LIBOR plus 1.55% and was scheduled to mature in December 2019.
In September, we repaid the $575 million mortgage loan on PENN2 with proceeds from our unsecured revolving credit facilities. The mortgage loan was scheduled to mature in December 2019. PENN2 is a 1,795,000 square foot (as expanded) Manhattan office building currently under redevelopment.
In September, a consolidated joint venture, in which we have a 50% interest, completed a $75 million refinancing of 606 Broadway, a 36,000 square foot Manhattan office and retail building. The interest-only loan carries a current rate of 2.66% (LIBOR plus 1.80%) and matures in September 2024. In connection therewith, the joint venture purchased a 4.00% LIBOR interest rate cap. The loan replaces the previous $65 million construction loan. The construction loan bore interest at LIBOR plus 3.00% and was scheduled to mature in May 2021.
In July, a joint venture in which we have a 50% interest, completed a $60 million refinancing of 825 Seventh Avenue, a 165,000 square foot Manhattan office building. The interest-only loan carries a current rate of 3.28% (LIBOR plus 1.65%) and matures in July 2022 with a one-year extension option. The loan replaces the previous $20.5 million loan that bore interest at LIBOR plus 1.40% and was scheduled to mature in September 2019.
In June, a joint venture in which we have a 55% interest, completed a $145.7 million refinancing of 512 West 22nd Street, a 173,000 square foot Manhattan office building. The interest-only loan carries a current rate of 2.86% (LIBOR plus 2.00%) and matures in June 2023 with a one-year extension option. The loan replaces the previous $126 million construction loan that bore interest at LIBOR plus 2.65% and was scheduled to mature in November 2019.
In May, we extended our $375 million mortgage loan on 888 Seventh Avenue, an 885,000 square foot Manhattan office building, from December 2020 to December 2025. The current interest rate on the new amortizing loan is 2.62% (LIBOR plus 1.70%). Pursuant to an existing swap agreement, the interest rate on the loan has been swapped to 3.25% through December 2020.
In March, we increased to $1.5 billion (from $1.25 billion) and extended to March 2024 (as fully extended) from February 2022 one of our two unsecured revolving credit facilities. The interest rate on the extended facility was lowered from LIBOR plus 1.00% to LIBOR plus 0.90%. The facility fee remains unchanged at 20 basis points.
In March, we called for redemption all of our $400 million 5.00% senior unsecured notes. The notes, which were scheduled to mature in January 2022, were redeemed on April 1, 2019 at a redemption price of 105.51% of the principal amount plus accrued interest. We incurred a charge of $22.5 million relating to the make-whole.
In February, we completed a $580 million refinancing of 100 West 33rd Street, a 1.1 million square foot Manhattan property comprised of 859,000 square feet of office space and the 256,000 square foot Manhattan Mall. The interest-only loan carries a current rate of 2.93% (LIBOR plus 1.55%) and matures in April 2024, with two one-year extension options. The loan replaces the previous $580 million loan that bore interest at LIBOR plus 1.65% and was scheduled to mature in July 2020.
In February, we completed a $95.7 million refinancing of 435 Seventh Avenue, a 43,000 square foot Manhattan retail property. The interest-only loan carries a current rate of 2.68% (LIBOR plus 1.30%) and matures in February 2024. The recourse loan replaces the previous $95.7 million loan that bore interest at LIBOR plus 2.25% and was scheduled to mature in August 2019.
In January, a joint venture in which we have a 45.1% interest, completed a $167.5 million refinancing of 61 Ninth Avenue, a 166,000 square foot Manhattan office and retail property. The interest-only loan carries a current rate of 2.22% (LIBOR plus 1.35%) and matures in January 2026. We realized net proceeds of approximately $31 million. The loan replaces the previous $90 million construction loan that bore interest at LIBOR plus 3.05% and was scheduled to mature in December 2021.
10
Below is the right hand side of our balance sheet at December 31, 2019.
| ($ in millions) | ||||
| Secured debt | 5,670 | |||
| Unsecured debt | 1,775 | |||
| Pro rata share of non-consolidated debt | 2,803 | |||
| Noncontrolling interests’ share of consolidated debt | (483 | ) | ||
| Total debt | 9,765 | |||
| Projected cash proceeds from 220 Central Park South in excess of debt | (1,200 | ) | ||
| Cash, restricted cash, marketable securities(11) | (1,347 | ) | ||
| Net debt | 7,218 | |||
| EBITDA as adjusted | 1,144 | |||
| Net debt/EBITDA as adjusted | 6.3x |
Fixed-rate debt accounted for 69% of debt with a weighted average interest rate of 3.6% and a weighted average term of 3.6 years; floating-rate debt accounted for 31% of debt with a weighted average interest rate of 3.2% and a weighted average term of 4.5 years. (12)
82% of our debt is recourse solely to individual assets. The fair value of the assets pledged is $16.3 billion, resulting in a loan-to-value of 49.1%. We have approximately $9.0 billion of unencumbered assets.
While we enjoy access to both the unsecured and secured debt markets, it is well-known that our preference is for the latter. Unsecured debt bears the personal guarantee of the entire entity whereas secured debt has recourse only to a single property. Since pricing is about the same, I think the advantage is obvious.
Vornado remains committed to maintaining our investment grade rating.
| 11 | Cash has been reduced proforma by the $398 million special dividend paid on January 15, 2020. |
| 12 | I have maintained over the years a contrarian view that fixed-rate debt may be more risky than floating-rate debt, with the added benefit that floating-rate debt is freely prepayable. We have more floating-rate debt than most, which is intentional. |
11
Lease...Lease…Lease
The mission of our business is to create value for shareholders by growing our asset base through the addition of carefully selected properties and by adding value through intensive and efficient management. Our operating platform is where the rubber meets the road. In our business, leasing is the main event. In New York, theMART and 555 California Street, in 2019 we leased 1.7 million square feet.
As is our practice, we present below leasing and occupancy statistics for our businesses.
| (square feet in thousands) | New York | theMART | 555 California St. | ||||||||||||||
| Office | Street Retail | ||||||||||||||||
| 2019 | |||||||||||||||||
| Square feet leased | 987 | 238 | 286 | 172 | |||||||||||||
| Initial Rent | 82.17 | 175.35 | 49.43 | 88.70 | |||||||||||||
| GAAP Mark-to-Market | 5.5 | % | 12.9 | % | 10.7 | % | 64.9 | % | |||||||||
| Number of transactions | 102 | 39 | 62 | 7 | |||||||||||||
| 2018 | |||||||||||||||||
| Square feet leased | 1,827 | 255 | 243 | 249 | |||||||||||||
| Initial Rent | 79.03 | 171.25 | 53.47 | 89.28 | |||||||||||||
| GAAP Mark-to-Market | 33.7 | % | (22.7 | )% | 20.9 | % | 34.3 | % | |||||||||
| Number of transactions | 113 | 34 | 75 | 8 | |||||||||||||
| 2017 | |||||||||||||||||
| Square feet leased | 1,867 | 126 | 345 | 285 | |||||||||||||
| Initial Rent | 78.72 | 318.67 | 47.60 | 88.42 | |||||||||||||
| GAAP Mark-to-Market | 12.8 | % | 26.5 | % | 26.0 | % | 24.2 | % | |||||||||
| Number of transactions | 139 | 17 | 71 | 10 | |||||||||||||
| Occupancy rate: | |||||||||||||||||
| 2019 | 96.9 | % | 94.5 | % | 94.6 | % | 99.8 | % | |||||||||
| 2018 | 97.2 | % | 97.3 | % | 94.7 | % | 99.4 | % | |||||||||
| 2017 | 97.1 | % | 96.9 | % | 98.6 | % | 94.2 | % | |||||||||
| 2016 | 96.3 | % | 97.1 | % | 98.9 | % | 92.4 | % | |||||||||
| 2015 | 96.3 | % | 96.2 | % | 98.6 | % | 93.3 | % | |||||||||
| 2014 | 96.9 | % | 96.5 | % | 94.7 | % | 97.6 | % | |||||||||
| 2013 | 96.6 | % | 97.4 | % | 96.4 | % | 94.5 | % | |||||||||
| 2012 | 95.8 | % | 96.8 | % | 95.2 | % | 93.1 | % | |||||||||
| 2011 | 96.2 | % | 95.6 | % | 90.3 | % | 93.1 | % | |||||||||
| 2010 | 96.1 | % | 96.4 | % | 93.7 | % | 93.0 | % | |||||||||
We are full and achieving record high rents. Year in and year out, our occupancy rate is in the high 90s. 2019 was a historic year in Manhattan where 43 million square feet was leased, the most active year in two decades and we certainly got our fair share.
Thanks to our leasing captains: Glen Weiss and Haim Chera. Also thanks to the New York leasing machine: Ed Hogan, Josh Glick, Jared Solomon, Jared Silverman, Edward Riguardi, Ryan Levy, Jason Morrison, Lucy Phillips, Jake Bank and to Paul Heinen who runs leasing at theMART and 555 California Street.
12

|
Artist Rendering of PENN 2 and PENN 1 |
|
13
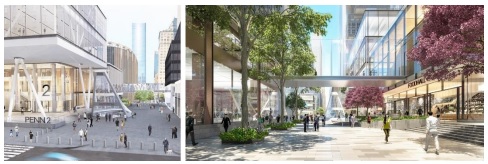
THE PENN DISTRICT
We are the largest owner in THE PENN DISTRICT with over 9 million square feet. THE PENN DISTRICT’S time has come, the district being validated by the neighboring Hudson Yards and Manhattan West. Our assets sit literally on top of Penn Station, the region’s major transportation hub, adjacent to Macy’s and Madison Square Garden.

THE PENN DISTRICT is different than our other office assets…it is a large multi-building district, it is long-term and it is development focused (development and long-term are two of the dirtiest words in REITland). But THE PENN DISTRICT is our moonshot, the highest growth opportunity in our portfolio. It seems to me appropriate that we give investors the ability to choose between higher growth or traditional stability, possibly through a tracking stock.
Our development plans for Farley, PENN1 and PENN2 were outlined in my letter to shareholders last year; images, budgets, returns and delivery dates are on our website. Each of these three large, exciting projects is now under construction and when completed will constitute the debut of our vision for THE PENN DISTRICT.

|
Artist Renderings Clockwise From Top Left: Farley, PENN 2, PENN 1 |
|
An essential part of our strategy here is that we are creating a campus, a city within a city, which will become the very beating heart of the NEW New York. We will begin with 5.2 million square feet in three buildings, interconnected either above or below ground. Over time, we hope to grow our interconnected campus to between 12 and 15 million square feet. Our scale here will allow us to offer tenants an unrivaled amenity package and the comfort in knowing that we can always accommodate their expansion needs. A 300,000 square foot tenant in a 500,000 square foot building is boxed in. Whereas in a five or ten million square foot complex, we will always be able to provide that same 300,000 square foot tenant expansion flexibility. So, scale really matters.
Importantly, our PENN DISTRICT campus, over time, will almost certainly command premium pricing.
As an aside, we own the only two Kmarts in Manhattan. After ten years or so of wrangling with Eddie, two years ago we bought back most of 770 Broadway to accommodate an in-place tenant’s expansion. In December, we bought back the 141,000 square foot Kmart at PENN1.
14
|
Artist Renderings of Plaza33 |
|
In a manner of speaking, we are in the hospitality business. I reprint here two important paragraphs from last year’s letter.
Talent is our New Client We are in a service business. We put our best foot forward when we take a page out of the hospitality industry. Our tenants appreciate and deserve to be treated like guests. Coffee and welcoming greetings go a long way. In keeping with that spirit, our PENN DISTRICT marketing campaign features the slogan, “Talent is our New Client,” the point being that everything we do, in every phase of our business, must be geared to pleasing, even delighting, our clients, defined as the talented employees of our tenants. After all, we recognize that real estate is a recruiting tool for our tenants.
Further, we are pushing the envelope of design. There is a place for Park Avenue-style financial services buildings and a place for West Side creative-type buildings. The aesthetics of our PENN DISTRICT will feature lobbies with areas to sit, congregate, surf or just hang and chill, a warm palette, welcome libraries, conference centers, gyms, an auditorium, food service, outdoor space and gardens and more. In a word, we will create a hospitality-rich communal workplace for our PENN DISTRICT tenants. The images below are a tiny sampling – additional images are posted at www.vno.com.
Our PENN DISTRICT development team is led by Barry Langer with David Bellman, Geoff Smith, Judy Kessler, Sandy Reis, Brian Thompson, and Alan Reagan.
Disclaimer: There can be no assurance that these projects will be completed, completed on schedule or within budget. There can be no assurance that the Company will be successful in leasing the properties on the expected schedule or at the budgeted rental rates.

15
Retail/Signage
Individually, and collectively as a portfolio, we own the best-in-class 70-property, 2.3 million square foot flagship street retail business in Manhattan, concentrated on the best high streets – Fifth Avenue, Times Square, THE PENN DISTRICT, Madison Avenue, and SoHo. Please see www.vno.com for portfolio details and images.
In April 2019 we transferred a 45.4% common equity interest in our portfolio of flagship high street retail assets on Upper Fifth Avenue and Times Square to a group of institutional investors. This transfer is described in detail on pages 18 and 18-A of last year’s letter to shareholders. Here is the math at share of our retail business:
| ($
IN MILLIONS, EXCEPT PROPERTIES) | Number
of Properties | NOI | NOI - Cash Basis(13) | |||||||||||
| 2019 | 70 | 273.2 | (14) | 267.7 | (14) | |||||||||
| 2018 | 71 | 353.4 | 324.2 | |||||||||||
| 2017 | 71 | 359.9 | 324.3 | |||||||||||
| 2016 | 70 | 363.7 | 292.0 | |||||||||||
| 2015 | 65 | 341.7 | 259.2 | |||||||||||
| 2014 | 57 | 263.4 | 226.6 | |||||||||||
Here are our 2019 results by submarket:
| NOI | NOI - Cash Basis(13) | |||||||||||||||
| ($ IN MILLIONS, EXCEPT %) | Amount | % | Amount | % | ||||||||||||
| Fifth Avenue | 92.6 | 33.9 | 81.6 | 30.5 | ||||||||||||
| Times Square | 49.5 | 18.1 | 46.7 | 17.4 | ||||||||||||
| THE PENN DISTRICT | 57.9 | 21.2 | 56.9 | 21.3 | ||||||||||||
| Madison Avenue | 13.6 | 5.0 | 13.4 | 5.0 | ||||||||||||
| SoHo | 14.2 | 5.2 | 17.2 | 6.4 | ||||||||||||
| Other | 45.4 | 16.6 | 51.9 | 19.4 | ||||||||||||
| Total | 273.2 | 100.0 | 267.7 | 100.0 | ||||||||||||
The retail industry (our tenants) is going through a vicious period of challenging, disruptive, secular change. Nonetheless, we are making deals – Fendi, Berluti, Sephora, Whole Foods…
In a manner of speaking, sitting between our retail business and our office business is our signage business. We own the largest signage business in Manhattan, concentrated in Times Square and THE PENN DISTRICT comprised of 22 large scale “HD spectacular LED signs” (that’s industry jargon). In 2019, the business produced $72 million of NOI (at 100%), about half from signs under long-term lease to our retail tenants and half leased in the advertising marketplace. This business is very capably managed by Gary Grossman and Justin Rinko.
13 Straight-lining of rents and amortization of below-market leases, net are excluded from NOI - Cash Basis.
14 If the Retail Joint Venture transaction had not occurred, 2019 NOI and NOI-Cash Basis would have been $338.2 and $329.0.
16

Clockwise From Top Left: 1540 & 1535 Broadway, 655 Fifth Avenue, 697-703 Fifth Avenue,
640 Fifth Avenue, Artist Rendering of Farley, 4 Union Square South, 666 Fifth Avenue
17
220 Central Park South
In a historically soft condominium market, our 220 Central Park South super-tall luxury condominium tower is now 91% sold at record prices. The financial performance of this project also surpassed all records…sort of like winning the Kentucky Derby by 10 lengths.
Our development and construction team here is led by Barry Langer with Eli Zamek and Mel Blum and the entire 44th floor. Sales were all Deborah Kern.

220 Central Park South
18

220 Central Park South Interiors Clockwise From Top Left: Tower Lobby,
Library, Men’s Locker Room, Pool, Resident Dining Room
19
Our business is 86% New York-centric and 81% office-centric. We manage the business in the following profit centers:
| · | Office |
| · | New York Office |
| · | THE PENN DISTRICT |
| · | 555 California Street in San Francisco |
| · | theMART in Chicago | |
| · | Manhattan Street Retail |
Our portfolio is populated with the highest quality assets in all of REITland: 555 California Street; theMART; our Fifth Avenue, Madison Avenue and Times Square retail assets; 1290 Avenue of the Americas; 770 Broadway, etc., etc. to name a few; AND, the most exciting development opportunity in all of REITland, THE PENN DISTRICT; AND the two best development sites in town, 350 Park Avenue and the Hotel Pennsylvania.
In recent years, we have done a lot:
| · | We made the early call on the secular decline of retail and sold our malls. | |
| · | We made the early call and coined the phrase that Manhattan was tilting to the West and South. | |
| · | We simplified and pruned to get to a focused core. All in all we sold or spun $19 billion of assets (see page 9). | |
| · | We spun-off JBG SMITH (our Washington, DC business where our shareholders inherited 75%) and Urban Edge Properties (our shopping center business where our shareholders inherited 100%). We are proud of these children. |
Our future strategy is clear and simple.
| · | We will sell assets even more aggressively and be less constrained by tax issues than we have been. No asset is sacred – in many cases, we would rather have the cash than the buildings. |
| · | Recognizing that THE PENN DISTRICT is different than our other office assets (it is a large multi-building district, it is long-term and it is development focused), it seems appropriate that we give investors the ability to choose between higher growth or traditional stability, possibly through a tracking stock. |
| · | We will reevaluate every aspect of our business. |
| · | We will fight to reduce overhead. |
| · | With our stock in the $30s/40s, let’s talk about buybacks. My views on buybacks are well known and were outlined in my 2017 letter to shareholders (and are reprinted in the footnote below).(15) We had the discipline to push away when our stock price was in the $70s. Even at the current stock price our first priority is to protect the balance sheet. We will revisit this matter as normalcy returns. |
15 Reprinted from 2017 letter to shareholders - Buying back one’s discounted stock seems to be an attractive proposition. We’ve done it before, in large scale, but that was way back in the dark ages. I must say we are tempted to do it now. Our hesitancy is that buybacks work best when financed out of recurring retained earnings. Since we dividend to shareholders all of our earnings, that is not us. So a buyback for us would be financed either by selling assets or running down our balance sheet. For us, selling assets would almost certainly result in a capital gain dividend requirement(*) rather than a source of cash to do a buyback. What’s more, we seem to be late in the cycle; real estate stocks are declining, signaling danger ahead; interest rates are rising, signaling danger ahead. This is exactly the point in the cycle where we want to maintain maximum liquidity. For us, the math is that a billion-dollar buyback would increase our NAV by about $1.50 per share;(**) for the moment, we’d rather have the billion dollars. Lastly, buybacks whose purpose is to prop up one’s stock price, sort of like putting your finger in the dike, never, ever work. Notwithstanding all of the above, buybacks are a recurring topic at our board meetings.
| * | Virtually every one of our assets has large embedded profits/tax gains. | |
| ** | By comparison, we expect $200 million invested in One Penn to increase NAV by about $4.00 per share versus a $200 million buyback which would create $0.30 of NAV. |
20
Some Thoughts, 2019 Version
| · | Out of the Blue - As I write this letter, we are now in the eye of the COVID-19 storm – an out of the blue apocalypse. Life as we know it is upside down, people are hurting, businesses are hurting, the future is uncertain. As our first priority we are following all protocols and taking all measures to protect our employees, our tenants and our communities. We pray for the health and safety of all and we commend and admire the talent and courage of our healthcare providers. |
The city and the country and the world are all in quarantine and shut-down. The disruption to normal day-to-day life and normal work life is extraordinary, but will, hopefully, be short lived; the disruption to commerce and the financial markets is double-extraordinary and likely to be longer lived. Businesses are closed, stock markets are in a rout and capital markets are seizing up. All this foretells the onset of recession. In my view, the health crisis will need to be resolved first so that we all can leave our bunkers and get back to normal life, before economies can recover.
| · | There are lessons here. First, we must always be prepared for the out-of-the-blue, unexpected black swan event…and we are. We are hunkered down and we will get through all of this. When the crisis abates there will be opportunities. Interest rates are at historic lows and may go lower. That will give us the opportunity to refinance at favorable rates. And, over time as markets settle in, our secure, long-term income streams should become more valuable (cap rates should go down, building values should increase). For what it’s worth, my observation over multiple cycles is that when stock markets blow out, investors turn to the safety and stability of hard assets. We will see. |
In our industry there will be opportunity to either buy real assets (buildings) or real estate stocks. It is very clear that today there is more opportunity in the stock market than in the real estate market.
| · | Many tenants are requesting rent relief as an antidote to their forced business closings. We and our industry will handle this on a case by case basis. We have instituted cash conservation measures across our business and we can rely on our significant liquidity (cash balance, lines of credit and unencumbered assets) to weather the storm. |
| · | My friend Steve Sakwa, the highly regarded real estate analyst at Evercore ISI, put out a report on March 1st where he calculated that at our then stock price of $53 our office buildings were selling for $460 per square foot at an 8.37% cap rate. Joe Macnow, our Dean of CFOs, agrees. With our stock now in the 30s you can do the new math. |
| · | NAV(16) is a calculation attempting to quantify a company’s private market break-up value. It is nothing more than a guide, hopefully directionally correct. It is a robotic calculation of NOI at a market cap rate. The first number is factual, the second an informed guestimate. It gives zero value for empty space, does not take into account transaction costs (which in our case would be about $4/$5 per share) and does not recognize a premium for scale or a discount for a mass sale. We first published our management’s version of NAV in 2016, but we may discontinue publishing it in the future. This is because our NAV estimate seems not to be relevant, each of our analysts and investors do their own calculations, many of which are different from ours (read lower), form their own judgments and they and the stock market pay little attention, making our NAV essentially irrelevant. |
| · | One of the big events of 2019 was the blow up of WeWork.(17) WeWork’s bubble valuation attracted enormous attention and made their business model, to many observers, the second coming. Now they were never the second coming, but they are not nothing either. Their culture of casual work and short-term or no-term lease flexibility is probably here to stay. But our large tenants want to tightly control every aspect of their space and their workforce. They are more interested in controlling space for the long term, and in being able to expand rather than all that WeWork stuff. They may use the coworking model for a very small amount of temporary or swing space, but that’s about it. |
It seems that several of the large New York landlords feel the need to be in the coworking business, each in a small way under their own brand. We ourselves are doing so as a service to our tenants in THE PENN DISTRICT. Here’s an idea – wouldn’t it make more sense for the largest New York landlords to get together and co-own and operate one coworking brand with one management team…just saying.
| · | In our council room, we have wondered whether the work-from-home response to COVID-19 may become popular and affect office demand. Anecdotally, the opposite seems to be true. Most who work at home are finding it very inefficient and after a week clamor to get back to the normal routine and social interaction of the conventional workplace. And, it may be that social distancing is the offset to densification. And, I do wonder how many of these now closed businesses will never reopen and what other disruptive changes there will be in post COVID-19 life. |
| · | The handful of mega gateway cities are not going away, in fact, they will go from strength-to-strength. Likewise, Fifth Avenue and Times Square and double likewise trophy CBD office towers in New York. To prove my point, it is not by chance that each of the FAANG companies are opening second headquarters in New York (on the West Side). And here is why: each million square foot block that the FAANGs lease will mean recruiting 5,000 talented new employees. Only New York, and maybe one other American mega-city, has a workforce large enough to support that kind of growth. |
| · | The Principles by Which We Run our Business are reprinted as Appendix A. |
16 After my review of our annual NAV published on February 18th with our year end documents, I had intended to include some comments about NAV in this letter. Green Street scooped me, publishing a piece with somewhat similar thoughts on February 24, 2020.
17 One of our alumni has taken on the interesting and challenging job of rescuing WeWork.
21
Environmental, Social and Governance (“ESG”)
Dan Egan is our industry acclaimed Senior Vice President, Sustainability. Please see our ESG report at www.vno.com. What follows is Dan’s summary of 2019 accomplishments and goals. Thank you, Dan.
Sustainability – now more broadly referred to as Environmental, Social and Governance (ESG) – is important to us. We believe a focus on ESG is responsible management of our business and key to mitigating risk.
We prioritize addressing climate change, and now, more than ever, we hear our investors, our tenants, our employees, and our communities echo that priority. We conduct business in cities and states that in 2019 passed bold regulation to reduce carbon emissions. And the business community has responded in kind with its own bigger and bolder reduction commitments.
We believe now is the time for Vornado to continue our leadership with a bigger and bolder commitment of our own: we intend to make our buildings carbon neutral by 2030 and we have adopted a ten year plan (“Vision 2030”) to get us there.
Though the road to carbon neutrality is complex, our plan is based on principles already core to our sustainability mission: energy efficiency, innovations in technology, stakeholder engagement, and local community benefit. Already this vision is guiding our redevelopment of THE PENN DISTRICT, where we are applying our experience in energy innovation, resource conservation, and health and wellness to the district.
We are proud that solutions we deploy across our existing buildings have proven to be a model for the real estate industry at large. Our energy efficiency capital projects continue to save energy and modernize our buildings. We are an active participant in demand response and contribute significantly to relieving the grid of constraints in each of our markets. We lead a robust tenant engagement program that in 2019 included the continuation of our tenant roundtable series. And we guide the design and operation of our tenant spaces to maximize efficiency.
Our tenants and our employees spend the majority of their week working in our buildings, and we are committed to providing an optimal environment for them, with a focus on healthy air and water and the least-toxic, health-driven cleaning policies and materials. We are going even a step further with the launch of our own smartphone application intended to make available to tenants all the amenities and information that our buildings and neighborhoods have to offer.
Importantly, our programs continue to deliver results: in 2019, we reduced our global energy consumption by over 4% from prior year. We recycled and composted over 15,000 tons of waste, amounting to a diversion rate of over 61%. We were awarded NAREIT’s Leader in the Light Award (10th year in a row), we achieved ENERGY STAR Partner of the Year with Sustained Excellence (5th time with this distinction), and we earned the Global Real Estate Sustainability Benchmark (GRESB) Green Star ranking (7th year in a row). In 2019, we scored among the top 6% of over 950 worldwide respondents to GRESB.
We own and operate more than 26 million square feet of LEED-certified buildings, with over 23 million square feet at LEED Gold or better. We are committed to LEED certifying our entire office portfolio and we are already 94% toward that goal.
Vornado’s employees are very, very important to us. To foster their talent and growth, we provide training and continuing education, promote career and personal development, and encourage innovation and engagement. Vornado’s policies support shareholder rights, worker rights, diversity and equal opportunity.
Our social commitments also extend to the communities we live and work in. As a corporate citizen, we uphold our responsibility to give back by encouraging our employees to volunteer. Through Vornado Volunteers, our employees give back to communities through participation in causes that support vulnerable parts of the population, protect and improve the environment, and promote a healthy lifestyle.
From a governance perspective, we are proud to have an esteemed and experienced Board of Trustees, many of whom are significant investors in our Company and all of whom are committed to building shareholder value. A complete summary of our approach to governance is included in our proxy statement which can be viewed at www.vno.com/proxy and the governance section on our website at www.vno.com/governance.
Further details on our environmental, social, and governance programs, including our Vision 2030 roadmap, can be found in our 2019 ESG Report. We have signed on as a supporter of the Taskforce on Climate-related Financial Disclosures. Our report is in accordance with the Global Reporting Initiative (GRI), and is also aligned with the metrics codified by the Sustainability Accounting Standards Board (SASB).
22

Clockwise From Top Left: 512 West 22nd Street, 555 California Street, theMART, 61 Ninth Avenue
23
Board Matters
In law and in practice, our Board of Trustees is our governing body, the ultimate authority. Board meetings are major events around here. The preparation of transactional and strategic material is intense. Transparency and communication is essential. We have a highly intelligent, seasoned, involved, fully committed and invested Board. Our boardroom overflows with real estate, legal and financial expertise, a large dose of what we call commercial instincts and lots of good old-fashioned judgment.
It has been our practice to add to/refresh our Board with talented trustees. We welcome Beatrice Hamza Bassey who was appointed to our Board of Trustees on March 26th and will stand for election at the May annual meeting. Her biography follows:
 |
Beatrice Hamza Bassey has served as the Group General Counsel, Chief Compliance Officer and Corporate Secretary of Atlas Mara Ltd. (an African-focused banking group) since February 2015. In her capacity as such, she has served as a member of the boards of directors of a number of Atlas Mara Ltd.’s subsidiary or affiliated banks operating in Africa. From September 1998 until February 2015, Ms. Hamza Bassey was an attorney with Hughes Hubbard & Reed LLP where she served as a partner, a member of the firm’s Executive Committee and Chair of the Africa Practice. |
24
This year we recognized our next generation of extraordinary and talented senior leadership.
David Greenbaum was appointed Vice Chairman
Michael Franco was appointed President
Glen Weiss was appointed Co-Head of Real Estate
Barry Langer was appointed Co-Head of Real Estate
Haim Chera was hired as Head of Retail
We continually broaden our leadership team through promotions from within our Company. Please join me in congratulating this year’s class; they deserve it.
Lisa Vogel was promoted to Executive Vice President, Marketing
Michael Schnitt was promoted to Senior Vice President, Acquisitions & Capital Markets
Jared Toothman was promoted to Senior Vice President, Acquisitions & Capital Markets
James Iervolino was promoted to Senior Vice President, Risk Management
David Perl was promoted to Senior Vice President, Lease Administration
Sean Sherman was promoted to Senior Vice President, Accounts Receivable
Jerald Kohrs was promoted to Vice President, Marketing
Brian Feldman was promoted to Vice President, Acquisitions & Capital Markets
Luis Santos was promoted to Vice President, Corporate Accounting
Ryan Saum was promoted to Vice President, Employee Compensation
Dalel Sernas was promoted to Vice President, Accounts Payable
Lewis Yu was promoted to Vice President, Tax & Compliance
Kitty Zhang was promoted to Vice President, Tax & Compliance
Maulik Shah was promoted to Vice President, Building Operations & Construction Services
Welcome Nicole Dosso, Vice President, Design and Construction.
Our operating platform heads are the best in the business. I pay my respects to my partners David Greenbaum, Michael Franco, Joe Macnow, Glen Weiss, Barry Langer and Haim Chera.
We are fortunate to have in our Operating and Finance Divisions a group of super associates.
Special thanks to all of our Vornado teams who are now working remotely and doing a brilliant job keeping the trains running and on time. Thanks to Robert Entin and his IT group for handling so well and so quickly the technical and logistical aspects to allow work from home.
Our exceptional Division Executive Vice Presidents deserve special recognition and our thanks: Michael Doherty – BMS; Robert Entin, Chief Information Officer; Fred Grapstein, Hotel Pennsylvania; Ed Hogan, Leasing – New York Retail; Mark Hudspeth, Capital Markets; Matthew Iocco, Chief Accounting Officer; Myron Maurer, Chief Operating Officer – theMART; Tom Sanelli, Chief Financial Officer – New York; Gaston Silva, Chief Operating Officer – New York; Craig Stern, Tax & Compliance and Lisa Vogel, Marketing.
Thank you as well to our very talented and hard working 29 Senior Vice Presidents and 64 Vice Presidents who make the trains run on time, every day.
Our Vornado Family has grown with 9 marriages and 21 births this year, 15 girls and 6 boys.
On behalf of Vornado’s Board, senior management and 4,008 associates, we thank our shareholders, analysts and other stakeholders for their continued support.
Warren Buffet has said a good shareholders letter is written by a smart CEO, telling the truth and it helps if they write every word themselves. I plead guilty to two out of three.
Steven Roth
Chairman and CEO
March 30, 2020
Broadway theatres are now closed. When they reopen, please call if I can help with tickets to my wife’s and to my son’s shows.
25
Appendix A - Here Are The Principles By Which We Run Our Business:
We are a fully-integrated real estate operating company. We have the best leasing, operating and development teams in the business. We are laser focused.
We invest in the best buildings in the best locations.
We seek to acquire value-add assets where our unique skills will create shareholder value. We believe vacancy at the right price is an opportunity and that buildings, even in rundown condition (that we can reimagine) in great locations are also an opportunity.
We invest in our buildings to maintain, modernize and transform. The front of the house and the back of the house of our assets are as good as new (and are in locations where new could not be created). Our transformations have increased rents over $20 per square foot, yielding attractive double-digit returns. We also measure our success here by the quality of tenants we have been able to attract. We have transformed almost all of our fleet; THE PENN DISTRICT is on deck.
We are disciplined and patient and prepared to let flat 4% cap rate deals pass by, while we wait for the fat pitch.
While we have many million plus square foot buildings, we shy away from 500,000 square foot tenants who seem to always get the better of the deal, in strong markets or in weak. Our sweet spot is the 50,000 to 200,000 square foot tenant.
A few years ago, I coined the phrase, “The island of Manhattan is tilting to the West and to the South.” Today, the hottest submarkets in town run from Hudson Yards to THE PENN DISTRICT and extend South through Chelsea and Meatpacking. Anticipating these trends, we have structured our office portfolio so that half of our square footage is in this district.
We have a hospitality approach, treating our tenants as the valued customers that they are. This attitude begins at the leasing table (although that process can at times be contentious), through tenant fit up, to greeting at the front door. We believe this approach yields the highest renewal rate in the business; renewing tenants enhances our bottom line.
We treat the real estate brokerage community as if they are our customers, because they are. Brokers prefer dealing with us, we know what it takes to make a deal, we treat their clients well and we deliver every time.
We are in the amenity business. Our amenity poster child is the giant MART in Chicago, where we have dominant, state of the art, dining, workout, socializing and meeting spaces, etc.
Tenant mix is really important; companies and their employees care who they co-tenant with. The design and location of each of our buildings has a target market in mind. For example our new-builds in Chelsea are targeting the creative class and boutique financials (an interesting combination).
We maintain a fortress balance sheet with industry-leading liquidity.
All of this in the relentless pursuit of shareholder value.
26
Below is a reconciliation of Net Income to NOI, As Adjusted (properties owned at the end of 2019):
| ($ IN MILLIONS) | 2019 | 2018 | 2017 | 2016 | 2015 | 2014 | 2013 | 2012 | 2011 | 2010 | ||||||||||||||||||||||||||||||
| Net Income | 3,334.3 | 422.6 | 264.1 | 982.0 | 859.4 | 1,009.0 | 564.7 | 694.5 | 740.0 | 708.0 | ||||||||||||||||||||||||||||||
| Our share of (income) loss from partially owned entities | (78.9 | ) | (9.1 | ) | (15.2 | ) | (168.9 | ) | 9.9 | 58.5 | 336.3 | (428.9 | ) | (125.5 | ) | (85.6 | ) | |||||||||||||||||||||||
| Our share of loss (income) from real estate fund | 104.1 | 89.2 | (3.2 | ) | 23.6 | (74.1 | ) | (163.0 | ) | (102.9 | ) | (63.9 | ) | (22.9 | ) | -- | ||||||||||||||||||||||||
| Interest and other investment (income) loss, net | (21.8 | ) | (17.1 | ) | (37.8 | ) | (29.6 | ) | (27.2 | ) | (38.6 | ) | 20.8 | 252.7 | (156.6 | ) | (234.6 | ) | ||||||||||||||||||||||
| Net gains on disposition of assets | (845.5 | ) | (246.0 | ) | (0.5 | ) | (160.4 | ) | (149.4 | ) | (13.6 | ) | (2.0 | ) | (4.9 | ) | (10.9 | ) | (26.7 | ) | ||||||||||||||||||||
| Net gain on transfer to Fifth Ave. and Times Square JV | (2,571.1 | ) | -- | -- | -- | -- | -- | -- | -- | -- | -- | |||||||||||||||||||||||||||||
| Purchase price fair value adjustment | -- | (44.1 | ) | -- | -- | -- | -- | -- | -- | -- | -- | |||||||||||||||||||||||||||||
| Net losses on early extinguishment of debt | -- | -- | -- | -- | -- | -- | -- | -- | -- | 10.8 | ||||||||||||||||||||||||||||||
| (Income) loss from discontinued operations | -- | (0.6 | ) | 13.2 | (404.9 | ) | (223.5 | ) | (686.9 | ) | (666.8 | ) | (378.1 | ) | (394.4 | ) | (351.6 | ) | ||||||||||||||||||||||
| NOI attributable to noncontrolling interests | (69.3 | ) | (71.2 | ) | (65.3 | ) | (66.2 | ) | (64.9 | ) | (55.0 | ) | (58.6 | ) | (45.3 | ) | (47.9 | ) | (47.8 | ) | ||||||||||||||||||||
| Depreciation, amortization expense and income taxes | 522.6 | 484.2 | 470.4 | 428.2 | 294.8 | 360.7 | 342.5 | 304.5 | 309.2 | 301.3 | ||||||||||||||||||||||||||||||
| General and administrative expense | 169.9 | 141.9 | 159.0 | 149.6 | 149.3 | 141.9 | 150.3 | 140.5 | 137.5 | 145.7 | ||||||||||||||||||||||||||||||
| Acquisition and transaction related costs | 106.5 | 31.3 | 1.8 | 9.4 | 12.5 | 18.4 | 24.9 | 17.4 | 34.9 | 38.6 | ||||||||||||||||||||||||||||||
| Our share of NOI from partially owned entities | 322.4 | 253.6 | 269.2 | 271.1 | 245.8 | 207.7 | 175.1 | 152.1 | 132.2 | 100.8 | ||||||||||||||||||||||||||||||
| Interest and debt expense | 286.6 | 347.9 | 345.6 | 330.2 | 309.3 | 337.4 | 323.5 | 315.7 | 338.0 | 348.9 | ||||||||||||||||||||||||||||||
| NOI | 1,259.8 | 1,382.6 | 1,401.3 | 1,364.1 | 1,341.9 | 1,176.5 | 1,107.8 | 956.3 | 933.6 | 907.8 | ||||||||||||||||||||||||||||||
| Certain items that impact NOI | (61.5 | ) | (177.1 | ) | (188.6 | ) | (192.6 | ) | (194.0 | ) | (120.0 | ) | (105.8 | ) | (68.0 | ) | (51.3 | ) | (48.0 | ) | ||||||||||||||||||||
| NOI, As Adjusted (properties owned at the end of 2019) | 1,198.3 | 1,205.5 | 1,212.7 | 1,171.5 | 1,147.9 | 1,056.5 | 1,002.0 | 888.3 | 882.3 | 859.8 | ||||||||||||||||||||||||||||||
Below is a reconciliation of Net Income to FFO and FFO, As Adjusted:
| ($ IN MILLIONS, EXCEPT SHARE AMOUNTS) | 2019 | 2018 | 2017 | 2016 | 2015 | 2014 | 2013 | 2012 | 2011 | 2010 | ||||||||||||||||||||||||||||||
| Net Income attributable to Vornado | 3,147.9 | 449.9 | 227.4 | 906.9 | 760.4 | 864.9 | 476.0 | 617.3 | 662.3 | 647.9 | ||||||||||||||||||||||||||||||
| Preferred share dividends and issuance costs | (50.1 | ) | (65.1 | ) | (65.4 | ) | (83.3 | ) | (80.6 | ) | (81.5 | ) | (84.0 | ) | (67.9 | ) | (60.5 | ) | (51.2 | ) | ||||||||||||||||||||
| Net Income applicable to common shares | 3,097.8 | 384.8 | 162.0 | 823.6 | 679.8 | 783.4 | 392.0 | 549.4 | 601.8 | 596.7 | ||||||||||||||||||||||||||||||
| Depreciation and amortization of real property | 389.0 | 413.1 | 468.0 | 531.6 | 514.1 | 517.5 | 501.8 | 504.4 | 530.1 | 505.8 | ||||||||||||||||||||||||||||||
| Net gains on sale of real estate | (178.7 | ) | (158.1 | ) | (3.5 | ) | (177.0 | ) | (289.1 | ) | (507.2 | ) | (411.6 | ) | (245.8 | ) | (51.6 | ) | (57.2 | ) | ||||||||||||||||||||
| Real estate impairment losses | 32.0 | 12.0 | -- | 160.7 | 0.3 | 26.5 | 37.1 | 130.0 | 28.8 | 97.5 | ||||||||||||||||||||||||||||||
| Decrease in fair value of marketable securities | 5.5 | 26.5 | -- | -- | -- | -- | -- | -- | -- | -- | ||||||||||||||||||||||||||||||
| Net gain on transfer to Fifth Ave. and Times Square JV, net | (2,559.1 | ) | -- | -- | -- | -- | -- | -- | -- | -- | -- | |||||||||||||||||||||||||||||
| Net gain from sale of Urban Edge shares | (62.4 | ) | -- | -- | -- | -- | -- | -- | -- | -- | -- | |||||||||||||||||||||||||||||
| After tax purchase price fair value adjustment | -- | (27.3 | ) | -- | -- | -- | -- | -- | -- | -- | -- | |||||||||||||||||||||||||||||
| Partially-owned entities adjustments: | ||||||||||||||||||||||||||||||||||||||||
| Depreciation of real property | 134.7 | 101.6 | 137.0 | 154.8 | 144.0 | 117.8 | 157.3 | 154.7 | 170.9 | 148.3 | ||||||||||||||||||||||||||||||
| Net gains on sale of real estate | -- | (4.0 | ) | (17.8 | ) | (2.9 | ) | (4.5 | ) | (11.6 | ) | (0.5 | ) | (241.6 | ) | (9.8 | ) | (5.8 | ) | |||||||||||||||||||||
| Income tax effect of adjustments | -- | -- | -- | -- | -- | (7.3 | ) | (26.7 | ) | (27.5 | ) | (24.6 | ) | (24.6 | ) | |||||||||||||||||||||||||
| Real estate impairment losses | -- | -- | 7.7 | 6.3 | 16.8 | -- | 6.6 | 11.6 | -- | 11.5 | ||||||||||||||||||||||||||||||
| Decrease in fair value of marketable securities | 2.9 | 3.9 | -- | -- | -- | -- | -- | -- | -- | -- | ||||||||||||||||||||||||||||||
| Noncontrolling interests’ share adjustments | 141.7 | (22.8 | ) | (36.7 | ) | (41.1 | ) | (22.4 | ) | (8.0 | ) | (15.1 | ) | (16.6 | ) | (41.0 | ) | (46.8 | ) | |||||||||||||||||||||
| Interest on exchangeable senior debentures | -- | -- | -- | -- | -- | -- | -- | -- | 26.1 | 25.9 | ||||||||||||||||||||||||||||||
| Preferred share dividends | -- | -- | 1.1 | 1.6 | -- | -- | 0.1 | -- | 0.3 | 0.2 | ||||||||||||||||||||||||||||||
| Funds From Operations | 1,003.4 | 729.7 | 717.8 | 1,457.6 | 1,039.0 | 911.1 | 641.0 | 818.6 | 1,231.0 | 1,251.5 | ||||||||||||||||||||||||||||||
| Certain items that impact FFO | (337.2 | ) | (16.2 | ) | (4.9 | ) | (776.6 | ) | (388.7 | ) | (376.0 | ) | (145.4 | ) | (435.8 | ) | (859.1 | ) | (900.8 | ) | ||||||||||||||||||||
| Funds From Operations, As Adjusted | 666.2 | 713.5 | 712.9 | 681.0 | 650.3 | 535.1 | 495.6 | 382.8 | 371.9 | 350.7 | ||||||||||||||||||||||||||||||
| Below is a reconciliation of Net Income to Net Income, as Adjusted: | ||||||||
| ($ IN MILLIONS) | 2019 | 2018 | ||||||
| Net Income applicable to common shares | 3,097.8 | 384.8 | ||||||
| Net gain on transfer to Fifth Ave. and Times Square JV, net | (2,559.1 | ) | -- | |||||
| 666 Fifth Avenue | -- | (134.0 | ) | |||||
| Real Estate Fund | 48.8 | 23.7 | ||||||
| 220 CPS Gains | (502.6 | ) | (67.3 | ) | ||||
| Non-cash impairment losses | 109.2 | 12.0 | ||||||
| Certain other items that impact net income | (17.4 | ) | 19.5 | |||||
| Net income, as Adjusted | 176.7 | 238.7 | ||||||
| Below is a reconciliation of Net Income to EBITDA, as Adjusted | ||||
| ($ IN MILLIONS) | 2019 | |||
| Net income (before noncontrolling interests) | 3,334.3 | |||
| Less: net loss attributable to noncontrolling interests in consolidated subsidiaries | 24.5 | |||
| Net income attributable to the Operating Partnership | 3,358.8 | |||
| Interest and debt expense | 390.1 | |||
| Depreciation and amortization | 530.6 | |||
| Gains on sale and impairment losses on real estate | (2,705.9 | ) | ||
| Income tax expense and other | 103.9 | |||
| EBITDA | 1,677.5 | |||
| Gain on sale of 220 Central Park South units | (604.4 | ) | ||
| Gain on sale of Urban Edge shares | (62.4 | ) | ||
| Impairment losses and writeoffs on 608 Fifth Avenue | 77.2 | |||
| Decrease in fair value of marketable securities | 8.4 | |||
| Real Estate Fund | 48.8 | |||
| Other | (1.2 | ) | ||
| EBITDA, as adjusted | 1,143.9 | |||
| Below is a reconciliation of Total Assets to Total Assets, as Adjusted: | ||||||||
| ($ IN MILLIONS) | 2019 | 2018 | ||||||
| Total Assets | 18,287.0 | 17,180.8 | ||||||
| Adjustments: | ||||||||
| Assets related to sold properties | (7.4 | ) | (6.7 | ) | ||||
| Moynihan Trail Hall development | (914.9 | ) | (445.7 | ) | ||||
| Right of use assets | (379.5 | ) | -- | |||||
| Real Estate Fund | (222.7 | ) | (318.8 | ) | ||||
| Cash available to repay revolving credit facilities | (575.0 | ) | (80.0 | ) | ||||
| Accumulated depreciation | 3,015.9 | 3,180.2 | ||||||
| Total Assets, as Adjusted | 19,203.4 | 19,509.8 | ||||||
| Below is a reconciliation of Revenues to Revenues, as Adjusted: | ||||||||
| ($ IN MILLIONS) | 2019 | 2018 | ||||||
| Revenues | 1,924.7 | 2,163.7 | ||||||
| Revenues related to sold properties | (15.4 | ) | (22.6 | ) | ||||
| Revenues, as Adjusted | 1,909.3 | 2,141.1 | ||||||
27