Attached files
UNITED
STATES SECURITIES AND EXCHANGE COMMISSION
Washington, D.C. 20549
FORM 10-K
☒ ANNUAL REPORT PURSUANT TO
SECTION 13 OR 15(d) OF THE SECURITIES EXCHANGE ACT OF
1934
For the
fiscal year ended December 31, 2019
or
☐ TRANSITION REPORT PURSUANT TO
SECTION 13 OR 15(d) OF THE SECURITIES EXCHANGE ACT OF
1934
For the
transition period from
to
Commission
File Number 000-09908
TOMI ENVIRONMENTAL SOLUTIONS, INC.
(Exact name of registrant as specified in its
charter)
|
FLORIDA
|
|
59-1947988
|
|
(State or other jurisdiction of incorporation or
organization)
|
|
(I.R.S. Employer Identification No.)
|
|
9454 Wilshire Blvd., R-1,
Beverly Hills, California
|
|
90212
|
|
(Address of principal executive offices)
|
|
(Zip Code)
|
Registrant’s telephone number, including area code: (800)
525-1698
Securities
registered under Section 12(b) of the Exchange Act:
None
Securities
registered under Section 12(g) of the Exchange Act:
|
Common Stock, $0.01 par
value per share
|
|
(Title of class)
|
Indicate by check
mark if the registrant is a well-known seasoned issuer, as defined
in Rule 405 of the Securities Act. Yes ☐ No ☒
Indicate by check
mark if the registrant is not required to file reports pursuant to
Section 13 or Section 15(d) of the Act. Yes ☐ No
☒
Indicate by check
mark whether the registrant (1) has filed all reports required to
be filed by Section 13 or 15(d) of the Securities Exchange Act of
1934 during the preceding 12 months (or for such shorter period
that the registrant was required to file such reports), and (2) has
been subject to such filing requirements for the past 90 days. Yes
☒ No ☐
Indicate by check
mark whether the registrant has submitted electronically and posted
on its corporate Web site, if any, every Interactive Data File
required to be submitted and posted pursuant to Rule 405 of
Regulation S-T (§ 232.405 of this chapter) during the
preceding 12 months (or for such shorter period that the registrant
was required to submit and post such files). Yes ☒ No
☐
Indicate by check
mark whether the registrant is a large accelerated filer, an
accelerated filer, a non-accelerated filer, a smaller reporting
company, or emerging growth company. See the definitions of
“large accelerated filer,” “accelerated
filer,” “smaller reporting company,” and
“emerging growth company” in Rule 12b-2 of the Exchange
Act:
|
Large
Accelerated Filer ☐
|
|
Accelerated
Filer ☐
|
|
Non-Accelerated
Filer ☐
|
|
Smaller
Reporting Company ☒
|
|
|
|
Emerging
Growth Company ☐
|
If an
emerging growth company, indicate by check mark if the registrant
has elected not to use the extended transition period for complying
with any new or revised financial accounting standards provided
pursuant to Section 13(a) of the Exchange Act. ☐
Indicate by check
mark whether the registrant is a shell company (as defined in Rule
12b-2 of the Act). Yes ☐ No ☒
As of
June 30, 2019, the last business day of the registrant’s most
recently completed second fiscal quarter, the aggregate market
value of the common stock held by non-affiliates of the registrant
was approximately $8,004,609, based upon the closing price of the
registrant’s common stock as reported on the OTCQB
Marketplace on such date.
As of March 24, 2020, the registrant had
133,517,083 shares of common stock outstanding.
DOCUMENTS INCORPORATED BY REFERENCE
None.
TOMI ENVIRONMENTAL SOLUTIONS, INC.
ANNUAL REPORT ON FORM 10-K
FOR THE FISCAL YEAR ENDED DECEMBER 31, 2019
TABLE OF CONTENTS
|
Item
|
Page
|
|
|
PART I
|
||
|
1.
|
Business
|
1
|
|
1A.
|
Risk
Factors
|
11
|
|
1B.
|
Unresolved Staff
Comments
|
17
|
|
2.
|
Properties
|
17
|
|
3.
|
Legal
Proceedings
|
17
|
|
4.
|
Mine
Safety Disclosures
|
17
|
|
PART II
|
||
|
5.
|
Market
for Registrant’s Common Equity, Related Shareholder Matters
and Issuer Purchases of Equity Securities
|
18
|
|
6.
|
Selected Financial
Data
|
18
|
|
7.
|
Management’s
Discussion and Analysis of Financial Condition and Results of
Operations
|
19
|
|
7A.
|
Quantitative and
Qualitative Disclosures About Market Risk
|
35
|
|
8.
|
Financial
Statements and Supplementary Data
|
35
|
|
9.
|
Changes
in and Disagreements with Accountants on Accounting and Financial
Disclosure
|
35
|
|
9A.
|
Controls and
Procedures
|
35
|
|
9B.
|
Other
Information
|
36
|
|
PART III
|
||
|
10.
|
Directors,
Executive Officers and Corporate Governance
|
37
|
|
11.
|
Executive
Compensation
|
40
|
|
12.
|
Security Ownership
of Certain Beneficial Owners and Management and Related Shareholder
Matters
|
44
|
|
13.
|
Certain
Relationships and Related Transactions, and Director
Independence
|
46
|
|
14.
|
Principal
Accounting Fees and Services
|
46
|
|
PART IV
|
||
|
15.
|
Exhibits, Financial
Statement Schedules
|
47
|
|
|
||
|
Signatures
|
48
|
|
|
|
|
|
|
Exhibit
Index
|
49
|
|
|
|
|
|
|
Financial
Statements
|
F-1
|
|
FORWARD-LOOKING STATEMENTS
This
Annual Report on Form 10-K contains certain forward-looking
statements within the meaning of Section 27A of the Securities Act
of 1933, as amended (the “Securities Act”), and Section
21E of the Securities Exchange Act of 1934, as amended (the
“Exchange Act”), and we intend that such
forward-looking statements be subject to the safe harbors created
thereby. For this purpose, any statements contained in this Annual
Report on Form 10-K, except for historical information, may be
deemed to be forward-looking statements. You can generally identify
forward-looking statements as statements containing the words
“will,” “would,” “believe,”
“expect,” “estimate,”
“anticipate,” “intend,”
“estimate,” “assume,” “can,”
“could,” “plan,” “predict,”
“should” or the negative or other variations thereof or
comparable terminology are intended to identify forward-looking
statements. In addition, any statements that refer to projections
of our future financial performance, trends in our businesses, or
other characterizations of future events or circumstances are
forward-looking statements.
The
forward-looking statements included herein are based on current
expectations of our management based on available information and
involve a number of risks and uncertainties, all of which are
difficult or impossible to predict accurately and many of which are
beyond our control. As such, our actual results could differ
materially and adversely from those expressed in any
forward-looking statements as a result of various factors, some of
which are listed under the section “Risk Factors,”
Item 1A of this Annual Report on Form 10-K. Readers should
carefully review these risks, as well as the additional risks
described in other documents we file from time to time with the
Securities and Exchange Commission. In light of the significant
risks and uncertainties inherent in the forward-looking information
included herein, the inclusion of such information should not be
regarded as a representation by us or any other person that such
results will be achieved, and readers are cautioned not to place
undue reliance on such forward-looking information. Except as
required by law, we undertake no obligation to revise the
forward-looking statements contained herein to reflect events or
circumstances after the date hereof or to reflect the occurrence of
unanticipated events.
PART I
Item 1.
BUSINESS
Overview
TOMI
Environmental Solutions, Inc., a Florida corporation
(“TOMI”, the “Company”, “we”,
“our” and “us”) is a global provider of
disinfection and decontamination essentials through its premier
Binary Ionization Technology®
(“BIT™)” platform,
under which it manufactures, licenses, services and sells its
SteraMist®
brand of products, including SteraMist®
BIT™,
a hydrogen peroxide-based mist and fog.
Invented under a defense grant in association with
the Defense Advanced Research Projects Agency (DARPA) of the U.S.
Department of Defense, BIT™ is
registered with the U.S. Environmental Protection Agency
(“EPA”) and uses a low
percentage hydrogen peroxide as its only active ingredient to
produce a fog composed mostly of a hydroxyl radical
(.OH
ion), known as ionized Hydrogen Peroxide
(“iHP™”).
Represented by the SteraMist® brand
of products, iHP™
produces a germ-killing aerosol that
works like a visual non-caustic gas.
TOMI introduced
SteraMist® to the commercial market in June 2013.
In June 2015, we successfully registered
SteraMist® BIT™
as a hospital-healthcare
disinfectant for use as a misting/fogging agent, at which time it
became the first EPA-registered hospital-healthcare and general
disinfectant registered solution and technology disinfection system
on the market.
TOMI’s
products are designed to service a broad spectrum of commercial
structures, including, but not limited to, hospitals and medical
facilities, bio-safety labs, pharmaceutical facilities, meat and
produce processing facilities, universities and research
facilities, vivarium labs, all service industries including cruise
ships, office buildings, hotel and motel rooms, schools,
restaurants, military barracks, police and fire departments, and
athletic facilities. TOMI products are also used in
single-family homes and multi-unit residences.
TOMI’s
mission is to help its customers create a healthier world through
its product line in its divisions (Healthcare, Life Sciences, TOMI
Service Network and Food Safety).
1
Our Technology
BIT™ was developed
in response to Amerithrax, the weaponized anthrax spore attacks
that occurred in Washington, D.C. shortly after the September 11,
2001 U.S. terrorist attacks. BIT™ is a patented
process that aerosolizes and activates a low concentration hydrogen
peroxide solution, producing a fine aqueous mist (0.3-3 um in
diameter) that contains a high concentration of Reactive Oxidative
Species (“ROS”), mostly hydroxyl radicals
(“.OH”). ROS cause
damage to pathogenic and resistant organisms, such as bacteria,
bacteria spores, viruses, mold spores, other fungi and yeast, via
oxidation of proteins carbohydrates, lipids and rendering the
building blocks of nature- amino acids, DNA and RNA inactive -
leading to cellular death, disruption and/or
dysfunction.
Testing
detailed by the Defense Advanced Research Projects Agency (DARPA)
of the U.S. Department of Defense demonstrates these hydroxyl
radicals, aggressively break the double bonds and other bonds in
bacterial spores, biological and chemical warfare agents and
neutralize their threat while producing nontoxic by-products. The
unique alteration of the chemistry of our solution occurs after our
EPA-registered solution passes through an atmospheric cold plasma
arc, which causes the breaking of the double bond of a hydrogen
peroxide molecule, the net result - our .OH
hydroxyl radical. This hydroxyl radical is known as iHP™. This patented
process allows these hydroxyl radicals to exist in high
concentrations without rapidly recombining and losing their
reactivity, while seeking to attach with any and all surfaces
within the proximity of TOMI’s mist.
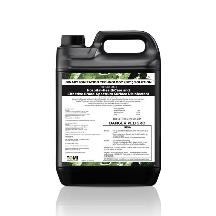
The
sole active ingredient of BIT™ is a low
percentage (7.8%) Hydrogen Peroxide and is represented by the
TOMI™
SteraMist®
brand of products. Our technology produces a germ-killing aerosol
that moves throughout a space like a gas. Our technology is able to
efficiently and effectively kill pathogenic and resistant organisms
in the air and on the surfaces without damaging delicate equipment or computers, and the only
by-product is oxygen and water in the form of humidity.
SteraMist®
is designed to be easily incorporated into any industry’s
current cleaning procedures; is economical, non-corrosive and easy
to apply; leaves behind no residues; and requires no manual
wiping.
Under the
Federal Insecticide, Fungicide, and Rodenticide Act (“FIFRA”), we are required to register
with the EPA and certain state regulatory authorities as a seller
of disinfectants. In June 2015, SteraMist®
BIT™
was registered with the EPA as a
hospital-healthcare disinfectant and general broad-spectrum surface
disinfectant for use as a misting/fogging agent.
SteraMist®
BIT™ now
holds EPA registrations (# 90150-2) for mold control, and air and
surface remediation (# 90150-1). In February 2016, we expanded our
label with the EPA to include C. diff”) spores and MRSA, as well as the
influenza virus h1n1, which
we believe has better positioned us to
penetrate all industries including the bio-defense and healthcare
industry. In August 2017, our EPA label was further expanded
to include efficacy against Salmonella and Norovirus. As of January
27, 2017, our technology is one of 53 of the EPA’s
“Registered Antimicrobial Products Effective against
Clostridium difficile
Spores”, as published on the EPA’s K List. Further, in December 2017,
SteraMist®
was included in the EPA’s list G (Norovirus), L (Ebola) and M
(Avian Flu). Currently, our EPA-registered label is in
all fifty (50) U.S. states as
well as many other countries.
SteraMist®
is being used throughout the world and has been demonstrated to
reduce certain problem organisms, such as bacterial spores,
Vancomycin-resistant Enterococcus (“VRE”), C.
diff, Middle East
Respiratory Syndrome (“MERS”) and Ebola Virus Disease
(“Ebola”). In U.S. hospitals where
SteraMist®
is being used for terminal cleaning, evidence has demonstrated a
reduction of C. diff spore
rates. SteraMist®
has reduced outbreaks of nosocomial MDRO’s (Klebsiella
pneumoniae, AB, pseudomonas
aeruginosa) at large
hospital to small clinics and has contributed to the control of
MERS and Ebola throughout the world.
Our
technology passed a sanctioned test showing six-log reduction
against Geobacillus stearothermophilus. Geobacillus
stearothermophilus
is the laboratory testing gold
standard and is commonly used as a challenge organism for
sterilization validation studies and periodic check of
sterilization cycles. In May 2015, the United States Agency
for International Development (USAID) awarded us a grant in the
amount of $559,000 for the development of SteraMist® Mobile
Decontamination Chambers to fight Ebola. In May 2016, upon the
decontamination and decommissioning of an Ebola treatment center in
West Africa, we fully achieved the milestones upon which the grant
was conditioned. Additionally, BIT™ has also been
shown to effectively decontaminate weaponized biological agents,
including weaponized anthrax, chemical agents such as VX (an
extremely toxic organophosphate) and sulfur mustard (otherwise
known as mustard gas) when applied using properly developed
international protocols.
All our
SteraMist® products are fully validated to
comply with good manufacturing practice standards, have received
Conformité Européene (“CE”) marks in the
European Economic Area (“EEA”) and are approved by Underwriters Laboratory
(“UL”). Our solution is manufactured at an
EPA-registered solution blender and our product performance is
supported by good laboratory practice efficacy data for
Staphylococcus aureus,
Pseudomonas aeruginosa,
Salmonella, Norovirus, mold spores, MRSA, h1n1, Geobacillus
stearothermophilus and C.
diff spores.
2
Our Products and Services
SteraMist®
Surface
Unit
|
Our SteraMist®
Surface Unit is a fully portable,
handheld, point and spray disinfection/decontamination system
intended to provide quick turnover of any affected space. The
single applicator unit enables disinfection of all surfaces,
including high touch, sensitive equipment and electronics. An
application time of only five seconds per square foot and
seven-minute contact time allows for safe re-entering of the space
within minutes after applying the iHP™ mist.
Our
SteraMist®
Surface Unit is lightweight, easy to transport and capable of
achieving reliable disinfection/decontamination results, as it is
easily incorporated into existing cleaning procedures and
protocols. It can be used as a standalone hospital terminal clean
product or as an adjunct to ultraviolet disinfection and is a
perfect solution to exit and entry barrier points of a facility.
The SteraMist®
Surface Unit does not require heating, ventilation or air
conditioning systems to be shut down. Further, its touchless
application (no wipe, no rinse) reduces risk of cross-contamination
between treated surfaces.
|
 |
|
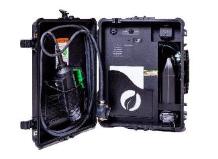
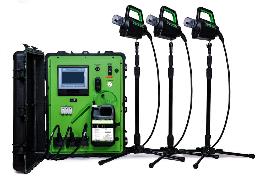
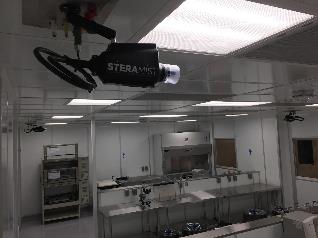
SteraMist Environment
System
Our
SteraMist®
Environment System is a transportable, remotely controlled
(robotic) system that provides complete room
disinfection/decontamination of a sealed space up to 103.8
m3 (3,663
ft3) in
just over 75 minutes (application, contact, and aeration time).
Individually, each remote applicator can be used to treat a space
of approximately 34.6 m3 (1,221
ft3).
Injection times are based on individual room size and number of
applicators. Multiple SteraMist®
Environment Systems can be used simultaneously to accommodate
larger or multiple spaces with fast application and minimal down
time. Our hybrid technology applicators can be used in both manual
and/or fogging modes.
Our
SteraMist®
Environment System features additional programmable and printable
features in PDF format. Other key features include lot # of
BIT™
Solution, location identifier, injection/dwell/aeration times, and
error notifications.
|
 |
3
|
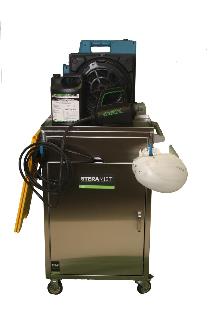
The
SteraMist®
Hospital Disinfection
Cart
The Hospital Cart
was designed by request of multiple public healthcare facilities
EVS (Environmental Service) teams using our equipment for the
SHIELD study that TOMI is participating in. The cart houses our
Surface Unit, a portable H2O2 monitor, Carbon
Air Scrubber, MaxAir Helmet Respiratory Protection System with
positive pressure air flow, storage hooks, and a sign notifying the
room is being treated. Included with the Cart is a custom ICU 45-55
minute terminal cleaning protocol.
|
 |
|
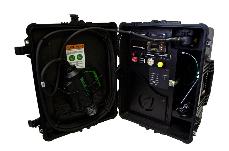
SteraMist®
Select Surface
Unit
Our Select Unit was
designed to meet the needs of our customers who have smaller
enclosures in need of decontamination. This unit is lightweight and
easy to transport with the added ability to function between a
lower flow operation and standard operation, such as the
SteraMist®
Surface Unit. The user can adjust air flow, adjust pump fluid flow,
set the programmable timer for automatic runs, modify spray/dwell
times and number of cycles, and is equipped with start and stop
buttons.
|
 |
|
Stainless Steel 90 Degree Applicator
TOMI’s
standard applicator was converted to a 90 degree and manufactured
using 316 stainless steel, the ideal applicator to accompany the
Select Surface Unit, affording many 90-degree build-in
opportunities. This applicator can be purchased with a flange for
ease of installation either permanently or
semi-permanently.
|
 |
4
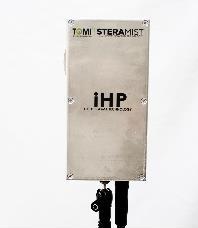
SteraMist®
Permanent
iHP™
Complete Disinfection
Room
The SteraMist®
Permanent iHP™
Disinfection Room is an automated
system that is plumbed utilizing the facilities’ existing
HVAC system. This involves permanently installing
SteraMist®
applicators within the designated
space to achieve maximum results. The generator and Programmable
Logic Control (“PLC)” are housed in a National
Electrical Manufacturers Association (“NEMA)” enclosure in a central remote
location. The entire system can be developed for multiple rooms and
various specifications, controlled remotely through the NEMA
interface. The status of the decontamination cycle is monitored
with indicators and can be integrated into a Supervisory Control
and Data Acquisition (“SCADA)” monitoring
board.
 |
 |
|
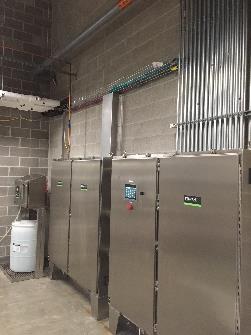
iHP™
Plasma Decontamination
Chamber
With prior written
approval our patented cold plasma technology can be integrated with
a chamber or cage washer by leading manufacturers. Current examples
are Lynx, BetterBuilt and Allentown. The photo demonstrates our
iHP™
Decontamination Chamber built into a lab at the University of
Houston. Our custom generator/chamber is built into a
stainless-steel single door panel and is permanently mounted next
to the chamber or washer, while a SteraMist®
applicator is permanently or semi-permanently mounted in the
enclosure. This SteraMist®
product line includes but is not limited to an internally mounted
air compressor, regulator for air pressure adjustment, E-stop
button, lever power switch, data logging functions, and multiple
dry contract outputs determined by the needs of the
customer.
|
 |
5
|
iHP™
Service
Decontamination
TOMI offers full
room, equipment, facility, and emergency
disinfection/decontamination services. Our goal is to reduce
bioburden and eliminate the potential for costly microbial
contamination preventing laboratory outbreaks. If a lab is dealing
with a current outbreak TOMI’s iHP™
service will contain and prevent future outbreaks. Single and
routine services are provided to TOMI customers to coincide with
maintenance, mandatory facility shutdowns, or to control a specific
threat.
●
The SteraMist®
systems are versatile and easy to
maintain with relatively low upkeep. In fact, preventive
maintenance is not required to be performed by a service engineer
and remote guidance can be provided upon
request.
|
 |
Industries & Market Segments
We
believe that our technology, service, and product offerings provide
a significant opportunity to help reduce the spread of Community
Associated and Healthcare-Acquired Infections
(“HAI’s”).
SteraMist®
and TOMI’s related service platforms are currently being used
in a broad spectrum of industries, including but not limited
to:
● Pharmaceutical
companies
● Clean
rooms
● Hospitals &
medical facilities
● Ambulances
● Bio-safety
labs
● Tissue
labs
● Vivariums &
Research Universities
● Military &
Government Agencies
● Office
buildings
● Hospitality
● Schools
● Transportation
● Athletic
facilities
● Single-family homes
and multi-unit residences
● Patient Medical
Transport Airline
● Cruise
Ships
● Entertainment
establishments
6
Life Sciences. Our
SteraMist® line of
products is a decontamination solution to use sites in this
industry, specifically pharmaceutical (compounding and
manufacturing), vivariums, research universities, BSLs of any
level, BSC’s, chambers, isolators, cage washers, and
cleanrooms. With proper implementation SteraMist® can reduce the
risk of infectious as well as potentially infectious agents and/or
materials, facilities such as these handle on a routine
basis.
There
are many requirements and restrictions on the type of
decontamination agents our Life Sciences customers may use to
prevent these risks and remediate adverse incidents. In light of
these regulations, our rapid deployment of our effective ionized
hydrogen peroxide aerosolized mist is the solution to lower risks,
reduce damage to expensive laboratory equipment and furniture,
eliminate other labor intense procedures, and perform
decontamination clean-up in these spaces quickly, less caustically,
requiring no wipe and with no residue.
Our
team of technicians and representatives train, maintain, and
troubleshoot capital equipment globally for our Life Sciences
customers. Further, our iHP™ service
decontamination team provides routine, emergency, and/or
commissioning or decommissioning of facilities equipment or full
complete space decontamination for our customer base.
Hospital-HealthCare.
Our SteraMist® line of
products, specifically the SteraMist® Surface Unit
and SteraMist®
Disinfection Cart are solutions to aid our Hospital-HealthCare
customers in providing the quality of care and safety they provide
to their patients by disinfecting patient and operating rooms,
pharmacies, ambulances, and emergency environments in a hospital or
healthcare facility. Our team of technicians and representatives
train, maintain, and troubleshoot capital equipment throughout the
world for our Hospital-HealthCare customers.
We
continue to penetrate the
hospital-healthcare market segment, and under the United States
Patient Protection and Affordable Care Act’s (also known as
the Affordable Care Act or ACA) Hospital Readmissions Reduction
Program, hospitals that have high rates of infections and HAIs are
facing significant financial penalties. Our SteraMist® BIT™ technology has
proven to reduce the transference spread of infections leading to
an overall reduction in the number of patients being infected as a
result of the prior poor manual cleaning of these patient rooms,
infectious disease rooms and operatory suites, with a corresponding
return on investment to the hospital of up to 20-to-1 in the first
year. At this time, we cannot predict the effect of any potential
healthcare reform legislation, including the potential repeal of
the Patient Protection and Affordable Care Act, on such
penalties.
The TOMI Service
Network. The TSN, has allowed
us to enhance our corporate service division by creating a
multi-nation-wide network composed of existing, full-service
specialists. Since the launch of TSN, we have added over one
hundred and three (103) service
partner companies across the United States and Canada. These are
professional first responders that specialize within the mold
remediation, hurricane and tornado response and other mitigation
fields, biohazard specialists including forensic restoration
specialists. These servicing specialists focus their businesses in
the commercial and residential space. Our team of TSN
Business Managers and SteraMist® technicians
train, maintain and troubleshoot capital equipment for these
individuals with the goal of implementing servicing procedures and
protocols throughout the United States and Canada for our TSN
network partners.
In September 2018, we partnered with the
Global BioRisk Advisory Council (“GBAC”) to use
SteraMist® as
one of the training technologies used in their certification
classes. This also allows for the decontamination of everyday
crises as well as forensic restoration and bio-hazard scenes as
needed. TOMI also launched the Forensic Restoration Service Team
(or “FRST”), a U.S. based TOMI-certified forensic
restoration and crime clean network. This network is comprised of
service providers who specialize in forensic restoration such as
mass casualty, crime scene, suicide and unattended death cleanup.
Also included within this field are hoarding and bio-recovery
services. Participating FRST members will receive specialized
training and certifications by GBAC. We have four (4) certified
FRST members
to date.
Food Safety
Industry. SteraMist®
is an effective decontaminant in the food safety industry.
According to the CDC, 80 million people per year in the United
States contract, and 5,000 people die from, food poisoning or other
food-related illnesses. Current food safety cleaning techniques
involve time intensive processes, which can reduce food
manufacturers’ profit. Our iHP™ degrades into
only harmless water and oxygen. After we obtain approval by the
United States Food and Drug Administration (the “FDA”)
and the United States Department of Agriculture (the
“USDA”), we anticipate that our solution can be applied
directly to all foods. Currently we use SteraMist®
on all food packing and storage equipment as SteraMist® is safe for use
on electronics and kitchenware, along with high touch surfaces
where most pathogens are found (such as phones, computers and
kitchen appliances). We believe that SteraMist® could be useful
for decontamination at all phases of food production, from the
farm, slaughterhouse, packaging and canning facilities,
food storage locations to the transportation of food and to the
restaurants and grocery stores.
7
Medical
Cannabis. TOMI
is looking to enter the global medical and recreational cannabis
market. Currently we are researching how the BIT™ Solution and the iHP™
process can be used to rid the
cannabis plant of the following:
-
Powdery Mildew (odium, white mold)
-
Spider Mites, Thrips, Root Aphids & Fungus
Gnats
-
Bud Rot (Botrytis cinerea)
- Load counts on coliform, microbes,
bacteria, e. coli and other molds.
-
Direct plant application, soil application and whole room
application
-
Residuals left on the plant
All
tests will also include whether or not the process affects the THC
and Cannabinoid levels of the plant.
SteraMist®
can be used in cannabis facilities
globally upping the industry standard of disinfecting areas between
grows- for example, the cannabis drying/curing/cloning/grow rooms,
manufacturing/packaging areas, on-site laboratories, storage rooms,
and employee restrooms and locker rooms.
Homeland Defense and Border
Protection. Countries around the world, including the United
States, need to protect their borders and cities against a
potential terrorist attack. Our SteraMist® line of
products will give governmental bodies an added tool in their
arsenal to mitigate the risk of a weaponized biological attack. In
addition, SteraMist® could assist in
mitigating the spread of emerging pandemic viruses, including
strains of Ebola, MERS, MLAV (filovirus), h1n1, h5n1, h7n9 and
h10n8. Our SteraMist® line of
products may assist border patrol agents in controlling the spread
of infectious disease introduced by foreign individuals by
decontaminating interview rooms, containment rooms, holding cells
and quarantine areas after a potential infected carrier’s
condition either improves or the carrier dies.
INFORMATION WITH RESPECT TO OUR BUSINESS IN GENERAL
Manufacturing
We
outsource the manufacturing and blending of our
SteraMist® line of
equipment and BIT™ Solution. Our
SteraMist® equipment
manufacturer is an ISO9001 registered company with facilities in
Pennsylvania, New York and New Jersey.
Our
solution is blended by an EPA approved blender; our blend includes
as the only active ingredient 7.8% Hydrogen Peroxide.
TOMI
maintains sole source distribution of all the SteraMist® product lines,
including our BIT™ Solution.
Neither our manufacturer or chemical blender may make modifications
to the manufacturing or blending of our products without our
request or consent in written format. TOMI maintains all creative
control throughout the design and manufacturing process, which
includes research & development through final product
fabrication.
Intellectual Property
Our success depends in part upon our ability to obtain and maintain
proprietary protection for our products and technologies. We
protect our technology and products by, among other means,
obtaining United States and foreign patents. There can be no
assurance, however, that any patent will provide adequate
protection for the technology, system, product, service or process
it covers. In addition, the process of obtaining and protecting
patents can be long and expensive. We also rely upon trade secrets,
technical know-how, and continuing technological innovation to
develop and maintain our competitive position.
As part of our intellectual property protection
strategy, we have registered our BIT™
solution with the Environmental
Protection Agency (“EPA”), all fifty (50) states in the
United States, and multiple countries worldwide. We have
received Conformité Européene (“CE”) marks in
the European Economic Area (“EEA”) and are approved by Underwriters Laboratory
(“UL”).
Our portfolio includes a total of twenty (20)
Utility Patents for both method and system claim on
SteraMist ®BIT™,
either published or waiting for acceptance. Most recently, we were
awarded and published a new Utility patent giving us protection of
our technology until the year 2038. And in February 2020, we were
awarded a continuation application for the systems patent published
– disclosing yet further additional claims on
SteraMist®
BIT™ and its capabilities. In 2019, we filed a PCT
international application for device and method decontamination
which passed on all claims approved in the United States on the
latest published patents. Further in 2019, we submitted utility
patents in other multiple countries which are all in the national
stage for review. Once these are received, we will hold
international acceptance for the inherited patents and our newly
received patents.
We
have filed and have been granted or have pending acceptance on
thirty-two (32) separate design patents for our: Decontamination
Chamber(s), Decontamination Applicator, Decontamination Cart,
Applicator, and Surface Mounted Applicator 90 Degree Device. These
patents are published around the world, including but not limited
to United States, China, Hong Kong, Europe, United Kingdom,
Singapore, Taiwan, Vietnam, Canada, South Korea, and
Japan.
8
Our products
are sold around the world under various brand names and trademarks.
We consider our brand names and trademarks to be valuable in the
marketing of our products. As of December 31, 2019, we held a total
of eighty-five (85) trademarks (word and logo) registered or
pending across the globe. TOMI registers marks in seven (7) classes
of specification of goods and services: Class
1 for Chemicals for Treating Hazardous Waste, Class 5 for
Disinfectants, All-Purpose for Hard Surfaces and for Treating Mold,
Class 7 for Handheld Power Operated Spraying Machines, Class 11 for
Sterilizers for Medical Use and Air Purification, Class 35 for
Business Consultation and Management Services, Class 37 for General
Disinfecting Services, and Class 40 for Chemical Decontamination
and Manufacturing Services.
Marketing and Distribution
Through
our brand awareness, marketing, social media presence and sales,
our business growth objective is to be a global leader in
disinfection and decontamination products, services, and
manufacturing. We intend to continue to expand and support research
and development on other decontamination and remediation solutions
(including hydroxyl radicals and other ROS), and to form more
business alliances with strategic partners.
We
continue to perform decontamination services within cleanrooms,
bio-safety labs, tissue and blood labs, pharmaceutical labs,
vivariums and research universities and we continue to secure
additional license agreements with major remediation, construction
and bio-safety servicing companies. Both of these strategies assist
in the brand awareness and use of our suite of
products.
We sell
our products domestically through our internal sales force, as well
as independent sales and manufacturing representatives.
Internationally, our products are sold through exclusive and
non-exclusive sales representatives and distributors. We have
shipped our equipment and solution into twenty-two (22) countries
worldwide.
Competition
The
decontamination and environmental infectious disease control
industry is extremely competitive and highly regulated. Competition
is intense in all four (4) of our divisions and includes many large
and small competitors.
Our
competitors include companies that market other hydrogen
peroxide-based products, such as Steris Corporation
(“Steris”), Bioquell, Inc. (“Bioquell”)
currently owned by Ecolab, Inc. (“Ecolab”) and The
Clorox Company (“Clorox”), various ultraviolet
companies and quad ammonia-chemical companies. We believe our SteraMist®
suite of products have a competitive
advantage in that they have a quicker and less caustic kill time,
provide a six log kill to a wide variety of pathogens and
leave no residue or unpleasant odor.
However, these competitors may have longer operating
histories, greater name recognition, larger installed customer
bases and substantially greater financial and marketing resources
than us.
We
believe that the principal factors affecting competition in our
markets include name recognition and the ability to receive
referrals based on client confidence in the service. There are no
significant barriers of entry that could keep potential competitors
from opening similar facilities. Our ability to compete
successfully in the industry will depend, in large part, upon our
ability to market and sell our indoor decontamination and
infectious disease control products and services. There can be no
assurance that we will be able to compete successfully in this
industry, or that future competition will not have a material
adverse effect on our business, operating results and financial
condition.
We
believe that our growth in these industries as a leading global
disinfection/decontamination company depends on our abilities to
discover, develop, market, and innovate, disruptive cost-effective
products and services.
9
Competitive Advantages
We
believe the SteraMist® technology has
many advantages over its competition. Our technology can turn over
a space to an end-user far faster than its competition. Our
technology requires limited preparation to an area compared to our
competitors and does not rely on fans to move throughout a space.
Our “.OH” is a small
0.3-3-micron particle that receives a charge and can move around an
area like a gas, going above, below, and beyond the hardest to
reach areas.
SteraMist®
offers the following competitive advantages:
●
Provides a 99.9999%
or six-log kill and above kill (i.e. the statistical destruction of
all microorganisms and their spores) on all challenged pathogens,
on multiple surfaces including Bacillus atrophaeus spores,
Bacillus subtilis spores
and Geobacillus
stearothermophilus, the spore that is considered a gold
standard for validation of sterilization versus
household/industrial cleaners that offer a 99.9% (sanitizing) or
three-log, kill to 99.99%,(disinfection) or four-log,
kill.
●
Easy to
use.
●
Does not require
mixing of materials
●
No
Touch
●
No Wipe, No
Rinse
●
Does not include
silver ions or peracetic acid.
●
Leaves no
residue.
●
Not affected by
humidity or temperature.
●
Non-corrosive.
●
Does not damage
medical or electronic equipment.
●
By-products
converts to humidity.
Research & Development
We are
generating and supporting research on improving, extending and
applying our patents in the field of mechanical cleaning and
decontamination. Research and development expenses for the years
ended December 31, 2019 and 2018, were approximately $341,000 and
$916,000, respectively.
Government Regulation
Our
business is subject to various degrees of governmental regulation
in the countries in which we operate. In the United States, the
EPA, the FDA and other governmental authorities regulate the
development, manufacture, sale, and distribution of our products
and services. Our international operations also are subject to a
significant amount of government regulation, including
country-specific rules and regulations and U.S. regulations
applicable to our international operations. Government regulations
include detailed inspection of, and controls over, research and
development, product approvals and manufacturing, marketing and
promotion, sampling, distribution, record-keeping, storage, and
disposal practices. We believe that we are currently compliant in
all material respects with applicable regulatory
requirements.
Employees
As of
March 20, 2020, we have twenty-one (21) full-time executive,
operational and administrative employees working within the United
States. Most of our sales are conducted by global exclusive
distribution agreements or domestically by independent
manufacturing representatives.
10
Item 1A. RISK FACTORS.
Our business routinely encounters and attempts
to address risks, some of which will cause our future results to
differ, sometimes materially, from those originally anticipated.
Below, we have described our present view of certain important
risks. The risk factors set forth below are not the only risks that
we may face or that could adversely affect us. If any of the risks
discussed in this Annual Report on Form 10-K actually occur, our
business, financial condition and results of operations could be
materially adversely affected. If this were to occur, the trading
price of our securities could decline significantly.
In assessing these risks,
investors should also refer to the other information contained or
incorporated by reference in our other filings with the
SEC.
Risk Related to Our Company and Business
We have experienced losses historically, may be required to obtain
additional financing and may never achieve and sustain
profitability.
We
incurred net losses of approximately $2.3 million and $3.2 million
for the years ended December 31, 2019 and 2018, respectively. We
may continue to incur net losses for the foreseeable future as we
continue to develop our products and seek customers and
distribution for our products. Even if we achieve profitability, we
may be unable to sustain or increase profitability on a quarterly
or annual basis. Further,
to finance our product development and grow our business, we may
seek funds through borrowings or through additional rounds of
financing, including private or public equity or debt offerings. We
may be unable to raise funds on commercially reasonable terms or at
all. In addition, the sale of additional equity or convertible debt
securities could result in additional dilution to our shareholders.
If we borrow additional funds or issue debt securities, these
securities could have rights superior to holders of our common
stock and could contain covenants that will restrict our
operations. If we do not obtain additional resources or achieve and
sustain profitability, our ability to capitalize on business
opportunities will be limited, the growth of our business will be
harmed, our business may fail, and investors may lose all of their
investment.
Our operations are subject to environmental laws and regulations
that may increase costs of operations and impact or limit our
business plans.
We are subject to environmental laws and regulations affecting
many aspects of our present and potential future operations,
including a wide variety of EPA labeling and other state regulatory
agency requirements. Compliance with these laws and regulations may
result in increased costs and delays as a result of administrative
proceedings and certain reporting obligations. Public officials and
entities may seek injunctive relief or other remedies to enforce
applicable environmental laws and regulations. We cannot predict
the outcome of any administrative proceedings that may
arise.
Business interruptions resulting from the COVID-19 outbreak or
similar public health crises could cause a disruption of the
manufacturing of our products and adversely impact our
business.
Public
health crises such as pandemics or similar outbreaks could
adversely impact our business. In December 2019, a novel strain of
a virus named SARS-CoV-2 (severe acute respiratory syndrome
coronavirus 2), or coronavirus, which causes coronavirus disease,
or COVID-19, was reported to have surfaced in Wuhan, China, and has
reached multiple other regions and countries, including the United
States and more specifically, Beverly Hills, California, where our
primary office is located. The coronavirus pandemic is evolving,
and to date has led to the implementation of various responses,
including government-imposed quarantines, travel restrictions and
other public health safety measures. Global health concerns, such
as coronavirus, could result in social, economic and labor
instability in the countries in which we or the third parties with
whom we engage operate. The extent to which the coronavirus impacts
our operations or those of our third party partners will depend on
future developments, which are highly uncertain and cannot be
predicted with confidence, including the duration of the outbreak,
new information that may emerge concerning the severity of the
coronavirus and the actions to contain the coronavirus or treat its
impact, among others. We cannot presently predict the scope and
severity of any potential business shutdowns or disruptions, but if
we or any of the third parties with whom we engage, including the
suppliers, customers and other third parties with whom we conduct
business, were to experience shutdowns or other business
disruptions, our ability to conduct our business in the manner
presently planned could be materially and negatively impacted. The
future progression of the COVID-19 outbreak and its resulting
effects on our business, financial condition and results of
operations are uncertain and are continuing to be
assessed.
11
We are subject to risks related to our international operations and
failure to manage these risks may adversely affect our operating
results and financial condition.
A
portion of our sales are made to customers outside the United
States. As such, we may be denied access to our customers as a
result of a closing of the borders of the countries in which we
sell our products due to economic, legislative, political and
military conditions in such countries.
International
operations are subject to a number of other inherent risks, and our
future results could be adversely affected by a number of factors,
including:
●
unfavorable
political or economic environments;
●
requirements or
preferences for domestic products or solutions, which could reduce
demand for our products;
●
differing existing
or future regulatory and certification requirements;
●
unexpected legal or
regulatory changes;
●
greater difficulty
in collecting accounts receivable and longer collection
periods;
●
difficulties in
enforcing contracts;
●
an inability to
effectively protect intellectual property;
●
natural
disasters, political and economic instability, including wars,
terrorism and political unrest, outbreak of disease, travel, social
distancing and quarantine policies, boycotts, curtailment of trade,
and other business restrictions affecting our ability to
manufacture or sell or products;
●
tariffs
and trade barriers, export regulations and other regulatory and
contractual limitations on our ability to sell our products;
and
●
potentially adverse
tax consequences, including multiple and possibly overlapping tax
structures.
If we
are unable to manage the risks inherent in our international
activities, our ability to obtain future revenues may suffer and,
consequently, our business, financial condition and results of
operations could be materially and adversely affected.
Our success depends upon third party contractors, suppliers and
manufacturers, the disruption of which could negatively impact our
business.
We rely
upon third parties to supply us with components for our products.
We outsource the manufacturing of our SteraMist®
line of equipment to a manufacturing company and use contract
manufacturers to build our BIT™-based systems,
as we do not maintain our own manufacturing facilities. If we fail
to maintain relationships with our current suppliers, we may not be
able to effectively commercialize and market our products, which
would have a material and adverse effect on our business. Further,
any disruption in the manufacturing process could have a material
adverse effect on our business, financial condition and results of
operations. We cannot ensure that alternative production capacity
would be available in the event of a disruption, or if it would be
available, it could be obtained on favorable terms.
Significant
outbreaks of contagious diseases such as COVID-19, and other
adverse public health developments, could have a material impact on
our business, financial condition and results of operations. As of
March 2020, the outbreak of COVID-19 has led to numerous confirmed
cases worldwide, including in the Unites States. In addition to
those who have been directly affected, millions more have been
affected by governmental effortsaround the world to slow the spread
of the outbreak. Such measures have had, and are expected to
continue to have, a significant impact, both direct and indirect,
on businesses and commerce worldwide. Although we keep stock of all
our product components with long lead times to assist in the event
that our supply chain is disrupted, we cannot guarantee that such
measures will be sufficient to avoid a disruption to our production
capacity due to the current COVID-19 pandemic or similar events
that may occur in the future.
The introduction of new products is often accompanied by design and
production delays, as well as significant cost, which could prevent
us from introducing new products to the market in a timely and
cost-effective manner.
The
development and initial production and enhancement of the
decontamination systems we produce is often accompanied by design
and production delays and related costs. Often, we cannot predict
the time and expense required to overcome such problems. If we are
unable to introduce new products on our anticipated timeframe, our
business, financial condition and results of operations may
suffer.
12
Our success depends on our ability to adequately protect our
intellectual property.
In
April 2013, we acquired certain assets from L-3 Applied
Technologies, Inc. (“L-3”), including patents,
trademarks and trade secrets related to BIT™. Our
commercial success depends, in part, on our ability to obtain,
maintain, defend, file new or enforce our existing patents,
trademarks, trade secrets and other intellectual property rights
covering our technologies and products, including, in particular,
the intellectual property rights we acquired from L-3. We may,
however, be unable to adequately preserve such rights due to a
number of reasons, including the following:
●
our rights could be
invalidated, circumvented, challenged, breached or infringed
upon;
●
we may not have
sufficient resources to adequately prosecute or protect our
intellectual property rights;
●
upon expiration of
our patents, certain of our key technology may become widely
available; or
●
third parties may
be able to develop or obtain patents for similar or competing
technology.
Although we devote
resources to the establishment and protection of our patents and
trademarks, we cannot assure you that the actions we have taken or
will take in the future will be adequate to prevent violation of
our patents, trademarks and proprietary rights by others or prevent
others from seeking to block sales of our products as an alleged
violation of their patents, trademarks and proprietary rights. In
the future, litigation may be necessary to enforce our trademarks
or proprietary rights and we may be forced to defend ourselves
against claimed infringement or the rights of others. Any such
litigation could result in adverse determinations that could have a
material adverse effect on our business, financial condition or
results of operations.
We may be unable to enforce our intellectual property rights
throughout the world.
The
laws of some foreign countries do not protect intellectual property
rights to the same extent as the laws of the United States.
Companies have encountered significant problems in protecting and
defending intellectual property rights in certain foreign
jurisdictions. To the extent that we have obtained or are able to
obtain patents or other intellectual property rights in any foreign
jurisdictions, it may be difficult to stop the infringement of our
patents or the misappropriation of other intellectual property
rights. For example, some foreign countries have compulsory
licensing laws under which a patent owner must grant licenses to
third parties. In addition, some countries limit the availability
of certain types of patent rights and enforceability of patents
against third parties, including government agencies or government
contractors. In these countries, patents may provide only limited
benefit or no benefit.
Proceedings to
enforce our patent rights in foreign jurisdictions could result in
substantial costs and divert our efforts and attention from other
aspects of our business. Accordingly, efforts to protect our
intellectual property rights in such countries may be inadequate.
In addition, future changes in the law and legal decisions by
courts in the United States and foreign countries may affect our
ability to obtain adequate protection for our technology and
products and the enforcement of intellectual property.
We may not be able to manage our growth effectively, create
operating efficiencies or achieve or sustain
profitability.
The
ability to manage and operate our business as we execute our growth
strategy will require effective planning. Rapid growth could strain
our internal resources, which could lead to a lower quality of
customer service, reporting problems and delays in meeting
important deadlines, resulting in loss of market share and other
problems that could adversely affect our reputation and financial
performance. Our ability to manage future growth effectively will
also require us to continue to update and improve our operational,
financial and management controls and procedures. If we do not
manage our growth effectively, we could be faced with slower growth
and a failure to achieve or sustain profitability.
We face significant competition in our industry, which could
significantly limit our growth and materially and adversely affect
our financial results.
The
decontamination and environmental infectious disease control
industry is extremely competitive. The competition includes
remediators and disinfection/decontamination companies such as
Steris, Bioquell (Eco-lab) and Clorox, various ultraviolet
companies and quad ammonia-chemical companies. These competitors
may have longer operating histories, greater name recognition,
larger installed customer bases and substantially greater financial
and marketing resources than us. We believe that the principal
factors affecting competition in our markets include name
recognition and the ability to receive referrals based on client
confidence in the service. There are no significant barriers of
entry that could keep potential competitors from opening similar
facilities. Our ability to compete successfully in the industry
will depend, in large part, upon our ability to market and sell our
indoor decontamination and infectious disease control products and
services. There can be no assurance that we will be able to compete
successfully in the remediation industry, or that future
competition will not have a material adverse effect on our
business, operating results and financial condition.
13
Our success depends upon broad market acceptance of our technology
that has not yet been achieved.
Our BIT™ technology is relatively new, having received full
Hospital registration for C. diff spores from the EPA in mid-2017. Our sales are
dependent upon broad market acceptance of our technology that
replaces long-standing failing manual cleaning techniques such as
quaternary ammonium compounds and bleach for disinfection, with our
no-touch mechanical process. The failure to obtain broad market
acceptance inevitably leads to substantially increased lead times
for sales, until our prospective customers-particularly in the
hospital-healthcare market-are accustomed to the use of newer
mechanical technology. The inability to timely meet our sales goals
could adversely affect our financial condition and results of
operations.
We are dependent on our key personnel, the loss of whom could
adversely affect our operations, and if we fail to attract and
retain the talent required for our business, we could be materially
harmed.
Our
success is substantially dependent on the performance of our
executive officers, including our Chairman and Chief Executive
Officer, Dr. Halden S. Shane, the loss of whom would have a
material adverse effect on our business. Given our relatively
recent entry into the decontamination industry, we depend to a
significant degree on our ability to attract, retain and motivate
quality personnel.
Competition for
highly skilled personnel is often intense in the United States. We
may not be successful in attracting, integrating or retaining
qualified personnel to fulfill our current or future
needs.
Our operations, and those of our suppliers, are subject to a
variety of business continuity hazards and risks, any of which
could interrupt production or operations or otherwise adversely
affect our performance and results.
We are
subject to business continuity hazards and other risks, including
natural disasters, utility and other mechanical failures, labor
difficulties, inability to obtain necessary licenses, permits or
registrations, disruption of communications, data security and
preservation, disruption of supply or distribution, safety
regulation and labor difficulties. The
occurrence of any of these or other events might disrupt or shut
down operations, or otherwise adversely impact the production or
profitability of a particular facility, or our operations as a
whole. We may also be subject to certain liability claims in the
event of an injury or loss of life, or damage to property and
equipment, resulting from such events. Although we maintain
property and casualty insurance, as well as other forms of
insurance that we believe are customary for our industries, our
insurance policies include limits and, as such, our coverage may be
insufficient to protect against all potential hazards and risks
incident to our business. Should any such hazards or risks occur,
or should our insurance coverage be inadequate or unavailable, our
business, prospects, financial condition and results of operations
might be adversely affected.
Our products are subject to potential product liability claims
which, if successful, could have a material adverse effect on our
business, financial condition and results of
operations.
Certain
of our products may be hazardous if
not deployed properly. We are exposed to significant risks for
product liability claims if death, personal injury or property
damage results from the use of our products. While we currently
maintain insurance against product liability claims, we may
experience material product liability losses in the future. Our
insurance coverage may not continue to be available on terms that
we accept, if at all, and our insurance coverage also may not
adequately cover liabilities that we incur. A successful claim
against us that exceeds our insurance coverage level or that is not
covered by insurance, or any product recall, could have a material
adverse effect on our business, financial condition and results of
operations. In addition, product liability and other claims can
divert the attention of management and other personnel for
significant periods of time, regardless of the ultimate outcome.
Further, claims of this nature may cause our customers to lose
confidence in our products and us. As a result, an unsuccessful
defense of a product liability or other claim could have a material
adverse effect on our financial condition, results of operations
and cash flows.
The requirements of being a public company may strain our
resources, divert management’s attention and affect our
ability to attract and retain executive management and qualified
board members.
We have
and likely will continue to incur significant legal, accounting and
other expenses as a public company subject to the reporting
requirements of the Exchange Act, the Sarbanes-Oxley Act of 2002
(“SOX”), the Dodd–Frank Wall Street Reform and
Consumer Protection Act and other applicable rules and regulations.
Our management and other personnel devote a substantial amount of
time to these compliance initiatives. Moreover, these rules and
regulations have increased our legal and financial compliance costs
and will make some activities more time-consuming and costly. For
example, applicable rules and regulations could make it more
difficult for us to attract and retain qualified persons to serve
on our Board of Directors (the “Board”) or as executive
officers.
In
addition, SOX requires, among other things, that we maintain
effective internal control over financial reporting and disclosure
controls and procedures. Our testing, or the potential subsequent
testing by our independent registered public accounting firm in
future periods, may reveal deficiencies in our internal control
over financial reporting that are deemed to be material weaknesses.
Our compliance with Section 404 of SOX may require that we incur
substantial expense and expend significant management time on
compliance-related issues. Moreover, if our independent registered
public accounting firm identifies deficiencies in our internal
control over financial reporting that are deemed to be material
weaknesses, the market price of our stock could decline, and we
could be subject to sanctions or investigations by regulatory
authorities, which would require additional financial and
management resources.
As a
result of disclosure of information in this Annual Report on Form
10-K and in filings required of a public company, our business and
financial condition are more visible, which we believe may result
in threatened or actual litigation, including by competitors and
other third parties. If such claims are successful, our business
and operating results could be adversely affected. Even if the
claims do not result in litigation or are resolved in our favor,
these claims, and the time and resources necessary to resolve them,
could divert the resources of our management and adversely affect
our business and operating results.
14
Risk Related to Our Securities
Our stock price is volatile and there is a limited market for our
shares.
The
stock markets generally have experienced, and will probably
continue to experience, extreme price and volume fluctuations that
have affected the market price of the shares of many small-cap
companies. These fluctuations have often been unrelated to the
operating results of such companies. Factors that may affect the
volatility of our stock price include the following:
● our success, or
lack of success, in developing and marketing our products and
services;
●
changes in general economic, political and market conditions in or
any of the regions in which we conduct our business, including as a
result of the current COVID-19 outbreak and related governmental
responses;
● our ability to
raise the required capital to fund our business;
● the announcement of
new products, services, or technological innovations by us or our
competitors;
● changes in our
executive leadership;
● quarterly
fluctuations of our operating results;
● changes in revenue
or earnings; and
● competition.
Moreover,
we are listed on the marketplace OTCQB exchange under the symbol of
TOMZ. OTCQB replaced the Financial
Industry Regulatory Authority (FINRA)-operated OTC Bulletin Board
(OTCBB) as the main market for trading OTC
securities that report to a U.S. regulator.
OTCQB is a
trading platform, and trading of securities quoted on the OTCQB is
often more sporadic than the trading of securities listed on a
national securities exchange like The NASDAQ Stock Market or the
New York Stock Exchange. Even if we were to seek to list our
securities on a national securities exchange, there is no assurance
we will be able to do so, and if we do so, many of these same
forces and limitations may still impact our trading volumes and
market price in the near term. Additionally, the sale or attempted
sale of a large amount of common stock into the market may also
have a significant impact on the trading price of our common
stock.
We do not intend to pay dividends for the foreseeable
future.
We have not paid dividends on our common stock
since inception. The continued operation and expansion of
our business will require substantial funding. Accordingly, we
currently intend to retain earnings, if any, for use in the
business and we do not
anticipate that we will pay any cash dividends on shares of our common
stock for the foreseeable future. Any determination to pay
dividends in the future will be at the discretion of our Board and
will depend upon results of operations, financial condition,
contractual restrictions, restrictions imposed by applicable law
and other factors our Board deems relevant. Investors seeking cash
dividends should not purchase our common stock. Accordingly,
realization of a gain on your investment will depend on the
appreciation of the price of our common stock, which may never
occur.
15
Our common stock is subject to the “penny stock” rules
of the SEC, and trading in our securities is very limited, which
makes transactions in our common stock cumbersome and may reduce
the value of an investment in our securities.
The SEC has adopted regulations which generally
define a “penny stock” to be any equity security that
is not listed on a qualified national securities exchange and that
has a market price of less than $5.00 per share, or with an
exercise price of less than $5.00 per share, subject to certain
exceptions. Historically, shares of our common stock have traded on
the OTCQB at a price of less
than $5.00 per share and, as a result, our common stock is
considered a “penny stock” by the SEC and subject to
rules adopted by the SEC regulating broker-dealer practices in
connection with transactions in “penny stocks.” Our
securities are covered by the penny stock rules, which impose
additional sales practice requirements on broker-dealers who sell
to persons other than established customers and accredited
investors. For any transaction involving a penny stock, unless
exempt, Rule 15g-9 under the Exchange Act requires that a
broker-dealer must:
●
approve
a person’s account for transactions in penny stocks;
and
●
receive
from the investor a written agreement to the transaction, setting
forth the identity and quantity of the penny stock to be
purchased.
In
order to approve a person’s account for transactions in penny
stocks, the broker or dealer must:
●
obtain
financial information and investment experience objectives of the
person; and
●
make
a reasonable determination that the transactions in penny stocks
are suitable for that person and the person has sufficient
knowledge and experience in financial matters to be capable of
evaluating the risks of transactions in penny stocks.
The
broker or dealer must also deliver, prior to any transaction in a
penny stock, a disclosure schedule prescribed by the SEC relating
to the penny stock market that:
●
sets
forth the basis on which the broker or dealer made the suitability
determination; and
●
provides
that the broker or dealer received a signed, written agreement from
the investor prior to the transaction.
Additionally, the investor must receive disclosure
about the risks of investing in penny stocks in both public
offerings and in secondary trading and about the commissions
payable to both the broker-dealer and the registered
representative, current quotations for the securities and the
rights and remedies available to an investor in cases of fraud in
penny stock transactions. Finally, monthly statements must be sent
disclosing recent price information for the penny stock held in the
account and information on the limited market in penny
stocks. Generally, brokers may be less willing to
execute transactions in securities subject to the “penny
stock” rules. This may discourage investor interest in and limit the
marketability of our securities.
While we intend to apply to list our common stock on a national
securities exchange, the exchange may not approve our listing and,
if approved, our common stock may not continue to trade on such
exchange.
We
intend to apply to list our common stock on a national securities
exchange. As such, we will need to satisfy certain qualitative and
quantitative requirements in order to successfully list our common
stock on such an exchange. We cannot assure you that we will be
able to meet the applicable requirements for such initial listing
or that our application will be approved.
If our
listing application is approved, we will be required to comply with
certain listing requirements of such exchange, which may include
compliance with certain requirements with respect to our corporate
governance, finances, stock trading volume and stock price. If we
fail to meet any of these requirements, such exchange may take
steps to delist our common stock. Such a delisting would likely
have a negative effect on the price of our common stock and would
adversely affect the ability to sell or purchase our common stock.
Further, even if we successfully apply to list our common stock on
a national exchange, we cannot assure you that an orderly and
active trading market in our common stock will ever develop or be
sustained.
We have a substantial number of options, warrants and convertible
debt outstanding, which could give rise to additional issuances of
our common stock and potential dilution of ownership to existing
shareholders.
As
of December 31, 2019, we had outstanding options and warrants to
purchase an aggregate of 17.9 million shares of our common stock at
exercise prices ranging from $0.05 to $2.10 per share. Of these,
620,000 represent shares underlying options with exercise prices
ranging from $0.05 to $2.10 per share and 17.2 million represent
shares underlying warrants at exercise prices ranging from $0.08 to
$1.00 per share. To the extent any holders of options or warrants
exercise same, the issuance of shares of our common stock upon such
exercise will result in dilution of ownership to existing
shareholders. Additionally, as a result of our 2017 financing, with
a remaining principal balance of $5,000,000 (See Note
8—Convertible Debt), the promissory notes issued are
convertible at $0.54 per share into an aggregate of 9,259,250
shares of common stock, if fully converted. As of March 25, 2020,
we converted $4,500,000 of the notes into 8,333,333 shares of our
common stock and repaid the remaining $500,000 note with cash. As
part of the original transaction, we also issued warrants to
purchase up to an additional 999,998 shares of common stock at an
exercise price of $0.69 per share 799,999 of which have
expired.
16
Item 1B. UNRESOLVED STAFF COMMENTS
Not
applicable.
Item 2.
PROPERTIES
Our
U.S. headquarters, a 9,000 square foot office space, is located at
8430 Spires Way, Frederick, MD 21701. The innovative facility includes a
warehouse, training room, quality control room, qualification
laboratory, and upon further installation will house its own custom
iHP ™SteraMist®
Complete Room System. The new warehouse is significantly larger
than our previous headquarters, allowing TOMI to store its new
product lines and stock a greater variety of inventory - quickly
delivering a customer purchase. The training room is integrated
with the newest technology to be able to present
SteraMist® virtually
around the world. As the company keeps up with the demand for
SteraMist®, there is a
dedicated quality control room to allow our service engineers to
work on machines for quick and efficient service to our customers.
The lease for our U.S. headquarters has a 10-year term and provides
for annual rent of approximately $143,000.
We
lease a 300 square foot office and conference space located at 9454
Wilshire Blvd., Penthouse, Beverly Hills, CA 90212. We lease this
space for $28,000 annually on a month-to-month tenancy in a
professional office building. The property serves as our sales and
executive office in the western region of the United States and is
used for meetings, sales demonstrations and various administrative
functions.
Item 3.
LEGAL PROCEEDINGS
We
currently are not a party to any legal proceedings, the adverse
outcome of which, in management’s opinion, individually or in
the aggregate, would have a material adverse effect on our results
of operations, financial position or cash flows.
Item 4.
MINE SAFETY DISCLOSURES
Not
applicable.
17
PART II
Item 5.
MARKET FOR REGISTRANT’S COMMON EQUITY, RELATED SHAREHOLDER
MATTERS AND ISSUER PURCHASES OF EQUITY SECURITIES
Market Information
Our
common stock is quoted on the OTCQB under the symbol
“TOMZ.” The OTCQB
replaced
the Financial Industry Regulatory Authority (FINRA)-operated OTC
Bulletin Board (OTCBB) as the main market for trading OTC
securities that report to a U.S. regulator. The market
quotations were for OTCQB reflect inter-dealer prices, without
retail mark-up, mark-down or commissions and may not necessarily
represent actual transactions.
Shareholders
As of
March 24, 2020, there were 771 record holders of our common
stock. On March 23, 2020, the last reported sale price of our
common stock on the OTCQB was $0.62 per share.
Dividends
We have
not paid and do not currently intend to pay cash dividends on our
common stock in the foreseeable future. Our policy is to retain all
earnings, if any, to provide funds for operation and expansion of
our business. The declaration of dividends, if any, will be subject
to the discretion of our Board, which may consider such factors as
our results of operations, financial condition, capital needs and
acquisition strategy, among others.
Recent Sales of Unregistered Securities
None.
Item 6.
SELECTED FINANCIAL DATA
Not
Required.
18
Item 7.
MANAGEMENT’S DISCUSSION AND ANALYSIS OF FINANCIAL CONDITION
AND RESULTS OF OPERATIONS
The following discussion and analysis of our financial condition
and results of operations relates to the years ended December 31,
2019 and 2018. This discussion and analysis should be read in
conjunction with our financial statements and the notes to those
financial statements that are included elsewhere in this
report.
Overview
TOMI
Environmental Solutions, Inc. (“TOMI”, “we”
and “our”) is a global provider of disinfection and
decontamination essentials through our premier Binary Ionization
Technology®
(BIT™)
platform, under which we manufacture, license, service and sell our
SteraMist® brand of
products, including SteraMist® BIT™, a hydrogen
peroxide-based fog or mist.
TOMI’s SteraMist is a patented technology
that produces ionized Hydrogen Peroxide (iHP™)
using plasma science invented by the United States Defense Advanced
Research Projects Agency (DARPA). TOMI’s EPA registered
BIT™
Solution is composed of a low
concentration of hydrogen peroxide converted to
iHP™
after passing the trade secret blended
solution including its sole active ingredient of 7.8% hydrogen
peroxide through an atmospheric cold plasma arc. The newly formed
iHP™
fog and mist consists of
submicron’s to 3-micron radical particles that are carried
throughout the treatment area in a fog or mist moving with the same
velocity and characteristics of a gas. This allows the fog or mist
to affect all surfaces and space throughout the targeted treatment
area, over, above and beyond the ability of a manual cleaning
processes. iHP™
damages pathogenic organisms through
oxidation of proteins, carbohydrates, and
lipids. SteraMist®
no-touch disinfection and or
decontamination mechanical clean in the treated area occurs by cellular disruptions
and/or dysfunctions resulting in a 6-log (99.9999%) and greater
kill or inactivation of all pathogens in the treatment
area.
SteraMist®
Binary Ionization Technology®
allows a facility to have a Hospital-HealthCare EPA registered tool
and solution to replace manual cleaning technology, upgrade
existing protocols, and limit liability in a facility when it comes
to resistant infectious pathogens. SteraMist®
BIT™
is the first EPA registered solution
and system combination on the market. BIT™
is also listed on EPA’s List G,
L, K, and M for Norovirus, C. diff,
Ebola, and Influenza, respectively. TOMI maintains this registration in 50
states, Canada, and approximately 22 other
countries.
Markets
TOMI’s
SteraMist®
products are designed to address a panoply of industries using
iHP™. Our
operations are organized into four main divisions based on our
current target industries: Hospital-Healthcare, Life Sciences, TOMI
Service Network (TSN) and Food Safety.
Products
We
continue to offer our customers a wide range of innovative products
designed to be easily incorporated into their existing disinfection
and decontamination procedures. In addition, we offer equipment
installations, iHP™
Service (routine & emergency), validations and qualifications,
and onsite performance maintenance requests - all of which are
structured to address the disinfection and decontamination needs of
our customers worldwide.
Divisions
Hospital-Healthcare
TOMI’s
hospital-healthcare customer list expands with the close of every
quarter. TOMI’s SteraMist® Hospital
Disinfection Cart, an all-in-one cart that houses our handheld
point-and-spray SteraMist® Surface Unit as
well as accompanying supplies, has increased interest in our
technology for this division. This product is designed to make the
terminal cleaning process of patient rooms more efficient than
traditional manual cleaning methods. We believe that our
SteraMist® Hospital
Disinfection Cart will allow our customers within the
Hospital-Healthcare industry to address the growing concern
regarding the increasing high level of transference of pathogens
including multiple drug resistant organisms (MDRO’s) leading
to HAI’s from hospital and healthcare related environmental
surfaces and equipment to patients and healthcare workers.
TOMI’s SteraMist 55-minute terminal clean protocol includes
incorporating most stages of a facility’s current cleaning
protocol and by just adding SteraMist mechanical clean protocol,
allows an average 90-minute manual clean protocol to be reduced to
55-minutes, as confirmed by the Shield Study at UCLA, from
beginning to end, including the changing of the bed linens,
demonstrating remarkable results in our clients’ facilities
from coast to coast.
19
Life Sciences
TOMI’s
SteraMist®. Environment
System, iHP™
Decontamination Complete Room, SteraMist® Select Surface
Unit, iHP™ implementation
to decontamination chambers and cage washers, and our
iHP™
Service Division, are designed to provide a complete room solution
to address the regulatory inspections of
disinfecting/decontaminating and Installation Qualification
(IQ)-Operational Qualification (OQ)–Performance Qualification
(PQ) validation processes within the life sciences
industry.
TOMI Service Network
TSN is
our network comprised of outside professionals who are exclusively
licensed and trained to use the SteraMist® products. TSN
sells, trains and services professional remediation companies in
the use of SteraMist®. These
companies specialize in mold abatement, water damage (including
damage from CAT 1 though 3 water loss) and fire damage, as well as
professional specialists that are certified and practice in the
area of forensic restoration. Currently, TSN is comprised of
companies throughout the United States and Canada. TSN members use
SteraMist® as a standalone
service as well as incorporating our products into their existing
business models. We derive a continuous revenue stream from our TSN
customers through recurring purchases of our BIT™ solution. As
of January 1, 2020, we have removed the exclusivity portion of our
service partner company agreements which allows us to expand our
network and penetrate existing markets.
Our TSN network
continues to grow and currently the total number of TSN company
providers to date is one-hundred and three
(103) expanding our network membership across 35 U.S. States
and two (2) Canadian provinces. Our service providers, with
approximately 160 SteraMist® with
BIT™
technology units in the field, allows for rapid deployment for use
in the control of a biological outbreak and border security
nationally and internationally upon short
notice.
Food Safety
Food
Safety is one of our newest and potentially largest targeted
markets, as we believe it presents an opportunity for substantial
growth. This is in light of the implementation and enforcement of
new and existing rules in the United States under the FDA Food
Safety Modernization Act and in Canada under the Safe Food for
Canadians Act and the Safe Food for Canadians Regulations, the
latter two of which became effective in January 2019. This is in
part due to the increased focus on concerns within the food safety
industry in North America and abroad. Our consultants have
submitted to the regulatory bodies a request to expand our current
labels from the treatment of food processing machinery, restaurants
and food contact areas, to include direct food and crop
applications using a 1% acceptable concentration of hydrogen
peroxide that is already approved for direct food use by the USDA
and EPA.
We
intend to target the following segments, with an initial emphasis
on the profitable organic market:
●
Growing
crops
●
Seeds
●
Packaging
facilities
●
Food storage
(produce, meats, fish)
●
Food transportation
vehicles
●
Food processing
plants
●
Grocery
stores
●
Cannabis labs,
grow-houses, extraction facilities and retail shops
In each
area, our main objective is to prevent and/or minimize food decay
without utilizing harsh chemicals that leave toxic residues. This
could create an opportunity to supplement, or replace, current
pesticides and fungicides currently being used by these industry
leaders.
20
Business Highlights and Recent Events
Customers:
Globally, we have
added fifty-four (54) new customers across all our divisions for
the year ended December 31, 2019. This represents a thirteen (13%)
percent increase over the calendar year 2018.
Our
Hospital-Healthcare division added sixteen (16) new facilities for the year
ended December 31, 2019 which represents 167% increase compared to
the prior year.
Our
Life Sciences customer base showed continued growth with the
addition of twenty-six (26) new customers for the year ended
December 31, 2019. This represents a 13% increase compared to the
prior year.
Our
Food Safety division added three (3) new Food Safety customers for
the year ended December 31, 2019, an increase of 100% compared to
the prior year.
Revenues:
For the
year ended December 31, 2019, we had record annual revenue since
our inception. Our total revenues for the years ended December 31,
2019 and 2018 was approximately $6,347,000 and $5,585,000,
respectively, representing an increase of $762,000, or 14% compared
to the prior year.
SteraMist
product-based revenues for the years ended December 31, 2019 and
2018, were approximately $4,999,000 and $4,652,000, representing an
increase of $347,000 or 7% when compared to the prior year. The
growth is attributable to an increase in our mobile equipment
orders and higher solution sales in 2019.
Our
service-based revenue achieved a record level representing another
milestone for the year ended December 31, 2019. Our service-based
revenue for the years ended December 31, 2019 and 2018 were
$1,348,000 and $933,000, respectively, representing an increase of
$415,000 or 44% when compared to the prior year. The increase in
our service-based revenue was due to increased service engagements
for the year ended December 31, 2019 when compared to the prior
year.
In
2019, our domestic revenue for the years ended December 31, 2019
and 2018 was $5,002,000 and $4,197,000, respectively, an increase
of $805,000, or 19% when compared to the prior year. The increase
was due to increased demand for our equipment, solution and
services.
Our
Hospital-Healthcare revenues grew by 120% for the year ended
December 31, 2019 when compared to the prior year. The growth was
attributable to the increase in the number of facilities added
during the year. We anticipate continued growth moving into
2020.
Our
Life Sciences revenue experienced continued growth 4% for the year
ended December 31, 2019 when compared to the prior year. The 4%
growth reflects a non-recurring custom
built-in unit of approximately $600,000 in the third quarter of
2018. Year over year, we experienced increased solution and mobile
equipment orders.
Significant Contracts:
In
January 2019, TOMI and Arkema Inc. a global leader in the hydrogen
peroxide industry entered into an exclusive global co-marketing and
supply agreement. The agreement provides that the parties will
develop the market for TOMI’s technology using our SteraMist
brand of products for food safety applications, improving the speed
and effectiveness of disinfection solutions to the
industry.
In
April 2019, we entered into an exclusive distribution agreement
with an Israeli company, Cleancor Technologies Ltd.
(“Cleancor”), an advanced solution company for the
industrial cleaning and repair of water and fire damages. Cleancor
has already diversified and started a subsidiary named Clean-Bit
Environmental Solutions and has begun implementing marketing
strategies resulting in a robust pipeline in the health care, food
industry, defense, and medical cannabis verticals.
In
May 2019, we received a order for mobile equipment of over $400,000
for the Kansas Department of Health in the United
States.
In July
2019, we announced the implementation of SteraMist®
iHP™
Plasma Decontamination Chamber at the University of Houston and a
partnership with Lynx Product Group.
In
December 2019, we shipped our seventh (7th) SteraMist® custom
engineered system. This is the second permanent room system for
installation into our United Kingdom based customer’s
facility.
21
Service Projects:
In
September 2019, we were engaged by Los Angeles County – USC
(LAC + USC) Medical Center to remediate Aspergillus mold that had
appeared within a critical sterilization area of the
facility.
In
August 2019, we were awarded a service project with a niche
pharmaceutical company that develops, manufactures and markets
generic and branded prescription pharmaceuticals as well as animal
and consumer health products with a focus on injectables. The
iHP™
Service team treated the 170,000 cubic foot space, including
classified and non-classified areas. We were engaged again in the
fourth quarter by the same niche pharmaceutical company to perform
a similar treatment.
Events:
We exhibited
at the annual conference of the Association of Professionals in
Infection Control (APIC) with our new booth creating the largest
presence we have had at a tradeshow. The SteraMist® Hospital Cart
was on display as well as multiple educational presentations to
infection preventionists. The show provided many valuable leads and
our new exhibit received considerable praise. This presence added
two new hospital clients in the third quarter and four in the
fourth quarter.
We
exhibited at our first veterinary conference, bringing on our first
animal hospital customer in the third quarter, demonstrating the
versatility and ever-expanding verticals SteraMist® disinfection
technology may be implemented in.
We
exhibited at the 70th annual American Association for Laboratory
Animal Science (AALAS) National Meeting in Denver
Colorado.
To
increase our presence in the Food Safety industry, we exhibited at
the Fruit Attraction 2019, an international trade show that focuses
on the fruit and vegetable industry.
In
November 2019, we exhibited at International Sanitary Supply
Association (ISSA) North America expo in Las Vegas
Nevada.
Subsequent Events:
SARS
CoV-2 coronavirus. On March 11, 2020
the World Health Organization declared the SARS CoV-2
coronavirus a global pandemic and
recommended containment and mitigation measures worldwide.
We have been identified as a disinfectant and decontamination
vendor by various agencies and countries. The outbreak has
increased the demand for TOMI products and services. We have been
working relentlessly with organizations to address the concerns and
provide solutions for disinfecting and decontamination of the SARS
CoV-2 coronavirus. The financial statements included in this Annual
Report do not reflect any of the Company’s SARS CoV-2
coronavirus related sales and services revenue that occurred since
the pandemic outbreak in 2020 and which will be reported in the
ensuing quarterly report.
Following are the
significant events during the first quarter 2020:
●
January 29, 2020
– TOMI SteraMist® prepared to
deploy to fight SARS CoV-2 coronavirus.
●
February 4, 2020 -
TOMI Receives China CDC Registration Making SteraMist® the
Disinfection Industry Standard in China
●
February 27, 2020 -
SteraMist® Takes the Fight
to the SARS CoV-2 coronavirus. Worldwide - China, Hong Kong,
Thailand, Singapore, Israel and the United Kingdom
●
March 2, 2020 -
SteraMist® Declared
Official Decontamination Technology of Seoul City Metropolitan
Transit Systems
●
March 10, 2020 -
SteraMist® is Mobilized to
Aid in the Control SARS-CoV-2 coronavirus in Daegu-Kyungbuk
Province, South Korea
●
March 11, 2020 -
SteraMist® is Prepared to
Fight SARS-CoV-2 coronavirus in Thailand
●
March 16, 2020 -
SteraMist® Deployed to
Fight SARS-CoV-2 coronavirus in United States
●
March 18, 2020
– SteraMist® has qualified
to meet the EPA Emerging Viral Pathogen Guidance for
Antimicrobial Pesticides with the SteraMist® Environment
System for room fogging/misting against SARS-CoV-2 coronavirus, the
novel coronavirus that causes COVID-19.
22
During
the first quarter of 2020, we have experienced the
following:
●
Sold substantially
all of our inventory, with a backlog and demand for 91 additional
units,
●
New equipment
orders require a 50% deposit,
●
Increased demand on
solution re-orders as disinfecting and decontamination procedures
have increased exponentially across the world,
●
Service revenue
exploded as the outbreak spread and demand for disinfecting and
decontamination services increased,
●
Exclusivity in TSN
was revoked as demand surged and new providers requested equipment,
solution and training to provide disinfecting and decontamination
services,
●
New channels were
opened as decontamination and disinfecting processes are updated
and implemented, including but not limited to, fire departments,
morgues, FAA, police departments, county and state health
departments, cruise ships, infectious disease research facilities,
military and ambulances,
●
Convertible notes with a principal balance of
$4,500,000 were converted into 8,333,333 shares of our
common stock at a conversion price of
$0.54 per share, the remaining outstanding balance of
$500,000 was repaid.
●
Staffing –
increased demand has severely taxed our existing team and resources
to meet the current demands resulting in hiring and onboarding
additional employees.
Certifications:
During
2019, we added compounding pharmacy customers, which are FDA 503B
outsourcing facilities that meets all rigorous national standards
with quality sterile products. The FDA created this new designation
of compounding pharmacy to establish a new level of patient care
and safety, and these facilities must comply with strict cGMP
(current good manufacturing practices) guidelines, which is the
same standards that pharmaceutical manufacturers follow. We have
continued to add new pharmacy customers in the third quarter of
2019. With the addition of the two new pharmacy customers in the
third quarter of 2019 we now have four compounding pharmacy
customers.
During
2019, we were audited by Pfizer Global Supply Manufacturing and
Supplier Quality Assessments and were reported to be
“Acceptable”, allowing us to continue expanding
SteraMist® implementation into Pfizer facilities. Our
management has further focused and allocated resources towards
expanding quality control procedures and protocols based on
recommendations received during the audit. Pfizer approved a press
release of how SteraMist is being used in multiple facilities
across the United States as a result of passing the Pfizer Global
Supply Agreement Audit. In the third quarter, we fulfilled new
orders and finalized a new piece of custom commercial research
laboratory equipment for Pfizer utilizing our BIT™ technology
platform.
Research Studies
We
continue to participate in a large multi-year federal funded study,
known as the “SHIELD study”, that compares hospital
manual cleans to a SteraMist® mechanical
clean. Preliminary results collected by the current hospitals in
the study is showing a decrease in the transference of pathogens
resulting in HAIs and C. difficile infections in the rooms that
used SteraMist® for their
terminal clean, as compared to the rooms that have been manually
cleaned. The University of Michigan, a recognized teaching
university hospital, joined the California hospitals in this Shield
Study in the fourth quarter, allowing for additional collection of
data to validate the value of SteraMist® technology in
hospitals.
At the
annual meeting of the American Association for Laboratory Animal
Science (“AALAS”) this October in Denver, the
University of Iowa and Iowa State University presented a study
about our technology and the effect of iHP™
on pinworms members of the University of Iowa and Iowa State
University were available in the poster section of the conference
and answered questions from the many AALAS members about our
excellent results. A published paper will be shortly released in a
major scientific journal.
The
United States Department of Agriculture (USDA) submitted another
paper for publication titled “Cold Plasma Enhances the
Efficacy of ionized Hydrogen Peroxide in Reducing Populations of
Salmonella Typhimurium and
Listeria innocua on Grape
Tomatoes, Apples, Cantaloupe and Romaine Lettuce” In July
2019, the author presented the paper, and a poster was shown at the
International Association of Food Protection (IAFP). This was a
successful introduction of SteraMist® to this
audience and many are interested in further testing and research of
the technology. The poster and presentation focused on the urgent
need of a decontamination technology, such as SteraMist® to enhance
microbial safety of fresh produce. Greater reductions were
documented when ionized hydrogen peroxide was passed through the
plasma arc and greater than 5 log reductions of Salmonella were achieved. We are
looking forward to the publication of this paper in a recognized
international food safety journal.
Product Development
We have
added three new products to our growing line of
products:
●
A single
applicator build-in unit for decontamination chambers and cage
washers, which was recently successfully validated at the
University of Houston.
●
A decontamination
cart for a Pfizer facility. We will be designing and engineering a
second SteraMist® mobile
decontamination cart for this same facility by the second quarter
of 2020.
●
A stainless-steel
mobile 90-degree applicator and
the answer to the mobile treatment and decontamination of BSC
cabinets and isolators. The 90 degree applicator product has led to
a partnership with a large design and manufacturing company of
washing and contamination control systems, and we plan on
installing an all-in-one disinfection solution to Gnotobiotic
Housings with our partner.
23
During
2019, we continued our focus on improving our SteraMist® Environment
System and the development of a proprietary software that will be
integrated into the next generation of SteraMist® equipment, both
mobile and permanent. The new software will improve communication
between our equipment and the end user’s system, provide
improved reporting results and simplify the overall usage of the
system itself. During the first quarter of 2019, we reached
feasibility with the software being developed. We are in the final
testing and validation phase of the new Environment System
prototype, expecting to begin commercialization in
2020.
We are
in the design phase with our partner Arkema and their client (a
global food storage and safety company) on an engineered concept
for the decontamination of large industrial food warehouse
facilities. The concept is a six (6) applicator fully automated
fogging system permanently mounted on a hydraulic lift that is
capable of coverage in high-volume spaces. We are in early phases
of the project and don’t have an expected commercialization
date.
Registrations & Intellectual Property (IP):
In January 2019, TOMI received a no objection
letter from Canada, amending its BIT™ Solution registration to include Salmonella
and Norovirus. Our Canadian label now holds similar efficacy claims
with our U.S. EPA label.
In
February 2019, we added our Canadian label to the Organic Materials
Review Institute (“OMRI”) certifying that our product
meets the Canadian organic standards. On May 15, 2019, our
BIT™
solution disinfectant was listed and certified with the OMRI in
compliance with the USDA National Organic Program. Thus, our
product is now listed as an OMRI Listed© product and
appears on the OMRI Products List© and the
OMRI Canada Products List©.
We have
been actively pursuing registration in mainland China. We
successfully passed the Chinese Center for Disease Control and
Prevention (“Chinese CDC”) requirements for
registration. In addition, we have strengthened our intellectual
property in the region, submitting trademarks and patent
registrations. We successfully passed all eighteen (18) testing
measures required, including many microbiological tests. All of the
toxicity studies demonstrated that our BIT™ fog was
classified as a non-toxic substance. In the second quarter of 2019,
we were made aware of the final materials needed for the dossier
that is required by the Chinese CDC for registration of our
product. The finalization of our dossier was submitted in the third
quarter of 2019, which included the successful shipping and custom
clearance to the region, and all the necessary custom declaration
forms have been certified. The pre-CDC approval has been commented
on by the Chinese CDC. After a three (3) year-long submission
process, in January 2020, we received confirmation that two (2)
separate registrations - SteraMist® equipment
registration and BIT™ solution
registration - has been officially approved and registered with the
China CDC.
Our
90-degree surface mounted applicator device was allowed and
published in the Philippines. We have submitted this design patent
in multiple countries and expect the others to follow shortly in
publication. This additional design patent compliments our design
patents portfolio, including our permanent modular applicator,
decontamination cart, and our two decontamination
chambers.
In
August and September 2019, we published and filed two new utility
patents. These utility patents were originally filed in 2017 and
2018. The published patents included both the system claims
(US15/858,446) and the method claims (US16/127,915) and were
published with the USPTO in the third quarter of 2019.
In
November 2019, we registered two new design patents entitled
“Surface Mounted Applicator Device” in Europe and
Japan.
Financial Operations Overview
Our
financial position as of December 31, 2019 and 2018, respectively,
was as follows:
|
|
December
31,
2019
|
December
31,
2018
|
|
Total
shareholders’ equity
|
$890,000
|
$2,995,000
|
|
Cash and cash
equivalents
|
$897,000
|
$2,005,000
|
|
Accounts
receivable, net
|
$1,495,000
|
$2,146,000
|
|
Inventories,
net
|
$2,315,000
|
$2,682,000
|
|
Prepaid
expenses
|
$188,000
|
$302,000
|
|
Deposits
|
$141,000
|
$109,000
|
|
Current liabilities
(excluding convertible notes)
|
$1,302,000
|
$1,700,000
|
|
Convertible notes
payable, net
|
$5,000,000
|
$4,982,000
|
|
Long-term
liabilities (excluding convertible notes)
|
$1,034,000
|
$402,000
|
|
Working Capital
(excluding convertible notes)
|
$3,734,000
|
$5,544,000
|
|
Working Capital
(including convertible notes)
|
$(1,266,000)
|
$5,544,000
|
24
During
the year ended December 31, 2019, our debt and liquidity positions
were affected by the following:
●
Net cash used in
operations of approximately $814,000.
●
Costs incurred to
develop software of approximately $126,000.
●
Costs incurred
related to new utility patents of approximately
$22,000.
●
Purchase of
property and equipment of approximately $146,000.
Results of Operations for the Year Ended December 31, 2019 Compared
to the Year Ended December 31, 2018
|
|
Year
Ended
|
Year
Ended
|
|
|
December
31,
2019
|
December
31,
2018
|
|
|
|
|
|
Revenue,
Net
|
$6,347,000
|
$5,585,000
|
|
Gross
Profit
|
$3,914,000
|
$3,117,000
|
|
Total Operating
Expenses (1)
|
$5,997,000
|
$6,188,000
|
|
Loss from
Operations
|
$(2,083,000)
|
$(3,070,000)
|
|
Total Other Income
(Expense)
|
$(214,000)
|
$(160,000)
|
|
Net
Loss
|
$(2,298,000)
|
$(3,230,000)
|
|
Basic (loss) per
share
|
$(0.02)
|
$(0.03)
|
|
Diluted (loss) per
share
|
$(0.02)
|
$(0.03)
|
(1)
Includes
approximately $114,000 and $77,000 in non-cash equity compensation
expense for the years ended
December 31, 2019 and 2018, respectively.
Sales
During
the years ended December 31, 2019 and 2018, we had net revenue
of approximately $6,347,000 and $5,585,000, respectively,
representing an increase in revenue of approximately $762,000 or
14%. The increase in sales in the
current year period was attributable to large equipment orders from
new customers, and steady repeat solution orders from our existing
customer base.
Our
products are early in the product and customer adoption cycle. We
continue to see strong reorders for solution from our existing
customers. The purchase of additional equipment is at a slower pace
due to the assessment and integration of our technology into our
customers’ on-going operations. Our new customer pipeline is
very strong. As customers mature through the product and adoption
cycle and our sales pipeline converts to sale wins, we expect to
have more predictable sales quarter over quarter.
25
Net Revenue
Product and Service Revenue
|
|
For the year ended December 31,
|
|
|
|
2019
|
2018
|
|
SteraMist®
Product
|
$4,999,000
|
$4,652,000
|
|
Service
and Training
|
1,348,000
|
933,000
|
|
Total
|
$6,347,000
|
$5,585,000
|
Revenue by Geographic Region
|
|
For the year ended December 31,
|
|
|
|
2019
|
2018
|
|
United
States
|
$5,002,000
|
$4,197,000
|
|
International
|
1,345,000
|
1,388,000
|
|
Total
|
$6,347,000
|
$5,585,000
|
Cost of Sales
During
the years ended December 31, 2019 and 2018, our cost of sales were
approximately $2,433,000 and $2,467,000, respectively, representing
a decrease of approximately $34,000 or 1%. The primary reason for the decrease in cost of
sales is attributable to the product mix in the current year period
as compared to the prior year period and our inventory
reserve that was recorded in the fourth quarter of 2018. Our gross
profit margins as a percentage of sales for the years ended
December 31, 2019 and 2018 was 61.7% and 55.8%, respectively. The
increase in 2019 as compared to the prior period was a result of
the customer and product mix in sales and our inventory reserve
established in 2018
Professional Fees
Professional fees
for the year ended December 31, 2019 were approximately $364,000,
as compared to $330,000 for the prior year, representing an
increase of approximately $34,000, or 10%. Professional fees are
comprised of legal, accounting and financial consulting fees. The
primary reason for the increase is attributable to legal fees
incurred in connection with filing and maintenance of our
trademarks and utility patents on a domestic and international
basis.
Depreciation and Amortization
Depreciation and
amortization were approximately $716,000 and $635,000 for the years
ended December 31, 2019 and 2018, respectively, representing an
increase of $81,000, or 13%. The increase in depreciation expense
is attributable to additional property, equipment and leasehold
improvements.
26
Selling Expenses
Selling
expenses for the year ended December 31, 2019 were approximately
$1,655,000, as compared to $1,360,000 for the year ended December
31, 2018, representing an increase of approximately $295,000 or
22%. We continue to invest and allocate resources into our sales,
marketing and advertising initiatives and have increased efforts in
the current year in order to further develop our brand recognition
and grow our base of customers. During the first half of 2019, we
contracted with various national sales groups. Our selling expenses
increased in the current period as a result of the
following:
–
Higher salaries due
to increases in headcount in our sales department.
–
Onboarding and
training of new sales independent sales
representatives.
–
Commissions impact
due to the plan implemented with the national sales groups as well
as the product mix for the existing teams.
–
Increased tradeshow
expenses for the year ended December 31, 2019 compared to the same
prior year period.
–
The acquisition of
a new high-tech 30x40 tradeshow booth
–
Continual
efforts in advertising within targeted publications, Google search
engine optimized campaigns, and organic brand
awareness.
–
Continued
investment in our Social Media presence across all
platforms.
Selling
expenses represent selling salaries and wages, trade show fees,
commissions, advertising and marketing expenses.
Research and Development
Research and
development expenses for the year ended December 31, 2019 were
approximately $341,000, as compared to $916,000 for the year ended
December 31, 2018, representing a decrease of approximately
$575,000, or 63%. The primary reason for the decrease is
attributable to the timing of costs related to testing and studies
that occurred in the same prior period.
Equity Compensation Expense
Equity
compensation expense for the year ended December 31, 2019 was
approximately $114,000, as compared to $77,000 for the year ended
December 31, 2018, representing a increase of approximately $37,000
or 48%. The increase in equity compensation expense relates to the
timing of certain issuances that occurred in the prior period.
Equity compensation expense is incurred upon the issuance of
warrants and stock options. On the date of a grant, we determine
the fair value of the award and recognize compensation expense over
the requisite service period, which is generally the vesting period
of the award. The fair value of the award is calculated using the
Black-Scholes Method option-pricing model.
Consulting Fees
Consulting fees for
the year ended December 31, 2019 were approximately $127,000, as
compared to $141,000 for the year ended December 31, 2018,
representing a decrease of approximately $14,000, or
10%.
General and Administrative Expense
General
and administrative expense includes salaries and payroll taxes,
rent, insurance expense, utilities, office expense and product
registration costs. General and administrative expense was
approximately $2,681,000 and $2,729,000 for the years ended
December 31, 2019 and 2018, respectively, representing a decrease
of approximately $48,000 or 2%.
27
Other Income and Expense
Gain on
redemption of convertible note was $150,000 for the year ended
December 31, 2018.
Amortization of
debt discount was approximately $18,000 and $38,000 during the
years ended December 31, 2019 and 2018, respectively. Amortization
of debt discount consists of the amortization of debt discount on
the $6,000,000 principal amount of Notes issued in March and May
2017. The debt discount was amortized over the life of the Notes
utilizing the effective interest method.
Induced
conversion costs of approximately $57,000 for the year ended
December 31,2018 were incurred in connection with the conversion of
$700,000 convertible note payable.
Interest income for
the years ended December 31, 2019 and 2018 was approximately $3,000
and $7,000, respectively.
Interest expense
for the years ended December 31, 2019 and 2018 was approximately
$200,000 and $222,000 respectively. Interest expense for the years
ended December 31, 2019 and 2018 consisted of the interest incurred
on the $6,000,000 principal amount of Notes issued in March and May
2017.
Net Loss
Net
loss for the years ended December 31, 2019 and 2018 was
approximately ($2,298,000) and ($3,230,000), respectively. Net loss
per common share, basic and diluted, for the years ended December
31, 2019 and 2018 was ($0.02) and ($0.03), respectively. The
primary reasons for the decreased net loss can be attributed to the
changes in the items when comparing 2019 to 2018:
●
Higher revenue and
gross profit of approximately $763,000 and $796,000,
respectively;
●
Lower operating
expenses of approximately $191,000, offset by
●
Higher other
expense of approximately $54,000
Liquidity and Capital Resources
As of December 31, 2019, we had cash and cash equivalents of
approximately $897,000. Our working capital before consideration of
the convertible notes payable of $5,000,000 was $3,734,000. Working
capital after consideration of the convertible notes payable was
($1,266,000). Our principal capital requirements are to fund
operations, invest in research and development and capital
equipment, and the continued costs of public company filing
requirements. We have historically funded our operations through
debt and equity financings.
In
March and May 2017, we raised gross proceeds of $6,000,000 through
a private placement of the Notes. We issued the Notes in two
tranches of $5,300,000 and $700,000, respectively, which originally
were scheduled to mature on August 31, 2018 and November 8, 2018,
respectively, unless earlier redeemed, repurchased or
converted.
In 2018, a portion of the Notes aggregating $1,000,000 principal
were either converted to equity or paid.
On March 30, 2019, the remaining holders of the
Notes agreed to extend the maturity dates of their Notes with an
aggregate principal amount of $5,000,000 to April 3, 2020. As of
March 30, 2020, convertible notes with a principal balance of
$4,500,000 were converted into 8,333,333 shares of our
common stock at a conversion price of
$0.54 per share and the remaining outstanding balance of $500,000
was repaid. The conversion and repayment of the notes
mitigates any going concern uncertainties.
For the
years ended December 31, 2019 and 2018, we incurred losses from
operations of approximately $2,083,000 and $3,070,000,
respectively. The cash used in operations was approximately
$814,000 and $1,767,000 for the years ended December 31, 2019 and
2018, respectively.
Our revenues can fluctuate due to the following factors, among
others:
●
Ramp up and
expansion of our internal sales force and manufacturers’
representatives;
●
Length of our sales
cycle;
●
Expansion into new
territories and markets; and
●
Timing of orders
from distributors.
We
could incur additional operating losses and an increase of costs
related to the continuation of product and technology development
and administrative activities.
28
Management has
taken and will endeavor to continue to take a number of actions in
order to improve our results of operations and the related cash
flows generated from operations in order to strengthen our
financial position, including the following items:
●
Expanding our label
with the EPA to further our product registration
internationally;
●
Continued expansion
of our internal sales force and manufacturer representatives in an
effort to drive domestic revenue in all hospital-healthcare
verticals;
●
Continued expansion
of our internal sales force and manufacturer representatives in an
effort to drive global revenue in the life science
verticals;
●
Expansion of
international distributors; and
●
Continued growth of
TSN, our new Forensic Restoration FRST sub-division and new growth
in the food safety market which includes using
SteraMist®
for increasing the storage time of pre- and post-harvest produce
and increasing transportation shelf life by installing
SteraMist® in semitrucks
and ships that are transporting food.
We
believe that our existing balance of cash and cash equivalents and
amounts expected to be provided by operations will provide us with
sufficient financial resources to meet our cash requirements for
operations, working capital and capital expenditures over the next
twelve months. We cannot make any
assurances that management’s strategies will be effective or
that any additional financing will be completed on a timely basis,
on acceptable terms or at all. Our inability to successfully
implement our strategies or to complete any other financing may
mean that we would have to significantly reduce costs and/or delay
projects, which would adversely affect our business, customers and
program development, and would adversely impact
us.
Until
such time, if ever, as we can generate substantial product revenue,
we expect to finance our cash needs through a combination of equity
or debt financings. Sufficient funds may not be available to us at
all or on attractive terms when needed from these sources. To the
extent that we raise additional capital through the future sale of
equity or debt, the ownership interests of our stockholders will be
diluted, and the terms of these securities may include liquidation
or other preferences that adversely affect the rights of our
existing common stockholders. We may require additional capital
beyond our currently anticipated amounts.
Operating Activities
Cash used in operating activities for
the years ended December 31, 2019 and 2018 was approximately
$814,000 and $1,767,000, respectively. Cash used in operating
activities decreased in 2019 approximately $953,000 compared to the
prior year period primarily as a result of the collection of
accounts receivable and the decline in inventory.
Investing Activities
Cash used in investing activities for
the years ended December 31, 2019 and 2018 was approximately
$293,000 and $628,000, respectively. Cash used in investing
activities decreased $335,000 compared to the prior year period
primarily due to equipment, furniture and leasehold improvements
acquired in connection with our new facility in the prior year
period.
Financing Activities
Cash used in financing activities for
the year ended December 31, 2019 was $0.
Cash used in financing activities for
the year ended December 31, 2018 consisted of the $150,000 paid in
connection with the redemption of convertible notes payable with a
principal balance of $300,000.
Financing Activities
Subsequent
liquidity events:
As of
March 30, 2020, convertible notes with
a principal balance of $4,500,000 were converted into
8,333,333 shares of our common stock at a conversion price of $0.54 per share
and the remaining outstanding balance of $500,000 was repaid. The
conversion and repayment of the notes mitigates any going concern
uncertainties.
SARS
CoV-2 coronavirus. On March 11, 2020
the World Health Organization declared the SARS CoV-2
coronavirus a global pandemic and
recommended containment and mitigation measures worldwide.
We have been identified as a disinfectant and decontamination
vendor by various agencies and countries. The outbreak has
increased the demand for TOMI products and services. We have been
working relentlessly with organizations to address the concerns and
provide solutions for disinfecting and decontamination of the
virus. The financial statements included in this Annual Report do
not reflect any of the Company’s SARS CoV-2 coronavirus
related sales and services revenue that occurred since the pandemic
outbreak in 2020 and which will be reported in the ensuing
quarterly report.
29
During
the first quarter of 2020, we have experienced the
following:
●
Sold substantially
all of our inventory, with a backlog and demand for 91 additional
units,
●
New equipment
orders require a 50% deposit,
●
Increased demand on
solution re-orders as disinfecting and decontamination procedures
have increased exponentially across the world,
●
Service revenue
exploded as the outbreak spread and demand for disinfecting and
decontamination services increased,
●
Exclusivity in TSN
was revoked as demand surged and new providers requested equipment,
solution and training to provide disinfecting and decontamination
services,
●
New channels were
opened as decontamination and disinfecting processes are updated
and implemented, including but not limited to, fire departments,
morgues, FAA, police departments, county and state health
departments, cruise ships, infectious disease research facilities,
military and ambulances,
●
Convertible notes with a principal balance of
$4,500,000 were converted into 8,333,333 shares of our
common stock at a conversion price of
$0.54 per share and the remaining outstanding balance of
$500,000 was repaid.
●
Staffing –
increased demand has severely taxed our existing team and resources
to meet the current demands resulting in hiring and onboarding
additional employees.
The
changes to our business during the first quarter of 2020 have
significantly changed our working capital outlook. The increase for
the demand of our products and services is generating increased
revenue and cashflow along with the conversion of $4.5 million of
our debt during 2020 will have a large impact on our working
capital. The increases are offset with the cash required to engage
our supply chain and order inventory. We anticipate the increase in
demand for our product and services will continue throughout 2020
and will have a positive impact on our working
capital.
Critical Accounting Policies and Estimates
Our
discussion and analysis of our financial condition and results of
operations is based upon our consolidated financial statements,
which have been prepared in accordance with accounting principles
generally accepted in the United States. The preparation of these
financial statements requires us to make estimates and judgments
that affect the reported amounts of assets, liabilities, revenues
and expenses, and related disclosure of contingent assets and
liabilities. The estimation process requires assumptions to be made
about future events and conditions, and as such, is inherently
subjective and uncertain. Actual results could differ materially
from our estimates.
The SEC
defines critical accounting policies as those that are, in
management’s view, most important to the portrayal of our
financial condition and results of operations and most demanding of
our judgment. We consider the following policies to be critical to
an understanding of our consolidated financial statements and the
uncertainties associated with the complex judgments made by us that
could impact our results of operations, financial position and cash
flows.
Revenue Recognition
We
recognize revenue in accordance with Financial Accounting Standards
Board (“FASB”) Accounting Standards Update
(“ASU”) No. 2014-09, Revenue from Contracts with
Customers (Topic 606). The Company recognizes revenue when we
transfer promised goods or services to customers in an amount that
reflects the consideration to which we expect to be entitled in
exchange for those goods or services. To determine revenue
recognition for contracts with customers we perform the following
five steps: (i) identify the contract(s) with a customer; (ii)
identify the performance obligation(s) in the contract; (iii)
determine the transaction price; (iv) allocate the transaction
price to the performance obligation(s) in the contract; and (v)
recognize revenue when (or as) we satisfy the performance
obligation(s). At contract inception, we assess the goods or
services promised within each contract, assess whether each
promised good or service is distinct and identify those that are
performance obligations.
The
Company must use judgment to determine: a) the number of
performance obligations based on the determination under step (ii)
above and whether those performance obligations are distinct from
other performance obligations in the contract; b) the transaction
price under step (iii) above; and c) the stand-alone selling price
for each performance obligation identified in the contract for the
allocation of transaction price in step (iv) above.
Title
and risk of loss generally pass to our customers upon shipment. Our
Customers include end users as well as dealers and distributors who
market and sell our products. Our revenue is not contingent upon
resale by the dealer or distributor, and we have no further
obligations related to bringing about resale. Revenues are reported
net of sales taxes collected from Customers.
30
Disaggregation of Revenue
The
following table presents our revenues disaggregated by revenue
source.
Net Revenue
Product and Service Revenue
|
|
For the year ended December 31,
|
|
|
|
2019
|
2018
|
|
SteraMist®
Product
|
$4,999,000
|
$4,652,000
|
|
Service
and Training
|
1,348,000
|
933,000
|
|
Total
|
$6,347,000
|
$5,585,000
|
Revenue by Geographic Region
|
|
For the year ended December 31,
|
|
|
|
2019
|
2018
|
|
United
States
|
$5,002,000
|
$4,197,000
|
|
International
|
1,345,000
|
1,388,000
|
|
Total
|
$6,347,000
|
$5,585,000
|
Product
revenue includes sales from our standard and customized equipment,
solution and accessories sold with our equipment. Revenue is
recognized upon transfer of control of promised products to
customers in an amount that reflects the consideration we expect to
receive in exchange for those products or services.
Service
and training revenue include sales from our high-level
decontamination and service engagements, validation of our
equipment and technology and customer training. Service revenue is
recognized as the agreed upon services are rendered to our
customers in an amount that reflects the consideration we expect to
receive in exchange for those services.
Costs to Obtain a Contract with a Customer
We
apply a practical expedient to expense costs as incurred for costs
to obtain a contract with a customer when the amortization period
would have been one year or less. We generally expense sales
commissions when incurred because the amortization period would
have been one year or less. These costs are recorded within selling
expenses.
Contract Balances
As of
December 31, 2019, and December 31, 2018 we did not have any
unsatisfied performance obligations for (i) contracts with an
original expected length of one year or less and (ii) contracts for
which we recognize revenue at the amount to which we have the right
to invoice for services performed.
Arrangements with Multiple Performance Obligations
Our
contracts with customers may include multiple performance
obligations. We enter into contracts that can include various
combinations of products and services, which are primarily distinct
and accounted for as separate performance obligations.
31
Significant Judgments
Our
contracts with customers for products and services often dictate
the terms and conditions of when the control of the promised
products or services is transferred to the customer and the amount
of consideration to be received in exchange for the products and
services.
Use of Estimates
The
preparation of consolidated financial statements in conformity with
U.S. GAAP requires us to make estimates and assumptions that affect
the amounts reported and disclosed in the accompanying consolidated
financial statements and the accompanying notes. Actual results
could differ materially from these estimates. On an ongoing basis,
we evaluate our estimates, including those related to accounts
receivable, inventory, fair values of financial instruments,
intangible assets, useful lives of intangible assets and property
and equipment, fair values of stock-based awards, income taxes, and
contingent liabilities, among others. We base our estimates on
historical experience and on various other assumptions that are
believed to be reasonable, the results of which form the basis for
making judgments about the carrying values of our assets and
liabilities.
Fair Value Measurements
The
authoritative guidance for fair value measurements defines fair
value as the exchange price that would be received for an asset or
paid to transfer a liability (an exit price) in the principal or
the most advantageous market for the asset or liability in an
orderly transaction between market participants on the measurement
date. Market participants are buyers and sellers in the principal
market that are (i) independent, (ii) knowledgeable, (iii) able to
transact, and (iv) willing to transact. The guidance describes a
fair value hierarchy based on the levels of inputs, of which the
first two are considered observable and the last unobservable, that
may be used to measure fair value, which are the
following:
Level
1:
Quoted prices in
active markets for identical assets or liabilities.
Level
2:
Inputs other than
Level 1 that are observable, either directly or indirectly, such as
quoted prices for similar assets or liabilities; quoted prices in
markets that are not active; or other inputs that are observable or
corroborated by observable market data or substantially the full
term of the assets or liabilities.
Level
3:
Unobservable inputs
that are supported by little or no market activity and that are
significant to the value of the assets or liabilities.
Our
financial instruments include cash and cash equivalents, accounts
receivable, accounts payable, accrued expenses and convertible
debt. All these items were determined to be Level 1 fair value
measurements.
The
carrying amounts of cash and cash equivalents, accounts receivable,
and accounts payable and accrued expenses approximated fair value
because of the short maturity of these instruments. The recorded
value of convertible debt approximates its fair value as the terms
and rates approximate market rates (See Note 8).
Cash and Cash Equivalents
For purposes of the statement of cash flows, cash
and cash equivalents includes cash on hand, held at financial
institutions and other liquid investments with original maturities
of three months or less. At times, these deposits may be in excess
of insured limits.
Accounts Receivable
Our
accounts receivable are typically from credit worthy customers or,
for certain international customers, are supported by pre-payments.
For those customers to whom we extend credit, we perform periodic
evaluations of them and maintain allowances for potential credit
losses as deemed necessary. We have a policy of reserving for
doubtful accounts based on our best estimate of the amount of
potential credit losses in existing accounts receivable. We
periodically review our accounts receivable to determine whether an
allowance is necessary based on an analysis of past due accounts
and other factors that may indicate that the realization of an
account may be in doubt. Account balances deemed to be
uncollectible are charged to the allowance after all means of
collection have been exhausted and the potential for recovery is
considered remote.
32
Inventories
Inventories are
valued at the lower of cost or market using the first-in, first-out
(FIFO) method. Inventories consist primarily of finished
goods.
We
expense costs to maintain certification to cost of goods sold as
incurred.
We
review inventory on an ongoing basis, considering factors such as
deterioration and obsolescence. We record an allowance for
estimated losses when the facts and circumstances indicate that
particular inventories may not be usable.
Property and Equipment
We
account for property and equipment at cost less accumulated
depreciation. We compute depreciation using the straight-line
method over the estimated useful lives of the assets, generally
three to five years. Depreciation for equipment, furniture and
fixtures and vehicles commences once placed in service for its
intended use. Leasehold improvements are amortized using the
straight-line method over the lives of the respective leases or
service lives of the improvements, whichever is
shorter.
Leases
In
February 2016, the FASB issued ASU No. 2016-02 (“ASC
842”), Leases, to
require lessees to recognize all leases, with certain exceptions,
on the balance sheet, while recognition on the statement of
operations will remain similar to current lease accounting.
Subsequently, the FASB issued ASU No. 2018-10, Codification Improvements to Topic 842,
Leases, ASU No. 2018-11, Targeted Improvements, ASU No. 2018-20,
Narrow-Scope Improvements for
Lessors, and ASU 2019-01, Codification Improvements, to clarify
and amend the guidance in ASU No. 2016-02. ASC 842 eliminates real
estate-specific provisions and modifies certain aspects of lessor
accounting. This standard is effective for interim and annual
periods beginning after December 15, 2018, with early adoption
permitted. We adopted ASC 842 as of January 1, 2019 using the
modified retrospective basis with a cumulative effect adjustment as
of that date. In addition, we elected the package of practical
expedients permitted under the transition guidance within the new
standard, which allowed us to carry forward the historical
determination of contracts as leases, lease classification and not
reassess initial direct costs for historical lease arrangements.
Accordingly, previously reported financial statements, including
footnote disclosures, have not been recast to reflect the
application of the new standard to all comparative periods
presented.
Operating lease
assets are included within operating lease right-of-use assets, and
the corresponding operating lease liabilities are recorded as
current portion of long-term operating lease, and within long-term
liabilities as long-term operating lease, net of current portion on
our consolidated balance sheet as of December 31,
2019.
We have
elected not to present short-term leases on the consolidated
balance sheet as these leases have a lease term of 12 months or
less at lease inception and do not contain purchase options or
renewal terms that we are reasonably certain to exercise. All other
lease assets and lease liabilities are recognized based on the
present value of lease payments over the lease term at commencement
date. Because most of our leases do not provide an implicit rate of
return, we used our incremental borrowing rate based on the
information available at adoption date in determining the present
value of lease payments.
Capitalized Software Development Costs
In
accordance with ASC 985-20 regarding the development of software to
be sold, leased, or marketed, the Company expenses such costs as
they are incurred until technological feasibility has been
established, at and after which time those costs are capitalized
until the product is available for general release to customers.
The periodic expense for the amortization of capitalized software
development costs will be included in cost of sales.
Accrued Warranties
Accrued
warranties represent the estimated costs, if any, that will be
incurred during the warranty period of our products. We estimate
the expected costs to be incurred during the warranty period and
record the expense to the consolidated statement of operations at
the date of sale. Our manufacturer assumes the warranty against
product defects for one year from date of sale, which we extend to
our customers upon sale of the product. We assume responsibility
for product reliability and results.
33
Income Taxes
Deferred income tax
assets and liabilities are determined based on differences between
the financial statement reporting and tax bases of assets and
liabilities and are measured using the enacted tax rates and laws
in effect when the differences are expected to reverse. The
measurement of deferred income tax assets is reduced, if necessary,
by a valuation allowance for any tax benefits that are, on a more
likely than not basis, not expected to be realized in accordance
with Accounting Standards Codification (“ASC”) guidance
for income taxes.
Net Loss Per Share
Basic
net loss per share is computed by dividing the Company’s net
loss by the weighted average number of shares of common stock
outstanding during the period presented. Diluted loss per share is
based on the treasury stock method and includes the effect from
potential issuance of shares of common stock, such as shares
issuable pursuant to the exercise of options and warrants and
conversions of preferred stock or debentures.
Equity Compensation Expense
We
account for equity compensation expense in accordance with FASB ASC
718, “Compensation—Stock Compensation.” Under the
provisions of FASB ASC 718, equity compensation expense is
estimated at the grant date based on the award’s fair value
and is recognized as expense over the requisite service
period.
On July
7, 2017, our shareholders approved the 2016 Equity Incentive Plan
(the “2016 Plan”). The 2016 Plan authorizes the grant
of stock options, stock appreciation rights, restricted stock,
restricted stock units and performance units/shares. Up to
5,000,000 shares of common stock are authorized for issuance under
the 2016 Plan. Shares issued under the 2016 Plan may be either
authorized but unissued shares, treasury shares, or any combination
thereof. Provisions in the 2016 Plan permit the reuse or reissuance
by the 2016 Plan of shares of common stock for numerous reasons,
including, but not limited to, shares of common stock underlying
canceled, expired, or forfeited awards of stock-based compensation
and stock appreciation rights paid out in the form of cash. Equity
compensation expense will typically be awarded in consideration for
the future performance of services to us. All recipients of awards
under the 2016 Plan are required to enter into award agreements
with the Company at the time of the award; awards under the 2016
Plan are expressly conditioned upon such agreements.
Concentrations of Credit Risk
Financial
instruments that potentially subject us to significant
concentrations of credit risk consist principally of cash and cash
equivalents. We maintain cash balances at financial institutions
which exceed the current Federal Deposit Insurance Corporation
limit of $250,000 at times during the year.
Long-Lived Assets Including Acquired Intangible Assets
We
assess long-lived assets for potential impairments at the end of
each year, or during the year if an event or other circumstance
indicates that we may not be able to recover the carrying amount of
the asset. In evaluating long-lived assets for impairment, we
measure recoverability of these assets by comparing the carrying
amounts to the future undiscounted cash flows the assets are
expected to generate. If our long-lived assets are considered to be
impaired, the impairment to be recognized equals the amount by
which the carrying value of the asset exceeds its fair market
value. We base the calculations of the estimated fair value of our
long-lived assets on the income approach. For the income approach,
we use an internally developed discounted cash flow model that
includes, among others, the following assumptions: projections of
revenues and expenses and related cash flows based on assumed
long-term growth rates and demand trends; expected future
investments to grow new units; and estimated discount rates. We
base these assumptions on our historical data and experience,
industry projections, micro and macro general economic condition
projections, and our expectations. We had no long-lived asset
impairment charges for the years ended December 31, 2019 and
2018.
Recent Accounting Pronouncements
In
January 2017, the FASB issued ASU No. 2017-04, Simplifying the Test for Goodwill
Impairment, to simplify the test for goodwill impairment
by removing Step 2. An
entity will, therefore, perform the goodwill impairment test by
comparing the fair value of a reporting unit with its carrying
amount, recognizing an
impairment charge for the amount by which the carrying amount
exceeds the fair value, not to exceed the total amount of goodwill
allocated to the reporting unit. An entity still
has the option to perform a qualitative assessment to determine if
the quantitative impairment test is necessary. ASU No. 2017-04 is
effective for interim
and annual periods beginning after December 15, 2019, with early
adoption permitted for interim or annual goodwill impairment tests
performed on testing dates after January 1, 2017. Adoption of ASU
No. 2017-04 is prospective.
Off-Balance Sheet Arrangements
None.
34
Item 7A. QUANTITATIVE AND QUALITATIVE DISCLOSURES ABOUT MARKET
RISK
Not
required.
Item 8. FINANCIAL STATEMENTS AND SUPPLEMENTARY DATA
The financial
statements required by this item are included in Part IV, Item 15
of this Annual Report on Form 10-K, beginning on page F-1, and are
incorporated by reference herein.
Item
9. CHANGES IN AND DISAGREEMENTS WITH ACCOUNTANTS ON
ACCOUNTING AND FINANCIAL DISCLOSURE
None.
Item 9A. CONTROLS AND PROCEDURES
Evaluation of Disclosure Controls and Procedures
Our
management, with the participation of our Principal Executive
Officer and Principal Financial Officer, conducted an evaluation of
the effectiveness of our disclosure controls and procedures (as is
defined in Rules 13a-15(e) and 15d-15(e) under the Exchange Act) as
of the end of the period covered by this Annual Report on Form
10-K. Our disclosure controls and procedures are intended to ensure
that the information we are required to disclose in the reports
that we file or submit under the Exchange Act is (i) recorded,
processed, summarized and reported within the time periods
specified in the SEC’s rules and forms and (ii) accumulated
and communicated to our management, including the Principal
Executive Officer and Principal Financial Officer, to allow timely
decisions regarding required disclosures.
Based
on that evaluation, our Principal Executive Officer and Principal
Financial Officer have concluded that, as of the end of the period
covered by this Annual Report, our disclosure controls and
procedures were effective. Our management has concluded that the
financial statements included in this Annual Report on Form 10-K
present fairly, in all material respects, our financial position,
results of operations and cash flows for the periods presented in
conformity with generally accepted accounting
principles.
Our
disclosure controls and procedures are designed to provide
reasonable assurance of achieving the desired control objectives.
Our management recognizes that any control system, no matter how
well designed and operated, is based upon certain judgments and
assumptions and cannot provide absolute assurance that its
objectives will be met. In addition, the design of disclosure
controls and procedures must reflect the fact that there are
resource constraints and that management is required to apply
judgment in evaluating the benefits of possible controls and
procedures relative to their costs. Similarly, an evaluation of
controls cannot provide absolute assurance that misstatements due
to error or fraud will not occur or that all control issues and
instances of fraud, if any, have been detected.
35
Management’s Annual Report on Internal Control Over Financial
Reporting
Management is
responsible for establishing and maintaining adequate internal
control over our financial reporting (as defined in Rule 13a-15(f)
and 15d-15(f) under the Exchange Act). Internal control over
financial reporting is a process designed to provide reasonable
assurance regarding the reliability of financial reporting and the
preparation of financial statements for external purposes in
accordance with accounting principles generally accepted in the
United States.
Our
internal control over financial reporting includes those policies
and procedures that (i) pertain to the maintenance of records that,
in reasonable detail, accurately and fairly reflect the
transactions and dispositions of our assets, (ii) provide
reasonable assurance that transactions are recorded as necessary to
permit preparation of financial statements in accordance with
accounting principles generally accepted in the United States of
America, and that our receipts and expenditures are being made only
in accordance with authorizations of our management and directors,
and (iii) provide reasonable assurance regarding prevention or
timely detection of unauthorized acquisition, use or disposition of
our assets that could have a material effect on the financial
statements. Because of its inherent limitations, internal control
over financial reporting may not prevent or detect misstatements.
Also, projections of any evaluation of effectiveness to future
periods are subject to the risk that controls may become inadequate
because of changes in conditions, or that the degree of compliance
with the policies or procedures may deteriorate.
Our
management, with the participation of our Principal Chief Executive
Officer and our Principal Chief Financial Officer, conducted an
evaluation of the effectiveness of our internal control over
financial reporting based on the framework in Internal
Control—Integrated
Framework issued by the Committee of Sponsoring Organizations of
the Treadway Commission. Based on this evaluation, our Principal
Chief Executive Officer along with our Principal Chief Financial
Officer concluded that, as of the end of the period covered by this
Annual Report on Form 10-K, our internal control over financial
reporting was effective. Our internal control over financial
reporting was not subject to attestation by our independent
registered public accounting firm as we are not an accelerated
filer, nor a large accelerated filer.
Changes in Internal Control Over Financial Reporting
During
our most recent fiscal quarter, there have been no changes in our
internal control over financial reporting that have materially
affected or are reasonably likely to materially affect our internal
control over financial reporting.
Item 9B. OTHER INFORMATION
None.
36
PART III
Item 10. DIRECTORS, EXECUTIVE OFFICERS AND CORPORATE
GOVERNANCE
Our
directors and executive officers and their ages and positions as of
March 15, 2020 are presented below.
|
Name
|
|
Age
|
|
Position
|
|
Halden S. Shane
|
|
75
|
|
Chief
Executive Officer and Chairman of the
Board
|
|
Elissa J. Shane
|
|
40
|
|
Chief
Operating Officer
|
|
Nick Jennings
|
|
44
|
|
Chief Financial Officer
|
|
Harold W. Paul
|
|
71
|
|
Director, Secretary
|
|
Walter C. Johnsen
|
|
69
|
|
Director
|
|
Kelly J. Anderson
|
|
52
|
|
Director
|
|
Lim Boh Soon
|
|
64
|
|
Director
|
Halden S.
Shane: Dr. Shane has
been our Chief Executive Officer and Chairman of the Board since
October 15, 2007, when we commenced our current operations.
Dr. Shane also served as
President and CEO of Tiger Management International, a private
management company that deals in business management of private and
public companies. Dr. Shane resigned all positions and closed Tiger
Management International in 2009. Dr. Shane was founder and CEO of
Integrated Healthcare Alliance, Inc. and also founder and General
Partner of Doctors Hospital West Covina, California. Prior thereto,
Dr. Shane practiced Podiatric Surgery specializing in ankle
arthroscopy. Dr. Shane received his Bachelor of Science degree
from the University of Miami in 1969, his Bachelor of Medical
Science degree from California College of Podiatric Medicine in
1971, and his Doctor of Podiatric Medicine Degree from the
California College of Podiatric Medicine in 1973. He is Board
Certified by the American Board of Podiatric Surgery, American
Board of Orthopedics, and the American Board of Quality Assurance
and Review. Dr. Shane brings to our Board experience in in the
medical and finance industries.
Elissa J.
Shane:
Ms.
Shane has been our Chief
Operating Officer since January
2018. Previously, she served
as our Chief Regulatory
and Compliance Officer from September 2015 to December 2017
and as our Corporate
Secretary in 2016. From January 2014 to September 2015, Ms. Shane
served as a paralegal with Levi Lubarsky Feigenbaum & Weiss
LLP, where she worked with the firm’s managing
partners and staff attorneys and directed all operational aspects
of the litigation cycle from inception through appeal. From
September 2009 to January 2014, she served as a paralegal with
Olshan Frome Wolosky LLP, where she managed all regulatory and
compliance issues, litigation procedures and advertising and
promotional matters. Ms. Shane received a B.A. in Psychology and
Communications with a minor in Economics from the University of
Southern California in 2001.
Nick Jennings: Mr. Jennings has been
our Chief Financial Officer since October 2014. From July 2014
until his employment by the Company, Mr. Jennings was self-employed
and provided consulting, accounting and tax compliance services to
private-owned companies. From November 2006 until June 2014, Mr.
Jennings was a senior manager at Richardson Kontogouris Emerson
LLP, where he worked with various public and private companies
providing services in a variety of business areas including tax
compliance, tax consulting, general accounting, and business
assurance. He is a graduate of Loyola Marymount College with a
degree in accounting and is a member of the American Institute of
Certified Public Accountants.
Harold W.
Paul: Mr. Paul has
been one of our directors since June 2009 and currently acts as
our Corporate Secretary. He has been engaged in the private
practice of law for more than thirty-five years, primarily as a
securities specialist. Mr. Paul has been company counsel to public
companies listed on the AMEX, NASDAQ and OTC exchanges. He has
served as a director for six public companies in a variety of
industries, including technology and financial services. He holds a
BA degree from SUNY at Stony Brook and a JD from Brooklyn Law
School and is admitted to practice in New York and Connecticut. Mr.
Paul brings to our Board experience as a director of public
companies and with the United States securities
laws.
Walter
C. Johnsen:
Mr. Johnsen has been one of
our directors since January 2016. Since January 1, 2007, Mr.
Johnsen has served as Chairman of the Board and Chief Executive
Officer of Acme United Corporation, a leading worldwide supplier of
innovative branded cutting, measuring and safety products in the
school, home, office, hardware & industrial markets. From
November 30, 1995 to December 31, 2006, he held the titles of
President and Chief Executive Officer at Acme United. Mr. Johnsen
previously served as Vice Chairman and a principal of Marshall
Products, Inc., a medical supply distributor. Mr. Johnsen holds a
Bachelor of Science in Chemical Engineering and a Master of Science
in Chemical Engineering from Cornell University, and a Master of
Business Administration from Columbia University. Mr. Johnsen
brings to our Board experience with business and
operations.
37
Kelly
J. Anderson:
Ms. Anderson has been one
of our directors since January 2016. Ms. Anderson is a partner in C
Suite Financial Partners, a financial consulting services company
dedicated to serving private, public, private equity,
entrepreneurial, family office and government-owned firms in all
industries. Between July 2014 and March 2015, Ms. Anderson was CFO
of Mavenlink, a SaaS company. Between October 2012 and January
2014, Ms. Anderson was Chief Accounting Officer of Fisker
Automotive. Between April 2010 and February 2012, Ms. Anderson was
the President and Chief Financial Officer of T3 Motion, Inc.,
(“T3”), an electric vehicle technology company. Between
March 2008 and April 2010, she served as T3’s Executive Vice
President and Chief Financial Officer, and as a director from
January 2009 until January 2010. From 2006 until 2008, Ms. Anderson
was Vice President at Experian, a leading credit reporting agency.
From 2004 until 2006, Ms. Anderson was Chief Accounting Officer for
TripleNet Properties and its affiliates. From 1996 to 2004, Ms.
Anderson held senior financial positions with The First American
Corp., a Fortune 500 title insurance company. Ms. Anderson is an
inactive California CPA and a 1989 graduate of the College of
Business and Economics at California State University, Fullerton.
Ms. Anderson brings to our Board experience in
finance.
Dr. Lim Boh Soon: Dr. Lim has been one
of our directors since January 2018. Dr. Lim has more than 25 years of experience in
the banking and finance industry. For more than the past five
years, he has been and continues to be a fellow of the Singapore
Institute of Directors, and is currently an independent
non-executive director on the board of two publicly-listed
companies on the Singapore Stock Exchange – since October
2015, he has been a director of Jumbo Group Limited. In addition,
Dr. Lim has worked in various senior management positions for
several regional and multi-national organizations, including UBS
Capital Asia Pacific Limited, The NatSteel Group, Rothschild
Ventures Asia Limited and The Singapore Technologies Group. Dr. Lim
was also a member of the Regional Investment Committee for UBS AG
in Asia. Dr. Lim graduated with a First-Class Honors in Mechanical
Engineering from The University of Strathclyde in the United
Kingdom (formerly The Royal College of Science & Technology) in
1981 and obtained his Doctor of Philosophy in Mechanical
Engineering from The University of Strathclyde in the United
Kingdom in 1985.
Family Relationships
Ms.
Elissa J. Shane, our Chief Operating Officer, is the daughter of
Dr. Halden Shane, our Chief Executive Officer and Chairman of the
Board.
Board Composition
Our Board currently consists of five members. Our bylaws provide
that our directors will hold office until their successors have
been duly elected and qualified. Our Board is responsible for the
business and affairs of our Company and considers various matters
that require its approval. Our executive officers are appointed by
our Board and serve at its discretion.
Scientific Advisory Board
In
February 2017, we approved and announced the formation of the TOMI
Scientific Advisory Board. The Scientific Advisory Board operates
under the terms of a written Advisory Board Charter. The role of TOMI’s Scientific Advisory Board will be
to:
(1)
constructively
challenge and help develop proposals on
strategy;
(2)
attend Scientific Advisory Board
meetings;
(3)
accept
responsibility, publicly and, where necessary, in writing when
required to do so under any act, regulation or code of
conduct;
(4)
scrutinize
the performance of management in meetings, prepare agreed goals and
objectives, and monitor the reporting of performance on
technological and regulatory trends that will impact our
business;
(5)
set
forth our strategic goals with respect to scientific research and
development and liaise with us to ensure we obtain the necessary
resources to meet our objectives, in scientific research and
development;
(6)
devote time to developing and refreshing the
knowledge of our Company’s technology, products and mission
in “Innovating for a Safer World”;
and
(7)
uphold
the highest standards of integrity and probity, and support us in
maintaining the appropriate culture, values and
behaviors.
38
The Scientific Advisory Board consists of the following
members:
Miguel A. Grimaldo, MEng: Miguel A. Grimaldo, MEng is an
Assistant Professor in the Department of Pathology, Director of
Institutional Biocontainment Resources at the University of Texas
Medical Branch (“UTMB”) and the Director of the
Biocontainment Engineering Division for the Galveston National
Laboratory. His responsibilities include the review of all design,
construction, commissioning and operation of High and Maximum
containment laboratories as well as to ensure regulatory compliance
and to conduct ongoing evaluation and recertification on all
critical containment features, equipment and operations for
Biosafety Level 3 (BSL‐3), Animal Biosafety
Level 3 (ABSL-3) and Biosafety Level 4 (BSL-4) laboratory
facilities at UTMB. He is also a member of the UTMB Institutional
Biosafety Committee. He has served as Committee Member for
development of the ANSI Z9.14‐2014
Standard‐
Testing and Performance‐Verification
Methodologies for Ventilation Systems for Biosafety Level 3
(BSL‐3) and
Animal Biosafety Level 3 (ABSL3) facilities as well as for the 2016
Edition of the National Institute of Health (NIH) ‐ Design Requirements
Manual (DRM) for Biomedical Laboratories and Animal Research
Facilities. Mr. Grimaldo routinely serves as Biocontainment Advisor
for containment laboratories nationally and internationally on
design, construction and operations and also routinely contributes
to a technical column in the American Biological Safety Association
(ABSA) journal, Applied Biosafety, entitled, “Containment
Talk”. Mr. Grimaldo obtained his Masters of Engineering from
the University of Louisville and Bachelor of Science degrees in
Agricultural Engineering and Agricultural Economics from Texas
A&M University.
Dr. Helene Paxton, MS, MT(ASCP), PhD,
CIC: Dr. Helene Paxton, MS, MT(ASCP), PhD, CIC, is an
Infection Preventionist, owner of Bio Guidance, LLC, adjunct
biology professor at Rowan University and Director of Infection
Prevention at Saint Francis Healthcare. She is Infection Control
Certified (CIC), board certified as an International Medical
Laboratory Scientist and holds a PhD in Epidemiology. Dr. Paxton
has over 40 years of experience in medical devices and infectious
disease consulting. Dr. Paxton obtained her PhD from Kennedy
Western University and her MS from Bowling Green State
University.
Audit Committee
Our
Audit Committee was established in June 2009 and currently is
comprised of Ms. Anderson, Mr. Paul and Dr. Lim. Ms. Anderson serves as chairperson of the Audit
Committee. The Company relies on the exemption related to Mr.
Paul’s lack of standing as a financial expert, since a
majority of the Audit Committee was comprised of financial experts
and does not believe the committee composition materially affects
its ability to act independently. The Audit Committee
operates under a written charter, which is available at
http://investor.tomimist.com/corporate-governance/audit-committee-charter.
The purpose of the Audit Committee is to assist the Board in
monitoring the integrity of the annual, quarterly and other
financial statements of the Company, the independent
auditor’s qualifications and independence, the performance of
the Company’s independent auditors and the compliance by the
Company with legal and regulatory requirements. The Audit Committee
also reviews and approves all related-party transactions. Our Board
has determined that Ms. Anderson is an “audit committee
financial expert” as defined by the regulations promulgated
by the SEC.
Code of Ethics
The
Board adopted a Code of Ethics in 2008 that applies to, among other
persons, Board members, officers (including our Chief Executive
Officer), contractors, consultants and advisors. Our Code of
Ethics, which is available at
http://investor.tomimist.com/corporate-governance/code-of-ethics,
sets forth written standards designed to deter wrongdoing and to
promote:
1.
honest and ethical
conduct including the ethical handling of actual or apparent
conflicts of interest between personal and professional
relationships;
2.
full, fair,
accurate, timely and understandable disclosure in reports and
documents that we file with or submit to the SEC and in other
public communications made by us;
3.
compliance with
applicable governmental laws, rules and regulations;
4.
the prompt internal
reporting of violations of the Code of Ethics to an appropriate
person or persons identified in the Code of Ethics;
and
5.
accountability for
adherence to the Code of Ethics.
39
Item 11. EXECUTIVE COMPENSATION
Summary Compensation Table
The
following table sets forth the total compensation paid to or earned
by our named executive officers for the years ended December 31,
2019 and 2018, respectively:
|
Name and
Principal Position
|
Year
|
Salary
($)
|
Bonus
($)
|
Stock
Awards
($)
(1)
|
Option/
Warrant
Awards
($) (1)
|
All
Other
Compensation
($)
|
Total
($)
|
|
|
|
|
|
|
|
|
|
|
Halden S.
Shane
|
2019
|
360,000
|
—
|
—
|
89,654(2)
|
—
|
449,654
|
|
Chairman and CEO
(2)
|
2018
|
360,000
|
40,000(7)
|
—
|
17,932(3)
|
—
|
417,932
|
|
|
|
|
|
|
|
|
|
|
Elissa J. Shane
(4)
|
2019
|
200,000
|
7,500(7)
|
—
|
23,595(4)
|
9,000(4)
|
240,095
|
|
COO
|
2018
|
200,000
|
20,000(7)
|
—
|
36,474(5)
|
9,000(4)
|
265,474
|
|
|
|
|
|
|
|
|
|
|
Nick Jennings
(6)
|
2019
|
155,000
|
5,000(7)
|
—
|
4,483(6)
|
—
|
164,483
|
|
CFO
|
2018
|
155,000
|
10,000(7)
|
—
|
—
|
—
|
165,000
|
|
(1)
|
The
amounts shown in this column represent the aggregate grant date
fair value of stock, option and/or warrant award, as applicable,
granted during the year computed in accordance with FASB ASC Topic
718. See Note 2 of the notes to our audited consolidated financial
statements contained in this Annual Report on Form 10-K for a
discussion of valuation assumptions made in determining the grant
date fair value of the awards.
|
|
(2)
|
During
the year ended December 31, 2019, we issued Dr. Shane five-year
warrant to purchase an aggregate of 1,000,000 shares of common stock as executive
compensation. The exercise price of the warrant was $0.10
per share, based on the three-day trailing VWAP on the date of
issuance. Utilizing the Black-Scholes pricing model, we determined
the fair value of the warrants issued to Dr. Shane was
approximately $90,000, with the following assumptions: volatility,
143%; expected dividend yield, 0%; risk free interest rate, 2.58%;
and a life of 5 years. The grant date fair value of each share of
common stock underlying the warrants was $0.09. We recognized
equity-based compensation to Dr. Shane of approximately $90,000 on
the warrants during the year ended December 31, 2019 pursuant to an employment agreement. Please
refer to Item 11 Employment Agreements for additional details of
Dr. Shane’s annual compensation.
|
|
(3)
|
During
the year ended December 31, 2018, we issued Dr. Shane five-year
warrants to purchase an aggregate of 250,000 shares of common stock
as executive compensation. The exercise price of the warrant was
$0.08 per share, based on the three-day trailing VWAP on the date
of issuance. Utilizing the Black-Scholes pricing model, we
determined the fair value of the warrants issued to Dr. Shane was
approximately $18,000, with the following assumptions: volatility,
142%; expected dividend yield, 0%; risk free interest rate, 2.95%;
and a life of 5 years. The grant date fair value of each share of
common stock underlying the warrants was $0.07. We recognized
equity-based compensation to Dr. Shane of approximately $18,000 on
the warrants during the year ended December 31, 2018.
|
|
(4)
|
During
the year ended December 31, 2019, we accrued the value of Ms.
Shane's options to purchase an aggregate of 250,000 shares of
common stock as executive compensation. The exercise price of the
option was $0.10 and $0.12 per share. Utilizing the Black-Scholes
pricing model, we determined the fair value of the option issued to
Ms. Shane was approximately $24,000, with the following
assumptions: volatility, 135%; expected dividend yield, 0%; risk
free interest rate, 1.64%; and a life of 5 years. The grant date
fair value of each share of common stock underlying the options was
$0.09 and $0.10. We recognized equity-based compensation to Ms.
Shane of approximately $24,000 on the options during the year ended
December 31, 2019. The other compensation in the amount of $9,000
represents an auto allowance pursuant to Ms. Shane’s
employment agreement. Please refer to
Item 11 Employment Agreements for additional details of Ms.
Shane’s annual compensation.
|
|
(5)
|
In connection with the execution of Ms. Shane’s employment
agreement, on January 5, 2018, we issued her an option under the
2016 Plan to purchase 100,000 shares of common stock. The exercise
price of the option was $0.12 per share, based on the closing price
of our common stock on the date of issuance. Utilizing the
Black-Scholes pricing model, we determined the fair value of the
option issued to Ms. Shane was approximately $12,000, with the
following assumptions: volatility, 146%; expected dividend yield,
0%; risk free interest rate, 2.27%; and a life of 5 years. The
grant date fair value of each share of common stock underlying the
option was $0.12. In addition, pursuant to her employment
agreement, on January 3, 2019, we issued her an option under the
2016 Plan to purchase 250,000 shares of common stock. The exercise
price of the option was $0.11 per share, based on the closing price
of our common stock on the date of issuance. Utilizing the
Black-Scholes pricing model, we determined the fair value of the
option issued to Ms. Shane was approximately $25,000, with the
following assumptions: volatility, 144%; expected dividend yield,
0%; risk free interest rate, 2.47%; and a life of 5 years. The
grant date fair value of each share of common stock underlying the
option was $0.10. The option was accrued for as of December 31,
2018. We recognized total equity-based compensation to Ms. Shane of
approximately $37,000 on the options during the year ended December
31, 2018.
|
|
(6)
|
During
the year ended December 31, 2019, we issued Mr. Jennings options to
purchase an aggregate of 50,000 shares of common stock as executive
compensation. The exercise price of the option was $0.10 per share.
Utilizing the Black-Scholes pricing model, we determined the fair
value of the option issued to Mr. Jennings was approximately
$4,000, with the following assumptions: volatility, 143%; expected
dividend yield, 0%; risk free interest rate, 2.58%; and a life of 5
years. The grant date fair value of each share of common stock
underlying the options was $0.09. We recognized equity-based
compensation to Mr. Jennings of approximately $4,000 on the options
during the year ended December 31, 2019. Please refer to Item 11
Employment Agreement for additional details of Mr. Jennings’
annual compensation.
|
|
(7)
|
In
December 2018, the compensation committee approved cash bonuses to
the CEO, COO and CFO which were paid in 2019.
In
December 2019, the compensation committee approved cash bonuses to
the COO and CFO which were paid in 2019.
|
40
Outstanding Equity Awards at 2019 Fiscal Year-End
The
following table sets forth certain information with respect to
outstanding warrants to purchase common stock previously awarded to
our named executive officers as of December 31, 2019.
|
|
Option
Awards
|
||||
|
Name
|
Number of
Securities
Underlying
Unexercised
Warrants/Options
Exercisable
(#)
|
Number of
Securities
Underlying
Unexercised
Warrants/Options
Unexercisable
(#)
|
Equity Incentive
Plan
Awards: Number
of
Securities
Underlying
Unexercised
Unearned Warrants
(#)
|
Warrant Exercise
Price
($)
|
Warrant
Expiration Date
|
|
Halden S.
Shane
|
2,000,000(1)
|
—
|
—
|
$0.30
|
2/11/2020-2/11/2021
|
|
|
250,000(2)
|
—
|
—
|
$0.50
|
3/31/2021
|
|
|
250,000(3)
|
—
|
—
|
$0.42
|
6/30/2021
|
|
|
250,000(4)
|
—
|
—
|
$0.32
|
9/30/2021
|
|
|
250,000(5)
|
—
|
—
|
$0.27
|
12/30/2021
|
|
|
250,000(8)
|
—
|
—
|
$0.10
|
7/17/2022
|
|
|
3,500,000(9)
|
—
|
—
|
$0.12
|
12/22/2022
|
|
|
250,000(11)
|
—
|
—
|
$0.08
|
11/19/2023
|
|
|
1,000,000(12)
|
—
|
—
|
$0.10
|
1/26/2024
|
|
Elissa J.
Shane
|
100,000(10)
|
—
|
—
|
$0.12
|
1/5/2023
|
|
Nick
Jennings
|
200,000(6)
|
—
|
—
|
$0.30
|
10/1/2020-10/1/2021
|
|
|
100,000(7)
|
—
|
—
|
$0.55
|
1/26/2021
|
(1)
Warrants vested in
increments of 1,000,000 on 2/11/2015 and 2/11/2016 and have a term
of 5 years
(2)
Warrants vested on
3/31/2016 and have a term of 5 years
(3)
Warrants vested on
6/30/2016 and have a term of 5 years
(4)
Warrants vested on
9/30/2016 and have a term of 5 years
(5)
Warrants vested on
12/30/2016 and have a term of 5 years
(6)
Warrants vested in
increments of 100,000 on 10/1/2015 and 10/1/2016 and have a term of
5 years
(7)
Warrants vested on
1/26/2016 and have a term of 5 years
(8)
Warrants vested on
7/17/2017 and have a term of 5 years
(9)
Warrants vested on
12/22/2017 and have a term of 5 years
(10)
Options vested on
1/5/2018 and have a term of 5 years
(11)
Warrants vested on
11/19/2018 and have a term of 5 years
(12)
Warrants vested on
1/26/2019 and have a term of 5
years
41
Employment Agreements, Termination of Employment and
Change-in-Control Arrangements
Except
as described below, we currently have no employment agreements with
any of our executive officers, nor any compensatory plans or
arrangements resulting from the resignation, retirement or any
other termination of any of our executive officers, from a
change-in-control, or from a change in any executive
officer’s responsibilities following a
change-in-control.
Employment Agreements
We have
entered into employment agreements with each of the named executive
officers and generally include the named executive officer’s
initial base salary and an indication of equity compensation
opportunities.
Halden S. Shane
On January 15, 2016, we
entered into an employment agreement
with Dr. Shane, effective January 1, 2016. The agreement
provides for a base annual salary of $360,000. The agreement
also provides for the quarterly issuance of an option to purchase
250,000 shares of common stock in 2016 with an
exercise price equal to the three-day trailing volume weighted
average price of our common stock. In the event Dr.
Shane is terminated for any reason or becomes disabled or dies, any
options he holds at such time will become cashless and will be
entitled to piggyback registration and exercise immediately. Dr.
Shane is also entitled to performance bonuses, subject to the
achievement of certain objectives, including (i) a minimum
semi-annual grant of stock options to purchase up to 250,000 shares
of common
stock and (ii) a cash bonus,
determined in the sole discretion of the Board. The agreement also
provides that we will reimburse Dr. Shane for certain business and
entertainment expenses, including the use of an
automobile.
In the event Dr. Shane
is terminated as CEO as a result of a change in control, Dr. Shane
will be entitled to a lump sum payment of two year’s salary
at the time of such termination and will be granted an option to
purchase 3,000,000 shares of common stock that are cashless and,
when exercised, will have piggyback registration or demand
registration rights, and if applicable, any and all outstanding
stock grants will be accelerated and be fully
vested.
The Board may terminate Dr. Shane for cause by written notification
to Dr. Shane; provided, however, that no termination for cause will
be effective unless Dr. Shane has been provided with prior written
notice and opportunity for remedial action and fails to remedy
within 30 days thereof, in the event of a termination by the
Company (i) by reason of willful dishonesty towards, fraud upon, or
deliberate injury or attempted injury to, the Company, (ii) by
reason of material breach of his employment agreement and (iii) by
reason of gross negligence or intentional misconduct with respect
to the performance of duties under the agreement. Upon termination
for cause, Dr. Shane will be immediately paid an amount equal to
his gross salary. The Board may terminate Dr. Shane other than for
cause at any time upon giving notice to Dr. Shane. Upon such
termination, Dr. Shane will be immediately paid an amount equal to
his gross salary.
Elissa J. Shane
On January 5, 2018, in connection with her
appointment as our Chief
Operating Officer, we entered into an employment agreement with Elissa J.
Shane, effective January 1,
2018. Pursuant to her
employment agreement, Ms. Shane will receive an annual base salary
of at least $200,000, subject to annual review and discretionary
increase by the Compensation Committee of the Board. Ms. Shane is
eligible to receive an annual cash bonus and other annual incentive
compensation, and the agreement
provides that we will issue Ms.
Shane annually an option to purchase at least 250,000 shares of
common stock pursuant to the 2016 Plan. Additionally, in connection
with the execution of her
employment agreement, on January 5, 2018, we issued Ms. Shane an option under the 2016 Plan
to purchase 100,000 shares of common stock at an exercise price of $0.12 per
share. Her employment agreement
also provides that we will
reimburse Ms. Shane for reasonable and necessary business and
entertainment expenses that she incurs in performing her duties.
During the term of her employment, Ms. Shane will also be entitled
to up to four weeks of paid vacation time annually, which will
accrue up to six weeks, and to participate in our benefit plans and programs, including but not
limited to all group health, life, disability and retirement plans.
Ms. Shane is also entitled to the sum of $750 per month as a
vehicle allowance. The initial term of her employment agreement is three years, which may
be automatically extended for successive one-year terms, unless
either party provides the other with 120 days’ prior written notice of its intent to
terminate the agreement.
Nick Jennings
On
September 2, 2015, we entered into a new employment agreement with
Mr. Jennings, which superseded his prior agreement, pursuant to
which he continues to serve as our Chief Financial Officer. Mr.
Jennings’ annual salary is $132,000, which is reviewed
annually. On January 26, 2016, we issued Mr. Jennings a five-year
warrant to purchase up to 100,000 shares of common stock at an
exercise price of $0.55 per share. The agreement also provided for
the issuance of an additional five-year warrant to purchase 100,000
shares of common stock in 2016, however, this provision was
modified to grant a salary increase in lieu of the options. In
January 2018, Mr. Jennings’ annual salary was increased to
$155,000 per year. Mr. Jennings is also entitled to additional
equity compensation based upon superior performance of his
responsibilities, as determined by the Board in its sole
discretion. The agreement also
provides that we will reimburse Mr. Jennings for certain business
and entertainment expenses. In the event of a change in
control of the Company that results in his termination, Mr.
Jennings will be entitled to a lump sum payment of one year’s
salary and all equity awards will be accelerated and fully vested.
In the event his employment is terminated other than for cause, Mr.
Jennings will receive an amount equal to his annual salary as of
such termination date after the second employment
anniversary.
42
Director Compensation
Each of our
non-employee directors receives cash fees and stock as compensation
for their service on the Board and the committees of the Board on
which they are a member. The tables below set forth
cash and
stock compensation earned by each non-employee director during the
fiscal year ended December 31, 2019.
|
Name
|
Fees earned or
paid in cash
($)
|
Stock awards
($)
|
Option awards
($)
|
Other Compensation
($)
|
Total
($)
|
|
Harold
W. Paul (1)
|
40,000
|
11,000
|
—
|
72,000
|
123,000
|
|
Walter
Johnsen (2)
|
40,000
|
11,000
|
—
|
—
|
51,000
|
|
Kelly
Anderson (3)
|
45,000
|
11,000
|
—
|
—
|
56,000
|
|
Lim
Boh Soon (4)
|
40,000
|
11,000
|
—
|
—
|
51,000
|
(1)
Mr. Paul also
received $72,000 in cash compensation in exchange for legal
services rendered during 2019. In January 2019, we issued Mr. Paul
100,000 shares of common stock that were valued at
$11,000.
(2)
Mr. Johnsen was
elected to the Board on January 29, 2016. The term of his
agreement as director commenced on February 1, 2016 for up to two
years and until a successor is elected, or resignation or
removal. Our agreement with Mr. Johnsen provides for an annual
fee in the amount of $40,000 paid on a quarterly basis and an
annual grant of shares of common stock. In January 2019, we
issued Mr. Johnsen 100,000 shares of common stock that were valued
at $11,000.
(3)
Ms. Anderson was
elected to the Board on January 29, 2016 and serves as the
chairperson of our Audit Committee. The term of her agreement
as director commenced on February 1, 2016 for up to two years and
until a successor is elected, or resignation or removal. Our
agreement with Ms. Anderson provides for an annual fee in the
amount of $45,000 paid on a quarterly basis and an annual grant of
shares of common stock. In January 2019, we issued Ms.
Anderson 100,000 shares of common stock that were valued at
$11,000.
(4)
Mr. Lim was elected to the Board
on January 29, 2018. The term of his agreement as director
commenced on February 1, 2018 for up to three years and until a
successor is elected, or resignation or removal. Our agreement
with Mr. Lim provides for an annual fee in the amount of $40,000
paid on a quarterly basis and an annual grant of shares of common
stock. In January 2019, we issued Mr. Lim 100,000 shares of
common stock that were valued at $11,000.
43
Item 12. SECURITY OWNERSHIP OF CERTAIN
BENEFICIAL OWNERS AND MANAGEMENT ANDRELATED STOCKHOLDER
MATTERS
Equity
Compensation Plan
Information
We
currently maintain one compensation plan: the 2016 Plan. The 2016
Plan was approved by the Board on January 29, 2016 and received
shareholder approval on July 7, 2017. The 2016 Plan authorizes the
issuance of 5,000,000 shares of common stock. On August 25, 2015,
the Board terminated the 2008 Plan, which we had maintained
previously and which our shareholders had approved. Accordingly, we
will issue future awards under the 2016 Plan.
The following table
provides information as of December 31, 2019 with respect to
compensation plans under which our equity securities
are authorized for issuance.
|
Plan Category
|
Number of securities to
be issued upon exercise of
outstanding options, warrants
and rights
|
Weighted-average exercise
price of outstanding options,
warrants and rights
|
Number of securities
remaining available for future
issuance under equity
compensation plans(3)
|
|
Equity
compensation plans approved by security holders
|
620,000(1)
|
$0.32
|
3,480,000
|
|
Equity
compensation plans not approved by security
holders
|
11,625,000(2)
|
$0.40
|
—
|
|
Total
|
12,245,000
|
$0.36
|
—
|
|
(1)
|
Prior
to August 25, 2015, we granted awards under the 2008
Plan.
|
|
(2)
|
Represents
shares of common stock issuable upon the exercise of warrants
issued to executive officers, employees and consultants in exchange
for services rendered.
|
|
(3)
|
On July
7, 2017, the 2016 Plan received shareholder approval, which permits
the grant up to 5,000,000 shares of common stock
|
Security
Ownership of Certain Beneficial Owners and Management
The following table sets forth certain information with respect to
the beneficial ownership of our common stock and Series A preferred
stock (together, “Voting Stock”) as of March 24, 2020
for:
●
each person (or group of affiliated persons) known by us to be the
beneficial owner of more than 5% of our outstanding shares of
common stock or Series A preferred stock;
●
each of our directors and nominees for election to the
Board;
●
each of the executive officers named in the summary compensation
table; and
●
all of our directors and executive officers as a
group.
We have determined beneficial ownership in accordance with the
rules of the SEC. Except as indicated by the footnotes below, we
believe, based on the information furnished to us, that the persons
and entities named in the following table have sole voting and
investment power with respect to all shares of Voting Stock that
they beneficially own, subject to applicable community property
laws.
Applicable percentage ownership is based on 133,
517,083 shares
of common stock and 510,000 shares of Series A preferred stock
outstanding at March 24, 2020. In computing the number of shares of
Voting Stock beneficially owned by a person and the percentage
ownership of that person, we deemed to be outstanding all shares of
Voting Stock subject to options, warrants or other convertible
securities held by that person or entity that are currently
exercisable or releasable or that will become exercisable or
releasable within 60 days of March 24, 2020. We did not deem
these shares outstanding, however, for the purpose of computing the
percentage ownership of any other person. Except as otherwise
noted, the address of each person or entity in the following table
is c/o TOMI Environmental Solutions, Inc., 9454 Wilshire Blvd.,
Penthouse, Beverly Hills, CA 90212.
44
|
|
Shares
Beneficially Owned
|
|
|||
|
|
Common
Stock
|
Series A
Preferred Stock
|
|
||
|
|
Shares
|
% of
Class
|
Shares
|
% of
Class
|
% of
Total VotingPower(1)
|
|
Named
Executive Officers and Directors:
|
|
|
|
|
|
|
Halden S. Shane,
CEO and Chairman of the Board
|
28,595,048(2)
|
20. 0%
|
510,000
|
100%
|
20.3%
|
|
Elissa J. Shane,
Chief Operating Officer
|
2,491,310(3)
|
1.7%
|
|
|
1.7%
|
|
Nick Jennings,
Chief Financial Officer
|
462,145(4)
|
*
|
—
|
—
|
*
|
|
Harold W. Paul,
Secretary, Director
|
1,559,774(5)
|
1.1%
|
—
|
—
|
1.1%
|
|
Walter Johnsen,
Director
|
350,000(6)
|
*
|
—
|
—
|
*
|
|
Kelly Anderson,
Director
|
350,000(7)
|
*
|
—
|
—
|
*
|
|
Lim Boh Soon,
Director
|
790,190(8)
|
*
|
—
|
—
|
*
|
|
All current
directors and executive officers as a group (7
persons)
|
34,598,467(9)
|
24. 2%
|
510,000
|
100%
|
24.5%
|
|
|
|
|
|
|
|
|
5%
Beneficial Owners:
|
|
|
|
|
|
|
Lau Sok
Huy
|
17,361,111(10)
|
13.0%
|
—
|
—
|
13.0%
|
|
Ah Kee
Wee
|
11,666,669(11)
|
8.7%
|
—
|
—
|
8.7%
|
*
Denotes ownership of less than 1%
|
(1)
|
Percentage of total voting power represents voting power with
respect to all shares of our common stock and Series A preferred
stock, as a single class. The holders of common stock
and Series A preferred
stock are each entitled to one vote per share.
|
|
(2)
|
Consists
of (i) 18,845,048 shares of common stock held of record by Dr.
Shane, (ii) 1,500,000 shares of common stock held of record by the
Shane Family Trust, (iii) 1,000,000 shares of common stock held of
record by Belinha Shane and (iv) 8,250,000 shares of common stock issuable upon the
exercise of warrants to purchase common stock held by Dr. Shane
that are exercisable within 60 days of March 24, 2020. Dr.
Shane is a co-trustee of the Shane Family Trust and may be
deemed to share voting and investment power over the securities
held by the trust. Belinha Shane is Dr. Shane’s wife. Dr.
Shane disclaims ownership of such shares held by his wife, except
to the extent of his pecuniary interest.
|
|
(3)
|
Consists
of (i) 1,891,310 shares of common stock held of record by Ms. Shane
and (ii) 600,000 shares of common stock issuable upon the
exercise of options to purchase common stock held by Ms. Shane
that are exercisable within 60 days of March 24, 2020.
|
|
(4)
|
Consists
of (i) 112,145 shares of common stock held of record by Mr.
Jennings and (ii) 350,000 shares of common stock issuable upon the
exercise of warrants and options to purchase common stock held by Mr.
Jennings that are exercisable within 60 days of March 24,
2020.
|
|
(5)
|
Consists of (i) 1,514,774 shares of common stock
held of record by Mr. Paul
and (ii) 45,000 shares of common stock issuable upon exercise of
stock options that are exercisable within 60 days of March
24, 2020.
|
|
(6)
|
Consists of (i) 325,000 shares of common stock held of record by Mr. Johnsen and (ii)
25,000 shares of common stock issuable upon exercise of stock
options that are exercisable within 60 days of March 24,
2020.
|
|
(7)
|
Consists of (i) 325,000 shares of common stock held of record by Ms. Anderson and (ii)
25,000 shares of common stock issuable upon exercise of stock
options that are exercisable within 60 days of March 24,
2020.
|
|
(8)
|
Consists of 790,190 shares of common stock held of record by Dr.
Lim.
|
|
(9)
|
Consists
of (i) 25,303,467 shares of common stock, (ii) 8,550,000 shares of
common stock
issuable upon the exercise of warrants to purchase common stock and
(iii) 745,000 shares of common stock issuable upon
exercise of stock options that are exercisable within 60 days of
March 24, 2020.
|
|
(10)
|
Based
on Form 3 filed with the SEC by Lau Sok Huy on January 24,
2018.
|
|
(11)
|
Based
on information reported by Mr. Wee to the Company. Consists of
(i) 8,666,669 shares of common stock and (ii) 3,000,000 shares of
common stock issuable upon the exercise of warrants to purchase
common stock held by Mr. Wee that are exercisable within 60 days of
March 24, 2020.
|
45
Changes in Control
We are
unaware of any contract or other arrangement the operation of which
may at a subsequent date result in a change in control of our
Company.
Item
13. CERTAIN RELATIONSHIPS AND RELATED TRANSACTIONS, AND DIRECTOR
INDEPENDENCE
Transactions with Related Persons
None.
Independence of the Board
Based
upon information submitted by Mr. Johnsen, Ms. Anderson, Dr. Lim
and Mr. Paul the Board has determined that each of them is
“independent” for purposes of OTC Governance Guidelines
for directors. Mr. Shane is not an independent director. No
director will be considered “independent” unless the
Board affirmatively determines that the director has no direct or
indirect material relationship with the Company.
Our
Board has three separate standing committees: the Audit Committee,
the Compensation Committee and the Nominating and Corporate
Governance Committee.
We have
made each of our committee charters available on our website at
http://investor.tomimist.com/.
Item 14. PRINCIPAL ACCOUNTING FEES AND SERVICES
Accountant Fees
The
following table presents the aggregate fees billed for audit and
other services provided by our independent registered public
accounting firm, Wolinetz, Lafazan & Company, P.C, during the
2019 and 2018 fiscal years:
|
|
For the Fiscal
Years Ended December 31,
|
|
|
|
2019
|
2018
|
|
Audit Fees
(1)
|
$122,000
|
$108,000
|
|
Audit-Related Fees
(2)
|
—
|
—
|
|
Tax Fees
(3)
|
—
|
—
|
|
All Other Fees
(4)
|
—
|
—
|
|
Total
|
$122,000
|
$108,000
|
(1)
Audit Fees- Audit fees represent the professional services rendered
for the audit of our annual financial statements and the review of
our financial statements included in quarterly reports, along with
services normally provided by the accounting firm in connection
with statutory and regulatory filings or engagements.
(2)
Audit-Related Fees- Audit-related fees represent professional
services rendered for assurance and related services by Wolinetz,
Lafazan & Company, P.C. that were reasonably related to the
performance of the audit or review of our financial statements that
are not reported under audit fees.
(3)
Tax Fees- Tax fees represent professional services rendered by the
accounting firm for tax compliance, tax advice, and tax
planning.
(4)
All Other Fees- All other fees represent fees billed for products
and services provided by Wolinetz, Lafazan & Company, P.C other
than the services reported for the other categories.
Pre-Approval Policies and Procedures of the
Audit Committee
Consistent with the
rules and regulations promulgated by the Securities and Exchange
Commission, the Audit Committee approves the engagement of our
independent registered public accounting firm and is also required
to pre-approve all audit and non-audit expenses. All of the
services described above were approved by the Audit Committee in
accordance with its procedure. We do not otherwise rely on
pre-approval policies and procedures.
46
PART IV
Item 15.
EXHIBITS AND FINANCIAL STATEMENT SCHEDULES
(a)
Documents filed as part of this report:
(1)
Financial Statements. See Index to Financial Statements and
Schedule on page F-1.
(2)
Schedules to Financial Statements. All financial statement
schedules have been omitted because they are either inapplicable or
the information required is provided in our consolidated financial
statements and the related notes thereto, included in Part II,
Item 8 of this Annual Report on Form 10-K.
(3) The
exhibits listed on the accompanying Exhibit Index are filed (or
incorporated by reference herein) as part of this Annual Report on
Form 10-K.
47
SIGNATURES
Pursuant to the
requirements of Section 13 or 15(d) of the Securities Exchange
Act of 1934, the registrant has duly caused this report to be
signed on its behalf by the undersigned, thereunto duly
authorized.
|
|
TOMI ENVIRONMENTAL SOLUTIONS,
INC.
|
||
|
|
|
|
|
|
Date: March 30,
2020
|
By:
|
/s/ Halden S.
Shane
|
|
|
|
|
Halden S.
Shane
|
|
|
|
|
Chairman of the
Board and Chief Executive Officer
(Principal
Executive Officer)
|
|
POWER OF ATTORNEY
The
undersigned directors and officers of TOMI Environmental Solutions,
Inc. constitute and appoint Halden S. Shane and Nick Jennings, or
either of them, as their true and lawful attorney and agent with
power of substitution, to do any and all acts and things in our
name and behalf in our capacities as directors and officers and to
execute any and all instruments for us and in our names in the
capacities indicated below, which said attorney and agent may deem
necessary or advisable to enable said corporation to comply with
the Securities Exchange Act of 1934, as amended, and any rules,
regulations and requirements of the Securities and Exchange
Commission, in connection with this Annual Report on Form 10-K,
including specifically but without limitation, power and authority
to sign for us or any of us in our names in the capacities
indicated below, any and all amendments hereto; and we do hereby
ratify and confirm all that said attorney and agent shall do or
cause to be done by virtue hereof. Pursuant to the requirements of
the Securities Exchange Act of 1934, this report has been signed
below by the following persons on behalf of the registrant and in
the capacities and on the dates indicated.
|
|
|
|
|
Signature
|
Title
|
Date
|
|
|
|
|
|
/s/ HALDEN S.
SHANE
|
Chairman of the
Board and Chief Executive Officer (Principal Executive
Officer)
|
March 30,
2020
|
|
Halden
S. Shane
|
|
|
|
|
|
|
|
/s/ NICK JENNINGS
|
Chief Financial
Officer (Principal Financial Officer and Principal Accounting
Officer)
|
March 30,
2020
|
|
Nick
Jennings
|
|
|
|
|
|
|
|
/s/ HAROLD W.
PAUL
|
Director
|
March 30,
2020
|
|
Harold
W. Paul
|
|
|
|
/s/ WALTER C.
JOHNSEN
|
Director
|
March 30,
2020
|
|
Walter
C. Johnsen
|
|
|
|
/s/ KELLY J.
ANDERSON
|
Director
|
March 30,
2020
|
|
Kelly
J. Anderson
|
|
|
|
/s/ LIM BOH
SOON
|
Director
|
March 30,
2020
|
|
Lim
Boh Soon
|
|
|
48
EXHIBIT INDEX
|
Exhibit Number
|
|
Description of Exhibit
|
|
Form
|
|
File No.
|
|
Date
|
|
Exhibit
|
|
Filed
Herewith
|
|
|
Articles
of Restatement of the Registrant, effective October 6,
2009
|
|
S-1
|
|
333-162356
|
|
10/6/09
|
|
3.1
|
|
|
|
|
|
Articles
of Amendment of Articles of Incorporation of the Registrant,
effective October 24, 2011
|
|
8-K
|
|
000-09908
|
|
10/24/11
|
|
3.1(a)
|
|
|
|
|
|
Amended
Bylaws of the Registrant, adopted effective November 2,
2007
|
|
10-Q
|
|
000-09908
|
|
5/16/16
|
|
3.2
|
|
|
|
|
|
Amendment
to Amended Bylaws of the Registrant, adopted effective January 29,
2016
|
|
8-K
|
|
000-09908
|
|
2/1/16
|
|
3.2
|
|
|
|
|
|
2016
Equity Incentive Plan, as adopted by the Registrant’s Board
of Directors on January 29, 2016
|
|
10-Q
|
|
000-09908
|
|
5/16/16
|
|
10.6
|
|
|
|
|
|
Offer
Letter, dated January 15, 2016, by and between the Registrant and
Dr. Halden Shane
|
|
10-Q
|
|
000-09908
|
|
5/16/16
|
|
10.1
|
|
|
|
|
|
Employment
Agreement, dated February 8, 2016, by and between the Registrant
and Robert Wotczak
|
|
10-Q
|
|
000-09908
|
|
5/16/16
|
|
10.2
|
|
|
|
|
|
Offer
Letter, dated September 2, 2015, by and between the Registrant and
Nick Jennings
|
|
10-Q
|
|
000-09908
|
|
5/16/16
|
|
10.3
|
|
|
|
|
|
Offer
Letter, dated September 2, 2015, by and between the Registrant and
Norris Gearhart
|
|
10-Q
|
|
000-09908
|
|
5/16/16
|
|
10.4
|
|
|
|
|
|
Form of
Appointment to the Board of Directors as Independent Director of
the Registrant
|
|
10-Q
|
|
000-09908
|
|
5/16/16
|
|
10.5
|
|
|
|
|
|
Restated
Manufacturing and Development Agreement, dated November 10, 2016,
by and between the Registrant and RG Group
|
|
10-Q
|
|
000-09908
|
|
9/30/16
|
|
10.1
|
|
|
|
|
|
Employment
Agreement, entered into as of January 5, 2018, by and between the
Registrant and Elissa J. Shane, effective as of January 1,
2018
|
|
8-K
|
|
000-09908
|
|
1/18/18
|
|
10.1
|
|
|
|
|
|
Code of
Ethics
|
|
10-K
|
|
000-09908
|
|
3/31/07
|
|
14
|
|
|
|
|
|
Subsidiaries
of the Registrant
|
|
|
|
|
|
|
|
|
|
X
|
|
|
24.1
|
|
Power
of Attorney (included in signature page)
|
|
|
|
|
|
|
|
|
|
X
|
|
|
Certification
of Chief Executive Officer pursuant to Rule 13a-14(a) or
Rule 15d-14(a) of the Securities Exchange Act of 1934, as
amended, as adopted pursuant to Section 302 of the Sarbanes-Oxley
Act of 2002
|
|
|
|
|
|
|
|
|
|
X
|
|
|
|
Certification
of Chief Financial Officer pursuant to Rule 13a-14(a) or
Rule 15d-14(a) of the Securities Exchange Act of 1934, as
amended, as adopted pursuant to Section 302 of the Sarbanes-Oxley
Act of 2002
|
|
|
|
|
|
|
|
|
|
X
|
|
|
32.1#
|
|
Certifications
of Chief Executive Officer and Chief Financial Officer pursuant to
18 U.S.C. Section 1350, as adopted pursuant to Section 906 of the
Sarbanes-Oxley Act of 2002
|
|
|
|
|
|
|
|
|
|
X
|
|
101.INS
|
|
XBRL
Instance Document
|
|
|
|
|
|
|
|
|
|
X
|
|
101.SCH
|
|
XBRL
Taxonomy Extension Schema
|
|
|
|
|
|
|
|
|
|
X
|
|
101.CAL
|
|
XBRL
Taxonomy Extension Calculation Linkbase
|
|
|
|
|
|
|
|
|
|
X
|
|
101.DEF
|
|
XBRL
Taxonomy Extension Definition Linkbase
|
|
|
|
|
|
|
|
|
|
X
|
|
101.LAB
|
|
XBRL
Taxonomy Extension Label Linkbase
|
|
|
|
|
|
|
|
|
|
X
|
|
101.PRE
|
|
XBRL
Taxonomy Extension Presentation Linkbase
|
|
|
|
|
|
|
|
|
|
X
|
|
+
|
Indicates
a management contract or compensatory plan.
|
|
#
|
The
information in Exhibit 32.1 shall not be deemed “filed”
for purposes of Section 18 of the Securities Exchange Act of 1934,
as amended, or the Exchange Act, or otherwise subject to the
liabilities of that section, nor shall they be deemed incorporated
by reference in any filing under the Securities Act of 1933, as
amended, or the Exchange Act (including this report), unless the
Registrant specifically incorporates the foregoing information into
those documents by reference.
|
49
TOMI ENVIRONMENTAL SOLUTIONS, INC.
INDEX TO CONSOLIDATED FINANCIAL STATEMENTS
|
|
|
|
Page
|
|
|
Report
of Independent Registered Public Accounting
Firm.
|
F-2
|
|
Consolidated
Balance Sheets as of December 31, 2019 and
2018
|
F-3
|
|
Consolidated
Statements of Operations for the Years Ended December 31, 2019
and 2018
|
F-4
|
|
Consolidated
Statements of Shareholders’ Equity for the Years Ended
December 31, 2019 and 2018
|
F-5
|
|
Consolidated
Statements of Cash Flows for the Years Ended December 31, 2019
and 2018
|
F-6
|
|
Notes
to Consolidated Financial Statements
|
F-8
|
F-1
Report of Independent Registered Public Accounting
Firm
To the
shareholders and the board of directors of
TOMI
Environmental Solutions, Inc.
Opinion on the Consolidated Financial Statements
We have
audited the accompanying consolidated balance sheets of TOMI
Environmental Solutions, Inc. and subsidiary (the "Company") as of
December 31, 2019 and 2018, the related consolidated statements of
operations, shareholders’ equity, and cash flows for each of
the two years in the period ended December 31, 2019, and the
related notes (collectively referred to as the "consolidated
financial statements"). In our opinion, the consolidated financial
statements present fairly, in all material respects, the financial
position of the Company as of December 31, 2019 and 2018, and the
results of their operations and their cash flows for each of the
two years in the period ended December 31, 2019, in conformity with
accounting principles generally accepted in the United States of
America.
Basis for Opinion
These
consolidated financial statements are the responsibility of the
Company's management. Our responsibility is to express an opinion
on the Company's consolidated financial statements based on our
audits. We are a public accounting firm registered with the Public
Company Accounting Oversight Board (United States) ("PCAOB") and
are required to be independent with respect to the Company in
accordance with the U.S. federal securities laws and the applicable
rules and regulations of the Securities and Exchange Commission and
the PCAOB.
We
conducted our audits in accordance with the standards of the PCAOB.
Those standards require that we plan and perform the audit to
obtain reasonable assurance about whether the consolidated
financial statements are free of material misstatement, whether due
to error or fraud. The Company is not required to have, nor were we
engaged to perform, an audit of its internal control over financial
reporting. As part of our audits, we are required to obtain an
understanding of internal control over financial reporting, but not
for the purpose of expressing an opinion on the effectiveness of
the Company’s internal control over financial reporting.
Accordingly, we express no such opinion.
Our
audits included performing procedures to assess the risks of
material misstatement of the consolidated financial statements,
whether due to error or fraud, and performing procedures that
respond to those risks. Such procedures included examining, on a
test basis, evidence regarding the amounts and disclosures in the
consolidated financial statements. Our audits also included
evaluating the accounting principles used and significant estimates
made by management, as well as evaluating the overall presentation
of the consolidated financial statements. We believe that our
audits provide a reasonable basis for our opinion.
WOLINETZ, LAFAZAN
& COMPANY, P.C.
We have
served as the Company's auditor since 2007.
Rockville
Centre, New York
March
30, 2020
F-2
TOMI
ENVIRONMENTAL SOLUTIONS, INC.
CONSOLIDATED BALANCE SHEET
|
ASSETS
|
|
|
|
|
Current
Assets:
|
December
31,
2019
|
December
31,
2018
|
|
|
Cash and Cash
Equivalents
|
$897,223
|
$2,004,938
|
|
|
Accounts Receivable
- net
|
1,494,658
|
2,145,622
|
|
|
Inventories (Note
3)
|
2,315,214
|
2,682,014
|
|
|
Deposits
|
141,052
|
109,441
|
|
|
Prepaid
Expenses
|
187,664
|
301,797
|
|
|
Total
Current Assets
|
5,035,811
|
7,243,812
|
|
|
|
|
|
|
|
Property and
Equipment – net (Note 4)
|
1,367,864
|
1,588,591
|
|
|
|
|
|
|
|
Other
Assets:
|
|
|
|
|
Intangible Assets
– net (Note 5)
|
939,010
|
1,235,816
|
|
|
Operating Lease -
Right of Use Asset (Note - 6)
|
674,471
|
-
|
|
|
Capitalized
Software Development Costs - net (Note 7)
|
94,278
|
-
|
|
|
Other
Assets
|
114,033
|
11,395
|
|
|
Total
Other Assets
|
1,821,792
|
1,247,211
|
|
|
Total
Assets
|
$8,225,467
|
$10,079,614
|
|
|
|
|
|
|
|
LIABILITIES AND SHAREHOLDERS’ EQUITY
|
|
|
|
|
|
|
|
|
|
Current
Liabilities:
|
|
|
|
|
Accounts
Payable
|
$713,222
|
$1,133,649
|
|
|
Accrued
Expenses and Other Current Liabilities (Note 13)
|
450,112
|
415,199
|
|
|
Accrued
Officers Compensation
|
-
|
70,000
|
|
|
Accrued
Interest (Note 8)
|
66,667
|
66,667
|
|
|
Customer
Deposits
|
-
|
1,486
|
|
|
Current
Portion of Long-Term Operating Lease
|
71,510
|
-
|
|
|
Deferred
Rent
|
-
|
13,215
|
|
|
Convertible Notes Payable, net of discount of $0
|
|
|
|
|
at
December 31, 2019 (Note 8)
|
5,000,000
|
-
|
|
|
Total
Current Liabilities
|
6,301,511
|
1,700,216
|
|
|
|
|
|
|
|
Long-Term
Liabilities:
|
|
|
|
|
Long-Term
Operating Lease, Net of Current Portion (Note 6)
|
1,034,413
|
-
|
|
|
Deferred
Rent and Tenant Improvement Allowances
|
-
|
401,734
|
|
|
Convertible Notes Payable, net of discount of $17,534
at
|
|
|
|
|
December
31, 2018 (Note 8)
|
-
|
4,982,466
|
|
|
Total
Long-Term Liabilities
|
1,034,413
|
5,384,200
|
|
|
Total
Liabilities
|
7,335,924
|
7,084,416
|
|
|
|
|
|
|
|
Commitments
and Contingencies
|
-
|
-
|
|
|
|
|
|
|
|
Shareholders’
Equity:
|
|
|
|
|
Cumulative
Convertible Series A Preferred Stock;
|
|
|
|
|
par value $0.01 per
share, 1,000,000 shares authorized; 510,000 shares
issued
|
|||
|
and
outstanding at December 31, 2019 and December 31, 2018
|
5,100
|
5,100
|
|
|
Cumulative
Convertible Series B Preferred Stock; $1,000 stated
value;
|
|
|
|
|
7.5%
Cumulative dividend; 4,000 shares authorized; none
issued
|
|
|
|
|
and
outstanding at December 31, 2019 and December 31, 2018
|
-
|
-
|
|
|
Common
stock; par value $0.01 per share, 250,000,000 and
200,000,000
shares
authorized at December 31, 2019 and December 31, 2018,
respectively;
|
|
|
|
|
124,700,418
and 124,290,418 shares issued and outstanding
|
|
|
|
|
at
December 31, 2019 and December 31, 2018, respectively.
|
1,247,004
|
1,242,904
|
|
|
Additional
Paid-In Capital
|
43,136,683
|
42,948,705
|
|
|
Accumulated
Deficit
|
(43,499,244)
|
(41,201,511)
|
|
|
Total
Shareholders’ Equity
|
889,543
|
2,995,198
|
|
|
Total Liabilities
and Shareholders’ Equity
|
$8,225,467
|
$10,079,614
|
|
The accompanying notes are an integral part of the consolidated
financial statements.
F-3
TOMI ENVIRONMENTAL SOLUTIONS, INC.
CONSOLIDATED STATEMENT OF OPERATIONS
|
|
For the Years
Ended
|
|
|
|
December
31,
|
|
|
|
2019
|
2018
|
|
|
|
|
|
Sales,
net
|
$6,347,160
|
$5,584,612
|
|
Cost
of Sales
|
2,433,243
|
2,467,114
|
|
Gross
Profit
|
3,913,917
|
3,117,498
|
|
|
|
|
|
Operating
Expenses:
|
|
|
|
Professional
Fees
|
363,789
|
329,674
|
|
Depreciation
and Amortization
|
716,165
|
634,671
|
|
Selling
Expenses
|
1,654,564
|
1,360,430
|
|
Research
and Development
|
340,582
|
916,003
|
|
Equity
Compensation Expense (Note 9)
|
114,222
|
77,242
|
|
Consulting
Fees
|
126,693
|
140,858
|
|
General
and Administrative
|
2,681,146
|
2,728,840
|
|
Total Operating
Expenses
|
5,997,161
|
6,187,718
|
|
Loss from
Operations
|
(2,083,244)
|
(3,070,220)
|
|
|
|
|
|
Other Income
(Expense):
|
|
|
|
Gain
on Redemption of Convertible Note
|
-
|
150,000
|
|
Amortization
of Debt Discounts
|
(17,534)
|
(38,091)
|
|
Induced
Conversion Costs
|
-
|
(57,201)
|
|
Interest
Income
|
3,045
|
6,928
|
|
Interest
Expense
|
(200,000)
|
(221,878)
|
|
Total Other Income
(Expense)
|
(214,489)
|
(160,242)
|
|
|
|
|
|
Net
Loss
|
$(2,297,733)
|
$(3,230,462)
|
|
|
|
|
|
Loss Per Common
Share
|
|
|
|
Basic
and Diluted
|
$(0.02)
|
$(0.03)
|
|
|
|
|
|
|
|
|
|
Basic and Diluted
Weighted Average Common Shares Outstanding
|
124,690,062
|
123,574,672
|
The accompanying
notes are an integral part of the consolidated financial
statements.
F-4
TOMI ENVIRONMENTAL SOLUTIONS, INC.
CONSOLIDATED STATEMENT OF SHAREHOLDERS’ EQUITY
FOR THE YEARS ENDED DECEMBER 31, 2019 AND 2018
|
|
Series A
Preferred
|
Common
Stock
|
|
|
|
||
|
|
|
|
|
|
Additional
Paid
|
Accumulated
|
Total
Shareholders’
|
|
|
Shares
|
Amount
|
Shares
|
Amount
|
in Capital
|
Deficit
|
Equity
|
|
Balance
at December 31, 2017
|
510,000
|
$5,100
|
122,049,958
|
$1,220,499
|
$42,139,675
|
$(37,971,049)
|
$5,394,225
|
|
|
|
|
|
|
|
|
|
|
Equity
Compensation
|
|
|
|
|
31,522
|
|
31,522
|
|
Common
Stock Issued for Services Provided
|
|
|
362,500
|
3,625
|
33,875
|
|
37,500
|
|
Conversion
of Notes Payable and Accrued Interest into Common
Stock
|
|
|
1,877,960
|
18,780
|
686,432
|
|
705,212
|
|
Induced
Conversion Costs
|
|
|
|
|
57,201
|
|
57,201
|
|
Net
Loss for the year ended December 31, 2018
|
|
|
|
|
|
(3,230,461)
|
(3,230,461)
|
|
Balance
at December 31, 2018
|
510,000
|
5,100
|
124,290,418
|
1,242,904
|
42,948,705
|
(41,201,510)
|
2,995,198
|
|
|
|
|
|
|
|
|
|
|
Equity
Compensation
|
|
|
|
|
146,878
|
|
146,878
|
|
Common
Stock Issued for Services Provided
|
|
|
410,000
|
4,100
|
41,100
|
|
45,200
|
|
Net
Loss for the year ended December 31, 2019
|
|
|
|
|
|
(2,297,733)
|
(2,297,733)
|
|
Balance
at December 31, 2019
|
510,000
|
$5,100
|
124,700,418
|
$1,247,004
|
$43,136,683
|
$(43,499,243)
|
$889,543
|
The accompanying
notes are an integral part of the consolidated financial
statements.
F-5
TOMI
ENVIRONMENTAL SOLUTIONS, INC.
CONSOLIDATED STATEMENT OF CASH FLOWS
|
|
For the Year Ended December 31,
|
|
|
|
2019
|
2018
|
|
Cash
Flow From Operating Activities:
|
|
|
|
Net
Loss
|
$(2,297,733)
|
$(3,230,462)
|
|
Adjustments
to Reconcile Net Loss to
|
|
.
|
|
Net
Cash Used In Operating Activities:
|
|
|
|
Depreciation
and Amortization
|
716,165
|
634,671
|
|
Amortization
of Lease Liability
|
157,315
|
-
|
|
Amortization
of Debt Discount
|
17,534
|
38,091
|
|
Amortization
of Software Costs
|
31,426
|
-
|
|
Equity
Compensation Expense
|
114,222
|
31,522
|
|
Value
of Equity Issued for Services
|
45,200
|
37,500
|
|
Induced
Conversion Costs
|
-
|
57,201
|
|
Reserve
for Bad Debt
|
(190,000)
|
(200,000)
|
|
Inventory
Reserve
|
-
|
100,000
|
|
Gain
on Redemption of Convertible Note
|
-
|
(150,000)
|
|
Changes
in Operating Assets and Liabilities:
|
|
|
|
Decrease
(Increase) in:
|
|
|
|
Accounts
Receivable
|
840,964
|
(109,673)
|
|
Inventory
|
348,226
|
629,023
|
|
Prepaid
Expenses
|
78,269
|
(88,170)
|
|
Deposits
|
(31,611)
|
(109,441)
|
|
Security
Deposits
|
-
|
(6,695)
|
|
Other
Assets
|
(154,330)
|
-
|
|
Increase
(Decrease) in:
|
|
|
|
Accounts
Payable
|
(420,427)
|
381,919
|
|
Accrued
Expenses
|
67,569
|
148,063
|
|
Accrued
Interest
|
-
|
(8,122)
|
|
Accrued
Officer Compensation
|
(70,000)
|
70,000
|
|
Deferred
Rent
|
-
|
9,168
|
|
Customer
Deposits
|
(1,486)
|
(1,576)
|
|
Lease
Liability
|
(65,753)
|
-
|
|
|
|
|
|
Net
Cash Used in Operating Activities
|
(814,451)
|
(1,766,980)
|
|
|
|
|
|
Cash
Flow From Investing Activities:
|
|
|
|
Capitalized
Software Costs
|
(125,704)
|
-
|
|
Capitalized
Patent Costs
|
(21,980)
|
-
|
|
Purchase
of Property and Equipment
|
(145,580)
|
(628,085)
|
|
Net
Cash Used in Investing Activities
|
(293,264)
|
(628,085)
|
The
accompanying notes are an integral part of the consolidated
financial statements.
F-6
TOMI ENVIRONMENTAL SOLUTIONS, INC.
CONSOLIDATED STATEMENT OF CASH FLOWS – CONTINUED
|
|
For the Year Ended December 31,
|
|
|
|
2019
|
2018
|
|
Cash
Flow From Financing Activities:
|
|
|
|
Repayment
of Principal Balance on Convertible Note
|
$-
|
$(150,000)
|
|
Net Cash Used in
Financing Activities
|
-
|
(150,000)
|
|
Decrease
In Cash and Cash Equivalents
|
(1,107,715)
|
(2,545,065)
|
|
Cash
and Cash Equivalents - Beginning
|
2,004,938
|
4,550,003
|
|
Cash
and Cash Equivalents – Ending
|
$897,223
|
$2,004,938
|
|
|
|
|
|
Supplemental
Cash Flow Information:
|
|
|
|
Cash
Paid for Interest
|
$200,000
|
$230,000
|
|
Cash
Paid for Income Taxes
|
$800
|
$800
|
|
Non-Cash
Investing and Financing Activities:
|
|
|
|
Accrued
Equity Compensation
|
$32,656
|
$-
|
|
Transfer of
equipment from inventory to property and equipment
|
$18,574
|
$107,846
|
|
Patent and
Trademark Costs Reclassified from Other Assets to Intangible
Assets, net
|
$51,692
|
$56,792
|
|
Establishment
of Tenant Improvement Allowance
|
$-
|
$405,000
|
|
Abandonment
of Fully Depreciated Property and Equipment
|
$-
|
$66,428
|
|
Conversion
of Convertible Note Payable and Accrued Interest into Common
Stock
|
$-
|
$705,212
|
The accompanying notes are an integral part of the consolidated
financial statements.
F-7
TOMI ENVIRONMENTAL SOLUTIONS, INC.
NOTES TO CONSOLIDATED FINANCIAL STATEMENTS
NOTE 1. DESCRIPTION OF BUSINESS
TOMI
Environmental Solutions, Inc., a Florida corporation
(“TOMI”, the “Company”, “we”,
“our” and “us”) is a global provider of
disinfection and decontamination essentials through its premier
Binary Ionization Technology®
(BIT™)
platform, under which it manufactures, licenses, services and sells
its SteraMist® brand of
products, including SteraMist® BIT™, a
hydrogen peroxide-based mist and fog.
Invented under a defense grant in association with
the Defense Advanced Research Projects Agency (DARPA) of the U.S.
Department of Defense, BIT™ is
registered with the U.S. Environmental Protection Agency
(“EPA”) and uses a low
percentage hydrogen peroxide as its only active ingredient to
produce a fog composed mostly of a hydroxyl radical
(.OH
ion), known as ionized Hydrogen Peroxide
(“iHP™”).
Represented by the SteraMist® brand of products, iHP™
produces a germ-killing aerosol that
works like a visual non-caustic gas.
TOMI’s
products are designed to service a broad spectrum of commercial
structures, including, but not limited to, hospitals and medical
facilities, bio-safety labs, pharmaceutical facilities, meat and
produce processing facilities, universities and research
facilities, vivarium labs, all service industries including cruise
ships, office buildings, hotel and motel rooms, schools,
restaurants, military barracks, police and fire departments, and
athletic facilities. TOMI products are also used in
single-family homes and multi-unit residences.
TOMI’s
mission is to help its customers create a healthier world through
its product line in its divisions (Healthcare, Life Sciences, TOMI
Service Network and Food Safety).
NOTE 2. SUMMARY OF SIGNIFICANT ACCOUNTING POLICIES
Principles of Consolidation
The
accompanying consolidated financial statements include the accounts
of TOMI and its wholly-owned subsidiary, TOMI Environmental
Solutions, Inc., a Nevada corporation. All significant intercompany
accounts and transactions have been eliminated in
consolidation.
Reclassification of Accounts
Certain
reclassifications have been made to prior-year comparative
financial statements to conform to the current year presentation.
These reclassifications had no effect on previously reported
results of operations or financial position.
Use of Estimates
The
preparation of consolidated financial statements in conformity with
U.S. GAAP requires us to make estimates and assumptions that affect
the amounts reported and disclosed in the accompanying consolidated
financial statements and the accompanying notes. Actual results
could differ materially from these estimates. On an ongoing basis,
we evaluate our estimates, including those related to accounts
receivable, inventory, fair values of financial instruments,
intangible assets, useful lives of intangible assets and property
and equipment, fair values of stock-based awards, income taxes, and
contingent liabilities, among others. We base our estimates on
historical experience and on various other assumptions that are
believed to be reasonable, the results of which form the basis for
making judgments about the carrying values of our assets and
liabilities.
F-8
Fair Value Measurements
The
authoritative guidance for fair value measurements defines fair
value as the exchange price that would be received for an asset or
paid to transfer a liability (an exit price) in the principal or
the most advantageous market for the asset or liability in an
orderly transaction between market participants on the measurement
date. Market participants are buyers and sellers in the principal
market that are (i) independent, (ii) knowledgeable, (iii) able to
transact, and (iv) willing to transact. The guidance describes a
fair value hierarchy based on the levels of inputs, of which the
first two are considered observable and the last unobservable, that
may be used to measure fair value, which are the
following:
Level
1:
Quoted prices in
active markets for identical assets or liabilities.
Level 2:
Inputs other than
Level 1 that are observable, either directly or indirectly, such as
quoted prices for similar assets or liabilities; quoted prices in
markets that are not active; or other inputs that are observable or
corroborated by observable market data or substantially the full
term of the assets or liabilities.
Level
3:
Unobservable inputs
that are supported by little or no market activity and that are
significant to the value of the assets or liabilities.
Our
financial instruments include cash and cash equivalents, accounts
receivable, accounts payable, accrued expenses and convertible
debt. All these items were determined to be Level 1 fair value
measurements.
The
carrying amounts of cash and cash equivalents, accounts receivable,
and accounts payable and accrued expenses approximated fair value
because of the short maturity of these instruments. The recorded
value of convertible debt approximates its fair value as the terms
and rates approximate market rates (See Note 8).
Cash and Cash Equivalents
For purposes of the statement of cash flows, cash
and cash equivalents includes cash on hand, held at financial
institutions and other liquid investments with original maturities
of three months or less. At times, these deposits may be in excess
of insured limits.
Accounts Receivable
Our
accounts receivable are typically from credit worthy customers or,
for certain international customers, are supported by pre-payments.
For those customers to whom we extend credit, we perform periodic
evaluations of them and maintain allowances for potential credit
losses as deemed necessary. We have a policy of reserving for
doubtful accounts based on our best estimate of the amount of
potential credit losses in existing accounts receivable. We
periodically review our accounts receivable to determine whether an
allowance is necessary based on an analysis of past due accounts
and other factors that may indicate that the realization of an
account may be in doubt. Account balances deemed to be
uncollectible are charged to the allowance after all means of
collection have been exhausted and the potential for recovery is
considered remote. Bad debt expense for the years ended December
31, 2019 and 2018 was $32,721 and $96,929,
respectively.
At
December 31, 2019 and December 31, 2018, the allowance for doubtful
accounts was $110,000 and $300,000,
respectively.
As of December 31, 2019, three customers accounted for 37% of
accounts receivable.
As of December 31, 2018, two customers accounted for 37% of
accounts receivable. One customer accounted for 13% of net revenues
for the year ended December 31, 2018.
Inventories
Inventories are
valued at the lower of cost or market using the first-in, first-out
(FIFO) method. Inventories consist primarily of finished
goods.
We
expense costs to maintain certification to cost of goods sold as
incurred.
We
review inventory on an ongoing basis, considering factors such as
deterioration and obsolescence. We record an allowance for
estimated losses when the facts and circumstances indicate that
particular inventories may not be usable. Our reserve for obsolete
inventory was $100,000 as of December 31, 2019 and
2018.
F-9
Property and Equipment
We
account for property and equipment at cost less accumulated
depreciation. We compute depreciation using the straight-line
method over the estimated useful lives of the assets, generally
three to five years. Depreciation for equipment, furniture and
fixtures and vehicles commences once placed in service for its
intended use. Leasehold improvements are amortized using the
straight-line method over the lives of the respective leases or
service lives of the improvements, whichever is
shorter.
Leases
In
February 2016, the FASB issued ASU No. 2016-02 (“ASC
842”), Leases, to
require lessees to recognize all leases, with certain exceptions,
on the balance sheet, while recognition on the statement of
operations will remain similar to current lease accounting.
Subsequently, the FASB issued ASU No. 2018-10, Codification Improvements to Topic 842,
Leases, ASU No. 2018-11, Targeted Improvements, ASU No. 2018-20,
Narrow-Scope Improvements for
Lessors, and ASU 2019-01, Codification Improvements, to clarify
and amend the guidance in ASU No. 2016-02. ASC 842 eliminates real
estate-specific provisions and modifies certain aspects of lessor
accounting. This standard is effective for interim and annual
periods beginning after December 15, 2018, with early adoption
permitted. We adopted ASC 842 as of January 1, 2019 using the
modified retrospective basis with a cumulative effect adjustment as
of that date. In addition, we elected the package of practical
expedients permitted under the transition guidance within the new
standard, which allowed us to carry forward the historical
determination of contracts as leases, lease classification and not
reassess initial direct costs for historical lease arrangements.
Accordingly, previously reported financial statements, including
footnote disclosures, have not been recast to reflect the
application of the new standard to all comparative periods
presented.
Operating lease
assets are included within operating lease right-of-use assets, and
the corresponding operating lease liabilities are recorded as
current portion of long-term operating lease, and within long-term
liabilities as long-term operating lease, net of current portion on
our consolidated balance sheet as of December 31,
2019.
We have
elected not to present short-term leases on the consolidated
balance sheet as these leases have a lease term of 12 months or
less at lease inception and do not contain purchase options or
renewal terms that we are reasonably certain to exercise. All other
lease assets and lease liabilities are recognized based on the
present value of lease payments over the lease term at commencement
date. Because most of our leases do not provide an implicit rate of
return, we used our incremental borrowing rate based on the
information available at adoption date in determining the present
value of lease payments.
Adoption of the new
lease standard on January 1, 2019 had a material impact on our
consolidated balance sheet. The most significant impacts related to
the recognition of right-of-use ("ROU") asset of $714,421 and lease
liability of $678,556 for our operating lease on the consolidated
balance sheet. We also reclassified prepaid expenses of $35,865 and
deferred rent balance, including tenant improvement allowances, and
other liability balances of $414,949 relating to our existing lease
arrangements as of December 31, 2018, into the ROU asset balance as
of January 1, 2019. ROU assets represent our right to use an
underlying asset for the lease term and lease liabilities represent
our obligation to make lease payments arising from the lease. The
standard did not materially impact our consolidated statement of
operations and consolidated statement of cash flows.
The
cumulative effect of the changes made to our consolidated balance
sheet as of January 1, 2019 for the adoption of the new lease
standard was as follows:
|
|
Balances at
December 31,
2018
|
Effect of Adoption
of New Lease Standard
|
Balances at
January 1,
2019
|
|
Assets
|
|
|
|
|
Prepaid
Expenses
|
$301,797
|
$(35,865)
|
$265,932
|
|
Operating
Lease Right of Use Asset
|
$-
|
$714,421
|
$714,421
|
|
Liabilities
|
|
|
|
|
Deferred
Rent
|
$13,215
|
$(13,215)
|
$-
|
|
Current
Portion of Long-Term Operating Lease
|
$-
|
$-
|
$-
|
|
Deferred
Rent and Tenant Improvement Allowances
|
$401,734
|
$(401,734)
|
$-
|
|
Long-Term
Operating Lease, Net of Current Portion
|
$-
|
$1,093,505
|
$1,093,505
|
|
Shareholders’ Equity
|
|
|
|
|
Accumulated
Deficit
|
$(41,201,511)
|
$-
|
$(41,201,511)
|
|
|
|
|
|
F-10
Capitalized Software Development Costs
In
accordance with ASC 985-20 regarding the development of software to
be sold, leased, or marketed, the Company expenses such costs as
they are incurred until technological feasibility has been
established, at and after which time those costs are capitalized
until the product is available for general release to customers.
The periodic expense for the amortization of capitalized software
development costs will be included in cost of sales. Amortization
expense for the year ended December 31, 2019 was
$31,426.
Accounts
Payable
As of December 31, 2019, one vendor accounted for approximately 40%
of accounts payable. As of December 31, 2018, three vendors
accounted for approximately 63% of accounts payable
One vendor accounted for 72% and 70% of cost of sales for the years
ended December 31, 2019 and 2018, respectively.
Accrued Warranties
Accrued
warranties represent the estimated costs, if any, that will be
incurred during the warranty period of our products. We estimate
the expected costs to be incurred during the warranty period and
record the expense to the consolidated statement of operations at
the date of sale. Our manufacturer assumes the warranty against
product defects for one year from date of sale, which we extend to
our customers upon sale of the product. We assume responsibility
for product reliability and results. As of December 31, 2019, and
2018, our warranty reserve was $30,000.
Income Taxes
Deferred income tax
assets and liabilities are determined based on differences between
the financial statement reporting and tax bases of assets and
liabilities and are measured using the enacted tax rates and laws
in effect when the differences are expected to reverse. The
measurement of deferred income tax assets is reduced, if necessary,
by a valuation allowance for any tax benefits that are, on a more
likely than not basis, not expected to be realized in accordance
with Accounting Standards Codification (“ASC”) guidance
for income taxes. Net deferred tax benefits have been fully
reserved at December 31, 2019 and 2018. The effect on deferred
income tax assets and liabilities of a change in tax rates is
recognized in the period that such tax rate changes are
enacted.
Net Loss Per Share
Basic
net loss per share is computed by dividing the Company’s net
loss by the weighted average number of shares of common stock
outstanding during the period presented. Diluted loss per share is
based on the treasury stock method and includes the effect from
potential issuance of shares of common stock, such as shares
issuable pursuant to the exercise of options and warrants and
conversions of preferred stock or debentures.
Potentially
dilutive securities as of December 31, 2019 consisted of 9,259,250 shares of
common stock from convertible debentures, 17,240,523 shares of
common stock issuable upon exercise of outstanding warrants,
620,000 shares of common stock issuable upon outstanding options
and 510,000 shares of common stock issuable upon conversion of
outstanding shares of Preferred A stock (“Convertible Series
A Preferred Stock”). Diluted and basic weighted average
shares are the same, as potentially dilutive shares are
anti-dilutive.
Potentially
dilutive securities as of December 31, 2018 consisted of 9,259,250
shares of common stock from convertible debentures, 26,550,611
shares of common stock issuable upon exercise of outstanding
warrants, 320,000 shares of common stock issuable upon outstanding
options and 510,000 shares of common stock issuable upon conversion
of outstanding shares of Preferred A stock (“Convertible
Series A Preferred Stock”). Diluted and basic weighted
average shares are the same, as potentially dilutive shares are
anti-dilutive.
Diluted
net loss per share is computed similarly to basic net loss per
share except that the denominator is increased to include the
number of additional shares of common stock that would have been
outstanding if the potential shares of common stock had been issued
and if such additional shares were dilutive. Options, warrants,
preferred stock and shares associated with the conversion of debt
to purchase approximately 27.6 million and 36.6 million shares of
common stock were outstanding at December 31, 2019 and December 31,
2018, respectively, but were excluded from the computation of
diluted net loss per share due to the anti-dilutive effect on net
loss per share.
F-11
|
|
For the Year Ended December 31,
|
|
|
|
2019
|
2018
|
|
|
|
|
|
Net
loss
|
$(2,297,733)
|
$(3,230,462)
|
|
Adjustments
for convertible debt - as converted
|
|
|
|
Interest
on convertible debt
|
200,000
|
221,878
|
|
Amortization
of debt discount on convertible debt
|
17,534
|
38,091
|
|
Net
loss attributable to common shareholders
|
$(2,080,199)
|
$(2,970,473)
|
|
Weighted
average number of shares of common stock outstanding:
|
|
|
|
Basic
and diluted
|
124,690,062
|
123,574,672
|
|
Net
loss attributable to common shareholders per share:
|
|
|
|
Basic
and diluted
|
$(0.02)
|
$(0.02)
|
Revenue Recognition
We
recognize revenue in accordance with Financial Accounting Standards
Board (“FASB”) Accounting Standards Update
(“ASU”) No. 2014-09, Revenue from Contracts with
Customers (Topic 606). The Company recognizes revenue when we
transfer promised goods or services to customers in an amount that
reflects the consideration to which we expect to be entitled in
exchange for those goods or services. To determine revenue
recognition for contracts with customers we perform the following
five steps: (i) identify the contract(s) with a customer; (ii)
identify the performance obligation(s) in the contract; (iii)
determine the transaction price; (iv) allocate the transaction
price to the performance obligation(s) in the contract; and (v)
recognize revenue when (or as) we satisfy the performance
obligation(s). At contract inception, we assess the goods or
services promised within each contract, assess whether each
promised good or service is distinct and identify those that are
performance obligations.
The
Company must use judgment to determine: a) the number of
performance obligations based on the determination under step (ii)
above and whether those performance obligations are distinct from
other performance obligations in the contract; b) the transaction
price under step (iii) above; and c) the stand-alone selling price
for each performance obligation identified in the contract for the
allocation of transaction price in step (iv) above.
Title
and risk of loss generally pass to our customers upon shipment. Our
Customers include end users as well as dealers and distributors who
market and sell our products. Our revenue is not contingent upon
resale by the dealer or distributor, and we have no further
obligations related to bringing about resale. Revenues are reported
net of sales taxes collected from Customers.
F-12
Disaggregation of Revenue
The
following table presents our revenues disaggregated by revenue
source.
Net Revenue
Product and Service Revenue
|
|
For the year ended December 31,
|
|
|
|
2019
|
2018
|
|
SteraMist
Product
|
$4,999,000
|
$4,652,000
|
|
Service
and Training
|
1,348,000
|
933,000
|
|
Total
|
$6,347,000
|
$5,585,000
|
Revenue by Geographic Region
|
|
For the year ended December 31,
|
|
|
|
2019
|
2018
|
|
United
States
|
$5,002,000
|
$4,197,000
|
|
International
|
1,345,000
|
1,388,000
|
|
Total
|
$6,347,000
|
$5,585,000
|
Product
revenue includes sales from our standard and customized equipment,
solution and accessories sold with our equipment. Revenue is
recognized upon transfer of control of promised products to
customers in an amount that reflects the consideration we expect to
receive in exchange for those products or services.
Service
and training revenue include sales from our high-level
decontamination and service engagements, validation of our
equipment and technology and customer training. Service revenue is
recognized as the agreed upon services are rendered to our
customers in an amount that reflects the consideration we expect to
receive in exchange for those services.
Costs to Obtain a Contract with a Customer
We
apply a practical expedient to expense costs as incurred for costs
to obtain a contract with a customer when the amortization period
would have been one year or less. We generally expense sales
commissions when incurred because the amortization period would
have been one year or less. These costs are recorded within selling
expenses.
Contract Balances
As of
December 31, 2019 and 2018 we did not have any unsatisfied
performance obligations for (i) contracts with an original expected
length of one year or less and (ii) contracts for which we
recognize revenue at the amount to which we have the right to
invoice for services performed.
Arrangements with Multiple Performance Obligations
Our
contracts with customers may include multiple performance
obligations. We enter into contracts that can include various
combinations of products and services, which are primarily distinct
and accounted for as separate performance obligations.
F-13
Significant Judgments
Our
contracts with customers for products and services often dictate
the terms and conditions of when the control of the promised
products or services is transferred to the customer and the amount
of consideration to be received in exchange for the products and
services.
Equity Compensation Expense
We
account for equity compensation expense in accordance with FASB ASC
718, “Compensation—Stock Compensation.” Under the
provisions of FASB ASC 718, equity compensation expense is
estimated at the grant date based on the award’s fair
value.
On July
7, 2017, our shareholders approved the 2016 Equity Incentive Plan
(the “2016 Plan”). The 2016 Plan authorizes the grant
of stock options, stock appreciation rights, restricted stock,
restricted stock units and performance units/shares. Up to
5,000,000 shares of common stock are authorized for issuance under
the 2016 Plan. Shares issued under the 2016 Plan may be either
authorized but unissued shares, treasury shares, or any combination
thereof. Provisions in the 2016 Plan permit the reuse or reissuance
by the 2016 Plan of shares of common stock for numerous reasons,
including, but not limited to, shares of common stock underlying
canceled, expired, or forfeited awards of stock-based compensation
and stock appreciation rights paid out in the form of cash. Equity
compensation expense will typically be awarded in consideration for
the future performance of services to us. All recipients of awards
under the 2016 Plan are required to enter into award agreements
with the Company at the time of the award; awards under the 2016
Plan are expressly conditioned upon such agreements. For the year
ended December 31, 2019 and 2018, we issued 400,000 and 300,000
shares of common stock, respectively, out of the 2016
Plan.
Concentrations of Credit Risk
Financial
instruments that potentially subject us to significant
concentrations of credit risk consist principally of cash and cash
equivalents. We maintain cash balances at financial institutions
which exceed the current Federal Deposit Insurance Corporation
limit of $250,000 at times during the year.
Long-Lived Assets Including Acquired Intangible Assets
We
assess long-lived assets for potential impairments at the end of
each year, or during the year if an event or other circumstance
indicates that we may not be able to recover the carrying amount of
the asset. In evaluating long-lived assets for impairment, we
measure recoverability of these assets by comparing the carrying
amounts to the future undiscounted cash flows the assets are
expected to generate. If our long-lived assets are considered to be
impaired, the impairment to be recognized equals the amount by
which the carrying value of the asset exceeds its fair market
value. We base the calculations of the estimated fair value of our
long-lived assets on the income approach. For the income approach,
we use an internally developed discounted cash flow model that
includes, among others, the following assumptions: projections of
revenues and expenses and related cash flows based on assumed
long-term growth rates and demand trends; expected future
investments to grow new units; and estimated discount rates. We
base these assumptions on our historical data and experience,
industry projections, micro and macro general economic condition
projections, and our expectations. We had no long-lived asset
impairment charges for the years ended December 31, 2019 and
2018.
Advertising and Promotional Expenses
We
expense advertising costs in the period in which they are incurred.
Advertising and promotional expenses
included in selling expenses for the years ended December 31, 2019
and 2018 were approximately $144,000 and $204,000,
respectively.
Research and Development Expenses
We expense research and development expenses in the period in which
they are incurred. For the years ended December 31, 2019 and 2018,
research and development expenses were approximately $341,000 and
$916,000, respectively.
Shipping and Handling Costs
We include shipping and
handling costs relating to the delivery of products directly from
vendors to the Company in cost of sales. Other shipping and
handling costs, including third-party delivery costs relating to
the delivery of products to customers, are classified as a general
and administrative expense. Shipping and handling costs included in general
and administrative expense were approximately $186,000 and $206,000
for the years ended December 31, 2019 and 2018,
respectively.
Business Segments
We
currently have one reportable business segment due to the fact that
we derive our revenue primarily from one product. A breakdown of
revenue is presented in “Revenue Recognition” in Note 2
above.
Recent Accounting Pronouncements
In
January 2017, the FASB issued ASU No. 2017-04, Simplifying the Test for Goodwill
Impairment, to simplify the test for goodwill impairment
by removing Step 2. An
entity will, therefore, perform the goodwill impairment test by
comparing the fair value of a reporting unit with its carrying
amount, recognizing an
impairment charge for the amount by which the carrying amount
exceeds the fair value, not to exceed the total amount of goodwill
allocated to the reporting unit. An entity still
has the option to perform a qualitative assessment to determine if
the quantitative impairment test is necessary. ASU No. 2017-04 is
effective for interim
and annual periods beginning after December 15, 2019, with early
adoption permitted for interim or annual goodwill impairment tests
performed on testing dates after January 1, 2017. Adoption of ASU
No. 2017-04 is prospective.
F-14
NOTE 3. INVENTORIES
Inventories consist
of the following at:
|
|
December
31,
2019
|
December
31,
2018
|
|
Finished
goods
|
$2,364,786
|
$2,782,014
|
|
Raw
Materials
|
50,428
|
-
|
|
Inventory
Reserve
|
(100,000)
|
(100,000)
|
|
|
$2,315,214
|
$2,682,014
|
NOTE 4. PROPERTY AND EQUIPMENT
Property
and equipment consist of the following at:
|
|
December 31,
2019
|
December 31,
2018
|
|
Furniture
and fixtures
|
$357,236
|
$277,976
|
|
Equipment
|
1,355,014
|
1,300,139
|
|
Vehicles
|
60,703
|
60,703
|
|
Computer and software
|
166,598
|
143,579
|
|
Leasehold improvements
|
362,898
|
355,898
|
|
Tenant Improvement Allowance
|
405,000
|
405,000
|
|
|
2,707,449
|
2,543,295
|
|
Less:
Accumulated depreciation
|
1,339,585
|
954,704
|
|
|
$1,367,864
|
$1,588,591
|
For
the years ended December 31, 2019 and 2018, depreciation was
$345,687 and $265,163, respectively.
F-15
NOTE 5. INTANGIBLE ASSETS
Intangible assets
consist of patents and trademarks related to our Binary Ionization
Technology. We amortize the patents over the estimated remaining
lives of the related patents. The trademarks have an indefinite
life. Amortization expense was
$370,478 and $369,508 for the years ended December 31, 2019 and
2018, respectively.
Definite life
intangible assets consist of the following:
|
|
December
31,
2019
|
December
31,
2018
|
|
|
|
|
|
Intellectual Property and
Patents
|
$2,906,507
|
$2,848,300
|
|
Less: Accumulated
Amortization
|
2,479,754
|
2,109,276
|
|
Intangible Assets,
net
|
$426,753
|
$739,024
|
Indefinite life
intangible assets consist of the following:
|
Trademarks
|
$512,257
|
$496,792
|
|
|
|
|
|
Total Intangible Assets, net
|
$939,010
|
$1,235,816
|
Approximate future
amortization is as follows:
|
Year Ended:
|
Amount
|
|
|
|
|
December
31, 2020
|
$373,000
|
|
December
31, 2021
|
3,000
|
|
December
31, 2022
|
3,000
|
|
December
31, 2023
|
3,000
|
|
December
31, 2024
|
3,000
|
|
Thereafter
|
$427,000
|
F-16
NOTE 6. LEASES
In
April 2018, we entered into a 10-year lease agreement for a new
9,000-square-foot facility that contains office, warehouse, lab and
research and development space in Frederick, Maryland. The lease
agreement was scheduled to commence on December 1, 2018 or when the
property was ready for occupancy. The agreement provided for annual
rent of $143,460, an escalation clause that increases the rent 3%
year over year, a landlord tenant improvement allowance of $405,000
and additional landlord work as discussed in the lease agreement.
We took occupancy of the property on December 17, 2018 and the
lease was amended in March 2019 to provide for a 4-month rent
holiday and a commencement date of April 1, 2019. Lease expense for
operating lease payments is recognized on a straight-line basis
over the lease term.
The
balances for our operating lease where we are the lessee are
presented as follows within our consolidated balance
sheet:
|
Operating leases:
|
December 31,
2019
|
|
Assets:
|
|
|
Operating
lease right-of-use asset
|
$674,471
|
|
Liabilities:
|
|
|
Current
Portion of Long-Term Operating Lease
|
$71,510
|
|
Long-Term
Operating Lease, Net of Current Portion
|
$1,034,413
|
|
|
$1,105,923
|
The
components of lease expense are as follows within our consolidated
statement of operations:
|
|
For
the Year Ended
December 31, 2019
|
|
|
|
|
Operating
lease expense
|
$157,315
|
Other
information related to leases where we are the lessee is as
follows:
|
|
For
the Year Ended
December 31, 2019
|
|
Weighted-average
remaining lease term:
|
|
|
Operating
leases
|
9.25
years
|
|
|
|
|
Discount
rate:
|
|
|
Operating
leases
|
7.00%
|
|
|
|
F-17
Supplemental cash
flow information related to leases where we are the lessee is as
follows:
|
|
For the Year
Ended
December 31, 2019
|
|
Cash
paid for amounts included in the measurement of lease
liabilities:
|
$65,753
|
As of
December 31, 2019, the maturities of our operating lease liability
are as follows:
|
Year Ended:
|
Operating Lease
|
|
December
31, 2020
|
146,688
|
|
December
31, 2021
|
151,088
|
|
December
31, 2022
|
155,621
|
|
December
31, 2023
|
160,290
|
|
December
31, 2024
|
165,098
|
|
Thereafter
|
745,183
|
|
Total
minimum lease payments
|
1,523,968
|
|
Less:
Interest
|
418,045
|
|
Present
value of lease obligations
|
1,105,923
|
|
Less:
Current portion
|
71,510
|
|
Long-term
portion of lease obligations
|
$1,034,413
|
As
previously reported in our Annual Report on Form 10-K for the year
ended December 31, 2018 and under legacy lease accounting (ASC
840), future minimum lease payments under non-cancellable leases as
of December 31, 2018 were as follows:
|
Year
Ended:
|
Operating Lease
|
|
December 31, 2019
|
$102,000
|
|
December 31, 2020
|
147,000
|
|
December 31, 2021
|
151,000
|
|
December 31, 2022
|
156,000
|
|
December 31, 2023
|
160,000
|
|
Thereafter
|
923,000
|
|
|
$1,639,000
|
F-18
NOTE 7. CAPITALIZED SOFTWARE DEVELOPMENT COSTS
In
accordance with ASC 985-20 we capitalized certain software
development costs associated with updating our continuing line of
product offerings. Capitalized software development costs consist
of the following at:
|
|
December 31,
2019
|
December 31,
2018
|
|
Capitalized
Software Development Costs
|
$125,704
|
$-
|
|
Less:
Accumulated Amortization
|
(31,426)
|
-
|
|
|
$94,278
|
$-
|
Amortization
expense for the year ended December 31, 2019 was
$31,426.
NOTE 8. CONVERTIBLE DEBT
In
March and May 2017, we closed a private placement transaction in
which we issued to certain accredited investors unregistered senior
callable convertible promissory notes (the “Notes”) and
three-year warrants to purchase an aggregate of 999,998 shares of
common stock at an exercise price of $0.69 per share in exchange
for aggregate gross proceeds of $6,000,000. The Notes bear interest
at a rate of 4% per annum. $5,300,000 in principal was originally
scheduled to mature on August 31, 2018 and $700,000 in principal
was originally scheduled to mature on November 8, 2018, unless
earlier redeemed, repurchased or converted. The Notes are
convertible at the option of the holder into common stock at a
conversion price of $0.54 per share. Subsequent to September 1,
2017, we may redeem the Notes that are scheduled to mature on
August 31, 2018 at any time prior to maturity at a price equal to
100% of the outstanding principal amount of the Notes to be
redeemed, plus accrued and unpaid interest as of the redemption
date. Prior to November 8, 2018, we may redeem the Notes that
are scheduled to mature on such date at any time prior to maturity
at a price equal to 100% of the outstanding principal amount of the
Notes to be redeemed, plus accrued and unpaid interest as of the
redemption date. Interest on the Notes is payable semi-annually in
cash on February 28 and August 31 of each year, beginning on August
31, 2017. Interest expense related to
the Notes for the years ended December 31, 2019 and 2018 was
$200,000 and $221,878, respectively.
The
warrants were valued at $62,559 using the Black-Scholes pricing
model with the following assumptions: expected volatility: 104.06%
–111.54%; expected dividend: $0; expected term: 3 years; and
risk-free rate: 1.49%–1.59%. We recorded the warrants’
relative fair value of $61,904 as an increase to additional paid-in
capital and a discount against the related Notes.
The
debt discount was amortized over the life of the Notes using the
effective interest method. Amortization expense for the years ended December
31, 2019 and 2018, was $17,534 and $38,091,
respectively.
In February and March 2018, we extended the
maturity date of the Notes— we
extended the maturity date to April 1, 2019 for $5,300,000 of
principal on the Notes and to June 8, 2019 for the remaining
$700,000 Note. No additional consideration was paid or accrued by
us. The stated rate of the Notes was unchanged, and the estimated
fair value of the new debt approximates its carrying amount
(principal plus accrued interest at the date of the modification).
We determined that the modification of these Notes is not a
substantial modification in accordance with ASC 470-50,
“Modifications and
Extinguishments”.
In May 2018, we offered
a noteholder the option to convert its Note at a reduced
conversion price of $0.46. The
noteholder accepted and converted at such price. Pursuant to the terms
of the conversion offer, an aggregate of $700,000 of
principal
and $5,212 of accrued interest outstanding under the
Note were converted into 1,877,960 shares of common
stock. We recognized an induced conversion cost of
$57,201 related to the conversion.
In December 2018, a
noteholder redeemed a note with a principal balance of $300,000 in
exchange for $150,000 in cash. We recognized a gain on redemption of convertible
note income in the amount of $150,000 as a result of the
transaction.
On
March 30, 2019, the two remaining noteholders agreed to extend the
maturity dates of their notes totaling $5,000,000 to April 3, 2020.
As part of the extensions, we agreed that if we do not make payment
on or before the new maturity dates, after five (5) days written
notice, the holders will have the right, but not the obligation, to
convert the notes into our common shares at a conversion price of
$0.11 per share or a total of 45,454,545 shares. All other
provisions of the notes remain unchanged. We determined that the
modification of these Notes is not a substantial modification in
accordance with ASC 470-50, “Modifications and
Extinguishments”. Refer to Footnote 16 – subsequent
events.
F-19
Convertible notes
consist of the following at:
|
|
December 31,
|
December 31,
|
|
|
2019
|
2018
|
|
Convertible
notes
|
$5,000,000
|
$5,000,000
|
|
Initial
discount
|
(53,873)
|
(53,873)
|
|
Accumulated
amortization
|
53,873
|
36,339
|
|
Convertible
notes, net
|
$5,000,000
|
$4,982,466
|
NOTE 9. SHAREHOLDERS’ EQUITY
Our
Board of Directors (the “Board”) may, without further
action by our shareholders, from time to time, direct the issuance
of any authorized but unissued or unreserved shares of preferred
stock in series and at the time of issuance, determine the rights,
preferences and limitations of each series. The holders of such
preferred stock may be entitled to receive a preference payment in
the event of any liquidation, dissolution or winding-up of the
Company before any payment is made to the holders of our common
stock. Furthermore, the Board could issue preferred stock with
voting and other rights that could adversely affect the voting
power of the holders of our common stock.
Convertible Series A Preferred Stock
Our
authorized Convertible Series A Preferred Stock, $0.01 par value,
consists of 1,000,000 shares. At December 31, 2019 and 2018, there
were 510,000 shares issued and outstanding. The Convertible Series
A Preferred Stock is convertible at the rate of one share of common
stock for one share of Convertible Series A Preferred
Stock.
Convertible Series B Preferred Stock
Our
authorized Convertible Series B Preferred Stock, $1,000 stated
value, 7.5% cumulative dividend, consists of 4,000 shares. At
December 31, 2019 and 2018, there were no shares issued and
outstanding, respectively. Each share of Convertible Series B
Preferred Stock may be converted (at the holder’s election)
into two hundred shares of our common stock.
Common Stock
In
November 2019, we amended our Restated Articles of Incorporation,
increasing the number of authorized shares of our Common Stock from
200,000,000 to 250,000,000.
During
the year ended December 31, 2018, we issued 362,500 shares of
common stock valued at $33,500 to members of our Board (see Note
11).
In May
2018, we issued 1,877,960
shares of
common stock in connection with the conversion of
$705,212 of principal
and accrued interest outstanding under a
Note (see Note 8).
During
the year ended December 31, 2019, we issued 400,000 shares of
common stock valued at $44,000 to members of our board of directors
(see Note 11) and 10,000 shares of common stock valued at $1,200 to
a consultant.
F-20
Stock Options
In
January 2018, we issued options to purchase an aggregate of 100,000
shares of common stock to our Chief Operating Officer, valued at
$11,780. The options have an exercise price of $0.12 per share and
expire in January 2023. The options were valued using the
Black-Scholes model using the following assumptions: volatility:
146%; dividend yield: 0%; zero coupon rate: 2.27%; and a life of 5
years.
In
January 2018, we issued options to purchase an aggregate of 20,000
shares of common stock to our Scientific Advisory Board members,
valued at $1,810 in total. The options have an exercise price of
$0.10 per share and expire in January 2028. The options were valued
using the Black-Scholes model using the following assumptions:
volatility: 147%; dividend yield: 0%; zero coupon rate: 2.41%; and
a life of 10 years.
In
January 2019, pursuant to an employment agreement, we issued
options to purchase an aggregate of 250,000 shares of common stock
to our Chief Operating Officer, valued at $24,694. The options have
an exercise price of $0.11 per share and expire in January 2024.
The options were valued using the Black-Scholes model using the
following assumptions: volatility: 144%; dividend yield: 0%; zero
coupon rate: 2.47%; and a life of 5 years. The value of the options
was expensed in the fourth quarter of 2018 and included in accrued
expenses at December 31, 2018.
In
January 2019, we issued options to purchase an aggregate of 50,000
shares of common stock to our Chief Financial Officer, valued at
$4,483. The options have an exercise price of $0.10 per share and
expire in January 2024. The options were valued using the
Black-Scholes model using the following assumptions: volatility:
143%; dividend yield: 0%; zero coupon rate: 2.58%; and a life of 5
years.
The
following table summarizes stock options outstanding as of December
31, 2019 and 2018:
|
|
December 31, 2019
|
December 31, 2018
|
||
|
|
Number of Options
|
Weighted Average
Exercise Price
|
Number of Options
|
Weighted Average
Exercise Price
|
|
Outstanding,
beginning of period
|
320,000
|
$0.52
|
200,000
|
$0.76
|
|
Granted
|
300,000
|
0.11
|
120,000
|
0.12
|
|
Exercised
|
—
|
—
|
—
|
—
|
|
Outstanding,
end of period
|
620,000
|
$0.32
|
320,000
|
$0.52
|
F-21
Options
outstanding and exercisable by price range as of December 31, 2019
were as follows:
|
Outstanding
Options
|
Average
Weighted
|
Exercisable
Options
|
||
|
Range
|
Number
|
Remaining
Contractual
Life in
Years
|
Number
|
Weighted
Average
Exercise
Price
|
|
|
|
|
|
|
|
$0.05
|
20,000
|
1.03
|
20,000
|
$0.05
|
|
$0.10
|
70,000
|
5.22
|
70,000
|
$0.10
|
|
$0.11
|
250,000
|
4.01
|
250,000
|
$0.11
|
|
$0.12
|
100,000
|
3.03
|
100,000
|
$0.12
|
|
$0.27
|
40,000
|
5.01
|
40,000
|
$0.27
|
|
$0.55
|
100,000
|
6.10
|
100,000
|
$0.55
|
|
$2.10
|
40,000
|
0.01
|
40,000
|
$2.10
|
|
|
620,000
|
4.04
|
620,000
|
$0.32
|
Stock Warrants
In
November 2018, we issued a warrant to purchase 250,000 shares of
common stock to the CEO at an exercise price of $0.08 per share
pursuant to his employment agreement with the Company. The warrant
was valued at approximately $18,000 and has a term of 5 years. We
utilized the Black-Scholes method to fair value the warrant
received by the CEO with the following assumptions: volatility,
142%; expected dividend yield, 0%; risk free interest rate, 2.95%;
and a life of 5 years. The grant date fair value of each share of
common stock underlying the warrant was $0.07.
In
January 2019, we issued a warrant to purchase 1,000,000 shares of
common stock to the CEO at an exercise price of $0.10 per share
pursuant to an employment agreement. The warrant was valued at
$89,654 and has a term of 5 years. We utilized the Black-Scholes
model to fair value the warrant received by the CEO with the
following assumptions: volatility, 143%; expected dividend yield,
0%; risk free interest rate, 2.58%; and a life of 5 years. The
grant date fair value of each share of common stock underlying the
warrant was $0.09.
In January 2019, we issued a warrant to purchase
250,000 shares of common stock to an employee at an exercise price
of $0.12 per share. The warrant was valued at $21,931 and has a
term of 3 years. We utilized the Black-Scholes model to fair value
the warrant received by the employee with the following
assumptions: volatility, 148%; expected dividend yield, 0%; risk
free interest rate, 2.55%; and a life of 3 years. The grant date
fair value of each share of common stock underlying the warrant was
$0.09. The value of the warrants was expensed in the fourth
quarter of 2018 and included in accrued expenses at December 31,
2018.
In
April 2019, we issued a warrant to purchase 50,000 shares of common
stock to an employee at an exercise price of $0.14 per share. The
warrant was valued at $6,116 and has a term of 5 years. We utilized
the Black-Scholes model to fair value the warrant received by the
employee with the following assumptions: volatility, 134%; expected
dividend yield, 0%; risk free interest rate, 2.32%; and a life of 5
years. The grant date fair value of each share of common stock
underlying the warrant was $0.12.
F-22
The
following table summarizes the outstanding common stock warrants as
of December 31, 2019 and 2018:
|
|
December 31, 2019
|
December 31, 2018
|
||
|
|
Number of Warrants
|
Weighted Average
Exercise Price
|
Number of Warrants
|
Weighted Average
Exercise Price
|
|
Outstanding,
beginning of period
|
26,550,611
|
$0.34
|
35,501,411
|
$0.33
|
|
Granted
|
1,300,000
|
0.11
|
250,000
|
0.08
|
|
Exercised
|
-
|
-
|
-
|
-
|
|
Expired
|
(10,610,088)
|
(0.23)
|
(9,200,800)
|
(0.30)
|
|
Outstanding,
end of period
|
17,240,523
|
$0.39
|
26,550,611
|
$0.34
|
Warrants
outstanding and exercisable by price range as of December 31, 2019
were as follows:
|
Outstanding Warrants
|
|
Exercisable Warrants
|
||
|
Exercise Price
|
Number
|
Average Weighted
Remaining Contractual
Life in Years
|
Number
|
Weighted Average
Exercise Price
|
|
$0.08
|
250,000
|
3.90
|
250,000
|
$0.08
|
|
$0.10
|
1,265,000
|
3.76
|
1,265,000
|
$0.10
|
|
$0.12
|
3,750,000
|
2.92
|
3,750,000
|
$0.12
|
|
$0.14
|
50,000
|
4.30
|
50,000
|
$0.14
|
|
$0.17
|
10,000
|
2.82
|
10,000
|
$0.17
|
|
$0.27
|
250,000
|
2.00
|
250,000
|
$0.27
|
|
$0.29
|
4,615,525
|
2.16
|
4,615,525
|
$0.29
|
|
$0.30
|
2,200,000
|
0.67
|
2,200,000
|
$0.30
|
|
$0.32
|
250,000
|
1.75
|
250,000
|
$0.32
|
|
$0.42
|
250,000
|
1.50
|
250,000
|
$0.42
|
|
$0.50
|
250,000
|
1.25
|
250,000
|
$0.50
|
|
$0.55
|
100,000
|
1.08
|
100,000
|
$0.55
|
|
$0.69
|
999,998
|
0.22
|
999,998
|
$0.69
|
|
$1.00
|
3,000,000
|
0.34
|
3,000,000
|
$1.00
|
|
|
17,240,523
|
1.81
|
17,240,523
|
$0.39
|
There
were no unvested warrants outstanding as of December 31,
2019.
F-23
NOTE 10. COMMITMENTS AND CONTINGENCIES
Legal Contingencies
We may become a party to litigation in the normal
course of business. In the opinion of management, there
are no legal matters involving us that would have a material
adverse effect upon our financial condition, results of operations
or cash flows. In addition, from time to time, we may have
to file claims against parties that infringe on our intellectual
property.
Product Liability
As
of December 31, 2019 and 2018, there were no claims against us for
product liability.
NOTE 11. CONTRACTS AND AGREEMENTS
Agreements with Directors
In
December 2017, we increased the annual board fee to directors to
$40,000, to be paid in cash on a quarterly basis, with the
exception of the audit committee chairperson, whose annual fee we
increased to $45,000, also to be paid in cash on a quarterly basis.
Director compensation also includes the annual issuance of our
common stock.
For
the year ended December 31, 2018, we issued an aggregate of 362,500
shares of common stock that were valued at $37,500 to members of
our board of directors.
For
the year ended December 31, 2019, we issued an aggregate of 400,000
shares of common stock that were valued at $44,000 to members of
our board of directors.
Other Agreements
In June
2015, we launched the TOMI Service Network (“TSN”). The
TSN is a national service network composed of existing full-service
restoration industry specialists that have entered into licensing
agreements with us to become Primary Service Providers
(“PSPs”). The licensing agreements grant protected
territories to PSPs to perform services using our
SteraMist® platform of
products and also provide for potential job referrals to PSPs
whereby we are entitled to referral fees. Additionally, the
agreement provides for commissions due to PSPs for equipment and
solution sales they facilitate to other service providers in their
respective territories. As part of these agreements, we are
obligated to provide to the PSPs various training, ongoing support
and facilitate a referral network call center. As of December 31,
2019, we had entered into 98 licensing agreements in connection
with the launch of the TSN. The licensing agreements contain fixed
price minimum equipment and solution orders based on the population
of the territories granted pursuant to the licensing agreements.
The nature and terms of our TSN agreements may represent multiple
deliverable arrangements. Each of the deliverables in these
arrangements typically represent a separate unit of
accounting.
F-24
NOTE 12. INCOME TAXES
|
The Company’s income tax expense consisted of:
|
|
|
|
|
For the Year Ended
|
|
|
|
December
31,
|
December
31,
|
|
|
2019
|
2018
|
|
Current:
|
|
|
|
United
States
|
$-
|
$-
|
|
Foreign
|
-
|
-
|
|
|
-
|
-
|
|
Deferred:
|
|
|
|
United
States
|
-
|
-
|
|
Foreign
|
-
|
-
|
|
|
-
|
-
|
|
Total
|
$-
|
$-
|
|
The Company’s net income (loss) before income tax consisted
of:
|
||
|
|
For the Year Ended
|
|
|
|
December 31,
|
December 31,
|
|
|
2019
|
2018
|
|
|
|
|
|
United
States
|
$(2,297,733)
|
$(3,230,462)
|
|
Foreign
|
-
|
-
|
|
Total
|
$(2,297,733)
|
$(3,230,462)
|
Our
income tax expense differed from the amounts computed by applying
the United States statutory corporate income tax rate for the
following reasons:
On
December 22, 2017, the 2017 Tax Cuts and Jobs Act (“Tax
Act”) was enacted into law making significant changes to the
Internal Revenue Code. Changes include, but are not limited to, a
federal corporate tax rate decrease from 35% to 21% for tax years
beginning after December 31, 2017, the transition of U.S.
international taxation from a worldwide tax system to a territorial
system and a one-time transition tax on the mandatory deemed
repatriation of foreign earnings. We are required to recognize the
effect of the tax law changes in the period of enactment, such as
re-measuring our U.S. deferred tax assets and liabilities as well
as reassessing the net realizability of our deferred tax assets and
liabilities. The Tax Act did not give rise to any material impact
on the consolidated balance sheets and consolidated statements of
operations due to our historical worldwide loss position and the
full valuation allowance on our net U.S. deferred tax
assets.
In December 2017, the Securities and Exchange
Commission staff issued Staff Accounting Bulletin
No. 118, Income Tax Accounting
Implications of the Tax Cuts and Jobs Act (“SAB 118”), which allows
us to record provisional amounts during a measurement period not to
extend beyond one year from the enactment date. As such, in
accordance with SAB 118, we completed our analysis during the
fourth quarter of 2018 considering current legislation and guidance
resulting in no material adjustments from the provisional amounts
recorded during the prior year.
F-25
The
reconciliation of taxes at the federal and state statutory rate to
our provision for income taxes for the years ended
December 31, 2019 and 2018 was as follows:
|
|
For the Year Ended
|
|
|
|
December 31,
|
December 31,
|
|
|
2019
|
2018
|
|
|
|
|
|
Loss
before income tax
|
$(2,297,733)
|
$(3,230,462)
|
|
US
statutory corporate income tax rate
|
28.00%
|
28.00%
|
|
Income tax expense computed at US statutory corporate income tax
rate
|
(643,365)
|
(904,529)
|
|
Reconciling
items:
|
|
|
|
Change
in valuation allowance on deferred tax assets
|
620,817
|
741,982
|
|
Provision to prior
year tax return
|
6,991
|
113,068
|
|
Incentive stock
options and warrants
|
31,982
|
21,628
|
|
Amortized
debt discount
|
4,910
|
1,758
|
|
Meals
and Entertainment
|
2,005
|
4,134
|
|
Induced
Conversion Costs
|
-
|
16,016
|
|
Other
|
(23,340)
|
5,943
|
|
Income
tax expense
|
$-
|
$-
|
Components of our
deferred income tax assets (liabilities) are as
follows:
|
|
December 31,
|
December 31,
|
|
|
2019
|
2018
|
|
Deferred
tax assets:
|
|
|
|
|
|
|
|
Reserve
for Bad Debt
|
$31,000
|
$84,000
|
|
Inventory
Reserve
|
28,000
|
28,000
|
|
Accrued
Vacation
|
92,000
|
52,000
|
|
Deferred Rent
|
-
|
4,000
|
|
Warranty Reserve
|
8,000
|
8,000
|
|
Intangible Assets
|
381,000
|
362,000
|
|
Operating lease right-of-use liabilities
|
310,000
|
-
|
|
Net operating losses
|
5,223,000
|
4,718,000
|
|
Valuation Allowance
|
(5,580,000)
|
(4,959,000)
|
|
Deferred Tax Assets
|
$493,000
|
$297,000
|
|
|
|
|
|
Deferred
tax liabilities:
|
|
|
|
Operating lease right-of-use assets
|
$(302,000)
|
$-
|
|
Property and Equipment
|
$(191,000)
|
(297,000)
|
|
|
$(493,000)
|
$(297,000)
|
|
|
|
|
|
Net
Deferred Tax Assets and Liabilities
|
$-
|
$-
|
F-26
Deferred income tax
assets and liabilities are determined based on differences between
the financial statement reporting and tax bases of assets and
liabilities and are measured using the enacted tax rates and laws
in effect when the differences are expected to reverse. The
measurement of deferred income tax assets is reduced, if necessary,
by a valuation allowance for any tax benefits, which are, on a more
likely than not basis, not expected to be realized; in accordance
with ASC guidance for income taxes. As of December 31, 2019, we recorded a
valuation allowance of $5,580,000 for the portion of the deferred
tax assets that we do not expect to be realized. The valuation
allowance on our net deferred taxes increased by $621,000 during
the year ended December 31, 2019, primarily due to
U.S. deferred tax assets incurred in the current year that cannot
be realized. Management believes that based on the available
information, it is more likely than not that the U.S. deferred tax
assets will not be realized, such that a valuation allowance is
required against U.S. deferred tax assets. The effect on deferred
income tax assets and liabilities of a change in tax rates is
recognized in the period that such tax rate changes are
enacted.
For
income tax purposes in the United States, we had available federal
net operating loss carryforwards ("NOL") as of December 31, 2019
and 2018 of approximately $19,386,000 and $17,544,000 respectively
to reduce future federal taxable income. For income tax purposes
in the United States, we had available state NOL carryforwards as
of December 31, 2019 and 2018 of approximately $16,463,000 and
$14,773,000 respectively to reduce future state taxable
income. If any of the NOL's generated prior to 2018 are not
utilized, they will expire at various dates through 2037.
NOL’s generated after 2017 carry forward indefinitely. There
may be certain limitations as to the future annual use of the NOLs
due to certain changes in our ownership.
We
record uncertain tax positions in accordance with ASC 740 on the
basis of a two-step process whereby (1) we determine whether it is
more likely than not that the tax positions will be sustained on
the basis of the technical merits of the position and (2) for those
tax positions that meet the more-likely-than-not recognition
threshold, we recognize the largest amount of tax benefit that is
more than 50 percent likely to be realized upon ultimate settlement
with the related tax authority. As of December 31, 2019, and 2018,
the management of the Company determined there were no reportable
uncertain tax positions.
NOTE 13. ACCRUED EXPENSES AND OTHER CURRENT
LIABILITIES
Accrued
expenses and other current liabilities consisted of the following
at:
|
|
December 31,
2019
|
December 31,
2018
|
|
Commissions
|
$112,102
|
$136,631
|
|
Payroll
and related costs
|
167,689
|
144,359
|
|
Director
fees
|
41,250
|
41,250
|
|
Sales
Tax Payable
|
21,814
|
11,296
|
|
Accrued
warranty (Note 14)
|
30,000
|
30,000
|
|
Other
accrued expenses
|
77,257
|
51,663
|
|
Total
|
$450,112
|
$415,199
|
NOTE 14. ACCRUED WARRANTY
Our
manufacturer assumes warranty against product defects for one year
from the sale to customers, which we extend to our customers upon
sale of the product. We assume responsibility for product
reliability and results. The warranty is generally limited to a
refund of the original purchase price of the product or a
replacement part. We estimate warranty costs based on historical
warranty claim experience.
The following table presents warranty reserve activities
at:
|
|
December 31,
2019
|
December 31,
2018
|
|
Beginning
accrued warranty costs
|
$30,000
|
$5,000
|
|
Provision for
warranty expense
|
2,609
|
47,454
|
|
Settlement of
warranty claims
|
(2,609)
|
(22,454)
|
|
Ending
accrued warranty costs
|
$30,000
|
$30,000
|
F-27
NOTE 15. CUSTOMER CONCENTRATION
The
Company had certain customers whose revenue individually
represented 10% or more of the Company’s total revenue, or
whose accounts receivable balances individually represented 10% or
more of the Company’s accounts receivable.
As of December 31, 2019, three customers accounted for 37% of
accounts receivable.
As of December 31, 2018, two customers accounted for 37% of
accounts receivable. One customer accounted for 13% of net revenues
for the year ended December 31, 2018.
NOTE 16. SUBSEQUENT EVENTS
In
January 2020, we issued a warrant to purchase 1,250,000 shares of
common stock to the CEO at an exercise price of $0.15 per share
pursuant to his employment agreement with the Company. The warrant
was valued at approximately $164,000 and has a term of 5 years. We
utilized the Black-Scholes method to fair value the warrant
received by the CEO with the following assumptions: volatility,
136%; expected dividend yield, 0%; risk free interest rate, 1.64%;
and a life of 5 years. The grant date fair value of each share of
common stock underlying the warrant was $0.13.
In
January 2020, we issued two options to purchase an aggregate of
250,000 shares of common stock to the COO at an exercise price of
$0.10 and $0.12per share pursuant to her employment agreement with
the Company. The options were valued at a total of approximately
$24,000 and have a term of 5 years. We utilized the Black-Scholes
method to fair value the option received by the COO with the
following assumptions: volatility, 135%; expected dividend yield,
0%; risk free interest rate, 1.64%; and a life of 5 years. The
grant date fair value of each share of common stock underlying the
options was $0.09 and $0.10. The value of the stock option was
included in accrued expenses at December 31, 2019.
Pursuant to the
agreement with our Board, in January 2020, we issued an aggregate
of 400,000 shares of common stock valued at approximately $48,000.
The agreements with our Board provide for the annual issuance of
shares of our common stock.
In February 2020, our SteraMist® equipment and BIT™ solution was registered with the Chinese Center
for Disease Control and Prevention (China CDC).
In March 2020, convertible notes with a principal
balance of $4,500,000 were converted into 8,333,333 shares
of our common stock at a conversion
price of $0.54 per share and the remaining outstanding balance of
$500,000 was repaid. The conversion and repayment of the
notes mitigates any going concern uncertainties.
In
March 2020, we received total proceeds of $57,500 for 83,333
warrants that were exercised at $0.69 per share.
SARS CoV-2 coronavirus
On March 11, 2020 the World Health Organization
declared the SARS CoV-2 coronavirus a global pandemic and recommended containment and
mitigation measures worldwide. We are monitoring this closely. We
have been identified as an essential disinfectant and
decontamination vendor by various agencies and countries. Our
operations being essential have been materially affected by the
coronavirus outbreak to date, as demand for our product and
services is increasing. The uncertain nature of its spread globally
may impact our business operations resulting from quarantines of
employees, customers and suppliers as well as potential travel
restrictions in areas affected or may be affected in the future. At
this time, the Company is unable to estimate the amount of the
impact of this event on its operations, however, expects this could
have a material impact on its operations in the coming
months.
F-28