Attached files
| file | filename |
|---|---|
| EX-99.1 - EXHIBIT 99.1 - HD Supply Holdings, Inc. | tm2012726d1_ex99-1.htm |
| 8-K - FORM 8-K - HD Supply Holdings, Inc. | tm2012726-1_8k.htm |
Exhibit 99.2

FINANCIAL RESULTS AND COMPANY OVERVIEW 2019 Fourth - Quarter and Fiscal Year Performance March 17 th , 2020
2 Disclaimer Forward - Looking Statements and Preliminary Results This presentation includes “forward - looking statements” within the meaning of Section 27A of the Securities Act of 1933 and Section 21E of the Securities Exchange Act of 1934. Forward - looking statements are based on management’s beliefs and assumptions and information currently available to management and are subject to known and unknown risks and uncertainties, many of which may be beyond o ur control. We caution you that the forward - looking information presented in this presentation is not a guarantee of future results , and that actual results may differ materially from those made in or suggested by the forward - looking information contained in this presen tation. Forward - looking statements generally can be identified by the use of forward - looking terminology such as “may,” “plan,” “seek,” “comfortable with,” “will,” “expect,” “intend,” “estimate,” “anticipate,” “believe” or “continue” or the negative thereof or var iations thereon or similar terminology. A number of important factors could cause actual events to differ materially from those contained in or imp lied by the forward - looking statements, including, without limitation, the impact of the coronavirus disease 2019 outbreak “COVID - 19” on the maintenance, repair and operations and specialty construction sectors, in general, and the financial position and operating r esu lts of our company, in particular, which cannot be predicted and could change rapidly and those “Risk factors” in our annual report on F orm 10 - K, for the fiscal year ended February 2, 2020, filed on March 17, 2020 and those described from time to time in our, and HD Supply, Inc.’s, other filings with the U.S. Securities and Exchange Commission (the “SEC”), which can be found at the SEC’s website www.sec.gov. Any forward - looking information presented herein is made only as of the date of this presentation, and we do not undertake any oblig ation to update or revise any forward - looking information to reflect changes in assumptions, the occurrence of unanticipated events, or o therwise. Estimates for February 2020 Net sales are preliminary estimates and are subject to risks and uncertainties, including, among others, changes in connection with quarter - end and year - end adjustments . Any variation between HD Supply’s actual results and the preliminary financial data set forth herein may be material. Non - GAAP Financial Measures HD Supply supplements its financial results that are determined in accordance with accounting principles generally accepted i n t he United States of America (“GAAP”) with non - GAAP measurements, including Adjusted EBITDA, Adjusted net income, Adjusted net income per diluted share, Net debt and Free cash flow . This supplemental information should not be considered in isolation or as a substitute for the GAAP measurements presented herein. Additional information regarding Adjusted EBITDA, Adjusted net income, Adjusted net income per diluted share, Net debt, and Free cash flow referred to in this presentation is included at the end of this presentation under “Capital Structure Overview” and “Reconciliation of Non - GAAP Measures.”

3 COVID - 19 Update Focused on Controllable Execution x Robust Action Plan x Cross - Functional Response Team x Business Continuity Plans x Communications Outreach to Associates and Customers x Restricted Travel x Self - Quarantine Resources x Heightened Hygiene Standards x Additional Hand Sanitizer Stations x Increased DC Cleanings x Daily Truck Cleanings

4 Financial Highlights Focused on Controllable Execution 1 Organic, 52 - week sales, Adj. EBITDA and Adj. Net Income per Diluted Share adjusted for the 53 rd week in 2018; see appendix slide 18 for more information 2 See appendix slides 19 and 20 for a reconciliation of Adjusted EBITDA, Adjusted net income and Adjusted net income per diluted share to Net income and Income from continuing operations 3 Free Cash Flow is defined as Operating Cash Flow of $180M and $677M, less Capital Expenditures of $17M and $106M, respectivel y, in Q4’19 and FY’19 x +3% Sales Growth 1 Versus Prior Year (“VPY”) x $78M Net Income , a decrease of $14M VPY x +3% Adjusted EBITDA 2 Growth 1 VPY x +$0.01 Adjusted Net Income per Diluted Share 2 Growth 1 VPY x $ 163M Free Cash Flow 3 Q4’19 FY’19 x +3% Net Sales Growth 1 VPY x $452M Net Income , an increase of $ 58M VPY x +2% Adjusted EBITDA 2 Growth 1 VPY x +$0.24 Adjusted Net Income per Diluted Share 2 Growth 1 VPY x $571M Free Cash Flow 3

5 Expanding Products and Services; Delivering Synergies and Returns Facilities Maintenance: Areas of Focus Topic Improvement 3. National Accounts 4. M&A Differentiated Value Proposition Driving Compliance Focused on Shareholder Value Creation Dependability, Investment and Readiness 2. Order Fulfillment Technology Development; Tailored Marketing and More Personalized Relationships 1. Improved Customer Experience

6 Transaction On Track for Completion by Middle of Fiscal 2020 Transaction Update Transaction Structure Timing / Other Matters Financial Implications ▪ Pro - rata distribution expected to be tax - free to HD Supply shareholders for U.S. tax purposes ▪ Both companies’ shares expected to be listed on national securities exchanges ▪ Closing subject to customary conditions, including final HD Supply Board approval ▪ Both companies expected to be well - capitalized and well - positioned for growth ▪ Targeting high non - investment grade credit rating at both companies within 2 - 3x Net debt to LTM EBITDA ▪ Expecting dis - synergies of 30 - 60 basis points of sales for Facilities Maintenance and an estimated 50 - 80 basis points for White Cap, including public company costs, sourcing, and technology ▪ Positions both companies for success with best - in - class margin profiles ▪ Strong cash flow generation with attractive opportunities for capital deployment ▪ The separation is expected to be completed by the middle of Fiscal 2020, subject to customary closing conditions ▪ Separation planning and implementation underway with significant progress made on talent alignment, systems, and processes ▪ Form 10 Registration Statement filed with the SEC in early 2020 ▪ Investor meetings to be held in the middle of 2020, subject to travel restrictions
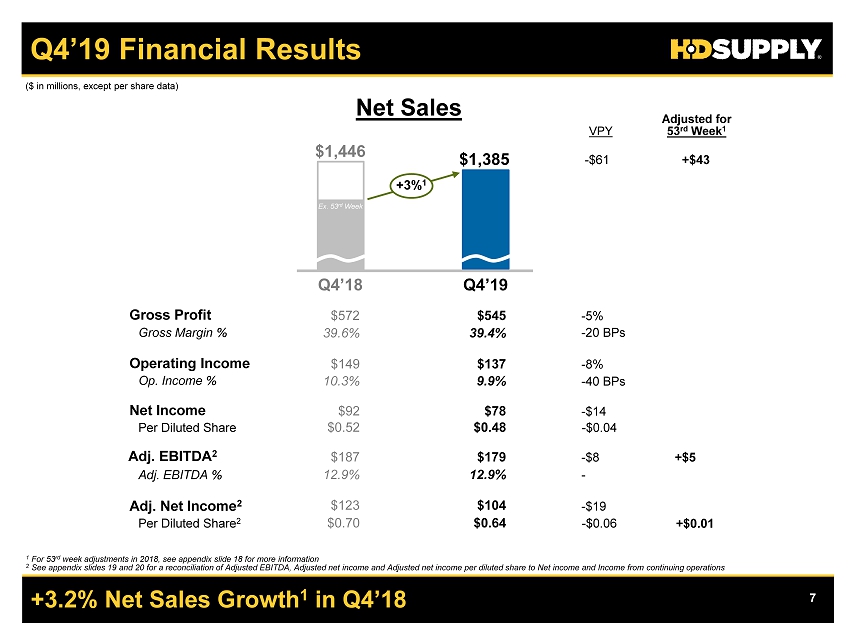
7 ($ in millions, except per share data) Net Sales 1 For 53 rd week adjustments in 2018, see appendix slide 18 for more information 2 See appendix slides 19 and 20 for a reconciliation of Adjusted EBITDA, Adjusted net income and Adjusted net income per dilute d s hare to Net income and Income from continuing operations +3.2% Net Sales Growth 1 in Q4’18 Q4’19 Financial Results $1,446 $1,385 Gross Profit Gross Margin % Operating Income Adj. EBITDA % Op . Income % $ 572 $545 39 .6 % 39.4 % $ 187 $ 179 $149 $ 137 12.9% 12.9 % 9.9 % - 5% - 20 BPs - - $8 $123 $ 104 - 8 % Q4’18 Adj. EBITDA 2 VPY Adj. Net Income 2 10.3 % Q4’19 $0.70 $ 0.64 - $0.06 Per Diluted Share 2 - $61 - $19 Net Income $92 $78 - $14 $0.52 $0.48 - $ 0.04 Per Diluted Share - 40 BPs +3% 1 Adjusted for 53 rd Week 1 +$5 +$ 43 +$0.01 Ex. 53 rd Week
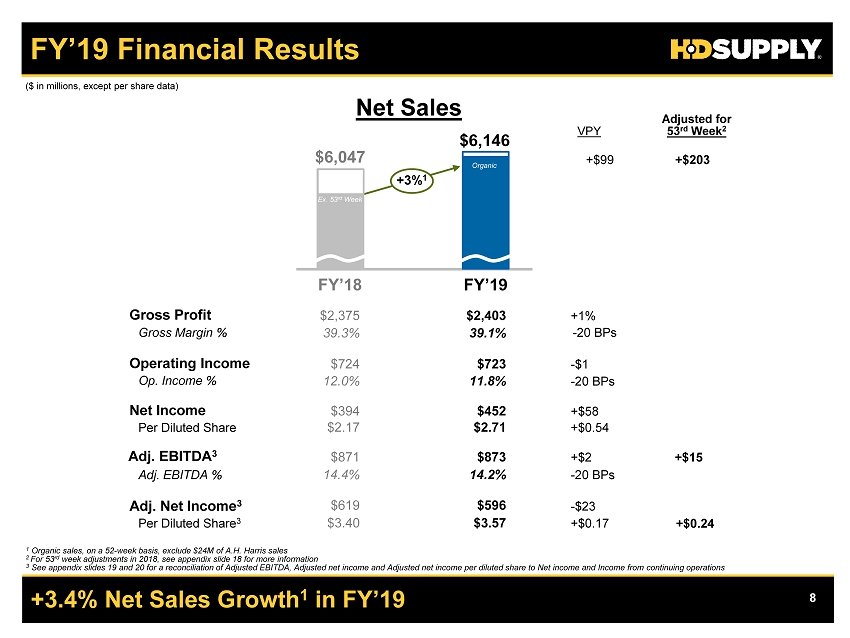
8 ($ in millions, except per share data) Net Sales 1 Organic sales, on a 52 - week basis, exclude $24M of A.H. Harris sales 2 For 53 rd week adjustments in 2018, see appendix slide 18 for more information 3 See appendix slides 19 and 20 for a reconciliation of Adjusted EBITDA, Adjusted net income and Adjusted net income per diluted share to Net income and Income from continuing operations +3.4% Net Sales Growth 1 in FY’19 FY’19 Financial Results $6,047 $6,146 Gross Profit Gross Margin % Operating Income Adj. EBITDA % Op . Income % $2,375 $2,403 39 .3 % 39.1 % $ 871 $ 873 $724 $ 723 14.4% 14.2 % 11.8 % +1% - 20 BPs - 20 BPs +$2 $619 $ 596 - $1 FY’18 Adj. EBITDA 3 VPY Adj. Net Income 3 12.0 % FY’19 $3.40 $ 3.57 +$0.17 Per Diluted Share 3 +$ 99 - $23 Net Income $ 394 $452 +$58 $2.17 $2.71 +$0.54 Per Diluted Share - 20 BPs +3% 1 Adjusted for 53 rd Week 2 +$ 203 Ex. 53 rd Week +$15 +$0.24 Organic

9 Growth in Both Business Units Q4’19 and FY’19 Segment Performance Adj. EBITDA, As Reported Net Sales ($ in millions) Q4’19 $702 $114 Q4’18 $736 $ 124 VPY 1 + 3 % FY’19 $3,130 $546 FY’18 $ 546 +3% $3,089 VPY 1 Q4’19 $685 $65 Q4’18 $711 $63 VPY 1 +4% FY’19 $3,019 $327 FY’18 $ 325 +4% $2,961 VPY 1 Note: Organic sales in FY’19 exclude A.H. Harris contribution through March 4, 2019 1 Growth rates adjusted for 53 rd Week in Q4’18; please see slide 18 for more information Adj. EBITDA 1 on a 52 - week Basis $114 $ 114 - $546 $ 536 +2% $65 $60 +8% $327 $ 322 +2% Ex. 53 rd Week Ex. 53 rd Week Ex. 53 rd Week Ex. 53 rd Week Organic

10 Q4’19 and FY’19 Taxes and Cash Flow ▪ Cash Taxes $18 in Q4’19 $53 in FY’19 ▪ $2,057 Net Debt 1 at the End of Q4’19 2.4x Net Debt to Adj. EBITDA ▪ Free Cash Flow $163 in Q4’19 $571 in FY’19 ▪ Capital Expenditures $17 in Q4’19 $106 in FY’19 1 Reconciled on slide 15. “Net Debt” defined as Total Debt before unamortized deferred financing costs and discounts, plus letters of credit, less cash an d cash equivalents Full Federal Tax Payer in 2020 ($ in millions)
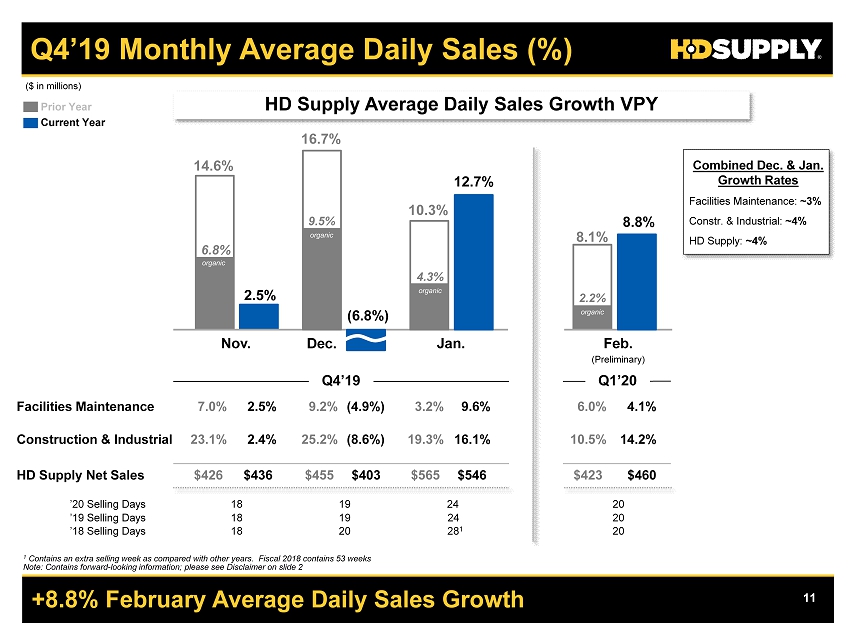
11 +8.8% February Average Daily Sales Growth Q4’19 Monthly Average Daily Sales (%) 9.6% 16.1% Feb. 4.1% 14.2% (4.9%) ’18 Selling Days 28 1 20 20 (8.6%) Facilities Maintenance Construction & Industrial (Preliminary) 2.5% (6.8%) 12.7% 2.5% 2.4% 18 14.6% 8.1% Nov. Jan. Prior Year $546 $460 $403 HD Supply Net Sales $436 16.7% 10.3% Q4’19 6.0% 10.5% $423 3.2% 19.3% $565 9.2% 25.2% $455 7.0% 23.1% $426 HD Supply Average Daily Sales Growth VPY ’19 Selling Days 24 20 19 18 Current Year 1 Contains an extra selling week as compared with other years. Fiscal 2018 contains 53 weeks Note: Contains forward - looking information; please see Disclaimer on slide 2 24 20 19 18 ’20 Selling Days Q1’20 6.8% organic 8.8% ($ in millions) 6.8% 9.5% organic 4.3% organic 2.2% organic Combined Dec. & Jan. Growth Rates Facilities Maintenance: ~3% Constr. & Industrial : ~4% HD Supply: ~4% Dec.

12 Q&A Q&A
13 Concluding Remarks Priority is Health and Safety of our Associates and Customers ▪ Solid End to 2019 and Good Start to 2020 ▪ No 2020 Guidance Provided at this Time ▪ Team is Preparing to Deal with Widespread Effects of COVID - 19 ▪ Priority is the Health and Safety of our Associates and Customers

14 Q&A APPENDIX
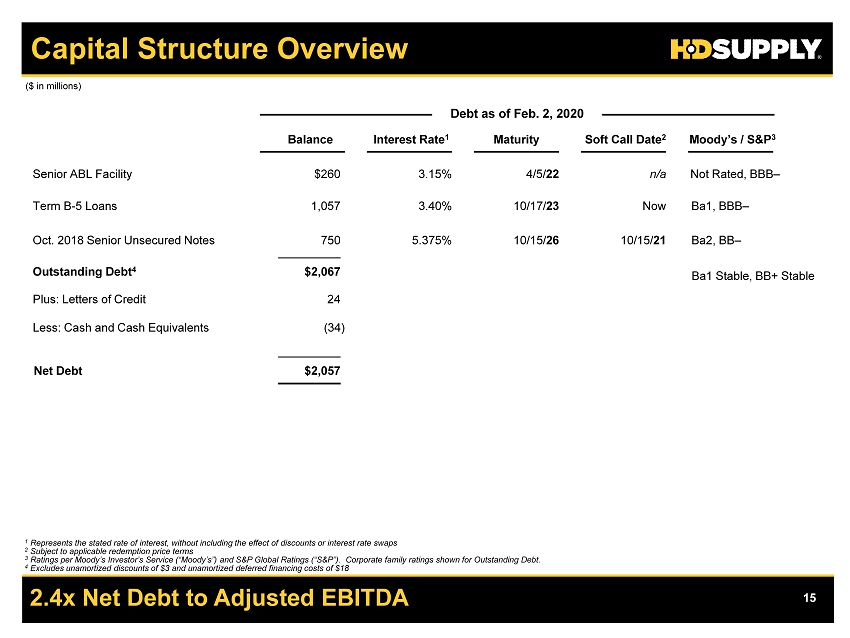
15 2.4x Net Debt to Adjusted EBITDA Capital Structure Overview Debt as of Feb. 2, 2020 Senior ABL Facility Term B - 5 Loans Oct. 2018 Senior Unsecured Notes Outstanding Debt 4 Less: Cash and Cash Equivalents Net Debt Balance Maturity 1 Represents the stated rate of interest, without including the effect of discounts or interest rate swaps 2 Subject to applicable redemption price terms 3 Ratings per Moody’s Investor’s Service (“Moody’s”) and S&P Global Ratings (“S&P”). Corporate family ratings shown for Outsta nd ing Debt. 4 Excludes unamortized discounts of $3 and unamortized deferred financing costs of $18 ($ in millions) Interest Rate 1 Soft Call Date 2 3.15% 3.40% 5.375% 4/5/ 22 10/17/ 23 10/15/ 26 n/a Now 10/15/ 21 Plus: Letters of Credit $260 750 $2,057 (34) $2,067 1,057 24 Moody’s / S&P 3 Not Rated, BBB – Ba1, BBB – Ba2, BB – Ba1 Stable, BB+ Stable
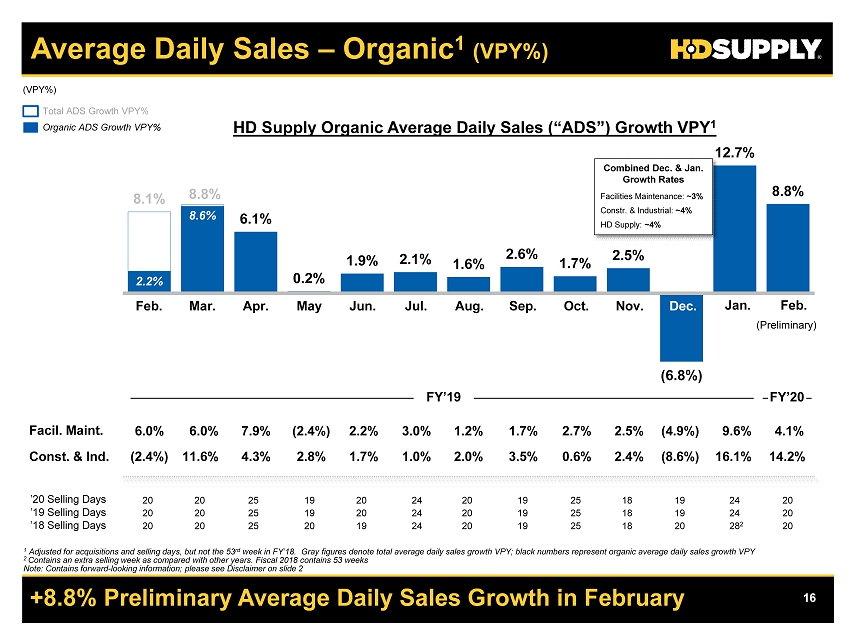
16 8.1% 8.8% 6.1% 0.2% 1.9% 2.1% 1.6% 2.6% 1.7% 2.5% (6.8%) 12.7% 8.8% 2.2% 8.6% 1 2 3 4 5 6 7 8 9 10 11 12 13 +8.8% Preliminary Average Daily Sales Growth in February Average Daily Sales – Organic 1 (VPY%) (Preliminary) Facil . Maint . Const. & Ind. HD Supply Organic Average Daily Sales (“ADS”) Growth VPY 1 Total ADS Growth VPY% Organic ADS Growth VPY% (VPY%) 1 Adjusted for acquisitions and selling days, but not the 53 rd week in FY’18. Gray figures denote total average daily sales growth VPY; black numbers represent organic average daily sales g rowth VPY 2 Contains an extra selling week as compared with other years. Fiscal 2018 contains 53 weeks Note : Contains forward - looking information; please see Disclaimer on slide 2 FY’19 ’20 Selling Days ’19 Selling Days 20 20 25 19 20 24 20 19 25 18 19 24 20 20 20 25 20 19 24 20 19 25 18 20 28 2 20 ’18 Selling Days 20 20 25 19 20 24 20 19 25 18 19 24 20 6.0% 6.0% 7.9% (2.4%) 2.2% 3.0% 1.2% 1.7% 2.7% 2.5% (4.9%) 9.6% 4.1% (2.4%) 11.6% 4.3% 2.8% 1.7% 1.0% 2.0% 3.5% 0.6% 2.4% (8.6%) 16.1% 14.2% FY’20 Combined Dec. & Jan. Growth Rates Facilities Maintenance: ~3% Constr. & Industrial : ~4% HD Supply: ~4% Feb. Mar. Apr. May Jun. Jul. Aug. Sep. Oct. Nov. Dec. Jan. Feb.

17 $460M Preliminary February Sales Monthly Net Sales ($) (Preliminary) Facil . Maint . Const. & Ind. ’20 Selling Days ’19 Selling Days 20 20 25 19 20 24 20 19 25 18 19 24 20 20 20 25 20 19 24 20 19 25 18 20 28 2 20 ’18 Selling Days 20 20 25 19 20 24 20 19 25 18 19 24 20 $423M $460M $610M $464M $521M $639M $521M $494M $629M $436M $403M $546M $460M $400M 1 2 3 4 5 6 7 8 9 10 11 12 13 organic $225 $238 $309 $228 $268 $334 $266 $249 $311 $216 $205 $281 $234 $198 $222 $301 $237 $253 $305 $255 $245 $318 $221 $198 $266 $226 HD Supply Net Sales Total Net Sales Organic Net Sales ($ in millions) 1 Contains an extra selling week as compared with other years . Fiscal 2018 contains 53 weeks Note : Contains forward - looking information; please see Disclaimer on slide 2 FY’20 FY’19 organic $459M Feb. Mar. Apr. May Jun. Jul. Aug. Sep. Oct. Nov. Dec. Jan. Feb.

18 53 rd Week: Net Sales ~$104, Adj. EBITDA ~$13, Adj. Dil. EPS ~$0.07 Items Affecting Comparability ($ in millions, except per share amounts) Q4’18 Q4’19 Versus Prior Year FY’18 FY’19 Versus Prior Year Reported 52 - Week Basis Reported 52 - Week Basis Organic, 52 - Week Basis Reported 53rd Week Adjusted Reported VPY $ VPY % VPY $ VPY % Reported 53rd Week Adjusted Reported A.H. Harris Inorganic Adjusted VPY $ VPY % VPY $ VPY % VPY $ VPY % Net Sales Facil. Maint. $ 736 ($ 53) $ 683 $ 702 ($ 34) (4.6%) $ 19 2.8% $ 3,089 ($ 53) $ 3,036 $ 3,130 - $ 3,130 $ 41 1.3% $ 94 3.1% $ 94 3.1% Const. & Ind. 711 (51) 660 685 (26) (3.7%) 25 3.8% 2,961 (51) 2,910 3,019 (24) 2,995 58 2.0% 109 3.7% 85 2.9% Corp. & Elim. (1) - (1) (2) (1) * (1) * (3) - (3) (3) - (3) - * - * - * HD Supply $ 1,446 ($ 104) $ 1,342 $ 1,385 ($ 61) (4.2%) $ 43 3.2% $ 6,047 $ 5,943 $ 6,146 ($ 24) $ 6,122 $ 99 1.6% $ 203 3.4% $ 179 3.0% Adjusted EBITDA Facil. Maint. $ 124 ($ 10) $ 114 $ 114 ($ 10) (8.1%) - - $ 546 $ 536 $ 546 - - $ 10 1.9% Const. & Ind. 63 (3) 60 65 2 3.2% 5 8.3% 325 322 327 2 0.6% 5 1.6% Corp. & Elim. - - - - - * 0 * - - - - * - * HD Supply $ 187 ($ 13) $ 174 $ 179 ($ 8) (4.3%) $ 5 2.9% $ 871 $ 858 $ 873 $ 2 0.2% $ 15 1.7% HD Supply $ 0.70 ($ 0.07) $ 0.63 $ 0.64 ($ 0.06) (8.6%) $ 0.01 1.6% $ 3.40 $ 3.33 $ 3.57 $ 0.17 5.0% $ 0.24 7.2% * not meaningful Adjusted Net Income per Diluted Share ($ 104) ($ 10) (3) - ($ 13) ($ 0.07)

19 Reconciliation of Non - GAAP Measures: Net Income to Adjusted EBITDA ($ in millions) 1 Depreciation and amortization includes amounts recorded within Cost of sales in the Consolidated Statements of Operations 2 Represents the loss on extinguishment of debt including the premium paid to repurchase or call the debt as well as the write - off of unamort ized deferred financing costs, original issue discount, and other assets or liabilities associated with such debt. Also includes the costs of debt modification 3 Represents the costs incurred for separation activities and strategic alignment of workforce 4 Represents the costs incurred in the acquisition and integration of business acquisitions, including A.H. Harris Twelve Months Three Months Ended Ended Feb. 2, 2020 Feb. 3, 2019 Feb. 2, 2020 Feb. 3, 2019 Net income $78 $92 $452 $394 Less income from discontinued operations, net of tax - 2 1 3 Income from continuing operations 78 90 451 391 Interest expense, net 27 29 110 129 Provision for income taxes 32 30 162 135 Depreciation and amortization 1 30 28 113 106 Loss on extinguishment & modification of debt 2 - - - 69 Restructuring and separation charges 3 6 - 8 9 Stock - based compensation 5 7 23 26 Acquisition and integration costs 4 - 1 5 6 Other 1 2 1 - Adjusted EBITDA $179 $187 $873 $871
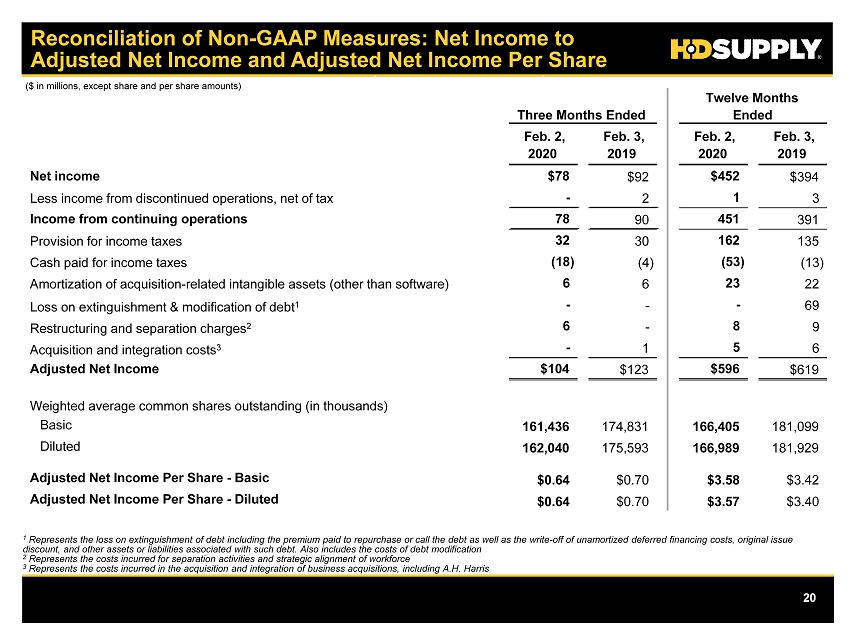
20 Reconciliation of Non - GAAP Measures: Net Income to Adjusted Net Income and Adjusted Net Income Per Share ($ in millions, except share and per share amounts) 1 Represents the loss on extinguishment of debt including the premium paid to repurchase or call the debt as well as the write - off of unamort ized deferred financing costs, original issue discount, and other assets or liabilities associated with such debt. Also includes the costs of debt modification 2 Represents the costs incurred for separation activities and strategic alignment of workforce 3 Represents the costs incurred in the acquisition and integration of business acquisitions, including A.H. Harris Twelve Months Three Months Ended Ended Feb. 2, 2020 Feb. 3, 2019 Feb. 2, 2020 Feb. 3, 2019 Net income $78 $92 $452 $394 Less income from discontinued operations, net of tax - 2 1 3 Income from continuing operations 78 90 451 391 Provision for income taxes 32 30 162 135 Cash paid for income taxes (18) (4) (53) (13) Amortization of acquisition - related intangible assets (other than software) 6 6 23 22 Loss on extinguishment & modification of debt 1 - - - 69 Restructuring and separation charges 2 6 - 8 9 Acquisition and integration costs 3 - 1 5 6 Adjusted Net Income $104 $123 $596 $619 Weighted average common shares outstanding (in thousands) Basic 161,436 174,831 166,405 181,099 Diluted 162,040 175,593 166,989 181,929 Adjusted Net Income Per Share - Basic $0.64 $0.70 $3.58 $3.42 Adjusted Net Income Per Share - Diluted $0.64 $0.70 $3.57 $3.40