Attached files
UNITED STATES
SECURITIES AND EXCHANGE COMMISSION
Washington, D.C. 20549
FORM 10-K
(Mark One)
| ⌧ |
ANNUAL REPORT PURSUANT TO SECTION 13 OR 15(d) OF THE SECURITIES EXCHANGE ACT OF 1934
|
For the fiscal year ended December 31, 2019
or
| □ |
TRANSITION REPORT PURSUANT TO SECTION 13 OR 15 (d) OF THE SECURITIES EXCHANGE ACT OF 1934
|
For the transition period from to .
Commission file number: 0-21121

(Exact name of registrant as specified in its charter)
|
Delaware
|
|
06-1456680
|
|
(State or other jurisdiction of incorporation or organization)
|
|
(I.R.S. Employer Identification No.)
|
|
One Hamden Center, 2319 Whitney Avenue, Suite 3B, Hamden, CT
|
|
06518
|
|
(Address of principal executive offices)
|
|
(Zip Code)
|
|
(203) 859-6800
|
|
(Registrant’s Telephone Number, Including Area Code)
|
|
Title of each class
|
Trading Symbol(s)
|
Name of each exchange on which registered
|
|
Common stock, par value $0.01 per share
|
TACT
|
NASDAQ Global Market
|
Securities registered pursuant to Section 12(b) of the Act: None
Indicate by check mark if the registrant is a well-known seasoned issuer, as defined in Rule 405 of the Securities Act. Yes □ No ⌧
Indicate by check mark if the registrant is not required to file reports pursuant to Section 13 or Section 15(d) of the Act. Yes □ No ⌧
Indicate by check mark whether the registrant (1) has filed all reports required to be filed by Section 13 or 15(d) of the Securities
Exchange Act of 1934 during the preceding 12 months (or for such shorter period that the registrant was required to file such reports), and (2) has been subject to such filing requirements for the past 90 days. Yes ⌧ No □
Indicate by check mark whether the registrant has submitted electronically every Interactive Data File required to be submitted pursuant
to Rule 405 of Regulation S-T during the preceding 12 months (or for such shorter period that the registrant was required to submit such files). Yes ⌧ No □
Indicate by check mark whether the registrant is a large accelerated filer, an accelerated filer, a non-accelerated filer, a smaller
reporting company or an emerging growth company. See the definitions of “large accelerated filer,” “accelerated filer,” “smaller reporting company,” and “emerging growth company” in Rule 12b-2 of the Exchange Act. (Check one):
|
Large accelerated filer □
|
Accelerated filer ⌧
|
|
Non-accelerated filer □
|
Smaller reporting company ⌧
|
|
Emerging growth company □
|
If an emerging growth company, indicate by check mark if the registrant has elected not to use the extended transition period for
complying with any new or revised financial standards provided pursuant to Section 13(a) of the Exchange Act. □
Indicate by check mark whether the registrant is a shell company (as defined in Rule 12b-2 of the Act). Yes □ No ⌧
The aggregate market value of the voting and non-voting common equity held by non-affiliates of the Registrant was approximately
$81,900,000 based on the last sale price on June 28, 2019.
As of February 28, 2020, the number of shares outstanding of the Registrant’s common stock, $0.01 par value, was 7,534,133.
DOCUMENTS INCORPORATED BY REFERENCE
Portions of the Registrant’s Definitive Proxy Statement related to its 2020 Annual Meeting of Stockholders (the “Proxy Statement”) to be
filed with the Securities and Exchange Commission within 120 days after the Registrant’s fiscal year end of December 31, 2019 are incorporated by reference into Part III of this Annual Report on Form 10-K.
TRANSACT TECHNOLOGIES INCORPORATED
INDEX
|
|
PART I.
|
|
|
Business
|
1
|
|
|
Risk Factors
|
5
|
|
|
Unresolved Staff Comments
|
11
|
|
|
Properties
|
11
|
|
|
Legal Proceedings
|
11
|
|
|
Mine Safety Disclosures
|
11
|
|
|
|
|
|
|
|
PART II.
|
|
|
Market for Registrant’s Common Equity, Related Stockholder Matters and Issuer Purchases of Equity Securities
|
12
|
|
|
Selected Financial Data
|
14
|
|
|
Management's Discussion and Analysis of Financial Condition and Results of Operations
|
14
|
|
|
Quantitative and Qualitative Disclosures About Market Risk
|
26
|
|
|
Financial Statements and Supplementary Data
|
26
|
|
|
Changes in and Disagreements with Accountants on Accounting and Financial Disclosure
|
26
|
|
|
Controls and Procedures
|
26
|
|
|
Other Information
|
27
|
|
|
|
|
|
|
|
PART III.
|
|
|
Directors, Executive Officers and Corporate Governance
|
28
|
|
|
Executive Compensation
|
28
|
|
|
Security Ownership of Certain Beneficial Owners and Management and Related Stockholder Matters
|
28
|
|
|
Certain Relationships and Related Transactions, and Director Independence
|
28
|
|
|
Principal Accounting Fees and Services
|
28
|
|
|
|
|
|
|
|
PART IV.
|
|
|
Exhibits, Financial Statement Schedules
|
29
|
|
|
Form 10-K Summary
|
31
|
|
|
SIGNATURES
|
|
|
|
|
|
|
|
32
|
||
|
|
|
|
|
CONSOLIDATED FINANCIAL STATEMENTS
|
|
|
|
|
|
|
|
F-1
|
||
|
|
|
|
PART I
Forward Looking Statements
Certain statements included in this Annual Report on Form 10-K (this “Form 10-K”) may include
“forward-looking statements” within the meaning of the U.S. federal securities laws, including the Private Securities Litigation Reform Act of 1995. Forward-looking statements are any statements other than statements of historical fact.
Forward-looking statements represent current views about possible future events and are often identified by the use of forward-looking terminology, such as “may”, “will”, “expect”, “intend”, “estimate”, “anticipate”, “believe”, “project” or
“continue” or the negative thereof or other similar words. Forward-looking statements are subject to certain risks, uncertainties and assumptions. In the event that one or more of such risks or uncertainties materialize, or one or more underlying
assumptions prove incorrect, actual results may differ materially from those expressed or implied by the forward-looking statements.
Important factors and uncertainties that could cause actual results to differ materially from
those expressed or implied by the forward-looking statements include, but are not limited to, the following: our ability to successfully develop new products that garner customer acceptance and generate sales, both domestically and internationally,
in the face of substantial competition from competitors that have broader lines of products and greater financial resources; our ability to successfully transition our business towards the food service technology and casino and gaming markets; our
ability to remediate the material weaknesses over internal control over financial reporting; risks associated with potential future acquisitions; our dependence on a significant customer; general economic conditions in the United
States, Australia, New Zealand, Europe, Latin America and Asia; our dependence on contract manufacturers for the manufacturing and assembly of a large portion of our products in Asia; our dependence on significant suppliers; our ability to recruit
and retain quality employees as the Company grows; our dependence on third parties for sales outside the United States, including Australia, New Zealand, Latin America and Asia; marketplace acceptance of new products; risks associated with foreign
operations; the availability of third-party components at reasonable prices; price wars or other significant pricing pressures affecting the Company's products in the United States or abroad; increased product costs or reduced customer demand for our
products due to changes in U.S. policy that may result in trade wars or tariffs; our ability to protect intellectual property; the effect on global economic conditions, financial markets and our business from the United Kingdom’s withdrawal from
the European Union; and other risk factors detailed from time to time in the Company’s reports filed with the Securities and Exchange Commission.
We caution readers not to place undue reliance on forward-looking statements, which speak
only as of the date of this Form 10-K. We undertake no obligation to public publicly or otherwise revise any forward-looking statements, whether as a result of new information, future events or other factors, except where we are expressly required
to do so by law.
The Company
TransAct Technologies Incorporated (together with its consolidated subsidiaries, “TransAct”, the “Company”, “we”, “us”, or “our”) was
incorporated in June 1996 and began operating as a stand-alone business in August 1996 as a spin-off of the printer business that was formerly conducted by certain subsidiaries of Tridex Corporation. We completed an initial public offering on August
22, 1996.
TransAct is a global leader in developing and selling software-driven technology and printing solutions for high growth markets
including food service technology, point of sale (“POS”) automation and banking, casino and gaming, lottery, and oil and gas. Our world-class products are designed from the ground up based on market and customer requirements and are sold under the
BOHA!™, AccuDate™, Epic®, EPICENTRAL™, Ithaca®, and Printrex® brand names. In March 2019, we launched a new line of products for the food service technology market, the BOHA! branded suite of cloud-based applications and companion hardware
solutions. The new BOHA! software and hardware products help restaurants and food service operators of all sizes automate the food production operations in the back-of-house operations. Known and respected worldwide for innovative designs and
real-world service reliability, our thermal and inkjet printers and terminals generate top-quality labels, coupons and transaction records such as receipts, tickets and other documents, as well as printed logging and plotting of data. We sell our
technology to original equipment manufacturers (“OEMs”), value-added resellers, select distributors, as well as directly to end-users. Our product distribution spans across the Americas, Europe, the Middle East, Africa, Asia, Australia, New Zealand,
Latin America, the Caribbean Islands and the South Pacific. We also offer world-class service, support, labels, spare parts, accessories and printing supplies to our growing worldwide base of products currently in use by our customers. Through our
TransAct Services Group (“TSG”), we provide a complete range of supplies and consumables used in the printing and scanning activities of customers in the restaurant and hospitality, banking, retail, casino and gaming, government and oil and gas
exploration markets. Through our webstore, www.transactsupplies.com, and our direct selling team, we address the demand for these products. Our primary
operating, hardware research and development, and eastern region service center is located in Ithaca, New York. In addition, we have a casino and gaming sales headquarters, software research and development and western region service center in Las
Vegas, Nevada; a European sales and service center at our subsidiary in the United Kingdom (“UK”); and a sales office located in Macau, China. Our executive offices are located at One Hamden Center, 2319 Whitney Avenue, Suite 3B, Hamden,
Connecticut, 06518, with a telephone number of (203) 859-6800.
Products, Services and Distribution Methods
Printers,
terminals and other hardware: TransAct designs, develops and markets a broad array of transaction-based and specialty printers and terminals utilizing thermal and inkjet printing technology for applications, primarily in the food service
technology, POS automation and banking, casino and gaming, lottery, and oil and gas printing markets. Our printers and terminals are configurable and offer customers the ability to choose from a variety of features and functions. Options typically
include interface configuration, mounting configuration, paper cutting devices, paper handling capacities and cabinetry color. Our food service technology terminals also offer software configurable menu options. Our food service technology market
also includes sales of hardware products including handheld devices, tablets, temperature probes and temperature sensors and gateways.
1
Food Service
Technology: The primary offering in the food service technology market is our BOHA! ecosystem, which combines our latest generation terminal, cloud-based software applications and related hardware into a unique solution to automate
operations with food production in the back-of-house operations in restaurants and food service operations. The software component of BOHA! consists of a suite of software-as-a-service (“SaaS”)-based applications, including applications for
inventory management, temperature monitoring of food and equipment, timers, food safety labeling, food recalls, checklists and procedures, equipment service management, and delivery management. Any and all these applications can be chosen by our
customer and packaged into a single platform with the associated hardware, which includes the BOHA! terminal, handheld devices, tablets, temperature probes and temperature sensors and gateways. The BOHA! terminal combines the software and hardware
components in a device that includes an operating system, touchscreen and one or two thermal print mechanisms that print easy-to-read food rotation labels, grab and go labels for prepared foods, nutritional labels and “enjoy by” date labels. The
BOHA! terminal is equipped with the TransAct Enterprise Management System to ensure that only approved applications and functions are available on the device and allows over-the-air updates to the applications and operating system. BOHA! helps food
service establishments and restaurants (including fine dining, casual dining, fast casual and quick-serve restaurants, convenience stores, hospitality establishments and contract food service providers) effectively manage food safety and grab-and-go
initiatives, as well as automate and manage back-of-house operations. Recurring revenue from BOHA! is generated by software sales, including software subscriptions that are charged to customers upfront on a per-application basis, as well as sales of
labels, extended warranty and service contracts, and technical support services. In the food service technology market, we use an internal sales force to solicit sales directly from end users.
POS automation
and banking: In the POS market, we sell several models of printers utilizing thermal printing technology. Our POS printers are used
primarily by quick-serve restaurants located either at the checkout counter or within self-service kiosks to print receipts for consumers or print on linerless labels. In the POS market, we primarily sell our products through a network of domestic
and international distributors and resellers. We use an internal sales force to manage sales through our distributors and resellers, as well as to solicit sales directly from end-users. In the banking market, we sold inkjet printers that are used
by banks, credit unions and other financial institutions to print deposit and withdrawal receipts and to validate checks at bank teller stations. In the banking market, we primarily sold our products directly to end-user banks and financial
institutions through our internal sales force and, to a lesser extent, resellers. We exited the banking market as of December 31, 2018 and therefore do not expect any future sales.
Casino and
gaming: We sell several models of printers used in slot machines and video lottery terminals (“VLTs”) and other gaming machines that print tickets or receipts instead of issuing coins (“ticket-in, ticket-out” or “TITO”) at casinos,
racetracks and other gaming venues worldwide. These printers utilize thermal printing technology to print tickets and receipts in monochrome and offer various other features such as jam resistant bezels and a dual port interface that enables casinos
to print coupons and promotions. In addition, we sell printers using thermal roll-fed printing technology for use in non-casino establishments, including game types such as Amusements with Prizes, Skills with Prizes, Fixed Odds Betting Terminals and
other off-premise gaming type machines around the world. We sell our casino and gaming products primarily (1) to slot machine manufacturers, who incorporate our printers into slot machines and, in turn, sell completed slot machines directly to
casinos and other gaming establishments and (2) through distributors. Prior to December 31, 2017, the Suzo-Happ Group was our primary worldwide distributor. However, effective January 1, 2018, we replaced the Suzo-Happ Group with new distributors
in Asia and Australia and adopted a direct selling model in Europe utilizing our UK sales office. We also maintain a dedicated internal sales force to solicit sales from slot machine manufacturers and casinos, and to manage sales through our
distributors.
We also offer a software solution, the EPICENTRAL™ Print System (“EPICENTRAL™” and “EPICENTRAL® SE”), including annual software
maintenance, that enables casino operators to create promotional coupons and marketing messages and to print them in real-time at the slot machine. With EPICENTRAL™, casinos can utilize the system to create multiple promotions and incentives to
either increase customer time spent on the casino floor or encourage additional visits to generate more revenue to the casinos. In 2017, we introduced EPICENTRAL® SE, a system edition version of our software solution, that is specifically designed
to work with the existing bonusing modules of casino slot machine management systems. In addition, EPICENTRAL® SE provides an upgrade path to a full EPICENTRALTM implementation in the event an operator seeks to expand its promotion and
bonusing options beyond the slot machine management systems currently offered. In 2019 we introduced Epicentral 4.0, a cloud based version that also uses the new Acres 4.0 technology that provides Epicentral with true real time slot machine play
data.
Lottery: Our
lottery printers are designed for high-volume, high-speed printing of lottery tickets for various lottery applications. We primarily supply lottery printers to International Gaming Technology and its subsidiaries (“IGT”), our largest customer and
the world’s largest provider of lottery terminals. During 2019, we decided to exit this business and we expect our last sales to occur in 2020 and no future sales beyond 2020. Sales of our lottery products are made directly to IGT and other lottery
system customers and are managed by an internal sales representative.
Printrex: Printrex
printers include wide format, desktop and rack mounted and vehicle mounted black and white thermal printers used by customers in the oil and gas exploration industry to log and plot oil field and down hole well drilling data. The Printrex® brand of
printers also includes high-speed color inkjet desktop printers used by oil and gas field service companies to print logs at their data centers. Prior to 2019, revenue in this market also included sales of vehicle mounted printers used to print
schematics and certain other critical information in emergency services vehicles and other mobile printing applications. We exited this market as of December 31, 2018 and do not expect any future sales. We primarily sell our Printrex® products
directly to oil field service and drilling companies and OEM’s, as well as through regional distributors in the United States, Europe, Canada and Asia.
TSG: Through TSG, we proactively market the sale of consumable products (including inkjet cartridges, ribbons, receipt paper, color thermal paper, and
other printing supplies), replacement parts, maintenance and repair services and testing services for all of our products and certain competitor’s products. Our maintenance services include the sale of extended warranties, multi-year maintenance
contracts, 24-hour guaranteed replacement product service called TransAct Xpress™ and other repair services for our printers and terminals. Within the United States, we provide repair services through our eastern region service center in Ithaca, New
York and our western region service center in Las Vegas, Nevada. Internationally, we provide repair services through our European service center located in Doncaster, UK, and through partners strategically located around the world.
We also provide customers with telephone sales and technical support, and a personal account representative to handle orders,
shipping and general information. Technical and sales support personnel receive training on all our manufactured products and services.
In addition to personalized telephone and technical support, we also market and sell consumable products 24 hours a day, seven days a
week, via our online webstore, www.transactsupplies.com.
2
Sources and Availability of Raw Materials
We design our products to optimize product performance, quality, reliability and durability. These designs combine cost efficient
materials, sourcing and assembly methods with high standards of workmanship. Approximately 99% of our printer and terminal production is primarily through two third-party contract manufacturers in Asia. The remaining 1% of our products are
assembled in our Ithaca, New York facility largely on a configure-to-order basis using components and subassemblies that have been sourced from vendors and contract manufacturers around the world.
We procure component parts and subassemblies for use in the assembly of our hardware products in Ithaca, New York. Critical
component parts and subassemblies include thermal and inkjet print heads, printing/cutting mechanisms, power supplies, motors, injection molded plastic parts, LCD screens, circuit boards and electronic components, which are obtained from domestic and
foreign suppliers at competitive prices. As a result of the majority of our production being performed by our contract manufacturers, the majority of our purchases consist of fully-assembled printers and terminals produced by our contract
manufacturers and, to a much lesser extent, component parts. We typically strive to maintain more than one source for our component parts, subassemblies and fully assembled printers and terminals to reduce the risk of parts shortages or
unavailability. However, we could experience temporary disruption if certain suppliers ceased doing business with us, as described below.
We currently buy a majority of our thermal print mechanisms, an important component of our thermal printers, and fully assembled
printers for several of our printer and food service technology terminal models, from one foreign contract manufacturer in China and to a lesser extent, one other foreign contract manufacturer in Thailand. Although we believe that other contract
manufacturers could provide similar thermal print mechanisms or fully assembled printers and terminals, on comparable terms, a change in contract manufacturers could cause a delay in manufacturing and possible loss of sales, which may have a material
adverse effect on our operating results. Although we do not have supply agreements with our foreign contract manufacturers, our relationship with both remain strong and we have no reason to believe that either will discontinue their supply of
thermal print mechanisms or fully assembled printers to us during 2020 or that their terms to us will be substantially less favorable than they have been historically. Due to the impact from the Chinese tariff, we are seeking to increasingly
transfer production from our largest contract manufacturer in China to our contract manufacturer in Thailand during 2020.
HP Inc. (“HP”) is the sole supplier of inkjet cartridges that are used in all our banking inkjet printers. Though we have exited the
banking market as of December 31, 2018, we still sell a substantial number of HP inkjet cartridges as a consumable product through TSG. Although other inkjet cartridges are compatible with our banking inkjet printers, the loss of the supply of HP
inkjet cartridges could have a material adverse effect on the sale of our TSG consumable products. Our relationship with HP remains stable and we have no reason to believe that HP will discontinue its supply of inkjet cartridges to us or that their
terms to us will be materially different than they have been historically. The inkjet cartridges we purchase from HP are used not only in our inkjet printers for the POS automation and banking market, but also in other manufacturer’s printing
devices across several other markets.
Canon, Inc. (“Canon”) is the sole supplier of inkjet cartridges and other consumable items (“Canon Consumables”) that are used in our
Printrex® 980 oil and gas printer. The loss of supply of Canon Consumables would have a material adverse effect on the sale of Printrex 980® printers and the Canon Consumables. We have a supply agreement with Canon to supply us with Canon
Consumables until May 2020. Prices under this agreement were fixed through May 2013 but may be changed during the remainder of the agreement if the exchange rate fluctuates significantly between the Japanese yen and the U.S. dollar.
Patents and Proprietary Information
TransAct relies on a combination of trade secrets, patents, employee and third-party nondisclosure agreements, copyright laws and
contractual rights to establish and protect its proprietary rights in its products. We hold 36 United States and 37 foreign patents and have 8 United States and 3 foreign patent applications pending pertaining to our products. The duration of these
patents range from 1 to 15 years. The expiration of any individual patent would not have a significant negative impact on our business. We regard certain manufacturing processes and designs to be proprietary and attempt to protect them through
employee and third-party nondisclosure agreements and similar means. It may be possible for unauthorized third parties to copy certain portions of our products or to reverse engineer or otherwise obtain and use, to our detriment, information that we
regard as proprietary. Moreover, the laws of some foreign countries do not afford the same protection to our proprietary rights as do the laws of the United States. There can be no assurance that legal protections we rely upon to protect our
proprietary position will be adequate or that our competitors will not independently develop technologies that are substantially equivalent or superior to our technologies.
Trademarks, Service Marks and Copyrights
We own or have rights to trademarks, service marks, trade names and copyrights that we use in connection with the operation of our
business, including our corporate names, logos and website names. Other trademarks, service marks and trade names appearing in this Annual Report on Form 10-K are the property of their respective owners. The trademarks we own include TransAct®,
BOHA!TM, AccuDate™, Epic, EPICENTRAL™, Ithaca® and Printrex®. Solely for convenience, some of the trademarks, service marks, trade names and copyrights referred to in this annual report on Form 10-K are listed without the ©, ® and ™
symbols, but we will assert, to the fullest extent under applicable law, our rights to our trademarks, service marks, trade names and copyrights.
Seasonality
Restaurants typically reduce purchases of equipment in the fourth quarter due to the increased volume of transactions during the
holiday period, which may negatively impact sales of our food service technology terminals or POS printers.
Working Capital
Inventory, accounts receivable, and accounts payable levels, payment terms, and where applicable, return policies are in accordance
with the general practices of the industry and standard business procedures. See also Item 7. Management’s Discussion and Analysis of Financial Condition and Results of Operations.
3
Certain Significant Customers
IGT is our most significant customer and has been since 1995. We sell both on-line lottery printers and casino and gaming printers
to IGT. On May 29, 2015, we signed an agreement with IGT to sell on-line lottery and casino printers to IGT on a non-exclusive basis through December 31, 2019. We decided not to renew the agreement upon its expiration and to exit the on-line
lottery market. Although we no longer have an agreement with IGT, we expect to continue selling casino and gaming printers to IGT in the future but will no longer sell on-line lottery printers other than expected last time purchases by IGT in 2020.
Sales to IGT represented 14%, 18% and 35% of our total net sales for the years ended December 31, 2019, 2018 and 2017, respectively.
Backlog
Our backlog of firm orders was approximately $5.7 million as of February 29, 2020, compared to $6.9 million as of February 28,
2019. Based on customers’ current delivery requirements, we expect to fill and recognize as revenue $5.4 million of our current backlog during 2020, $0.2 million during 2021 and the remaining balance of the amount during 2022.
Competition
The market for transaction-based and specialty printers and food service technology terminals is extremely competitive, and we expect
such competition to continue in the future. However, we experience less competition for EPICENTRALTM software due to the highly customized nature of the product. We compete with a number of companies, many of which have greater
financial, technical and marketing resources than TransAct. We believe our ability to compete successfully depends on a number of factors both within and outside our control, including durability, reliability, quality, design capability, product
customization, price, customer support, success in developing new products, manufacturing expertise and capacity, supply of component parts and materials, strategic relationships with suppliers, the timing of new product introductions by us and our
competitors, general market, economic and political conditions and, in some cases, the uniqueness of our products.
In the food service technology market, we primarily compete with Avery Dennison Corporation, Ecolab Inc., ITD Food Safety, CMC
Daymark, Integrated Control Corp, Digi International, Squadle Inc., Jolt Software and Zenput. We compete in this market based largely on our ability to provide highly specialized software and purpose-built products and ongoing technical support.
In the POS automation and banking market, we primarily compete with Epson America, Inc., which holds a dominant market position. We
also compete, to a much lesser extent, with CognitiveTPG, Star Micronics America, Inc., Citizen -- CBM America Corporation, Pertech Industries, Inc., Addmaster, and Samsung/Bixolon. Certain competitors of ours have greater financial resources and
lower costs attributable to higher volume production which enables them to occasionally offer lower prices than us. However, we have exited the banking market and will continue to deemphasize efforts in the POS automation market going forward as we
have shifted our focus toward our higher-value, technology enabled food service technology and casino and gaming products.
In the casino and gaming market (consisting principally of slot machine printing, VLT transaction printing and promotional coupon
printing), we compete with several companies including JCM Global, Nanoptix, Inc., Custom Engineering SPA, Eurocoin and others. Certain of our products sold for casino and gaming applications compete based upon our ability to provide highly
specialized products, custom engineering and ongoing technical support.
In the lottery market (consisting principally of on-line lottery transaction printing), we compete with other lottery printer
providers such as Custom Engineering SPA, Star Micronics and Wincor Nixdorf. However, we have exited the lottery market going forward as we have shifted our focus toward our higher-value, technology enabled food service technology and casino and
gaming products.
In the oil and gas market, our Printrex® products compete primarily with the products of Imaging Systems Group, Inc. and Neuralog
Inc. We compete in this market based largely on our ability to provide specialized, custom-engineered products.
The market in which TSG competes is highly fragmented, and we compete with numerous competitors of various sizes, including POS and
internet resellers and paper converters depending on the geographic area.
Our strategy for competing in our markets is to continually develop new products (hardware and software), such as BOHA!TM
in 2019, and product line extensions that are technologically advanced and provide differentiated features and functions, to increase our geographic market penetration, to take advantage of strategic relationships, and to lower the cost of our
products by sourcing certain products overseas. Although we believe that our products, operations and relationships provide a competitive foundation, there can be no assurance that we will compete successfully in the future. In addition, our
products utilize certain thermal and inkjet printing technologies. If new technologies are introduced, or existing technologies evolve, we may be required to incorporate these technologies into our products. Alternatively, if such technologies were
to become available to our competitors, our products could become obsolete, which could have a significant negative impact on our business.
Environment Compliance
Our compliance with federal, state and local laws and regulations relating to environmental protection and discharge of hazardous
materials has not had a material impact on our capital expenditures, earnings or competitive position, and we do not anticipate any material impact from such compliance in the future.
Available Information
We make available free of charge through the “Investor Relations” tab on our Internet website, www.transact-tech.com, our Annual
Report on Form 10-K, quarterly reports on Form 10-Q, current reports on Form 8-K, proxy statements and all amendments to those reports and statements as soon as reasonably practicable after such material is electronically filed with or furnished to
the Securities and Exchange Commission (“SEC”) pursuant to Sections 13(a) or 15(d) of the Exchange Act. The SEC maintains reports, proxy and information statements, and other information regarding issuers that file electronically with the SEC at
http;//www.sec.gov. The content on any website referred to in this Form 10-K is not incorporated by reference in this Form 10-K unless expressly noted.
4
Employees
As of December 31, 2019, TransAct and our subsidiaries employed 134 persons, all of whom were full-time employees. None of our
employees are unionized, and we consider our relationships with our employees to be good.
Information about our Executive Officers
The following is a list of the names and ages of all executive officers of the registrant, indicating all positions and offices with
the registrant held by each such person and each person’s principal occupations and employment during at least the past five years.
|
Name
|
|
Age
|
|
Position
|
|
|
Bart C. Shuldman
|
|
|
62
|
|
Chairman of the Board and Chief Executive Officer
|
|
Steven A. DeMartino
|
|
|
50
|
|
President, Chief Financial Officer, Treasurer and Secretary
|
|
Donald E. Brooks
|
|
|
67
|
|
Senior Vice President-Engineering
|
|
Tracey S. Chernay
|
|
|
60
|
|
Senior Vice President, Casino, Gaming and Lottery Sales
|
|
Andrew J. Hoffman
|
|
|
62
|
|
Senior Vice President, Operations
|
|
David B. Peters
|
41
|
Vice President and Chief Accounting Officer
|
|||
|
Raymond T. Walsh, Jr.
|
34
|
Senior Vice President, Global Sales
|
|||
Bart C. Shuldman has been Chief Executive Officer, President and a Director of the Company since its formation in June 1996. In
February 2001, Mr. Shuldman was elected Chairman of the Board. Mr. Shuldman relinquished the President title, effective June 1, 2010, to focus on new products and markets, international expansion and potential acquisitions.
Steven A. DeMartino was named as TransAct’s President, Chief Financial Officer, Treasurer and Secretary on June 1, 2010. Previously,
Mr. DeMartino served as Executive Vice President, Chief Financial Officer, Treasurer and Secretary from June 2004 to May 2010, Senior Vice President, Finance and Information Technology from October 2001 to May 2004, Vice President and Corporate
Controller from January 1998 to October 2001, and Corporate Controller from August 1996 to December 1997. Mr. DeMartino is a certified public accountant.
Donald E. Brooks was appointed Senior Vice President of Engineering in April 2012. Previously, Mr. Brooks served as Vice President,
Engineering from September 2004 to April 2012, Senior Project Engineer from February 1998 to September 2004, Project Engineer from June 1997 to February 1998, Director of Electrical Engineering from March 1986 to June 1997 and Manager of Electronic
Development from December 1983 to March 1986.
Tracey S. Chernay was appointed Senior Vice President, Casino and Gaming Sales and Marketing in June 2010, with responsibility for
the sales and marketing of all casino and gaming products. Previously, Ms. Chernay served as Senior Vice President, Sales and Marketing from June 2007 to May 2010, Senior Vice President, Marketing and Sales, POS and Banking with the Company from
July 2006 to June 2007, and joined TransAct in May of 2005 as Senior Vice President, Marketing. Prior to joining TransAct, Ms. Chernay was employed with Xerox Corporation where she held the role of Manager, Worldwide Marketing since 2003, and
Manager, Sales Operations from 2000 to 2002. She joined Xerox Corporation in 1983.
Andrew J. Hoffman was appointed Senior Vice President, Operations for TransAct worldwide in November 2004. He served as Vice
President, Operations from September 1994 to November 2004.
David B. Peters was appointed Vice President and Chief Accounting Officer on March 1, 2018. Previously, Mr. Peters served as
Director, SEC and Financial Reporting since joining TransAct in March 2014. Prior to joining TransAct, Mr. Peters was employed with United Technologies Corporation from November 2006 to March 2014 where he served in various financial management
positions. Mr. Peters is a certified public accountant.
Raymond T. Walsh, Jr. was appointed Senior Vice President, Global Sales on February 27, 2019. Previously, Mr. Walsh served as Vice
President, Global Sales since 2018. Mr. Walsh joined TransAct in 2006 and has held several sales positions of increasing responsibility with the Company. Prior to joining TransAct, Mr. Walsh served as the Senior Manager of Business Development at
Nerac.
There are no family relationships between any of our executive officers and there is no arrangement or understanding between any of
such officers and any other person pursuant to which he or she was selected as an officer. Each of our executive officers was elected by the Board of Directors to hold office until his or her successor is elected and qualified or until his or her
earlier resignation or removal.
Investors should carefully consider the risks, uncertainties and other factors described below, as well as other disclosures in
Management’s Discussion and Analysis of Financial Condition and Results of Operations, because they could have a material adverse effect on our business, financial condition, operating results, and growth prospects. The risks described below are not
the only ones facing our Company. Additional risks and uncertainties not presently known to us, or that we currently believe to be immaterial, may also impair our business operations. In the event that such risks or uncertainties materialize, our
business, financial condition, and results of operations could be materially adversely affected.
We assume no obligation (and specifically disclaim any such obligation) to update these Risk Factors or any other forward-looking
statements contained in this Form 10-K to reflect actual results, changes in assumptions or other factors affecting such forward-looking statements, except as required by law.
5
Risks Related to our Business
Our operating results and financial condition may fluctuate.
Our operating results and financial condition may fluctuate from quarter-to-quarter and year-to-year and are likely to continue to
vary due to a number of factors, many of which are not within our control. If our operating results do not meet the expectations of securities analysts or investors, who may derive their expectations by extrapolating data from recent historical
operating results, the market price of our common stock will likely decline. Fluctuations in our operating results and financial condition may be due to a number of factors, including, but not limited to, those identified throughout this “Risk
Factors” section:
| ● |
delays between our expenditures to develop and market new or enhanced products and consumables and the generation of sales from those products;
|
| ● |
the geographic distribution of our sales and our supply chain;
|
| ● |
market acceptance of our products, both domestically and internationally;
|
| ● |
development of new competitive products by others;
|
| ● |
our responses to price competition;
|
| ● |
our level of research and development activities;
|
| ● |
changes in the amount that we spend to develop, acquire or license new products, consumables, technologies or businesses;
|
| ● |
changes in the amount we spend to promote our products and services;
|
| ● |
changes in the cost of satisfying our warranty obligations and servicing our installed base of products;
|
| ● |
availability of third-party components at reasonable prices;
|
| ● |
general economic and industry conditions, including changes in interest rates affecting returns on cash balances and investments, that affect customer demand;
|
| ● |
fluctuations of world-wide oil and gas prices;
|
| ● |
the dependence of our supply chain on a few, foreign third-party manufacturers and suppliers;
|
| ● |
severe weather events, public health crises, and other external events out of our control that can disrupt our operations or the operations of our customers’ or
suppliers’ facilities; and
|
| ● |
changes in accounting rules.
|
Due to all of the foregoing factors, and the other risks discussed in this Form 10-K, quarter-to-quarter comparisons of our operating
results may not be an indicator of future performance.
Our revenue and profitability depend on our ability to continue to develop, on a timely basis,
new products and technologies which are free from hardware or software anomalies and cannot be fraudulently manipulated, and customer acceptance of such products.
Our success depends upon our ability to timely adapt our capabilities and processes to meet the demands of producing new and
innovative products. Because our newer products contain software and generally are more technologically sophisticated than those we have produced in the past, we must continually refine our capabilities to meet the needs of our product innovation.
If we cannot efficiently adapt our infrastructure to meet the needs of our product innovations in a timely manner, our business could be negatively impacted.
In addition, even if we successfully develop such products, there is no assurance that our innovations will be accepted by our
customers. Developing and marketing new products, such as our BOHA! ecosystem, is costly, and our business could be materially adversely affected if we are unable to generate sales of such products or if our existing or new customers do not quickly
accept such products. Customer acceptance is crucial because new products typically have very little competition and market penetration due to their novelty. Although we develop new products with the input of our customers, which has contributed to
the early success of BOHA!, customer acceptance is never assured may take time to materialize.
We compete in highly competitive markets, which are likely to become more competitive.
Competitors may be able to respond more quickly to new or emerging technology and changes in customer requirements.
We face significant competition in developing and selling our printers, terminals, software, consumables and
services. Our principal competitors have substantial marketing, financial, development and personnel resources. To remain competitive, we believe we must continue to provide:
| ● |
technologically advanced products that satisfy the user demands;
|
| ● |
superior customer service;
|
| ● |
high levels of quality and reliability; and
|
| ● |
dependable and efficient distribution networks.
|
We cannot ensure we will be able to compete successfully against current or future competitors. Increased competition may result in
price reductions, lower gross profit margins and loss of market share, and could require increased spending on research and development, sales and marketing and customer support. Some competitors may make strategic acquisitions or establish
cooperative relationships with suppliers or companies that produce complementary products. Any of these factors could reduce our earnings.
Our success will depend on our ability to sustain and manage growth.
As part of our business strategy, we intend to pursue a growth strategy. Assuming this growth occurs, it will require the expansion
of customer relationships in international markets, the successful development and marketing of new products for our existing and new markets, expanded internal sales and marketing, customer service and support, and the continued implementation and
improvement of our operational, financial and management information systems.
6
To the extent that we seek growth through acquisitions, our ability to manage our growth will also depend on our
ability to integrate businesses that have previously operated independently. We may not be able to achieve this integration without encountering difficulties or experiencing the loss of key employees, customers or suppliers. It may be difficult to
design and implement effective financial controls for combined operations and differences in existing controls for each business may result in weaknesses that require remediation when the financial controls and reporting functions are combined. As
we pursue acquisitions, we may incur legal, accounting and other transaction related expenses for unsuccessful acquisition attempts that could adversely affect our results of operations in the period in which they are incurred.
There can be no assurance that we will be able to successfully implement our growth strategy, or that we can
successfully manage expanded operations, if they occur. As we expand, we may from time to time experience constraints that will adversely affect our ability to satisfy customer demand in a timely fashion. Failure to manage growth effectively could
adversely affect our results of operations and financial condition.
Material weaknesses in our internal control over financial reporting have been identified, and
if we are unable to implement and maintain effective internal control over financial reporting, or our independent registered public accounting firm is unable to provide an unqualified report thereon, we could be materially adversely affected.
Material weaknesses in our internal control over financial reporting existed as of December 31, 2018 and 2019
regarding our internal controls over user access to ensure appropriate segregation of duties and to adequately restrict user access to appropriate personnel. Specifically, the provisioning and user recertification controls are not designed to ensure
users maintain proper segregation of duties and therefore could have inappropriate access rights. Additionally, we identified a material weakness in controls over key spreadsheets supporting our accounting records. Specifically, we did not design
adequate controls to address the completeness and accuracy of information included in key spreadsheets. As a result of these material weaknesses, management concluded that our internal control over financial reporting was not effective as of
December 31, 2019.
Unless and until these material weaknesses have been remediated or should new material weaknesses arise or be
discovered in the future, a material misstatement could occur and go undetected in our interim or annual consolidated financial statements. As a result, we may experience delays in fulfilling our reporting obligations or complying with federal
securities laws, which could result in investigations and sanctions by regulatory authorities, including, but not limited to, the Securities and Exchange Commission (the “SEC”), and may result in defaults or accelerations under our credit facility in
the event that we are unable to timely file reports with the SEC, to the extent that in such an event, we are unable to obtain waivers from our lender. Any of these results could adversely affect our business and the value of our common stock.
In the casino and gaming market and the lottery market, we are dependent on sales to one large
customer; the loss of this customer or reduction in orders from this customer could materially affect our sales.
Lottery and, to a lesser extent, casino and gaming sales to IGT have represented a material percentage of our net
sales since 1995. A reduction, delay or cancellation in orders from this customer, including reductions or delays due to market, economic, or competitive conditions in the industries in which we serve, could have a material adverse effect upon our
results of operations.
General economic conditions could have a material adverse effect on our business, operating
results and financial condition.
Our business is subject to general economic conditions. Uncertainty or negative trends in U.S. or international economic and
investment climates, including the impact of Brexit and recent developments in U.S.-China trade relations (discussed separately below), could adversely affect our business. For example, customers or potential customers could reduce or delay orders,
key suppliers and customers could become insolvent, which could result in production delays, and our customers may not be able to obtain credit. Any of these possible effects could impact our ability to effectively manage inventory levels and
collect receivables, create unabsorbed costs due to lower net sales, and ultimately decrease our net sales and profitability including write-downs of assets.
Fluctuations in oil and gas prices could adversely affect drilling and exploration activities
by oil and gas companies and our revenue in our Printrex market. If oil and gas prices remain volatile, or if oil or gas prices remain low or decline further, the demand for our Printrex products could be adversely affected.
The demand for our Printrex products depends on the level of spending by oil and gas companies for drilling and exploratory
activities, which are affected by short-term and long-term trends in oil and gas prices, including current and anticipated oil and gas prices. Oil and gas prices, as well as the level of drilling and exploration, historically have been extremely
volatile and are expected to continue to be highly volatile. If oil and gas prices continue to remain low or decline further, or if there is a further reduction in drilling and exploration activities, the demand for our Printrex products could be
materially and adversely affected.
If market conditions deteriorate or future results of operations are less than expected, a
valuation allowance may be required for all or a portion of our deferred tax assets.
We currently have deferred tax assets, which may be used to reduce taxable income in the future. We assess the realization of these
deferred tax assets on a quarterly basis, and if we determine that it is more likely than not that some portion of these assets will not be realized, an income tax valuation allowance is recorded. If market conditions deteriorate or future results
of operations are less than expected, or there is a change to applicable tax rules, future assessments may result in a determination that it is more likely than not that some or all of our net deferred tax assets are not realizable. As a result, we
may need to establish a valuation allowance for all or a portion of our net deferred tax assets, which may have a material adverse effect on our business, results of operations and financial condition.
We rely on distributors and resellers to sell our products and services.
We use a variety of distribution channels, including OEMs and distributors, to market and sell our products and services. We may be
adversely impacted by any conflicts that could arise between and among our various sales channels.
7
Our dependence upon distributors and resellers exposes us to numerous risks, including:
| ● |
loss of channel and the ability to bring new products to market;
|
| ● |
concentration of credit risk, including disruption in distribution should the distributors and / or resellers’ financial condition deteriorate;
|
| ● |
reduced visibility to end user demand and pricing issues which makes forecasting more difficult;
|
| ● |
distributors or resellers leveraging their buying power to change the terms of pricing, payment and product delivery schedules; and
|
| ● |
direct competition should a distributor or reseller decide to manufacture printers internally or source printers from a competitor.
|
We cannot guarantee that resellers will not reduce, delay or eliminate purchases from us, which could have a material adverse effect
upon the business, consolidated results of operations and financial condition.
We are dependent upon two manufacturers located in China and Thailand for the manufacturing
and assembly of our printers and terminals, and their operations have been disrupted by the outbreak of the Coronavirus. The impact of this disruption on the Company is uncertain at this time, but this disruption, and any further or future disruption
in their businesses or operations, such as those caused by political, social or economic instability, trade restrictions or tariffs, severe weather, additional public health crises and other events out of our control, could materially adversely
affect our business, financial condition and results of operations.
In an effort to achieve additional cost savings and operation benefits, we have outsourced substantially all of the manufacturing and
assembly of our printers and terminals to two contract manufacturers located in Asia. Approximately 80% of our printer and terminal manufacturing is conducted by one third-party manufacturer located in China, and an additional 19% is conducted by
one other third-party manufacturers located in Thailand. As a result, we are dependent on them for the manufacturing of our products, and any disruption in such manufacturing or the export of products from these manufacturers to the U.S. may
adversely affect our business, financial condition and results of operations.
Risks affecting the businesses and operations of our two manufacturers in Asia include: political and regional strife; war; labor
shortages; severe weather and natural disasters such as earthquakes, hurricanes, fires, and floods; lengthy power outages; increased pricing, financial instability and capacity constraints of shippers; and concerns with or threats of public health
crises, contagious diseases or health epidemics. The risk to our business posed by any disruption in manufacturing is exacerbated by the concentration of our manufacturing operations in two manufacturers both located in Asia.
In December 2019, a novel strain of the coronavirus was reported in China that has subsequently spread outside of China. In response
to the coronavirus outbreak, the Chinese government has placed restrictions on travel and mandated business closures. Such restrictions and closures have started to disrupt our supply chain by delaying product shipments from our contract
manufacturers during 2020. Although the impact of such disruptions and delays has not had a material impact on our results of operations, there is significant uncertainty relating to the outbreak of coronavirus as well as the potential effects of
such outbreak on our business.
The extent to which the coronavirus impacts our operations will depend on future developments, which are highly uncertain and cannot
be predicted with confidence, including the duration of the outbreak, new information which may emerge concerning the severity of the coronavirus and the actions to contain the coronavirus or treat its impact, among others. Without the contract
manufacturers continuing to manufacture our products and the continuing operation of the contract manufacturers’ facilities, we will have limited means for the final assembly of a majority of our products until we are able to secure the manufacturing
capability at another facility or develop an alternative manufacturing facility, which could be costly and time consuming and have a material adverse effect on our operating and financial results. However, any such risk is partially offset by the
current inventory of printing solutions maintained at our Ithaca, New York and, to a lesser extent, Las Vegas, Nevada facilities.
We may also incur increased business continuity and reputational risks to the extent that we continue to outsource the manufacturing
and assembly of our products to foreign third-party service providers. For example, outsourcing of manufacturing prevents us from exercising control over the assembly of certain of our products and related operations or processes, including the
internal controls associated with operations and processes conducted and the quality of our products assembled by contract manufacturers. If we are unable to effectively manage and oversee our outsourcing strategy, we may not realize cost structure
efficiencies and our operating and financial results could be materially adversely affected. Outsourcing also exposes us to increased risk of infringement or misappropriation of our intellectual property, to which our manufacturers have access.
Because our manufacturers are located in Asia, there is no guarantee that our intellectual property rights will be protected or enforced to the same extent as under U.S. federal and state laws. Consequently, we may not be able to prevent
third-parties from developing or selling products made using our technologies.
We face risks associated with manufacturing forecasts.
If we fail to predict our manufacturing requirements accurately, we could incur additional costs or experience
manufacturing delays, which could cause us to lose orders or customers and result in lower net sales. We currently use a rolling 12-month forecast based primarily on our anticipated product orders and our product order history to help determine our
requirements for components and materials. It is very important that we accurately predict both the demand for our products and the lead-time required to obtain the necessary components and raw materials.
Lead times for materials and components that we order vary significantly and depend on factors such as the
specific supplier, the size of the order, contract terms, and demand for each component at a given time. If we underestimate our requirements, we may have inadequate manufacturing capacity or inventory, which could interrupt manufacturing of our
products and result in delays in shipments and net sales. If we overestimate our requirements, we could have excess inventory of parts and finished products. In addition, delays in the manufacturing of our products could cause us to lose orders or
customers.
We purchase component parts and consumable products from third-party and sole source
suppliers, and any interference with this supply chain may impact our ability to manufacture and sell our products.
We rely on third-party or sole source suppliers to provide certain key components for our products. We do not have guaranteed supply
contracts with any of our component suppliers, and our suppliers could delay shipments, increase prices or cease manufacturing or selling such components to us at any time. A disruption in the supply of such component parts and consumable products
could delay our production and/or the release of our new products and hinder our ability to meet our commitments to customers. If we are unable to obtain a sufficient quantity of these components on commercially reasonable terms or in a timely
manner, or if we are unable to obtain alternative sources for the components, sales of our products could be delayed or halted entirely or we may be required to redesign our products. Any of these events could result in lost sales, reduced gross
margins or damage to our end-customer relationships, which would have a material adverse effect on our operations and financial results.
8
In addition to maintaining offices in the UK and Macau, we sell and ship a significant portion
of our products internationally and rely on third parties that make up our global salesforce. The international nature of our operations may expose us to certain risks associated with doing business outside of the U.S., including risks posed by the
UK’s withdrawal from the European Union, tariffs, and changes in trade relations.
We sell a significant amount of our products to customers outside the United States. Shipments to international customers are
expected to continue to account for a material portion of net sales. In addition, our manufacturers and suppliers are largely located in Asia. As a result, our products are largely exported to one of our facilities in the United States, which makes
our operations vulnerable to disruptions in trade that could adversely affect our business results.
Our international operations, including our reliance on manufacturers and suppliers located in Asia, our worldwide sales team, and
our sales to customers located outside the United States, expose us to disruptions in trade and other associated risks such as:
| ● |
the imposition of additional duties, tariffs, quotas, taxes, trade barriers, capital flow restrictions and other charges on imports and exports by the United States
or the governments of the countries in which we or our manufacturers and suppliers operate;
|
| ● |
delays in the delivery of cargo due to port security considerations, labor disputes such as dock strikes, and our reliance on a limited number of shipping and air
carriers, which may experience capacity issues that adversely affect our ability to ship inventory in a timely manner or for an acceptable cost;
|
| ● |
fluctuations in the value of the U.S. Dollar against foreign currencies, which could restrict sales, or increase costs of purchasing, in foreign countries;
|
| ● |
economic or political instability in any of the countries in which we or our manufacturers or suppliers operate, which could result in a reduction in demand for our
products due to political and economic instability or impair our foreign assets;
|
| ● |
a reduced ability or inability to sell in or purchase from certain markets as a result of export or import restrictions;
|
| ● |
potentially limited intellectual property protection in certain countries, such as China, may limit recourse against infringing products or cause us to refrain from
selling in certain geographic territories; and
|
| ● |
reliance on a limited number of shipping and air carriers who may experience capacity issues that adversely affect our ability to ship inventory in a timely manner
or for an acceptable cost; and
|
| ● |
economic uncertainties and adverse economic conditions (including inflation and recession).
|
Although we carry business interruption insurance to cover lost revenue and profits in an amount we consider adequate, this insurance
does not cover all possible situations. In addition, the business interruption insurance would not compensate us for the loss of opportunity and potential adverse impact, both short-term and long-term, on relations with our existing customers
resulting from our inability to produce products for them.
Outside of the United States we maintain offices in the UK and Macau. Effective January 31, 2020, the UK formally withdrew from the
European Union. Following the UK’s withdrawal, often referred to as “Brexit,” the UK entered a transition period, which is currently set to end on December 31, 2020. It is expected that the UK will negotiate a new free trade agreement with the
European Union during this transition period. In the event that no such agreement is reached prior to the end of the transition period, the UK will have no international agreement governing its ongoing relationship with the EU.
We are still evaluating the impact of Brexit on our business, particularly as it relates to our UK subsidiary, during and after this
transition period. Adverse consequences such as deterioration in economic conditions and volatility in currency exchange rates could have a negative impact on the Company's operations, financial condition and results of operations. In addition, the
future trade relationship between the UK and the European Union remains uncertain, and any incremental regulatory controls and regulations governing trade between the UK and the European Union could have adverse consequences on the steel industry in
the UK and/or the European Union and could negatively impact the Company's operations and financial condition.
Our business could be adversely affected by actual or threatened terrorist attacks or the
related heightened security measures, military actions and other efforts to combat terrorism.
Our business could be adversely affected by actual or threatened terrorist attacks or the related heightened security measures,
military actions and other efforts to combat terrorism. It is possible that terrorist attacks could be directed at important locations for the gaming industry. Heightened security measures and other efforts to combat terrorism may also have an
adverse effect on the gaming industry by reducing tourism. Any of these developments could also negatively affect the general economy and consumer confidence. Any downturn in the economy in general, or in the gaming industry in particular could
result in a reduced demand for our products and could adversely affect our business and results of operations. In addition, heightened security measures may cause certain governments to restrict the import or export of goods, which may have an
adverse effect on our ability to buy and sell goods.
We depend on key personnel, the loss of which could materially impact our business.
Our future success will depend in significant part upon the continued service of certain key management and other
personnel and our continuing ability to attract and retain highly qualified managerial, technical and sales and marketing personnel. There can be no assurance that we will be able to recruit and retain such personnel. The loss of either Bart C.
Shuldman, the Company's Chairman of the Board and Chief Executive Officer, or Steven A. DeMartino, the Company’s President, Chief Financial Officer, Treasurer and Secretary, or the loss of certain groups of key employees, could have a material
adverse effect on our results of operations.
9
The inability to protect our intellectual property rights could harm our reputation, damage
our business or interfere with our competitive position, and infringement on the intellectual property rights of others, or claims thereof, could put us at a competitive disadvantage, and any related litigation could be time consuming and costly.
Our intellectual property is valuable and provides us with certain competitive advantages. Copyrights, patents, trademarks, service
marks, trade secrets, nondisclosure agreements and contracts are used to protect these proprietary rights. Despite these precautions, it may be possible for third parties to copy aspects of our products or, without authorization, to obtain and use
information which we regard as trade secrets.
In addition, prosecuting and defending infringement lawsuits is very expensive. We are committed to aggressively asserting and
defending our technology and related intellectual property rights, which we have spent a significant amount of money to develop. Similarly, third-parties may claim, from time to time, that we have violated their intellectual property rights. To the
extent of a violation of a third-party’s patent or other intellectual property right, we may be prevented from operating our business as planned and may be required to pay damages, to obtain a license, if available, or to use a non-infringing method,
if possible, to accomplish our objectives. Any such claims could result in costly litigation and, if successful, could result in costly judgments or settlements.
The expense of prosecuting or defending any future infringement lawsuits could have a material adverse effect on our business,
financial condition and results of operations. Intellectual property litigation is generally complex, costly, protracted, and highly disruptive to business operations by diverting the attention and energies of management and key technical personnel.
Cyber-security and privacy breaches, cyber-attacks, or other disruptions could expose us to
liability, affect our business, and damage our reputation.
We are increasingly dependent on our information technology systems and infrastructure for our business. We
collect, store, and transmit sensitive information including intellectual property, proprietary business information and personal information in connection with business operations. The secure maintenance of this information is critical to our
operations and business strategy. Some of this information could be an attractive target of criminal attack by third parties with a wide range of motives and expertise, including organized criminal groups, disgruntled current or former employees, and
others. Cyber-attacks are of ever-increasing levels of sophistication, and despite our extensive security measures, our information technology and infrastructure may be vulnerable to such attacks or may be breached, including due to employee error or
malfeasance. Any such breach could compromise our networks and the information stored there could be accessed, publicly disclosed, lost or stolen. If our systems become compromised, we may not promptly discover the intrusion. Like other companies in
our industry, we have experienced attacks to our data and systems, including malware and computer viruses that we have been able to detect and eliminate. If our systems fail or are breached or disrupted, we could lose product sales, and suffer
reputational damage and loss of customer confidence. Such incidents would require notification to affected individuals and may result in legal claims or proceedings and liability under federal and state laws that protect the privacy and security of
personal information. Any one of these events could cause our business to be materially harmed and our results of operations to be adversely impacted.
We cannot provide any assurance that current laws, or any laws enacted in the future, will not
have a material adverse effect on our business.
Our operations are subject to laws, rules, regulations, including environmental regulations, government policies and other
requirements in each of the jurisdictions in which we conduct business. Changes in such laws, rules, regulations, policies or requirements could result in the need to modify our products and could affect the demand for our products, which may have
an adverse impact on our future operating results. If we do not comply with applicable laws, rules and regulations we could be subject to costs and liabilities and our business may be adversely impacted.
Risks Related to our Common Stock
Our stock price may fluctuate significantly.
The market price of our common stock could fluctuate significantly in response to variations in quarterly
operating results and other factors, such as:
| ● |
changes in our business, operations or prospects;
|
| ● |
developments in our relationships with our customers;
|
| ● |
announcements of new products or services by us or by our competitors;
|
| ● |
announcement or completion of acquisitions by us or by our competitors;
|
| ● |
changes in existing or adoption of additional government regulations;
|
| ● |
unfavorable or reduced analyst coverage; and
|
| ● |
prevailing domestic and international market and economic conditions.
|
In addition, the stock market may experience significant price fluctuations year-to-year. Broad market
fluctuations, general economic conditions and specific conditions in the industries in which we operate may adversely affect the market price of our common stock.
Limited trading volume and a reduction in analyst coverage of our common stock may contribute
to its price volatility.
Our common stock is traded on the Nasdaq Global Market. During the year ended December 31, 2019 the average
daily trading volume for our common stock as reported by the Nasdaq Global Market was approximately 19,000 shares. We are uncertain whether a more active trading market in our common stock will develop. In addition, many investment banks no longer
find it profitable to provide securities research on micro-cap and small-cap companies. As a result, relatively small trades may have a significant impact on the market price of our common stock, which could increase the volatility and depress the
price of our common stock.
Future sales of our common stock may cause our stock price to decline.
In the future, we may sell additional shares of our common stock in public or private offerings, and we may also issue additional
shares of our common stock to finance future acquisitions. Shares of our common stock are also available for future sale pursuant to stock options and other equity awards that we have granted to our employees, and in the future, we may grant
additional stock options and other forms of equity compensation to our employees. Sales of our common stock or the perception that such sales could occur may adversely affect prevailing market prices for shares of our common stock and could impair
our ability to raise capital through future offerings.
10
Our principal facilities as of December 31, 2019 are listed below. We believe that all facilities generally are in good condition,
adequately maintained and suitable for their present and currently contemplated uses.
|
Location
|
Operations Conducted
|
|
Size
(Approx. Sq.
Ft.)
|
|
Owned or
Leased
|
Lease Expiration
Date
|
|||
|
Hamden, Connecticut
|
Executive offices and sales office
|
|
|
11,100
|
|
Leased
|
April 30, 2027
|
||
|
Ithaca, New York*
|
Hardware design and development, assembly and service facility
|
|
|
73,900
|
|
Leased
|
May 31, 2021
|
||
|
Las Vegas, Nevada
|
Software design and development, service center and casino and gaming sales office
|
|
|
19,600
|
|
Leased
|
October 31, 2022
|
||
|
Doncaster, UK
|
Sales office and service center
|
|
|
6,000
|
|
Leased
|
August 26, 2026
|
||
|
Macau, China
|
Sales office
|
|
|
180
|
|
Leased
|
June 30, 2020
|
||
|
|
|
|
|
110,780
|
|
|
|
||
*On February 28, 2020, we signed
an amendment to extend our lease in Ithaca, New York to May 31, 2025.
The Company may, in the ordinary course of business, become a party to litigation involving collection matters, contract claims and
other legal proceedings relating to the conduct of its business. As of December 31, 2019, we are unaware of any legal proceedings pending or threatened against us that management believes are likely to have a material adverse effect on our business,
financial condition or results of operations.
11
PART II
Item 5. Market for Registrant’s Common Equity, Related Stockholder
Matters and Issuer Purchases of Equity Securities.
Our common stock is traded on the Nasdaq Global Market under the symbol TACT. As of February 28, 2020, there were 261 holders of
record of the common stock.
Issuer Purchases of Equity Securities
Prior to its expiration on December 31, 2019, we maintained a stock repurchase program (the "2018 Stock Repurchase Program") whereby
we were authorized to repurchase up to $5 million of our outstanding shares of common stock from time to time in the open market at prevailing market prices based on market conditions, share price and other factors. During 2019 we did not repurchase
any shares of our common stock. From the start of the 2018 Stock Repurchase Program on March 1, 2018 through December 31, 2018, we repurchased 156,410 shares of our common stock for approximately $2 million at an average price per share of $12.79.
Dividend Policy
In 2012, our Board of Directors initiated a quarterly cash dividend program which is subject to the Board’s approval each
quarter. Our Board of Directors declared an increase to the quarterly cash dividend from $0.06 to $0.07 per share in May 2013, from $0.07 to $0.08 per share in May 2014, and from $0.08 to $0.09 per share in May 2017. Dividends declared and paid on
our common stock totaled $2.7 million or $0.36 per in both 2019 and 2018. On January 23, 2020, our Board of Directors announced the cessation of our quarterly cash dividend on the Company’s common stock to accelerate the investment in sales and
marketing, continued product development and infrastructure of the BOHA! ecosystem. The final dividend payment was made in December 2019.
Sales of Unregistered Securities
None.
12
CORPORATE PERFORMANCE GRAPH
The following graph compares the cumulative total return on the Company’s Common Stock from December 31, 2014 through December 31,
2019, with the CRSP Total Return Index for the Nasdaq Stock Market (U.S.) and the Nasdaq Computer Hardware Stocks Index. The graph assumes that $100 was invested on December 31, 2014 in each of TransAct’s common stock, the CRSP Total Return Index for
the Nasdaq Stock Market (U.S.) and the Nasdaq Computer Manufacturer Stocks Index, and that all dividends were reinvested.
The performance graph shall not be deemed “filed” for purposes of Section 18 of the Exchange Act or incorporated by reference into
any filings of the Company under the Securities Act of 1933, as amended, or the Exchange Act, except as shall be expressly set forth by specific reference in such filing.
COMPARISON OF CUMULATIVE TOTAL RETURN AMONG
TRANSACT TECHNOLOGIES INCORPORATED COMMON STOCK,
THE CRSP TOTAL RETURN INDEX FOR THE NASDAQ STOCK MARKET (U.S.),
AND THE NASDAQ COMPUTER MANUFACTURER STOCKS INDEX
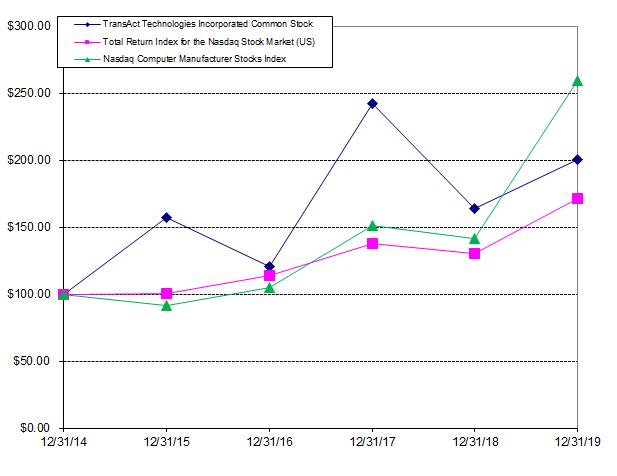
|
|
12/31/14
|
12/31/15
|
12/31/16
|
12/31/17
|
12/31/18
|
12/31/19
|
||||||||||||||||||
|
TransAct Technologies Incorporated Common Stock
|
$
|
100.00
|
$
|
157.04
|
$
|
120.66
|
$
|
242.23
|
$
|
164.17
|
$
|
200.55
|
||||||||||||
|
CRSP Total Return Index for the Nasdaq Stock Market (U.S.)
|
$
|
100.00
|
$
|
100.48
|
$
|
113.55
|
$
|
137.83
|
$
|
130.33
|
$
|
170.96
|
||||||||||||
|
Nasdaq Computer Hardware Stocks Index
|
$
|
100.00
|
$
|
91.05
|
$
|
104.94
|
$
|
150.94
|
$
|
141.35
|
$
|
259.32
|
||||||||||||
13
The following is summarized from our audited financial statements of the past five years:
|
|
Year Ended December 31,
|
|||||||||||||||||||
|
|
2019
|
2018
|
2017
|
2016
|
2015
|
|||||||||||||||
|
Consolidated Statement of Operations Data:
|
||||||||||||||||||||
|
Net sales
|
$
|
45,748
|
$
|
54,587
|
$
|
56,311
|
$
|
57,235
|
$
|
59,676
|
||||||||||
|
Gross profit
|
21,935
|
26,743
|
26,662
|
23,799
|
24,978
|
|||||||||||||||
|
Operating expenses
|
21,592
|
19,984
|
19,848
|
18,599
|
20,510
|
|||||||||||||||
|
Operating income
|
343
|
6,759
|
6,814
|
5,200
|
4,468
|
|||||||||||||||
|
Net income
|
516
|
5,426
|
3,211
|
3,617
|
3,092
|
|||||||||||||||
|
Net income per share:
|
||||||||||||||||||||
|
Basic
|
0.07
|
0.73
|
0.43
|
0.48
|
0.40
|
|||||||||||||||
|
Diluted
|
0.07
|
0.70
|
0.42
|
0.47
|
0.39
|
|||||||||||||||
|
Dividends declared and paid per share
|
0.36
|
0.36
|
0.35
|
0.32
|
0.32
|
|||||||||||||||
|
|
December 31,
|
|||||||||||||||||||
|
|
2019
|
2018
|
2017
|
2016
|
2015
|
|||||||||||||||
|
Consolidated Balance Sheet Data:
|
||||||||||||||||||||
|
Total assets
|
$
|
36,061
|
$
|
34,956
|
$
|
33,950
|
$
|
32,042
|
$
|
32,569
|
||||||||||
|
Shareholders’ equity
|
25,926
|
27,567
|
26,014
|
24,109
|
25,728
|
|||||||||||||||
This discussion should be read in conjunction with the Consolidated Financial Statements and notes thereto.
Overview
During the year ended December 31, 2019, we launched our BOHA! software-as-a-service (“SaaS”)-based software and hardware ecosystem.
BOHA! is a comprehensive ecosystem of cloud-based SaaS software applications and hardware designed to help restaurant and food service companies automate their back-of-house operations. BOHA! represents the first single-vendor solution to allow
customers to choose from any combination of applications for inventory management, temperature monitoring of food and equipment, food safety labeling, food recalls, checklists & procedures, equipment service management, timers and delivery
management. In order to accelerate the investment in sales and marketing and continued product development of the BOHA! ecosystem, the Board of Directors announced the Company will cease our quarterly dividend on the Company’s common stock. The
final dividend payment was made in December 2019.
During 2019, our sales decreased due to declines in all markets other than food service technology. POS automation and banking sales
declined due to lower sales of our Ithaca 9000 printer to McDonald’s in 2019 compared to higher than normal levels in 2018. Casino and gaming sales were lower in 2019 due to a large order from a domestic casino operator during 2018 that did not
reoccur in 2019 and lower casino and gaming sales to Europe in 2019 compared to 2018 due to a large order from a slot machine manufacturer to replace a competitor’s printer. Sales for our lottery market and TransAct Services Group (“TSG”) market
decreased in 2019 compared to 2018 due to lower sales to International Gaming Technology and its subsidiaries (“IGT”). TSG sales to IGT decreased due to lower sales of spare parts in the lottery market during 2019 compared to 2018. These sales
declines were as expected as we are no longer focusing on the lottery markets and therefore we expect lottery and TSG sales to continue to decrease in 2020 compared to 2019.
During the year ended December 31, 2019, our total net sales decreased 16% to approximately $45.7 million. We have reclassified
sales of labels and other recurring revenue items, which includes extended warranty and service contracts, and technical support services related to our food service technology market, previously included in TSG to Food Service Technology for all
periods presented in this Form 10-K. See the table below for a breakdown of our sales by market:
|
|
Year Ended
|
Year Ended
|
Change
|
|||||||||||||||||||||
|
(In thousands)
|
December 31, 2019
|
December 31, 2018
|
$ |
|
%
|
|||||||||||||||||||
|
Food service technology
|
$
|
6,104
|
13.3
|
%
|
$
|
5,086
|
9.3
|
%
|
$
|
1,018
|
20.0
|
%
|
||||||||||||
|
POS automation and banking
|
5,758
|
12.6
|
%
|
7,273
|
13.3
|
%
|
(1,515
|
)
|
(20.8
|
%)
|
||||||||||||||
|
Casino and gaming
|
21,529
|
47.1
|
%
|
26,593
|
48.7
|
%
|
(5,064
|
)
|
(19.0
|
%)
|
||||||||||||||
|
Lottery
|
1,291
|
2.8
|
%
|
3,093
|
5.7
|
%
|
(1,802
|
)
|
(58.3
|
%)
|
||||||||||||||
|
Printrex
|
1,166
|
2.6
|
%
|
1,297
|
2.4
|
%
|
(131
|
)
|
(10.1
|
%)
|
||||||||||||||
|
TSG
|
9,900
|
21.6
|
%
|
11,245
|
20.6
|
%
|
(1,345
|
)
|
(12.0
|
%)
|
||||||||||||||
|
$
|
45,748
|
100.0
|
%
|
$
|
54,587
|
100.0
|
%
|
$
|
(8,839
|
)
|
(16.2
|
%)
|
||||||||||||
Sales of our food service technology products increased 20% in the year ended December 31, 2019 compared to the year ended December
31, 2018. In the food service technology market, we focus on providing hardware products, which include terminals, handheld devices, tablets, temperature probes and temperature sensors; in addition to cloud-based software applications, labels and
other recurring revenue items. In 2019, we launched our BOHA! solution, which combines our latest generation terminal, cloud-based software applications and hardware into a unique solution to automate the back-of-house operations in restaurants and
food service operations. Food service technology sales increased in 2019 primarily due to a 264% increase in recurring revenue attributable to sales of BOHA!, which sales reflect subscriptions for the related software applications, as well as sales
of labels, extended warranty and service contracts, and technical support services. We expect food service technology to increase in 2020 as we plan to accelerate investments in selling and marketing and product development to exploit the
significant market opportunities.
Sales of our POS automation and banking products decreased 21% in the year ended December 31, 2019 compared to the year ended
December 31, 2018. In the POS market, we focus primarily on supplying printers that print receipts or linerless labels for customers in the restaurant and quick serve markets. During the year ended December 31, 2019, sales of our Ithaca 9000
printer to McDonald’s slowed from the record pace of the prior two years, which we expect to continue in 2020. In the banking market, we had focused mainly on supplying printers for use in bank teller stations at banks and financial institutions
primarily in the U.S. As we continue to shift our focus to our new food service technology market, we do not expect any future sales of these legacy products, as we exited the banking market at the end of 2018.
14
Sales of our casino and gaming products decreased 19% in 2019 compared to 2018. In our casino and gaming market, our focus lies
primarily in supplying printers worldwide for use in slot machines at casinos and racetracks, as well as in other electronic gaming devices that print tickets or receipts. Additionally, we supplement these printer sales with revenue from EPICENTRAL™,
our promotional printing system that enables casino operators to create promotional coupons and marketing messages and print them real time at the slot machine. The decrease of casino and gaming printer sales is primarily due to decreased domestic
and international sales of our thermal casino printers of 18% and 17%, respectively. The decrease in domestic thermal casino printers was driven primarily by lower sales to our OEMs and a large order of replacement printers from a domestic casino
operator in 2018 that did not reoccur in 2019. Total casino and gaming sales also decreased, although to a lesser extent, due to a 23% decrease in sales of our international off-premise gaming printers.
During the year ended December 31, 2019, total lottery printer sales decreased approximately 58% due to lower sales to IGT. Our
sales to IGT each year are directly dependent on the timing and number of new and upgraded lottery terminal installations IGT performs and are not indicative of IGT’s overall business or revenue. On December 31, 2019, we decided to end our
non-exclusive agreement with IGT and exit the lottery market as we have shifted our focus to our higher-value, technology-enabled market for food service technology and casino and gaming products. We do expect IGT to make a last time buy of lottery
printers in 2020, with no future sales expected beyond 2020.
Sales of our Printrex branded printers include wide format, rack mounted and vehicle mounted thermal printers used by customers to
log and plot oil field and down hole well drilling data in the oil and gas exploration industry. During the year ended December 31, 2019, we experienced a 10% decline in Printrex oil and gas printer sales. Although we will continue to fulfill
orders from existing customers during 2020, we have shifted our focus away from this market and towards our higher value, technology enabled restaurant solution terminals and casino and gaming products.
TSG, which sells service, replacement parts and consumable products, including receipt paper, ribbons and inkjet cartridges,
continues to offer a recurring revenue stream for the Company. TSG sales decreased 12% in 2019 from 2018 primarily due to lower sales of lottery printer spare parts to IGT for a legacy lottery printer. Although the installed base of our thermal
lottery printers remains large, we expect sales of spare parts to IGT to decline and overall TSG sales to decrease in 2020 compared to 2019.
Operationally, our gross margin was 47.9% in 2019, a decrease of 110 basis points from 2018 when we reached our highest reported full
year gross margin of 49%.
During 2019 our operating margin declined to 0.7% compared to 12.4% in 2018 primarily due to the 16% decline in sales and 8% increase
in operating expenses. Operating expenses increased primarily due to increased investments in the launch of BOHA!. During 2020, we expect operating expenses to increase more significantly compared to 2019, as we accelerate investment in engineering
and selling and marketing to take advantage of the opportunities we see in the food service technology market.
We reported net income of $0.5 million and net income per diluted share of $0.07 for 2019, compared to $5.4 million and net income
per diluted share of $0.70 for 2018. In terms of cash flow for 2019 we generated $4.8 million of cash from operating activities. We also returned $2.7 million to our shareholders during 2019 in the form of cash dividends. We ended the year with
cash and cash equivalents of $4.2 million and no debt on our Consolidated Balance Sheet at December 31, 2019.
Critical Accounting Policies and Estimates
The preparation of financial statements in conformity with generally accepted accounting principles requires management to make
estimates, judgments and assumptions that affect both Balance Sheet items and Statement of Income categories. Such estimates and judgments are based upon historical experience and certain assumptions that are believed to be reasonable in the
particular circumstances. We evaluate our assumptions on an ongoing basis by comparing actual results with our estimates. Actual results may differ from the original estimates.
The following accounting policies are those that we believe to be most critical in the preparation of our financial
statements. These items utilize assumptions and estimates about the effect of future events that are inherently uncertain and are therefore based on our judgment. Please refer to Note 2 – Summary of significant accounting policies in the
accompanying Consolidated Financial Statements for a complete listing of our accounting policies.
Revenue Recognition – We account for revenue in accordance with ASC Topic 606: Revenue from Contracts with Customers. We adopted ASC 606 effective January 1, 2018 and elected the modified retrospective approach. The results for
periods before 2018 were not adjusted for the new standard and there was no cumulative effect for the change in accounting at the date of adoption. In accordance with ASC 606, a performance obligation is a promise in a contract with a customer to
transfer a distinct good or service to the customer. Some of our contracts with customers contain a single performance obligation, while other contracts contain multiple performance obligations (most commonly when contracts include a hardware
product, software and extended warranties). A contract's transaction price is allocated to each distinct performance obligation and recognized as revenue when, or as, the performance obligation is satisfied.
The transaction price is determined based on the consideration to which the Company will be entitled in exchange for transferring
services to the customer. To the extent the transaction price includes variable consideration, such as price protection, reserves for returns and other allowances, the Company estimates the amount of variable consideration that should be included in
the transaction price utilizing either the “expected value” method or the “most likely amount” method depending on the nature of the variable consideration. Variable consideration is included in the transaction price if, in the Company’s judgment,
it is probable that a significant future reversal of cumulative revenue under the contract will not occur.
For a majority of our revenue, which consists of printers, terminals, consumables, and replacement parts, the Company recognizes
revenue as of a point of time. The transaction price is recognized upon shipment of the order when control of the goods is transferred to the customer and at the time the performance obligation is fulfilled. We also sell a software solution in our
casino and gaming market, EPICENTRAL™, that enables casino operators to create promotional coupons and marketing messages and to print them in real-time at the slot machine. EPICENTRALTM is primarily comprised of both a software
component, which is licensed to the customer, and a hardware component. EPICENTRAL™ software and hardware are integrated to deliver the system's full functionality. The transaction prices from EPICENTRAL™ software license and hardware are
recognized upon installation and formal acceptance by the customer when control of the license is transferred to the customer. For out-of-warranty repairs, the transaction price is recognized after the repair work is completed and the printer or
terminal is returned to the customer, as control of the product is transferred to the customer and our performance obligation is completed.
15
Performance obligations are satisfied over time if the customer receives the benefits as we perform work, if the customer controls
the asset as it is being produced, or if the product being produced for the customer has no alternative use and we have a contractual right to payment. For our separately priced extended warranty, BOHA! cloud-based software applications, technical
support for our food service technology terminals and maintenance agreements (including free one-year maintenance received by the customers upon completion of EPICENTRAL™ installation) revenue is recognized over time as the customer receives the
benefit. The transaction price from the maintenance services is recognized ratably over time, using output methods, as control of the services is transferred to the customer. The cloud-based software component of BOHA! allows customers to use
hosted software over the contract period without taking possession of the software and are provided on a subscription basis and is recognized ratably over the contract period. For extended warranties, the transaction price is recognized ratably over
the warranty period, using output methods, as control of the services is transferred to the customer.
When there is more than one performance obligation in a customer arrangement, the Company typically uses the “standalone selling
price” method to determine the transaction price to allocate to each performance obligation. The Company sells the performance obligations separately and has established standalone selling prices for its products and services. In the case of an
overall price discount, the discount is applied to each performance obligation proportionately based on standalone selling price. To determine the standalone selling price for initial EPICENTRAL™ installations, the Company uses the adjusted market
assessment approach.
Accounts
Receivable – We have standardized credit granting and review policies and procedures for all customer accounts, including: credit reviews of all new customer accounts; ongoing credit evaluations of current customers; credit limits and
payment terms based on available credit information; and adjustments to credit limits based upon payment history and the customer’s current creditworthiness. We also provide an estimate of doubtful accounts based on historical experience and
specific customer collection issues. Our allowance for doubtful accounts as of December 31, 2019 was $221 thousand, or 3.3% of outstanding accounts receivable, which we believe is appropriate considering the overall quality of our accounts
receivable. Although credit losses have historically been within expectations and the reserves established, there is no assurance that our credit loss experience will continue to be consistent with historical experience.
Inventories –
Our inventories are stated at the lower of cost (principally standard cost, which approximates actual cost on a first-in, first-out basis) or net realizable value. We review net realizable value based on estimated selling prices in the ordinary
course of business less estimated costs of completion, disposal and transportation, historical usage and estimates of future demand. Assumptions are reviewed at least quarterly and adjustments are made, as necessary, to reflect changing market
conditions. Based on these reviews, inventory write-downs are recorded, as necessary, to reflect estimated obsolescence, excess quantities and net realizable value. Should circumstances change and we determine that additional inventory is subject to
obsolescence, additional write-downs of inventory could result in a charge to income.
Goodwill and
Intangible Assets – We acquire businesses in purchase transactions that result in the recognition of goodwill and intangible assets. The determination of the value of intangible assets requires management to make estimates and assumptions.
In accordance with ASC 350-20 “Goodwill”, acquired goodwill is not amortized, but is subject to impairment testing at least annually and when an event occurs or circumstances change, which indicate it is more likely than not an impairment exists.
Factors considered that may trigger an impairment review are: significant underperformance relative to expected historical or projected future operating results; significant changes in the manner of use of acquired assets or the strategy for the
overall business; significant negative industry or economic trends; and significant decline in market capitalization relative to net book value. Definite-lived intangible assets are amortized and are tested for impairment when appropriate. We
reported $2.6 million of goodwill and $0.8 million of unamortized definite-lived intangible assets at December 31, 2019. We have determined that no goodwill or intangible asset impairment has occurred and the fair value of goodwill was substantially
higher than our carrying value based on our assessment as of December 31, 2019 when the impairment review was performed.
Income Taxes
– In preparing our Consolidated Financial Statements, we are required to estimate income taxes in each of the jurisdictions in which we operate. This involves estimating the actual current tax exposure together with assessing temporary differences
between the tax basis of certain assets and liabilities and their reported amounts in the financial statements, as well as net operating losses, tax credits and other carryforwards. These differences result in deferred tax assets and liabilities,
which are reflected in our Consolidated Balance Sheets. We then assess the likelihood that the deferred tax assets will be realized from future taxable income, and to the extent that we believe that realization is not likely, we establish a
valuation allowance.
Significant judgment is required in determining the provision for income taxes and, in particular, any valuation allowance or tax
reserves with respect to our deferred tax assets and uncertain tax positions. On a quarterly basis, we evaluate the recoverability of our deferred tax assets based upon historical results and forecasted taxable income over future years, and match
this forecast against the basis differences, deductions available in future years and the limitations allowed for net operating loss and tax credit carryforwards to ensure that there is adequate support for the realization of the deferred tax assets.
Although we have considered future taxable income and ongoing prudent and feasible tax planning strategies in assessing the need for a valuation allowance, in the event we were to determine that we would not be able to realize all or part of our
deferred tax assets in the future, an adjustment to the valuation allowance or tax reserves would be charged as a reduction to income in the period such determination was made. Likewise, should we determine that we would be able to realize future
deferred tax assets in excess of its net recorded amount, an adjustment to the valuation allowance would increase net income in the period such determination was made.
We account for income taxes in accordance with ASC 740, “Income Taxes.” Among other things this provision prescribes a minimum
recognition threshold that an income tax position must meet before it is recorded in the reporting entity’s financial statements. It also requires that the effects of such income tax positions be recognized only if, as of the balance sheet reporting
date, it is “more likely than not” (i.e., more than a 50% likelihood) that the income tax position will be sustained based solely on its technical merits. When making this assessment, management must assume that the responsible taxing authority will
examine the income tax position and have full knowledge of all relevant facts and other pertinent information. The accounting guidance also clarifies the method of accruing for interest and penalties when there is a difference between the amount
claimed, or expected to be claimed, on a company’s income tax returns and the benefits recognized in the financial statements. See Note 10 to the consolidated financial statements for further details of the impact of the Tax Reform Act.
16
Warranty –
We generally warrant our products for up to 24 months and record the estimated cost of such product warranties at the time the sale is recorded. Estimated warranty costs are based upon actual past experience of product repairs and the related
estimated cost of labor and material to make the necessary repairs. If actual future product repair rates or the actual costs of material and labor differ from the estimates, adjustments to the accrued warranty liability and related warranty expense
would be made.
Share-Based
Compensation – We calculate share-based compensation expense in accordance with ASC 718, “Compensation – Stock Compensation” using the Black-Scholes option-pricing model to calculate the fair value of share-based awards. The key assumptions
for this valuation method include the expected term of an option grant, stock price volatility, risk-free interest rate, and dividend yield. We account for forfeitures as they occur.
Results of Operations: Year ended December 31, 2019 compared to Year ended December 31, 2018
Net Sales. Net
sales, which include printer, terminal and software sales as well as sales of replacement parts, consumables and maintenance and repair services, by market for the years ended December 31, 2019 and 2018 are detailed in the below table. We have
reclassified sales of labels and other recurring revenue items, which includes extended warranty and service contracts, and technical support services related to our food service technology market, previously included in TSG to Food Service
Technology for all periods presented in this Form 10-K.
|
|
Year Ended
|
Year Ended
|
Change
|
|||||||||||||||||||||
|
(In thousands)
|
December 31, 2019
|
December 31, 2018
|
$ |
|
%
|
|||||||||||||||||||
|
Food service technology
|
$
|
6,104
|
13.3
|
%
|
$
|
5,086
|
9.3
|
%
|
$
|
1,018
|
20.0
|
%
|
||||||||||||
|
POS automation and banking
|
5,758
|
12.6
|
%
|
7,273
|
13.3
|
%
|
(1,515
|
)
|
(20.8
|
%)
|
||||||||||||||
|
Casino and gaming
|
21,529
|
47.1
|
%
|
26,593
|
48.7
|
%
|
(5,064
|
)
|
(19.0
|
%)
|
||||||||||||||
|
Lottery
|
1,291
|
2.8
|
%
|
3,093
|
5.7
|
%
|
(1,802
|
)
|
(58.3
|
%)
|
||||||||||||||
|
Printrex
|
1,166
|
2.6
|
%
|
1,297
|
2.4
|
%
|
(131
|
)
|
(10.1
|
%)
|
||||||||||||||
|
TSG
|
9,900
|
21.6
|
%
|
11,245
|
20.6
|
%
|
(1,345
|
)
|
(12.0
|
%)
|
||||||||||||||
|
|
$
|
45,748
|
100.0
|
%
|
$
|
54,587
|
100.0
|
%
|
$
|
(8,839
|
)
|
(16.2
|
%)
|
|||||||||||
|
|
||||||||||||||||||||||||
|
International*
|
$
|
10,416
|
22.8
|
%
|
$
|
11,069
|
20.3
|
%
|
$
|
(653
|
)
|
(5.9
|
%)
|
|||||||||||
| * |
International sales do not include sales of products made to domestic distributors or other customers who in turn ship those products to international destinations.
|
Net sales for 2019 decreased $8.8 million, or 16%, from 2018. Printer, terminal and other hardware sales volume decreased by 22% to
approximately 111,000 units, driven primarily by a 17% decrease in unit volume from the casino and gaming market and, to a lesser extent, a 66% and 22% decrease in the lottery market and POS automation and banking market, respectively. The average
selling price of our printers, terminals and other hardware increased 2% during 2019 compared to 2018.
International sales decreased $0.7 million, or 6%, primarily driven by a 7% decrease of international casino and gaming sales. This
increase was partially offset by a 31% increase from our international food service technology market during 2019 compared to 2018.
Food service technology: The
primary offering in the food service technology market is our BOHA! ecosystem, which combines our latest generation terminal, cloud-based software applications and related hardware into a unique solution to automate back-of-house operations in
restaurants and food service operations. The software component of BOHA! consists of a suite of SaaS-based applications, including applications for inventory management, temperature monitoring of food and equipment, timers, food safety labeling,
food recalls, checklists and procedures, equipment service management, and delivery management. These applications are combined into a single platform with the associated hardware, which includes the BOHA! terminal, handheld devices, tablets,
temperature probes and temperature sensors. The BOHA! terminal combines the software and hardware components in a device that includes an operating system, touchscreen and one or two thermal print mechanisms that print easy-to-read food rotation
labels, grab and go labels for prepared foods, and “enjoy by” date labels. The BOHA! terminal is equipped with the TransAct Enterprise Management System to ensure that only approved applications and functions are available on the device, and allows
over-the-air updates to the applications and operating system. BOHA! helps food service establishments and restaurants (including fine dining, casual dining, fast casual and quick-serve restaurants, convenience stores, hospitality establishments and
contract food service providers) effectively manage food safety and grab-and-go initiatives, as well as automate and manage back-of-house operations. Recurring revenue from BOHA! is generated by software sales, including software subscriptions that
are charged to customers upfront on a per-application basis, as well as sales of labels, extended warranty and service contracts, and technical support services. In the food service technology market, we use an internal sales force and, to a lesser
extent, distributors, to solicit sales directly from end users. Sales of our worldwide food service technology products for the years ended December 31, 2019 and 2018 is as follows (in thousands, except percentages):
|
|
Year Ended
|
Year Ended
|
Change
|
|||||||||||||||||||||
|
(In thousands)
|
December 31, 2019
|
December 31, 2018
|
$ |
|
%
|
|||||||||||||||||||
|
Domestic
|
$
|
5,522
|
90.5
|
%
|
$
|
4,640
|
91.2
|
%
|
$
|
882
|
19.0
|
%
|
||||||||||||
|
International
|
582
|
9.5
|
%
|
446
|
8.8
|
%
|
136
|
30.5
|
%
|
|||||||||||||||
|
|
$
|
6,104
|
100.0
|
%
|
$
|
5,086
|
100.0
|
%
|
$
|
1,018
|
20.0
|
%
|
||||||||||||
|
|
Year Ended
|
Year Ended
|
Change
|
|||||||||||||||||||||
|
(In thousands)
|
December 31, 2019
|
December 31, 2018
|
$ |
|
%
|
|||||||||||||||||||
|
Hardware
|
$
|
4,169
|
68.3
|
%
|
$
|
4,555
|
89.6
|
%
|
$
|
(386
|
)
|
(8.5
|
%)
|
|||||||||||
|
Software, labels and other recurring revenue
|
1,935
|
31.7
|
%
|
531
|
10.4
|
%
|
1,404
|
264.4
|
%
|
|||||||||||||||
|
|
$
|
6,104
|
100.0
|
%
|
$
|
5,086
|
100.0
|
%
|
$
|
1,018
|
20.0
|
%
|
||||||||||||
17
The increase in food service technology sales in 2019 compared to 2018 was driven by sales of our BOHA! software, labels and other
recurring revenue. Sales of BOHA! software, recognized on a SaaS subscription basis, labels and other recurring revenue increased by 264%, including a 241% increase in label sales and an eight-fold increase in software sales (though off a low base
for 2018). Hardware sales declined approximately 9% primarily due to lower sales of our AccuDate 9700 terminal to our former U.S. distributor. Sales of our new BOHA! terminal and other hardware products partially offset the decline of the AccuDate
9700 terminal, increasing 4% in 2019 compared to 2018. We expect food service technology sales to increase in 2020 compared to 2019 as we convert the investments we have made, and will continue to make in our BOHA! products, into sales, including
recurring software subscription, service and label sales.
International food service technology sales increased during 2019 compared to 2018 primarily due to increased sales of the BOHA!
ecosystem to a casino operator in Asia and a quick serve chain in Canada.
POS automation and banking: Revenue
from the POS automation and banking market includes sales of thermal printers used primarily by quick serve restaurants located either at the checkout counter or within self-service kiosks to print receipts for consumers or to print on linerless
labels. In addition, revenue includes sales of inkjet printers used by banks, credit unions and other financial institutions to print deposit or withdrawal receipts and/or validate checks at bank teller stations. As of December 31, 2018, we exited
the banking market, but will continue to fulfill orders from legacy customers until our inventory is exhausted and to sell consumable products through TSG that are compatible with the previously sold inkjet printers. A summary of sales of our
worldwide POS automation and banking products for the years ended December 31, 2019 and 2018 is as follows:
|
|
Year Ended
|
Year Ended
|
Change
|
|||||||||||||||||||||
|
(In thousands)
|
December 31, 2019
|
December 31, 2018
|
$ |
|
%
|
|||||||||||||||||||
|
Domestic
|
$
|
5,714
|
99.2
|
%
|
$
|
7,122
|
97.9
|
%
|
$
|
(1,408
|
)
|
(19.8
|
%)
|
|||||||||||
|
International
|
44
|
0.8
|
%
|
151
|
2.1
|
%
|
(107
|
)
|
(70.9
|
%)
|
||||||||||||||
|
|
$
|
5,758
|
100.0
|
%
|
$
|
7,273
|
100.0
|
%
|
$
|
(1,515
|
)
|
(20.8
|
%)
|
|||||||||||
The decrease in domestic POS automation and banking sales in 2019 compared to 2018 was primarily driven by a 20%
decrease in domestic sales of our Ithaca® 9000 printer, as sales to McDonald’s decreased during 2019 compared to 2018, and the decrease in international POS automation and banking sales was primarily due to lower sales of our Ithaca® 9000 printer to
our Canadian distributor for McDonald’s during 2019 compared to 2018. We expect POS automation and banking sales to decrease due to lower expected sales of our Ithaca® 9000 printer to McDonald's in 2020 compared to 2019.
Casino and Gaming: Revenue
from the casino and gaming market includes sales of thermal ticket printers used in slot machines, video lottery terminals, and other gaming machines that print tickets or receipts instead of issuing coins at casinos and racetracks and other gaming
venues worldwide. Revenue from this market also includes sales of thermal roll-fed printers used in the international off-premise gaming market in gaming machines such as Amusement with Prizes, Skills with Prizes and Fixed Odds Betting Terminals at
non-casino gaming establishments. Revenue from this market also includes royalties related to our patented casino and gaming technology. In addition, casino and gaming market revenue includes sales of the EPICENTRAL™ print system, our software
solution (including annual software maintenance), that enables casino operators to create promotional coupons and marketing messages and to print them real-time at the slot machine. A summary of sales of our worldwide casino and gaming products for the years ended December 31, 2019 and 2018 is as follows:
|
|
Year Ended
|
Year Ended
|
Change
|
|||||||||||||||||||||
|
(In thousands)
|
December 31, 2019
|
December 31, 2018
|
$ |
|
%
|
|||||||||||||||||||
|
Domestic
|
$
|
13,076
|
60.7
|
%
|
$
|
17,518
|
65.9
|
%
|
$
|
(4,442
|
)
|
(25.4
|
%)
|
|||||||||||
|
International
|
8,453
|
39.3
|
%
|
9,075
|
34.1
|
%
|
(622
|
)
|
(6.9
|
%)
|
||||||||||||||
|
|
$
|
21,529
|
100.0
|
%
|
$
|
26,593
|
100.0
|
%
|
$
|
(5,064
|
)
|
(19.0
|
%)
|
|||||||||||
The decrease in domestic sales of our casino and gaming products during 2019 compared to 2018 was due primarily to a 18% decrease in
domestic sales of our thermal casino printer, driven primarily by a large order from a domestic casino operator for replacement printers during 2018 that did not reoccur in 2019, as well as lower sales to our domestic OEMs. Additionally, domestic
sales of our off-premise gaming printers decreased 95% during 2019 compared to 2018 due to sales to an OEM in the 2018 period that did not reoccur in 2019. Domestic EPICENTRAL™ software sales decreased 60%, as we had no new installations during 2019
compared to two new installations during 2018. Sales of EPICENTRAL™ are project based, and as a result, may fluctuate significantly quarter-to-quarter and year-to-year.
The decrease in international sales in 2019 compared to 2018 was primarily due to a 17% decline in international sales of our thermal
casino printer due primarily to lower sales to a large OEM in Europe to replace a competitor’s printer. The decrease was partially offset by a 26% increase in
international sales of our off-premise gaming printers to Europe for sports betting. Sales of our off-premise gaming printers are largely project-oriented and therefore may fluctuate significantly from quarter-to-quarter and year-to-year.
Lottery: Revenue from the
lottery market includes sales of thermal on-line and other lottery printers primarily to IGT and, to a lesser extent, other lottery system companies for various lottery applications. A summary of sales of our worldwide lottery printers for the years
ended December 31, 2019 and 2018 is as follows:
|
|
Year Ended
|
Year Ended
|
Change
|
|||||||||||||||||||||
|
(In thousands)
|
December 31, 2019
|
December 31, 2018
|
$ |
|
%
|
|||||||||||||||||||
|
Domestic
|
$
|
1,290
|
99.9
|
%
|
$
|
3,046
|
98.5
|
%
|
$
|
(1,756
|
)
|
(57.6
|
%)
|
|||||||||||
|
International
|
1
|
0.1
|
%
|
47
|
1.5
|
%
|
(46
|
)
|
(97.9
|
%)
|
||||||||||||||
|
|
$
|
1,291
|
100.0
|
%
|
$
|
3,093
|
100.0
|
%
|
$
|
(1,802
|
)
|
(58.3
|
%)
|
|||||||||||
18
Our sales to IGT are directly dependent on the timing and number of new and upgraded lottery terminal installations that IGT
performs, and as a result, may fluctuate significantly quarter-to-quarter and year-to-year. Our sales to IGT are not indicative of IGT’s overall business or revenue. We allowed our non-exclusive agreement to provide lottery terminal printers to IGT
to expire on December 31, 2019 as we have decided to exit this market and to shift our focus towards our higher-value, technology enabled food service technology and casino and gaming products. As a result, we expect IGT to make a last time buy in
2020 and expect no future sales beyond 2020.
Printrex: Printrex branded
printers are sold into markets that include wide format, desktop and rack mounted and vehicle mounted black/white thermal printers used by customers to log and plot oil field, seismic and down hole well drilling data in the oil and gas exploration
industry. It also includes high-speed color inkjet desktop printers used to print logs at the data centers of the oil and gas field service companies. Prior to 2019, revenue in this market also included sales of vehicle mounted printers used to
print schematics and certain other critical information in emergency services vehicles and other mobile printing applications. We exited this market at the end of 2018 and do not expect any future sales. A summary of sales of our worldwide Printrex
printers for the years ended December 31, 2019 and 2018 is as follows (in thousands, except percentages):
|
|
Year Ended
|
Year Ended
|
Change
|
|||||||||||||||||||||
|
(In thousands)
|
December 31, 2019
|
December 31, 2018
|
$ |
|
%
|
|||||||||||||||||||
|
Domestic
|
$
|
961
|
82.4
|
%
|
$
|
1,028
|
79.3
|
%
|
$
|
(67
|
)
|
(6.5
|
%)
|
|||||||||||
|
International
|
205
|
17.6
|
%
|
269
|
20.7
|
%
|
(64
|
)
|
(23.8
|
%)
|
||||||||||||||
|
|
$
|
1,166
|
100.0
|
%
|
$
|
1,297
|
100.0
|
%
|
$
|
(131
|
)
|
(10.1
|
%)
|
|||||||||||
The decrease in sales of Printrex printers during 2019 compared to 2018 resulted from a 12% decrease in domestic and international
sales in the oil and gas market. This decrease was partially offset by higher sales from the international medical and mobile market which we exited at the end of 2018 but continued to fulfill orders from legacy customers during 2019.
TSG: Revenue generated by our
TSG includes sales of consumable products (inkjet cartridges, ribbons, receipt paper, and other printing supplies), replacement parts, maintenance and repair services, testing services, refurbished printers, and shipping and handling charges. TSG
sales for all periods presented in this Form 10-K exclude the sales of labels, extended warranty and service contracts, and technical support services related to our food service technology market, which have been reclassified to food service
technology. A summary of sales in our worldwide TSG market for the years ended December 31, 2019 and 2018 is as follows:
|
|
Year Ended
|
Year Ended
|
Change
|
|||||||||||||||||||||
|
(In thousands)
|
December 31, 2019
|
December 31, 2018
|
$ |
|
%
|
|||||||||||||||||||
|
Domestic
|
$
|
8,769
|
88.6
|
%
|
$
|
10,164
|
90.4
|
%
|
$
|
(1,395
|
)
|
(13.7
|
%)
|
|||||||||||
|
International
|
1,131
|
11.4
|
%
|
1,081
|
9.6
|
%
|
50
|
4.6
|
%
|
|||||||||||||||
|
|
$
|
9,900
|
100.0
|
%
|
$
|
11,245
|
100.0
|
%
|
$
|
(1,345
|
)
|
(12.0
|
%)
|
|||||||||||
The decrease in domestic revenue from TSG for 2019 as compared to 2018 was due primarily to lower sales of replacement parts and
lower sales of consumable products. Replacement part sales decreased 29% due to lower lottery printer spare parts to IGT. Consumable sales declined 13% due largely to lower sales of HP inkjet cartridges used in our banking printers, as we exited
the banking market at the end of 2018. These decreases were partially offset by a 24% increase in service revenue during 2019 compared 2018. We expect TSG sales to decrease in 2020 compared to 2019 due to lower expected sales of lottery printer
spare printer parts to IGT and lower service sales related to a service contract with a banking customer that is expected to end in 2020.
Internationally, TSG revenue increased during 2019 compared to 2018 primarily due to a 18% increase in sales of replacement parts and
accessories to international casino and gaming customers. This increase was partially offset by a 60% decrease of international consumable sales in 2019 compared to 2018.
Gross Profit. Gross
profit information for the years ended December 31, 2019 and 2018 is summarized below (in thousands, except percentages):
|
|
December 31,
|
Percent
|
Percent of
|
Percent of
|
||||||||||||||||
|
|
2019
|
2018
|
Change
|
Total Sales - 2019
|
Total Sales - 2018
|
|||||||||||||||
|
Year ended
|
$
|
21,935
|
$
|
26,743
|
(18.0
|
%)
|
47.9
|
%
|
49.0
|
%
|
||||||||||
Gross profit is measured as revenue less cost of sales, which includes primarily the cost of all raw materials and component parts,
direct labor, manufacturing overhead expenses, cost of finished products purchased directly from our contract manufacturers and expenses associated with installations and support of our EPICENTRALTM print system and BOHA! ecosystem. Gross
profit decreased $4.8 million, or 18%, and gross margin decreased 110 basis points due primarily to the 16% sales decrease in 2019 compared to 2018. The decline in gross margin reflects higher manufacturing overhead expenses including approximately
$0.2 million incurred for the new Chinese tariffs and $0.4 million for the write-off of tooling related to a product design change incurred during the year ended December 31, 2019 compared to the year ended December 31, 2018.
Operating
Expenses - Engineering, Design and Product Development. Engineering, design and product development information for the years ended December 31, 2019 and 2018 is summarized below (in thousands, except percentages):
|
|
December 31,
|
Percent
|
Percent of
|
Percent of
|
||||||||||||||||
|
|
2019
|
2018
|
Change
|
Total Sales - 2019
|
Total Sales - 2018
|
|||||||||||||||
|
Year ended
|
$
|
4,393
|
$
|
4,576
|
(4.0
|
%)
|
9.6
|
%
|
8.4
|
%
|
||||||||||
19
Engineering, design and product development expenses primarily includes salary and payroll related expenses for our hardware and
software engineering staff, depreciation and design expenses (including prototype printer expenses, outside design, development and testing services, supplies and contract software development expenses). Engineering, design and product development
expenses decreased $183 thousand, or 4%, in 2019 compared to 2018 due primarily to lower expenses related to hardware product development for the food service technology market and casino and gaming market. We expect engineering, design and product
development expenses to increase in 2020 related to accelerated investments planned for our food service technology products.
Operating
Expenses - Selling and Marketing. Selling and marketing information for the years ended December 31, 2019 and 2018 is summarized below
(in thousands, except percentages):
|
|
December 31,
|
Percent
|
Percent of
|
Percent of
|
||||||||||||||||
|
|
2019
|
2018
|
Change
|
Total Sales - 2019
|
Total Sales - 2018
|
|||||||||||||||
|
Year ended
|
$
|
8,033
|
$
|
7,203
|
11.5
|
%
|
17.6
|
%
|
13.2
|
%
|
||||||||||
Selling and marketing expenses primarily include salaries and payroll related expenses for our sales and marketing staff, sales
commissions, travel expenses, expenses associated with the lease of sales offices, advertising, trade show expenses, public relations, e-commerce and other promotional marketing expenses. Selling and marketing expenses increased $830 thousand, or
12%, in 2019 compared to 2018 due primarily to higher compensation expenses related to the hiring of additional outside sales, technical sales and marketing staff and higher promotional marketing expenses for our food service technology market. We
expect selling and marketing expenses to continue to increase in 2020 as we make substantial strategic investments in our food service technology sales and marketing groups.
Operating
Expenses - General and Administrative. General and administrative information for the years ended December 31, 2019 and 2018 is summarized below (in thousands, except percentages):
|
|
December 31,
|
Percent
|
Percent of
|
Percent of
|
||||||||||||||||
|
|
2019
|
2018
|
Change
|
Total Sales - 2019
|
Total Sales - 2018
|
|||||||||||||||
|
Year ended
|
$
|
9,166
|
$
|
8,205
|
11.7
|
%
|
20.0
|
%
|
15.0
|
%
|
||||||||||
General and administrative expenses primarily include salaries, incentive compensation, and other payroll related expenses for our
executive, accounting, human resources and information technology staff, expenses for our corporate headquarters, professional and legal expenses, telecommunication expenses, and other expenses related to being a publicly-traded company. General and
administrative expenses increased $961 thousand, or 12%, in 2019 compared to 2018 due primarily to higher professional and legal expenses. We expect general and administrative expenses to increase in 2020 compared to 2019 due to the hiring of
additional administrative staff to support the anticipated growth in the food service technology market.
Operating Income. Operating
income information for the years ended December 31, 2019 and 2018 is summarized below (in thousands, except percentages):
|
|
December 31,
|
Percent
|
Percent of
|
Percent of
|
||||||||||||||||
|
|
2019
|
2018
|
Change
|
Total Sales – 2019
|
Total Sales – 2018
|
|||||||||||||||
|
Year ended
|
$
|
343
|
$
|
6,759
|
(94.9
|
%)
|
0.7
|
%
|
12.4
|
%
|
||||||||||
Our operating income decreased by $6.4 million, or 95%, in 2019 due to a decrease in sales of 16% and an 8% increase in operating
expenses related to the investments made in our food service technology market during 2019 compared to 2018.
Interest. We
recorded net interest expense of $11 thousand in 2019 compared to $27 thousand in 2018 primarily due to interest income earned on the note receivable during 2019 partially offsetting interest expense.
Other, net. We recorded other income of $35 thousand in 2019 compared to other expense of $266 thousand in 2018 primarily due to foreign exchange gains recorded
by our UK entity during 2019 compared to foreign exchange losses recorded during 2018. Going forward, we may continue to experience more foreign exchange gains or losses depending on the level of sales to Europe through our UK subsidiary and the
change in exchange rates of the Euro and Pound Sterling against the U.S. dollar.
Income Taxes. We recorded an income tax benefit during the year ended December 31, 2019 of $149 thousand at an effective tax rate of -40.6%, compared to an income
tax provision during the year ended December 31, 2018 of $1.0 million at an effective tax rate of 16.1%. An income tax benefit was recorded in 2019 primarily due to the impact of research and development (R&D) credits on a relatively low level
of taxable income.
Net Income. We
reported net income of $0.5 million, or $0.07 per diluted share, in 2019 compared to net income of $5.4 million, or $0.70 per diluted share, in 2018.
20
Results of Operations: Year ended December 31, 2018 compared to year ended December 31, 2017
Net Sales. Net
sales, which include printer, terminal and software sales as well as sales of replacement parts, consumables and maintenance and repair services, by market for the years ended December 31, 2018 and 2017 are detailed in the below table. We have
reclassified sales of labels and other recurring revenue items, which includes extended warranty and service contracts, and technical support services related to our food service technology market, previously included in TSG to Food Service
Technology for all periods presented in this Form 10-K.
|
|
Year Ended
|
Year Ended
|
Change
|
|||||||||||||||||||||
|
(In thousands)
|
December 31, 2018
|
December 31, 2017
|
$ |
|
%
|
|||||||||||||||||||
|
Food service technology
|
$
|
5,086
|
9.3
|
%
|
$
|
4,862
|
8.6
|
%
|
$
|
224
|
4.6
|
%
|
||||||||||||
|
POS automation and banking
|
7,273
|
13.3
|
%
|
7,905
|
14.0
|
%
|
(632
|
)
|
(8.0
|
%)
|
||||||||||||||
|
Casino and gaming
|
26,593
|
48.7
|
%
|
18,615
|
33.1
|
%
|
7,978
|
42.9
|
%
|
|||||||||||||||
|
Lottery
|
3,093
|
5.7
|
%
|
9,805
|
17.4
|
%
|
(6,712
|
)
|
(68.5
|
%)
|
||||||||||||||
|
Printrex
|
1,297
|
2.4
|
%
|
1,052
|
1.9
|
%
|
245
|
23.3
|
%
|
|||||||||||||||
|
TSG
|
11,245
|
20.6
|
%
|
14,072
|
25.0
|
%
|
(2,827
|
)
|
(20.1
|
%)
|
||||||||||||||
|
|
$
|
54,587
|
100.0
|
%
|
$
|
56,311
|
100.0
|
%
|
$
|
(1,724
|
)
|
(3.1
|
%)
|
|||||||||||
|
|
||||||||||||||||||||||||
|
International*
|
$
|
11,069
|
20.3
|
%
|
$
|
7,591
|
13.5
|
%
|
$
|
3,478
|
45.8
|
%
|
||||||||||||
| * |
International sales do not include sales of products made to domestic distributors or other customers who in turn ship those products to international destinations.
|
Net sales for 2018 decreased $1.7 million, or approximately 3%, from 2017. Printer and terminal sales volume decreased by 5% to
approximately 142,000 units, driven primarily by a 71% decrease in unit volume from the lottery market and, to a lesser extent, a 6% and 18% decrease in the POS automation and banking market and food service technology market, respectively. These
decreases were partially offset by an increase in sales volume of 44% in the casino and gaming market. Although unit volume decreased during 2018 compared to 2017, the average selling price of our printers and terminals increased 7% during 2018
compared to 2017, due primarily to the decreased volume of lottery printers, which carry lower prices than our other products.
International sales increased $3.5 million, or 46%, primarily driven by 81% higher international sales in the casino and gaming
market. This increase was partially offset by a $1.1 million sales decrease in our international lottery market during 2018 compared to 2017.
Food service technology: A
summary of sales of our worldwide food service technology products for the years ended December 31, 2018 and 2017 is as follows:
|
|
Year Ended
|
Year Ended
|
Change
|
|||||||||||||||||||||
|
(In thousands)
|
December 31, 2018
|
December 31, 2017
|
$ |
|
%
|
|||||||||||||||||||
|
Domestic
|
$
|
4,640
|
91.2
|
%
|
$
|
4,488
|
92.3
|
%
|
$
|
152
|
3.4
|
%
|
||||||||||||
|
International
|
446
|
8.8
|
%
|
374
|
7.7
|
%
|
72
|
19.3
|
%
|
|||||||||||||||
|
|
$
|
5,086
|
100.0
|
%
|
$
|
4,862
|
100.0
|
%
|
$
|
224
|
4.6
|
%
|
||||||||||||
|
|
Year Ended
|
Year Ended
|
Change
|
|||||||||||||||||||||
|
(In thousands)
|
December 31, 2018
|
December 31, 2017
|
$ |
|
%
|
|||||||||||||||||||
|
Hardware
|
$
|
4,555
|
89.6
|
%
|
$
|
4,758
|
97.9
|
%
|
$
|
(203
|
)
|
(4.3
|
%)
|
|||||||||||
|
Software, labels and other recurring revenue
|
531
|
10.4
|
%
|
104
|
2.1
|
%
|
427
|
410.6
|
%
|
|||||||||||||||
|
|
$
|
5,086
|
100.0
|
%
|
$
|
4,862
|
100.0
|
%
|
$
|
224
|
4.6
|
%
|
||||||||||||
The increase in food service technology sales in 2018 compared to 2017 was due to increased sales of our labels and other recurring
revenue, primarily increased label sales which more than quadrupled in 2018 compared 2017. Hardware sales declined 4% in 2018 compared to 2017 due to lower sales of our AccuDate 9700 terminal for McDonald’s. This decrease was partially offset by
increased sales of our newer AccuDate XL2e terminal, which was renamed to our BOHA! terminal in 2019, to three large corporate customers.
International food service technology sales increased during 2018 compared to 2017 due to increased sales of the AccuDate 9700 for
McDonald’s through our Canadian distributor.
POS automation and banking: A
summary of sales of our worldwide POS automation and banking products for the years ended December 31, 2018 and 2017 is as follows:
|
|
Year Ended
|
Year Ended
|
Change
|
|||||||||||||||||||||
|
(In thousands)
|
December 31, 2018
|
December 31, 2017
|
$ |
|
%
|
|||||||||||||||||||
|
Domestic
|
$
|
7,122
|
97.9
|
%
|
$
|
7,596
|
96.1
|
%
|
$
|
(474
|
)
|
(6.2
|
%)
|
|||||||||||
|
International
|
151
|
2.1
|
%
|
309
|
3.9
|
%
|
(158
|
)
|
(51.1
|
%)
|
||||||||||||||
|
|
$
|
7,273
|
100.0
|
%
|
$
|
7,905
|
100.0
|
%
|
$
|
(632
|
)
|
(8.0
|
%)
|
|||||||||||
The decrease in domestic POS automation and banking sales in 2018 compared to 2017 was primarily driven by a 75% decrease in sales of
our legacy banking and other POS printers. These decreases were partially offset by a slight increase in domestic sales of our Ithaca® 9000 printers of 1% during 2018 compared to 2017, as sales rebounded to 2017, near-record levels during the second
and third quarters of 2018.
International POS automation and banking sales decreased due to lower sales of our Ithaca® 9000 printer to our Canadian distributor
for McDonald’s during 2018 compared to 2017.
21
Casino and gaming: A summary
of sales of our worldwide casino and gaming products for the years ended December 31, 2018 and 2017 is as follows:
|
|
Year Ended
|
Year Ended
|
Change
|
|||||||||||||||||||||
|
(In thousands)
|
December 31, 2018
|
December 31, 2017
|
$ |
|
%
|
|||||||||||||||||||
|
Domestic
|
$
|
17,518
|
65.9
|
%
|
$
|
13,608
|
73.1
|
%
|
$
|
3,910
|
28.7
|
%
|
||||||||||||
|
International
|
9,075
|
34.1
|
%
|
5,007
|
26.9
|
%
|
4,068
|
81.2
|
%
|
|||||||||||||||
|
|
$
|
26,593
|
100.0
|
%
|
$
|
18,615
|
100.0
|
%
|
$
|
7,978
|
42.9
|
%
|
||||||||||||
The increase in domestic sales of our casino and gaming products was due primarily to a 20% increase in domestic sales of our thermal
casino printer in 2018 compared to 2017, driven primarily by increased sales to our OEMs and a large order from a domestic casino operator for replacement printers. Domestic sales also increased during 2018 due to a significant sale of our
off-premise gaming printers to an OEM. Sales of EPICENTRAL™ software during 2018 were comparable with our 2017 EPICENTRAL™ sales as we completed two new installations during both 2018 and 2017.
The increase in international sales in 2018 compared to 2017 was due to a 143% increase of thermal casino printer sales. These
increases were due to the successful transition away from using our previous exclusive worldwide distributor whose contract ended at the end of 2017 and using our new direct sales team to sell to end user casino and gaming customers in Europe. These
increases were partially offset by a 5% decrease in international sales of off-premise gaming printers.
Lottery: A summary of sales
of our worldwide lottery printers for the years ended December 31, 2018 and 2017 is as follows:
|
|
Year Ended
|
Year Ended
|
Change
|
|||||||||||||||||||||
|
(In thousands)
|
December 31, 2018
|
December 31, 2017
|
$ |
|
%
|
|||||||||||||||||||
|
Domestic
|
$
|
3,046
|
98.5
|
%
|
$
|
8,626
|
88.0
|
%
|
$
|
(5,580
|
)
|
(64.7
|
%)
|
|||||||||||
|
International
|
47
|
1.5
|
%
|
1,179
|
12.0
|
%
|
(1,132
|
)
|
(96.0
|
%)
|
||||||||||||||
|
|
$
|
3,093
|
100.0
|
%
|
$
|
9,805
|
100.0
|
%
|
$
|
(6,712
|
)
|
(68.5
|
%)
|
|||||||||||
Our sales to IGT are directly dependent on the timing and number of new and upgraded lottery terminal installations that IGT
performs, and as a result, may fluctuate significantly quarter-to-quarter and year-to-year. However, our lottery market sales are not indicative of IGT’s overall business or revenue.
The decrease in international lottery sales in 2018 compared to 2017 was primarily due to a sale of lottery printers to IGT for the
Canadian lottery in 2017 and no comparable sale occurring in 2018.
Printrex: A summary of sales
of our worldwide Printrex printers for the years ended December 31, 2018 and 2017 is as follows (in thousands, except percentages):
|
|
Year Ended
|
Year Ended
|
Change
|
|||||||||||||||||||||
|
(In thousands)
|
December 31, 2018
|
December 31, 2017
|
$ |
|
%
|
|||||||||||||||||||
|
Domestic
|
$
|
1,028
|
79.3
|
%
|
$
|
849
|
80.7
|
%
|
$
|
179
|
21.1
|
%
|
||||||||||||
|
International
|
269
|
20.7
|
%
|
203
|
19.3
|
%
|
66
|
32.5
|
%
|
|||||||||||||||
|
|
$
|
1,297
|
100.0
|
%
|
$
|
1,052
|
100.0
|
%
|
$
|
245
|
23.3
|
%
|
||||||||||||
The increase in Printrex sales in 2018 compared to 2017 resulted from a 57% increase in domestic and international sales of our oil
and gas printers due to a continued recovery in the oil and gas market. This increase was partially offset by 87% lower sales of domestic and international medical and mobile printers in 2018 compared to 2017.
TSG: A summary of sales in
our worldwide TSG market for the years ended December 31, 2018 and 2017 is as follows:
|
|
Year Ended
|
Year Ended
|
Change
|
|||||||||||||||||||||
|
(In thousands)
|
December 31, 2018
|
December 31, 2017
|
$ |
|
%
|
|||||||||||||||||||
|
Domestic
|
$
|
10,164
|
90.4
|
%
|
$
|
13,553
|
96.3
|
%
|
$
|
(3,389
|
)
|
(25.0
|
%)
|
|||||||||||
|
International
|
1,081
|
9.6
|
%
|
519
|
3.7
|
%
|
562
|
108.3
|
%
|
|||||||||||||||
|
|
$
|
11,245
|
100.0
|
%
|
$
|
14,072
|
100.0
|
%
|
$
|
(2,827
|
)
|
(20.1
|
%)
|
|||||||||||
The decrease in domestic revenue from TSG in 2018 compared to 2017 was due primarily to lower sales of replacement parts,
non-Printrex consumable products and service revenue. Replacement part sales decreased 36% due to lower sales of lottery printer spare parts to IGT. Non-Printrex consumables sales declined 10% due to lower sales of our legacy HP inkjet cartridges
used in our banking printers, as we exited the banking market at the end of 2018. Service revenue declined 14% in 2018 compared to 2017 due to paper testing sales that occurred in 2017 but did not repeat in 2018.
Internationally, TSG revenue increased primarily due to a 134% increase in sales of replacement parts and accessories in 2018
compared to 2017, as sales of replacement parts and accessories to international casino and gaming customers increased upon the transition away from using our previous exclusive worldwide distributor and using our new direct sales team to sell to end
user casino and gaming customers.
22
Gross Profit. Gross
profit information for the years ended December 31, 2018 and 2017 is summarized below (in thousands, except percentages):
|
|
December 31,
|
Percent
|
Percent of
|
Percent of
|
||||||||||||||||
|
|
2018
|
2017
|
Change
|
Total Sales - 2018
|
Total Sales - 2017
|
|||||||||||||||
|
Year ended
|
$
|
26,743
|
$
|
26,662
|
0.3
|
%
|
49.0
|
%
|
47.3
|
%
|
||||||||||
Gross profit increased $81 thousand, or less than 1%, and gross margin increased 170 basis points due primarily to a more favorable
sales mix in 2018 compared to 2017. The increased gross margin reflected a favorable shift in sales mix towards higher-value, technology driven solutions, as well as lower sales volume of lottery and POS printers, which carry lower margins than our
other products.
Operating
Expenses - Engineering, Design and Product Development. Engineering, design and product development information for the years ended December 31, 2018 and 2017 is summarized below (in thousands, except percentages):
|
|
December 31,
|
Percent
|
Percent of
|
Percent of
|
||||||||||||||||
|
|
2018
|
2017
|
Change
|
Total Sales - 2018
|
Total Sales - 2017
|
|||||||||||||||
|
Year ended
|
$
|
4,576
|
$
|
4,303
|
6.3
|
%
|
8.4
|
%
|
7.6
|
%
|
||||||||||
Engineering, design and product development expenses increased $273 thousand, or 6%, in 2018 compared to 2017 due primarily to the
hiring of additional engineering staff and increased expenses related to product development for the food service technology and casino and gaming markets.
Operating Expenses - Selling and Marketing. Selling and marketing information for the years ended December 31, 2018 and 2017 is
summarized below (in thousands, except percentages):
|
|
December 31,
|
Percent
|
Percent of
|
Percent of
|
||||||||||||||||
|
|
2018
|
2017
|
Change
|
Total Sales - 2018
|
Total Sales - 2017
|
|||||||||||||||
|
Year ended
|
$
|
7,203
|
$
|
7,561
|
(4.7
|
%)
|
13.2
|
%
|
13.4
|
%
|
||||||||||
Selling and marketing expenses decreased $358 thousand, or 5%, in 2018 compared to 2017 primarily due to the retirement of our EVP,
Sales and Marketing in December 2017, whose position was replaced by an existing employee of TransAct, as well as the elimination of sales commission expense to our former international casino and gaming distributor, Suzo-Happ. These decreases were
partially offset by the hiring of additional sales staff to replace our former exclusive worldwide distributor with a direct selling team for our casino and gaming sales in Europe.
Operating
Expenses - General and Administrative. General and administrative information for the years ended December 31, 2018 and 2017 is summarized below (in thousands, except percentages):
|
|
December 31,
|
Percent
|
Percent of
|
Percent of
|
||||||||||||||||
|
|
2018
|
2017
|
Change
|
Total Sales - 2018
|
Total Sales - 2017
|
|||||||||||||||
|
Year ended
|
$
|
8,205
|
$
|
7,984
|
2.8
|
%
|
15.0
|
%
|
14.2
|
%
|
||||||||||
General and administrative expenses increased $221 thousand, or 3%, in 2018 compared to 2017 due primarily to increased legal
expenses and increased administrative expenses related to the expansion of our food service technology sales staff and transitioning to a direct selling model for the casino and gaming market in Europe. These increases were partially offset by lower
incentive compensation expense in 2018 compared to 2017.
Operating Income
(Loss). Operating income information for the years ended December 31, 2018 and 2017 is summarized below (in thousands, except percentages):
|
|
December 31,
|
Percent
|
Percent of
|
Percent of
|
||||||||||||||||
|
|
2018
|
2017
|
Change
|
Total Sales – 2018
|
Total Sales – 2017
|
|||||||||||||||
|
Year ended
|
$
|
6,759
|
$
|
6,814
|
(0.8
|
%)
|
12.4
|
%
|
12.1
|
%
|
||||||||||
Our operating income decreased by $55 thousand, or 1%. Despite a sales decline of 3% our operating margin improved, increasing 30
basis points to 12.4% in 2018 compared to 12.1% in 2017, largely due to a 170 basis point increase in gross margin somewhat offset by a 1% increase in operating expenses.
Interest. We
recorded net interest expense of $27 thousand in 2018 compared to $33 thousand in 2017.
Other, net. We recorded other expense of $266 thousand in 2018 compared to $9 thousand in 2017. The additional expense was due to higher foreign currency
exchange losses recorded by our U.K. subsidiary in 2018 compared to 2017.
Income Taxes. We recorded an income tax provision during the year ended December 31, 2018 of $1.0 million at an effective tax rate of 16.1%, compared to an income
tax provision during the year ended December 31, 2017 of $3.6 million at an effective tax rate of 52.6%. The effective tax rate in 2018 was lower than the effective tax rate in 2017 due to the enactment of the Tax Reform Act that was signed on
December 22, 2017. Additionally, the effective tax rate in 2017 was unusually high due to the initial impact of the Tax Reform Act as we recognized a provisional $1.3 million charge to income tax expense for the year ended December 31, 2017 as a
result of revaluing our net deferred tax assets using the new U.S. corporate tax rate of 21%.
Net Income. We
reported net income during 2018 of $5.4 million, or $0.70 per diluted share, compared to $3.2 million, or $0.42 per diluted share, for 2017.
23
Liquidity and Capital Resources
We assess our liquidity in terms of our ability to generate cash to fund our operating, investing and financing
activities. Significant factors affecting the management of liquidity are cash flows from operating activities, capital expenditures, access to bank lines of credit and our ability to attract long-term capital with satisfactory terms.
Internal cash generation together with currently available cash and cash equivalents, available borrowing facilities and an ability
to access credit lines, if needed, are expected to be sufficient to fund operations, capital expenditures, and any increase in working capital that would be required to accommodate a higher level of business activity. We may actively seek to expand
by acquisition as well as through the growth of our current business. While a significant acquisition may require additional debt and/or equity financing, although no assurances can be given, we believe that we would be able to obtain additional
financing based on our available collateral and historical earnings performance.
Cash Flow
During 2019 our cash balance decreased $0.5 million, or 10%, from December 31, 2018 and we returned cash to shareholders of $2.7
million in the form of cash dividends paid to common shareholders. Additionally, we issued a note receivable of $1 million to a third party in 2019. Even after funding these items and our capital expenditures, we had $4.2 million in cash and cash
equivalents as of December 31, 2019, of which $0.9 million was held by our UK subsidiary, and no debt outstanding.
Operating activities: The
following significant factors primarily affected our cash provided by operating activities of $4.8 million in 2019 as compared to $5.1 million in 2018. During 2019:
| ● |
We reported a net income of $0.5 million.
|
| ● |
We recorded depreciation and amortization of $1.4 million and share-based compensation expense of $0.7 million.
|
| ● |
Accounts receivable decreased $1.6 million, or 20%, primarily due to strong collections on receivables during the fourth quarter of 2019.
|
| ● |
Inventories decreased $0.8 million, or 6%, primarily due to the utilization of inventory on hand to fulfill sales.
|
| ● |
Prepaid income taxes decreased $0.6 million, or 71%, primarily due to an income tax refund received in the fourth quarter of 2019.
|
| ● |
Other current and long-term assets increased $0.3 million, or 47%, due primarily to an advanced payment of royalty fees to a technology partner for food service
technology.
|
| ● |
Accounts payable decreased $0.5 million, or 15%, primarily due to the utilization of inventory on hand to fulfill sales requiring a lower level of inventory
purchases during the second half of 2019.
|
| ● |
Accrued liabilities and other liabilities increased $0.4 million, or 11%, due primarily to an increase in deferred revenue related to our food service technology
service contracts and software subscriptions.
|
During 2018:
| ● |
We reported a net income of $5.4 million.
|
| ● |
We recorded depreciation and amortization of $1.0 million and share-based compensation expense of $0.6 million.
|
| ● |
Accounts receivable decreased $2.7 million, or 25%, primarily due to the collection of past due receivables from 2017 sales made to our former international
casino and gaming distributor.
|
| ● |
Inventories increased $4.0 million, or 46%, primarily due to the buildup of inventory on hand to support future anticipated sales in the casino and gaming market
and food service technology market.
|
| ● |
Accounts payable decreased $0.3 million, or 9%, primarily due to the timing of inventory purchases in 2017 compared to 2018.
|
| ● |
Accrued liabilities and other liabilities decreased $0.2 million, or 5%, due primarily to a decrease in our accrued incentive compensation.
|
Investing activities: Our
capital expenditures, including capitalized software costs, were $1.4 million and $1.5 million in 2019 and 2018, respectively. Expenditures in 2019 were primarily for new product tooling equipment, and, to a lesser extent, computer and networking
equipment. Expenditures in 2018 were primarily for computer and networking equipment and furniture and fixtures purchases related to investments made in our UK facility to support the build-out of our internal sales infrastructure to sell directly
to slot machine manufacturers and end-user casino and gaming customers. To a lesser extent, expenditures in 2018 included computer and networking equipment for our U.S. operations and leasehold improvements made at our Las Vegas facility.
Capital expenditures and additions to capitalized software for 2020 are expected to be approximately $1.1 million, primarily for
new product tooling, new computer software and equipment purchases and leasehold improvements to support our food service technology market.
Financing activities: We
used $2.9 million of cash from financing activities during 2019 to pay dividends of $2.7 million and $0.2 million related to the relinquishment of shares to pay for withholding taxes on stock issued from our stock compensation plan. During 2018,
we used $4.5 million of cash to pay dividends of $2.7 million to common shareholders, purchase $2 million of common stock for treasury and $0.3 million related to the relinquishment of shares to pay for withholding taxes on stock issued from our
stock compensation plan, partially offset by proceeds from stock option exercises of $0.4 million.
Resource Sufficiency
We believe that our cash and cash equivalents on hand, cash flows generated from operating activities and access to our credit
facility will provide sufficient resources to meet our working capital needs, finance our capital expenditures, support planned investments for our food service technology market and meet our liquidity requirements through at least the next twelve
months.
Credit Facility and Borrowings
During 2019 we maintained a credit facility (the “TD Bank Credit Facility”) with TD Bank N.A. (“TD Bank) which provided for a $20
million revolving credit line. On November 21, 2017, we signed an amendment to the TD Bank Credit Facility through November 28, 2022. Borrowings under the revolving credit line bear a floating rate of interest at the prime rate minus one percent
and are secured by a lien on all our assets. We also pay a fee of 0.125% on unused borrowings under the revolving credit line. The amendment increased the amount of revolving credit loans we may use to fund future cash dividend payments or treasury
share buybacks to $12.5 million from $10 million.
24
The TD Bank Credit Facility imposes certain quarterly financial covenants on us and restricts, among other things, our ability to
incur additional indebtedness and the creation of other liens. On November 6, 2019, we amended our TD Credit Facility to change the definition of interest expense to exclude fees paid on unused borrowings under the revolving credit line which is used
to calculate total debt service in the operating cash flow to total debt service. Additionally, the amendment limited our maximum loan amount to $1 million. We were in compliance with all financial covenants of the TD Bank Credit Facility at
December 31, 2019.
|
Financial Covenant
|
|
Requirement/Restriction
|
|
Calculation at December 31, 2019
|
|
Operating cash flow / Total debt service
|
|
Minimum of 1.25 times
|
|
0
|
|
Funded debt / EBITDA
|
|
Maximum of 3.0 times
|
|
0 times
|
As of December 31, 2019, we had no outstanding borrowings under the TD Bank Credit facility.
On March 13, 2020 we terminated our TD Bank Credit Facility and signed a $10 million credit facility (the “Siena Credit Facility”)
with Siena Lending Group LLC. The Siena Credit Facility replaced our TD Bank Credit Facility. The Siena Credit Facility provides for a $10 million revolving credit line expiring on March 13, 2023. Borrowings under the Siena Credit Facility bear
a floating rate of interest equal to the greatest of (i) the prime rate plus 1.75%, (ii) the federal funds rate plus 2.25%, and (iii) 6.50%. We incurred a closing fee of $63 thousand payable 50% on the closing date and 50% on the first anniversary of
the closing date. We will also pay a fee of 0.50% on unused borrowings under the facility. Borrowings under the facility are secured by a lien on substantially all the assets of the Company. The Siena Credit Facility imposes certain financial
covenants on the Company and borrowings are subject to a borrowing base based on (i) 85% of eligible accounts receivable plus the lesser of (a) $5,000,000 and (b) 50% of eligible raw material and 60% of finished good inventory.
Shareholder Dividend Payments
In 2012, our Board of Directors initiated a quarterly cash dividend program which is subject to the Board’s approval each
quarter. Our Board of Directors declared an increase to the quarterly cash dividend from $0.06 to $0.07 per share in May 2013, from $0.07 to $0.08 per share in May 2014, and from $0.08 to $0.09 per share in May 2017. Dividends declared and paid on
our common stock totaled $2.7 million or $0.36 per in both 2019 and 2018. On January 23, 2020, our Board of Directors announced the cessation of our quarterly cash dividend on the Company’s common stock to accelerate the investment in sales and
marketing, continued product development and infrastructure of the BOHA! ecosystem. The final dividend payment was made in December 2019.
Stock Repurchase Program
Prior to its expiration on December 31, 2019, we maintained a stock repurchase program (the "2018 Stock Repurchase Program") whereby
we were authorized to repurchase up to $5 million of our outstanding shares of common stock from time to time in the open market at prevailing market prices based on market conditions, share price and other factors. We use the cost method to account
for treasury stock purchases, under which the price paid for the stock is charged to the treasury stock account. Repurchases of our common stock are accounted for as of the settlement date. During 2019 we did not repurchase any shares of our common
stock. From the start of the 2018 Stock Repurchase Program on March 1, 2018 through December 31, 2018, we repurchased 156,410 shares of our common stock for approximately $2.0 million at an average price per share of $12.79.
In 2017, under a prior repurchase program that was in place from February 25, 2016 through December 31, 2017, we purchased 36,465
shares of our common stock for $0.4 million at an average price of $9.84 per share. From January 1, 2005 through December 31, 2019, we repurchased a total of 4,044,842 shares of common stock for $32.1 million, at an average price of $7.94 per share.
Shareholders’ Equity
Shareholders’ equity decreased $1.6 million, or 6%, to $25.9 million at December 31, 2019 from $27.6 million at December 31,
2018. The decrease was due to the payment of $2.7 million in dividends during 2019 and $0.2 million related to the relinquishment of stock awards to pay for withholding taxes on stock awards. These decreases were partially offset by net income of
$0.5 million, as well as share-based compensation expense related to stock awards of $0.7 million.
Off-Balance Sheet Arrangements
As of December 31, 2019, we had no off-balance sheet arrangements that have had or that we expect would be reasonably likely to have
a future material effect on our financial condition, changes in financial condition, revenues or expenses, results of operations, liquidity, capital expenditures or capital resources.
Contractual Obligations
Our contractual obligations as of December 31, 2019 were as follows:
|
|
Payments due by period
|
|||||||||||||||||||
|
(In thousands)
|
Total
|
Less than
1 year
|
1-3 years
|
3-5 years
|
More than
5 years
|
|||||||||||||||
|
Operating lease obligations
|
$
|
3,344
|
$
|
1,042
|
$
|
1,145
|
$
|
541
|
$
|
616
|
||||||||||
|
Purchase obligations
|
9,056
|
$
|
9,056
|
$
|
-
|
–
|
–
|
|||||||||||||
|
Total
|
$
|
12,400
|
$
|
10,098
|
$
|
1,145
|
$
|
541
|
$
|
616
|
||||||||||
Purchase obligations are for purchases made in the normal course of business to meet operational requirements, primarily of fully
assembled printers, terminals and component part inventory.
Impact of Inflation
We believe that our business has not been affected to a significant degree by inflationary trends during the past three
years. However, inflation is still a factor in the worldwide economy and may increase the cost of purchasing products from our contract manufacturers in Asia, as well as the cost of certain raw materials, component parts and labor used in the
production of our products. It also may increase our operating expenses, manufacturing overhead expenses and the cost to acquire or replace fixed assets. We have generally been able to maintain or improve our profit margins through productivity and
efficiency improvements, cost reduction programs and to a lesser extent, price increases, and we expect to be able to do the same during 2020. As such, we do not believe that inflation will have a significant impact on our business during 2020.
25
Interest Rate Risk
Our exposure to market risk for changes in interest rates relates primarily to the investment of our available cash and cash
equivalents. In accordance with our investment policy, we strive to achieve above market rates of return in exchange for accepting a prudent amount of incremental risk, which includes the risk of interest rate movements. Risk tolerance is
constrained by an overriding objective to preserve capital. An increase or decrease of 10% in effective interest rates would not have a material effect on our results of operations or cash flows.
Foreign Currency Exchange Risk
Transaction Exposure – We
transact business in foreign currencies and have international revenue, as well as costs denominated in foreign currencies which are the Euro and Pound Sterling. As a result, we are exposed to the risk of fluctuations in foreign currency exchange
rates. Accordingly, changes in exchange rates, and in particular a strengthening of the U.S. dollar, would negatively affect our revenue and other operating results as expressed in U.S. dollars.
Beginning in 2018, we have experienced increased fluctuations in our net loss as a result of transaction gains or losses related to
revaluation and ultimately settling certain asset and liability balances that are denominated in currencies other than the functional currency of our UK subsidiary, which is Pound Sterling. Net realized and unrealized foreign currency gains were $35
thousand in 2019 and net realized and unrealized losses were $267 thousand and $11 thousand in 2018 and 2017, respectively.
The change in foreign currency gains and losses is primarily a result of increased sales recognized by our U.K. subsidiary upon the
adoption of a direct selling model in Europe in 2018. We do not use derivative financial instruments to manage foreign currency exchange risk exposure. As a result, both positive and negative currency fluctuations against the U.S. dollar may affect
our results of operations. Based on our foreign currency exposures from monetary assets and liabilities, we estimate that a 10% change in exchange rates against the U.S. dollar would have resulted in a gain or loss of approximately $280 thousand as
of December 31, 2019.
Translation Exposure – We
are also exposed to foreign exchange rate fluctuations as we translate the financial statements of our UK subsidiary into U.S. dollars in consolidation. If there is a change in foreign currency exchange rates, the translating adjustments resulting
from the conversion of our U.K. subsidiary into U.S. dollars would result in a gain or loss recorded as a component of accumulated other comprehensive loss which is part of stockholders’ equity.
The financial statements of the Company are annexed to this Annual Report as pages F-3 through F-21. The “Report of Independent
Registered Public Accounting Firm” is annexed to this Annual Report as of page F-2. An index to such materials appears on page F-1.
Evaluation of Disclosure Controls and Procedures
Our management, with the participation of our Chief Executive Officer (“CEO”) and Chief Financial Officer (“CFO”), evaluated the
effectiveness of our disclosure controls and procedures, as defined in Rule 13a-15(e) under the Exchange Act as of December 31, 2019. In the Amendment to our Annual Report on Form 10-K for the year ended December 31, 2018, filed with the SEC on
November 21, 2019, we disclosed that management, including our CEO and CFO, concluded that our disclosure controls and procedures were not effective as of December 31, 2018, due to material weaknesses in our internal control over financial reporting
as described below. As of December 31, 2019, these material weaknesses were not fully remediated and our disclosure controls and procedures were not effective as of December 31, 2019. Management has begun remediation efforts, which are described
below.
Notwithstanding these material weaknesses, our management, including our CEO and CFO, has concluded that our consolidated financial
statements, included in this Form 10-K, fairly present, in all material respects, our financial condition, results of operations and cash flows for the periods presented in conformity with generally accepted accounting principles, and that they can
still be relied upon.
Management’s Annual Report on Internal Control Over Financial Reporting
Our management is responsible for establishing and maintaining adequate internal control over financial
reporting, as defined in Rule 13a-15(f) under the Exchange Act, to provide reasonable assurance regarding the reliability of our financial reporting and the preparation of financial statements for external purposes in accordance with generally
accepted accounting principles. Internal control over financial reporting includes those policies and procedures that (i) pertain to the maintenance of records that in reasonable detail accurately and fairly reflect the transactions and dispositions
of the assets of the Company; (ii) provide reasonable assurance that transactions are recorded as necessary to permit preparation of financial statements in accordance with generally accepted accounting principles, and that receipts and expenditures
of the Company are being made only in accordance with authorizations of management and directors of the Company; and (iii) provide reasonable assurance regarding prevention or timely detection of unauthorized acquisition, use or disposition of the
Company’s assets that could have a material effect on the financial statements.
26
Our management assessed our internal control over financial reporting as of December 31, 2019. Our management
based its assessment on criteria established in Internal Control–Integrated Framework issued by the Committee of Sponsoring Organizations of the
Treadway Commission (“2013 COSO”). In the opinion of management, TransAct did not maintain effective internal control over financial reporting as of December 31, 2019 solely because of the material weaknesses in internal control over financial
reporting described below that existed as of December 31, 2018 and were not remediated as of December 31, 2019.
A material weakness is defined in Rule 12b-2 under the Exchange Act as a deficiency, or a combination of
deficiencies, in internal control over financial reporting, such that there is a reasonable possibility that a material misstatement of the Company’s annual or interim financial statements will not be prevented or detected on a timely basis.
We identified the following control deficiencies that constituted material weaknesses in our internal control
over financial reporting as of December 31, 2019 and 2018.
|
We did not design and maintain effective controls over user access within the Company’s ERP system,
Oracle, to ensure appropriate segregation of duties and to adequately restrict user access to appropriate personnel. Specifically, the provisioning and user recertification controls are not designed to ensure users maintain proper
segregation of duties and therefore could have inappropriate access rights. (the “Access Control Weakness”).
|
|
We did not design and maintain effective controls over the completeness and accuracy of information
included in key spreadsheets supporting our accounting records (the “Spreadsheet Control Weakness”).
|
The control deficiencies constituted material weaknesses but did not result in a material misstatement of our
annual or interim consolidated financial statements. However, if these material weaknesses are not remediated, a material misstatement of account balances or disclosures may not be prevented, and may go undetected, which could result in a material
misstatement of future annual or interim consolidated financial statements.
The effectiveness of the Company’s internal control over financial reporting as of December 31, 2019 has been
audited by PricewaterhouseCoopers LLP, an independent registered public accounting firm, as stated in their report which appears on pages F-2 through F-3 of this Form 10-K.
Remediation Plan
During 2019, we commenced developing and implementing a plan to enhance the design and operating effectiveness
of our internal control over financial reporting, which includes taking the following steps to remediate the identified control deficiencies and material weaknesses:
|
To address the Access Control Weakness, we are utilizing the services of an Oracle consulting firm to
assist us in analyzing and reviewing Oracle access for all users. During the first quarter of 2020, we completed the analysis and have developed an action plan to modify the designated Oracle responsibilities for each employee with respect
to whom a conflict was identified to remove any Oracle transactional responsibilities that we believe are conflicting and, in some instances, we will reassign those responsibilities to a different employee to ensure proper segregation of
duties. We have begun the design and testing of the new Oracle responsibilities created. In addition, we plan to enhance and implement provisioning and user certification controls to ensure we maintain the appropriate segregation of
duties within Oracle following the analysis.
|
|
To address the Spreadsheet Control Weakness, for each key spreadsheet using Oracle data, we plan to
evaluate and determine (1) if a standard Oracle report exists containing the same information as the spreadsheet, and if so, we would utilize the standard Oracle report (without modification) instead of the spreadsheet to support our
accounting records and (2) if a standard Oracle report cannot be used, we will implement a new key control whereby an employee performs a formal validation that the information from Oracle is completely and accurately transferred
(automatically or manually) to a spreadsheet by verifying totals and other information on a test basis. For all other key spreadsheets, we plan to design and implement a new key control to validate completeness and accuracy of information
supporting our accounting records. During the first quarter of 2020, we began the process of evaluating each key spreadsheet based on the above criteria, and for several key spreadsheets, we implemented a new key control to validate the
completeness and accuracy of the information contained within and supporting each such spreadsheet.
|
We believe these steps will address the material weaknesses described above.
Changes in Internal Control over Financial Reporting
There has been no change in our internal control over financial reporting that occurred during the quarter ended December 31, 2019
that has materially affected, or is reasonably likely to materially affect, our internal control over financial reporting.
PART III
Set forth in Item 1 of this Form 10-K is certain information regarding our executive officers. The remaining information in response
to this item will be contained in our Proxy Statement for our 2020 Annual Meeting of Stockholders (the “Proxy Statement”) under the headings, “Delinquent Section 16(a) Reportings,” “Corporate Governance,” “Proposal 1: Election of Directors,” “Audit
Committee Report,” “Executive Compensation – Compensation Committee Report,” “Compensation Committee Interlocks and Insider Participation,” “Stockholder Proposals for 2020 Annual Meeting,” “Procedures for Submitted Director Nominations and
Recommendations” and “Stockholder Communications with the Board of Directors Policy,” which will be filed within 120 days after the end of the year covered by this Form 10-K and is incorporated herein by reference.
Code of Ethics
We maintain a Code of Business Conduct that includes our code of ethics that is applicable to all employees, including our Chief
Executive Officer, Chief Financial Officer and Controller. Our Code of Business Conduct, which requires continued observance of high ethical standards, such as honesty, integrity and compliance with the law in the conduct of our business, is
available for public access on our Internet website at https://transacttech.gcs-web.com/corporate-governance. Any person may request a copy of our Code of Business Conduct free of charge by calling (203) 859-6800.
The information in response to this item will be contained in the Proxy Statement under the heading “Executive Compensation,” and is
incorporated herein by reference.
Item 12. Security Ownership of Certain Beneficial Owners and
Management and Related Stockholder Matters.
Set forth below is certain information regarding our equity compensation plans. The remaining information in response to this item
will be contained in the Proxy Statement under the heading, “Security Ownership of Certain Beneficial Owners and Management,” and is incorporated herein by reference.
Equity Compensation Plan Information
Information regarding our equity compensation plans as of December 31, 2019 is as follows:
|
Plan category
|
(a)
Number of
securities to be
issued upon exercise
of outstanding options,
warrants and rights
|
(b)
Weighted-average
exercise price of
outstanding
options, warrants
and rights
|
(c)
Number of securities
remaining available for
future issuance under
equity compensation plans
(excluding securities
reflected in column (a)
|
|||||||||
|
Equity compensation plans approved by security holders:
|
||||||||||||
|
2005 Equity Incentive Plan
|
363,500
|
$
|
9.18
|
–
|
||||||||
|
2014 Equity Incentive Plan
|
869,543
|
8.29
|
332,541
|
|||||||||
|
Total
|
1,233,043
|
$
|
8.56
|
332,541
|
||||||||
In May 2014, our stockholders approved the adoption of the 2014 Equity Incentive Plan. In May 2017, our stockholders approved an
amendment to the 2014 Equity Incentive Plan to increase the number of shares of common stock which may be subject to awards granted under the plan from 600,000 to its current level of 1,400,000. The Company also maintains the 2005 Equity Incentive
Plan; however no new awards will be available for future issuance under this plan. Both plans generally provide for award in the form of: (i) incentive stock options, (ii) non-qualified stock options, (iii) restricted stock, (iv) restricted stock
units (which may include performance-based vesting), (v) stock appreciation rights or (vi) limited stock appreciation rights. The Company does not have any equity plans that have not been approved by its stockholders.
The information in response to this item will be contained in the Proxy Statement under the headings “Certain Relationships and
Related Transactions” and is incorporated herein by reference.
The information in response to this item will be contained in the Proxy Statement under the headings, “Policy Regarding Pre-Approval
of Services Provided by the Independent Registered Public Accounting Firm” and “Independent Registered Public Accounting Firm’s Services and Fee’s” and is incorporated herein by reference.
28
PART IV
|
(a)
|
The following documents are filed as part of this Form 10-K:
|
|
1.
|
Financial Statements.
|
|
Report of Independent Registered Public Accounting Firm
|
|
Consolidated Balance Sheets as of December 31, 2019 and 2018
|
|
Consolidated Statements of Income for the years ended December 31, 2019, 2018, and 2017
|
|
Consolidated Statements of Comprehensive Income for the years ended December 31, 2019, 2018 and 2017
|
|
Consolidated Statements of Changes in Shareholders' Equity for the years ended December 31, 2019, 2018 and
2017
|
|
Consolidated Statements of Cash Flows for the years ended December 31, 2019, 2018 and 2017
|
|
Notes to Consolidated Financial Statements
|
|
2.
|
Schedules.
|
All schedules are omitted because they are either inapplicable or not required, or because the information required therein is included
in the Consolidated Financial Statements and Notes thereto.
29
3. Exhibits.
Exhibits Index
|
Certificate of Incorporation of TransAct Technologies Incorporated (conformed copy) (incorporated by reference to Exhibit 3(i) of the Company’s
Quarterly Report on Form 10-Q (SEC File No. 000-21121) filed with the SEC on August 9, 2019).
|
|
|
Certificate of Designation, Series A Preferred Stock, filed with the Secretary of State of Delaware on December 2, 1997 (incorporated by reference
to Exhibit C of the Company’s Current Report on Form 8-K (SEC File No. 000-21121) filed with the SEC on February 18, 1999).
|
|
|
Certificate of Designation, Series B Preferred Stock, filed with the Secretary of State of Delaware on April 6, 2000 (incorporated by reference to
Exhibit 3.1(c) of the Company’s Quarterly Report on Form 10-Q (SEC File No. 000-21121) filed with the SEC on May 8, 2000).
|
|
|
Amended and Restated By-laws of the Company (incorporated by reference to Exhibit 3.1 of the Company’s Current Report on Form 8-K (SEC File No.
000-21121) filed with the SEC on August 2, 2019).
|
|
|
Specimen Common Stock Certificate (incorporated by reference to Exhibit 4.1 of the Company’s Registration Statement on Form S-1/A (No. 333-06895)
filed with the SEC on August 1, 1996).
|
|
|
4.2*
|
Description of Securities.
|
|
10.1(x)
|
2005 Equity Incentive Plan (incorporated by reference to Exhibit 99.1 of the Company’s Current Report on Form 8-K (SEC File No. 000-21121) filed
with the SEC on June 1, 2005).
|
|
10.2(x)
|
2014 Equity Incentive Plan (incorporated by reference to Exhibit 10.1 of the Company’s Current Report on Form 8-K (SEC File No. 000-21121) filed
with the SEC on May 19, 2014).
|
|
10.3(x)
|
Amendment to 2014 Equity Incentive Plan approved by Shareholders on May 22, 2017 (incorporated by reference to Exhibit 10.1 of the Company’s
Quarterly Report on Form 10-Q (SEC File No. 000-21121) filed with the SEC on August 9, 2017).
|
|
10.4(x)
|
2014 Equity Incentive Plan Time-based Restricted Stock Unit Agreement (incorporated by reference to Exhibit 10.2 of the Company's Quarterly Report
on Form 10-Q (SEC File No. 000-21121) filed with the SEC on May 6, 2016).
|
|
10.5(x)
|
2014 Equity Incentive Plan Performance-based Restricted Stock Unit Agreement (incorporated by reference to Exhibit 10.1 of the Company's Quarterly
Report on Form 10-Q (SEC File No. 000-211121) filed with the SEC on August 8, 2016).
|
|
10.6(x)
|
Employment Agreement, dated July 31, 1996, by and between TransAct and Bart C. Shuldman (incorporated by reference to Exhibit 10.20 of the
Company’s Registration Statement on Form S-1/A (No. 333-06895) filed with the SEC on August 1, 1996).
|
|
10.7(x)
|
Severance Agreement by and between TransAct and Steven A. DeMartino, dated June 1, 2004 (incorporated by reference to Exhibit 10.8 of the Company’s
Annual Report on Form 10-K (SEC File No. 000-21121) filed with the SEC on March 16, 2005).
|
|
10.8(x)
|
Severance Agreement by and between TransAct and Tracey S. Chernay, dated July 29, 2005 (incorporated by reference to Exhibit 10.9 of the Company’s
Annual Report on Form 10-K (SEC File No. 000-21121) filed with the SEC on March 14, 2008).
|
|
10.9(x)
|
Amendment to Employment Agreement, effective January 1, 2008, by and between TransAct and Bart C. Shuldman (incorporated by reference to Exhibit
10.10 of the Company’s Annual Report on Form 10-K (SEC File No. 000-21121) filed with the SEC on March 16, 2009).
|
|
10.10(x)
|
Amendment to Severance Agreement by and between TransAct and Steven A. DeMartino, effective January 1, 2008 (incorporated by reference to Exhibit
10.12 of the Company’s Annual Report on Form 10-K (SEC File No. 000-21121) filed with the SEC on March 16, 2009).
|
|
10.11(x)
|
Amendment to Severance Agreement by and between TransAct and Tracey S. Chernay, effective January 1, 2008 (incorporated by reference to Exhibit
10.14 of the Company’s Annual Report on Form 10-K (SEC File No. 000-21121) filed with the SEC on March 16, 2009).
|
|
Lease Agreement by and between Bomax Properties and Ithaca, dated as of March 23, 1992 (incorporated by reference to Exhibit 10.14 of the Company’s
Registration Statement on Form S-1 (No. 333-06895) filed with the SEC on June 26, 1996).
|
|
|
Second Amendment to Lease Agreement by and between Bomax Properties and Ithaca, dated December 2, 1996 (incorporated by reference to Exhibit 10.27 of the Company’s Annual Report on Form 10-K (SEC File No. 000-21121) filed with the SEC on March 31, 1998).
|
|
|
Agreement regarding the Continuation and Renewal of Lease by and between Bomax Properties, LLC and TransAct, dated July 18, 2001 (incorporated by reference to Exhibit 10.8 of the Company’s Annual Report on Form 10-K (SEC File No. 000-21121) filed with the SEC on March 29, 2002).
|
|
|
Amendment No. 1 to Lease Agreement between Bomax Properties, LLC and TransAct (incorporated by reference to Exhibit 10.16 of the Company’s
Quarterly Report on Form 10-Q (SEC File No. 000-21121) filed with the SEC on May 10, 2012).
|
|
|
Amendment No. 2 to Lease Agreement between Bomax Properties, LLC and TransAct, dated January 14, 2016 (incorporated by reference to Exhibit 10.13
of the Company’s Annual Report on Form 10-K (SEC File No. 000-21121) filed with the SEC on March 11, 2016).
|
|
|
Amendment No. 3 to Lease Agreement between Bomax Properties, LLC and TransAct, dated February 28, 2020 (incorporated by reference to Exhibit 10.1
to the Company’s Current Report on Form 8-K (SEC File No. 000-21121) filed with the SEC on March 4, 2020).
|
|
|
Lease Agreement by and between Las Vegas Airport Properties LLC and TransAct dated December 2, 2004 (incorporated by reference to Exhibit 10.13 of
the Company’s Annual Report on Form 10-K (SEC File No. 000-21121) filed with the SEC on March 16, 2005).
|
|
|
First Amendment to Lease Agreement by and between Las Vegas Airport Properties LLC and TransAct dated August 31, 2009 (incorporated by reference to
Exhibit 10.19 of the Company’s Annual Report on Form 10-K (SEC File No. 000-21121) filed with the SEC on March 16, 2010).
|
|
|
Second Amendment to Lease Agreement by and between The Realty Associates Fund IX LP and TransAct dated June 30, 2015 (incorporated by reference to
Exhibit 10.2 of the Company’s Quarterly Report on Form 10-Q (SEC File No. 000-21121) filed with the SEC on August 7, 2015).
|
|
|
Lease Agreement by and between 2319 Hamden Center I, L.L.C. and TransAct dated November 27, 2006 (incorporated by reference to Exhibit 10.14 of the
Company’s Annual Report on Form 10-K (SEC File No. 000-21121) filed with the SEC on March 15, 2007).
|
|
|
First Amendment to Lease by and between 2319 Hamden Center I, L.L.C. and TransAct dated January 3, 2017 (incorporated by reference to Exhibit 10.20
of the Company’s Annual Report on Form 10-K (SEC File No. 000-21121) filed with the SEC on March 16, 2017).
|
|
|
Amended and Restated Revolving Credit and Security Agreement between TransAct and TD Banknorth, N.A. dated November 28, 2006 (incorporated by
reference filed with the Company's Annual Report on Form 10-K (SEC File No. 000-21121)for the year ended December 31, 2006).
|
|
|
First Amendment to Amended and Restated Revolving Credit and Security Agreement between TransAct and TD Banknorth, N.A. effective September 30,
2007 (incorporated by reference to Exhibit 10.20 of the Company’s Quarterly Report on Form 10-Q (SEC File No. 000-21121) filed with the SEC on November 9, 2007).
|
|
|
Second Amendment to Amended and Restated Revolving Credit and Security Agreement between TransAct and TD Bank, N.A. effective November 22, 2011 (incorporated
by reference to Exhibit 10.25 of the Company’s Annual Report on Form 10-K (SEC File No. 000-21121) filed with the SEC on March 12, 2012).
|
|
|
Third Amendment to Amended and Restated Revolving Credit and Security Agreement effective September 7, 2012 (incorporated by reference to Exhibit
10.26 of the Company’s Current Report on Form 8-K (SEC File No. 000-21121) filed with the SEC on September 11, 2012).
|
|
|
Fourth Amendment to Amended and Restated Revolving Credit and Security Agreement effective November 26, 2014 (incorporated by reference to Exhibit
99.1 of the Company’s Current Report on Form 8-K (SEC File No. 000-21121) filed with the SEC on December 1, 2014).
|
|
|
Fifth Amendment to Amended and Restated Revolving Credit and Security Agreement effective November 21, 2017 (incorporated by reference to Exhibit
99.1 to the Company’s Current Report on Form 8-K (SEC File No. 000-21121) filed with the SEC on November 22, 2017)..
|
|
|
Subsidiaries of the Company
|
|
|
Consent of PricewaterhouseCoopers LLP.
|
|
|
Rule 13a-14(a) Certification of Chief Executive Officer in accordance with Section 302 of the Sarbanes-Oxley Act of 2002.
|
|
|
Rule 13a-14(a) Certification of Chief Financial Officer in accordance with Section 302 of the Sarbanes-Oxley Act of 2002.
|
|
|
Certification of Chief Executive Officer and Chief Financial Officer pursuant to 18 U.S.C. Section 1350 as adopted pursuant to Section 906 of the
Sarbanes-Oxley Act of 2002.
|
|
|
101.INS
|
XBRL Instance Document.
|
|
101.SCH
|
XBRL Taxonomy Extension Schema Document.
|
|
101.CAL
|
XBRL Taxonomy Extension Calculation Linkbase Document.
|
|
101.DEF
|
XBRL Taxonomy Extension Definition Linkbase Document.
|
|
101.LAB
|
XBRL Taxonomy Extension Label Linkbase Document.
|
|
101.PRE
|
XBRL Taxonomy Extension Presentation Linkbase Document.
|
30
* These
exhibits are filed herewith.
| (x) |
Management contract or compensatory plan or arrangement.
|
|
(a)
|
Exhibits.
|
The Exhibits required by Item 601 of Regulation S-K under the Exchange Act are included in the Exhibit Index above under a(3) of this Item 15.
|
(b)
|
Financial Statement Schedules.
|
See the Notes to the Consolidated Financial Statements included in this Form 10-K.
31
Pursuant to the requirements of Section 13 or 15(d) of the Securities Exchange Act of 1934, the registrant has duly caused this report
to be signed on its behalf by the undersigned, thereunto duly authorized.
|
|
TRANSACT TECHNOLOGIES INCORPORATED
|
|
|
|
|
|
|
|
By:
|
/s/ Bart C. Shuldman
|
|
|
Name:
|
Bart C. Shuldman
|
|
|
Title:
|
Chairman of the Board and Chief Executive Officer
|
Date: March 16, 2020
Pursuant to the requirements of the Securities Exchange Act of 1934, this report has been signed below by the following persons on
behalf of the registrant and in the capacities and on the dates indicated.
|
Signature
|
Title
|
Date
|
||||
|
|
|
|
||||
|
/s/ Bart C. Shuldman
|
Chairman of the Board and Chief Executive Officer
|
March 16, 2020
|
||||
|
Bart C. Shuldman
|
(Principal Executive Officer)
|
|
||||
|
|
|
|
||||
|
/s/ Steven A. DeMartino
|
President, Chief Financial Officer, Treasurer and Secretary
|
March 16, 2020
|
||||
|
Steven A. DeMartino
|
(Principal Financial Officer)
|
|
||||
|
/s/ David B. Peters
|
Vice President and Chief Accounting Officer
|
March 16, 2020
|
||||
|
David B. Peters
|
(Principal Accounting Officer)
|
|||||
|
|
|
|
||||
|
/s/ John M. Dillon
|
Director
|
March 16, 2020
|
||||
|
John M. Dillon
|
|
|
||||
|
|
|
|
||||
|
/s/ Emanuel P. N. Hilario
|
Director
|
March 16, 2020
|
||||
|
Emanuel P. N. Hilario
|
||||||
|
/s/ Haydee Olinger
|
Director
|
March 16, 2020
|
||||
|
Haydee Olinger
|
|
|
||||
|
|
|
|
||||
|
/s/ Thomas R. Schwarz
|
Director
|
March 16, 2020
|
||||
|
Thomas R. Schwarz
|
|
|
32
TRANSACT TECHNOLOGIES INCORPORATED
|
Financial Statements
|
|
|
F-3
|
|
|
F-4
|
|
|
F-5
|
|
|
F-6
|
|
|
F-7
|
|
|
F-8
|
|
|
F-9
|
F-1
To the Board of Directors and Shareholders of TransAct Technologies Incorporated
Opinions on the Financial Statements and Internal Control over Financial
Reporting
We have audited the accompanying consolidated balance sheets of TransAct Technologies Incorporated and its
subsidiaries (the “Company”) as of December 31, 2019 and 2018, and the related consolidated statements of income, comprehensive income, changes in shareholders’ equity and cash flows for each of the three years in the period ended December 31, 2019,
including the related notes (collectively referred to as the “consolidated financial statements”). We also have audited the Company's internal control over financial reporting as of December 31, 2019, based on criteria established in Internal Control - Integrated Framework (2013) issued by the Committee of Sponsoring Organizations of the Treadway Commission (COSO).
In our opinion, the consolidated financial statements referred to above present fairly, in all material respects,
the financial position of the Company as of December 31, 2019 and 2018, and the results of its operations and its cash flows for each of the three years in the period ended December 31, 2019 in conformity with accounting principles generally accepted
in the United States of America. Also in our opinion, the Company did not maintain, in all material respects, effective internal control over financial reporting as of December 31, 2019, based on criteria established in Internal Control - Integrated Framework (2013) issued by the COSO because material weaknesses in internal control over financial reporting existed as of that date related to
the Company not designing and maintaining effective controls over (i) user access within the Company’s ERP system, Oracle, to ensure appropriate segregation of duties and to adequately restrict user access to appropriate personnel, and (ii) the
completeness and accuracy of information included in key spreadsheets supporting the Company’s accounting records.
A material weakness is a deficiency, or a combination of deficiencies, in internal control over financial
reporting, such that there is a reasonable possibility that a material misstatement of the annual or interim financial statements will not be prevented or detected on a timely basis. The material weaknesses referred to above are described in
Management’s Annual Report on Internal Control over Financial Reporting appearing under Item 9A. We considered these material weaknesses in determining the nature, timing, and extent of audit tests applied in our audit of the 2019 consolidated
financial statements, and our opinion regarding the effectiveness of the Company’s internal control over financial reporting does not affect our opinion on those consolidated financial statements.
Change in Accounting Principle
As discussed in Note 2 to the consolidated financial statements, the Company changed the manner in which it
accounts for leases in 2019.
Basis for Opinions
The Company's management is responsible for these consolidated financial statements, for maintaining effective
internal control over financial reporting, and for its assessment of the effectiveness of internal control over financial reporting included in management's report referred to above. Our responsibility is to express opinions on the Company’s
consolidated financial statements and on the Company's internal control over financial reporting based on our audits. We are a public accounting firm registered with the Public Company Accounting Oversight Board (United States) (PCAOB) and are
required to be independent with respect to the Company in accordance with the U.S. federal securities laws and the applicable rules and regulations of the Securities and Exchange Commission and the PCAOB.
We conducted our audits in accordance with the standards of the PCAOB. Those standards require that we plan and
perform the audits to obtain reasonable assurance about whether the consolidated financial statements are free of material misstatement, whether due to error or fraud, and whether effective internal control over financial reporting was maintained in
all material respects.
Our audits of the consolidated financial statements included performing procedures to assess the risks of
material misstatement of the consolidated financial statements, whether due to error or fraud, and performing procedures that respond to those risks. Such procedures included examining, on a test basis, evidence regarding the amounts and disclosures
in the consolidated financial statements. Our audits also included evaluating the accounting principles used and significant estimates made by management, as well as evaluating the overall presentation of the consolidated financial statements. Our
audit of internal control over financial reporting included obtaining an understanding of internal control over financial reporting, assessing the risk that a material weakness exists, and testing and evaluating the design and operating effectiveness
of internal control based on the assessed risk. Our audits also included performing such other procedures as we considered necessary in the circumstances. We believe that our audits provide a reasonable basis for our opinions.
F-2
Definition and Limitations of Internal Control over Financial Reporting
A company’s internal control over financial reporting is a process designed to provide reasonable assurance
regarding the reliability of financial reporting and the preparation of financial statements for external purposes in accordance with generally accepted accounting principles. A company’s internal control over financial reporting includes those
policies and procedures that (i) pertain to the maintenance of records that, in reasonable detail, accurately and fairly reflect the transactions and dispositions of the assets of the company; (ii) provide reasonable assurance that transactions are
recorded as necessary to permit preparation of financial statements in accordance with generally accepted accounting principles, and that receipts and expenditures of the company are being made only in accordance with authorizations of management and
directors of the company; and (iii) provide reasonable assurance regarding prevention or timely detection of unauthorized acquisition, use, or disposition of the company’s assets that could have a material effect on the financial statements.
Because of its inherent limitations, internal control over financial reporting may not prevent or detect
misstatements. Also, projections of any evaluation of effectiveness to future periods are subject to the risk that controls may become inadequate because of changes in conditions, or that the degree of compliance with the policies or procedures may
deteriorate.
/s/ PricewaterhouseCoopers LLP
Hartford, Connecticut
March 16, 2020
We have served as the Company's auditor since 1996.
F-3
TRANSACT TECHNOLOGIES INCORPORATED
(In thousands, except share data)
|
|
December 31,
2019
|
December 31,
2018
|
||||||
|
Assets:
|
||||||||
|
Current assets:
|
||||||||
|
Cash and cash equivalents
|
$
|
4,203
|
$
|
4,691
|
||||
|
Accounts receivable, net
|
6,418
|
8,025
|
||||||
|
Note receivable
|
1,017,000
|
–
|
||||||
|
Inventories, net
|
12,099
|
12,835
|
||||||
|
Prepaid income taxes
|
180
|
809
|
||||||
|
Other current assets
|
998
|
677
|
||||||
|
Total current assets
|
24,915
|
27,037
|
||||||
|
|
||||||||
|
Fixed assets, net
|
2,244
|
2,272
|
||||||
|
Right-of-use asset
|
2,855,000
|
–
|
||||||
|
Goodwill
|
2,621
|
2,621
|
||||||
|
Deferred tax assets
|
2,565
|
2,198
|
||||||
|
Intangible assets, net
|
817
|
797
|
||||||
|
Other assets
|
44
|
31
|
||||||
|
11,146
|
7,919
|
|||||||
|
Total assets
|
36,061
|
34,956
|
||||||
|
|
||||||||
|
Liabilities and Shareholders’ Equity:
|
||||||||
|
Current liabilities:
|
||||||||
|
Accounts payable
|
$
|
2,960
|
$
|
3,483
|
||||
|
Accrued liabilities
|
3,041
|
2,765
|
||||||
|
Lease liability
|
945,000
|
–
|
||||||
|
Deferred revenue
|
700
|
384
|
||||||
|
Total current liabilities
|
7,646
|
6,632
|
||||||
|
|
||||||||
|
Deferred revenue, net of current portion
|
219
|
265
|
||||||
|
Lease liability, net of current portion
|
2,104
|
–
|
||||||
|
Deferred rent, net of current portion
|
–
|
250,000
|
||||||
|
Other liabilities
|
166
|
242
|
||||||
|
|
2,489
|
757
|
||||||
|
Total liabilities
|
10,135
|
7,389
|
||||||
|
Commitments and contingencies (Note 15)
|
||||||||
|
Shareholders’ equity:
|
||||||||
|
Preferred stock, $0.01 value, 4,800,000 authorized, none issued and outstanding
|
–
|
–
|
||||||
|
Preferred stock, Series A, $0.01 par value, 200,000 authorized, none issued and
outstanding
|
–
|
–
|
||||||
|
Common stock, $0.01 par value, 20,000,000 authorized at December 31, 2019 and 2018;
11,515,090 and 11,463,141 shares issued; 7,470,248 and 7,418,299 shares outstanding, at December 31, 2019 and 2018, respectively
|
115
|
115
|
||||||
|
Additional paid-in capital
|
32,604
|
32,129
|
||||||
|
Retained earnings
|
25,348
|
27,515
|
||||||
|
Accumulated other comprehensive loss, net of tax
|
(31
|
)
|
(82
|
)
|
||||
|
Treasury stock, 4,044,842 shares, at cost
|
(32,110
|
)
|
(32,110
|
)
|
||||
|
Total shareholders’ equity
|
25,926
|
27,567
|
||||||
|
Total liabilities and shareholders’ equity
|
$
|
36,061
|
$
|
34,956
|
||||
See accompanying notes to Consolidated Financial Statements.
F-4
TRANSACT TECHNOLOGIES INCORPORATED
(In thousands, except per share data)
|
|
Year Ended December 31,
|
|||||||||||
|
|
2019
|
2018
|
2017
|
|||||||||
|
|
||||||||||||
|
Net sales
|
$
|
45,748
|
$
|
54,587
|
$
|
56,311
|
||||||
|
Cost of sales
|
23,813
|
27,844
|
29,649
|
|||||||||
|
|
||||||||||||
|
Gross profit
|
21,935
|
26,743
|
26,662
|
|||||||||
|
|
||||||||||||
|
Operating expenses:
|
||||||||||||
|
Engineering, design and product development
|
4,393
|
4,576
|
4,303
|
|||||||||
|
Selling and marketing
|
8,033
|
7,203
|
7,561
|
|||||||||
|
General and administrative
|
9,166
|
8,205
|
7,984
|
|||||||||
|
|
21,592
|
19,984
|
19,848
|
|||||||||
|
|
||||||||||||
|
Operating income
|
343
|
6,759
|
6,814
|
|||||||||
|
Interest and other income (expense):
|
||||||||||||
|
Interest expense
|
(28
|
)
|
(27
|
)
|
(33
|
)
|
||||||
|
Interest income
|
17
|
–
|
–
|
|||||||||
|
Other, net
|
35
|
(266
|
)
|
(9
|
)
|
|||||||
|
|
24
|
(293
|
)
|
(42
|
)
|
|||||||
|
|
||||||||||||
|
Income before income taxes
|
367
|
6,466
|
6,772
|
|||||||||
|
Income tax (benefit) provision
|
(149
|
)
|
1,040
|
3,561
|
||||||||
|
Net income
|
$
|
516
|
$
|
5,426
|
$
|
3,211
|
||||||
|
|
||||||||||||
|
Net income per common share:
|
||||||||||||
|
Basic
|
$
|
0.07
|
$
|
0.73
|
$
|
0.43
|
||||||
|
Diluted
|
$
|
0.07
|
$
|
0.70
|
$
|
0.42
|
||||||
|
|
||||||||||||
|
Shares used in per-share calculation:
|
||||||||||||
|
Basic
|
7,466
|
7,444
|
7,423
|
|||||||||
|
Diluted
|
7,677
|
7,759
|
7,592
|
|||||||||
|
|
||||||||||||
|
Dividends declared and paid per common share:
|
$
|
0.36
|
$
|
0.36
|
$
|
0.35
|
||||||
See accompanying notes to Consolidated Financial Statements.
F-5
TRANSACT TECHNOLOGIES INCORPORATED
(In thousands, except share data)
|
|
Year Ended December 31,
|
|||||||||||
|
|
2019
|
2018
|
2017
|
|||||||||
|
|
||||||||||||
|
Net income
|
$
|
516
|
$
|
5,426
|
$
|
3,211
|
||||||
|
Foreign currency translation adjustment, net of tax
|
51
|
17
|
10
|
|||||||||
|
|
||||||||||||
|
Comprehensive income
|
$
|
567
|
$
|
5,443
|
$
|
3,221
|
||||||
See accompanying notes to Consolidated Financial Statements.
F-6
TRANSACT TECHNOLOGIES INCORPORATED
(In thousands, except share data)
|
Common Stock
|
Additional
Paid-in
|
Retained
|
Treasury
|
Accumulated
Other
Comprehensive
|
Total
|
|||||||||||||||||||||||
|
|
Shares
|
Amount
|
Capital
|
Earnings
|
Stock
|
Income (Loss)
|
Equity
|
|||||||||||||||||||||
|
Balance, December 31, 2016
|
7,333,364
|
$
|
112
|
$
|
29,701
|
$
|
24,157
|
$
|
(29,752
|
)
|
$
|
(109
|
)
|
$
|
24,109
|
|||||||||||||
|
Issuance of shares from exercise of stock options
|
166,600
|
2
|
1,041
|
–
|
–
|
–
|
1,043
|
|||||||||||||||||||||
|
Issuance of common stock on restricted stock units
|
8,300
|
– |
– |
– |
– |
– |
– |
|||||||||||||||||||||
|
Issuance of common stock on deferred stock units
|
8,663
|
–
|
–
|
–
|
–
|
–
|
–
|
|||||||||||||||||||||
|
Relinquishment of stock awards and deferred stock units to pay withholding taxes
|
(2,368
|
)
|
–
|
(29
|
)
|
–
|
–
|
–
|
(29
|
)
|
||||||||||||||||||
|
Purchase of treasury stock
|
(36,465
|
)
|
–
|
–
|
–
|
(358
|
)
|
–
|
(358
|
)
|
||||||||||||||||||
|
Dividends declared and paid on common stock
|
–
|
–
|
–
|
(2,581
|
)
|
–
|
–
|
(2,581
|
)
|
|||||||||||||||||||
|
Share-based compensation expense
|
–
|
–
|
609
|
–
|
–
|
–
|
609
|
|||||||||||||||||||||
|
Adjustment upon adoptions of ASU 2016-09
|
–
|
–
|
31
|
(31
|
)
|
–
|
–
|
–
|
||||||||||||||||||||
|
Foreign currency translation adjustment, net of tax
|
–
|
–
|
–
|
–
|
–
|
10
|
10
|
|||||||||||||||||||||
|
Net income
|
–
|
–
|
–
|
3,211
|
–
|
–
|
3,211
|
|||||||||||||||||||||
|
Balance, December 31, 2017
|
7,478,094
|
$
|
114
|
$
|
31,353
|
$
|
24,756
|
$
|
(30,110
|
)
|
$
|
(99
|
)
|
$
|
26,014
|
|||||||||||||
|
Issuance of shares from exercise of stock options
|
58,146
|
1
|
415
|
–
|
–
|
–
|
416
|
|||||||||||||||||||||
|
Issuance of common stock on restricted stock units
|
33,935
|
–
|
–
|
–
|
–
|
–
|
–
|
|||||||||||||||||||||
|
Issuance of common stock on deferred stock units
|
23,578
|
–
|
–
|
–
|
–
|
–
|
–
|
|||||||||||||||||||||
|
Relinquishment of stock awards and deferred stock units to pay withholding taxes
|
(19,044
|
)
|
–
|
(268
|
)
|
–
|
–
|
–
|
(268
|
)
|
||||||||||||||||||
|
Purchase of treasury stock
|
(156,410
|
)
|
–
|
–
|
–
|
(2,000
|
)
|
–
|
(2,000
|
)
|
||||||||||||||||||
|
Dividends declared and paid on common stock
|
–
|
–
|
–
|
(2,667
|
)
|
–
|
–
|
(2,667
|
)
|
|||||||||||||||||||
|
Share-based compensation expense
|
–
|
–
|
629
|
–
|
–
|
–
|
629
|
|||||||||||||||||||||
|
Foreign currency translation adjustment, net of tax
|
–
|
–
|
–
|
–
|
–
|
17
|
17
|
|||||||||||||||||||||
|
Net income
|
–
|
–
|
–
|
5,426
|
–
|
–
|
5,426
|
|||||||||||||||||||||
|
Balance, December 31, 2018
|
7,418,299
|
$
|
115
|
$
|
32,129
|
$
|
27,515
|
$
|
(32,110
|
)
|
$
|
(82
|
)
|
$
|
27,567
|
|||||||||||||
|
Issuance of common stock on restricted stock units
|
45,167
|
–
|
–
|
–
|
–
|
–
|
–
|
|||||||||||||||||||||
|
Issuance of common stock on deferred stock units
|
28,231
|
–
|
–
|
–
|
–
|
–
|
–
|
|||||||||||||||||||||
|
Relinquishment of stock awards and deferred stock units to pay withholding taxes
|
(21,449
|
)
|
–
|
(217
|
)
|
–
|
–
|
–
|
(217
|
)
|
||||||||||||||||||
|
Dividends declared and paid on common stock
|
–
|
–
|
–
|
(2,683
|
)
|
–
|
–
|
(2,683
|
)
|
|||||||||||||||||||
|
Share-based compensation expense
|
–
|
–
|
692
|
–
|
–
|
–
|
692
|
|||||||||||||||||||||
|
Foreign currency translation adjustment, net of tax
|
–
|
–
|
–
|
–
|
–
|
51
|
51
|
|||||||||||||||||||||
|
Net income
|
–
|
–
|
–
|
516
|
–
|
–
|
516
|
|||||||||||||||||||||
|
Balance, December 31, 2019
|
7,470,248
|
$
|
115
|
$
|
32,604
|
$
|
25,348
|
$
|
(32,110
|
)
|
$
|
(31
|
)
|
$
|
25,926
|
|||||||||||||
See accompanying notes to Consolidated Financial Statements.
F-7
TRANSACT TECHNOLOGIES INCORPORATED
(In thousands)
|
|
Year Ended December 31,
|
|||||||||||
|
|
2019
|
2018
|
2017
|
|||||||||
|
Cash flows from operating activities:
|
||||||||||||
|
Net income
|
$
|
516
|
$
|
5,426
|
$
|
3,211
|
||||||
|
Adjustments to reconcile net income to net cash provided by operating activities:
|
||||||||||||
|
Share-based compensation expense
|
692
|
629
|
609
|
|||||||||
|
Depreciation and amortization
|
1,371
|
997
|
1,081
|
|||||||||
|
Deferred income tax (benefit) provision
|
(294
|
)
|
(107
|
)
|
1,117
|
|||||||
|
Provision for doubtful accounts
|
16
|
105
|
50
|
|||||||||
|
Foreign currency transaction losses
|
18
|
199
|
11
|
|||||||||
|
Changes in operating assets and liabilities:
|
||||||||||||
|
Accounts receivable
|
1,589
|
2,688
|
(405
|
)
|
||||||||
|
Inventories
|
796
|
(4,049
|
)
|
834
|
||||||||
|
Prepaid income taxes
|
577
|
(100
|
)
|
(518
|
)
|
|||||||
|
Other current and long term assets
|
(333
|
)
|
(161
|
)
|
(137
|
)
|
||||||
|
Accounts payable
|
(517
|
)
|
(332
|
)
|
(988
|
)
|
||||||
|
Accrued liabilities and other liabilities
|
415
|
(186
|
)
|
1,053
|
||||||||
|
Net cash provided by operating activities
|
4,846
|
5,109
|
5,918
|
|||||||||
|
|
||||||||||||
|
Cash flows from investing activities:
|
||||||||||||
|
Capital expenditures
|
(1,062
|
)
|
(1,007
|
)
|
(835
|
)
|
||||||
|
Additions to capitalized software
|
(304
|
)
|
(466
|
)
|
(150
|
)
|
||||||
|
Issuance of note receivable
|
(1,000,000
|
)
|
–
|
–
|
||||||||
|
Net cash used in investing activities
|
(2,366
|
)
|
(1,473
|
)
|
(985
|
)
|
||||||
|
|
||||||||||||
|
Cash flows from financing activities:
|
||||||||||||
|
Proceeds from stock option exercises
|
–
|
416
|
1,043
|
|||||||||
|
Purchases of common stock for treasury
|
–
|
(2,000
|
)
|
(358
|
)
|
|||||||
|
Payment of dividends on common stock
|
(2,683
|
)
|
(2,667
|
)
|
(2,581
|
)
|
||||||
|
Withholding taxes paid on stock issuances
|
(214
|
)
|
(265
|
)
|
(23
|
)
|
||||||
|
Net cash used in financing activities
|
(2,897
|
)
|
(4,516
|
)
|
(1,919
|
)
|
||||||
|
|
||||||||||||
|
Effect of exchange rate changes on cash and cash equivalents
|
(71
|
)
|
64
|
(10
|
)
|
|||||||
|
|
||||||||||||
|
(Decrease) increase in cash and cash equivalents
|
(488
|
)
|
(816
|
)
|
3,004
|
|||||||
|
Cash and cash equivalents, beginning of period
|
4,691
|
5,507
|
2,503
|
|||||||||
|
Cash and cash equivalents, end of period
|
$
|
4,203
|
$
|
4,691
|
$
|
5,507
|
||||||
|
|
||||||||||||
|
Supplemental cash flow information:
|
||||||||||||
|
Interest paid
|
$
|
30
|
$
|
25
|
$
|
30
|
||||||
|
Income taxes paid
|
65
|
1,249
|
2,991
|
|||||||||
|
Non-cash capital expenditure items
|
17
|
21
|
44
|
|||||||||
See accompanying notes to Consolidated Financial Statements.
1. Description of business
TransAct Technologies Incorporated (together with its subsidiaries, “TransAct,” the “Company,” "we,", "us,",
"our"), which has its headquarters in Hamden, Connecticut and its primary operating facility in Ithaca, New York, operates in one operating segment: software-driven technology and printing solutions for high growth markets including food service
technology, casino and gaming, lottery, POS automation and banking, and oil and gas markets. Our solutions are designed from the ground up based on market and customer requirements and are sold under the BOHA!TM, AccuDate™ Ithaca®, Epic,
EPICENTRALTM and Printrex® product brands. We sell our products to original equipment manufacturers, value-added resellers, select distributors, and directly to end-users. Our product distribution spans across the Americas, Europe, the
Middle East, Africa, Asia, Australia, the Caribbean Islands and the South Pacific. TransAct also provides world-class service, spare parts, accessories and printing supplies to its growing worldwide installed base of products. We also generate
revenue from the after-market side of the business, providing printer and terminal service, supplies and spare parts in addition to revenue from our two software solutions; (i)the EPICENTRALTM Print System (“EPICENTRALTM”), that
enables casino operators to create promotional coupons and marketing messages and print them in real-time at the slot machine and (ii) our newly-launched line of BOHA! software applications used to automate the back-of-house operations of restaurants
and other food service establishments.
2. Summary of significant accounting policies
Principles of
consolidation: The accompanying Consolidated Financial Statements include the accounts of TransAct and its wholly-owned subsidiaries, which require consolidation, after the elimination of intercompany accounts, transactions and unrealized
profit.
Use of estimates: The preparations of consolidated financial statements in conformity with accounting principles generally accepted in the United States of America
(“GAAP”) requires management to make estimates and assumptions that affect the reported amounts of assets, liabilities, revenue and expenses, and disclosure of contingent assets and liabilities as of the date of the Consolidated Financial Statements
and the reported amounts of sales and expenses during the reporting period. Actual results could differ from those estimates.
Segment reporting: We apply the provisions of the Financial Accounting Standards Board (“FASB”) Accounting Standards Codification (“ASC”) 280, “Segment Reporting.” We
view our operations and manage our business as one segment: the design, development and marketing of software-driven technology and printing solutions and providing printer and terminal related software, services, supplies and spare parts. Factors
used to identify TransAct’s single operating segment include the organizational structure of the Company and the financial information available for evaluation by the chief operating decision-maker in making decisions about how to allocate resources
and assess performance.
Cash and cash
equivalents: We consider all highly liquid investments with a maturity date of three months or less at date of purchase to be cash
equivalents.
Allowance for
doubtful accounts: We establish an allowance for doubtful accounts to ensure trade receivables are valued appropriately. We maintain an
allowance for doubtful accounts based on a variety of factors, including the length of time receivables are past due, significant one-time events and historical experience. We record a specific allowance for individual accounts when we become aware
of a customer’s inability to meet its financial obligations, such as in the case of bankruptcy filings or deterioration in the customer’s operating results or financial position. If circumstances related to customers change, we would further adjust
estimates of the recoverability of receivables.
The following table summarizes the activity recorded in the valuation account for accounts receivable:
|
|
Year Ended December 31,
|
|||||||||||
|
(In thousands)
|
2019
|
2018
|
2017
|
|||||||||
|
Balance, beginning of period
|
$
|
205
|
$
|
100
|
$
|
50
|
||||||
|
Additions charged to costs and expenses
|
39
|
105
|
50
|
|||||||||
|
Deductions
|
(23
|
)
|
-
|
-
|
||||||||
|
Balance, end of period
|
$
|
221
|
$
|
205
|
$
|
100
|
||||||
Inventories: Inventories
are stated at the lower of cost (principally standard cost, which approximates actual cost on a first-in, first-out basis) or net realizable value. We review net realizable value based on estimated selling prices in the ordinary course of business
less estimated costs of completions, disposal and transportation, historical usage and estimates of future demand. Based on these reviews, inventory write-downs are recorded, as necessary, to reflect estimated obsolescence, excess quantities and net
realizable value.
Fixed assets: Fixed
assets are stated at cost. Depreciation is recorded using the straight-line method over the estimated useful lives. The estimated useful life of tooling is five years; machinery and equipment is ten years; furniture and office equipment is five
years to ten years; and computer software and equipment is three years to seven years. Leasehold improvements are amortized over the shorter of the term of the lease or the useful life of the asset. Costs related to repairs and maintenance are
expensed as incurred. The costs of sold or retired assets are removed from the related asset and accumulated depreciation accounts and any gain or loss is recognized. Depreciation expense was $1.1 million, $0.9 million and $0.8 million in 2019,
2018, and 2017, respectively.
Leases: ASU 2016-02, “Leases”, which was codified in, and is referred to
in this Annual Report as, ASC 842, became effective for reporting periods beginning after December 15, 2018. The adoption required a modified retrospective transition approach, applying the new standard to all leases existing at the date of initial
application. An entity may choose to use either (1) its effective date or (2) the beginning of the earliest comparative period presented in the financial statements as its date of initial application. The Company has elected to adopt the standard
using the effective date, January 1, 2019, as its date of initial application. Consequently, financial information for prior periods will not be updated, and the disclosures required under the new standard will not be provided for dates and periods
before January 1, 2019.
F-9
The new standard requires lessees to apply a dual approach, classifying leases as either finance or operating leases based on the
principle of whether or not the lease is effectively a financed purchase by the lessee. This classification will determine whether lease expense is recognized based on an effective interest method or on a straight-line basis over the term of the
lease, respectively. A lessee is also required to record a right-of-use asset and a lease liability for all leases with a term of greater than 12 months regardless of their classification. Leases with a term of 12 months or less will be accounted for
based on existing guidance for operating leases. If risks and rewards are conveyed without the transfer of control, the lease is treated as financing. If the lessor does not convey risks and rewards or control, the lease is treated as operating.
We have elected certain practical expedients available under ASC 842 upon adoption. We have applied the practical expedient which
allows prospective transition to ASC 842 on January 1, 2019. Under this transition practical expedient, we did not reassess lease classification, embedded leases or initial direct costs. We have applied the practical expedient for short-term leases.
We have lease agreements that include lease and non-lease components, and we have not elected the practical expedients to combine these components for any of our leases. The adoption of ASC 842 had no effect on our Consolidated Statement of Income
or Consolidated Statement of Cash Flows. Upon adoption of ASC 842, we recorded a $3.7 million right-of-use asset and a $3.9 million lease liability. The adoption of the new standard had no impact on retained earnings.
We enter into lease agreements for the use of real estate space and certain other equipment under operating leases and we have no financing leases. We determine if an arrangement contains a lease at inception. Our leases are included in Right of use assets and Lease
liabilities in our Condensed Consolidated Balance Sheet.
Right of use assets represent our right to use an underlying asset for the lease term and lease liabilities represent our obligation
to make lease payments arising from the lease. Lease right of use assets and liabilities are recognized at the commencement date of the lease based on the present value of lease payments over the lease term. As most of our leases do not provide an
implicit rate, the Company determines its incremental borrowing rate by using the rate of interest that the Company would have to pay to borrow on a collateralized basis over a similar term, an amount equal to the lease payments in a similar economic
environment. Our lease right of use assets exclude lease incentives. Our leases have remaining lease terms of one year to eight years, some of which include options to extend. The majority of our leases with options to extend provide for extensions
of up to five years with the ability to terminate the lease within one year. The exercise of lease renewal options is at our sole discretion and our lease right of use assets and liabilities reflect only the options we are reasonably certain that we
will exercise. Lease expense is recognized on a straight-line basis over the lease term.
Goodwill and
Intangible assets: We acquire businesses in purchase transactions that result in the recognition of goodwill and intangible assets. The
determination of the value of intangible assets requires management to make estimates and assumptions. In accordance with ASC 350-20 “Goodwill”, acquired goodwill is not amortized but is subject to impairment testing at least annually and when an
event occurs or circumstances change, that indicate it is more likely than not an impairment exists. Factors considered that may trigger an impairment review of either acquired goodwill or intangible assets are: significant underperformance relative
to expected historical or projected future operating results; significant changes in the manner of use of acquired assets or the strategy for the overall business; significant negative industry or economic trends; and significant decline in market
capitalization relative to net book value. Finite lived intangible assets are amortized and are tested for impairment when appropriate. We have determined that no goodwill or intangible asset impairment has occurred and the fair value of goodwill was
substantially higher than our carrying value based on our assessment as of December 31, 2019 when the impairment review is performed.
Revenue recognition: We account for revenue in accordance with ASC Topic 606: Revenue from Contracts with Customers. We adopted ASC 606 effective January 1, 2018 and elected the modified retrospective approach. The results for
periods before 2018 were not adjusted for the new standard and there was no cumulative effect for the change in accounting at the date of adoption. In accordance with ASC 606, a performance obligation is a promise in a contract with a customer to
transfer a distinct good or service to the customer. Some of our contracts with customers contain a single performance obligation, while other contracts contain multiple performance obligations (most commonly when contracts include a hardware
product, software and extended warranties). A contract's transaction price is allocated to each distinct performance obligation and recognized as revenue when, or as, the performance obligation is satisfied.
The transaction price is determined based on the consideration to which the Company will be entitled in exchange for transferring
services to the customer. To the extent the transaction price includes variable consideration, such as price protection, reserves for returns and other allowances, the Company estimates the amount of variable consideration that should be included in
the transaction price utilizing either the “expected value” method or the “most likely amount” method depending on the nature of the variable consideration. Variable consideration is included in the transaction price if, in the Company’s judgment,
it is probable that a significant future reversal of cumulative revenue under the contract will not occur.
For a majority of our revenue, which consists of printers, terminals, consumables, and replacement parts, the Company recognizes
revenue as of a point of time. The transaction price is recognized upon shipment of the order when control of the goods is transferred to the customer and at the time the performance obligation is fulfilled. We also sell a software solution in our
casino and gaming market, EPICENTRAL™, that enables casino operators to create promotional coupons and marketing messages and to print them in real-time at the slot machine. EPICENTRALTM is primarily comprised of both a software
component, which is licensed to the customer, and a hardware component. EPICENTRAL™ software and hardware are integrated to deliver the system's full functionality. The transaction prices from EPICENTRAL™ software license and hardware are
recognized upon installation and formal acceptance by the customer when control of the license is transferred to the customer. For out-of-warranty repairs, the transaction price is recognized after the repair work is completed and the printer or
terminal is returned to the customer, as control of the product is transferred to the customer and our performance obligation is completed.
F-10
Performance obligations are satisfied over time if the customer receives the benefits as we perform work, if the customer controls
the asset as it is being produced, or if the product being produced for the customer has no alternative use and we have a contractual right to payment. For our separately priced extended warranty, BOHA! cloud-based software applications, technical
support for our food service technology terminals and maintenance agreements (including free one-year maintenance received by customers upon completion of EPICENTRAL™ installation) revenue is recognized over time as the customer receives the
benefit. The transaction price from the maintenance services is recognized ratably over time, using output methods, as control of the services is transferred to the customer. Our cloud-based BOHA! software allows customers to use hosted software
over the contract period without taking possession of the software and are provided on a subscription basis and is recognized ratably over the contract period. For extended warranties, the transaction price is recognized ratably over the warranty
period, using output methods, as control of the services is transferred to the customer.
When there is more than one performance obligation in a customer arrangement, the Company typically uses the “standalone selling
price” method to determine the transaction price to allocate to each performance obligation. The Company sells the performance obligations separately and has established standalone selling prices for its products and services. In the case of an
overall price discount, the discount is applied to each performance obligation proportionately based on standalone selling price. To determine the standalone selling price for initial EPICENTRAL™ installations, the Company uses the adjusted market
assessment approach.
For contracts with terms of less than 12 months, the Company expenses sales commissions as they are incurred,
since the expected amortization period of the cost to obtain a contract is less than 12 months. Prior to the adoption of ASC 606 in 2018, cost to obtain a contract were expensed as incurred regardless of the length of contract.
Disaggregation of revenue
The following table disaggregates our revenue by market-type, as we believe it best depicts how the nature, amount, timing and uncertainty of our revenue
and cash flows are affected by economic factors. Sales and usage-based taxes are excluded from revenues.
|
Year Ended
December 31, 2019
|
||||||||||||
|
United States
|
International
|
Total
|
||||||||||
|
(In thousands)
|
||||||||||||
|
Food Service Technology
|
$
|
5,522
|
$
|
582
|
$
|
6,104
|
||||||
|
POS Automation and Banking
|
5,714
|
44
|
5,758
|
|||||||||
|
Casino and Gaming
|
13,076
|
8,453
|
21,529
|
|||||||||
|
Lottery
|
1,290
|
1
|
1,291
|
|||||||||
|
Printrex
|
961
|
205
|
1,166
|
|||||||||
|
TransAct Services Group
|
8,769
|
1,131
|
9,900
|
|||||||||
|
Total net sales
|
$
|
35,332
|
$
|
10,416
|
$
|
45,748
|
||||||
|
Year Ended
December 31, 2018
|
||||||||||||
|
United States
|
International
|
Total
|
||||||||||
|
(In thousands)
|
||||||||||||
|
Food Service Technology
|
$
|
4,640
|
$
|
446
|
$
|
5,086
|
||||||
|
POS Automation and Banking
|
7,122
|
151
|
7,273
|
|||||||||
|
Casino and Gaming
|
17,518
|
9,075
|
26,593
|
|||||||||
|
Lottery
|
3,046
|
47
|
3,093
|
|||||||||
|
Printrex
|
1,028
|
269
|
1,297
|
|||||||||
|
TransAct Services Group
|
10,164
|
1,081
|
11,245
|
|||||||||
|
Total net sales
|
$
|
43,518
|
$
|
11,069
|
$
|
54,587
|
||||||
|
Year Ended
December 31, 2017
|
||||||||||||
|
United States
|
International
|
Total
|
||||||||||
|
(In thousands)
|
||||||||||||
|
Food Service Technology
|
$
|
4,488
|
$
|
374
|
$
|
4,862
|
||||||
|
POS Automation and Banking
|
7,596
|
309
|
7,905
|
|||||||||
|
Casino and Gaming
|
13,608
|
5,007
|
18,615
|
|||||||||
|
Lottery
|
8,626
|
1,179
|
9,805
|
|||||||||
|
Printrex
|
849
|
203
|
1,052
|
|||||||||
|
TransAct Services Group
|
13,553
|
519
|
14,072
|
|||||||||
|
Total net sales
|
$
|
48,720
|
$
|
7,591
|
$
|
56,311
|
||||||
F-11
Contract balances
Our contract liabilities consist of customer pre-payments and deferred revenue. Customer prepayments are reported as “Accrued
Liabilities” in current liabilities in the Condensed Consolidated Balance Sheets and represent customer payments made in advance of performance obligations in instances where credit has not been extended and is recognized as revenue when the
performance obligation is complete. Deferred revenue is reported separately in current liabilities and non-current liabilities and consists of our extended warranty contracts, technical support for our food service technology terminals, EPICENTRAL™
maintenance contracts and testing service contracts and prepaid software subscriptions for our BOHA! software applications, and is recognized as revenue as (or when) we perform under the contract. The increase in current and non-current deferred
revenue is primarily due to the sale of BOHA! software subscriptions, extended warranties and technical support for our food service technology terminals. We do not have any contract asset balances as of December 31, 2019 or 2018. During the year
ended December 31, 2019, we recognized revenue of $0.4 million related to our contract liabilities as of December 31, 2018. Total contract liabilities consist of the following:
|
December 31, 2019
|
December 31, 2018
|
|||||||
|
(In thousands)
|
||||||||
|
Customer pre-payments
|
$
|
232
|
$
|
50
|
||||
|
Deferred revenue, current
|
700
|
384
|
||||||
|
Deferred revenue, non-current
|
219
|
265
|
||||||
|
Total contract liabilities
|
$
|
1,151
|
$
|
699
|
||||
Remaining performance obligations
Remaining performance obligations represent the transaction price of firm orders for which a good or service has not been delivered
to our customer. As of December 31, 2019, the aggregate amount of the transaction price allocated to remaining performance obligations was $5.8 million. The Company expects to recognize revenue on $5.5 million of our remaining performance
obligations within the next 12 months, $0.2 million within the next 24 months and the balance of these remaining performance obligations recognized within the next 36 months.
Concentration of
credit risk: Financial instruments that potentially expose us to concentrations of credit risk are limited to cash and cash equivalents held by our banks in excess of insured limits and accounts receivable.
Accounts receivable from customers representing 10% or more of total accounts receivable were as follows:
|
|
December 31,
|
|||||||
|
|
2019
|
2018
|
||||||
|
International Gaming Technology ("IGT")
|
15
|
%
|
21
|
%
|
||||
|
Bally Technologies
|
10
|
%
|
6
|
%
|
||||
Sales to customers representing 10% or more of total net sales were as follows:
|
|
Year Ended December 31,
|
|||||||||||
|
|
2019
|
2018
|
2017
|
|||||||||
|
IGT
|
14
|
%
|
18
|
%
|
35
|
%
|
||||||
Warranty: We
generally warrant our products for up to 24 months and record the estimated cost of such product warranties at the time the sale is recorded. Estimated warranty costs are based upon actual past experience of product repairs and the related estimated
cost of labor and material to make the necessary repairs.
The following table summarizes the activity recorded in the accrued product warranty liability:
|
|
Year Ended December 31,
|
|||||||||||
|
(In thousands)
|
2019
|
2018
|
2017
|
|||||||||
|
Balance, beginning of period
|
$
|
273
|
$
|
267
|
$
|
267
|
||||||
|
Warranties issued
|
181
|
269
|
259
|
|||||||||
|
Warranty settlements
|
(239
|
)
|
(263
|
)
|
(259
|
)
|
||||||
|
Balance, end of period
|
$
|
215
|
$
|
273
|
$
|
267
|
||||||
$174 thousand and $192 thousand of the accrued product warranty liability were classified as current in Accrued liabilities at
December 31, 2019 and 2018, respectively. The remaining $41 thousand and $81 thousand of the accrued product warranty liability as of December 31, 2019 and 2018, respectively, is classified as long-term in Other liabilities.
Engineering,
design and product development: Engineering, design and product development expenses include expenses incurred in connection with specialized engineering and design to introduce new products and to customize existing products, and are
expensed as a component of operating expenses as incurred. We recorded $4.4 million, $4.6 million and $4.3 million of research and development expenses in 2019, 2018, and 2017, respectively.
Costs incurred in the engineering, design and product development of a computer software product are charged to expense until
technological feasibility has been established, at which point all material software costs are capitalized within Intangible assets in our Consolidated Balance Sheet until the product is available for general release to customers. While judgment is
required in determining when technological feasibility of a product is established, we have determined that it is reached after all high-risk development issues have been documented in a formal detailed plan design. The amortization of these costs
have been included in cost of sales over the estimated life of the product. During 2019 and 2018, we contracted several third-parties to develop software for our food service technology products. Unamortized development costs for such software were
$704 thousand as of December 31, 2019. The total amount charged to cost of sales for capitalized software development costs was $186 thousand, $30 thousand and $2 thousand in 2019, 2018, and 2017, respectively.
Advertising: Advertising
costs are expensed as incurred. Advertising expenses, which are included in selling and marketing expense on the accompanying Consolidated Statements of Income, for 2019, 2018, and 2017 totaled $1.4 million, $1.0 million and $1.0 million,
respectively. These expenses include items such as consulting and professional services, tradeshows, and print advertising.
F-12
Income taxes: The
income tax amounts reflected in the accompanying Consolidated Financial Statements are accounted for under the liability method in accordance with ASC 740, “Income Taxes” (“ASC 740”). Deferred tax assets and liabilities are recognized for the
estimated future tax consequences attributable to differences between the financial statement carrying amounts of existing assets and liabilities and their respective tax bases and operating loss and tax credit carryforwards. Deferred tax assets and
liabilities are measured using enacted tax rates in effect for the year in which those temporary differences are expected to be recovered or settled. We assess the likelihood that net deferred tax assets will be realized from future taxable income,
and to the extent that we believe that realization is not likely, we establish a valuation allowance. In accordance with ASC 740, we identified, evaluated and measured the amount of benefits to be recognized for our tax return positions. See Note
10 for information regarding our accounting for income taxes and additional provision items recorded in regard to the Tax Cuts and Job Act.
Foreign currency
translation: The financial position and results of operations of our foreign subsidiary in the UK are measured using local currency as the functional currency. Assets and liabilities of such subsidiary have been translated into U.S.
dollars at the year-end exchange rate, related sales and expenses have been translated at the exchange rate as of the date the transaction was recognized, and shareholders’ equity has been translated at historical exchange rates. The resulting
translation gains or losses, net of tax, are recorded in shareholders’ equity as a cumulative translation adjustment, which is a component of accumulated other comprehensive income. Foreign currency transaction gains and losses, including those
related to intercompany balances, are recognized in Other, net on the Consolidated Statements of Income.
Share-based
payments: At December 31, 2019, we have share-based employee compensation plans, which are described more fully in Note 9 - Stock
incentive plans. We account for those plans under the recognition and measurement principles of ASC 718, “Compensation – Stock Compensation” (“ASC 718”). Share-based compensation expense is measured at the grant date, based on the estimated fair
value of the award, and is recognized as expense over the employee’s requisite service period.
We use the Black-Scholes option-pricing model to calculate the fair value of share based awards. The key assumptions for this
valuation method include the expected term of the option, stock price volatility, risk-free interest rate, dividend yield, market price of our underlying stock and exercise price. Many of these assumptions are judgmental and highly sensitive in the
determination of compensation expense. Beginning in the first quarter of 2017, we recognize forfeitures as they occur.
In May 2017, the FASB issued ASU No. 2017-09, "Compensation-Stock Compensation: Scope of modification accounting". ASU 2017-09
provides guidance about which changes to the terms or conditions of a share-based payment award require an entity to apply modification accounting in ASC 718. ASU No. 2017-09 was effective for fiscal years beginning after December 15, 2017. The
amendments are applied prospectively to an award modified on or after the adoption date. We adopted this guidance in the first quarter of 2018 and the adoption did not result in a change to our financial statements.
Net income and
loss per share: We report net income or loss per share in accordance with ASC 260, “Earnings per Share (EPS).” Under this guidance, basic EPS, which excludes dilution, is computed by dividing income or loss available to common shareholders
by the weighted average number of common shares outstanding for the period. Diluted EPS reflects the potential dilution that could occur if securities or other contracts to issue common stock were exercised or converted into common stock. Diluted
EPS includes in-the-money stock options using the treasury stock method. During a loss period, the assumed exercise of in-the-money stock options has an anti-dilutive effect, and therefore, these instruments are excluded from the computation of
dilutive EPS. See Note 11 - Earnings per share.
3. Note receivable
The note receivable balance relates to a loan given to a third party and repayment is expected to occur in 12 months or less of
original issuance. The note receivable has an interest rate of 4.5% and is due in April 2020. Notes receivable are stated at unpaid balances and interest income is recognized on the accrual method. As of December 31, 2019, we have no allowances
for loan losses, unamortized deferred loan fees or unearned discounts.
4. Inventories, net
The components of inventories, net are:
|
|
December 31,
|
|||||||
|
(In thousands)
|
2019
|
2018
|
||||||
|
Raw materials and purchased component parts
|
$
|
7,724
|
$
|
6,593
|
||||
|
Work-in-process
|
–
|
29
|
||||||
|
Finished goods
|
4,375
|
6,213
|
||||||
|
|
$
|
12,099
|
$
|
12,835
|
||||
5. Fixed assets
The components of fixed assets, net are:
|
|
December 31,
|
|||||||
|
(In thousands)
|
2019
|
2018
|
||||||
|
Tooling, machinery and equipment
|
$
|
9,175
|
$
|
11,177
|
||||
|
Furniture and office equipment
|
1,694
|
1,690
|
||||||
|
Computer software and equipment
|
7,062
|
6,930
|
||||||
|
Leasehold improvements
|
2,696
|
2,666
|
||||||
|
|
20,627
|
22,463
|
||||||
|
Less: Accumulated depreciation and amortization
|
(19,010
|
)
|
(20,518
|
)
|
||||
|
|
1,617
|
1,945
|
||||||
|
Construction in-process
|
627
|
327
|
||||||
|
|
$
|
2,244
|
$
|
2,272
|
||||
F-13
6. Intangible assets
Identifiable intangible assets are recorded in Intangible assets in the accompanying Consolidated Balance Sheets and are comprised of
the following:
|
|
December 31,
|
|||||||||||||||
|
|
2019
|
2018
|
||||||||||||||
|
(In thousands)
|
Gross
Amount
|
Accumulated
Amortization
|
Gross
Amount
|
Accumulated
Amortization
|
||||||||||||
|
Purchased technology
|
$
|
2,526
|
$
|
(1,792
|
)
|
$
|
2,221
|
$
|
(1,558
|
)
|
||||||
|
Customer relationships
|
1,300
|
(1,300
|
)
|
1,300
|
(1,300
|
)
|
||||||||||
|
Trademark
|
480
|
(402
|
)
|
480
|
(354
|
)
|
||||||||||
|
Covenant not to compete
|
146
|
(146
|
)
|
146
|
(146
|
)
|
||||||||||
|
Patents
|
56
|
(51
|
)
|
57
|
(49
|
)
|
||||||||||
|
Other
|
80
|
(80
|
)
|
80
|
(80
|
)
|
||||||||||
|
Total
|
$
|
4,588
|
$
|
(3,771
|
)
|
$
|
4,284
|
$
|
(3,487
|
)
|
||||||
Amortization expense was $284 thousand, $128 thousand and $237 thousand in 2019, 2018 and 2017, respectively. Amortization expense
for each of the next five years ending December 31 is expected to be as follows: $237 thousand in 2020; $185 thousand in 2021; $154 thousand in 2022; $154 thousand in 2023; $87 thousand in 2024; and none thereafter.
7. Accrued liabilities
The components of accrued liabilities are:
|
|
December 31,
|
|||||||
|
(In thousands)
|
2019
|
2018
|
||||||
|
Salaries and compensation related
|
$
|
1,541
|
$
|
1,817
|
||||
|
Warranty
|
174
|
192
|
||||||
|
Professional and consulting
|
465
|
231
|
||||||
|
Other
|
861
|
525
|
||||||
|
|
$
|
3,041
|
$
|
2,765
|
||||
8. Retirement savings plan
We maintain a 401(k) plan under which all full-time employees are eligible to participate at the beginning of each month immediately
following their date of hire. We match employees’ contributions at a rate of 50% of employees’ contributions up to the first 6% of the employees’ compensation contributed to the 401(k) plan. Our matching contributions were $305 thousand, $237
thousand and $264 thousand in 2019, 2018, and 2017, respectively.
9. Borrowings
During 2019, we maintained a credit facility (the “TD Bank Credit Facility”) with TD Bank N.A. (“TD Bank) which provided for a $20
million revolving credit line. On November 21, 2017, we signed an amendment to the TD Bank Credit Facility extending the term through November 28, 2022. Borrowings under the revolving credit line bear a floating rate of interest at the prime rate
minus one percent and are secured by a lien on all our assets. We also pay a fee of 0.125% on unused borrowings under the revolving credit line. The amendment increased the amount of revolving credit loans we may use to fund future cash dividend
payments or treasury share buybacks to $12.5 million from $10 million.
The TD Bank Credit Facility imposes certain quarterly financial covenants on us and restricts, among other things, our ability to
incur additional indebtedness and the creation of other liens. On November 6, 2019, we amended our TD Credit Facility to change the definition of interest expense to exclude fees paid on unused borrowings under the revolving credit line which is used
to calculate total debt service in the operating cash flow to total debt service financial covenant. We were in compliance with all financial covenants of the TD Bank Credit Facility at December 31, 2019.
As of December 31, 2019, we had no outstanding borrowings under the TD Bank Credit facility.
On March 13, 2020, we terminated our TD Bank Credit Facility and signed a new credit facility with Siena Lending Group LLC. See Note
16 – Subsequent Event.
F-14
10. Stock incentive plans
Stock incentive
plans. We currently have two primary stock incentive plans: the 2005 Equity Incentive Plan and 2014 Equity Incentive Plan, which provide
for awards to executives, key employees, directors and consultants. The plans generally provide for awards in the form of: (i) incentive stock options, (ii) non-qualified stock options, (iii) restricted stock, (iv) restricted stock units (which may
include performance-based vesting), (v) stock appreciation rights or (vi) limited stock appreciation rights. Awards granted under these plans have exercise prices equal to 100% of the fair market value of the common stock at the date of grant.
Awards granted have a ten years-year term and generally vest over a two year- to five year period, unless automatically accelerated for certain defined events. As of May 2014, no new awards were made under the 2005 Equity Incentive Plan. Under our
2014 Equity Incentive Plan, we are authorized to grant awards of up to 1,400,000 shares of TransAct common stock. At December 31, 2019, 332,541 shares of common stock remained available for issuance under the 2014 Equity Incentive Plan.
Under the assumptions indicated below, the weighted-average per share fair value of stock option grants for 2019, 2018, and 2017 was
$3.01, $4.38 and $1.95, respectively. We also issued restricted stock units for certain executives and directors that vest over a specified period of time, and in some instances require achieving certain performance metrics. The weighted-average
per share fair value of these restricted stock units was $10.46, $12.91 and $7.53 in 2019, 2018 and 2017 respectively.
The table below indicates the key assumptions used in the option valuation calculations for options granted in 2019, 2018, and 2017
and a discussion of our methodology for developing each of the assumptions used in the valuation model:
|
|
Year Ended December 31,
|
|||||||||||
|
|
2019
|
2018
|
2017
|
|||||||||
|
Expected option term (in years)
|
6.8
|
6.8
|
6.8
|
|||||||||
|
Expected volatility
|
38.8
|
%
|
38.0
|
%
|
36.2
|
%
|
||||||
|
Risk-free interest rate
|
2.6
|
%
|
2.7
|
%
|
2.1
|
%
|
||||||
|
Dividend yield
|
3.5
|
%
|
2.6
|
%
|
4.3
|
%
|
||||||
Expected Option
Term - This is the weighted average period of time over which the options granted are expected to remain outstanding giving consideration to our historical exercise patterns. Options granted have a maximum term of ten years and an increase
in the expected term will increase compensation expense.
Expected
Volatility – The stock volatility for each grant is measured using the weighted average of historical daily price changes of our common stock over the most recent period approximately equal to the expected option term of the grant. An
increase in the expected volatility factor will increase compensation expense.
Risk-Free
Interest Rate - This is the U.S. Treasury rate in effect at the time of grant having a term approximately equal to the expected term of the option. An increase in the risk-free interest rate will increase compensation expense.
Dividend Yield
–The dividend yield is calculated by dividing the annual dividend declared per common share by the weighted average market value of our common stock on the date of grant. An increase in the dividend yield will decrease compensation expense.
For 2019, 2018, and 2017, we recorded $692 thousand, $629 thousand, and $609 thousand of share-based compensation expense,
respectively, included primarily in general and administrative expense in our Consolidated Statements of Income. We also recorded income tax benefits of $152 thousand, $138 thousand, and $134 thousand in 2019, 2018, and 2017 respectively, related to
such share-based compensation. At December 31, 2019, these benefits are recorded as a deferred tax asset in the Consolidated Balance Sheets.
Equity award activity in the 2005 Equity Incentive Plan and 2014 Equity Incentive Plan is summarized below:
|
Stock Options
|
Restricted Stock Units
|
|||||||||||||||
|
|
Number of Shares
|
Average Price*
|
Number of Units
|
Average Price**
|
||||||||||||
|
Outstanding at December 31, 2018
|
1,004,293
|
$
|
9.00
|
98,600
|
$
|
9.82
|
||||||||||
|
Granted
|
180,675
|
10.31
|
58,050
|
10.44
|
||||||||||||
|
Exercised
|
–
|
–
|
(45,167
|
)
|
9.16
|
|||||||||||
|
Forfeited
|
(36,625
|
)
|
8.72
|
(20,908
|
)
|
12.12
|
||||||||||
|
Expired
|
(5,875
|
)
|
6.05
|
–
|
–
|
|||||||||||
|
Outstanding at December 31, 2019
|
1,142,468
|
$
|
9.23
|
90,575
|
$
|
10.46
|
||||||||||
| * |
weighted average exercise price per share
|
| ** |
weighted-average grant stock price per share
|
The following summarizes information about equity awards outstanding that are vested and expect to vest and equity awards that are
exercisable at December 31, 2019:
|
Equity Awards Vested and Expected to Vest
|
Equity Awards That Are Exercisable
|
|||||||||||||||||||||||||||||||
|
Awards
|
Average Price*
|
Aggregate Intrinsic Value
|
Remaining Term**
|
Awards
|
Average Price*
|
Aggregate Intrinsic Value
|
Remaining Term**
|
|||||||||||||||||||||||||
|
Stock Options
|
1,142,468
|
$
|
9.23
|
$
|
2,441
|
5.7
|
730,500
|
$
|
8.62
|
$
|
1,888
|
4.1
|
||||||||||||||||||||
|
Restricted stock units
|
90,575
|
–
|
994
|
2.5
|
–
|
–
|
–
|
–
|
||||||||||||||||||||||||
| * |
weighted average exercise price per share
|
| ** |
weighted-average contractual remaining term in years
|
Shares that are issued upon exercise of employee stock awards are newly issued shares and not issued from treasury stock. As of
December 31, 2019, unrecognized compensation cost related to non-vested equity awards granted under our stock incentive plans is approximately $1.5 million, which is expected to be recognized over a weighted average period of 2.1 years.
F-15
The total fair value of awards vested during the years ended December 31, 2019, 2018, and 2017 was $1.6 million, $1.1 million, and
$1.1 million, respectively. The total intrinsic value (which is the amount by which the stock price exceeded the exercise price on the date of exercise) of stock options exercised during the years ended December 31, 2018, and 2017 was $280 thousand
and $958 thousand, respectively. No stock options were exercised during the year ended December 31, 2019. Cash received from option exercises was $0.4 million and $1 million for 2018 and 2017, respectively. We recorded a realized tax benefit in
2018 and 2017 from equity-based awards of $17 thousand and $150 thousand, respectively, related to options exercised. Upon adoption of ASU 2016-09 in 2017 tax benefits realized on stock options exercises are included in income tax expense and are no
longer included as a component of cash flows.
11. Income taxes
The components of the income tax provision are as follows:
|
|
Year Ended December 31,
|
|||||||||||
|
(In thousands)
|
2019
|
2018
|
2017
|
|||||||||
|
Current:
|
||||||||||||
|
Federal
|
$
|
58
|
$
|
1,049
|
$
|
2,379
|
||||||
|
State
|
51
|
85
|
114
|
|||||||||
|
Foreign
|
(58)
|
13
|
(49
|
)
|
||||||||
|
|
51
|
1,147
|
2,444
|
|||||||||
|
Deferred:
|
||||||||||||
|
Federal
|
(205
|
)
|
(117)
|
1,097
|
||||||||
|
State
|
5
|
10
|
20
|
|||||||||
|
|
(200
|
)
|
(107
|
)
|
1,117
|
|||||||
|
Income tax provision (benefit)
|
$
|
(149
|
)
|
$
|
1,040
|
$
|
3,561
|
|||||
On December 22, 2017, the United States enacted significant changes to U.S. tax law following the passage and signing of the Tax
Reform Act. The legislation significantly changes U.S. tax law by, among other things, lowering corporate income tax rates, implementing a territorial tax system and imposing a one-time repatriation tax on undistributed foreign earnings. The Tax
Reform Act permanently reduces the U.S. corporate income tax rate from a maximum of 35% to a flat 21% rate, effective January 1, 2018. Income tax effects resulting from changes in tax laws are accounted for by the Company in accordance with
authoritative guidance, which requires that these tax effects be recognized in the period in which the law is enacted.
The Company uses the asset and liability method of accounting for income taxes. Under this method, deferred tax assets and
liabilities are recognized for future tax consequences attributable to differences between the financial statement carrying amounts of existing assets and liabilities and their respective tax basis. Deferred tax assets and liabilities are measured
using enacted tax rates expected to apply to taxable income in the years in which those temporary differences are expected to reverse. As a result of the reduction of TransAct's U.S. corporate income tax rate from 34% to 21% under the Tax Reform Act,
the Company revalued its ending net deferred tax assets at December 31, 2017 and recognized a provisional $1.3 million charge to income tax expense in the Company's consolidated statement of income for the year ended December 31, 2017.
The Tax Reform Act also provided for a one-time deemed mandatory repatriation of post-1986 undistributed foreign subsidiary earnings
and profits ("E&P") through the year ended December 31, 2017. The Company had no undistributed foreign E&P subject to the one-time mandatory repatriation and, therefore, did not recognize any income tax expense related to undistributed
foreign subsidiary E&P for the year ended December 31, 2017.
While the Tax Reform Act provides for a territorial tax system, beginning in 2018, it includes two new U.S. tax base erosion
provisions, the global intangible low-taxed income ("GILTI") provisions and the base-erosion and anti-abuse tax ("BEAT") provisions. The GILTI provisions require the Company to include in its U.S. income tax return foreign subsidiary earnings in
excess of an allowable return on the foreign subsidiary's tangible assets. The BEAT provisions in the Tax Reform Act eliminate the deduction of certain base-erosion payments made to related foreign corporations, and impose a minimum tax if greater
than regular tax. The Company is not currently subject to these taxes and therefore has not included any tax impacts of GILTI or BEAT in its consolidated financial statements for the year ended December 31, 2019 or 2018.
At December 31, 2019, we have no federal or state net operating loss carryforwards, $111 thousand in R&D credit carryforwards,
and no state tax credit carryforwards. Foreign loss before taxes was $515 thousand, $286 thousand, and $563 thousand in 2019, 2018, and 2017, respectively.
F-16
Deferred income taxes arise from temporary differences between the tax basis of assets and liabilities and their reported amounts in
the Consolidated Financial Statements. Our deferred tax assets and liabilities were comprised of the following:
|
|
December 31,
|
|||||||
|
(In thousands)
|
2019
|
2018
|
||||||
|
Deferred tax assets:
|
||||||||
|
Foreign net operating losses
|
$
|
538
|
$
|
390
|
||||
|
Depreciation
|
165
|
71
|
||||||
|
Inventory reserves
|
916
|
879
|
||||||
|
Deferred revenue
|
58
|
16
|
||||||
|
Warranty reserve
|
47
|
60
|
||||||
|
Stock compensation expense
|
701
|
682
|
||||||
|
Other accrued compensation
|
226
|
233
|
||||||
|
R&D credit carryforward
|
111
|
–
|
||||||
|
Other liabilities and reserves
|
276
|
278
|
||||||
|
Gross deferred tax assets
|
3,038
|
2,609
|
||||||
|
Valuation allowance
|
(444
|
)
|
(390
|
)
|
||||
|
Net deferred tax assets
|
2,594
|
2,219
|
||||||
|
|
||||||||
|
Deferred tax liabilities:
|
||||||||
|
Other
|
29
|
21
|
||||||
|
Net deferred tax liabilities
|
29
|
21
|
||||||
|
Total net deferred tax assets
|
$
|
2,565
|
$
|
2,198
|
||||
As of December 31, 2019 a valuation allowance of $444 thousand has been established for foreign net operating loss carryforwards that
are not expected to be used. The following table summarizes the activity recorded in the valuation allowance on the deferred tax assets:
|
|
Year Ended December 31,
|
|||||||||||
|
(In thousands)
|
2019
|
2018
|
2017
|
|||||||||
|
Balance, beginning of period
|
$
|
390
|
$
|
328
|
$
|
423
|
||||||
|
Additions charged to income tax provision
|
54
|
62
|
67
|
|||||||||
|
Reductions credited to income tax provision
|
–
|
–
|
(162
|
)
|
||||||||
|
Balance, end of period
|
$
|
444
|
$
|
390
|
$
|
328
|
||||||
Differences between the U.S. statutory federal income tax rate and our effective income tax rate are analyzed below:
|
|
Year Ended December 31,
|
|||||||||||
|
|
2019
|
2018
|
2017
|
|||||||||
|
|
||||||||||||
|
Federal statutory tax rate
|
21.0
|
%
|
21.0
|
%
|
34.0
|
%
|
||||||
|
Valuation allowance and tax accruals
|
14.8
|
1.0
|
1.6
|
|||||||||
|
State income taxes, net of federal income taxes
|
12.0
|
1.2
|
1.3
|
|||||||||
|
Business meals and entertainment
|
5.4
|
0.4
|
0.4
|
|||||||||
|
Miscellaneous permanent items
|
1.4
|
0.3
|
(0.9
|
)
|
||||||||
|
Uncertain tax positions
|
1.0
|
–
|
(0.1
|
)
|
||||||||
|
Stock option cancellations
|
0.8
|
–
|
1.7
|
|||||||||
|
U.S. corporate tax rate change
|
–
|
–
|
19.4
|
|||||||||
|
Foreign-derived intangible income deduction
|
(5.4
|
)
|
(1.5
|
)
|
–
|
|||||||
|
Stock award excess tax benefit
|
(8.4
|
)
|
(1.5
|
)
|
(1.4
|
)
|
||||||
|
R&D credit
|
(83.2
|
)
|
(4.9
|
)
|
(3.3
|
)
|
||||||
|
Other
|
–
|
0.1
|
(0.1
|
)
|
||||||||
|
Effective tax rate
|
(40.6
|
%)
|
16.1
|
%
|
52.6
|
%
|
||||||
F-17
Our effective tax rates were -40.6%, 16.1%, and 52.6% for 2019, 2018, and 2017, respectively. We recorded a tax
benefit in 2019 due to the impact of R&D credits on a near break-even level of income before income tax.
We had $107 thousand and $104 thousand of total gross unrecognized tax benefits at December 31, 2019 and 2018, respectively that, if
recognized, would favorably affect the effective income tax rate in any future periods. We are not aware of any events that could occur within the next twelve months that could cause a significant change in the total amount of unrecognized tax
benefits. A tabular reconciliation of the gross amounts of unrecognized tax benefits at the beginning and end of the year is as follows:
|
December 31,
|
||||||||
|
(In thousands)
|
2019
|
2018
|
||||||
|
Unrecognized tax benefits as of January 1
|
$
|
104
|
$
|
104
|
||||
|
Tax positions taken during the current period
|
28
|
28
|
||||||
|
Lapse of statute of limitations
|
(25
|
)
|
(28
|
)
|
||||
|
Unrecognized tax benefits as of December 31
|
$
|
107
|
$
|
104
|
||||
We expect $27 thousand of the $107 thousand of unrecognized tax benefits will reverse in 2020 upon the expiration of the statute of
limitations.
We recognize interest and penalties related to uncertain tax positions in the income tax provision. We have accrued interest and
penalties related to uncertain tax positions of $18 thousand and $17 thousand as of December 31, 2019 and 2018, respectively.
We are subject to U.S. federal income tax as well as income tax of certain state and foreign jurisdictions. We have substantially
concluded all U.S. federal income tax, state and local, and foreign tax matters through 2015. However, our federal tax returns for the years 2016 through 2018 remain open to examination. Various state and foreign tax jurisdiction tax years remain
open to examination as well, though we believe that any additional assessment would be immaterial to the Consolidated Financial Statements.
12. Earnings per share
For 2019, 2018, and 2017, earnings per share was computed as follows (in thousands, except per share amounts):
|
|
Year Ended December 31,
|
|||||||||||
|
|
2019
|
2018
|
2017
|
|||||||||
|
Net income
|
$
|
516
|
$
|
5,426
|
$
|
3,211
|
||||||
|
|
||||||||||||
|
Shares:
|
||||||||||||
|
Basic: Weighted average common shares outstanding
|
7,466
|
7,444
|
7,423
|
|||||||||
|
Add: Dilutive effect of outstanding equity awards as determined by the treasury stock
method
|
211
|
315
|
169
|
|||||||||
|
Diluted: Weighted average common and common equivalent shares outstanding
|
7,677
|
7,759
|
7,592
|
|||||||||
|
|
||||||||||||
|
Net income per common share:
|
||||||||||||
|
Basic
|
$
|
0.07
|
$
|
0.73
|
$
|
0.43
|
||||||
|
Diluted
|
0.07
|
0.70
|
0.42
|
|||||||||
F-18
The computation of diluted earnings per share excludes the effect of the potential exercise of stock awards, including stock options,
restricted stock units and performance stock awards, when the average market price of the common stock is lower than the exercise price of the related stock award during the period. These outstanding stock awards are not included in the computation
of diluted earnings per share because the effect would be anti-dilutive. Anti-dilutive stock awards excluded from the computation of earnings per dilutive share were 447,000, 149,000 and 341,000, at December 31, 2019, 2018 and 2017 respectively.
13. Stock repurchase program
Prior to its expiration on December 31, 2019, we maintained a stock repurchase program (the "2018 Stock Repurchase Program") whereby
we were authorized to repurchase up to $5 million of our outstanding shares of common stock from time to time in the open market at prevailing market prices based on market conditions, share price and other factors. We use the cost method to account
for treasury stock purchases, under which the price paid for the stock is charged to the treasury stock account. Repurchases of our common stock are accounted for as of the settlement date. During 2019 we did not repurchase any shares of our common
stock. From the start of the 2018 Stock Repurchase Program on March 1, 2018 through December 31, 2018, we repurchased 156,410 shares of our common stock for approximately $2.0 million at an average price per share of $12.79.
In 2017, under a prior repurchase program that was in place from February 25, 2016 through December 31, 2017, we purchased 36,465
shares of our common stock for $0.4 million at an average price of $9.84 per share. From January 1, 2005 through December 31, 2019, we repurchased a total of 4,044,842 shares of common stock for $32.1 million, at an average price of $7.94 per share.
14. Geographic area information
Information regarding our operations by geographic area is contained in the following table. These amounts in the geographic area
table are based on the location of the customer and asset.
|
|
Year Ended December 31,
|
|||||||||||
|
(In thousands)
|
2019
|
2018
|
2017
|
|||||||||
|
Net sales:
|
||||||||||||
|
United States
|
$
|
35,332
|
$
|
43,518
|
$
|
48,720
|
||||||
|
International
|
10,416
|
11,069
|
7,591
|
|||||||||
|
Total
|
$
|
45,748
|
$
|
54,587
|
$
|
56,311
|
||||||
|
|
||||||||||||
|
Fixed assets, net:
|
||||||||||||
|
United States
|
$
|
1,326
|
$
|
1,767
|
$
|
1,548
|
||||||
|
International
|
918
|
505
|
621
|
|||||||||
|
Total
|
$
|
2,244
|
$
|
2,272
|
$
|
2,169
|
||||||
Sales to international customers were 23%, 20%, and 14% of total sales in 2019, 2018, and 2017 respectively. Sales to Europe
represented 44%, 56%, and 44%, sales to the Pacific Rim (which includes Australia and Asia) represented 46%, 36%, and 32%, and sales to Canada represented 8%, 6%, and 18% of total international sales in 2019, 2018, and 2017
respectively. International long-lived assets consist of net fixed assets located at our foreign subsidiary in the UK as well as our contract manufacturers in China, Thailand, Malaysia and Mexico.
F-19
15. Leases
Operating lease expense for the year ended December 31, 2019, 2018 and 2017 was $1.0 million, $1.1 million and $1.1 million,
respectively, and was included within Cost of sales, Engineering, design and product development expense, Selling and marketing expense, and General and administrative expense. Operating costs include short-term lease costs which were immaterial
during the period.
The following information represents supplemental disclosure for the statement of cash flows related to operating leases (in
thousands):
|
Year Ended
December 31, 2019
|
||||
|
Operating cash outflows from leases
|
$
|
1,031
|
||
The following summarizes additional information related to our leases as of December 31, 2019:
|
December 31, 2019
|
||||
|
Weighted average remaining lease term (in years)
|
5.0
|
|||
|
Weighted average discount rate
|
3.7
|
%
|
||
The maturity of the Company’s operating lease liabilities as of December 31, 2019 are as follows (in thousands):
|
December 31, 2019
|
||||
|
2020
|
$
|
1,042
|
||
|
2021
|
711
|
|||
|
2022
|
434
|
|||
|
2023
|
268
|
|||
|
2024
|
273
|
|||
|
Thereafter
|
616
|
|||
|
Total undiscounted lease payments
|
3,344
|
|||
|
Less imputed interest
|
295
|
|||
|
Total lease liabilities
|
$
|
3,049
|
||
Prior to the adoption of ASC 842, rental commitments on an undiscounted basis were approximately $4.3 million at December 31, 2018
under non-cancelable operating leases and were payable as follows: $1.0 million in 2019; $1.0 million in 2020; $0.7 million in 2021; $0.4 million in 2022, $0.3 million in 2023 and $0.9 million thereafter.
16. Quarterly results of operations (unaudited)
Our quarterly results of operations for 2019 and 2018 are as follows:
|
|
Quarter Ended
|
|||||||||||||||
|
(In thousands, except per share amounts)
|
March 31
|
June 30
|
September 30
|
December 31
|
||||||||||||
|
2019:
|
||||||||||||||||
|
Net sales
|
$
|
11,550
|
$
|
11,350
|
$
|
11,686
|
$
|
11,162
|
||||||||
|
Gross profit
|
6,086
|
5,704
|
5,546
|
4,599
|
||||||||||||
|
Net income (loss)
|
746
|
186
|
384
|
(800
|
)
|
|||||||||||
|
Net income (loss) per common share:
|
||||||||||||||||
|
Basic
|
0.10
|
0.02
|
0.05
|
(0.11
|
)
|
|||||||||||
|
Diluted
|
0.10
|
0.02
|
0.05
|
(0.11
|
)
|
|||||||||||
|
2018:
|
||||||||||||||||
|
Net sales
|
$
|
12,243
|
$
|
14,751
|
$
|
15,838
|
$
|
11,755
|
||||||||
|
Gross profit
|
5,862
|
6,991
|
8,004
|
5,886
|
||||||||||||
|
Net income
|
680
|
1,210
|
2,574
|
962
|
||||||||||||
|
Net income per common share:
|
||||||||||||||||
|
Basic
|
0.09
|
0.16
|
0.35
|
0.13
|
||||||||||||
|
Diluted
|
0.09
|
0.16
|
0.33
|
0.12
|
||||||||||||
F-20
17. Subsequent events
On February 28, 2020, we entered into an amendment to extend the lease on our facility in Ithaca, New York. The lease, which was
last amended on January 14, 2016, was scheduled to expire on May 31, 2021. The lease amendment provides for an extension of the lease for four additional years from June 1, 2021 to May 31, 2025.
On March 13, 2020, we entered into a new $10 million credit facility (the “Siena Credit Facility”) with Siena
Lending Group LLC. The Siena Credit Facility replaced our TD Bank Credit Facility. The Siena Credit Facility provides for a $10 million revolving credit line expiring on March 13, 2023. Borrowings under the Siena Credit Facility bear a floating
rate of interest equal to the greatest of (i) the prime rate plus 1.75%, (ii) the federal funds rate plus 2.25%, and (iii) 6.50%. We incurred a closing fee of $63 thousand payable 50% on the closing date and 50% on the first anniversary of the
closing date. We also pay a fee of 0.50% on unused borrowings under the facility. Borrowings under the facility are secured by a lien on substantially all the assets of the Company. The Siena Credit Facility imposes certain financial covenants on
the Company and borrowings are subject to a borrowing base based on (i) 85% of eligible accounts receivable plus the lesser of (a) $5,000,000 and (b) 50% of eligible raw material and 60% of finished good inventory.
On March 13, 2020 we loaned an additional $0.6 million to a third party increasing the total note receivable principal balance to
$1.6 million. Repayment is expected to occur in 12 months or less of original issuance and the terms of the loan are the same as the original loan disclosed in Note 3-Note receivable above.
F-21