Attached files
| file | filename |
|---|---|
| EX-32.2 - Waterstone Financial, Inc. | exhibit322k.htm |
| EX-32.1 - Waterstone Financial, Inc. | exhibit321k.htm |
| EX-31.2 - Waterstone Financial, Inc. | exhibit312k.htm |
| EX-31.1 - Waterstone Financial, Inc. | exhibit311k.htm |
| EX-23.1 - Waterstone Financial, Inc. | exhibit231k.htm |
| EX-21.1 - Waterstone Financial, Inc. | exhibit211k.htm |
| EX-4.2 - Waterstone Financial, Inc. | exhibit42.htm |
SECURITIES AND EXCHANGE COMMISSION
Washington, D.C. 20549
F O R M 1 0 - K
[X] ANNUAL REPORT PURSUANT TO SECTION 13 OR 15(d) OF THE SECURITIES EXCHANGE ACT OF 1934
For the fiscal year ended December 31, 2019
Commission file number: 001-36271
WATERSTONE FINANCIAL, INC.
(Exact name of registrant as specified in its charter)
|
Maryland
|
|
90-1026709
|
|
(State or other jurisdiction of incorporation or organization)
|
|
(I.R.S. Employer Identification No.)
|
|
|
|
|
|
11200 W Plank Ct, Wauwatosa, Wisconsin
|
|
53226
|
|
(Address of principal executive offices)
|
|
(Zip Code)
|
(414) 761-1000
Registrant's telephone number, including area code:
Securities registered pursuant to Section 12(b) of the Act:
|
Title of each class
|
Trading Symbol
|
Name of each exchange on which registered
|
||
|
Common Stock, $0.01 Par Value
|
WSBF
|
The NASDAQ Stock Market, LLC
|
Securities registered pursuant to Section 12(g) of the Act:
NONE
Indicate by check mark whether the registrant is a well-known seasoned issuer (as defined in Rule 405 of the 1933 Act).
Yes □ No T
Indicate by check mark whether the registrant is not required to file reports pursuant to Section 13 or Section 15(d) of the 1934 Act.
Yes □ No T
Indicate by check mark whether the registrant (1) has filed all reports required to be filed by Section 13 or 15(d) of the Securities Exchange Act of 1934
during the preceding 12 months (or for such shorter period that the registrant was required to file such reports), and (2) has been subject to such filing requirements for the past 90 days.
Yes T No □
Indicate by check mark whether the registrant has submitted electronically every Interactive Data File required to be submitted pursuant to Rule 405 of
Regulation S-T during the preceding 12 months (or for such shorter period that the registrant was required to submit such files)
Yes T No □
Indicate by check mark whether the registrant is a large accelerated filer, an accelerated filer, a non-accelerated filer, a smaller reporting company, or
an emerging growth company. See definitions of “large accelerated filer,” “accelerated filer,” “smaller reporting company,” and "emerging growth company" in Rule 12b-2 of the Exchange Act.
|
Large accelerated filer
|
☐
|
|
Accelerated filer
|
☒
|
|
Non-accelerated filer
|
☐
|
|
Smaller Reporting Company
|
☐
|
|
Emerging growth company
|
☐
|
If an emerging growth company, indicate by check mark if the registrant has elected not to use the extended transition period for complying with any new or
revised financial accounting standards provided pursuant to Section 13(a) of the Exchange Act. □
Indicate by check mark whether the registrant is a shell company (as defined in Rule 12b-2 under the Exchange Act).
Yes □ No T
The aggregate market value of the voting and non-voting common equity held by non-affiliates of the Registrant, computed by reference to the price at which
the common equity was last sold on June 30, 2019 as reported by the NASDAQ Global Select Market®, was approximately $471.3 million.
As of February 28, 2020, 26,889,750 shares of the
Registrant’s Common Stock were issued and outstanding.
|
DOCUMENTS INCORPORATED BY REFERENCE
|
||
|
|
|
Part of Form 10-K Into Which
|
|
Document
|
|
Portions of Document are Incorporated
|
|
Proxy Statement for Annual Meeting of
|
|
Part III
|
|
Shareholders on May 19, 2020
|
|
|
WATERSTONE FINANCIAL, INC.
FORM 10-K ANNUAL REPORT TO THE SECURITIES AND EXCHANGE COMMISSION
FOR THE YEAR ENDED DECEMBER 31, 2019
|
TABLE OF CONTENTS
|
|||
|
|
|
|
|
|
ITEM
|
|
|
PAGE
|
|
|
|
|
|
|
PART I
|
|
|
|
|
|
|
|
|
|
1.
|
Business
|
|
3-28 |
|
1A.
|
Risk Factors
|
|
29-35 |
|
1B.
|
Unresolved Staff Comments
|
|
35 |
|
2.
|
Properties
|
|
35 |
|
3.
|
Legal Proceedings
|
|
35 |
|
4.
|
Mine Safety Disclosures
|
|
35 |
|
|
|
|
35 |
|
PART II
|
|
|
|
|
|
|
|
|
|
5.
|
Market for Registrant's Common Equity, Related Stockholders Matters and Issuer Purchases
of Equity Securities
|
|
36 |
|
6.
|
Selected Financial Data
|
|
37-38 |
|
7.
|
Management's Discussion and Analysis of Financial Condition and Results of Operations
|
|
39-50 |
|
7A.
|
Quantitative and Qualitative Disclosures About Market Risk
|
|
51 |
|
8.
|
Financial Statements and Supplementary Data
|
|
52-100 |
|
9.
|
Changes in and Disagreements with Accountants on Accounting and Financial Disclosure
|
|
100 |
|
9A.
|
Controls and Procedures
|
|
100-101 |
|
9B.
|
Other Information
|
|
101 |
|
|
|
|
|
|
PART III
|
|
|
|
|
|
|
|
|
|
10.
|
Directors, Executive Officers and Corporate Governance
|
|
|
|
11.
|
Executive Compensation
|
|
102 |
|
12.
|
Security Ownership of Certain Beneficial Owners and Management and Related Stockholder
Matters
|
|
102 |
|
13.
|
Certain Relationships and Related Transactions, and Director Independence
|
|
103 |
|
14.
|
Principal Accountant Fees and Services
|
|
103 |
|
|
|
|
|
|
PART IV
|
|
|
|
|
|
|
|
|
|
15.
|
Exhibits and Financial Statement Schedules
|
|
103 |
|
16.
|
Form 10-K Summary |
|
103 |
| |
Signatures | 105 | |
- 2 -
Item 1. Business
Forward-Looking Statements
This Annual Report on Form 10-K may contain or incorporate by reference various forward-looking statements, which can
be identified by the use of words such as “estimate,” “project,” “believe,” “intend,” “anticipate,” “plan,” “seek,” “expect” and similar expressions and verbs in the future tense. These forward-looking statements include, but are not limited to:
|
•
|
Statements of our goals, intentions and expectations;
|
|
|
•
|
Statements regarding our business plans, prospects, growth and operating strategies;
|
|
|
•
|
Statements regarding the quality of our loan and investment portfolio;
|
|
|
•
|
Estimates of our risks and future costs and benefits.
|
These forward-looking statements are based on current beliefs and expectations of our management and are inherently
subject to significant business, economic and competitive uncertainties and contingencies, many of which are beyond our control. In addition, these forward-looking statements are subject to assumptions with respect to future business strategies and
decisions that are subject to change.
The following factors, among others, could cause actual results to differ materially from the anticipated results or
other expectations expressed in the forward-looking statements.
|
•
|
general economic conditions, either nationally or in our market area, including employment prospects, that are different than
expected;
|
|
|
•
|
competition among depository and other financial institutions;
|
|
|
•
|
inflation and changes in the interest rate environment that reduce our margins and yields, our mortgage banking revenues or reduce
the fair value of financial instruments or reduce the origination levels in our lending business, or increase the level of defaults, losses or prepayments on loans we have made and make whether held in portfolio or sold in the secondary
markets;
|
|
|
•
|
adverse changes in the securities or secondary mortgage markets;
|
|
|
•
|
changes in laws or government regulations or policies affecting financial institutions, including changes in regulatory fees and
capital requirements;
|
|
|
•
|
changes in monetary or fiscal policies of the U.S. Government, including policies of the U.S. Treasury and the Federal Reserve Board;
|
|
|
•
|
our ability to manage market risk, credit risk and operational risk in the current economic conditions;
|
|
|
•
|
our ability to enter new markets successfully and capitalize on growth opportunities;
|
|
|
•
|
our ability to successfully integrate acquired entities;
|
|
|
•
|
decreased demand for our products and services;
|
|
|
•
|
changes in tax policies or assessment policies;
|
|
|
•
|
the inability of third-party provider to perform their obligations to us;
|
|
|
•
|
changes in consumer demand, spending, borrowing and savings habits;
|
|
|
•
|
changes in accounting policies and practices, as may be adopted by the bank regulatory agencies, the Financial Accounting Standards
Board, the Securities and Exchange Commission or the Public Company Accounting Oversight Board;
|
|
|
•
|
our ability to retain key employees;
|
|
|
•
|
cyber attacks, computer viruses and other technological risks that may breach the security of our websites or other systems to obtain
unauthorized access to confidential information and destroy data or disable our systems;
|
|
|
•
|
technological changes that may be more difficult or expensive than expected;
|
|
|
•
|
the ability of third-party providers to perform their obligations to us;
|
|
|
•
|
the effects of federal government shutdown;
|
|
|
•
|
the ability of the U.S. Government to manage federal debt limits;
|
|
|
•
|
significant increases in our loan losses; and
|
|
|
•
|
changes in the financial condition, results of operations or future prospects of issuers of securities that we own.
|
See also the factors regarding future operations discussed in "Management's Discussion and Analysis of Financial
Condition and Results of Operations" and "Risk Factors" below.
Waterstone Financial, Inc.
Waterstone Financial, Inc., a Maryland corporation (“New Waterstone”), was organized in 2013. Upon completion of the
mutual-to-stock conversion of Lamplighter Financial, MHC in 2014, New Waterstone became the holding company of WaterStone Bank SSB and succeeded to all of the business and operations of Waterstone Financial, Inc., a Federal corporation
(“Waterstone-Federal”) and each of Waterstone-Federal and Lamplighter Financial, MHC ceased to exist. In this report, we refer to WaterStone Bank SSB, our wholly owned subsidiary, both before and after the reorganization, as “WaterStone Bank” or the
“Bank.”
Waterstone Financial, Inc. and its subsidiaries, including WaterStone Bank, are referred to herein as the “Company,”
“Waterstone Financial,” or “we.”
The Company maintains a website at www.wsbonline.com.
We make available through that website, free of charge, copies of our Annual Reports on Form 10-K, Quarterly Reports on Form 10-Q, Current Reports on Form 8-K, amendments to those reports and proxy materials as soon as is reasonably practical after
the Company electronically files those materials with, or furnishes them to, the Securities and Exchange Commission. You may access those reports by following the links under “Investor Relations” at the Company’s website. Information on this website
is not and should not be considered a part of this document.
Waterstone Financial’s executive offices are located at 11200 West Plank Court, Wauwatosa, Wisconsin 53226, and its
telephone number at this address is (414) 761-1000.
- 3 -
BUSINESS OF WATERSTONE BANK
General
WaterStone Bank is a community bank that has served the banking needs of its customers since 1921. WaterStone Bank also
has an active mortgage banking subsidiary, Waterstone Mortgage Corporation, which had 67 offices in 24 states as of December 31, 2019.
WaterStone Bank conducts its community banking business from 13 banking offices located in Milwaukee, Washington and
Waukesha counties, Wisconsin, as well as a loan production office in Minneapolis, Minnesota. WaterStone Bank’s principal lending activity is originating one- to four-family, multi-family residential, and commercial real estate loans for retention in
its portfolio. At December 31, 2019, such loans comprised 34.6%, 42.1%, and 17.1%, respectively, of WaterStone Bank’s loan portfolio. WaterStone Bank also offers home equity loans and lines of credit, construction and land loans, commercial business
loans, and consumer loans. WaterStone Bank funds its loan production primarily with retail deposits and Federal Home Loan Bank advances. Our deposit offerings include certificates of deposit, money market savings accounts, transaction deposit
accounts, noninterest bearing demand accounts and individual retirement accounts. Our investment securities portfolio is comprised principally of mortgage-backed securities, government-sponsored enterprise bonds, municipal obligations, and other debt
securities.
WaterStone Bank is subject to comprehensive regulation and examination by the Wisconsin Department of Financial
Institutions (the "WDFI") and the Federal Deposit Insurance Corporation (the "FDIC").
WaterStone Bank’s executive offices are located at 11200 West Plank Court, Wauwatosa, Wisconsin 53226, and its telephone
number is (414) 761-1000. Its website address is www.wsbonline.com. Information on this website is not and should not be considered a part of this document.
WaterStone Bank’s mortgage banking operations are conducted through its wholly-owned subsidiary, Waterstone Mortgage
Corporation. Waterstone Mortgage Corporation originates single-family residential real estate loans for sale into the secondary market. Waterstone Mortgage Corporation utilizes lines of credit provided by WaterStone Bank as a primary source of
funds, and also utilizes a line of credit with another financial institution as needed. On a consolidated basis, Waterstone Mortgage Corporation originated approximately $2.85 billion in mortgage loans held for sale during the year ended December
31, 2019, which excludes the loans originated from Waterstone Mortgage Corporation and purchased by WaterStone Bank.
Subsidiary Activities
Waterstone Financial currently has one wholly-owned subsidiary, WaterStone Bank, which in turn has three wholly-owned
subsidiaries. Wauwatosa Investments, Inc., which holds and manages our investment portfolio, is located and incorporated in Nevada. Waterstone Mortgage Corporation is a mortgage banking business incorporated in Wisconsin. Main Street Real Estate
Holdings, LLC is a Wisconsin limited liability corporation and previously owned WaterStone Bank office facilities and held WaterStone Bank office facility leases.
Wauwatosa
Investments, Inc. Established in 1998, Wauwatosa Investments, Inc. operates in Nevada as WaterStone Bank’s investment subsidiary. This
wholly-owned subsidiary owns and manages the majority of the consolidated investment portfolio. It has its own board of directors currently comprised of its President, the WaterStone Bank Chief Financial Officer, Treasury Officer and the Chairman of
Waterstone Financial’s board of directors.
Waterstone
Mortgage Corporation. Acquired in February 2006, Waterstone Mortgage Corporation is a mortgage banking business with offices in 24 states. It has its own board of directors currently comprised of its President, its Chief Financial
Officer, the WaterStone Bank Chief Executive Officer, Chief Financial Officer and Executive Vice President and General Counsel.
Main
Street Real Estate Holdings, LLC. Established in 2002, Main Street Real Estate Holdings, LLC was established to acquire and hold WaterStone Bank office and retail facilities, both owned and leased. Main Street Real Estate Holdings, LLC
currently conducts real estate broker activities limited to real estate owned.
Market Area
WaterStone
Bank. WaterStone Bank’s market area is broadly defined as the Milwaukee, Wisconsin metropolitan market, which is geographically located in the southeast corner of the state. WaterStone Bank’s primary market area is Milwaukee and Waukesha
counties and the five surrounding counties of Ozaukee, Washington, Jefferson, Walworth and Racine. We have eight branch offices in Milwaukee County, four branch offices in Waukesha County and one branch office in Washington County. At June 30, 2019
(the latest date for which information was publicly available), 47.0% of deposits in the State of Wisconsin were located in the seven-county Milwaukee metropolitan market and 39.9% of deposits in the State of Wisconsin were located in the three
counties in which the Bank has a branch office.
WaterStone Bank’s primary market area for deposits includes the communities in which we maintain our banking office
locations. Our primary lending market area is broader than our primary deposit market area and includes all of the primary market area noted above but extends further west to the Madison, Wisconsin market and further north to the Appleton and Green
Bay, Wisconsin markets. Additionally, in 2013 we opened a loan production office in Minneapolis, Minnesota, which has a primary lending market area of the Minneapolis-St. Paul, Minnesota metropolitan market.
Waterstone
Mortgage Corporation. As of December 31, 2019, Waterstone Mortgage Corporation had 10 offices in each of Wisconsin and Florida, eight offices in New Mexico, three offices in each of Delaware, Illinois, Minnesota, and Virginia, two offices
in each of Arizona, Colorado, Maryland, Missouri, Ohio, Oklahoma, Oregon, and Virginia, and one office in each of Arkansas, California, Georgia, Idaho, Iowa, Michigan, New Hampshire, North Carolina and Pennsylvania.
- 4 -
Competition
WaterStone
Bank. WaterStone Bank faces competition within our market area both in making real estate loans and attracting deposits. The
Milwaukee-Waukesha-West Allis metropolitan statistical area has a high concentration of financial institutions, including large commercial banks, community banks and credit unions. As of June 30, 2019, based on the FDIC annual Summary of Deposits
Report, we had the eigth largest market share in our metropolitan statistical area out of 43 financial institutions, representing 1.88% of all deposits.
Our competition for loans and deposits comes principally from commercial banks, savings institutions, mortgage banking
firms and credit unions. We face additional competition for deposits from money market funds, brokerage firms, and mutual funds. Some of our competitors offer products and services that we do not offer, such as trust services and private banking.
Our primary focus is to build and develop profitable consumer and commercial customer relationships while maintaining
our role as a community bank.
Waterstone
Mortgage Corporation. Waterstone Mortgage Corporation faces competition for originating loans both directly within the markets in which it operates and from entities that provide services throughout the United States through internet
services. Waterstone Mortgage Corporation’s competition comes principally from other mortgage banking firms, as well as from commercial banks, savings institutions and credit unions.
Lending Activities
The scope of the discussion included under “Lending Activities” is limited to lending operations related to loans
originated for investment. A discussion of the lending activities related to loans originated for sale is included under “Mortgage Banking Activities.”
Historically, our principal lending activity has been originating mortgage loans for the purchase
or refinancing of residential and commercial real estate. Generally, we retain the loans that we originate, which we refer to as loans originated for investment. One- to four-family residential mortgage loans represented $480.3 million, or 34.6%, of
our total loan portfolio at December 31, 2019. Multi-family residential mortgage loans represented $584.9 million, or 42.1%, of our total loan portfolio at December 31, 2019. Commercial real estate loans represented $236.7 million, or 17.1%, of our
total loan portfolio at December 31, 2019. We also offer construction and land loans, home equity lines of credit and commercial loans. At December 31, 2019, commercial business loans, home equity loans, and land and construction loans totaled $30.3
million, $18.1 million and $37.0 million, respectively.
The largest exposure to one borrower or group of related borrowers was $39.1 million in the
multi-family category. The borrower represented a total of 2.8% of the total loan portfolio as of December 31, 2019.
Loan
Portfolio Composition. The following table sets forth the composition of our loan portfolio in dollar amounts and as a percentage of the total portfolio at the dates indicated.
|
At December 31,
|
||||||||||||||||||||||||||||||||||||||||
|
2019
|
2018
|
2017
|
2016
|
2015
|
||||||||||||||||||||||||||||||||||||
|
Amount
|
Percent
|
Amount
|
Percent
|
Amount
|
Percent
|
Amount
|
Percent
|
Amount
|
Percent
|
|||||||||||||||||||||||||||||||
|
(Dollars in Thousands)
|
||||||||||||||||||||||||||||||||||||||||
|
Mortgage loans:
|
||||||||||||||||||||||||||||||||||||||||
|
Residential real estate:
|
||||||||||||||||||||||||||||||||||||||||
|
One- to four-family
|
$
|
480,280
|
34.60
|
%
|
$
|
489,979
|
35.53
|
%
|
$
|
439,597
|
34.03
|
%
|
$
|
392,817
|
33.35
|
%
|
$
|
381,992
|
34.26
|
%
|
||||||||||||||||||||
|
Multi-family
|
584,859
|
42.14
|
%
|
597,087
|
43.29
|
%
|
578,440
|
44.77
|
%
|
558,592
|
47.42
|
%
|
547,250
|
49.08
|
%
|
|||||||||||||||||||||||||
|
Home equity
|
18,071
|
1.30
|
%
|
19,956
|
1.45
|
%
|
21,124
|
1.64
|
%
|
21,778
|
1.85
|
%
|
24,326
|
2.18
|
%
|
|||||||||||||||||||||||||
|
Construction and land
|
37,033
|
2.67
|
%
|
13,361
|
0.97
|
%
|
19,859
|
1.54
|
%
|
18,179
|
1.54
|
%
|
19,148
|
1.72
|
%
|
|||||||||||||||||||||||||
|
Commercial real estate
|
236,703
|
17.05
|
%
|
225,522
|
16.35
|
%
|
195,842
|
15.16
|
%
|
159,401
|
13.53
|
%
|
118,820
|
10.66
|
%
|
|||||||||||||||||||||||||
|
Commercial loans
|
30,253
|
2.18
|
%
|
32,810
|
2.38
|
%
|
36,697
|
2.84
|
%
|
26,798
|
2.28
|
%
|
23,037
|
2.07
|
%
|
|||||||||||||||||||||||||
|
Consumer
|
832
|
0.06
|
%
|
433
|
0.03
|
%
|
255
|
0.02
|
%
|
319
|
0.03
|
%
|
361
|
0.03
|
%
|
|||||||||||||||||||||||||
|
Total loans
|
1,388,031
|
100.00
|
%
|
1,379,148
|
100.00
|
%
|
1,291,814
|
100.00
|
%
|
1,177,884
|
100.00
|
%
|
1,114,934
|
100.00
|
%
|
|||||||||||||||||||||||||
|
Allowance for loan losses
|
(12,387
|
)
|
(13,249
|
)
|
(14,077
|
)
|
(16,029
|
)
|
(16,185
|
)
|
||||||||||||||||||||||||||||||
|
Loans, net
|
$
|
1,375,644
|
$
|
1,365,899
|
$
|
1,277,737
|
$
|
1,161,855
|
$
|
1,098,749
|
||||||||||||||||||||||||||||||
- 5 -
Loan
Portfolio Maturities and Yields. The following table summarizes the final maturities of our loan portfolio at December 31, 2019. Maturities are based upon the final contractual payment dates and do not reflect the impact of prepayments and scheduled
monthly payments that will occur.
|
One- to four-family
|
Multi-family
|
Home Equity
|
Construction and Land
|
|||||||||||||||||||||||||||||
|
Due during the year ended
|
Weighted
|
Weighted
|
Weighted
|
Weighted
|
||||||||||||||||||||||||||||
|
December 31,
|
Amount
|
Average Rate
|
Amount
|
Average Rate
|
Amount
|
Average Rate
|
Amount
|
Average Rate
|
||||||||||||||||||||||||
|
(Dollars in Thousands)
|
||||||||||||||||||||||||||||||||
|
2020
|
$
|
7,496
|
5.15
|
%
|
$
|
40,731
|
4.06
|
%
|
$
|
2,270
|
5.34
|
%
|
$
|
1,840
|
4.92
|
%
|
||||||||||||||||
|
2021
|
10,084
|
5.19
|
%
|
35,374
|
4.39
|
%
|
2,063
|
5.34
|
%
|
10,194
|
4.54
|
%
|
||||||||||||||||||||
|
2022
|
23,730
|
5.25
|
%
|
89,802
|
4.44
|
%
|
2,579
|
5.25
|
%
|
4,887
|
4.23
|
%
|
||||||||||||||||||||
|
2023
|
16,549
|
5.40
|
%
|
93,123
|
4.65
|
%
|
2,320
|
5.13
|
%
|
2,130
|
4.76
|
%
|
||||||||||||||||||||
|
2024
|
14,729
|
5.45
|
%
|
49,482
|
4.72
|
%
|
2,603
|
4.93
|
%
|
2,848
|
4.55
|
%
|
||||||||||||||||||||
|
2025 and thereafter
|
407,692
|
4.60
|
%
|
276,347
|
4.12
|
%
|
6,236
|
4.75
|
%
|
15,134
|
4.82
|
%
|
||||||||||||||||||||
|
Total
|
$
|
480,280
|
4.71
|
%
|
$
|
584,859
|
4.32
|
%
|
$
|
18,071
|
5.04
|
%
|
$
|
37,033
|
4.64
|
%
|
||||||||||||||||
|
Commercial Real Estate
|
Commercial
|
Consumer
|
Total
|
|||||||||||||||||||||||||||||
|
Due during the year ended
|
Weighted
|
Weighted
|
Weighted
|
Weighted
|
||||||||||||||||||||||||||||
|
December 31,
|
Amount
|
Average Rate
|
Amount
|
Average Rate
|
Amount
|
Average Rate
|
Amount
|
Average Rate
|
||||||||||||||||||||||||
|
(Dollars in Thousands)
|
||||||||||||||||||||||||||||||||
|
2020
|
$
|
13,738
|
4.37
|
%
|
$
|
13,304
|
5.04
|
%
|
$
|
717
|
2.00
|
%
|
$
|
80,096
|
4.42
|
%
|
||||||||||||||||
|
2021
|
17,740
|
4.12
|
%
|
1,178
|
4.46
|
%
|
52
|
5.13
|
%
|
76,685
|
4.48
|
%
|
||||||||||||||||||||
|
2022
|
34,199
|
4.41
|
%
|
4,338
|
4.33
|
%
|
63
|
5.38
|
%
|
159,598
|
4.50
|
%
|
||||||||||||||||||||
|
2023
|
37,355
|
4.43
|
%
|
2,437
|
5.12
|
%
|
-
|
0.00
|
%
|
153,914
|
4.69
|
%
|
||||||||||||||||||||
|
2024
|
45,620
|
4.60
|
%
|
2,493
|
4.61
|
%
|
-
|
0.00
|
%
|
117,775
|
4.76
|
%
|
||||||||||||||||||||
|
2025 and thereafter
|
88,051
|
4.44
|
%
|
6,503
|
6.69
|
%
|
-
|
0.00
|
%
|
799,963
|
4.44
|
%
|
||||||||||||||||||||
|
Total
|
$
|
236,703
|
4.44
|
%
|
$
|
30,253
|
5.24
|
%
|
$
|
832
|
2.45
|
%
|
$
|
1,388,031
|
4.50
|
%
|
||||||||||||||||
The following table sets forth the scheduled repayments of fixed and adjustable rate loans at December 31, 2019 that
are contractually due after December 31, 2020.
|
Due After December 31, 2020
|
||||||||||||
|
Fixed
|
Adjustable
|
Total
|
||||||||||
|
(In Thousands)
|
||||||||||||
|
Mortgage loans
|
||||||||||||
|
Real estate loans:
|
||||||||||||
|
One- to four-family
|
$
|
24,939
|
$
|
447,845
|
$
|
472,784
|
||||||
|
Multi-family
|
207,845
|
336,283
|
544,128
|
|||||||||
|
Home equity
|
3,600
|
12,201
|
15,801
|
|||||||||
|
Construction and land
|
19,817
|
15,376
|
35,193
|
|||||||||
|
Commercial
|
138,569
|
84,396
|
222,965
|
|||||||||
|
Commercial
|
16,098
|
851
|
16,949
|
|||||||||
|
Consumer
|
115
|
-
|
115
|
|||||||||
|
Total loans
|
$
|
410,983
|
$
|
896,952
|
$
|
1,307,935
|
||||||
One-
to Four-Family Residential Mortgage Loans. One- to four-family residential mortgage loans totaled $480.3 million, or 34.6% of total loans at December 31, 2019. One- to four-family residential mortgage loans originated for investment during
the year ended December 31, 2019 totaled $95.5 million, or 29.1% of all loans originated for investment. Our one- to four-family residential mortgage loans have fixed or adjustable rates. Our single family adjustable-rate mortgage loans generally
provide for maximum annual rate adjustments of 200 basis points, with a lifetime maximum adjustment of 600 basis points. Our adjustable-rate mortgage loans typically amortize over terms of up to 30 years, and are indexed to the 12-month LIBOR rate.
Single family adjustable rate mortgage loans are originated at both our community banking segment and our mortgage banking segment. We do not offer and have never offered residential mortgage loans specifically designed for borrowers with sub-prime
credit scores, including Alt-A and negative amortization loans. Further, prior to 2007, we did not offer indexed, adjustable-rate loans other than home equity lines of credit, and we have never offered “teaser rate” first mortgage products.
- 6 -
Adjustable rate mortgage loans can decrease the interest rate risk associated with changes in market interest rates by
periodically repricing, but involve other risks because, as interest rates increase, the loan payments by the borrower increase, thus increasing the potential for default by the borrower. At the same time, the marketability of the underlying
collateral may be adversely affected by higher interest rates. Upward adjustment of the contractual interest rate is also limited by the maximum periodic and lifetime interest rate adjustments permitted by our loan documents and, therefore, the
effectiveness of adjustable rate mortgage loans in decreasing the risk associated with changes in interest rates may be limited during periods of rapidly rising interest rates. Moreover, during periods of rapidly declining interest rates the interest
income received from the adjustable rate loans can be significantly reduced, thereby adversely affecting interest income.
All residential mortgage loans that we originate include “due-on-sale” clauses, which give us the right to declare a
loan immediately due and payable in the event that, among other things, the borrower sells or otherwise transfers the real property subject to the mortgage and the loan is not repaid. We also require homeowner’s insurance and where circumstances
warrant, flood insurance, on properties securing real estate loans. The average one- to four-family first mortgage loan balance was approximately $225,000 on December 31, 2019, and the largest outstanding balance on that date was $6.3 million, which
is a consolidation loan that is collateralized by 85 single family properties. A total of 58.8% of our one- to four-family loans are collateralized by properties in the state of Wisconsin.
Multi-family Real Estate Loans. Multi-family loans totaled $584.9 million, or 42.1% of total loans at December 31, 2019. Multi-family loans
originated for investment during the year ended December 31, 2019 totaled $110.1 million, or 33.5% of all loans originated for investment. These loans are generally secured by properties located in our primary market area. Our multi-family real
estate underwriting policies generally provide that such real estate loans may be made in amounts of up to 80% of the appraised value of the property provided the loan complies with our current loans-to-one borrower limit. Multi-family real estate
loans are offered with interest rates that are fixed for periods of up to five years or are variable and either adjust based on a market index or at our discretion. Contractual maturities do not exceed 10 years while principal and interest payments
are typically based on a 30-year amortization period. In reaching a decision whether to make a multi-family real estate loan, we consider gross revenues and the net operating income of the property, the borrower’s expertise and credit history,
global cash flows, and the appraised value of the underlying property. We will also consider the terms and conditions of the leases and the credit quality of the tenants. We generally require that the properties securing these real estate loans
have debt service coverage ratios (the ratio of earnings before interest, income taxes, depreciation and amortization divided by interest expense and current maturities of long term debt) of at least 1.15 times. Generally, multi-family loans made
to corporations, partnerships and other business entities require personal guarantees from the principals and by the owners of 20% or more of the borrower.
A multi-family borrower’s financial information is monitored on an ongoing basis by requiring periodic financial
statement updates, payment history reviews and periodic face-to-face meetings with the borrower. We generally require borrowers with aggregate outstanding balances exceeding $1.0 million to provide updated financial statements and federal tax
returns annually. These requirements also apply to all guarantors on these loans. We also require borrowers with rental investment property to provide an annual report of income and expenses for the property, including a tenant list and copies of
leases, as applicable. The average outstanding multi-family mortgage loan balance was approximately $985,000 on December 31, 2019, with the largest outstanding balance at $11.9 million.
Loans secured by multi-family real estate generally involve larger principal amounts than owner-occupied, one- to
four-family residential mortgage loans. Because payments on loans secured by multi-family properties often depend on the successful operation or
management of the properties, repayment of such loans may be affected by adverse conditions in the real estate market or the economy.
Home
Equity Loans and Lines of Credit. We also offer home equity loans and home equity lines of credit, both of which are secured by
owner-occupied and non-owner occupied one- to four-family residences. At December 31, 2019, outstanding home equity loans and equity lines of credit totaled $18.1 million, or 1.3% of total loans outstanding. At December 31, 2019, the unadvanced
portion of home equity lines of credit totaled $13.4 million. Home equity loans and lines originated for investment during the year ended December 31, 2019 totaled $5.8 million, or 1.8% of all loans originated for investment. The underwriting
standards utilized for home equity loans and home equity lines of credit include a determination of the applicant’s credit history, an assessment of the applicant’s ability to meet existing obligations and payments on the proposed loan, and the value
of the collateral securing the loan. Home equity loans are offered with adjustable rates of interest and with terms up to 10 years. The loan-to-value ratio for our home equity loans and our lines of credit is generally limited to 90% when combined
with the first security lien, if applicable. Our home equity lines of credit have ten-year terms and adjustable rates of interest, subject to a contractual floor, which are indexed to the prime rate, as reported in The Wall Street Journal. Interest rates on home equity lines of credit are generally limited to a maximum rate of 18%. The average outstanding home equity loan balance was
approximately $45,000 at December 31, 2019, with the largest outstanding balance at that date of $515,000.
Construction
and Land Loans. We originate construction loans for the acquisition of land and the construction of single-family residences, multi-family residences, and commercial real estate buildings. At December 31, 2019, construction and land loans
totaled $37.0 million, or 2.7% of total loans. Construction and land loans originated for investment during the year ended December 31, 2019 totaled $59.8 million, or 18.2% of all loans originated for investment. Of the $59.8 million originated in
2019, a total of $47.4 million had yet to be advanced as of December 31, 2019. At December 31, 2019, the unadvanced portion of the construction loan portfolio totaled $91.4 million.
Our construction mortgage loans generally
provide for the payment of interest only during the construction phase, which is typically up to nine months for single-family residences although our policy is to consider construction periods as long as 12 months or more for multi-family
residences and commercial buildings. At the end of the construction phase, the construction loan converts to a longer-term mortgage loan. Construction loans can be made with a maximum loan-to-value ratio of 90%, provided that the borrower obtains
private mortgage insurance if the owner-occupied residential loan balance exceeds 80% of the lesser of the appraised value or acquisition cost of the secured property. The average outstanding construction loan balance totaled approximately $1.7
million on December 31, 2019, with the largest outstanding balance at $11.6 million. The average outstanding land loan balance was approximately $194,000 on December 31, 2019, and the largest outstanding balance on that date was $1.0 million.
Before making a commitment to fund a construction loan, we require an appraisal of the property by an independent
licensed appraiser. We also review and inspect each property before disbursement of funds during the term of the construction loan. Loan proceeds are disbursed after inspection based on either the percentage of completion method or the actual cost of
the completed work.
Construction financing is generally considered to involve a higher degree of credit risk than longer-term financing on
improved, owner-occupied real estate. Risk of loss on a construction loan depends largely upon the accuracy of the initial estimate of the value of the property at completion of construction compared to the estimated cost (including interest) of
construction and other assumptions. If the estimate of construction cost is inaccurate, we may be required to advance funds beyond the amount originally committed in order to protect the value of the property. Additionally, if the estimate of value
is inaccurate, we may be confronted with a project, when completed, with a value that is insufficient to ensure full repayment of the loan.
- 7 -
Commercial
Real Estate Loans. Commercial real estate loans totaled $236.7 million at December 31, 2019, or 17.1% of total loans, and are made up
of loans secured by office and retail buildings, industrial buildings, churches, restaurants, other retail properties and mixed use properties. Commercial real estate loans originated for investment during the year ended December 31, 2019 totaled
$49.7 million, or 15.1% of all loans originated for investment. These loans are generally secured by property located in our primary market area. Our commercial real estate underwriting policies provide that such real estate loans may be made in
amounts of up to 80% of the appraised value of the property. Commercial real estate loans are offered with interest rates that are fixed up to five years or are variable and either adjust based on a market index or at our discretion. Contractual
maturities do not exceed 10 years while principal and interest payments are typically based on a 25 to 30-year amortization period. In reaching a decision whether to make a commercial real estate loan, we consider gross revenues and the net operating
income of the property, the borrower’s expertise and credit history, business and global cash flow, and the appraised value of the underlying property. In addition, we will also consider the terms and conditions of the leases and the credit quality
of the tenants, if applicable. We generally require that the properties securing these real estate loans have debt service coverage ratios (the ratio of earnings before interest, income taxes, depreciation and amortization divided by interest expense
and current maturities of long term debt) of at least 1.15 times. Environmental surveys are required for commercial real estate loans when environmental risks are identified. Generally, commercial real estate loans made to corporations, partnerships
and other business entities require personal guarantees by the principals and by the owners of 20% or more of the borrower.
A commercial real estate borrower’s financial information is monitored on an ongoing basis by requiring periodic
financial statement updates, payment history reviews and periodic face-to-face meetings with the borrower. We generally require borrowers with aggregate outstanding balances exceeding $1.0 million to provide annual updated financial statements and
federal tax returns. These requirements also apply to all guarantors on these loans. We also require borrowers to provide an annual report of income and expenses for the property, including a tenant list and copies of leases, as applicable. The
average commercial real estate loan in our portfolio at December 31, 2019 was approximately $877,000, and the largest outstanding balance at that date was $13.2 million.
Commercial
Loans. Commercial loans totaled $30.3 million at December 31, 2019, or 2.2% of total loans, and are made up of loans secured by
accounts receivable, inventory, equipment and real estate. Commercial loans originated for investment during the year ended December 31, 2019 totaled $7.5 million, or 2.3% of all loans originated.
Our commercial loans are generally made to borrowers that are located in our primary market area. Working capital
lines of credit are granted for the purpose of carrying inventory and accounts receivable or purchasing equipment. These lines require that certain collateral levels must be maintained and are monitored on a monthly or quarterly basis. Working
capital lines of credit are short-term loans of 12 months or less with variable interest rates. At December 31, 2019, the unadvanced portion of working capital lines of credit totaled $17.0 million. Outstanding balances fluctuate up to the maximum
commitment amount based on fluctuations in the balance of the underlying collateral. Personal property loans secured by equipment are considered commercial business loans and are generally made for terms of up to 84 months and for up to 80% of the
value of the underlying collateral. Interest rates on equipment loans may be either fixed or variable. Commercial business loans are generally variable rate loans with initial fixed rate periods of up to five years.
A commercial business borrower’s financial information is monitored on an ongoing basis by requiring periodic
financial statement updates, usually quarterly, payment history reviews and periodic face-to-face meetings with the borrower. The average outstanding commercial loan at December 31, 2019 was $238,000 and the largest outstanding balance on that date
was $6.3 million.
The following table shows loan origination, principal repayment activity, transfers to real estate owned, charge-offs
and sales during the years indicated.
|
As of or for the Year Ended December 31,
|
||||||||||||
|
2019
|
2018
|
2017
|
||||||||||
|
(In Thousands)
|
||||||||||||
|
Total gross loans receivable and held for sale at beginning of year
|
$
|
1,520,764
|
$
|
1,441,710
|
$
|
1,403,132
|
||||||
|
Real estate loans originated for investment:
|
||||||||||||
|
Residential
|
||||||||||||
|
One- to four-family
|
95,461
|
126,601
|
117,747
|
|||||||||
|
Multi-family
|
110,136
|
123,107
|
108,380
|
|||||||||
|
Home equity
|
5,804
|
4,613
|
5,430
|
|||||||||
|
Construction and land
|
59,814
|
66,265
|
2,270
|
|||||||||
|
Commercial real estate
|
49,710
|
58,176
|
61,684
|
|||||||||
|
Total real estate loans originated for investment
|
320,925
|
378,762
|
295,511
|
|||||||||
|
Consumer loans originated for investment
|
55
|
142
|
80
|
|||||||||
|
Commercial loans originated for investment
|
7,517
|
6,221
|
19,610
|
|||||||||
|
Total loans originated for investment
|
328,497
|
385,125
|
315,201
|
|||||||||
|
Principal repayments
|
(318,383
|
)
|
(297,162
|
)
|
(197,623
|
)
|
||||||
|
Transfers to real estate owned
|
(1,052
|
)
|
(545
|
)
|
(2,171
|
)
|
||||||
|
Loan principal charged-off
|
(179
|
)
|
(84
|
)
|
(1,477
|
)
|
||||||
|
Net activity in loans held for investment
|
8,883
|
87,334
|
113,930
|
|||||||||
|
Loans originated for sale
|
2,853,222
|
2,509,827
|
2,458,370
|
|||||||||
|
Loans sold
|
(2,774,715
|
)
|
(2,518,107
|
)
|
(2,533,722
|
)
|
||||||
|
Net activity in loans held for sale
|
78,507
|
(8,280
|
)
|
(75,352
|
)
|
|||||||
|
Total gross loans receivable and held for sale at end of year
|
$
|
1,608,154
|
$
|
1,520,764
|
$
|
1,441,710
|
||||||
- 8 -
Origination
and Servicing of Loans. All loans originated for investment are underwritten pursuant to internally developed policies and procedures. While we generally underwrite owner-occupied residential mortgage loans to Freddie Mac and Fannie Mae
standards, due to several unique characteristics, our loans originated prior to 2008 do not conform to the secondary market standards. The unique features of these loans include interest payments in advance of the month in which they are earned and
discretionary rate adjustments that are not tied to an independent index.
Exclusive of our mortgage banking operations, we retain in our portfolio all of the loans that we originate. At December
31, 2019, WaterStone Bank was not servicing any loan it originated and subsequently sold to unrelated third parties. Loan servicing includes collecting and remitting loan payments, accounting for principal and interest, contacting delinquent
mortgagors, supervising foreclosures and property dispositions in the event of unremedied defaults, making certain insurance and tax payments on behalf of the borrowers and generally administering the loans.
Loan
Approval Procedures and Authority. WaterStone Bank’s lending activities follow written, non-discriminatory, underwriting standards and
loan origination procedures established by WaterStone Bank’s board of directors. The loan approval process is intended to assess the borrower’s ability to repay the loan, the viability of the loan and the adequacy of the value of the property that
will secure the loan, if applicable. To assess the borrower’s ability to repay, we review the employment and credit history and information on the historical and projected income and expenses of borrowers.
Loan officers, with concurrence from independent credit officers and underwriters, are authorized to approve and close
any loan that qualifies under WaterStone Bank underwriting guidelines within the following lending limits:
|
●
|
A secured one- to four-family mortgage loan up to $500,000 for a borrower with total outstanding loans from us of less than $1.0
million that is independently underwritten can be approved by select loan officers.
|
|
●
|
A loan up to $500,000 for a borrower with total outstanding loans from us of less than $500,000 can be approved by select
commercial loan officers.
|
|
●
|
Any secured mortgage loan ranging from $500,001 to $3.0 million or any new loan to a borrower with outstanding loans from us
exceeding $1.0 million must be approved by the Officer Loan Committee.
|
|
●
|
Any non-real estate loan ranging from $500,001 to $3.0 million or any new non-real estate loan to a borrower with outstanding loans
exceeding $500,000 must be approved by the Officer Loan Committee.
|
|
●
|
Any new loan over $3.0 million must be approved by the Officer Loan Committee and the board of directors prior to closing. Any new
loan to a borrower with outstanding loans from us exceeding $10.0 million must be reviewed by the board of directors.
|
Asset Quality
When a loan becomes more than 30 days delinquent, WaterStone Bank sends a letter advising the borrower of the
delinquency. The borrower is given a specific date by which delinquent payments must be made or by which they must contact WaterStone Bank to make arrangements to bring the loan current over a longer period of time. If the borrower fails to bring
the loan current within the specified time period or to make arrangements to cure the delinquency over a longer period of time, the matter is referred to legal counsel and foreclosure or other collection proceedings are considered.
All loans are reviewed on a regular basis, and loans are placed on non-accrual status when they become 90 or more days
delinquent. When loans are placed on non-accrual status, unpaid accrued interest is reversed, and further income is recognized only to the extent received when collection of the remaining principal balance is reasonably assured.
Non-Performing
Assets. Non-performing assets consist of non-accrual loans and other real estate owned. Loans are generally placed on non-accrual status when contractually past due 90 days or more as to interest or principal payments. Additionally,
whenever management becomes aware of facts or circumstances that may adversely impact the collectability of principal or interest on loans, management may place such loans on non-accrual status immediately, rather than waiting until the loan becomes
90 days past due. At the time a loan is placed on non-accrual status, previously accrued and uncollected interest on such loans is reversed and additional income is recorded only to the extent that payments are received and the collection of
principal is reasonably assured. Generally, loans are restored to accrual status when the obligation is brought current, has performed in accordance with the contractual terms for a reasonable period of time, and the ultimate collectability of the
total contractual principal and interest is no longer in doubt.
- 9 -
The table below sets forth the amounts and categories of our non-accrual loans and real estate
owned at the dates indicated.
|
At December 31,
|
||||||||||||||||||||
|
2019
|
2018
|
2017
|
2016
|
2015
|
||||||||||||||||
|
(Dollars in Thousands)
|
||||||||||||||||||||
|
Non-accrual loans:
|
||||||||||||||||||||
|
Residential
|
||||||||||||||||||||
|
One- to four-family
|
$
|
5,985
|
$
|
4,902
|
$
|
4,677
|
$
|
7,623
|
$
|
13,888
|
||||||||||
|
Multi-family
|
667
|
1,309
|
1,007
|
1,427
|
2,553
|
|||||||||||||||
|
Home equity
|
70
|
201
|
107
|
344
|
437
|
|||||||||||||||
|
Construction and land
|
-
|
-
|
-
|
-
|
239
|
|||||||||||||||
|
Commercial real estate
|
303
|
125
|
251
|
422
|
460
|
|||||||||||||||
|
Commercial
|
-
|
18
|
26
|
41
|
27
|
|||||||||||||||
|
Consumer
|
-
|
-
|
-
|
-
|
-
|
|||||||||||||||
|
Total non-accrual loans
|
7,025
|
6,555
|
6,068
|
9,857
|
17,604
|
|||||||||||||||
|
Real estate owned
|
||||||||||||||||||||
|
One- to four-family
|
46
|
163
|
1,330
|
2,141
|
4,610
|
|||||||||||||||
|
Multi-family
|
-
|
-
|
-
|
-
|
209
|
|||||||||||||||
|
Construction and land
|
1,256
|
3,327
|
4,582
|
5,082
|
5,262
|
|||||||||||||||
|
Commercial real estate
|
-
|
300
|
300
|
300
|
300
|
|||||||||||||||
|
Total real estate owned
|
1,302
|
3,790
|
6,212
|
7,523
|
10,381
|
|||||||||||||||
|
Valuation allowance at end of period
|
(554
|
)
|
(1,638
|
)
|
(1,654
|
)
|
(1,405
|
)
|
(1,191
|
)
|
||||||||||
|
Total real estate owned, net
|
748
|
2,152
|
4,558
|
6,118
|
9,190
|
|||||||||||||||
|
Total non-performing assets
|
$
|
7,773
|
$
|
8,707
|
$
|
10,626
|
$
|
15,975
|
$
|
26,794
|
||||||||||
|
Total non-accrual loans to total loans, net
|
0.51
|
%
|
0.48
|
%
|
0.47
|
%
|
0.84
|
%
|
1.58
|
%
|
||||||||||
|
Total non-accrual loans to total assets
|
0.35
|
%
|
0.34
|
%
|
0.34
|
%
|
0.55
|
%
|
1.00
|
%
|
||||||||||
|
Total non-performing assets to total assets
|
0.39
|
%
|
0.45
|
%
|
0.59
|
%
|
0.89
|
%
|
1.52
|
%
|
||||||||||
All loans that meet or exceed 90 days with respect to past due principal and interest are recognized as non-accrual.
Troubled debt restructurings which are still on non-accrual status either due to being past due 90 days or greater, or which have not yet performed under the modified terms for a reasonable period of time, are included in the table above. In
addition, loans which are past due less than 90 days are evaluated to determine the likelihood of collectability given other credit risk factors such as early stage delinquency, the nature of the collateral or the results of a borrower fiscal review.
When the collection of all contractual principal and interest is determined to be unlikely, the loan is moved to non-accrual status and an updated appraisal of the underlying collateral is ordered. This process generally takes place between 60 and 90
days past contractual due dates. Upon determining the updated estimated value of the collateral, a loan loss provision is recorded to establish a specific reserve to the extent that the outstanding principal balance exceeds the updated estimated net
realizable value of the collateral. When a loan is determined to be uncollectible, generally coinciding with the initiation of foreclosure action, the specific reserve is reviewed for adequacy, adjusted if necessary, and charged-off.
The following table sets forth activity in our non-accrual loans for the years indicated.
|
At and for the Year Ended December 31,
|
||||||||||||||||||||
|
2019
|
2018
|
2017
|
2016
|
2015
|
||||||||||||||||
|
(Dollars in Thousands)
|
||||||||||||||||||||
|
Balance at beginning of year
|
$
|
6,555
|
$
|
6,068
|
$
|
9,857
|
$
|
17,604
|
$
|
38,011
|
||||||||||
|
Additions
|
3,716
|
3,147
|
3,149
|
3,114
|
10,165
|
|||||||||||||||
|
Transfers to real estate owned
|
(1,052
|
)
|
(545
|
)
|
(2,171
|
)
|
(4,590
|
)
|
(15,580
|
)
|
||||||||||
|
Charge-offs
|
(31
|
)
|
(6
|
)
|
(766
|
)
|
(667
|
)
|
(3,809
|
)
|
||||||||||
|
Returned to accrual status
|
(650
|
)
|
(777
|
)
|
(2,716
|
)
|
(4,183
|
)
|
(5,824
|
)
|
||||||||||
|
Principal paydowns
|
(1,513
|
)
|
(1,332
|
)
|
(1,285
|
)
|
(1,421
|
)
|
(5,359
|
)
|
||||||||||
|
Balance at end of year
|
$
|
7,025
|
$
|
6,555
|
$
|
6,068
|
$
|
9,857
|
$
|
17,604
|
||||||||||
- 10 -
Total non-accrual loans increased by $470,000, or 7.2%, to $7.0 million as of December 31, 2019 compared to $6.6 million
as of December 31, 2018. The ratio of non-accrual loans to total loans receivable was 0.51% at December 31, 2019 compared to 0.48% at December 31, 2018. During the year ended December 31, 2019, $1.1 million was transferred to real estate owned,
$31,000 in loan principal was charged off, $1.5 million in principal payments were received and $650,000 in loans were returned to accrual status. Offsetting this activity, $3.7 million in loans were placed on non-accrual status during the year ended
December 31, 2019.
Of the $7.0 million in total non-accrual loans as of December 31, 2019, $6.2 million in loans have been specifically
reviewed to assess whether a specific valuation allowance is necessary. A specific valuation allowance is established for an amount equal to the impairment when the carrying value of the loan exceeds the present value of expected future cash flows,
discounted at the loan’s original effective interest rate or the fair value of the underlying collateral with an adjustment made for costs to dispose of the asset. Based upon these specific reviews, a total of $1.6 million in partial charge-offs
have been recorded with respect to these loans as of December 31, 2019. Partially charged-off loans measured for impairment based upon net realizable collateral value are maintained in a “non-performing” status and are disclosed as impaired loans.
In addition, specific reserves totaling $39,000 have been recorded as of December 31, 2019. The remaining $862,000 of non-accrual loans were reviewed on an aggregate basis and $172,000 in general valuation allowance was deemed necessary related to
those loans as of December 31, 2019. The $172,000 in general valuation allowance is based upon a migration analysis performed with respect to similar non-accrual loans in prior periods.
The outstanding principal balance of our five largest non-accrual loans as of December 31, 2019 totaled $2.0 million,
which represents 22.0% of total non-accrual loans as of that date. These five loans did not have any charge-offs or require any specific valuation allowances as of December 31, 2019.
For the year ended December 31, 2019, gross interest income that would have been recorded had our non-accruing loans
been current in accordance with their original terms was $547,000. We received $468,000 of interest payments on such loans during the year ended December 31, 2019. Interest payments received are treated as interest income on a cash basis as long as
the remaining book value of the loan (i.e., after charge-off of all identified losses) is deemed to be fully collectible. If the remaining book value is not deemed to be fully collectible, all payments received are applied to unpaid principal.
Determination as to the ultimate collectability of the remaining book value is supported by an updated credit department evaluation of the borrower's financial condition and prospects for repayment, including consideration of the borrower's sustained
historical repayment performance and other relevant factors.
There were no accruing loans past due 90 days or more during the years ended December 31, 2019, 2018 or 2017.
Troubled Debt
Restructurings. The following table summarizes troubled debt restructurings by the Company’s internal risk rating.
|
At December 31,
|
||||||||||||||||||||
|
2019
|
2018
|
2017
|
2016
|
2015
|
||||||||||||||||
|
(Dollars in Thousands)
|
||||||||||||||||||||
|
Troubled debt restructurings
|
||||||||||||||||||||
|
Substandard
|
$
|
4,018
|
$
|
4,256
|
$
|
5,035
|
$
|
7,025
|
$
|
14,436
|
||||||||||
|
Watch
|
-
|
2,476
|
47
|
3,112
|
3,103
|
|||||||||||||||
|
Total troubled debt restructurings
|
$
|
4,018
|
$
|
6,732
|
$
|
5,082
|
$
|
10,137
|
$
|
17,539
|
||||||||||
Troubled debt restructurings totaled $4.0 million at December 31, 2019, compared to $6.7 million at December 31, 2018.
At December 31, 2019, $3.6 million of troubled debt restructurings, or 88.9%, were performing in accordance with their restructured terms. All troubled debt restructurings are considered to be impaired and are risk rated as either substandard or
watch and are included in the internal risk rating tables disclosed in the notes to the consolidated financial statements. Specific reserves have been established to the extent that the collateral-based impairment analyses indicate that a collateral
shortfall exists or to the extent that a discounted cash flow analysis results in an impairment.
We do not participate in government-sponsored troubled debt restructuring programs. Our troubled debt restructurings
are short-term modifications. Typical initial restructured terms include six to twelve months of principal forbearance, a reduction in interest rate or both. Restructured terms do not include a reduction of the outstanding principal balance unless
mandated by a bankruptcy court. Troubled debt restructuring terms may be renewed or further modified at the end of the initial term for an additional period if performance has been acceptable and the short-term borrower difficulty persists.
- 11 -
Information with respect to the accrual status of our troubled debt restructurings is provided in
the following table.
|
At December 31,
|
||||||||||||||||
|
2019
|
2018
|
|||||||||||||||
|
Accruing
|
Non-accruing
|
Accruing
|
Non-accruing
|
|||||||||||||
|
(In Thousands)
|
||||||||||||||||
|
One- to four-family
|
$
|
2,740
|
$
|
685
|
$
|
2,740
|
$
|
844
|
||||||||
|
Multi-family
|
-
|
308
|
-
|
372
|
||||||||||||
|
Commercial real estate
|
278
|
7
|
2,759
|
17
|
||||||||||||
|
$
|
3,018
|
$
|
1,000
|
$
|
5,499
|
$
|
1,233
|
|||||||||
The following table sets forth activity in our troubled debt restructurings for the years
indicated.
|
At or for the Year Ended December 31,
|
||||||||||||||||
|
2019
|
2018
|
|||||||||||||||
|
Accruing
|
Non-accruing
|
Accruing
|
Non-accruing
|
|||||||||||||
|
(In Thousands)
|
||||||||||||||||
|
Balance at beginning of year
|
$
|
5,499
|
$
|
1,233
|
$
|
3,077
|
$
|
2,005
|
||||||||
|
Additions
|
-
|
-
|
2,476
|
-
|
||||||||||||
|
Change in accrual status
|
-
|
-
|
-
|
-
|
||||||||||||
|
Charge-offs
|
-
|
-
|
-
|
-
|
||||||||||||
|
Returned to contractual/market terms
|
-
|
-
|
(46
|
)
|
-
|
|||||||||||
|
Transferred to real estate owned
|
-
|
-
|
-
|
-
|
||||||||||||
|
Principal paydowns
|
(2,481
|
)
|
(233
|
)
|
(8
|
)
|
(772
|
)
|
||||||||
|
Balance at end of period
|
$
|
3,018
|
$
|
1,000
|
$
|
5,499
|
$
|
1,233
|
||||||||
For the year ended December 31, 2019, gross interest income that would have been recorded had our troubled debt
restructurings been current in accordance with their contractual terms was $338,000. We received $310,000 of interest payments on such loans during the year ended December 31, 2019. Interest payments received on non-accrual troubled debt
restructurings are treated as interest income on a cash basis as long as the remaining book value of the loan (i.e., after charge-off of all identified losses) is deemed to be fully collectible. If the remaining book value is not deemed to be fully
collectible, all payments received are applied to unpaid principal. Determination as to the ultimate collectability of the remaining book value is supported by an updated credit department evaluation of the borrower's financial condition and
prospects for repayment, including consideration of the borrower's sustained historical repayment performance and other relevant factors.
If a restructured loan is current in all respects and a minimum of six consecutive restructured payments have been
received, it can be considered for return to accrual status. After a restructured loan that is current in all respects reverts to contractual/market terms, if a credit department review indicates no evidence of elevated market risk, the loan is
removed from the troubled debt restructuring classification. The restructured loan will be classified as a troubled debt restructuring for at least the calendar year after the modification even after returning to a contractual/market rate and accrual
status.
Loan
Delinquency. The following table summarizes loan delinquency in total dollars and as a percentage of the total loan portfolio:
|
At December 31,
|
||||||||
|
2019
|
2018
|
|||||||
|
(Dollars in Thousands)
|
||||||||
|
Loans past due less than 90 days
|
$
|
1,833
|
$
|
1,925
|
||||
|
Loans past due 90 days or more
|
4,632
|
5,025
|
||||||
|
Total loans past due
|
$
|
6,465
|
$
|
6,950
|
||||
|
Total loans past due to total loans receivable
|
0.47
|
%
|
0.50
|
%
|
||||
- 12 -
Past due loans decreased by $485,000, or 7.0%, to $6.5 million at December 31, 2019 from $7.0 million at December 31,
2018. Loans past due 90 days or more decreased by $393,000, or 7.8%, and loans past due less than 90 days decreased by $92,000, or 4.8%, during the year ended December 31, 2019. The $485,000 decrease in loans past due was primarily due to a
decrease in the multi family loans of $577,000 during the year ended December 31, 2019.
Potential
Problem Loans. We define potential problem loans as substandard loans which are still accruing interest. We do not necessarily expect to realize losses on potential problem loans, but we recognize potential problem loans carry a higher
probability of default and require additional attention by management. The aggregate principal amounts of potential problem loans as of December 31, 2019 and 2018 were $4.0 million and $4.5 million, respectively. Management believes it has
established an adequate allowance for probable loan losses as appropriate under generally accepted accounting principles.
Real
Estate Owned. Total real estate owned decreased by $1.4 million, or 65.2%, to $748,000 at December 31, 2019, compared to $2.2 million at December 31, 2018. During the year ended December 31, 2019, $1.1 million was transferred from loans
to real estate owned upon completion of foreclosure. During the same period, sales of real estate owned totaled $2.4 million. There were no write-downs during the year ended December 31, 2019.
New appraisals received on real estate owned and collateral dependent impaired loans are based upon an "as is value"
assumption. During the period of time in which we are awaiting receipt of an updated appraisal, loans evaluated for impairment based upon collateral value are measured by the following:
● Applying an updated adjustment factor to an existing appraisal;
● Confirming that the physical condition of the real estate has not significantly changed since
the last valuation date;
● Comparing the estimated current value of the collateral to that of updated sales values
experienced on similar collateral;
● Comparing the estimated current value of the collateral to that of updated values seen on
current appraisals of similar collateral; and
● Comparing the estimated current value to that of updated listed sales prices on our real estate
owned and that of similar properties (not owned by the Company).
We owned five properties at December 31, 2019, compared to 12 properties as of December 31, 2018 and 33 properties at
December 31, 2017. Habitable real estate owned is managed with the intent of attracting a lessee to generate revenue. Foreclosed properties are transferred to real estate owned at estimated net realizable value, with charge-offs, if any, charged to
the allowance for loan losses upon transfer to real estate owned. The fair value is primarily based upon updated appraisals in addition to an analysis of current real estate market conditions.
Allowance for Loan Losses
We establish valuation allowances on loans that are deemed to be impaired. A loan is considered impaired when, based on
current information and events, it is probable that we will not be able to collect all amounts due according to the contractual terms of the loan agreement. A valuation allowance is established for an amount equal to the impairment when the carrying
amount of the loan exceeds the present value of the expected future cash flows, discounted at the loan’s original effective interest rate or the fair value of the underlying collateral.
We also establish valuation allowances based on an evaluation of the various risk components that are inherent in the
loan portfolio. The risk components that are evaluated include past loan loss experience; the level of non-performing and classified assets; current economic conditions; volume, growth, and composition of the loan portfolio; adverse situations that
may affect the borrower’s ability to repay; the estimated value of any underlying collateral; regulatory guidance; and other relevant factors. The allowance is increased by provisions charged to earnings and recoveries of previously charged-off loans
and reduced by charge-offs. The appropriateness of the allowance for loan losses is reviewed and approved quarterly by the WaterStone Bank board of directors. The allowance reflects management’s best estimate of the amount needed to provide for the
probable loss on impaired loans and other inherent losses in the loan portfolio, and is based on a risk model developed and implemented by management and approved by the WaterStone Bank board of directors.
Actual results could differ from this estimate, and future additions to the allowance may be necessary based on
unforeseen changes in loan quality and economic conditions. In addition, the Federal Deposit Insurance Corporation and the WDFI, as an integral part of their examination process, periodically review WaterStone Bank’s allowance for loan losses. Such
regulators have the authority to require WaterStone Bank to recognize additions to the allowance based on their judgments of information available to them at the time of their review or examination.
Any loan that is 90 or more days past due is placed on non-accrual and classified as a non-performing loan. A loan is
classified as impaired when it is probable that we will be unable to collect all amounts due in accordance with the terms of the loan agreement. Non-performing loans are then evaluated and accounted for in accordance with generally accepted
accounting principles.
- 13 -
The following table sets forth activity in our allowance for loan losses for the years indicated.
|
At or for the Year
|
||||||||||||||||||||
|
Ended December 31,
|
||||||||||||||||||||
|
2019
|
2018
|
2017
|
2016
|
2015
|
||||||||||||||||
|
(Dollars in Thousands)
|
||||||||||||||||||||
|
Balance at beginning of year
|
$
|
13,249
|
$
|
14,077
|
$
|
16,029
|
$
|
16,185
|
$
|
18,706
|
||||||||||
|
Provision (credit) for loan losses
|
(900
|
)
|
(1,060
|
)
|
(1,166
|
)
|
380
|
1,965
|
||||||||||||
|
Charge-offs:
|
||||||||||||||||||||
|
Mortgage loans
|
||||||||||||||||||||
|
One- to four-family
|
125
|
69
|
1,364
|
1,003
|
3,855
|
|||||||||||||||
|
Multi-family
|
3
|
14
|
92
|
489
|
2,281
|
|||||||||||||||
|
Home equity
|
44
|
1
|
-
|
112
|
72
|
|||||||||||||||
|
Construction and land
|
-
|
-
|
14
|
3
|
84
|
|||||||||||||||
|
Commercial real estate
|
2
|
-
|
7
|
-
|
45
|
|||||||||||||||
|
Consumer
|
5
|
-
|
-
|
-
|
3
|
|||||||||||||||
|
Commercial
|
-
|
-
|
-
|
-
|
-
|
|||||||||||||||
|
Total charge-offs
|
179
|
84
|
1,477
|
1,607
|
6,340
|
|||||||||||||||
|
Recoveries:
|
||||||||||||||||||||
|
Mortgage loans
|
||||||||||||||||||||
|
One- to four-family
|
135
|
159
|
293
|
811
|
649
|
|||||||||||||||
|
Multi-family
|
30
|
89
|
208
|
152
|
992
|
|||||||||||||||
|
Home equity
|
27
|
26
|
26
|
36
|
110
|
|||||||||||||||
|
Construction and land
|
-
|
40
|
162
|
72
|
58
|
|||||||||||||||
|
Commercial real estate
|
25
|
2
|
1
|
-
|
40
|
|||||||||||||||
|
Consumer
|
-
|
-
|
1
|
-
|
5
|
|||||||||||||||
|
Commercial
|
-
|
-
|
-
|
-
|
-
|
|||||||||||||||
|
Total recoveries
|
217
|
316
|
691
|
1,071
|
1,854
|
|||||||||||||||
|
Net (recoveries) charge-offs
|
(38
|
)
|
(232
|
)
|
786
|
536
|
4,486
|
|||||||||||||
|
Allowance at end of year
|
$
|
12,387
|
$
|
13,249
|
$
|
14,077
|
$
|
16,029
|
$
|
16,185
|
||||||||||
|
Ratios:
|
||||||||||||||||||||
|
Allowance for loan losses to non-performing loans at end of year
|
176.33
|
%
|
202.12
|
%
|
231.99
|
%
|
162.62
|
%
|
91.94
|
%
|
||||||||||
|
Allowance for loan losses to loans outstanding at end of year
|
0.89
|
%
|
0.96
|
%
|
1.09
|
%
|
1.36
|
%
|
1.45
|
%
|
||||||||||
|
Net (recoveries) charge-offs to average loans outstanding
|
(0.00
|
%)
|
(0.02
|
%)
|
0.06
|
%
|
0.05
|
%
|
0.37
|
%
|
||||||||||
|
Current year provision (credit) for loan losses to net (recoveries) charge-offs
|
2,368.42
|
%
|
456.90
|
%
|
(148.35
|
%)
|
70.90
|
%
|
43.80
|
%
|
||||||||||
|
Net (recoveries) charge-offs to beginning of the year allowance
|
(0.29
|
%)
|
(1.65
|
%)
|
4.90
|
%
|
3.31
|
%
|
23.98
|
%
|
||||||||||
- 14 -
Allocation
of Allowance for Loan Losses. The following table sets forth the allowance for loan losses allocated by loan category, the total loan balances by category, and the percent of loans in each category to total loans at the dates indicated.
The allowance for loan losses allocated to each category is not necessarily indicative of future losses in any particular category and does not restrict the use of the allowance to absorb losses in other categories.
|
At December 31,
|
||||||||||||||||||||||||||||||||||||
|
2019
|
2018
|
2017
|
||||||||||||||||||||||||||||||||||
|
Allowance for Loan Losses
|
% of Loans in Category to Total Loans
|
% of Allowance in Category to Total Allowance
|
Allowance for Loan Losses
|
% of Loans in Category to Total Loans
|
% of Allowance in Category to Total Allowance
|
Allowance for Loan Losses
|
% of Loans in Category to Total Loans
|
% of Allowance in Category to Total Allowance
|
||||||||||||||||||||||||||||
|
(Dollars in Thousands)
|
||||||||||||||||||||||||||||||||||||
|
Real Estate:
|
||||||||||||||||||||||||||||||||||||
|
Residential
|
||||||||||||||||||||||||||||||||||||
|
One- to four-family
|
$
|
4,907
|
34.60
|
%
|
39.61
|
%
|
$
|
5,742
|
35.53
|
%
|
43.34
|
%
|
$
|
5,794
|
34.03
|
%
|
41.16
|
%
|
||||||||||||||||||
|
Multi-family
|
4,138
|
42.14
|
%
|
33.41
|
%
|
4,153
|
43.29
|
%
|
31.35
|
%
|
4,431
|
44.77
|
%
|
31.48
|
%
|
|||||||||||||||||||||
|
Home equity
|
201
|
1.30
|
%
|
1.62
|
%
|
325
|
1.45
|
%
|
2.45
|
%
|
356
|
1.64
|
%
|
2.53
|
%
|
|||||||||||||||||||||
|
Construction and land
|
610
|
2.67
|
%
|
4.92
|
%
|
400
|
0.97
|
%
|
3.02
|
%
|
949
|
1.54
|
%
|
6.74
|
%
|
|||||||||||||||||||||
|
Commercial real estate
|
2,145
|
17.05
|
%
|
17.32
|
%
|
2,126
|
16.35
|
%
|
16.05
|
%
|
1,881
|
15.16
|
%
|
13.36
|
%
|
|||||||||||||||||||||
|
Commercial
|
372
|
2.18
|
%
|
3.00
|
%
|
483
|
2.38
|
%
|
3.65
|
%
|
656
|
2.84
|
%
|
4.66
|
%
|
|||||||||||||||||||||
|
Consumer
|
14
|
0.06
|
%
|
0.11
|
%
|
20
|
0.03
|
%
|
0.15
|
%
|
10
|
0.02
|
%
|
0.07
|
%
|
|||||||||||||||||||||
|
Total allowance for loan losses
|
$
|
12,387
|
100.00
|
%
|
100.00
|
%
|
$
|
13,249
|
100.00
|
%
|
100.00
|
%
|
$
|
14,077
|
100.00
|
%
|
100.00
|
%
|
||||||||||||||||||
|
At December 31,
|
||||||||||||||||||||||||
|
2016
|
2015
|
|||||||||||||||||||||||
|
Allowance for Loan Losses
|
% of Loans in Category to Total Loans
|
% of Allowance in Category to Total Allowance
|
Allowance for Loan Losses
|
% of Loans in Category to Total Loans
|
% of Allowance in Category to Total Allowance
|
|||||||||||||||||||
|
(Dollars In Thousands)
|
||||||||||||||||||||||||
|
Real Estate:
|
||||||||||||||||||||||||
|
Residential
|
||||||||||||||||||||||||
|
One- to four-family
|
$
|
7,164
|
33.35
|
%
|
44.69
|
%
|
$
|
7,763
|
34.26
|
%
|
47.96
|
%
|
||||||||||||
|
Multi-family
|
4,809
|
47.42
|
%
|
30.00
|
%
|
5,000
|
49.08
|
%
|
30.89
|
%
|
||||||||||||||
|
Home equity
|
364
|
1.85
|
%
|
2.27
|
%
|
433
|
2.18
|
%
|
2.68
|
%
|
||||||||||||||
|
Construction and land
|
1,016
|
1.54
|
%
|
6.34
|
%
|
904
|
1.72
|
%
|
5.59
|
%
|
||||||||||||||
|
Commercial real estate
|
1,951
|
13.53
|
%
|
12.17
|
%
|
1,680
|
10.66
|
%
|
10.38
|
%
|
||||||||||||||
|
Commercial
|
713
|
2.28
|
%
|
4.45
|
%
|
396
|
2.07
|
%
|
2.45
|
%
|
||||||||||||||
|
Consumer
|
12
|
0.03
|
%
|
0.07
|
%
|
9
|
0.03
|
%
|
0.06
|
%
|
||||||||||||||
|
Total allowance for loan losses
|
$
|
16,029
|
100.00
|
%
|
100.00
|
%
|
$
|
16,185
|
100.00
|
%
|
100.00
|
%
|
||||||||||||
All impaired loans meeting the criteria established by management are evaluated individually, based primarily on the
value of the collateral securing each loan and the ability of the borrowers to repay according to the terms of the loans, or based upon an analysis of the present value of the expected future cash flows under the original contract terms as compared
to the modified terms in the case of certain troubled debt restructurings. Specific loss allowances are established as required by this analysis. At least once each quarter, management evaluates the appropriateness of the balance of the allowance
for loan losses based on several factors some of which are not loan specific, but are reflective of the inherent losses in the loan portfolio. This process includes, but is not limited to, a periodic review of loan collectability in light of
historical experience, the nature and volume of loan activity, conditions that may affect the ability of the borrower to repay, underlying value of collateral and economic conditions in our immediate market area. All loans for which a specific loss
review is not required are segregated by loan type and a loss allowance is established by using loss experience data and management’s judgment concerning other matters it considers significant including trends in non-performing loan balances,
impaired loan balances, classified asset balances and the current economic environment. The allowance is allocated to each category of loans based on the results of the above analysis.
- 15 -
Our underwriting policies and procedures emphasize that credit decisions must rely on both the credit quality of the
borrower and the estimated value of the underlying collateral. Credit quality is assured only when the estimated value of the collateral is objectively determined and is not subject to significant fluctuation.
The allowance for loan losses has been determined in accordance with generally accepted accounting principals (GAAP). We
are responsible for the timely and periodic determination of the amount of the allowance required. Any future provisions for loan losses will continue to be based upon our assessment of the overall loan portfolio and the underlying collateral, trends
in non-performing loans, current economic conditions and other relevant factors. To the best of management's knowledge, all probable losses have been provided for in the allowance for loan losses.
The establishment of the amount of the loan loss allowance inherently involves judgments by management as to the
appropriateness of the allowance, which ultimately may or may not be correct. Higher than anticipated rates of loan default would likely result in a need to increase provisions in future years.
At December 31, 2019, the allowance for loan losses was $12.4 million, compared to $13.2 million at December 31, 2018.
As of December 31, 2019, the allowance for loan losses to total loans receivable was 0.89% and 176.33% of non-performing loans, compared to 0.96%, and 202.12%, respectively at December 31, 2018. The decrease in the allowance for loan losses during
the year ended December 31, 2019 reflects a continued stabilization in the quality of the loan portfolio and continued improvement in the overall risk profile of the loan portfolio.
Net recoveries totaled $38,000, or less than 0.01% of average loans for the year ended December 31, 2019, compared to
net recoveries $232,000, or 0.02% of average loans for the year ended December 31, 2018. The $194,000 decrease in net recoveries was primarily the result of an increase in charge-offs in the one- to four-family and home equity loan categories offset
primarily by an increase in recoveries for the commercial real estate loan category. Net recoveries related to loans secured by one- to four-family residential loans decreased $80,000, to $10,000 in net recoveries for year ended December 31, 2019,
as compared to net recoveries of $90,000 for the year ended December 31, 2018. Net recoveries related to loans secured by multi-family loans decreased $48,000 to net recoveries of $27,000 for year ended December 31, 2019, as compared to net
recoveries of $75,000 for the year ended December 31, 2018. Net charge-offs related to loans secured by home equity loans increased $42,000, to net charge-offs of $17,000 for year ended December 31, 2019, as compared to net recoveries of $25,000 for
the year ended December 31, 2018. Net recoveries related to loans secured by construction and land loans decreased $40,000 to no net recoveries for year ended December 31, 2019, as compared to recoveries of $40,000 for the year ended December 31,
2018. Partially offsetting the increases in net charge-offs, net recoveries related to loans secured by commercial real estate loans increased $21,000, to net recoveries of $23,000 for year ended December 31, 2019, as compared to net recoveries of
$2,000 for the year ended December 31, 2018.
Mortgage Banking Activity
In addition to the lending activities previously discussed, we also originate single-family residential mortgage loans
for sale in the secondary market through Waterstone Mortgage Corporation. Waterstone Mortgage Corporation originated $2.92 billion in mortgage loans held for sale during the year ended December 31, 2019, which was an volume increase of $324.5
million, or 12.5%, from the $2.60 billion originated during the year ended December 31, 2018. The increase in loan production volume was driven by a 122.9% volume increase in refinance products and 1.0% increase in mortgage purchase products.
Total mortgage banking income increased $11.5 million, or 9.9%, to $126.9 million during the year ended December 31, 2019 compared to $115.4 million during the year ended December 31, 2018. Offsetting the increase in the volume of loans originated
and sold, gross margin on those loans originated and sold decreased approximately 1.9% for the year ended December 31, 2019 compared to December 31, 2018. Gross margin on those loans originated and sold is the ratio of mortgage banking income
(excluding the change in interest rate lock fair value) divided by total loan originations. We sell loans on both a servicing-released and a servicing retained basis. Waterstone Mortgage Corporation has contracted with a third party to service the
loans for which we retain servicing.
Our gross margin can be affected by the mix of both loan type (conventional loans versus governmental) and loan purpose
(purchase versus refinance). Conventional loans include loans that conform to Fannie Mae and Freddie Mac standards, whereas governmental loans are those loans guaranteed by the federal government, such as a Federal Housing Authority or U.S.
Department of Agriculture loan. Loans originated for the purchase of a residential property, which generally yield a higher margin than loans originated for refinancing existing loans, comprised 81.4% of total originations during the year ended
December 31, 2019, compared to 90.6% of total originations during the year ended December 31, 2018. The mix of loan type trended towards more governmental loans and less conventional loans comprising 30.5% and 69.5% of all loan originations,
respectively, during the year ended December 31, 2019, compared to 30.3% and 69.7% of all loan originations, respectively, during the year ended December 31, 2018.
Investment Activities
Wauwatosa Investments, Inc. is WaterStone Bank’s investment subsidiary headquartered in the State of Nevada. Wauwatosa Investments, Inc. manages the back office function for WaterStone Bank’s investment portfolio. Our Chief Financial Officer and Treasury
Officer are responsible for executing purchases and sales in accordance with our investment policy and monitoring the investment activities of Wauwatosa Investments, Inc. The investment policy is reviewed annually by management and changes to the
policy are recommended to and subject to the approval of WaterStone Bank's board of directors. Authority to make investments under the approved investment policy guidelines is delegated by the board to designated employees. While general investment
strategies are developed and authorized by management, the execution of specific actions rests with the Chief Financial Officer and Treasury Officer who may act jointly in performing security trades. The Chief Financial Officer and Treasury Officer
are responsible for ensuring that the guidelines and requirements included in the investment policy are followed and that all securities are considered prudent for investment. The Chief Financial Officer and the Treasury Officer are authorized to
execute investment transactions (purchases and sales) without the prior approval of the board provided they are within the scope of the established investment policy.
Our investment policy requires that all securities transactions be conducted in a safe and sound manner. Investment
decisions are based upon a thorough analysis of each security instrument to determine its quality, inherent risks, fit within our overall asset/liability management objectives, effect on our risk-based capital measurement and prospects for yield
and/or appreciation.
Consistent with our overall business and asset/liability management strategy, which focuses on sustaining adequate
levels of core earnings, our investment portfolio is comprised primarily of securities that are classified as available for sale. During the years ended December 31, 2019 and 2018, no investment securities were sold. During the year ended December
31, 2017, one municipal security with a total book value of $555,000 was sold at a loss of $107,000.
- 16 -
Available for Sale Portfolio
Mortgage-backed
Securities and Collateralized Mortgage Obligations. We purchase mortgage-backed securities and collateralized mortgage obligations guaranteed by Fannie Mae, Freddie Mac and Ginnie Mae. We invest in mortgage-backed securities and
collateralized mortgage obligations to achieve positive interest rate spreads with minimal administrative expense, and to lower our credit risk. We regularly monitor the credit quality of this portfolio.
Mortgage-backed securities and collateralized mortgage obligations are created by the pooling of mortgages and the
issuance of a security. These securities typically represent a participation interest in a pool of single-family or multi-family mortgages, although we focus our investments on mortgage related securities backed by one- to four-family mortgages.
The issuers of such securities pool and resell the participation interests in the form of securities to investors such as WaterStone Bank, and in the case of government agency sponsored issues, guarantee the payment of principal and interest to
investors. Mortgage-backed securities and collateralized mortgage obligations generally yield less than the loans that underlie such securities because of the cost of payment guarantees, if any, and credit enhancements. These fixed-rate securities
are usually more liquid than individual mortgage loans.
At December 31, 2019, mortgage-backed securities totaled $34.2 million. The mortgage-backed securities portfolio had a
weighted average yield of 2.59% and a weighted average remaining life of 4.6 years at December 31, 2019. The estimated fair value of our mortgage-backed securities portfolio at December 31, 2019 was $377,000 greater than the amortized cost of $33.8
million. Mortgage-backed securities valued at $1.2 million were pledged as collateral for mortgage banking activities as of December 31, 2019. Investments in mortgage-backed securities involve a risk that actual prepayments may differ from estimated
prepayments over the life of the security, which may require adjustments to the amortization of any premium or accretion of any discount relating to such instruments, thereby changing the net yield on such securities. There is also reinvestment risk
associated with the cash flows from such securities or if such securities are redeemed by the issuer. In addition, the fair value of such securities may be adversely affected in a rising interest rate environment, particularly since all of our
mortgage-backed securities have a fixed rate of interest. The relatively short weighted average remaining life of our mortgage-backed security portfolio mitigates our potential risk of loss in a rising interest rate environment.
At December 31, 2019, collateralized mortgage obligations totaled $81.8 million. At December 31, 2019, the
collateralized mortgage obligations portfolio consisted entirely of securities backed by government sponsored enterprises or U.S. Government agencies. The collateralized mortgage obligations portfolio had a weighted average yield of 2.64% and a
weighted average remaining life of 3.1 years at December 31, 2019. The estimated fair value of our collateralized mortgage obligations portfolio at December 31, 2019 was $522,000 greater than the amortized cost of $81.2 million. Investments in
collateralized mortgage obligations involve a risk that actual prepayments may differ from estimated prepayments over the life of the security, which may require adjustments to the amortization of any premium or accretion of any discount relating to
such instruments, thereby changing the net yield on such securities. There is also reinvestment risk associated with the cash flows from such securities or if such securities are redeemed by the issuer. In addition, the fair value of such securities
may be adversely affected in a rising interest rate environment, particularly since all of our collateralized mortgage obligations have a fixed rate of interest. The relatively short weighted average remaining life of our collateralized mortgage
obligation portfolio mitigates our potential risk of loss in a rising interest rate environment.
Municipal
Obligations. These securities consist of obligations issued by school districts, counties and municipalities or their agencies and include general obligation bonds, industrial development revenue bonds and other revenue bonds. Our
investment policy requires that such municipal obligations be rated A+ or better by a nationally recognized rating agency at the date of purchase. A security that is downgraded below investment grade will require additional analysis of
creditworthiness and a determination will be made to hold or dispose of the investment. We regularly monitor the credit quality of this portfolio. At December 31, 2019, our municipal obligations portfolio totaled $53.7 million, all of which was
classified as available for sale. The weighted average yield on this portfolio was 3.10% at December 31, 2019, with a weighted average remaining life of 4.3 years. The estimated fair value of our municipal obligations bond portfolio at December 31,
2019 was $1.8 million greater than the amortized cost of $51.9 million.
As of December 31, 2019, the Company identified one municipal security that was deemed to be other-than-temporarily
impaired. The security was issued by a tax incremental district in a municipality located in Wisconsin. During the year ended December 31, 2012, the Company received audited financial statements with respect to the municipal issuer that called into
question the ability of the underlying taxing district that issued the securities to operate as a going concern. During the year ended December 31, 2012, the Company’s analysis of the security in this municipality resulted in $77,000 in credit
losses that were charged to earnings with respect to this municipal security. An additional $17,000 credit loss was charged to earnings during the year ended December 31, 2014 with respect to this security as a sale occurred at a discounted price. As
of December 31, 2019, the remaining impaired bond had an amortized cost of $116,000 and a total life-to-date impairment of $94,000.
Other
Debt Securities. As of December 31, 2019, we held other debt securities with a fair value of $8.9 million and amortized cost of $10.0 million. Other debt securities consists of one corporate bond. The weighted average yield on this
portfolio was 1.39% at December 31, 2019, with a weighted average remaining life of 10.3 years. We regularly monitor the credit quality of this portfolio.
- 17 -
Investment Securities Portfolio.
The following table sets forth the carrying values of our available for sale securities
portfolio at the dates indicated.
|
At December 31,
|
||||||||||||||||||||||||
|
2019
|
2018
|
2017
|
||||||||||||||||||||||
|
Amortized
|
Amortized
|
Amortized
|
||||||||||||||||||||||
|
Cost
|
Fair Value
|
Cost
|
Fair Value
|
Cost
|
Fair Value
|
|||||||||||||||||||
|
(In Thousands)
|
||||||||||||||||||||||||
|
Securities available for sale:
|
||||||||||||||||||||||||
|
Mortgage-backed securities
|
$
|
33,773
|
$
|
34,150
|
$
|
42,105
|
$
|
41,631
|
$
|
57,351
|
$
|
57,435
|
||||||||||||
|
Collateralized mortgage obligations
|
||||||||||||||||||||||||
|
Government sponsored enterprise issued
|
81,232
|
81,754
|
75,923
|
74,955
|
61,313
|
60,500
|
||||||||||||||||||
|
Government sponsored enterprise bonds
|
-
|
-
|
-
|
-
|
2,500
|
2,497
|
||||||||||||||||||
|
Municipal obligations
|
51,898
|
53,692
|
55,242
|
55,948
|
62,516
|
63,769
|
||||||||||||||||||
|
Other debt securities
|
10,000
|
8,880
|
15,002
|
13,186
|
15,005
|
14,525
|
||||||||||||||||||
|
Certificates of deposit
|
-
|
-
|
-
|
-
|
980
|
981
|
||||||||||||||||||
|
Total securities available for sale
|
$
|
176,903
|
$
|
178,476
|
$
|
188,272
|
$
|
185,720
|
$
|
199,665
|
$
|
199,707
|
||||||||||||
The following table sets forth, by issuer, the amortized cost and estimated fair value of our investments in a single
issuer, as of December 31, 2019, that exceeded 10% of our stockholders’ equity as of that date.
|
At December 31, 2019
|
||||||||
|
Amortized Cost
|
Fair Value
|
|||||||
|
(In Thousands)
|
||||||||
|
Fannie Mae
|
$
|
67,644
|
$
|
68,166
|
||||
|
Freddie Mac
|
39,549
|
39,874
|
||||||
Portfolio
Maturities and Yields. The composition and maturities of the securities portfolio at December 31, 2019 are summarized in the following table. Maturities are based on the final contractual payment dates and do not reflect the impact of
prepayments or early redemptions that may occur. Municipal obligation yields have not been adjusted to a tax-equivalent basis. Certain mortgage related securities have interest rates that are adjustable and will reprice annually within the various
maturity ranges. These repricing schedules are not reflected in the table below.
|
One Year or Less
|
More than One Year through Five Years
|
More than Five Years through Ten Years
|
More than Ten Years
|
Total Securities
|
||||||||||||||||||||||||||||||||||||
|
Weighted
|
Weighted
|
Weighted
|
Weighted
|
Weighted
|
||||||||||||||||||||||||||||||||||||
|
Amortized
|
Average
|
Amortized
|
Average
|
Amortized
|
Average
|
Amortized
|
Average
|
Amortized
|
Average
|
|||||||||||||||||||||||||||||||
|
Cost
|
Yield
|
Cost
|
Yield
|
Cost
|
Yield
|
Cost
|
Yield
|
Cost
|
Yield
|
|||||||||||||||||||||||||||||||
|
(Dollars in Thousands)
|
||||||||||||||||||||||||||||||||||||||||
|
Securities available for sale:
|
||||||||||||||||||||||||||||||||||||||||
|
Mortgage-backed securities
|
$
|
1,311
|
2.97
|
%
|
$
|
25,606
|
2.47
|
%
|
$
|
1,472
|
2.75
|
%
|
$
|
5,384
|
3.03
|
%
|
$
|
33,773
|
2.59
|
%
|
||||||||||||||||||||
|
Collateralized mortgage obligations
|
||||||||||||||||||||||||||||||||||||||||
|
Government sponsored enterprise issued
|
815
|
2.24
|
%
|
76,309
|
2.63
|
%
|
4,108
|
2.79
|
%
|
-
|
-
|
81,232
|
2.64
|
%
|
||||||||||||||||||||||||||
|
Municipal obligations
|
3,449
|
2.18
|
%
|
33,200
|
2.94
|
%
|
14,615
|
3.71
|
%
|
634
|
5.51
|
%
|
51,898
|
3.10
|
%
|
|||||||||||||||||||||||||
|
Other debt securities
|
-
|
-
|
-
|
-
|
-
|
-
|
10,000
|
1.39
|
%
|
10,000
|
1.39
|
%
|
||||||||||||||||||||||||||||
|
Total securities available for sale
|
$
|
5,575
|
2.38
|
%
|
$
|
135,115
|
2.68
|
%
|
$
|
20,195
|
3.45
|
%
|
$
|
16,018
|
2.10
|
%
|
$
|
176,903
|
2.70
|
%
|
||||||||||||||||||||
- 18 -
Sources of Funds
General.
Deposits have traditionally been our primary source of funds for use in lending and investment activities. We also rely on advances from the Federal Home Loan Bank of Chicago and borrowings from other commercial banks in the form of repurchase
agreements collateralized by investment securities. In addition to deposits and borrowings, we derive funds from scheduled loan payments, investment maturities, loan prepayments, retained earnings and income on earning assets. While scheduled loan
payments and income on earning assets are relatively stable sources of funds, deposit inflows and outflows can vary widely and are influenced by prevailing market interest rates, economic conditions and competition from other financial institutions.
Deposits. A majority of our depositors are persons or businesses who work, reside, or are located in Milwaukee and Waukesha Counties and, to a lesser extent,
other southeastern Wisconsin communities. We offer a selection of deposit instruments, including checking, savings, money market deposit accounts, and fixed-term certificates of deposit. Deposit account terms vary, with the principal differences
being the minimum balance required, the amount of time the funds must remain on deposit and the interest rate. As of December 31, 2019, certificates of deposit comprised 69.3% of total customer deposits, and had a weighted average cost of 2.18% on
that date. Our reliance on certificates of deposit has resulted in a higher cost of funds than would otherwise be the case if demand deposits, savings and money market accounts made up a larger part of our deposit base. Development of our branch
network and expansion of our commercial products and services and aggressively seeking lower cost savings, checking and money market accounts are expected to result in decreased reliance on higher-cost certificates of deposit.
Interest rates paid, maturity terms, service fees and withdrawal penalties are established on a periodic basis. Deposit
rates and terms are based primarily on current operating strategies and market rates, liquidity requirements, rates paid by competitors and growth goals. To attract and retain deposits, we rely upon personalized customer service, long-standing
relationships and competitive interest rates. We also provide remote deposit capture, internet banking and mobile banking.
The flow of deposits is influenced significantly by general economic conditions, changes in money market and other
prevailing interest rates and competition. The variety of deposit accounts that we offer allows us to be competitive in obtaining funds and responding to changes in consumer demand. Based on historical experience, management believes our deposits
are relatively stable. The ability to attract and maintain money market accounts and certificates of deposit, and the rates paid on these deposits, has been and will continue to be significantly affected by market conditions. At December 31, 2019
and December 31, 2018, $739.8 million and $735.9 million of our deposit accounts were certificates of deposit, of which $665.7 million and $472.5 million, respectively, had remaining maturities of one year or less.
Deposits increased by $29.3 million, or 2.8%, from December 31, 2018 to December 31, 2019. The increase in deposits was
the result of a $25.4 million, or 8.4%, increase in total transaction accounts and a $3.9 million, or 0.5% increase in time deposits. The Company
had no deposits obtained directly from brokers as of December 31, 2019 and December 31, 2018.
The following table sets forth the distribution of total deposit accounts, by account type, at the dates indicated.
|
At December 31,
|
||||||||||||||||||||||||||||||||||||
|
2019
|
2018
|
2017
|
||||||||||||||||||||||||||||||||||
|
Average
|
Ending
Weighted
|
Average
|
Ending
Weighted
|
Average
|
Ending
Weighted
|
|||||||||||||||||||||||||||||||
|
Average
|
Cost of
|
Average
|
Average
|
Cost of
|
Average
|
Average
|
Cost of
|
Average
|
||||||||||||||||||||||||||||
|
Balance
|
Funds
|
Yield
|
Balance
|
Funds
|
Yield
|
Balance
|
Funds
|
Yield
|
||||||||||||||||||||||||||||
|
(Dollars in Thousands)
|
||||||||||||||||||||||||||||||||||||
|
Deposit type:
|
||||||||||||||||||||||||||||||||||||
|
Demand deposits
|
$
|
90,497
|
0.00
|
%
|
0.00
|
%
|
$
|
96,648
|
0.00
|
%
|
0.00
|
%
|
$
|
89,785
|
0.00
|
%
|
0.00
|
%
|
||||||||||||||||||
|
NOW accounts
|
36,926
|
0.09
|
%
|
0.07
|
%
|
37,388
|
0.09
|
%
|
0.07
|
%
|
36,716
|
0.08
|
%
|
0.08
|
%
|
|||||||||||||||||||||
|
Savings and escrow
|
72,872
|
0.05
|
%
|
0.04
|
%
|
77,454
|
0.04
|
%
|
0.04
|
%
|
78,788
|
0.04
|
%
|
0.04
|
%
|
|||||||||||||||||||||
|
Money market
|
125,155
|
0.97
|
%
|
1.05
|
%
|
95,306
|
0.60
|
%
|
0.38
|
%
|
92,519
|
0.40
|
%
|
0.31
|
%
|
|||||||||||||||||||||
|
Total transaction accounts
|
325,450
|
0.39
|
%
|
0.47
|
%
|
306,796
|
0.21
|
%
|
0.15
|
%
|
297,808
|
0.14
|
%
|
0.12
|
%
|
|||||||||||||||||||||
|
Certificates of deposit
|
737,397
|
2.17
|
%
|
2.18
|
%
|
709,102
|
1.55
|
%
|
2.01
|
%
|
671,982
|
1.09
|
%
|
1.31
|
%
|
|||||||||||||||||||||
|
Total deposits
|
$
|
1,062,847
|
1.62
|
%
|
1.65
|
%
|
$
|
1,015,898
|
1.15
|
%
|
1.46
|
%
|
$
|
969,790
|
0.80
|
%
|
0.96
|
%
|
||||||||||||||||||
- 19 -
At December 31, 2019, the aggregate balance of certificates of deposit of $100,000 or more was $299.6 million. The
following table sets forth the maturity of those certificates at December 31, 2019.
|
(In Thousands)
|
||||
|
Due in:
|
||||
|
Three months or less
|
$
|
61,876
|
||
|
Over three months through six months
|
56,942
|
|||
|
Over six months through 12 months
|
152,154
|
|||
|
Over 12 months
|
28,589
|
|||
|
Total
|
$
|
299,561
|
||
Borrowings.
Our borrowings at December 31, 2019 consisted of $470.0 million in advances from the Federal Home Loan Bank of Chicago and $13.6 million outstanding balance in short-term repurchase agreements used to fund loans held for sale. The following
table sets forth information concerning balances and interest rates on borrowings at the dates and for the periods indicated.
|
At or For the Year Ended
|
||||||||||||
|
December 31,
|
||||||||||||
|
2019
|
2018
|
2017
|
||||||||||
|
Borrowings:
|
(Dollars in Thousands)
|
|||||||||||
|
Balance outstanding at end of year
|
$
|
483,562
|
$
|
435,046
|
$
|
386,285
|
||||||
|
Weighted average interest rate at the end of year
|
2.11
|
%
|
2.01
|
%
|
1.57
|
%
|
||||||
|
Maximum amount of borrowings outstanding at any month end during the year
|
$
|
519,396
|
$
|
451,132
|
$
|
498,103
|
||||||
|
Average balance outstanding during the year
|
$
|
484,801
|
$
|
427,301
|
$
|
403,163
|
||||||
|
Weighted average interest rate during the year
|
2.12
|
%
|
1.85
|
%
|
2.14
|
%
|
||||||
Personnel
As of December 31, 2019, we had 824 full-time equivalent employees. A total of 197 are WaterStone Bank employees and
627 are employees of Waterstone Mortgage Corporation. Our employees are not represented by any collective bargaining group. Management believes that we have good working relations with our employees.
Supervision and Regulation
General
WaterStone Bank is a stock savings bank organized under the laws of the State of Wisconsin. The lending, investment, and
other business operations of WaterStone Bank are governed by Wisconsin law and regulations, as well as applicable federal law and regulations, and WaterStone Bank is prohibited from engaging in any operations not authorized by such laws and
regulations. WaterStone Bank is subject to extensive regulation, supervision and examination by the WDFI and by the Federal Deposit Insurance Corporation. This regulation and supervision establishes a comprehensive framework of activities in which
an institution may engage and is intended primarily for the protection of the Federal Deposit Insurance Corporation’s deposit insurance fund and depositors, and not for the protection of security holders. WaterStone Bank also is regulated to a
lesser extent by the Federal Reserve Board, governing reserves to be maintained against deposits and other matters. WaterStone Bank also is a member of and owns stock in the Federal Home Loan Bank of Chicago, which is one of the 11 regional banks in
the Federal Home Loan Bank System.
Under this system of regulation, the regulatory authorities have extensive discretion in connection with their
supervisory, enforcement, rulemaking and examination activities and policies, including rules or policies that: establish minimum capital levels; restrict the timing and amount of dividend payments; govern the classification of assets; determine the
adequacy of loan loss reserves for regulatory purposes; and establish the timing and amounts of assessments and fees. Moreover, as part of their examination authority, the banking regulators assign numerical ratings to banks and savings institutions
relating to capital, asset quality, management, liquidity, earnings and other factors. These ratings are inherently subjective and the receipt of a less than satisfactory rating in one or more categories may result in enforcement action by the
banking regulators against a financial institution. A less than satisfactory rating may also prevent a financial institution, such as WaterStone Bank or its holding company, from obtaining necessary regulatory approvals to access the capital markets,
pay dividends, acquire other financial institutions or establish new branches.
- 20 -
In addition, we must comply with significant anti-money laundering and anti-terrorism laws and regulations, Community
Reinvestment Act laws and regulations, and fair lending laws and regulations. Government agencies have the authority to impose monetary penalties and other sanctions on institutions that fail to comply with these laws and regulations, which could
significantly affect our business activities, including our ability to acquire other financial institutions or expand our branch network.
As a savings and loan holding company, Waterstone Financial is required to comply with the rules and regulations of the
Federal Reserve Board. It is required to file certain reports with the Federal Reserve Board and is subject to examination by and the enforcement authority of the Federal Reserve Board. Waterstone Financial is also subject to the rules and
regulations of the Securities and Exchange Commission under the federal securities laws.
Any change in applicable laws or regulations, whether by the WDFI, the Federal Deposit Insurance Corporation, the
Federal Reserve Board or Congress, could have a material adverse impact on the operations and financial performance of Waterstone Financial, WaterStone Bank and Waterstone Mortgage Corporation.
Set forth below is a brief description of material regulatory requirements that are or will be applicable to WaterStone
Bank, Waterstone Mortgage Corporation and Waterstone Financial. The description is limited to certain material aspects of the statutes and regulations addressed, and is not intended to be a complete description of such statutes and regulations and
their effects on WaterStone Bank, Waterstone Mortgage Corporation and Waterstone Financial.
Intrastate and Interstate Merger and Branching Activities
Wisconsin Law and
Regulation. Any Wisconsin savings bank meeting certain requirements may, upon approval of the WDFI, establish one or more branch offices in the state of Wisconsin and the states of Illinois, Indiana, Iowa, Kentucky, Michigan, Minnesota,
Missouri, and Ohio. In addition, upon WDFI approval, a Wisconsin savings bank may establish a branch office in any other state as the result of a merger or consolidation.
Federal Law and
Regulation. The Interstate Banking Act permits the federal banking agencies to, under certain circumstances, approve acquisition transactions between banks located in different states, regardless of whether an acquisition would be
prohibited under state law. The Interstate Banking Act, as amended, authorizes de novo branching into another state at locations at which banks
chartered by the host state could establish a branch.
Loans and Investments
Wisconsin Law and
Regulations. Under Wisconsin law and regulation, WaterStone Bank is authorized to make, invest in, sell, purchase, participate or otherwise deal in mortgage loans or interests in mortgage loans without geographic restriction, including
loans made on the security of residential and commercial property. Wisconsin savings banks also may lend funds on a secured or unsecured basis for business, commercial or agricultural purposes, provided the total of all such loans does not exceed 20%
of the savings bank’s total assets, unless the WDFI authorizes a greater amount. Loans are subject to certain other limitations, including percentage restrictions based on total assets.
Wisconsin savings banks may invest funds in certain types of debt and equity securities, including obligations of
federal, state and local governments and agencies. Subject to prior approval of the WDFI, compliance with capital requirements and certain other restrictions, Wisconsin savings banks may invest in residential housing development projects. Wisconsin
savings banks may also invest in service corporations or subsidiaries with the prior approval of the WDFI, subject to certain restrictions. Similarly, the line of credit that WaterStone Bank provides to Waterstone Mortgage Corporation is subject to
the approval of the WDFI.
Wisconsin savings banks may make loans and extensions of credit, both direct and indirect, to one borrower in amounts up
to 20% of the savings bank’s capital plus an additional 5% for loans fully secured by readily marketable collateral. In addition, and notwithstanding the 20% of capital and additional 5% of capital limitations set forth above, Wisconsin savings banks
may make loans to one borrower, or a related group of borrowers, for any purpose in an amount not to exceed $500,000, or to develop domestic residential housing units in an amount not to exceed the lesser of $30 million or 30% of the savings bank’s
capital, subject to certain conditions. At December 31, 2019, WaterStone Bank did not have any loans which exceeded the “loans-to-one borrower” limitations.
In addition, under Wisconsin law, WaterStone Bank must qualify for and maintain a level of qualified thrift investments
equal to 60% of its assets as prescribed in Section 7701(a)(19) of the Internal Revenue Code of 1986, as amended. A Wisconsin savings bank that fails to meet this qualified thrift lender test becomes subject to certain operating restrictions
otherwise applicable only to commercial banks. At December 31, 2019, WaterStone Bank maintained 86.7% of its assets in qualified thrift investments and therefore met the qualified thrift lender requirement.
Federal Law and
Regulation. Federal Deposit Insurance Corporation regulations also govern the equity investments of WaterStone Bank and, notwithstanding Wisconsin law and regulations, Federal Deposit Insurance Corporation regulations prohibit WaterStone
Bank from making certain equity investments and generally limit WaterStone Bank’s equity investments to those that are permissible for national banks and their subsidiaries. Under Federal Deposit Insurance Corporation regulations, WaterStone Bank
must obtain prior Federal Deposit Insurance Corporation approval before directly, or indirectly through a majority-owned subsidiary, engaging “as principal” in any activity that is not permissible for a national bank unless certain exceptions apply.
The activity regulations provide that state banks that meet applicable minimum capital requirements would be permitted to engage in certain activities that are not permissible for national banks, including certain real estate and securities
activities conducted through subsidiaries. The Federal Deposit Insurance Corporation will not approve an activity that it determines presents a significant risk to the Federal Deposit Insurance Corporation insurance fund. The current activities of
WaterStone Bank and its subsidiaries are permissible under applicable federal regulations.
Loans to, and other transactions with, affiliates of WaterStone Bank, such as Waterstone Financial, are restricted by
the Federal Reserve Act and regulations issued by the Federal Reserve Board thereunder. See “—Transactions with Affiliates and Insiders” below.
- 21 -
Lending Standards
Wisconsin Law and
Regulation. Wisconsin law and regulations issued by the WDFI impose on Wisconsin savings banks certain fairness in lending requirements and prohibit savings banks from discriminating against a loan applicant based upon the applicant’s
physical condition, developmental disability, sex, marital status, race, color, creed, national origin, religion or ancestry.
Federal Law and
Regulation. The federal banking agencies have adopted uniform regulations prescribing standards for extensions of credit that are secured by liens on interests in real estate or made for the purpose of financing the construction of a
building or other improvements to real estate. Under the joint regulations adopted by the federal banking agencies, all insured depository institutions, such as WaterStone Bank, must adopt and maintain written policies that establish appropriate
limits and standards for extensions of credit that are secured by liens or interests in real estate or are made for the purpose of financing permanent improvements to real estate. These policies must establish loan portfolio diversification
standards, prudent underwriting standards (including loan-to-value limits) that are clear and measurable, loan administration procedures, and loan documentation, approval and reporting requirements. The real estate lending policies must reflect
consideration of the Interagency Guidelines for Real Estate Lending Policies that have been adopted by the federal bank regulators.
The Interagency Guidelines, among other things, require a depository institution to establish internal loan-to-value
limits for real estate loans that are not in excess of the following supervisory limits:
|
●
|
for loans secured by raw land, the supervisory loan-to-value limit is 65% of the value of the collateral;
|
|
|
●
|
for land development loans (i.e., loans for the purpose of improving unimproved property prior to the erection of structures), the
supervisory limit is 75%;
|
|
|
●
|
for loans for the construction of commercial, over four-family or other non-residential property, the supervisory limit is 80%;
|
|
|
●
|
for loans for the construction of one- to four-family properties, the supervisory limit is 85%; and
|
|
|
●
|
for loans secured by other improved property (e.g., farmland, completed commercial property and other income-producing property,
including non-owner occupied, one- to four-family property), the limit is 85%.
|
Although no supervisory loan-to-value limit has been established for permanent mortgages on owner-occupied, one- to
four-family and home equity loans, the Interagency Guidelines state that for any such loan with a loan-to-value ratio that equals or exceeds 90% at origination, an institution should require appropriate credit enhancement in the form of either
mortgage insurance or readily marketable collateral.
Deposits
Wisconsin Law and
Regulation. Under Wisconsin law, WaterStone Bank is permitted to establish deposit accounts and accept deposits. WaterStone Bank’s board of directors, or its designee, determines the rate and amount of interest to be paid on or credited to
deposit accounts subject to Federal Deposit Insurance Corporation limitations.
Deposit Insurance
Wisconsin Law and
Regulation. Under Wisconsin law, WaterStone Bank is required to obtain and maintain insurance on its deposits from a deposit insurance corporation. The deposits of WaterStone Bank are insured up to the applicable limits by the Federal
Deposit Insurance Corporation.
Federal Law and
Regulation. WaterStone Bank is a member of the Deposit Insurance Fund, which is administered by the Federal Deposit Insurance Corporation. The Bank’s deposit accounts are insured by the Federal Deposit Insurance Corporation, generally up
to a maximum of $250,000.
The Federal Deposit Insurance Corporation imposes an assessment against all insured depository institutions. An
institution’s assessment rate depends upon the perceived risk of the institution to the Deposit Insurance Fund, with less risky institutions paying lower rates. Currently, assessments for institutions of less than $10 billion of total assets are
based on financial measures and supervisory ratings derived from statistical models estimating the probability of failure within three years. Assessment rates (inclusive of possible adjustments) currently range from 1.5 to 30 basis points of each
institution’s total assets less tangible capital. The Federal Deposit Insurance Corporation may increase or decrease the range of assessments uniformly, except that no adjustment can deviate more than two basis points from the base assessment rate
without notice and comment rulemaking. The existing system represents a change, required by the Dodd-Frank Act, from the Federal Deposit Insurance Corporation’s prior practice of basing the assessment on an institution’s aggregate deposits.
The Dodd-Frank Act increased the minimum target Deposit Insurance Fund ratio from 1.15% of estimated insured deposits to
1.35% of estimated insured deposits. The Federal Deposit Insurance Corporation was required to seek to achieve the 1.35% ratio by September 30, 2020. The Federal Deposit Insurance Corporation indicated that the 1.35% ratio was exceeded in November
2018. Insured institutions of less than $10 billion of assets will receive credits for the portion of their assessments that contributed to the reserve ratio between 1.15% and 1.35%. The Dodd-Frank Act eliminated the 1.5% maximum fund ratio, instead
leaving it to the discretion of the Federal Deposit Insurance Corporation, and the Federal Deposit Insurance Corporation has exercised that discretion by establishing a long-range fund ratio of 2%.
The Federal Deposit Insurance Corporation has the authority to increase insurance assessments. A significant increase in
insurance premiums would have an adverse effect on the operating expenses and results of operations of WaterStone Bank. We cannot predict what deposit insurance assessment rates will be in the future.
Insurance of deposits may be terminated by the Federal Deposit Insurance Corporation upon a finding that an institution
has engaged in unsafe or unsound practices, is in an unsafe or unsound condition to continue operations or has violated any applicable law, regulation, rule, order or condition imposed by the Federal Deposit Insurance Corporation. We do not know of
any practice, condition or violation that might lead to termination of deposit insurance.
- 22 -
Capitalization
Wisconsin Law and
Regulation. Wisconsin savings banks are required to maintain a minimum capital to assets ratio of 6% and must maintain total capital necessary to ensure the continuation of insurance of deposit accounts by the Federal Deposit Insurance
Corporation. If the WDFI determines that the financial condition, history, management or earning prospects of a savings bank are not adequate, the WDFI may require a higher minimum capital level for the savings bank. If a Wisconsin savings bank’s
capital ratio falls below the required level, the WDFI may direct the savings bank to adhere to a specific written plan established by the WDFI to correct the savings bank’s capital deficiency, as well as a number of other restrictions on the savings
bank’s operations, including a prohibition on the payment of dividends. At December 31, 2019, WaterStone Bank’s capital to assets ratio, as calculated under Wisconsin law, was 17.15%.
Federal Law and
Regulation. Federal regulations require Federal Deposit Insurance Corporation insured depository institutions to meet several minimum capital standards: a common equity Tier 1 capital to risk-based assets ratio of 4.5%, a Tier 1 capital to
risk-based assets ratio of 6.0%, a total capital to risk-based assets of 8.0%, and a 4.0% Tier 1 capital to total assets leverage ratio.
Common equity Tier 1 capital is generally defined as common stockholders’ equity and retained earnings. Tier 1 capital
is generally defined as common equity Tier 1 and additional Tier 1 capital. Additional Tier 1 capital includes certain noncumulative perpetual preferred stock and related surplus and minority interests in equity accounts of consolidated
subsidiaries. Total capital includes Tier 1 capital (common equity Tier 1 capital plus additional Tier 1 capital) and Tier 2 capital. Tier 2 capital is comprised of capital instruments and related surplus, meeting specified requirements, and may
include cumulative preferred stock and long-term perpetual preferred stock, mandatory convertible securities, intermediate preferred stock and subordinated debt. Also included in Tier 2 capital is the allowance for loan and lease losses limited to a
maximum of 1.25% of risk-weighted assets and, for institutions that have exercised an opt-out election regarding the treatment of Accumulated Other Comprehensive Income (“AOCI”), up to 45% of net unrealized gains on available-for-sale equity
securities with readily determinable fair market values. Institutions that have not exercised the AOCI opt-out have AOCI incorporated into common equity Tier 1 capital (including unrealized gains and losses on available-for-sale-securities).
WaterStone Bank exercised its AOCI opt-out election. Calculation of all types of regulatory capital is subject to deductions and adjustments
specified in the regulations.
In determining the amount of risk-weighted assets for purposes of calculating risk-based capital ratios, all assets,
including certain off-balance sheet assets (e.g., recourse obligations, direct credit substitutes, residual interests) are multiplied by a risk weight factor
assigned by the regulations based on the risks believed inherent in the type of asset. Higher levels of capital are required for asset categories believed to present greater risk. For example, a risk weight of 0% is assigned to cash and U.S.
government securities, a risk weight of 50% is generally assigned to prudently underwritten first lien one to four- family residential real estate loans, a risk weight of 100% is assigned to commercial and consumer loans, a risk weight of 150% is
assigned to certain past due loans and a risk weight of between 0% to 600% is assigned to permissible equity interests, depending on certain specified factors.
In addition to establishing the minimum regulatory capital requirements, the regulations limit capital distributions and
certain discretionary bonus payments to management if the institution does not hold a “capital conservation buffer” consisting of 2.5% of common equity Tier 1 capital to risk-weighted asset above the amount necessary to meet its minimum risk-based
capital requirements. The capital conservation buffer requirement was phased in beginning January 1, 2016 until fully implemented at 2.5% on January 1, 2019.
In assessing an institution’s capital adequacy, the Federal Deposit Insurance Corporation takes into consideration, not
only these numeric factors, but qualitative factors as well, including the bank’s exposure to interest rate risk. The Federal Deposit Insurance Corporation has the authority to establish higher capital requirements for individual institutions where
deemed necessary due to a determination that an institution’s capital level is, or is likely to become, inadequate in light of particular circumstances.
Legislation enacted in May 2018 required the federal banking agencies, including the Federal Deposit Insurance
Corporation, to establish an optional “community bank leverage ratio” of between 8% to 10% of average total consolidated assets for qualifying institutions with assets of less than $10 billion of assets. Institutions with capital meeting the
specified requirement and electing to follow the alternative framework would be deemed to comply with the applicable regulatory capital requirements, including the risk-based requirements. The federal regulators issued a final rule, effective
January 1, 2020, that set the elective community bank leverage ratio at 9% tier 1 capital to average total consolidated assets.
Safety and Soundness Standards
Each federal banking agency, including the Federal Deposit Insurance Corporation, has adopted guidelines establishing
general standards relating to internal controls, internal audit systems, loan documentation, credit underwriting, interest rate exposure, asset growth, asset quality, earnings and compensation, fees and benefits, and information security. In general,
the guidelines require, among other things, appropriate systems and practices to identify and manage the risks and exposures specified in the guidelines. The guidelines prohibit excessive compensation as an unsafe and unsound practice and describe
compensation as excessive when the amounts paid are unreasonable or disproportionate to the services performed by an executive officer, employee, director, or principal shareholder.
Prompt Corrective Regulatory Action
Federal bank regulatory authorities are required to take "prompt corrective action" with respect to institutions that do
not meet minimum capital requirements. For these purposes, the statute establishes five capital categories: well capitalized, adequately capitalized, undercapitalized, significantly undercapitalized, and critically undercapitalized. Under the
regulations, a bank is deemed to be (i) "well capitalized" if it has total risk-based capital of 10.0% or more, has a Tier 1 risk-based capital ratio of 8.0% or more, has a Tier 1 leverage capital ratio of 5.0% or more and a common equity Tier 1
ratio of 6.5% or more, and is not subject to any written capital order or directive; (ii) "adequately capitalized" if it has a total risk-based capital ratio of 8.0% or more, a Tier 1 risk-based capital ratio of 6.0% or more, a Tier 1 leveraged
capital ratio of 4.0% or more and a common equity Tier 1 ratio of 4.5% or more, and does not meet the definition of "well capitalized"; (iii) "undercapitalized" if it has a total risk-based capital ratio that is less than 8.0%, a Tier 1 risk-based
capital ratio that is less than 6.0%, a Tier 1 leverage capital ratio that is less than 4.0% or a common equity Tier 1 ratio of less than 4.5%; (iv) "significantly undercapitalized" if it has a total risk-based capital ratio that is less than 6.0%
and a Tier 1 risk-based capital ratio that is less than 4.0% or a common equity Tier 1 ratio of less than 3.0%; and (v) "critically undercapitalized" if it has a ratio of tangible equity to total assets that is equal to or less than 2.0%.
Federal law and regulations also specify circumstances under which a federal banking agency may reclassify a well
capitalized institution as adequately capitalized and may require an institution classified as less than well capitalized to comply with supervisory actions as if it were in the next lower category (except that the Federal Deposit Insurance
Corporation may not reclassify a significantly undercapitalized institution as critically undercapitalized).
- 23 -
The Federal Deposit Insurance Corporation may order savings banks that have insufficient capital to take corrective
actions. For example, a savings bank that is categorized as “undercapitalized” is subject to growth limitations and is required to submit a capital restoration plan, and a holding company that controls such a savings bank is required to guarantee
that the savings bank complies with the restoration plan. A “significantly undercapitalized” savings bank may be subject to additional restrictions. Savings banks deemed by the Federal Deposit Insurance Corporation to be “critically undercapitalized”
would be subject to the appointment of a receiver or conservator.
At December 31, 2019, WaterStone Bank was considered well-capitalized with a common equity Tier 1 ratio of 22.05%, Tier
1 leverage ratio of 17.11%, a Tier 1 risk-based ratio of 22.05% and a total risk based capital ratio of 22.85%.
The previously referenced final rule that establishes an elective community bank leverage ratio provides that a
qualifying institution whose tier 1 capital equals or exceeds the specified community bank leverage ratio and opts into that framework will be considered well capitalized for prompt corrective action purposes.
Banking regulators addressed the regulatory capital treatment of credit loss allowance under Accounting Standard Update
(ASU) No. 2016-13, "Financial Instruments - Credit Losses (Topic 326): Measurement of Credit Losses on Financial Instruments" (CECL) methodology by allowing banking organizations an option to phase in the day-one regulatory capital effects. See Note
1 for the section "Recent Accounting Pronouncements" for additional information regarding the adoption of this standard.
Dividends
Under Wisconsin law and applicable regulations, a Wisconsin savings bank that meets its regulatory capital requirements
may declare dividends on capital stock based upon net profits, provided that its paid-in surplus equals its capital stock. In addition, prior WDFI approval is required before dividends exceeding 50% of net profits for any calendar year may be
declared and before a stock dividend may be declared out of retained earnings. Under WDFI regulations, a Wisconsin savings bank which has converted from mutual to stock form also is prohibited from paying a dividend on its capital stock if the
payment causes the regulatory capital of the savings bank to fall below the amount required for its liquidation account.
The Federal Deposit Insurance Corporation has the authority to prohibit WaterStone Bank from paying dividends if, in its
opinion, the payment of dividends would constitute an unsafe or unsound practice in light of the financial condition of WaterStone Bank. Institutions may not pay dividends if they would be “undercapitalized” following payment of the dividend within
the meaning of the prompt corrective action regulations.
Information with respect to regulation regarding dividends declared and paid by Waterstone Financial is disclosed under
"Holding Company Dividends."
Liquidity and Reserves
Wisconsin Law and
Regulation. Under WDFI regulations, all Wisconsin savings banks are required to maintain a certain amount of their assets as liquid assets, consisting of cash and certain types of investments. The exact amount of assets a savings bank is
required to maintain as liquid assets is set by the WDFI, but generally ranges from 4% to 15% of the savings bank’s average daily balance of net withdrawable accounts plus short-term borrowings (the “Required Liquidity Ratio”). At December 31, 2019,
WaterStone Bank’s Required Liquidity Ratio was 8.0%, and WaterStone Bank was in compliance with this requirement. In addition, 50% of the liquid assets maintained by a Wisconsin savings bank must consist of “primary liquid assets,” which are defined
to include securities issued by the United States Government, United States Government agencies, or the state of Wisconsin or a subdivision thereof, and cash. At December 31, 2019, WaterStone Bank was in compliance with this requirement.
Federal Law and
Regulation. Under federal law and regulations, WaterStone Bank is required to maintain sufficient liquidity to ensure safe and sound banking practices. Regulation D, promulgated by the Federal Reserve Board, imposes reserve requirements on
all depository institutions, including WaterStone Bank, which maintain transaction accounts or non-personal time deposits. Checking accounts, NOW accounts, Super NOW checking accounts, and certain other types of accounts that permit payments or
transfers to third parties fall within the definition of transaction accounts and are subject to Regulation D reserve requirements, as are any non-personal time deposits (including certain money market deposit accounts) at a savings institution. For
2019, a depository institution was required to maintain average daily reserves equal to 3% on the first $124.2 million of transaction accounts, plus 10% of that portion of total transaction accounts in excess of $124.2 million. The first $16.3
million of otherwise reservable balances was exempt from the reserve requirements. These percentages and threshold limits are subject to annual adjustment by the Federal Reserve Board and increased to a threshold of $127.5 million and an exemption
of $16.3 million for 2020. As of December 31, 2019, WaterStone Bank met its Regulation D reserve requirements.
- 24 -
Transactions with Affiliates and Insiders
Wisconsin Law and
Regulation. Under Wisconsin law, a savings bank may not make a loan to a person owning 10% or more of its stock, an affiliated person (including a director, officer, the spouse of either and a member of the immediate family of such person
who is living in the same residence), agent, or attorney of the savings bank, either individually or as an agent or partner of another, except as under the rules of the WDFI and regulations of the Federal Deposit Insurance Corporation. In addition,
unless the prior approval of the WDFI is obtained, a savings bank may not purchase, lease or acquire a site for an office building or an interest in real estate from an affiliated person, including a shareholder owning more than 10% of its capital
stock, or from any firm, corporation, entity or family in which an affiliated person or 10% shareholder has a direct or indirect interest.
Federal Law and
Regulation. Sections 23A and 23B of the Federal Reserve Act govern transactions between an insured savings bank, such as WaterStone Bank, and any of its affiliates, including Waterstone Financial. The Federal Reserve Board has adopted
Regulation W, which comprehensively implements and interprets Sections 23A and 23B, in part by codifying prior Federal Reserve Board interpretations under Sections 23A and 23B.
An affiliate of a savings bank is any company or entity that controls, is controlled by or is under common control with
the savings bank. A subsidiary of a savings bank that is not also a depository institution or a “financial subsidiary” under federal law is not treated as an affiliate of the savings bank for the purposes of Sections 23A and 23B; however, the Federal
Deposit Insurance Corporation has the discretion to treat subsidiaries of a savings bank as affiliates on a case-by-case basis. Sections 23A and 23B limit the extent to which a savings bank or its subsidiaries may engage in “covered transactions”
with any one affiliate to an amount equal to 10% of such savings bank’s capital stock and surplus, and limit all such transactions with all affiliates to an amount equal to 20% of such capital stock and surplus. The term “covered transaction”
includes the making of loans, purchase of assets, issuance of guarantees and other similar types of transactions. Further, most loans and other extensions of credit by a savings bank to any of its affiliates must be secured by collateral in amounts
ranging from 100% to 130% of the loan amounts, depending on the type of collateral. In addition, any affiliate transaction by a savings bank must be on terms that are substantially the same, or at least as favorable, to the savings bank as those that
would be provided to a non-affiliate, and be consistent with safe and sound banking practices.
A savings bank’s loans to its executive officers, directors, any owner of more than 10% of its stock (each, an insider)
and any of certain entities affiliated with any such person (an insider’s related interest) are subject to the conditions and limitations imposed by Section 22(h) of the Federal Reserve Act and the Federal Reserve Board’s Regulation O thereunder.
Under these restrictions, the aggregate amount of the loans to any insider and the insider’s related interests may not exceed the loans-to-one-borrower limit applicable to national banks, (which is generally 15% of capital and surplus). Aggregate
loans by a savings bank to its insiders and insiders’ related interests in the aggregate may not exceed the savings bank’s unimpaired capital and unimpaired surplus. With certain exceptions, loans to an executive officer, other than loans for the
education of the officer’s children and certain loans secured by the officer’s primary residence, may not exceed the greater of $25,000 or 2.5% of the savings bank’s unimpaired capital and unimpaired surplus, but in no event more than $100,000.
Regulation O also requires that any proposed loan to an insider or a related interest of that insider be approved in advance by a majority of the board of directors of the savings bank, with any interested director not participating in the voting, if
such loan, when aggregated with any existing loans to that insider and the insider’s related interests, would exceed either $500,000 or the greater of $25,000 or 5% of the savings bank’s unimpaired capital and surplus. Generally, such loans must be
made on substantially the same terms as, and follow credit underwriting procedures that are no less stringent than, those that are prevailing at the time for comparable transactions with other persons and must not present more than a normal risk of
collectability.
An exception to the requirement is made for extensions of credit made pursuant to a benefit or compensation plan of a
bank that is widely available to employees of the savings bank and that does not give any preference to insiders of the bank over other employees of the bank. Consistent with these requirements, the Bank offered employees special terms for home
mortgage loans on their principal residences. Effective April 1, 2006, this program was discontinued for new loan originations. Under the terms of the discontinued program, the employee interest rate is based on the Bank’s cost of funds on December
31st of the immediately preceding year and is adjusted annually. At December 31, 2019, the rate of interest on an employee rate mortgage loan was 1.62%, compared to the weighted average rate of 4.54% on all single family mortgage loans. This rate
increased to 1.73% effective March 1, 2020. Employee rate mortgage loans totaled $1.0 million, or 0.3%, of our single family residential mortgage loan portfolio on December 31, 2019.
Transactions between Bank Customers and Affiliates
Wisconsin savings banks, such as WaterStone Bank, are subject to the prohibitions on certain tying arrangements. Subject
to certain exceptions, a savings bank is prohibited from extending credit to or offering any other service to a customer, or fixing or varying the consideration for such extension of credit or service, on the condition that such customer obtain some
additional service from the institution or certain of its affiliates or not obtain services of a competitor of the institution.
Examinations and Assessments
WaterStone Bank is required to file periodic reports with and is subject to periodic examinations by the WDFI and
FDIC. WaterStone Bank is required to pay examination fees and annual assessments to fund its supervision. Federal regulations require annual on-site examinations for all depository institutions except certain well-capitalized and highly rated
institutions with assets of less than $3 billion which are examined every 18 months.
Customer Privacy
Under Wisconsin and federal law and regulations, savings banks, such as WaterStone Bank, are required to develop and
maintain privacy policies relating to information on its customers, restrict access to and establish procedures to protect customer data. Applicable privacy regulations further restrict the sharing of non-public customer data with non-affiliated
parties if the customer requests.
- 25 -
Community Reinvestment Act
Under the Community Reinvestment Act, WaterStone Bank has a continuing and affirmative obligation consistent with its
safe and sound operation to help meet the credit needs of its entire community, including low and moderate income neighborhoods. The Community Reinvestment Act does not establish specific lending requirements or programs for financial institutions
nor does it limit an institution’s discretion to develop the types of products and services that it believes are best suited to its particular community, consistent with the Community Reinvestment Act. The Community Reinvestment Act requires the
Federal Deposit Insurance Corporation, in connection with its examination of WaterStone Bank, to assess WaterStone Bank’s record of meeting the credit needs of its community and to take that record into account in the Federal Deposit Insurance
Corporation’s evaluation of certain applications by WaterStone Bank. For example, the regulations specify that a bank’s Community Reinvestment Act performance will be considered in its expansion (e.g., branching or merger) proposals and may be the
basis for approving, denying or conditioning the approval of an application. As of the date of its most recent regulatory examination, WaterStone Bank was rated “satisfactory” with respect to its Community Reinvestment Act compliance.
Federal Home Loan Bank System
The Federal Home Loan Bank System, consisting of 11 Federal Home Loan Banks, is under the jurisdiction of the Federal
Housing Finance Board. The designated duties of the Federal Housing Finance Board are to supervise the Federal Home Loan Banks; ensure that the Federal Home Loan Banks carry out their housing finance mission; ensure that the Federal Home Loan Banks
remain adequately capitalized and able to raise funds in the capital markets; and ensure that the Federal Home Loan Banks operate in a safe and sound manner.
WaterStone Bank, as a member of the Federal Home Loan Bank of Chicago, is required to acquire and hold shares of capital
stock in the Federal Home Loan Bank of Chicago in specified amounts. WaterStone Bank is in compliance with this requirement with an investment in Federal Home Loan Bank of Chicago stock of $21.1 million at December 31, 2019.
Among other benefits, the Federal Home Loan Banks provide a central credit facility primarily for member institutions.
It is funded primarily from proceeds derived from the sale of consolidated obligations of the Federal Home Loan Bank System. It makes advances to members in accordance with policies and procedures established by the Federal Housing Finance Board and
the board of directors of the Federal Home Loan Bank of Chicago. At December 31, 2019, WaterStone Bank had $470.0 million in advances from the Federal Home Loan Bank of Chicago.
USA PATRIOT Act
The USA PATRIOT Act gives the federal government powers to address terrorist threats through enhanced domestic security
measures, expanded surveillance powers, increased information sharing and broadened anti-money laundering requirements. The USA PATRIOT Act also required the federal banking agencies to take into consideration the effectiveness of controls designed
to combat money laundering activities in determining whether to approve a merger or other acquisition application of a member institution. Accordingly, if we engage in a merger or other acquisition, our controls designed to combat money laundering
would be considered as part of the application process. We have established policies, procedures and systems designed to comply with these regulations.
Regulation of Waterstone Mortgage Corporation
Waterstone Mortgage Corporation is subject to numerous federal, state and local laws and regulations and may be subject
to various judicial and administrative decisions imposing various requirements and restrictions on its business. These laws, regulations and judicial and administrative decisions to which Waterstone Mortgage Corporation is subject include those
pertaining to: real estate settlement procedures; fair lending; fair credit reporting; truth in lending; compliance with net worth and financial statement delivery requirements; compliance with federal and state disclosure and licensing requirements;
the establishment of maximum interest rates, finance charges and other charges; secured transactions; collection, foreclosure, repossession and claims-handling procedures; other trade practices and privacy regulations providing for the use and
safeguarding of non-public personal financial information of borrowers; and guidance on non-traditional mortgage loans issued by the federal financial regulatory agencies. Waterstone Mortgage Corporation may also be required to comply with any
additional requirements that its customers may be subject to by their regulatory authorities.
Holding Company Regulation
Waterstone Financial is a unitary savings and loan holding company subject to regulation and supervision by the Federal
Reserve Board. The Federal Reserve Board has enforcement authority over Waterstone Financial and its non-savings institution subsidiaries. Among other things, this authority permits the Federal Reserve Board to restrict or prohibit activities that
are determined to be a risk to WaterStone Bank. In addition, any company that owns or controls, directly or indirectly, more than 25% of the voting securities of a state savings bank is subject to regulation as a savings bank holding company by the
WDFI. Waterstone Financial is subject to regulation as a savings bank holding company under Wisconsin law. However, the WDFI has not issued specific regulations governing savings bank holding companies.
As a savings and loan holding company, Waterstone Financial’s activities are limited to those activities permissible by
law for financial holding companies (if Waterstone Financial makes an election to be treated as a financial holding company and meets the other requirements to be a financial holding company) or multiple savings and loan holding companies. A
financial holding company may engage in activities that are financial in nature, incidental to financial activities or complementary to a financial activity. Such activities include lending and other activities permitted for bank holding companies,
insurance and underwriting equity securities. Multiple savings and loan holding companies are authorized to engage in activities specified by federal regulation.
- 26 -
Federal law prohibits a savings and loan holding company, directly or indirectly, or through one or more subsidiaries,
from acquiring more than 5% of another savings institution or savings and loan holding company without prior written approval of the Federal Reserve Board, and from acquiring or retaining control of any depository institution not insured by the
Federal Deposit Insurance Corporation. In evaluating applications by holding companies to acquire savings institutions, the Federal Reserve Board must consider such things as the financial and managerial resources and future prospects of the company
and institution involved, the effect of the acquisition on and the risk to the federal deposit insurance fund, the convenience and needs of the community and competitive factors. A savings and loan holding company may not acquire a savings
institution in another state and hold the target institution as a separate subsidiary unless it is a supervisory acquisition under Section 13(k) of the Federal Deposit Insurance Act or the law of the state in which the target is located authorizes
such acquisitions by out-of-state companies.
The Dodd-Frank Act required the Federal Reserve Board to impose upon bank and savings and loan holding companies
consolidated regulatory capital requirements that are equally stringent as those applicable to the subsidiary depository institutions. However, legislation enacted in May 2018 required the Federal Reserve Board to raise the asset size threshold of
its “small holding company” exception to the applicability of consolidated holding company capital requirements from $1 billion to $3 billion. That change became effective in 2018. Consequently, holding companies with less than $3 billion of
consolidated assets, such as Waterstone Financial, are generally not subject to the requirements unless otherwise advised by the Federal Reserve Board.
The Dodd-Frank Act extended the "source of strength" doctrine to savings and loan holding companies. The Federal Reserve
Board promulgated regulations implementing the "source of strength" policy, which requires holding companies to act as a source of strength to their subsidiary depository institutions by providing capital, liquidity and other support in times of
financial stress.
The Federal Reserve Board has issued a policy statement regarding the payment of dividends and the repurchase of shares
of common stock by bank holding companies and savings and loan holding companies. In general, the policy provides that dividends should be paid only out of current earnings and only if the prospective rate of earnings retention by the holding company
appears consistent with the organization’s capital needs, asset quality and overall financial condition. Regulatory guidance provides for prior regulatory consultation with respect to capital distributions in certain circumstances such as where the
company’s net income for the past four quarters, net of dividends previously paid over that period, is insufficient to fully fund a proposed dividend or the company’s overall rate of earnings retention is inconsistent with the company’s capital needs
and overall financial condition. The ability of a holding company to pay dividends may be restricted if a subsidiary bank becomes undercapitalized. The policy statement also states that a holding company should inform the Federal Reserve Board
supervisory staff, to provide opportunity for supervisory review and possible objection, prior to redeeming or repurchasing common stock or perpetual preferred stock if the holding company is experiencing financial weaknesses or if the repurchase or
redemption would result in a net reduction, as of the end of a quarter, in the amount of such equity instruments outstanding compared with the beginning of the quarter in which the redemption or repurchase occurred. These regulatory policies may
affect the ability of Waterstone Financial to pay dividends, repurchase shares of common stock or otherwise engage in capital distributions.
Holding Company Dividends
Waterstone Financial will not be permitted to pay dividends on its common stock if its stockholders’ equity would be
reduced below the amount of the liquidation account established by Waterstone Financial in connection with the conversion. The source of dividends will depend on the net proceeds retained by Waterstone Financial and earnings thereon, and dividends
from WaterStone Bank. In addition, Waterstone Financial will be subject to relevant state corporate law limitations and federal bank regulatory policy on the payment of dividends. Maryland law, which is the state of Waterstone Financial’s
incorporation, generally limits dividends if the corporation would not be able to pay its debts in the usual course of business after giving effect to the dividend or if the corporation’s total assets would be less than the corporation’s total
liabilities plus the amount needed to satisfy the preferential rights upon dissolution of stockholders whose preferential rights on dissolution are superior to those receiving the distribution.
The dividend rate and continued payment of dividends will depend on a number of factors, including our capital
requirements, our financial condition and results of operations, tax considerations, statutory and regulatory limitations, and general economic conditions.
Federal Securities Laws Regulation
Securities Exchange
Act. Waterstone Financial common stock is registered with the Securities and Exchange Commission. Waterstone Financial is subject to the information, proxy solicitation, insider trading restrictions and other requirements under the
Securities Exchange Act of 1934.
Shares of common stock purchased by persons who are not affiliates of Waterstone Financial may be resold without
registration. Shares purchased by an affiliate of Waterstone Financial are subject to the resale restrictions of Rule 144 under the Securities Act of 1933. If Waterstone Financial meets the current public information requirements of Rule 144 under
the Securities Act of 1933, each affiliate of Waterstone Financial that complies with the other conditions of Rule 144, including those that require the affiliate’s sale to be aggregated with those of other persons, would be able to sell in the
public market, without registration, a number of shares not to exceed, in any three-month period, the greater of 1% of the outstanding shares of Waterstone Financial, or the average weekly volume of trading in the shares during the preceding four
calendar weeks. In the future, Waterstone Financial may permit affiliates to have their shares registered for sale under the Securities Act of 1933.
Sarbanes-Oxley Act of
2002. The Sarbanes-Oxley Act of 2002 is intended to improve corporate responsibility, to provide for enhanced penalties for accounting and auditing improprieties at publicly traded companies and to protect investors by improving the
accuracy and reliability of corporate disclosures pursuant to the securities laws. We have policies, procedures and systems designed to comply with these regulations, and we review and document such policies, procedures and systems to ensure
continued compliance with these regulations.
- 27 -
Change in Control Regulations
Under the Change in Bank Control Act, no person may acquire control of a savings and loan holding company such as
Waterstone Financial unless the Federal Reserve Board has been given 60 days’ prior written notice and has not issued a notice disapproving the proposed acquisition, taking into consideration certain factors, including the financial and managerial
resources of the acquirer and the competitive effects of the acquisition. Control, as defined under federal law, means ownership, control of or holding irrevocable proxies representing more than 25% of any class of voting stock, control in any manner
of the election of a majority of the institution’s directors, or a determination by the regulator that the acquiror has the power, directly or indirectly, to exercise a controlling influence over the management or policies of the institution.
Acquisition of more than 10% of any class of a savings and loan holding company’s voting stock constitutes a rebuttable determination of control under the regulations under certain circumstances including where, as is the case with Waterstone
Financial, the issuer has registered securities under Section 12 of the Securities Exchange Act of 1934.
In addition, federal regulations provide that no company may acquire control of a savings and loan holding company
without the prior approval of the Federal Reserve Board. Any company that acquires such control becomes a “savings and loan holding company” subject to registration, examination and regulation by the Federal Reserve Board.
Federal and State Taxation
Federal Taxation
General. Waterstone
Financial and subsidiaries are subject to federal income taxation in the same general manner as other corporations, with some exceptions discussed below. Waterstone Financial and subsidiaries constitute an affiliated group of corporations and,
therefore, are eligible to report their income on a consolidated basis. The following discussion of federal taxation is intended only to summarize certain pertinent federal income tax matters and is not a comprehensive description of the tax rules
applicable to Waterstone Financial or WaterStone Bank. The Company is no longer subject to federal tax examinations for years before 2016.
Method of Accounting.
For federal income tax purposes, Waterstone Financial currently reports its income and expenses on the accrual method of accounting and uses a tax year ending December 31 for filing its federal income tax returns.
Bad Debt Reserves. Prior
to the Small Business Protection Act of 1996 (the "1996 Act"), WaterStone Bank was permitted to establish a reserve for bad debts and to make annual additions to the reserve. These additions could, within specified formula limits, be deducted in
arriving at our taxable income. As a result of the 1996 Act, WaterStone Bank was required to use the specific charge-off method in computing its bad debt deduction beginning with its 1996 federal tax return. Savings institutions were required to
recapture any excess reserves over those established as of December 31, 1987 (base year reserve). At December 31, 2019, WaterStone Bank had no reserves subject to recapture in excess of its base year.
Waterstone Financial is required to use the specific charge-off method to account for tax bad debt deductions.
Taxable Distributions
and Recapture. Prior to 1996, bad debt reserves created prior to 1988 were subject to recapture into taxable income if WaterStone Bank failed to meet certain thrift asset and definitional tests or made certain distributions. Tax law
changes in 1996 eliminated thrift-related recapture rules. However, under current law, pre-1988 tax bad debt reserves remain subject to recapture if WaterStone Bank makes certain non-dividend distributions, repurchases any of its common stock, pays
dividends in excess of earnings and profits, or fails to qualify as a “bank” for tax purposes. At December 31, 2019, our total federal pre-base year bad debt reserve was approximately $16.7 million.
Corporate
Dividends-Received Deduction. Waterstone Financial may exclude from its federal taxable income 100% of dividends received from WaterStone Bank as a wholly-owned subsidiary by filing consolidated tax returns. The corporate
dividends-received deduction is 65% when the corporation receiving the dividend owns at least 20% of the stock of the distributing corporation. The dividends-received deduction is 50% when the corporation receiving the dividend owns less than 20% of
the distributing corporation.
State Taxation
The Company is subject to primarily the Wisconsin corporate franchise (income) tax and taxation in a number of states
due primarily to the operations of the mortgage banking segment. Under current law, the state of Wisconsin imposes a corporate franchise tax of 7.9% on the combined taxable incomes of the members of our consolidated income tax group.
The Company is no longer subject to state income tax examinations by certain state tax authorities for years before
2015.
As a Maryland business corporation, Waterstone Financial is required to file an annual report and pay franchise taxes to
the state of Maryland.
- 28 -
An investment in our securities is subject to risks inherent in our business and the industry in
which we operate. Before making an investment decision, you should carefully consider the risks and uncertainties described below and all other information included in this report. The risks described below may adversely affect our business,
financial condition and operating results. In addition to these risks and the other risks and uncertainties described in Item 1, “Business-Forward Looking Statements” and Item 7, “Management's Discussion and Analysis of Financial Condition and
Results of Operations,” there may be additional risks and uncertainties that are not currently known to us or that we currently deem to be immaterial that could materially and adversely affect our business, financial condition or operating results.
The value or market price of our securities could decline due to any of these identified or other risks. Past financial performance may not be a reliable indicator of future performance, and historical trends should not be used to anticipate results
or trends in future periods.
We operate in a highly regulated environment and we are subject to supervision, examination and enforcement action by
various bank regulatory agencies.
We are subject to extensive supervision, regulation, and examination by the WDFI, the Federal Deposit Insurance
Corporation and the Federal Reserve Board. As a result, we are limited in the manner in which we conduct our business, undertake new investments and activities, and obtain financing. This system of regulation is designed primarily for the
protection of the Deposit Insurance Fund and our depositors, and not for the benefit of our stockholders. Under this system of regulation, the regulatory authorities have extensive discretion in connection with their supervisory, enforcement,
rulemaking and examination activities and policies, including rules or policies that: establish minimum capital levels; restrict the timing and amount of dividend payments; govern the classification of assets; determine the adequacy of loan loss
reserves for regulatory purposes; and establish the timing and amounts of assessments and fees.
Moreover, as part of their examination authority, the banking regulators assign numerical ratings to banks and savings
institutions relating to capital, asset quality, management, liquidity, earnings and other factors. These ratings are inherently subjective and the receipt of a less than satisfactory rating in one or more categories may result in enforcement action
by the banking regulators against a financial institution. A less than satisfactory rating may also prevent a financial institution, such as WaterStone Bank or its holding company, from obtaining necessary regulatory approvals to access the capital
markets, paying dividends, acquiring other financial institutions or establishing new branches.
In addition, we must comply with significant anti-money laundering and anti-terrorism laws and regulations, Community
Reinvestment Act laws and regulations, and fair lending laws and regulations. Government agencies have the authority to impose monetary penalties and other sanctions on institutions that fail to comply with these laws and regulations, which could
significantly affect our business activities, including our ability to acquire other financial institutions or expand our branch network.
Changing interest rates may have a negative effect on our results of operations.
Our earnings and cash flows are dependent on our net interest income and income from our mortgage
banking operations. Interest rates are highly sensitive to many factors that are beyond our control, including general economic conditions and policies of various governmental and regulatory agencies and, in particular, the Federal Reserve Board.
Changes in market interest rates could have an adverse effect on our financial condition and results of operations.
Decreases in interest rates often result in increased prepayments of loans and mortgage-related securities, as borrowers
refinance their loans to reduce borrowings costs. Under these circumstances, we are subject to reinvestment risk to the extent we are unable to reinvest the cash received from such prepayments in loans or other investments that have interest rates
that are comparable to the interest rates on existing loans and securities.
Increases in interest rates can also have an adverse impact on our results of operations. A portion of our loans have
adjustable interest rates. While the higher payment amounts we would receive on these loans in a rising interest rate environment may increase our interest income, some borrowers may be unable to afford the higher payment amounts, which may result
in a higher rate of loan delinquencies and defaults, as well as lower loan originations, as borrowers who may qualify for a loan based on certain mortgage repayments, may not be able to afford repayments based on higher interest rates for the same
loan amounts. The marketability of the underlying collateral also may be adversely affected in a high interest rate environment.
Although we have implemented asset and liability management strategies designed to
reduce the effects of changes in interest rates on our results of operations, any substantial, unexpected, prolonged change in market interest rate could have a material adverse effect on our financial condition and results of operations. Also, our
interest rate models and assumptions likely may not fully predict or capture the impact of actual interest rate changes on our balance sheet.
See “Management’s Discussion and Analysis of Financial Condition and Results of Operations—Management of Market Risk.”
We rely heavily on certificates of deposit, which has increased our cost of funds and could continue to do so in the
future.
Our reliance on certificates of deposit to fund our operations has resulted in a higher cost of funds than would
otherwise be the case if we had a higher percentage of demand deposits, savings deposits and money market accounts. In addition, if our certificates of deposit do not remain with us, we may be required to access other sources of funds, including loan
sales, other types of deposits, including replacement certificates of deposit, securities sold under agreements to repurchase, advances from the Federal Home Loan Bank of Chicago and other borrowings. Depending on market conditions, we may be
required to pay higher rates on such deposits or other borrowings than we currently pay on our certificates of deposit.
- 29 -
We intend to increase our commercial business lending, and we intend to continue our commercial real estate and
multi-family residential real estate lending, which may expose us to increased lending risks and have a negative effect on our results of operations.
We continue to focus on originating commercial business, commercial real estate and multi-family residential real estate
loans. These types of loans generally have a higher risk of loss compared to our one- to four-family residential real estate loans. Commercial business loans may expose us to greater credit risk than loans secured by residential real estate because
the collateral securing these loans may not be sold as easily as residential real estate. In addition, commercial business and commercial real estate loans may also involve relatively large loan balances to individual borrowers or groups of
borrowers. These loans also have greater credit risk than residential real estate loans as repayment is generally dependent upon the successful operation of the borrower’s business. Also, the collateral underlying commercial business loans may
fluctuate in value. Some of our commercial business loans are collateralized by equipment, inventory, accounts receivable or other business assets, and the liquidation of collateral in the event of default is often an insufficient source of repayment
because accounts receivable may be uncollectible and inventories may be obsolete or of limited use. Multi-family residential real estate and commercial real estate loans involve increased risk because repayment is dependent on income being generated
in amounts sufficient to cover property maintenance and debt service. In addition, if loans that are collateralized by real estate become troubled and the value of the real estate has been significantly impaired, then we may not be able to recover
the full contractual amount of principal and interest that we anticipated at the time we originated the loan, which could cause us to increase our provision for loan losses and adversely affect our financial condition and results of operations.
Consumers may decide to use alternative options to complete financial transactions.
Technology is allowing parties to complete financial transactions through alternative methods that historically have
involved banks. Consumers can now easily access historically banking needs through online banking accounts, brokerage accounts, mutual funds or general-purpose reloadable prepaid cards. Consumers can also complete certain transactions without the
assistance of banks.
The removal of banking with financial transactions could result in the loss of customer loans, customer deposits, and the
related fee income generated from those loans and deposits. The loss of these revenue streams and the lower cost of deposits as a source of funds could have a material adverse effect on our financial condition and results of operations.
Secondary mortgage market conditions could have a material impact on our financial condition and results of operations.
Our mortgage banking operations provide a significant portion of our non-interest income. In addition to being affected
by interest rates, the secondary mortgage markets are also subject to investor demand for residential mortgage loans and increased investor yield requirements for these loans. These conditions may fluctuate or worsen in the future. In light of
current conditions, there is greater risk in retaining mortgage loans pending their sale to investors. We believe our ability to retain fixed-rate residential mortgage loans is limited. As a result, a prolonged period of secondary market
illiquidity may reduce our loan production volumes and could have a material adverse effect on our financial condition and results of operations.
Changes in the programs offered by secondary market purchasers or our ability to qualify for their programs may reduce
our mortgage banking revenues, which would negatively impact our non-interest income.
We generate mortgage revenues primarily from gains on the sale of single-family
mortgage loans pursuant to programs currently offered by Fannie Mae, Freddie Mac, Ginnie Mae and non-GSE investors. These entities account for a substantial portion of the secondary market in residential mortgage loans. Any future changes in these
programs, our eligibility to participate in such programs, the criteria for loans to be accepted or laws that significantly affect the activity of such entities could, in turn, materially adversely affect our results of operations.
A protracted government shutdown may result in reduced loan originations and related gains on sale and could negatively
affect our financial condition and results of operations.
Our mortgage banking operations provide a significant portion of our non-interest income. During any
protracted federal government shutdown, we may not be able to close certain loans and we may not be able to recognize non-interest income on the sale of loans. Some of the loans we originate are sold directly to government agencies, and some of
these sales may be unable to be consummated during the shutdown. In addition, we believe that some borrowers may determine not to proceed with their home purchase and not close on their loans, which would result in a permanent loss of the related
non-interest income. A federal government shutdown could also result in reduced income for government employees or employees of companies that engage in business with the federal government, which could result in greater loan delinquencies,
increases in our nonperforming, criticized and classified assets and a decline in demand for our products and services.
If we are required to repurchase mortgage loans that we have previously sold, it could negatively affect our earnings.
One of our primary business operations is our mortgage banking, which involves originating residential mortgage loans
for sale in the secondary market under agreements that contain representations and warranties related to, among other things, the origination and characteristics of the mortgage loans. We may be required to repurchase mortgage loans that we have
sold in cases of borrower default or breaches of these representations and warranties. If we are required to repurchase mortgage loans or provide indemnification or other recourse, this could increase our costs and thereby affect our future earnings.
Changes in economic conditions could adversely affect our earnings, as our borrowers’ ability to repay loans and the
value of the collateral securing our loans decline.
Economic conditions have an impact, to some extent, on our overall performance. Conditions such as an economic
recession, rising unemployment, changes in interest rates, money supply and other factors beyond our control may adversely affect our asset quality, deposit levels and loan demand and, therefore, our earnings. Because a majority of our loans are
secured by real estate, decreases in real estate values could adversely affect the value of property used as collateral. Adverse changes in the economy may also have a negative effect on the ability of our borrowers to make timely repayments of their
loans, which could have an adverse impact on our earnings. Consequently, declines in the economy in our market area could have a material adverse effect on our financial condition and results of operations.
- 30 -
Legal and regulatory proceedings and related matters could adversely affect us or the financial services industry in
general.
We, and other participants in the financial services industry upon whom we rely to operate, have been and may in the
future become involved in legal and regulatory proceedings. Most of the proceedings we consider to be in the normal course of our business or typical for the industry; however, it is inherently difficult to assess the outcome of these matters, and
other participants in the financial services industry or we may not prevail in any proceeding or litigation.
Any litigation or regulatory proceeding could entail substantial costs and divert management’s attention away from our
operations, and any adverse determination could have a materially adverse effect on our business, brand or image, or our financial condition and results of our operations.
We are currently a defendant in multiple lawsuits alleging that Waterstone Mortgage Corporation violated certain
provisions of the Fair Labor Standards Act. Although we intend to vigorously defend our interests in this matter and pursue all possible defenses against the claims, we may ultimately be required to pay significant damages and attorney fees, which
would adversely affect our financial condition and results of operations. See Note 14 - Commitments, Off-Balance Sheet Arrangements, and Contingent Liabilities of the notes to consolidated financial statements for additional information.
If our allowance for loan losses is not sufficient to cover actual loan losses, our results of operations would be
negatively affected.
In determining the amount of the allowance for loan losses, we analyze our loss and delinquency experience by loan
categories and we consider the effect of existing economic conditions. In addition, we make various assumptions and judgments about the collectability of our loan portfolio, including the creditworthiness of our borrowers and the value of the real
estate and other assets serving as collateral for the repayment of many of our loans. If the results of our analyses are incorrect, our allowance for loan losses may not be sufficient to cover losses inherent in our loan portfolio, which would
require additions to our allowance and would decrease our net income. Our emphasis on loan growth and on increasing our portfolio of commercial real estate loans, as well as any future credit deterioration, could require us to increase our allowance
further in the future.
The Financial Accounting Standards Board has adopted a new accounting standard that will be effective for us for our
first fiscal year after December 15, 2019. This standard, referred to as Current Expected Credit Loss, or CECL, will require financial institutions to determine periodic estimates of lifetime expected credit losses on loans, and recognize the
expected credit losses as allowances for loan losses. This will change the current method of providing allowances for loan losses that are probable, which may require us to increase our allowance for loan losses, and to greatly increase the types of
data we would need to collect and review to determine the appropriate level of the allowance for loan losses. Any resulting increase in our allowance for loan losses or expenses incurred to determine the appropriate level of the allowance for loan
losses may have a material adverse effect on our results of operations and financial condition. See Note 1 for the section "Recent Accounting Pronouncements" for additional information regarding the adoption of this standard.
In addition, bank regulators periodically review our allowance for loan losses and may require us to increase our
provision for loan losses or recognize further loan charge-offs. Any increase in our allowance for loan losses or loan charge-offs as required by these regulatory authorities may have a material adverse effect on our results of operations and
financial condition.
Because most of our borrowers are located in the Milwaukee, Wisconsin metropolitan area, a prolonged downturn in the
local economy, or a decline in local real estate values, could cause an increase in nonperforming loans or a decrease in loan demand, which would reduce our profits.
Substantially all of our loans are secured by real estate located in our primary market area. Weakness in our local
economy and our local real estate markets could adversely affect the ability of our borrowers to repay their loans and the value of the collateral securing our loans, which could adversely affect our results of operations. Real estate values are
affected by various factors, including supply and demand, changes in general or regional economic conditions, interest rates, governmental rules or policies and natural disasters. Weakness in economic conditions also could result in reduced loan
demand and a decline in loan originations. In particular, a significant decline in real estate values would likely lead to a decrease in new loan originations and increased delinquencies and defaults by our borrowers.
Strong competition within our market areas may limit our growth and profitability.
Competition in the banking and financial services industry is intense. In our market areas, we compete with commercial
banks, savings institutions, mortgage brokerage firms, credit unions, finance companies, mutual funds, money market funds, insurance companies, and brokerage firms operating locally and elsewhere. Some of our competitors have greater name
recognition and market presence and offer certain services that we do not or cannot provide, all of which benefit them in attracting business. In addition, larger competitors may be able to price loans and deposits more aggressively than we do.
We may not be able to attract and retain
skilled people.
Our success depends, in large part, on our ability to attract and retain skilled people. Competition for the best people
in most activities engaged in by us can be intense, and we may not be able to hire sufficiently skilled people or to retain them. The unexpected loss of services of one or more of our key personnel could have a material adverse impact on our business
because of their skills, knowledge of our markets, years of industry experience, and the difficulty of promptly finding qualified replacement personnel.
- 31 -
Loss of key employees may disrupt relationships with certain customers.
Our business is primarily relationship-driven in that many of our key employees have extensive customer relationships.
Loss of a key employee with such customer relationships may lead to the loss of business if the customers were to follow that employee to a competitor. While we believe our relationship with our key personnel is good, we cannot guarantee that all of
our key personnel will remain with our organization. Loss of such key personnel, should they enter into an employment relationship with one of our competitors, could result in the loss of some of our customers.
Non-compliance with the USA PATRIOT Act, Bank Secrecy Act, or other laws and regulations could result in fines or
sanctions.
The USA PATRIOT and Bank Secrecy Acts require financial institutions to develop programs to prevent financial
institutions from being used for money laundering and terrorist activities. If such activities are detected, financial institutions are obligated to file suspicious activity reports with the U.S. Treasury’s Office of Financial Crimes Enforcement
Network. These rules require financial institutions to establish procedures for identifying and verifying the identity of customers seeking to open new financial accounts. Failure to comply with these regulations could result in fines or
sanctions. During the last year, several banking institutions have received large fines for non-compliance with these laws and regulations. While we have developed policies and procedures designed to assist in compliance with these laws and
regulations, these policies and procedures may not be effective in preventing violations of these laws and regulations.
Monetary policies and regulations of the Federal Reserve Board could adversely affect our business, financial condition and
results of operations.
In addition to being affected by general economic conditions, our earnings and growth are affected by the policies of
the Federal Reserve Board. An important function of the Federal Reserve Board is to regulate the money supply and credit conditions. Among the instruments used by the Federal Reserve Board to implement these objectives are open market purchases and
sales of U.S. government securities, adjustments of the discount rate and changes in banks’ reserve requirements against bank deposits. These instruments are used in varying combinations to influence overall economic growth and the distribution of
credit, bank loans, investments and deposits. Their use also affects interest rates charged on loans or paid on deposits.
We are subject to the Community Reinvestment Act and fair lending laws, and failure to comply with these laws could lead
to material penalties.
The Community Reinvestment Act (“CRA”), the Equal Credit Opportunity Act, the Fair Housing Act and other fair lending
laws and regulations impose nondiscriminatory lending requirements on financial institutions. A successful regulatory challenge to an institution’s performance under the CRA or fair lending laws and regulations could result in a wide variety of
sanctions, including the required payment of damages and civil money penalties, injunctive relief, imposition of restrictions on mergers and acquisitions activity and restrictions on expansion. Private parties may also have the ability to challenge
an institution’s performance under fair lending laws in private class action litigation. Such actions could have a material adverse effect on our business, financial condition and results of operations.
Changes in our accounting policies or in accounting standards could materially affect how we report our financial
condition and results of operations.
Our accounting policies are essential to understanding our financial condition and results of operations. Some of these
policies require the use of estimates and assumptions that may affect the value of our assets or liabilities and financial results. Some of our accounting policies are critical because they require management to make difficult, subjective, and
complex judgments about matters that are inherently uncertain, and because it is likely that materially different amounts would be reported under different conditions or using different assumptions. If such estimates or assumptions underlying our
financial statements are incorrect, we may experience material losses.
From time to time, the Financial Accounting Standards Board and the Securities and Exchange Commission change the
financial accounting and reporting standards or the interpretation of those standards that govern the preparation of our financial statements. These changes are beyond our control, can be hard to predict and could materially affect how we report our
financial condition and results of operations. We could also be required to apply a new or revised standard retroactively, which may result in our restating our prior period financial statements.
We may be required to transition from the use of LIBOR in the future.
In 2017, the Chief Executive of the United Kingdom Financial Conduct Authority, which regulates LIBOR, announced that it
intends to stop persuading or compelling banks to submit rates for the calibration of LIBOR to the administrator of LIBOR after 2021. The announcement indicates that the continuation of LIBOR on the current basis cannot and will not be guaranteed
after 2021. It is impossible to predict whether and to what extent banks will continue to provide LIBOR submissions to the administrator of LIBOR or whether any additional reforms to LIBOR may be enacted in the United Kingdom or elsewhere. At this
time, no consensus exists as to what rate or rates may become acceptable alternatives to LIBOR and it is impossible to predict the effect of any such alternatives on the value of LIBOR-based securities and variable rate loans, subordinated
debentures, or other securities or financial arrangements, given LIBOR's role in determining market interest rates globally. Uncertainty as to the nature of alternative reference rates and as to potential changes or other reforms to LIBOR may
adversely affect LIBOR rates and the value of LIBOR-based loans and securities in our portfolio, and may impact the availability and cost of hedging instruments and borrowings. Our adjustable-rate mortgage loans are generally tied to the LIBOR. If
LIBOR rates are no longer available, and we are required to implement substitute indices for the calculation of interest rates under our loan agreements with our borrowers, we may incur expenses in effecting the transition, and may be subject to
disputes or litigation with customers over the appropriateness or comparability to LIBOR of the substitute indices, which could have an adverse effect on our results of operations.
- 32 -
The need to account for certain assets at estimated fair value may adversely affect our results of operations.
We report certain assets, such as loans held for sale, at estimated fair value. Generally, for assets that are reported
at fair value, we use quoted market prices or valuation models that utilize observable market inputs to estimate fair value. Because we carry these assets on our books at their estimated fair value, we may incur losses even if the asset in question
presents minimal credit risk.
Changes in the valuation of our securities portfolio could adversely affect our profits.
Our securities portfolio may be impacted by fluctuations in fair value, potentially reducing accumulated other
comprehensive income and/or earnings. Fluctuations in fair value may be caused by changes in market interest rates, lower market prices for securities and limited investor demand. Management evaluates securities for other-than-temporary impairment
on a monthly basis, with more frequent evaluation for selected issues. In analyzing a debt issuer’s financial condition, management considers whether the securities are issued by the federal government or its agencies, whether downgrades by bond
rating agencies have occurred, industry analysts’ reports and, to a lesser extent given the relatively insignificant levels of depreciation in our debt portfolio, spread differentials between the effective rates on instruments in the portfolio
compared to risk-free rates. In analyzing an equity issuer’s financial condition, management considers industry analysts’ reports, financial performance and projected target prices of investment analysts within a one-year time frame. If this
evaluation shows impairment to the actual or projected cash flows associated with one or more securities, a potential loss to earnings may occur. Changes in interest rates can also have an adverse effect on our financial condition, as our
available-for-sale securities are reported at their estimated fair value, and therefore are impacted by fluctuations in interest rates. We increase or decrease our stockholders’ equity by the amount of change in the estimated fair value of the
available-for-sale securities, net of taxes. The declines in fair value could result in other-than-temporary impairments of these assets, which would lead to accounting charges that could have a material adverse effect on our net income and capital
levels.
Because the nature of the financial services business involves a high volume of transactions, we face significant
operational risks.
We operate in diverse markets and rely on the ability of our employees and systems to process a high number of
transactions. Operational risk is the risk of loss resulting from our operations, including but not limited to, the risk of fraud by employees or persons outside our company, the execution of unauthorized transactions by employees, errors relating to
transaction processing and technology, breaches of the internal control system and compliance requirements, and business continuation and disaster recovery. Insurance coverage may not be available for such losses, or where available, such losses may
exceed insurance limits. This risk of loss also includes the potential legal actions that could arise as a result of an operational deficiency or as a result of noncompliance with applicable regulatory standards, adverse business decisions or their
implementation, and customer attrition due to potential negative publicity. In the event of a breakdown in the internal control system, improper operation of systems or improper employee actions, we could suffer financial loss, face regulatory
action, and suffer damage to our reputation.
Risks associated with system failures, interruptions, or breaches of cybersecurity could negatively affect our earnings.
Information technology systems are critical to our business. We use various technology systems to manage our customer
relationships, general ledger, securities investments, deposits and loans. We have established policies and procedures to prevent or limit the effect of system failures, interruptions, and security breaches, but such events may still occur or may not
be adequately addressed if they do occur. Although we take numerous protective measures and otherwise endeavor to protect and maintain the privacy and security of confidential data, these systems may be vulnerable to unauthorized access, computer
viruses, other malicious code, cyber-attacks, cyber-theft and other events that could have a security impact. If one or more of such events were to occur, this potentially could jeopardize confidential and other information processed and stored in,
and transmitted through, our systems or otherwise cause interruptions or malfunctions in our or our customers' operations.
In addition, we outsource a majority of our data processing to certain third-party providers. If these third-party
providers encounter difficulties, or if we have difficulty communicating with them, our ability to adequately process and account for transactions could be affected, and our business operations could be adversely affected. Threats to information
security also exist in the processing of customer information through various other vendors and their personnel.
The occurrence of any system failures, interruption, or breach of security could damage our reputation and result in a
loss of customers and business, subject us to additional regulatory scrutiny, or expose us to litigation and possible financial liability. We may be required to expend significant additional resources to modify our protective measures or to
investigate and remediate vulnerabilities or other exposures, and we may be subject to litigation and financial losses that are not fully covered by our insurance. Any of these events could have a material adverse effect on our financial condition
and results of operations.
Our risk management framework may not be effective in mitigating risk and reducing the potential for significant losses.
Our risk management framework is designed to minimize risk and loss to us. We seek to identify, measure, monitor, report
and control our exposure to risk, including strategic, market, liquidity, compliance and operational risks. While we use a broad and diversified set of risk monitoring and mitigation techniques, these techniques are inherently limited because they
cannot anticipate the existence or future development of currently unanticipated or unknown risks. Recent economic conditions and heightened legislative and regulatory scrutiny of the financial services industry, among other developments, have
increased our level of risk. Accordingly, we could suffer losses as a result of our failure to properly anticipate and manage these risks.
Our business may be adversely affected by an increasing prevalence of fraud and other financial crimes.
Our loans to businesses and individuals and our deposit relationships and related transactions are subject to exposure
to the risk of loss due to fraud and other financial crimes. We have experienced losses due to apparent fraud and other financial crimes. While we have policies and procedures designed to prevent such losses, losses may still occur.
- 33 -
New lines of business or new products and services may subject us to additional risks.
From time to time, we may implement new lines of business or offer new products and services within existing lines of
business. In addition, we will continue to make investments in research, development, and marketing for new products and services. There are substantial risks and uncertainties associated with these efforts, particularly in instances where the
markets are not fully developed. In developing and marketing new lines of business and/or new products and services we may invest significant time and resources. Initial timetables for the development and introduction of new lines of business and/or
new products or services may not be achieved and price and profitability targets may not prove feasible. Furthermore, if customers do not perceive our new offerings as providing significant value, they may fail to accept our new products and
services. External factors, such as compliance with regulations, competitive alternatives, and shifting market preferences, may also impact the successful implementation of a new line of business or a new product or service. Furthermore, the burden
on management and our information technology of introducing any new line of business and/or new product or service could have a significant impact on the effectiveness of our system of internal controls. Failure to successfully manage these risks in
the development and implementation of new lines of business or new products or services could have a material adverse effect on our business, financial condition and results of operations.
Acquisitions may disrupt our business and dilute stockholder value.
We regularly evaluate merger and acquisition opportunities with other financial institutions and financial services
companies. As a result, negotiations may take place and future mergers or acquisitions involving cash, debt, or equity securities may occur at any time. We would seek acquisition partners that offer us either significant market presence or the
potential to expand our market footprint and improve profitability through economies of scale or expanded services.
Acquiring other banks, businesses, or branches may have an adverse effect on our financial results and may involve various
other risks commonly associated with acquisitions, including, among other things:
|
●
|
difficulty in estimating the value of the target company;
|
|
|
●
|
payment of a premium over book and market values that may dilute our tangible book value and earnings per share in the short and long
term;
|
|
|
●
|
potential exposure to unknown or contingent tax or other liabilities of the target company;
|
|
|
●
|
exposure to potential asset quality problems of the target company;
|
|
|
●
|
potential volatility in reported income associated with goodwill impairment losses;
|
|
|
●
|
difficulty and expense of integrating the operations and personnel of the target company;
|
|
|
●
|
inability to realize the expected revenue increases, cost savings, increases in geographic or product presence, and/or other projected
benefits;
|
|
|
●
|
potential disruption to our business;
|
|
|
●
|
potential diversion of our management’s time and attention;
|
|
|
●
|
the possible loss of key employees and customers of the target company; and
|
|
|
●
|
potential changes in banking or tax laws or regulations that may affect the target company.
|
Various factors may make takeover attempts more difficult to achieve.
Our articles of incorporation and bylaws, federal regulations, Maryland law, shares of restricted stock and stock
options that we have granted or may grant to employees and directors and stock ownership by our management and directors, and various other factors may make it more difficult for companies or persons to acquire control of Waterstone Financial without
the consent of our board of directors. A shareholder may want a takeover attempt to succeed because, for example, a potential acquiror could offer a premium over the then prevailing price of our common stock.
Our funding sources may prove insufficient to replace deposits at maturity and support our future growth.
We must maintain sufficient funds to respond to the needs of depositors and
borrowers. As a part of our liquidity management, we use a number of funding sources in addition to core deposit growth and repayments and maturities of loans and investments. As we continue to grow, we are likely to become more dependent on these
sources, which may include Federal Home Loan Bank advances, proceeds from the sale of loans, federal funds purchased and brokered certificates of deposit. Adverse operating results or changes in industry conditions could lead to difficulty or an
inability to access these additional funding sources. Our financial flexibility will be severely constrained if we are unable to maintain our access to funding or if adequate financing is not available to accommodate future growth at acceptable
interest rates. If we are required to rely more heavily on more expensive funding sources to support future growth, our revenues may not increase proportionately to cover our costs. In this case, our operating margins and profitability would be
adversely affected.
- 34 -
We are subject to environmental liability risk associated with lending
activities.
A significant portion of our loan portfolio is secured by real estate, and we could become subject to environmental liabilities with respect to one or more of these properties. During the ordinary course of business, we
may foreclose on and take title to properties securing defaulted loans. In doing so, there is a risk that hazardous or toxic substances could be found on these properties. If hazardous conditions or toxic substances are found on these properties,
we may be liable for remediation costs, as well as for personal injury and property damage, civil fines and criminal penalties regardless of when the hazardous conditions or toxic substances first affected any particular property. Environmental laws may require us to incur substantial expenses to address unknown liabilities and may materially reduce the affected property’s
value or limit our ability to use or sell the affected property. In addition, future laws or more stringent interpretations or enforcement policies with respect to existing laws may increase our exposure to environmental liability. Although we have
policies and procedures to perform an environmental review before initiating any foreclosure action on nonresidential real property, these reviews may not be sufficient to detect all potential environmental hazards. The remediation costs and any
other financial liabilities associated with an environmental hazard could have a material adverse effect on us.
None
We operate from our corporate center, our 13 full-service banking offices, our drive-through office and 13 automated
teller machines, located in Milwaukee, Washington and Waukesha Counties, Wisconsin. In addition, we operate a loan production office in Minneapolis, Minnesota. The net book value of our premises, land, equipment and leasehold improvements was $25.0
million at December 31, 2019. The following table sets forth information with respect to our corporate center and our full-service banking offices as of December 31, 2019.
|
Corporate Center
11200 West Plank Court
Wauwatosa, Wisconsin 53226 |
Wauwatosa
7500 West State Street
Wauwatosa, Wisconsin 53213 |
Brookfield (1)
17495 W Capitol Dr.
Brookfield, Wisconsin 53045 |
|
Franklin/Hales Corners
6555 South 108th Street
Franklin, Wisconsin 53132 |
Germantown/Menomonee Falls
W188N9820 Appleton Avenue
Germantown, Wisconsin 53022 |
Oak Creek
6560 South 27th Street
Oak Creek, Wisconsin 53154 |
|
Oconomowoc/Lake Country (1)
1233 Corporate Center Drive
Oconomowoc, Wisconsin 53066 |
Pewaukee
1230 George Towne Drive
Pewaukee, Wisconsin 53072 |
Waukesha/Brookfield
21505 East Moreland Blvd.
Waukesha, Wisconsin 53186 |
|
West Allis/Greenfield Avenue
10101 West Greenfield Avenue
West Allis, Wisconsin 53214 |
Fox Point/North Shore
8607 North Port Washington Road
Fox Point, Wisconsin 53217
|
Greenfield/Loomis Road
5000 West Loomis Road
Greenfield, Wisconsin 53220
|
|
West Allis/National Avenue
10296 West National Avenue West Allis, Wisconsin 53227 |
Oak Creek/Howell Avenue
8780 South Howell Avenue Oak Creek, Wisconsin 53154 |
Commercial Real Estate Loan Production Office (1)
333 Washington Avenue North Suite 304
Minneapolis, Minnesota 55401 |
|
(1)
|
Leased property
|
In addition to our banking offices, as of December 31, 2019, Waterstone Mortgage Corporation had 10 offices in each of
Wisconsin and Florida, eight offices in New Mexico, three offices in each of Delaware, Illinois, Minnesota, and Virginia, two offices in each of Arizona, Colorado, Maryland, Missouri, Ohio, Oklahoma, Oregon, and Virginia, and one office in each of
Arkansas, California, Georgia, Idaho, Iowa, Michigan, New Hampshire, North Carolina and Pennsylvania.
See Note 14 - Commitments, Off-Balance Sheet Arrangements, and Contingent Liabilities of the notes to consolidated
financial statements for additional information.
Not applicable.
- 35 -
Part II
Item
5. Market for Registrant's Common Equity and Related Stockholder Matters and Issuer Purchase of Equity Securities
Our shares of common stock are traded on the NASDAQ Global Select Market® under the symbol WSBF. The approximate number
of shareholders of record of Waterstone common stock as of February 28, 2020 was 1,400. On that same date there were 26,889,750 shares of common stock issued and outstanding.
Following are the Company's monthly common stock repurchases during the fourth quarter of 2019.
|
Period
|
Total
Number of Shares Purchased |
Average
Price Paid per Share |
Total Number of
Shares Purchased as Part of Publicly Announced Plans |
Maximum
Number of Shares that May Yet Be Purchased Under the Plan(a) |
||||||||||||
|
October 1, 2019 - October 31, 2019
|
2,350
|
$
|
16.93
|
2,350
|
1,348,450
|
|||||||||||
|
November 1, 2019 - November 30, 2019
|
-
|
-
|
-
|
1,348,450
|
||||||||||||
|
December 1, 2019 - December 31, 2019
|
-
|
-
|
-
|
1,348,450
|
||||||||||||
|
Total
|
2,350
|
$
|
16.93
|
2,350
|
1,348,450
|
|||||||||||
|
(a) On May 30, 2019, the Board of Directors announced the completion of the then-existing stock repurchase plan and authorized the
repurchase of 2,000,000 shares of common stock pursuant to a new share repurchase plan. This plan has no expiration date.
|
PERFORMANCE GRAPH
Set forth below is a line graph comparing the cumulative total shareholder return on Waterstone Financial common stock,
based on the market price of the common stock and assuming reinvestment of cash dividends, with the cumulative total return of companies on the SNL Thrift NASDAQ Index and the Russell 2000. The graph assumes $100 was invested on December 31, 2014, in
Waterstone Financial, Inc. common stock and each of those indices.
Waterstone Financial, Inc.
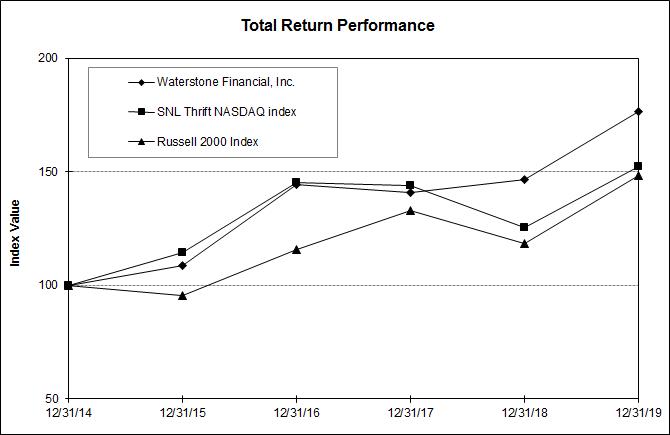
|
Index
|
12/31/14
|
12/31/15
|
12/31/16
|
12/31/17
|
12/31/18
|
12/31/19
|
|
Waterstone Financial, Inc.
|
100.00
|
108.87
|
144.52
|
141.03
|
146.68
|
176.63
|
|
SNL Thrift NASDAQ index
|
100.00
|
114.27
|
145.28
|
143.89
|
125.58
|
152.22
|
|
Russell 2000
|
100.00
|
95.59
|
115.95
|
132.94
|
118.30
|
148.49
|
- 36 -
Item 6. Selected Financial Data
The summary financial information presented below is derived in part from the Company’s audited financial statements, although the table
itself is not audited. The following data should be read together with the Company’s consolidated financial statements and related notes and “Management’s Discussion and Analysis of Financial Condition and Results of Operations” later in this report.
|
At or for the Year Ended December 31,
|
||||||||||||||||||||
|
2019
|
2018
|
2017
|
2016
|
2015
|
||||||||||||||||
|
(In Thousands, except per share amounts)
|
||||||||||||||||||||
|
Selected Financial Condition Data:
|
||||||||||||||||||||
|
Total assets
|
$
|
1,996,347
|
$
|
1,915,381
|
$
|
1,806,401
|
$
|
1,790,619
|
$
|
1,762,729
|
||||||||||
|
Cash and cash equivalents
|
74,300
|
86,101
|
48,607
|
47,217
|
100,471
|
|||||||||||||||
|
Securities available for sale
|
178,476
|
185,720
|
199,707
|
226,795
|
269,658
|
|||||||||||||||
|
Loans held for sale
|
220,123
|
141,616
|
149,896
|
225,248
|
166,516
|
|||||||||||||||
|
Loans receivable
|
1,388,031
|
1,379,148
|
1,291,814
|
1,177,884
|
1,114,934
|
|||||||||||||||
|
Allowance for loan losses
|
12,387
|
13,249
|
14,077
|
16,029
|
16,185
|
|||||||||||||||
|
Loans receivable, net
|
1,375,644
|
1,365,899
|
1,277,737
|
1,161,855
|
1,098,749
|
|||||||||||||||
|
Real estate owned, net
|
748
|
2,152
|
4,558
|
6,118
|
9,190
|
|||||||||||||||
|
Deposits
|
1,067,776
|
1,038,495
|
967,380
|
949,411
|
893,361
|
|||||||||||||||
|
Borrowings
|
483,562
|
435,046
|
386,285
|
387,155
|
441,203
|
|||||||||||||||
|
Total shareholders' equity
|
393,686
|
399,679
|
412,104
|
410,690
|
391,930
|
|||||||||||||||
|
Selected Operating Data:
|
||||||||||||||||||||
|
Interest income
|
$
|
79,741
|
$
|
73,700
|
$
|
67,095
|
$
|
63,736
|
$
|
61,963
|
||||||||||
|
Interest expense
|
27,544
|
19,523
|
16,362
|
20,292
|
23,119
|
|||||||||||||||
|
Net interest income
|
52,197
|
54,177
|
50,733
|
43,444
|
38,844
|
|||||||||||||||
|
Provision for loan losses
|
(900
|
)
|
(1,060
|
)
|
(1,166
|
)
|
380
|
1,965
|
||||||||||||
|
Net interest income after provision for loan losses
|
53,097
|
55,237
|
51,899
|
43,064
|
36,879
|
|||||||||||||||
|
Noninterest income
|
130,750
|
118,199
|
124,413
|
126,365
|
104,474
|
|||||||||||||||
|
Noninterest expense
|
136,273
|
133,156
|
131,879
|
127,435
|
115,534
|
|||||||||||||||
|
Income before income taxes
|
47,574
|
40,280
|
44,433
|
41,994
|
25,819
|
|||||||||||||||
|
Provision for income taxes
|
11,671
|
9,526
|
18,469
|
16,462
|
9,249
|
|||||||||||||||
|
Net income
|
$
|
35,903
|
$
|
30,754
|
$
|
25,964
|
$
|
25,532
|
$
|
16,570
|
||||||||||
|
Per common share:
|
||||||||||||||||||||
|
Income per share - basic
|
$
|
1.38
|
$
|
1.12
|
$
|
0.95
|
$
|
0.94
|
$
|
0.57
|
||||||||||
|
Income per share - diluted
|
$
|
1.37
|
$
|
1.11
|
$
|
0.93
|
$
|
0.93
|
$
|
0.56
|
||||||||||
|
Book value
|
$
|
14.50
|
$
|
14.04
|
$
|
13.97
|
$
|
13.95
|
$
|
13.33
|
||||||||||
|
Dividends declared
|
$
|
0.98
|
$
|
0.98
|
$
|
0.98
|
$
|
0.33
|
$
|
0.20
|
||||||||||
- 37 -
|
At or for the Year Ended December 31,
|
|||||
|
2019
|
2018
|
2017
|
2016
|
2015
|
|
|
Selected Financial Ratios and Other Data:
|
|||||
|
Performance Ratios:
|
|||||
|
Return on average assets
|
1.82 %
|
1.64 %
|
1.43 %
|
1.45%
|
0.94%
|
|
Return on average equity
|
9.14
|
7.60
|
6.32
|
6.33
|
3.99
|
|
Interest rate spread (1)
|
2.44
|
2.75
|
2.69
|
2.27
|
1.91
|
|
Net interest margin (2)
|
2.83
|
3.09
|
3.00
|
2.64
|
2.36
|
|
Noninterest expense to average assets
|
6.91
|
7.12
|
7.29
|
7.24
|
6.58
|
|
Efficiency ratio (3)
|
74.49
|
77.25
|
75.30
|
75.05
|
80.61
|
|
Average interest-earning assets to average interest-bearing liabilities
|
126.40
|
130.14
|
131.86
|
130.56
|
131.54
|
|
Dividend payout ratio (4)
|
71.01
|
87.50
|
103.16
|
27.66
|
35.20
|
|
Capital Ratios:
|
|||||
|
Waterstone Financial, Inc.:
|
|||||
|
Equity to total assets at end of period
|
19.72 %
|
20.87 %
|
22.81 %
|
22.94 %
|
22.23 %
|
|
Average equity to average assets
|
19.91
|
21.63
|
22.70
|
22.90
|
23.62
|
|
Total capital to risk-weighted assets
|
26.17
|
28.22
|
30.75
|
32.23
|
33.41
|
|
Tier 1 capital to risk-weighted assets
|
25.37
|
27.32
|
29.74
|
31.02
|
32.16
|
|
Common equity tier 1 capital to risk-weighted assets
|
25.37
|
27.32
|
29.74
|
31.02
|
32.16
|
|
Tier 1 capital to average assets
|
19.69
|
21.06
|
22.43
|
23.20
|
22.20
|
|
WaterStone Bank:
|
|||||
|
Total capital to risk-weighted assets
|
22.85
|
26.95
|
28.93
|
29.50
|
30.92
|
|
Tier I capital to risk-weighted assets
|
22.05
|
26.05
|
27.92
|
28.29
|
29.67
|
|
Common equity tier 1 capital to risk-weighted assets
|
22.05
|
26.05
|
27.92
|
28.29
|
29.67
|
|
Tier I capital to average assets
|
17.11
|
20.08
|
21.10
|
21.17
|
20.45
|
|
Asset Quality Ratios:
|
|||||
|
Allowance for loan losses as a percent of total loans
|
0.89 %
|
0.96 %
|
1.09 %
|
1.36 %
|
1.45 %
|
|
Allowance for loan losses as a percent of non-performing loans
|
176.33
|
202.12
|
231.99
|
162.62
|
91.94
|
|
Net (recoveries) charge-offs to average outstanding loans during the period
|
0.00
|
(0.02)
|
0.06
|
0.05
|
0.37
|
|
Non-performing loans as a percent of total loans
|
0.51
|
0.48
|
0.47
|
0.84
|
1.58
|
|
Non-performing assets as a percent of total assets
|
0.39
|
0.45
|
0.59
|
0.89
|
1.52
|
|
Other Data:
|
|||||
|
Number of full-service banking offices
|
13
|
11
|
11
|
11
|
11
|
|
Number of full-time equivalent employees
|
824
|
888
|
927
|
895
|
770
|
(1) Represents the difference between the weighted average yield on average
interest-earning assets and the weighted average cost of interest-bearing liabilities.
(2) Represents net interest income as a percent of average interest-earning assets.
(3) Represents noninterest expense divided by the sum of net interest income and noninterest income.
(4) Represents dividends paid per share divided by basic earnings per share.
- 38 -
Overview
The following discussion and analysis is presented to assist the reader in understanding and evaluating of the Company's
financial condition and results of operations. It is intended to complement the consolidated financial statements, footnotes, and supplemental financial data appearing elsewhere in this Annual Report on Form 10-K and should be read in conjunction
therewith. The detailed discussion in the sections below focuses on the results of operations for the years ended December 31, 2019, compared to the year ended December 2018, and the financial condition as of December 31, 2019 compared to the
financial condition as of December 31, 2018.
As described in the notes to consolidated financial statements, we have two reportable segments: community banking and
mortgage banking. The community banking segment provides consumer and business banking products and services to customers. Consumer products include loan products, deposit products, and personal investment services. Business banking products include
loans for working capital, inventory and general corporate use, commercial real estate construction loans, and deposit accounts. The mortgage banking segment, which is conducted through Waterstone Mortgage Corporation, consists of originating
residential mortgage loans primarily for sale in the secondary market.
Our community banking segment generates the significant majority of our consolidated net interest income and requires
the significant majority of our provision for loan losses. Our mortgage banking segment generates the significant majority of our noninterest income and a majority of our noninterest expenses. We have provided below a discussion of the material
results of operations for each segment on a separate basis for the year ended December 31, 2019, compared the year ended December 31, 2018, which focuses on noninterest income and noninterest expenses. We have also provided a discussion of the
consolidated operations of Waterstone Financial, which includes the consolidated operations of WaterStone Bank and Waterstone Mortgage Corporation, for the same periods.
For a discussion of our results of operations for the year ended December 31, 2018 compared to the year ended December
31, 2017, see “Part II, Item 7: Management’s Discussion and Analysis of Financial Condition and Results of Operations” Discussion of Results of Operations included in our 2018 Form 10-K, filed with the SEC on March 6, 2019.
Significant Items
Earnings comparisons among the three years ended December 31, 2019, 2018, and 2017 were impacted by the Significant Items
summarized below.
There were no Significant Items during the year ended December 31, 2019 or 2018.
As a result of The Tax Cuts and Jobs Act, the Company revalued its net deferred tax asset to reflect the reduction in its
federal corporate income tax rate from 35% to 21%. This revaluation resulted in a one-time income tax expense of approximately $2.7 million for the year ended December 31, 2017.
Critical Accounting Policies
Critical accounting policies are those that involve significant judgments and assumptions by management and that have,
or could have, a material impact on our income or the carrying value of our assets.
Allowance
for Loan Losses. WaterStone Bank establishes valuation allowances on loans deemed to be impaired. A loan is considered impaired when, based on current information and events, it is probable that WaterStone Bank will not be able to collect
all amounts due according to the contractual terms of the loan agreement. A valuation allowance is established for an amount equal to the impairment when the carrying amount of the loan exceeds the present value of the expected future cash flows,
discounted at the loan’s original effective interest rate or the fair value of the underlying collateral (specific component). WaterStone Bank recognizes the change in present value of expected future cash flows on impaired loans attributable to the
passage of time as bad debt expense. On an ongoing basis, at least quarterly for financial reporting purposes, the fair value of collateral dependent impaired loans and real estate owned is determined or reaffirmed by the following procedures:
|
●
|
Obtaining updated real estate appraisals or performing updated discounted cash flow analysis;
|
|
|
●
|
Confirming that the physical condition of the real estate has not significantly changed since the last valuation date;
|
|
|
●
|
Comparing the estimated current book value to that of updated sales values experienced on similar real estate owned;
|
|
|
●
|
Comparing the estimated current book value to that of updated values seen on more current appraisals of similar properties; and
|
|
|
●
|
Comparing the estimated current book value to that of updated listed sales prices on our real estate owned and that of similar
properties (not owned by the Company).
|
WaterStone Bank also establishes valuation allowances based on an evaluation of the various risk components that are
inherent in the credit portfolio (general component). The risk components that are evaluated include past loan loss experience; the level of non-performing and classified assets; current economic conditions; volume, growth, and composition of the
loan portfolio; adverse situations that may affect the borrower’s ability to repay; the estimated value of any underlying collateral; regulatory guidance; and other relevant factors. The allowance is increased by provisions charged to earnings and
recoveries of previously charged-off loans and reduced by charge-offs. Charge-offs approximate the amount by which the outstanding principal balance exceeds the estimated net realizable value of the underlying collateral. The appropriateness of the
allowance for loan losses is reviewed and approved quarterly by the WaterStone Bank Board of Directors. The allowance reflects management’s best estimate of the amount needed to provide for the probable loss on impaired loans and other inherent
losses in the loan portfolio, and is based on a risk model developed and implemented by management and approved by the WaterStone Bank Board of Directors.
Actual results could differ from this estimate, and future additions to the allowance may be necessary based on
unforeseen changes in loan quality and economic conditions. More specifically, if our future charge-off experience increases substantially from our past experience, or if the value of underlying loan collateral, in our case mostly real estate,
declines in value by a substantial amount, or if unemployment in our primary market area increases significantly, our allowance for loan losses may be inadequate and we will incur higher provisions for loan losses and lower net income in the future.
- 39 -
In addition, state and federal regulators periodically review the WaterStone Bank allowance for loan losses. Such
regulators have the authority to require WaterStone Bank to recognize additions to the allowance at the time of their examination.
Income
Taxes. The Company and its subsidiaries file consolidated federal, combined state income tax, and separate state income tax returns. The provision for income taxes is based upon income in the consolidated financial statements, rather than
amounts reported on the income tax return. Deferred tax assets and liabilities are recognized for the future tax consequences attributable to differences between the financial statement carrying amounts of existing assets and liabilities and their
respective tax bases as well as for net operating loss carry forwards. Deferred tax assets and liabilities are measured using enacted tax rates expected to apply to taxable income in the years in which those temporary differences are expected to
be recovered or settled. The effect on deferred tax assets and liabilities of a change in tax rates is recognized as income or expense in the period that includes the enactment date.
Under generally accepted accounting principles, a valuation allowance is required to be recognized if it is “more likely
than not” that a deferred tax asset will not be realized. The determination of the realizability of deferred tax assets is highly subjective and dependent upon judgment concerning management's evaluation of both positive and negative evidence, the
forecasts of future income, applicable tax planning strategies, and assessments of current and future economic and business conditions. Examples of positive evidence may include the existence of taxes paid in available carry-back years as well as the
probability that taxable income will be generated in future periods. Examples of negative evidence may include cumulative losses in a current year and prior two years and general business and economic trends.
Positions taken in the Company’s tax returns are subject to challenge by the taxing authorities upon examination. The
benefit of uncertain tax positions are initially recognized in the financial statements only when it is more likely than not that the position will be sustained upon examination by the tax authorities. Such tax positions are both initially and
subsequently measured as the largest amount of tax benefit that has a greater than 50% likelihood of being realized upon settlement with the tax authority, assuming full knowledge of the position and all relevant facts. Interest and penalties on
income tax uncertainties are classified within income tax expense in the income statement.
Fair
Value Measurements. The Company determines the fair value of its assets and liabilities in accordance with ASC 820. ASC 820 establishes a standard framework for measuring and disclosing fair value under generally accepted accounting
principles. A number of valuation techniques are used to determine the fair value of assets and liabilities in the Company’s financial statements. The valuation techniques include quoted market prices for investment securities, appraisals of real
estate from independent licensed appraisers and other valuation techniques. Fair value measurements for assets and liabilities where limited or no observable market data exists are based primarily upon estimates, and are often calculated based on the
economic and competitive environment, the characteristics of the asset or liability and other factors. Therefore, the valuation results cannot be determined with precision and may not be realized in an actual sale or immediate settlement of the asset
or liability. Additionally, there are inherent weaknesses in any calculation technique, and changes in the underlying assumptions used, including discount rates and estimates of future cash flows, could significantly affect the results of current or
future values. Significant changes in the aggregate fair value of assets and liabilities required to be measured at fair value or for impairment are recognized in the income statement under the framework established by generally accepted accounting
principles.
Recent
Accounting Pronouncements. Refer to Note 1 of our consolidated financial statements for a description of recent accounting pronouncements including the respective dates of adoption and effects on results of operations and financial
condition.
Comparison of Consolidated Waterstone Financial, Inc. Financial Condition at December 31, 2019 and at December 31, 2018
Total Assets. Total assets increased by $81.0 million, or 4.2%, to $2.00 billion at December 31, 2019 from $1.92 billion at December 31, 2018. The increase in total assets primarily reflects an increase in loans held
for sale, loans receivable, and right-of-use assets due to the adoption of the new lease accounting standard; partially offset by decreases in cash and cash equivalents and securities available for sale. The total assets increase reflects liability
increases in deposits, additional short-term and long-term debt, and lease liabilities due to the adoption of the new lease accounting standard.
Cash and Cash Equivalents. Cash and cash equivalents decreased $11.8 million to $74.3 million at December 31, 2019
from $86.1 million at December 31, 2018. The decrease in cash and cash equivalents primarily reflects the use of cash to fund loans held for sale, fund loans held for investment, pay dividends, and repurchase shares since December 31, 2018.
Offsetting the decreases, cash and cash equivalents increased due to additional deposits and long-term FHLB borrowings along with a decrease in securities available for sale.
Securities
Available for Sale. Securities available for sale decreased by $7.2 million to $178.5 million at December 31, 2019 from $185.7 million
at December 31, 2018. The decrease was due to paydowns in mortgage related securities and maturities of debt securities exceeding security purchases during the year.
Loans
Held for Sale. Loans held for sale increased $78.5 million, or 55.4%, to $220.1 million at December 31, 2019 from $141.6 million at
December 31, 2018. The increase was due primarily to the production increase of refinance products, which was driven by the reduction in mortgage rates compared to the end of last year.
Loans
Receivable. Loans receivable held for investment increased $8.9 million, or 0.6%, to $1.39 billion at December 31, 2019. The increase in
total loans receivable was primarily attributable to increases in the construction and land, commercial real estate, and consumer loan categories. Offsetting those increases, the one- to four-family, multi-family, home equity, and commercial
categories decreased.
Allowance
for Loan Losses. The allowance for loan losses decreased $862,000 to $12.4 million at December 31, 2019 from $13.2 million at December 31, 2018. The decrease resulted from a negative provision due to the improvement of key loan quality
metrics decreasing the required allowance related to the loans collectively reviewed. The overall decrease was primarily related to the one- to four-family, multi-family, home equity, and commercial categories offset slightly by an increase to the
construction and land and commercial real estate categories. See Note 3 for further discussion on the allowance for loan losses.
Federal
Home Loan Bank Stock. Total Federal Home Loan Bank stock increased $1.8 million to $21.1 million at December 31, 2019. The increase reflects the ownership requirements in conjunction with the additional FHLB borrowings.
- 40 -
Cash
Surrender Value of Life Insurance. Total cash surrender value of life insurance increased $2.1 million, to $69.7 million at December 31, 2019. The increase related to continued earnings and annual premiums paid.
Real
Estate Owned. Total real estate owned decreased by $1.4 million, or 65.2%, to $748,000 at December 31, 2019, compared to $2.2 million at December 31, 2018. During the year ended December 31, 2019, $1.1 million was transferred from loans to
real estate owned upon completion of foreclosure. During the same period, sales of real estate owned totaled $2.4 million. There were no write-downs during the year ended December 31 2019.
Prepaid
Expenses and Other Assets. Total prepaid expenses and other assets increased $8.7 million to $31.2 million at December 31, 2019. The increase was primarily due to recording the right-of-use asset for operating leases, as a result of
adopting the new lease accounting standard, along with an increase in funding receivables, for loans sold, from investors.
Deposits.
Deposits increased by $29.3 million to $1.07 billion at December 31, 2019, from $1.04 billion at December 31, 2018. The increase was driven by an increase of $34.4 million in money market and savings deposits and $3.9 million in time deposits offset
by a decrease of $9.0 million in demand deposits.
Borrowings.
Total borrowings increased $48.5 million to $483.6 million at December 31, 2019, from $435.0 million at December 31, 2018. The community banking segment borrowed a total of $40.0 million additional long term borrowings to fund loan growth. External
short term borrowings at the mortgage banking segment increased a total of $8.5 million at December 31, 2019 from December 31, 2018 to fund loans held for sale.
Other
Liabilities. Other liabilities increased $9.3 million to $47.1 million at December 31, 2019 compared to December 31, 2018. Other liabilities primarily increased due to operating lease liabilities being added to the statements of financial
condition as a result of adopting the new lease accounting standard.
Shareholders’
Equity. Shareholders’ equity decreased by $6.0 million, or 1.5%, to $393.7 million at December 31, 2019 from $399.7 million at December 31, 2018. Shareholders' equity decreased primarily due to the declaration of regular dividends and a
special dividend and the repurchase of stock. Partially offsetting the decreases were increases from net income, stock options exercised, the increase in the fair value of the securities portfolio, and unearned ESOP shares as they continue to vest.
Comparison of Community Banking Segment Operations for the Years Ended December 31, 2019 and 2018
Net income from our community banking segment for the year ended December 31, 2019 totaled $24.6
million compared to $24.9 million for the year ended December 31, 2018. Net interest income decreased $927,000 to $54.0 million for the year ended December 31, 2019 compared to $54.9 million for the year ended December 31, 2018. Net interest income
decreased due to an increase in interest expense as deposits and borrowings repriced at higher rates. Partially offsetting the increase in interest expense, interest income increased primarily due to increases in average loan balances and loan
rates.
Provision for loan losses was a negative provision of $1.1 million for the year ended December 31,
2019 compared to a negative provision of $1.2 million for the year ended December 31, 2018.
Noninterest income increased $721,000 for the year ended December 31, 2019 primarily due to
increases in loan and deposit fees and cash surrender value of life insurance offset by a decrease in other income. The loan fees increased primarily due to increased prepayment penalties and loan fees associated with interest rate swaps related to
current year originations. Cash surrender value of life insurance increased as the earnings rate increased slightly. Other income decreased primarily due to a decrease in rental income.
Compensation, payroll taxes, and other employee benefits expense decreased $190,000 due primarily
to decreases in health insurance and lower stock based compensation expenses offset primarily by increases in salaries expense and variable compensation. Occupancy, office furniture, and equipment increased due primarily to increased depreciation
expense, snow removal, maintenance and repair expense, and computer supplies. Advertising expense increased in order to promote our deposit products. Data processing expenses increased due primarily to increased investments in technology.
Professional fees decreased as consulting activity related to retail staff training decreased from 2018. Real estate owned expense decreased as there was a decrease in writedowns and decrease in management expense offset by a decrease in gain on sale
of real estate owned. Other noninterest expense decreased primarily from the FDIC assessing credits for insurance.
Income tax expense increased $23,000 to $7.3 million for the year ended December 31, 2019. The
increase was primarily due to a lower permanent deductions from tax-fee municipal bonds. Additionally, the Company recognized a lower benefit related to stock awards exercised for the year ended December 31, 2019. Offsetting the increases, pre-tax
income decreased $274,000.
- 41 -
Comparison of Mortgage Banking Segment Operations for the Years Ended December 31,
2019 and 2018
Net income from our mortgage banking segment increased $5.4 million to $11.2 million for the year ended December 31,
2019 compared to $5.8 million for the year ended December 31, 2018. We originated $2.92 billion in mortgage loans held for sale during the year ended December 31, 2019, which was an increase of $324.5 million, or 12.5%, from the $2.60 billion
originated during the year ended December 31, 2018. The increase in loan production volume was driven by a 122.9% volume increase in refinance products and 1.0% volume increase in mortgage purchase products. Total mortgage banking income increased
$11.5 million, or 9.9%, to $126.9 million during the year ended December 31, 2019 compared to $115.4 million during the year ended December 31, 2018. Gross margin on loans originated and sold decreased approximately 1.9% for the year ended December
31, 2019 Gross margin on those loans originated and sold is the ratio of mortgage banking income (excluding the change in interest rate lock fair value) divided by total loan originations. The gross margin on those loans originated and sold
compression reflects a higher mix of refinance products which generally yield a lower margin, and industry dynamics, as price-based competition has escalated to maintain market share. We sell loans on both a servicing-released and a servicing
retained basis. Waterstone Mortgage Corporation has contracted with a third party to service the loans for which we retain servicing.
Our overall margin can be affected by the mix of both loan type (conventional loans versus governmental) and loan
purpose (purchase versus refinance). Conventional loans include loans that conform to Fannie Mae and Freddie Mac standards, whereas governmental loans are those loans guaranteed by the federal government, such as a Federal Housing Authority or U.S.
Department of Agriculture loan. Loans originated for the purchase of a residential property, which generally yield a higher margin than loans originated for refinancing existing loans, comprised 81.4% of total originations during the year ended
December 31, 2019, compared to 90.6% of total originations during the year ended December 31, 2018. The mix of loan type trended towards more governmental loans and less conventional loans comprising 30.5% and 69.5% of all loan originations,
respectively, during the year ended December 31, 2019, compared to 30.3% and 69.7% of all loan originations, respectively, during the year ended December 31, 2018.
There were no sales of mortgage servicing rights during the year ended December 31, 2019. During the year ended
December 31, 2018, mortgage servicing rights related to $148.7 million in loans receivable with a book value of $1.0 million were sold at a gain of $417,000.
Total compensation, payroll taxes and other employee benefits increased $4.2 million, or 5.3%, to $84.2 million for the
year ended December 31, 2019 compared to $80.0 million for the year ended December 31, 2018. The increase primarily related to increased commission expense, branch manager pay, and health insurance expense. Offsetting those increases, salary
decreased as we closed underperforming branches over the past year. Occupancy, office furniture, and equipment expense decreased due to lower rent expense with the closing of underperforming branches. Advertising, communications, lower processing
expenses, and other noninterest expenses decreased. Other noninterest expense decreased primarily due to a lower provision for branch losses. Data processing, real estate owned expense, and professional fees increased due primarily to new contracts,
managing one real estate owned property, and ongoing litigation expenses.
Waterstone Mortgage Corporation originates loans in various states. The states
where we originate greater than 10% of total activity are Florida and New Mexico.
Comparison of Consolidated Waterstone Financial, Inc. Results of Operations for the Years Ended December 31, 2019 and
2018
|
Years Ended December 31,
|
||||||||
|
2019
|
2018
|
|||||||
|
(Dollars in Thousands, except per share amounts)
|
||||||||
|
Net income
|
$
|
35,903
|
30,754
|
|||||
|
Earnings per share - basic
|
1.38
|
1.12
|
||||||
|
Earnings per share - diluted
|
1.37
|
1.11
|
||||||
|
Return on average assets
|
1.82
|
%
|
1.64
|
%
|
||||
|
Return on average equity
|
9.14
|
%
|
7.60
|
%
|
||||
- 42 -
Average Balance Sheets, Interest and Yields/Costs
The following table set forth average balance sheets, annualized average yields and costs, and certain other information
for the periods indicated. Non-accrual loans were included in the computation of the average balances of loans receivable and held for sale. The yields set forth below include the effect of deferred fees, discounts and premiums that are amortized
or accreted to interest income or expense. Yields on interest-earning assets are computed on a fully tax-equivalent yield, where applicable.
|
Years Ended December 31,
|
||||||||||||||||||||||||||||||||||||
|
2019
|
2018
|
2017
|
||||||||||||||||||||||||||||||||||
|
Average
|
Average
|
Average
|
Average
|
Average
|
Average
|
|||||||||||||||||||||||||||||||
|
Balance
|
Interest
|
Rate
|
Balance
|
Interest
|
Rate
|
Balance
|
Interest
|
Rate
|
||||||||||||||||||||||||||||
|
(Dollars in Thousands)
|
||||||||||||||||||||||||||||||||||||
|
Interest-earning assets:
|
||||||||||||||||||||||||||||||||||||
|
Loans receivable and held for sale (1)
|
$
|
1,546,249
|
72,235
|
4.67
|
%
|
$
|
1,463,730
|
66,966
|
4.58
|
%
|
$
|
1,369,072
|
60,824
|
4.44
|
%
|
|||||||||||||||||||||
|
Mortgage related securities (2)
|
113,659
|
2,978
|
2.62
|
%
|
110,136
|
2,648
|
2.40
|
%
|
123,972
|
2,646
|
2.13
|
%
|
||||||||||||||||||||||||
|
Debt securities, federal funds sold and
short-term investments (2)(3)
|
181,897
|
4,826
|
2.65
|
%
|
178,594
|
4,399
|
2.46
|
%
|
198,962
|
4,317
|
2.17
|
%
|
||||||||||||||||||||||||
|
Total interest-earning assets
|
1,841,805
|
80,039
|
4.35
|
%
|
1,752,460
|
74,013
|
4.22
|
%
|
1,692,006
|
67,787
|
4.01
|
%
|
||||||||||||||||||||||||
|
Noninterest-earning assets
|
131,168
|
118,737
|
118,228
|
|||||||||||||||||||||||||||||||||
|
Total assets
|
$
|
1,972,973
|
$
|
1,871,197
|
$
|
1,810,234
|
||||||||||||||||||||||||||||||
|
Interest-bearing liabilities:
|
||||||||||||||||||||||||||||||||||||
|
Demand accounts
|
$
|
36,926
|
33
|
0.09
|
%
|
$
|
37,388
|
33
|
0.09
|
%
|
$
|
36,716
|
28
|
0.08
|
%
|
|||||||||||||||||||||
|
Money market, savings, and escrow accounts
|
198,027
|
1,247
|
0.63
|
%
|
172,760
|
599
|
0.35
|
%
|
171,307
|
401
|
0.23
|
%
|
||||||||||||||||||||||||
|
Time deposits
|
737,397
|
15,998
|
2.17
|
%
|
709,102
|
10,995
|
1.55
|
%
|
671,982
|
7,310
|
1.09
|
%
|
||||||||||||||||||||||||
|
Total interest-bearing deposits
|
972,350
|
17,278
|
1.78
|
%
|
919,250
|
11,627
|
1.26
|
%
|
880,005
|
7,739
|
0.88
|
%
|
||||||||||||||||||||||||
|
Borrowings
|
484,801
|
10,266
|
2.12
|
%
|
427,301
|
7,896
|
1.85
|
%
|
403,163
|
8,623
|
2.14
|
%
|
||||||||||||||||||||||||
|
Total interest-bearing liabilities
|
1,457,151
|
27,544
|
1.89
|
%
|
1,346,551
|
19,523
|
1.45
|
%
|
1,283,168
|
16,362
|
1.28
|
%
|
||||||||||||||||||||||||
|
Noninterest-bearing liabilities
|
||||||||||||||||||||||||||||||||||||
|
Non-interest bearing deposits
|
90,497
|
96,648
|
89,785
|
|||||||||||||||||||||||||||||||||
|
Other non-interest bearing liabilities
|
32,594
|
23,168
|
26,345
|
|||||||||||||||||||||||||||||||||
|
Total non-interest bearing liabilities
|
123,091
|
119,816
|
116,130
|
|||||||||||||||||||||||||||||||||
|
Total liabilities
|
1,580,242
|
1,466,367
|
1,399,298
|
|||||||||||||||||||||||||||||||||
|
Equity
|
392,731
|
404,830
|
410,936
|
|||||||||||||||||||||||||||||||||
|
Total liabilities and equity
|
$
|
1,972,973
|
$
|
1,871,197
|
$
|
1,810,234
|
||||||||||||||||||||||||||||||
|
Net interest income / Net interest rate spread (4)
|
52,495
|
2.46
|
%
|
54,490
|
2.77
|
%
|
51,425
|
2.73
|
%
|
|||||||||||||||||||||||||||
|
Less: taxable equivalent adjustment
|
298
|
0.02
|
%
|
313
|
0.02
|
%
|
692
|
0.04
|
%
|
|||||||||||||||||||||||||||
|
Net interest income / Net interest rate spread, as reported
|
52,197
|
2.44
|
%
|
54,177
|
2.75
|
%
|
50,733
|
2.69
|
%
|
|||||||||||||||||||||||||||
|
Net interest-earning assets (5)
|
$
|
384,654
|
$
|
405,909
|
$
|
408,838
|
||||||||||||||||||||||||||||||
|
Net interest margin (6)
|
2.83
|
%
|
3.09
|
%
|
3.00
|
%
|
||||||||||||||||||||||||||||||
|
Tax equivalent effect
|
0.02
|
%
|
0.02
|
%
|
0.04
|
%
|
||||||||||||||||||||||||||||||
|
Net interest margin on a fully tax equivalent basis
|
2.85
|
%
|
3.11
|
%
|
3.04
|
%
|
||||||||||||||||||||||||||||||
|
Average interest-earning assets to average interest-bearing liabilities
|
126.40
|
%
|
130.14
|
%
|
131.86
|
%
|
||||||||||||||||||||||||||||||
(1) Includes net deferred loan fee amortization income of $672,000, $622,000 and $689,000 for the years ended
December 31, 2019, 2018 and 2017, respectively.
(2) Includes available for sale securities.
| (3) |
Interest income from tax exempt securities is computed on a taxable equivalent basis using a tax rate of 21% for the years ended December 31, 2019
and 2018, and 35% for the year ended December 31, 2017. The yields on debt securities, federal funds sold and short-term investments before tax-equivalent adjustments were 2.49%, 2.29%, and 1.82% for the years ended December 31, 2019,
2018, and 2017, respectively.
|
(4) Net interest rate spread represents the difference between the yield on average interest-earning assets and the cost of
average interest-bearing liabilities and is presented on a fully tax equivalent basis.
(5) Net interest-earning assets represent total interest-earning assets less total interest-bearing liabilities.
(6) Net interest margin represents net
interest income divided by average total interest-earning assets.
- 43 -
Rate/Volume Analysis
The following table sets forth the effects of changing rates and volumes on our net interest income for the periods
indicated. The rate column shows the effects attributable to changes in rate (changes in rate multiplied by prior volume). The volume column shows the effects attributable to changes in volume (changes in volume multiplied by prior rate). The net
column represents the sum of the prior columns. For purposes of this table, changes attributable to changes in both rate and volume that cannot be segregated have been allocated proportionately based on the changes due to rate and the changes due to
volume.
|
Years Ended December 31,
|
Years Ended December 31,
|
|||||||||||||||||||||||
|
2019 versus 2018
|
2018 versus 2017
|
|||||||||||||||||||||||
|
Increase (Decrease) due to
|
Increase (Decrease) due to
|
|||||||||||||||||||||||
|
Volume
|
Rate
|
Net
|
Volume
|
Rate
|
Net
|
|||||||||||||||||||
|
(In Thousands)
|
||||||||||||||||||||||||
|
Interest and dividend income:
|
||||||||||||||||||||||||
|
Loans receivable and held for sale(1) (2)
|
$
|
4,045
|
$
|
1,224
|
$
|
5,269
|
$
|
4,244
|
$
|
1,898
|
$
|
6,142
|
||||||||||||
|
Mortgage related securities(3)
|
83
|
247
|
330
|
(313
|
)
|
315
|
2
|
|||||||||||||||||
|
Other interest-earning assets(3) (4)
|
79
|
348
|
427
|
(465
|
)
|
547
|
82
|
|||||||||||||||||
|
Total interest-earning assets
|
4,207
|
1,819
|
6,026
|
3,466
|
2,760
|
6,226
|
||||||||||||||||||
|
Interest expense:
|
||||||||||||||||||||||||
|
Demand accounts
|
-
|
-
|
-
|
-
|
5
|
5
|
||||||||||||||||||
|
Money market, savings, and escrow accounts
|
100
|
548
|
648
|
4
|
194
|
198
|
||||||||||||||||||
|
Time deposits
|
454
|
4,549
|
5,003
|
376
|
3,309
|
3,685
|
||||||||||||||||||
|
Total interest-bearing deposits
|
554
|
5,097
|
5,651
|
380
|
3,508
|
3,888
|
||||||||||||||||||
|
Borrowings
|
1,137
|
1,233
|
2,370
|
575
|
(1,302
|
)
|
(727
|
)
|
||||||||||||||||
|
Total interest-bearing liabilities
|
1,691
|
6,330
|
8,021
|
955
|
2,206
|
3,161
|
||||||||||||||||||
|
Net change in net interest income
|
$
|
2,516
|
$
|
(4,511
|
)
|
$
|
(1,995
|
)
|
$
|
2,511
|
$
|
554
|
$
|
3,065
|
||||||||||
| (1) |
Includes net deferred loan fee amortization income of $672,000, $622,000 and $689,000 for the years ended December 31, 2019, 2018 and 2017,
respectively.
|
| (2) |
Non-accrual loans have been included in average loans receivable balance.
|
| (3) |
Includes available for sale securities.
|
| (4) |
Interest income from tax exempt securities is computed on a taxable equivalent basis using a tax rate of 21% for the year ended December 31, 2019
and 2018, and 35% for the year ended December 31, 2017.
|
- 44 -
Net Interest Income
Net interest income decreased $2.0 million, or 3.7%, to $52.2 million during the year
ended December 31, 2019 compared to $54.2 million during the year ended December 31, 2018.
|
·
|
Interest income on loans increased $5.3 million due primarily to an increase of $82.5
million, or 5.6%, in average balance of loans along with a nine basis point increase in average yield on loans. The increase in average loan balance was driven by a $44.4 million, or 3.3%, increase in the average balance of loans held in
portfolio and by an increase of $38.1 million, or 29.4%, in the average balance of loans held for sale.
|
|
·
|
Interest income from mortgage-related securities increased $330,000 primarily because the average yield increased 22 basis
points. Additionally, the average balance of mortgage related securities increased $3.5 million.
|
|
·
|
Interest income from other interest-earning assets (comprised of debt securities, federal
funds sold and short-term investments) increased $442,000 due to a 20 basis point increase in the average yield. The increase in average yield was primarily driven by the increase in the dividend paid by the FHLB on its stock. The average
balance increased $3.3 million to $181.9 million due to a higher cash balance on hand along with a higher FHLB stock balance offset primarily by a lower balance of municipal securities as maturities occurred throughout the past 12 months
were not replaced due to market conditions.
|
|
·
|
Interest expense on time deposits increased $5.0 million, or 45.5%, primarily due to a 62
basis point increase in the average cost of time deposits, as maturing time deposits repriced or were replaced at a higher rate in the current competitive market. In addition to the increase in the average cost of time deposits, the average
balance of time deposits increased $28.3 million compared to the prior year period.
|
|
·
|
Interest expense on money market, savings, and escrow accounts increased $648,000, or
108.2%, due primarily to a 28 basis point increase in the average cost of money market, savings, and escrow accounts along with an increase in average balance of $25.3 million.
|
|
·
|
Interest expense on borrowings increased $2.4 million, or 30.0%, due to an increase in the
average cost of borrowings that resulted from the maturity and replacement of fixed-rate borrowings since the beginning of the prior year. The average cost of borrowings totaled 2.12% for the year ended December 31, 2019, compared to 1.85%
during the year ended December 31, 2018. In addition to the increase in rate, average borrowing volume increased $57.5 million to $484.8 million during the year ended December 31, 2019.
|
Provision for Loan Losses
Our provision for loan losses amounted to a negative provision of $900,000 during
the year ended December 31, 2019, compared to a negative provision of $1.1 million during the year ended December 31, 2018. We had a negative provision for loan losses of $1.1 million at the community banking segment due to recoveries and a continued
improvement in the overall risk profile of the loan portfolio. A provision for loan losses of $150,000 for the mortgage banking segment was due to loans added to its loan portfolio.
The provision is primarily a function of the Company's reserving methodology and
assessments of certain quantitative and qualitative factors which are used to determine an appropriate allowance for loan losses for the period. See further discussion regarding the allowance for loan losses in the "Asset Quality" section for an
analysis of charge-offs, nonperforming assets, specific reserves and additional provisions and the "Allowance for Loan Loss" section.
Noninterest Income
|
Years Ended December 31,
|
||||||||||||||||
|
2019
|
2018
|
$ Change
|
% Change
|
|||||||||||||
|
(Dollars in Thousands)
|
||||||||||||||||
|
Service charges on loans and deposits
|
$
|
2,363
|
1,680
|
683
|
40.7
|
%
|
||||||||||
|
Increase in cash surrender value of life insurance
|
1,935
|
1,848
|
87
|
4.7
|
%
|
|||||||||||
|
Mortgage banking income
|
125,666
|
113,151
|
12,515
|
11.1
|
%
|
|||||||||||
|
Other
|
786
|
1,520
|
(734
|
)
|
(48.3
|
%)
|
||||||||||
|
Total noninterest income
|
$
|
130,750
|
118,199
|
12,551
|
10.6
|
%
|
||||||||||
Total noninterest income increased $12.6 million, or 10.6%, to $130.8
million during the year ended December 31, 2019 compared to $118.2 million during the year ended December 31, 2018. The increase resulted primarily from an increase in mortgage banking income, partially offset by a decrease in other noninterest
income.
- 45 -
|
·
|
The $12.6 million increase in mortgage banking income was primarily the result of an
increase in loan origination volume. Total loan origination volume on a consolidated basis increased $343.4 million, or 13.7%, to $2.85 billion during the year ended December 31, 2019 compared to $2.51 billion during the year ended
December 31, 2018. Gross margin on loans originated and sold decreased 1.9% at the mortgage banking segment. Gross margin on loans originated and sold is the ratio of mortgage banking income (excluding the change in interest rate lock fair
value) divided by total loan originations. See "Comparison of Mortgage Banking Segment Results of Operations for the Year December 31, 2019 and 2018" above, for additional discussion of the increase in mortgage banking income.
|
|
·
|
The increase in service charges on loans and deposits was due to an increase of loan
prepayment penalties on existing loans. Additionally, the Bank received fees for originating loan interest rate swaps which began in the current year.
|
|
·
|
The increase in cash surrender value of life insurance was due primarily to an increase in
earnings rate.
|
|
·
|
The $734,000 decrease in other noninterest income was primarily due to a decrease in gain on sale of mortgage servicing rights. A
bulk sale of mortgage servicing rights resulted in a gain of $417,000 during the year ended December 31, 2018. There were no sales during the year ended December 31, 2019. In addition to the decrease from the gain on sale of mortgage
servicing rights, other noninterest income decreased due to less servicing fee income on loans sold and rental income.
|
Noninterest Expenses
|
Years Ended December 31,
|
||||||||||||||||
|
2019
|
2018
|
$ Change
|
% Change
|
|||||||||||||
|
(Dollars in Thousands)
|
||||||||||||||||
|
Compensation, payroll taxes, and other employee benefits
|
$
|
101,718
|
97,784
|
3,934
|
4.0
|
%
|
||||||||||
|
Occupancy, office furniture and equipment
|
10,606
|
10,855
|
(249
|
)
|
(2.3
|
%)
|
||||||||||
|
Advertising
|
3,885
|
4,123
|
(238
|
)
|
(5.8
|
%)
|
||||||||||
|
Data processing
|
3,630
|
2,792
|
838
|
30.0
|
%
|
|||||||||||
|
Communications
|
1,359
|
1,611
|
(252
|
)
|
(15.6
|
%)
|
||||||||||
|
Professional fees
|
3,605
|
2,327
|
1,278
|
54.9
|
%
|
|||||||||||
|
Real estate owned
|
(146
|
)
|
1
|
(147
|
)
|
(14,700.0
|
%)
|
|||||||||
|
Loan processing expense
|
3,288
|
3,372
|
(84
|
)
|
(2.5
|
%)
|
||||||||||
|
Other
|
8,328
|
10,291
|
(1,963
|
)
|
(19.1
|
%)
|
||||||||||
|
Total noninterest expenses
|
$
|
136,273
|
133,156
|
3,117
|
2.3
|
%
|
||||||||||
- 46 -
Total noninterest expenses increased $3.1 million, or 2.3%, to $136.3 million during
the year ended December 31, 2019 compared to $133.2 million during the year ended December 31, 2018.
|
·
|
Compensation, payroll taxes and other employee benefit expense at our mortgage banking
segment increased $4.2 million, or 5.3%, to $84.2 million for the year ended December 31, 2019. The increase in compensation expense was primarily a result of the increase in commission expense as fundings increased and branch manager pay
as branches were more profitable. These increases were partially offset by a decrease to salaries as we closed underperforming branches over the past year.
|
|
·
|
Compensation, payroll taxes and other employee benefits expense at the community banking
segment decreased $190,000, or 1.0%, to $18.2 million during the year ended December 31, 2019. The decrease was primarily due to a decrease in health insurance and lower stock based compensation expenses offset by higher variable
compensation and salaries expense with annual raises and the addition of two branches.
|
|
·
|
Occupancy, office furniture and equipment expense at the mortgage banking segment decreased
$694,000 to $6.9 million during the year ended December 31, 2019 compared to the prior year resulting from lower computer supplies expense and rent expense due to a number of underperforming branches closing.
|
|
·
|
Occupancy, office furniture and equipment expense at the community banking segment increased
$445,000 to $3.8 million during the year ended December 31, 2019 compared to the prior year. The increase was primarily due to increased depreciation expense, snow removal, maintenance and repair expense, and computer supplies.
|
|
·
|
Advertising expense decreased $238,000 primarily due to less spending at the mortgage
banking segment as customer leads were acquired in the New Mexico branch acquisition during the prior year. Offsetting the decrease at the mortgage banking segment, advertising increased slightly at the community banking segment to promote
deposit products.
|
|
·
|
Data processing expense increased $838,000 to $3.6 million during the year ended December
31, 2019. This was primarily due to increases at the community banking and mortgage banking segments for new contracts and investments in technology resources to support future growth.
|
|
·
|
Professional fees expense increased $1.3 million, or 54.9%, to $3.6 million primarily as a
result of an increase in legal fees at the mortgage banking segment for ongoing litigation partially offset by lower consulting fees at the community banking segment.
|
|
·
|
Real estate owned expense decreased $147,000, to $146,000 of income during the year ended December 31, 2019 compared to $1,000 of
expense during the year ended December 31, 2018. Property management expense, not including gains/losses on sales of real estate owned, decreased $108,000 to $158,000 during 2019 compared to 2018 due to a reduction in the number of
properties under management during the year. Real estate owned writedowns decreased $308,000 as there were no writedowns for 2019 . Net gains on sales of real estate owned decreased $270,000 to $304,000 during 2019.
|
|
·
|
Loan processing expense decreased $84,000 to $3.3 million during the year ended December 31,
2019. This was driven by an decrease in credit report fees at the mortgage banking segment.
|
|
·
|
Other noninterest expense decreased $2.0 million to $8.3 million primarily due to lower
expenses at both the community banking and mortgage banking segments. At the community banking segment, other noninterest expense decreased $510,000 primarily due to a decrease in loan origination expenses and FDIC insurance expense as two
credits were granted in 2019. At the mortgage banking segment, other noninterest expenses decreased $1.8 million primarily due to lower branch loss reserves as underperforming branches were closed as well as lower hiring, training, and
recruiting expenses partially offset by an increase in provision for loan sale losses.
|
Income Taxes
Income tax expense increased $2.1 million to $11.7 million during the year ended December 31, 2019, compared to $9.5
million during the year ended December 31, 2018. Income tax expense was recognized during the year ended December 31, 2019 at an effective rate of 24.5% compared to an effective rate of 23.6% during the year ended December 31, 2018. During the year
ended December 31, 2019, the Company recognized a benefit of approximately $114,000 related to stock awards exercised compared to a benefit of $197,000 recognized during the year ended December 31, 2018.
- 47 -
Liquidity and Capital Resources
We maintain liquid assets at levels we consider adequate to meet our liquidity needs. The liquidity ratio is equal to
average daily cash and cash equivalents for the period divided by average total assets. We adjust our liquidity levels to fund loan commitments, repay our borrowings, fund deposit outflows and pay real estate taxes on mortgage loans. We also adjust
liquidity as appropriate to meet asset and liability management objectives. The operational adequacy of our liquidity position at any point in time is dependent upon the judgment of the Chief Financial Officer as supported by the Asset/Liability
Committee. Liquidity is monitored on a daily, weekly and monthly basis using a variety of measurement tools and indicators. Regulatory liquidity, as required by the WDFI, is based on current liquid assets as a percentage of the prior month’s average
deposits and short-term borrowings. Minimum primary liquidity is equal to 4.0% of deposits and short-term borrowings and minimum total regulatory liquidity is equal to 8.0% of deposits and short-term borrowings. The Bank’s primary and total
regulatory liquidity at December 31, 2019 were 10.9% and 21.7%, respectively.
Our primary sources of liquidity are deposits, amortization and repayment of loans, sales of loans held for sale,
maturities of investment securities and other short-term investments, and earnings and funds provided from operations. While scheduled principal repayments on loans are a relatively predictable source of funds, deposit flows and loan repayments are
greatly influenced by market interest rates, economic conditions, and rates offered by our competitors. We set the interest rates on our deposits to maintain a desired level of total deposits. In addition, we invest excess funds in short-term,
interest-earning assets, which provide liquidity to meet lending requirements. Additional sources of liquidity used to manage long- and short-term cash flows include advances from the FHLB.
A portion of our liquidity consists of cash and cash equivalents, which are a product of our operating, investing and
financing activities. At December 31, 2019 and 2018, $74.3 million and $86.1 million, respectively, of our assets were invested in cash and cash equivalents. Our primary sources of cash are principal repayments on loans, proceeds from the calls and
maturities of debt and mortgage related securities, increases in deposit accounts, Federal funds purchased and advances from the FHLB.
Our cash flows are derived from operating activities, investing activities and financing activities as reported in our
Consolidated Statements of Cash Flows included in our Consolidated Financial Statements.
During the years ended December 31, 2019, and 2018, we originated $2.85 billion and $2.51 billion in loans for sale and
sold loans of $2.90 billion and $2.63 billion. During the years ended December 31, 2019, and 2018, loan originations net of loan repayments resulted in a negative cash flows of $9.9 million and $87.6 million. Cash received from the principal
repayments of debt and mortgage related securities and maturity and calls of debt securities totaled $40.0 million and $39.0 million for the years ended December 31, 2019 and 2018, respectively. We purchased $28.9 million and $28.1 million in debt
securities and mortgage related securities classified as available for sale during the years ended December 31, 2019 and 2018, respectively. The net increases in deposits were $29.3 million and $71.1 million for the years ending December 31, 2019 and
2018. We received a $474,000 death benefit on a bank owned life insurance policy in 2018. There was a net increase in borrowings of $48.5 million and $48.8 million for the years ended December 31, 2019 and 2018. During the years ended December 31,
2019 and 2018, we repurchased common stock of $22.8 million and $19.2 million, respectively. During the years ended December 31, 2019 and 2018, we paid cash dividends on common stock of $26.0 million and $27.1 million, respectively.
Deposits increased by $29.3 million from December 31, 2018 to December 31, 2019. The increase was driven by an increase
of $34.4 million in money market and savings deposits and $3.9 million in time deposits offset by a decrease of $9.0 million in demand deposits. Deposit flows are generally affected by the level of interest rates, market conditions and products
offered by local competitors and other factors.
Liquidity management is both a daily and longer-term function of business management. If we require funds beyond our
ability to generate them internally, borrowing agreements exist with the FHLB which provide an additional source of funds. At December 31, 2019, we had $470.0 million in long term advances from the FHLB with contractual maturity dates in 2027, 2028,
and 2029. The 2027 advance has a contractual maturity date in December 2027. The 2028 advance maturities have single call options in March 2020, March 2021, May 2020, and May 2021, along with two advances that have quarterly call options beginning
in June 2020 and September 2020. The 2029 advance maturities have quarterly call option currently available and the other options beginning November 2020, August 2021, and May 2022. As an additional source of funds, the mortgage banking segment has
a repurchase agreement. At December 31, 2019, we had $13.6 million outstanding under the repurchase agreement with a total outstanding commitment of $35.0 million.
At December 31, 2019, we had outstanding commitments to originate loans receivable of $13.4 million. In addition, at
December 31, 2019, we had unfunded commitments under construction loans of $90.4 million, unfunded commitments under business lines of credit of $14.6 million and unfunded commitments under home equity lines of credit and standby letters of credit of
$14.7 million. At December 31, 2019, certificates of deposit scheduled to mature in less than one year totaled $665.7 million. Based on prior
experience, management believes that a significant portion of such deposits will remain with us, although there can be no assurance that this will be the case. In the event a significant portion of our deposits are not retained by us, we will have to
utilize other funding sources, such as Federal Home Loan Bank of Chicago advances, Federal Reserve Discount Window or brokered deposits to maintain our level of assets. However, such borrowings may not be available on attractive terms, or at all, if
and when needed. Alternatively, we would reduce our level of liquid assets, such as our cash and cash equivalents and securities available for sale in order to meet funding needs. In addition, the cost of such deposits may be significantly higher if
market interest rates are higher or there is an increased amount of competition for deposits in our market area at the time of renewal.
Waterstone Financial, Inc. and WaterStone Bank are subject to various regulatory capital requirements, including a
risk-based capital measure. The risk-based capital guidelines include both a definition of capital and a framework for calculating risk-weighted assets by assigning assets and off-balance sheet items to broad risk categories. At December 31, 2019,
Waterstone Financial, Inc. and WaterStone Bank exceeded all regulatory capital requirements and is considered “well capitalized” under regulatory guidelines. See “Supervision and Regulation—Capital Requirements” and Note 9 of the notes to the
consolidated financial statements.
- 48 -
Capital
Shareholders’ equity decreased $6.0 million, or 1.5%, to $393.7 million at December 31, 2019 from $399.7 million at
December 31, 2018. Shareholders' equity decreased primarily due to the declaration of regular dividends and a special dividend and the repurchase of stock. Partially offsetting the decreases were increases from net income, stock options exercised,
the increase in the fair value of the securities portfolio, and unearned ESOP shares as they continue to vest.
The Company's Board of Directors authorized a stock repurchase program in the second quarter of 2019. The timing of the
repurchases will depend on certain factors, including but not limited to, market conditions and prices, available funds and alternative uses of capital. The stock repurchase program may be carried out through open-market purchases, block trades,
negotiated private transactions and pursuant to a trading plan that will be adopted in accordance with Rule 10b5-1 under the Securities Exchange Act of 1934. Repurchased shares are held by the Company as authorized but unissued shares.
The Company had repurchased 8,379,303 shares at an average price of $14.11 under previously approved stock repurchase
plans as of December 31, 2019. The Company is authorized to purchase up to 1.3 million additional shares under the current approved stock repurchase program as of December 31, 2019. The Company also repurchased shares for minimum tax withholding
settlements on equity compensation. These purchases are not included in the 8,379,303 total above and do not count against the maximum number of shares that may yet be purchased under the Board of Directors' authorization.
Contractual Obligations, Commitments, Contingent Liabilities, and Off-balance Sheet Arrangements
WaterStone Bank has various financial obligations, including contractual obligations and commitments that may require
future cash payments. The following tables present information indicating various non-deposit contractual obligations and commitments of WaterStone Bank as of December 31, 2019 and the respective maturity dates.
Contractual Obligations
|
More Than
|
More Than
|
|||||||||||||||||||
|
One Year
|
Three Years
|
|||||||||||||||||||
|
One Year or
|
Through
|
Through Five
|
Over Five
|
|||||||||||||||||
|
Total
|
Less
|
Three Years
|
Years
|
Years
|
||||||||||||||||
|
(In Thousands)
|
||||||||||||||||||||
|
Deposits without a stated maturity (1)
|
$
|
332,217
|
$
|
332,217
|
$
|
-
|
$
|
-
|
$
|
-
|
||||||||||
|
Time deposit (1)
|
739,771
|
665,703
|
72,401
|
1,667
|
-
|
|||||||||||||||
|
Repurchase agreements (1)
|
13,562
|
13,562
|
-
|
-
|
-
|
|||||||||||||||
|
Federal Home Loan Bank advances (2)
|
470,000
|
-
|
-
|
-
|
470,000
|
|||||||||||||||
|
Operating leases (3)
|
10,238
|
3,308
|
4,173
|
1,774
|
983
|
|||||||||||||||
|
Total Contractual Obligations
|
$
|
1,565,788
|
$
|
1,014,790
|
$
|
76,574
|
$
|
3,441
|
$
|
470,983
|
||||||||||
_______________
(1) Excludes interest
(2) Secured under a blanket security agreement on qualifying assets, principally, mortgage
loans. Excludes interest that will accrue on the advances. See call provisions in Note 8 - Borrowings
(3) Represents non-cancellable operating leases for offices and equipment.
Other Commitments
|
More than
|
More than
|
|||||||||||||||||||
|
One Year
|
Three
|
|||||||||||||||||||
|
through
|
Years
|
|||||||||||||||||||
|
One Year
|
Three
|
Through
|
Over Five
|
|||||||||||||||||
|
Total
|
or Less
|
Years
|
Five Years
|
Years
|
||||||||||||||||
|
(In Thousands)
|
||||||||||||||||||||
|
Real estate loan commitments(1)
|
$
|
13,389
|
$
|
13,389
|
$
|
-
|
$
|
-
|
$
|
-
|
||||||||||
|
Unused portion of home equity lines of credit(2)
|
13,776
|
13,776
|
-
|
-
|
-
|
|||||||||||||||
|
Unused portion of construction loans(3)
|
90,439
|
90,439
|
-
|
-
|
-
|
|||||||||||||||
|
Unused portion of business lines of credit
|
14,623
|
14,623
|
-
|
-
|
-
|
|||||||||||||||
|
Standby letters of credit
|
885
|
885
|
-
|
-
|
-
|
|||||||||||||||
_______________
(1) Commitments for loans are extended to customers for up to 90 days after which they expire.
(2) Unused portions of home equity loans are available to the borrower for up to 10 years.
(3) Unused portions of construction loans are available to the borrower for up to one year.
See Note 14 - Commitments, Off-Balance Sheet Arrangements, and Contingent Liabilities of the notes to consolidated
financial statements for additional information.
- 49 -
Impact of Inflation and Changing Prices
The financial statements and accompanying notes have been prepared in accordance with accounting principles generally
accepted in the United States ("GAAP"). GAAP generally requires the measurement of financial position and operating results in terms of historical dollars without consideration for changes in the relative purchasing power of money over time due to
inflation. The impact of inflation is reflected in the increased cost of our operations. Unlike industrial companies, our assets and liabilities are primarily monetary in nature. As a result, changes in market interest rates have a greater impact on
performance than do the effects of inflation.
Quarterly Financial Information
The following table sets forth certain unaudited quarterly data for the periods indicated:
|
Quarter Ended
|
||||||||||||||||
|
March 31
|
June 30
|
September 30
|
December 31
|
|||||||||||||
|
(In thousands, except per share data)
|
||||||||||||||||
|
2019 (unaudited)
|
||||||||||||||||
|
Interest income
|
$
|
19,172
|
$
|
19,913
|
$
|
20,378
|
$
|
20,278
|
||||||||
|
Interest expense
|
6,236
|
6,932
|
7,224
|
7,152
|
||||||||||||
|
Net interest income
|
12,936
|
12,981
|
13,154
|
13,126
|
||||||||||||
|
Provision (credit) for loan losses
|
(680
|
)
|
30
|
(80
|
)
|
(170
|
)
|
|||||||||
|
Net interest income after provision for loan losses
|
13,616
|
12,951
|
13,234
|
13,296
|
||||||||||||
|
Total noninterest income
|
24,257
|
35,190
|
37,494
|
33,809
|
||||||||||||
|
Total noninterest expense
|
29,349
|
35,355
|
36,232
|
35,337
|
||||||||||||
|
Income before income taxes
|
8,524
|
12,786
|
14,496
|
11,768
|
||||||||||||
|
Income taxes
|
1,982
|
3,143
|
3,572
|
2,974
|
||||||||||||
|
Net income
|
$
|
6,542
|
$
|
9,643
|
$
|
10,924
|
$
|
8,794
|
||||||||
|
Income per share – basic
|
$
|
0.25
|
$
|
0.37
|
$
|
0.42
|
$
|
0.34
|
||||||||
|
Income per share - diluted
|
$
|
0.24
|
$
|
0.37
|
$
|
0.42
|
$
|
0.34
|
||||||||
|
2018 (unaudited)
|
||||||||||||||||
|
Interest income
|
$
|
16,963
|
$
|
18,363
|
$
|
19,046
|
$
|
19,328
|
||||||||
|
Interest expense
|
3,822
|
4,643
|
5,196
|
5,862
|
||||||||||||
|
Net interest income
|
13,141
|
13,720
|
13,850
|
13,466
|
||||||||||||
|
Provision (credit) for loan losses
|
(880
|
)
|
(220
|
)
|
40
|
-
|
||||||||||
|
Net interest income after provision for loan losses
|
14,021
|
13,940
|
13,810
|
13,466
|
||||||||||||
|
Total noninterest income
|
25,183
|
33,318
|
34,062
|
25,636
|
||||||||||||
|
Total noninterest expense
|
30,147
|
34,737
|
36,426
|
31,846
|
||||||||||||
|
Income before income taxes
|
9,057
|
12,521
|
11,446
|
7,256
|
||||||||||||
|
Income taxes
|
2,104
|
3,101
|
2,743
|
1,578
|
||||||||||||
|
Net income
|
$
|
6,953
|
$
|
9,420
|
$
|
8,703
|
$
|
5,678
|
||||||||
|
Income per share – basic
|
$
|
0.25
|
$
|
0.34
|
$
|
0.32
|
$
|
0.21
|
||||||||
|
Income per share - diluted
|
$
|
0.25
|
$
|
0.34
|
$
|
0.31
|
$
|
0.21
|
||||||||
- 50 -
Management of Market Risk
General. The majority of our assets and liabilities
are monetary in nature. Consequently, our most significant form of market risk is interest rate risk. Our assets, consisting primarily of mortgage loans, have longer maturities than our liabilities, consisting primarily of deposits. As a result, a
principal part of our business strategy is to manage interest rate risk and reduce the exposure of our net interest income to changes in market interest rates. Accordingly, WaterStone Bank’s board of directors has established an Asset/Liability
Committee which is responsible for evaluating the interest rate risk inherent in our assets and liabilities, for determining the level of risk that is appropriate given our business strategy, operating environment, capital, liquidity and performance
objectives, and for managing this risk consistent with the guidelines approved by the board of directors. Management monitors the level of interest rate risk on a regular basis and the Asset/Liability Committee meets at least weekly to review our
asset/liability policies and interest rate risk position, which are evaluated quarterly.
We have sought to manage our interest rate risk in order to minimize the exposure of our earnings and capital to changes
in interest rates. We have implemented the following strategies to manage our interest rate risk: (i) emphasizing variable rate loans including variable rate one- to four-family, and commercial real estate loans as well as three to five year
commercial real estate balloon loans; (ii) reducing and shortening the expected average life of the investment portfolio; and (iii) whenever possible, lengthening the term structure of our deposit base and our borrowings from the FHLBC. These
measures should reduce the volatility of our net interest income in different interest rate environments.
Income
Simulation. Simulation analysis is an estimate of our interest rate risk exposure at a particular point in time. At least quarterly we
review the potential effect changes in interest rates may have on the repayment or repricing of rate sensitive assets and funding requirements of rate sensitive liabilities. Our most recent simulation uses projected repricing of assets and
liabilities at December 31, 2019 on the basis of contractual maturities, anticipated repayments and scheduled rate adjustments. Prepayment rate assumptions may have a significant impact on interest income simulation results. Because of the large
percentage of loans and mortgage-backed securities we hold, rising or falling interest rates may have a significant impact on the actual prepayment speeds of our mortgage related assets that may in turn affect our interest rate sensitivity position.
When interest rates rise, prepayment speeds slow and the average expected lives of our assets would tend to lengthen more than the expected average lives of our liabilities and therefore would most likely have a positive impact on net interest income
and earnings.
The following interest rate scenario displays the percentage change in net interest income over a one-year time horizon
assuming increases of 100, 200 and 300 basis points and a decrease of 100 basis points. The results incorporate actual cash flows and repricing characteristics for balance sheet accounts following an instantaneous parallel change in market rates
based upon a static (no growth balance sheet).
Analysis of Net Interest Income Sensitivity
|
Immediate Change in Rates
|
||||||||||||||||
|
+300
|
+200
|
+100
|
-100
|
|||||||||||||
|
(Dollar Amounts in Thousands)
|
||||||||||||||||
|
As of December 31, 2019
|
||||||||||||||||
|
Dollar Change
|
$
|
886
|
1,209
|
1,047
|
(1,440
|
)
|
||||||||||
|
Percentage Change
|
1.72
|
%
|
2.35
|
2.03
|
(2.80
|
)
|
||||||||||
At December 31, 2019, a 100 basis point instantaneous increase in interest rates had the effect of increasing forecast
net interest income over the next 12 months by 2.03% while a 100 basis point decrease in rates had the effect of decreasing net interest income by 2.80%.
- 51 -
Report of Independent Registered Public Accounting Firm
To the Shareholders and the Board of Directors of Waterstone Financial, Inc.
Opinion on the Financial Statements
We have audited the accompanying consolidated statements of financial condition of Waterstone Financial, Inc. and Subsidiaries (the
Company) as of December 31, 2019 and 2018, the related consolidated statements of operations, comprehensive income, changes in shareholders' equity and cash flows for each of the three years in the period ended December 31, 2019, and the related
notes to the consolidated financial statements (collectively, the financial statements). In our opinion, the financial statements present fairly, in all material respects, the financial position of the Company as of December 31, 2019 and 2018, and
the results of its operations and its cash flows for each of the three years in the period ended December 31, 2019, in conformity with accounting principles generally accepted in the United States of America.
We have also audited, in accordance with the standards of the Public Company Accounting Oversight Board (United States) (PCAOB), the
Company's internal control over financial reporting as of December 31, 2019, based on criteria established in Internal Control — Integrated Framework
issued by the Committee of Sponsoring Organizations of the Treadway Commission in 2013, and our report dated March 13, 2020 expressed an unqualified opinion on the effectiveness of the Company's internal control over financial reporting.
Basis for Opinion
These financial statements are the responsibility of the Company’s management. Our responsibility is to express an opinion on the Company’s
financial statements based on our audits. We are a public accounting firm registered with the PCAOB and are required to be independent with respect to the Company in accordance with U.S. federal securities laws and the applicable rules and
regulations of the Securities and Exchange Commission and the PCAOB.
We conducted our audits in accordance with the standards of the PCAOB. Those standards require that we plan and perform the audits to
obtain reasonable assurance about whether the financial statements are free of material misstatement, whether due to error or fraud. Our audits included performing procedures to assess the risks of material misstatement of the financial statements,
whether due to error or fraud, and performing procedures that respond to those risks. Such procedures included examining, on a test basis, evidence regarding the amounts and disclosures in the financial statements. Our audits also included evaluating
the accounting principles used and significant estimates made by management, as well as evaluating the overall presentation of the financial statements. We believe that our audits provide a reasonable basis for our opinion.
|
|
/s/ RSM US LLP
|
|
We have served as the Company's auditor since 2014.
|
|
|
Chicago, Illinois
|
|
|
March 13, 2020
|
|
- 52 -
Waterstone Financial, Inc. and Subsidiaries
Consolidated Statements of Financial Condition
December 31, 2019 and 2018
|
|
December 31,
|
|||||||
|
|
2019
|
2018
|
||||||
|
Assets
|
(In Thousands, except share data)
|
|||||||
|
Cash
|
$
|
52,814
|
48,234
|
|||||
|
Federal funds sold
|
12,704
|
25,100
|
||||||
|
Interest-earning deposits in other financial institutions and other short term investments
|
8,782
|
12,767
|
||||||
|
Cash and cash equivalents
|
74,300
|
86,101
|
||||||
|
Securities available for sale (at fair value)
|
178,476
|
185,720
|
||||||
|
Loans held for sale (at fair value)
|
220,123
|
141,616
|
||||||
|
Loans receivable
|
1,388,031
|
1,379,148
|
||||||
|
Less: Allowance for loan losses
|
12,387
|
13,249
|
||||||
|
Loans receivable, net
|
1,375,644
|
1,365,899
|
||||||
|
|
||||||||
|
Office properties and equipment, net
|
25,028
|
24,524
|
||||||
|
Federal Home Loan Bank stock (at cost)
|
21,150
|
19,350
|
||||||
|
Cash surrender value of life insurance
|
69,665
|
67,550
|
||||||
|
Real estate owned, net
|
748
|
2,152
|
||||||
|
Prepaid expenses and other assets
|
31,213
|
22,469
|
||||||
|
Total assets
|
$
|
1,996,347
|
1,915,381
|
|||||
|
|
||||||||
|
Liabilities and Shareholders’ Equity
|
||||||||
|
Liabilities:
|
||||||||
|
Demand deposits
|
$
|
130,063
|
139,111
|
|||||
|
Money market and savings deposits
|
197,942
|
163,511
|
||||||
|
Time deposits
|
739,771
|
735,873
|
||||||
|
Total deposits
|
1,067,776
|
1,038,495
|
||||||
|
|
||||||||
|
Borrowings
|
483,562
|
435,046
|
||||||
|
Advance payments by borrowers for taxes
|
4,212
|
4,371
|
||||||
|
Other liabilities
|
47,111
|
37,790
|
||||||
|
Total liabilities
|
1,602,661
|
1,515,702
|
||||||
|
|
||||||||
|
Shareholders’ equity:
|
||||||||
|
Preferred stock (par value $.01 per share) Authorized - 50,000,000 shares in 2019 and 2018, no
shares issued
|
-
|
-
|
||||||
|
Common stock (par value $.01 per share) Authorized - 100,000,000 shares in 2019 and 2018 Issued
- 27,148,411 in 2019 and 28,463,239 in 2018 Outstanding - 27,148,411 in 2019 and 28,463,239 in 2018
|
271
|
285
|
||||||
|
Additional paid-in capital
|
211,997
|
232,406
|
||||||
|
Retained earnings
|
197,393
|
187,153
|
||||||
|
Unearned ESOP shares
|
(16,617
|
)
|
(17,804
|
)
|
||||
|
Accumulated other comprehensive income (loss), net of taxes
|
642
|
(2,361
|
)
|
|||||
|
Total shareholders’ equity
|
393,686
|
399,679
|
||||||
|
Total liabilities and shareholders’ equity
|
$
|
1,996,347
|
1,915,381
|
|||||
See accompanying notes to consolidated financial statements
- 53 -
Waterstone Financial, Inc. and Subsidiaries
Consolidated Statements of Operations
Years ended December 31, 2019, 2018 and 2017
|
|
Years ended December 31,
|
|||||||||||
|
|
2019
|
2018
|
2017
|
|||||||||
|
|
(In Thousands, except per share amounts)
|
|||||||||||
|
Interest income:
|
||||||||||||
|
Loans
|
$
|
72,235
|
66,966
|
60,824
|
||||||||
|
Mortgage-related securities
|
2,978
|
2,648
|
2,646
|
|||||||||
|
Debt securities, federal funds sold and short-term investments
|
4,528
|
4,086
|
3,625
|
|||||||||
|
Total interest income
|
79,741
|
73,700
|
67,095
|
|||||||||
|
Interest expense:
|
||||||||||||
|
Deposits
|
17,278
|
11,627
|
7,739
|
|||||||||
|
Borrowings
|
10,266
|
7,896
|
8,623
|
|||||||||
|
Total interest expense
|
27,544
|
19,523
|
16,362
|
|||||||||
|
Net interest income
|
52,197
|
54,177
|
50,733
|
|||||||||
|
Provision (credit) for loan losses
|
(900
|
)
|
(1,060
|
)
|
(1,166
|
)
|
||||||
|
Net interest income after provision for loan losses
|
53,097
|
55,237
|
51,899
|
|||||||||
|
Noninterest income:
|
||||||||||||
|
Service charges on loans and deposits
|
2,363
|
1,680
|
1,625
|
|||||||||
|
Increase in cash surrender value of life insurance
|
1,935
|
1,848
|
1,807
|
|||||||||
|
Mortgage banking income
|
125,666
|
113,151
|
120,044
|
|||||||||
|
Loss on sale of available for sale securities
|
-
|
-
|
(107
|
)
|
||||||||
|
Other
|
786
|
1,520
|
1,044
|
|||||||||
|
Total noninterest income
|
130,750
|
118,199
|
124,413
|
|||||||||
|
Noninterest expenses:
|
||||||||||||
|
Compensation, payroll taxes, and other employee benefits
|
101,718
|
97,784
|
97,084
|
|||||||||
|
Occupancy, office furniture, and equipment
|
10,606
|
10,855
|
10,178
|
|||||||||
|
Advertising
|
3,885
|
4,123
|
3,333
|
|||||||||
|
Data processing
|
3,630
|
2,792
|
2,439
|
|||||||||
|
Communications
|
1,359
|
1,611
|
1,560
|
|||||||||
|
Professional fees
|
3,605
|
2,327
|
2,656
|
|||||||||
|
Real estate owned
|
(146
|
)
|
1
|
379
|
||||||||
|
Loan processing expense
|
3,288
|
3,372
|
3,062
|
|||||||||
|
Other
|
8,328
|
10,291
|
11,188
|
|||||||||
|
Total noninterest expenses
|
136,273
|
133,156
|
131,879
|
|||||||||
|
Income before income taxes
|
47,574
|
40,280
|
44,433
|
|||||||||
|
Income tax expense
|
11,671
|
9,526
|
18,469
|
|||||||||
|
Net income
|
$
|
35,903
|
30,754
|
25,964
|
||||||||
|
Income per share:
|
||||||||||||
|
Basic
|
$
|
1.38
|
1.12
|
0.95
|
||||||||
|
Diluted
|
$
|
1.37
|
1.11
|
0.93
|
||||||||
|
Weighted average shares outstanding:
|
||||||||||||
|
Basic
|
26,021
|
27,363
|
27,467
|
|||||||||
|
Diluted
|
26,247
|
27,634
|
27,899
|
|||||||||
See accompanying notes to consolidated financial statements
- 54 -
Waterstone Financial, Inc. and Subsidiaries
Consolidated Statements of Comprehensive Income
Years ended December 31, 2019, 2018 and 2017
|
|
Years ended December 31,
|
|||||||||||
|
|
2019
|
2018
|
2017
|
|||||||||
|
|
(In Thousands)
|
|||||||||||
|
Net income
|
$
|
35,903
|
30,754
|
25,964
|
||||||||
|
Other comprehensive income (loss), net of tax:
|
||||||||||||
|
Net unrealized holding gain (loss) on available for sale securities arising during the period,
net of tax (expense) benefit of ($1,122), $710 and $106 respectively
|
3,003
|
(1,889
|
)
|
(159
|
)
|
|||||||
|
Recognition of net deferred tax liability revaluation due to tax law change
|
-
|
5
|
(5
|
)
|
||||||||
|
Reclassification adjustment for net loss on available for sale securities realized during the
period, net of tax benefit of $0, $0 and ($42), respectively
|
-
|
-
|
65
|
|||||||||
|
Total other comprehensive income (loss)
|
3,003
|
(1,884
|
)
|
(99
|
)
|
|||||||
|
Comprehensive income
|
$
|
38,906
|
28,870
|
25,865
|
||||||||
See accompanying notes to consolidated financial statements
- 55 -
Waterstone Financial, Inc. and Subsidiaries
Consolidated Statements of Changes in Shareholders’ Equity
Years Ended December 31, 2019, 2018 and 2017
|
|
Common Stock
|
|||||||||||||||||||||||||||
|
|
Shares
|
Amount
|
Additional
Paid-In
Capital
|
Retained
Earnings
|
Unearned
ESOP
Shares
|
Accumulated
Other
Comprehensive
Income (Loss)
|
Total
Shareholders'
Equity
|
|||||||||||||||||||||
|
|
||||||||||||||||||||||||||||
|
|
||||||||||||||||||||||||||||
|
Balances at December 31, 2016
|
29,430
|
$
|
294
|
246,387
|
184,565
|
(20,178
|
)
|
(378
|
)
|
410,690
|
||||||||||||||||||
|
|
||||||||||||||||||||||||||||
|
Comprehensive income:
|
||||||||||||||||||||||||||||
|
Net income
|
-
|
$
|
-
|
-
|
25,964
|
-
|
-
|
25,964
|
||||||||||||||||||||
|
Other comprehensive loss:
|
-
|
-
|
-
|
-
|
-
|
(99
|
)
|
(99
|
)
|
|||||||||||||||||||
|
Total comprehensive income
|
25,865
|
|||||||||||||||||||||||||||
|
ESOP shares committed to be released to Plan participants
|
-
|
-
|
769
|
-
|
1,187
|
-
|
1,956
|
|||||||||||||||||||||
|
Cash dividends, $0.98 per share
|
-
|
-
|
-
|
(27,171
|
)
|
-
|
-
|
(27,171
|
)
|
|||||||||||||||||||
|
Stock compensation activity
|
194
|
2
|
1,050
|
-
|
-
|
-
|
1,052
|
|||||||||||||||||||||
|
Stock based compensation expense
|
-
|
-
|
1,902
|
-
|
-
|
-
|
1,902
|
|||||||||||||||||||||
|
Purchase of common stock returned to authorized but unissued
|
(123
|
)
|
(1
|
)
|
(2,189
|
)
|
-
|
-
|
-
|
(2,190
|
)
|
|||||||||||||||||
|
|
||||||||||||||||||||||||||||
|
Balances at December 31, 2017
|
29,501
|
$
|
295
|
247,919
|
183,358
|
(18,991
|
)
|
(477
|
)
|
412,104
|
||||||||||||||||||
|
|
||||||||||||||||||||||||||||
|
Comprehensive income:
|
||||||||||||||||||||||||||||
|
Net income
|
-
|
$
|
-
|
-
|
30,754
|
-
|
-
|
30,754
|
||||||||||||||||||||
|
Other comprehensive loss:
|
-
|
-
|
-
|
-
|
-
|
(1,884
|
)
|
(1,884
|
)
|
|||||||||||||||||||
|
Total comprehensive income
|
28,870
|
|||||||||||||||||||||||||||
|
Reclassification for net deferred tax liability revaluation
|
-
|
-
|
-
|
(5
|
)
|
-
|
-
|
(5
|
)
|
|||||||||||||||||||
|
ESOP shares committed to be released to Plan participants
|
-
|
-
|
609
|
-
|
1,187
|
-
|
1,796
|
|||||||||||||||||||||
|
Cash dividends, $0.98 per share
|
-
|
-
|
-
|
(26,954
|
)
|
-
|
-
|
(26,954
|
)
|
|||||||||||||||||||
|
Stock compensation activity
|
103
|
1
|
1,303
|
-
|
-
|
-
|
1,304
|
|||||||||||||||||||||
|
Stock based compensation expense
|
-
|
-
|
1,760
|
-
|
-
|
-
|
1,760
|
|||||||||||||||||||||
|
Purchase of common stock returned to authorized but unissued
|
(1,141
|
)
|
(11
|
)
|
(19,185
|
)
|
-
|
-
|
-
|
(19,196
|
)
|
|||||||||||||||||
|
Balances at December 31, 2018
|
28,463
|
$
|
285
|
232,406
|
187,153
|
(17,804
|
)
|
(2,361
|
)
|
399,679
|
||||||||||||||||||
|
Comprehensive income:
|
||||||||||||||||||||||||||||
|
Net income
|
-
|
$
|
-
|
-
|
35,903
|
-
|
-
|
35,903
|
||||||||||||||||||||
|
Other comprehensive income:
|
-
|
-
|
-
|
-
|
-
|
3,003
|
3,003
|
|||||||||||||||||||||
|
Total comprehensive income
|
38,906
|
|||||||||||||||||||||||||||
|
ESOP shares committed to be released to Plan participants
|
-
|
-
|
618
|
-
|
1,187
|
-
|
1,805
|
|||||||||||||||||||||
|
Cash dividends, $0.98 per share
|
-
|
-
|
-
|
(25,663
|
)
|
-
|
-
|
(25,663
|
)
|
|||||||||||||||||||
|
Stock compensation activity
|
50
|
-
|
659
|
-
|
-
|
-
|
659
|
|||||||||||||||||||||
|
Stock based compensation expense
|
-
|
-
|
1,067
|
-
|
-
|
-
|
1,067
|
|||||||||||||||||||||
|
Purchase of common stock returned to authorized but unissued
|
(1,365
|
)
|
(14
|
)
|
(22,753
|
)
|
-
|
-
|
-
|
(22,767
|
)
|
|||||||||||||||||
|
Balances at December 31, 2019
|
27,148
|
$
|
271
|
211,997
|
197,393
|
(16,617
|
)
|
642
|
393,686
|
|||||||||||||||||||
See accompanying notes to consolidated financial statements
- 56 -
Waterstone Financial, Inc. and Subsidiaries
Consolidated Statements of Cash Flows
Years ended December 31, 2019, 2018 and 2017
|
|
Years ended December 31,
|
||||||||||||||
|
|
2019
|
2018
|
2017
|
||||||||||||
|
|
(In Thousands)
|
||||||||||||||
|
Operating activities:
|
|||||||||||||||
|
Net income
|
|
$
|
35,903
|
|
30,754
|
|
25,964
|
||||||||
|
Adjustments to reconcile net income to net cash (used in) provided by operating activities:
|
|
|
|
||||||||||||
|
(Credit) provision for loan losses
|
|
(900
|
)
|
|
(1,060
|
)
|
|
(1,166
|
)
|
||||||
|
Provision for depreciation
|
|
2,507
|
|
2,296
|
|
2,050
|
|||||||||
|
Deferred income taxes
|
|
639
|
|
535
|
|
3,079
|
|||||||||
|
Stock based compensation
|
|
1,067
|
|
1,760
|
|
1,902
|
|||||||||
|
Net amortization of premium/discount on debt and mortgage related securities
|
|
205
|
|
444
|
|
682
|
|||||||||
|
Amortization of unearned ESOP shares
|
|
1,805
|
|
1,796
|
|
1,956
|
|||||||||
|
Amortization and valuation allowance on mortgage servicing rights
|
181
|
191
|
106
|
||||||||||||
|
Gain on sale of loans held for sale
|
|
(128,928
|
)
|
|
(109,526
|
)
|
|
(121,951
|
)
|
||||||
|
Loans originated for sale
|
|
(2,853,222
|
)
|
|
(2,509,827
|
)
|
|
(2,458,370
|
)
|
||||||
|
Proceeds on sales of loans originated for sale
|
|
2,903,643
|
|
2,627,634
|
|
2,655,673
|
|||||||||
|
Increase in accrued interest receivable
|
|
(7
|
)
|
|
(413
|
)
|
|
(643
|
)
|
||||||
|
Increase in cash surrender value of life insurance
|
|
(1,935
|
)
|
|
(1,848
|
)
|
|
(1,807
|
)
|
||||||
|
Increase (decrease) in accrued interest on deposits and borrowings
|
|
164
|
|
509
|
|
(30
|
)
|
||||||||
|
Decrease (increase) in prepaid income tax
|
|
330
|
|
(1,178
|
)
|
|
(1,686
|
)
|
|||||||
|
Loss on sale of available for sale securities
|
|
-
|
|
-
|
|
107
|
|||||||||
|
Net gain on real estate owned
|
|
(304
|
)
|
|
(265
|
)
|
|
(24
|
)
|
||||||
|
Gain on sale of mortgage servicing rights
|
-
|
(417
|
)
|
(178
|
)
|
||||||||||
|
Change in other assets and other liabilities, net
|
|
(1,367
|
)
|
|
1,551
|
|
1,433
|
||||||||
|
Net cash (used in) provided by operating activities
|
|
(40,219
|
)
|
|
42,936
|
|
107,097
|
||||||||
|
|
|
|
|
||||||||||||
|
Investing
activities:
|
|
|
|
||||||||||||
|
Net increase in loans receivable
|
|
(9,896
|
)
|
|
(87,648
|
)
|
|
(116,887
|
)
|
||||||
|
Net change in FHLB Stock
|
(1,800
|
)
|
(2,475
|
)
|
(3,600
|
)
|
|||||||||
|
Purchases of:
|
|
|
|
||||||||||||
|
Debt securities
|
|
-
|
|
-
|
|
(6,140
|
)
|
||||||||
|
Mortgage related securities
|
|
(28,860
|
)
|
|
(28,058
|
)
|
|
(16,827
|
)
|
||||||
|
Premises and equipment, net
|
|
(3,114
|
)
|
|
(3,962
|
)
|
|
(1,577
|
)
|
||||||
|
Bank owned life insurance
|
|
(180
|
)
|
|
(180
|
)
|
|
(2,680
|
)
|
||||||
|
Mortgage banking branch
|
-
|
(163
|
)
|
-
|
|||||||||||
|
Proceeds from:
|
|
|
|
||||||||||||
|
Principal repayments on mortgage-related securities
|
|
31,944
|
|
28,572
|
|
32,968
|
|||||||||
|
Maturities of debt securities
|
|
8,080
|
|
10,435
|
|
15,686
|
|||||||||
|
Sales of debt securities
|
|
-
|
|
–
|
|
448
|
|||||||||
|
Death benefit from bank owned life insurance
|
|
-
|
|
474
|
|
-
|
|||||||||
|
Sales of real
estate owned
|
|
2,674
|
|
3,134
|
|
3,733
|
|||||||||
|
Net cash used in investing activities
|
|
(1,152
|
)
|
|
(79,871
|
)
|
|
(94,876
|
)
|
||||||
|
Financing activities:
|
|||||||||||||||
|
Net increase in deposits
|
|
29,281
|
|
71,115
|
|
17,969
|
|||||||||
|
Net change in short term borrowings
|
|
8,516
|
|
(41,239
|
)
|
|
(26,870
|
)
|
|||||||
|
Repayment of long term debt
|
(125,000
|
)
|
(165,000
|
)
|
(149,000
|
)
|
|||||||||
|
Proceeds from long term debt
|
165,000
|
255,000
|
175,000
|
||||||||||||
|
Net (decrease) increase in advance payments by borrowers for taxes
|
|
(159
|
)
|
|
(505
|
)
|
|
160
|
|||||||
|
Cash dividends in common stock
|
(25,960
|
)
|
(27,050
|
)
|
(26,952
|
)
|
|||||||||
|
Proceeds from stock option exercises
|
659
|
1,304
|
1,052
|
||||||||||||
|
Purchase of common stock returned to authorized but unissued
|
(22,767
|
)
|
(19,196
|
)
|
(2,190
|
)
|
|||||||||
|
Net cash provided by (used in) financing activities
|
|
29,570
|
|
74,429
|
|
(10,831
|
)
|
||||||||
|
(Decrease) increase in cash and cash equivalents
|
|
(11,801
|
)
|
|
37,494
|
|
1,390
|
||||||||
|
Cash and cash equivalents at beginning of year
|
|
86,101
|
|
48,607
|
|
47,217
|
|||||||||
|
Cash and cash equivalents at end of year
|
|
$
|
74,300
|
|
86,101
|
|
48,607
|
||||||||
|
|
|
|
|
||||||||||||
|
Supplemental information:
|
|
|
|
||||||||||||
|
Cash paid or credited during the period for:
|
|
|
|
||||||||||||
|
Income tax payments
|
|
$
|
10,703
|
|
10,168
|
|
17,081
|
||||||||
|
Interest payments
|
|
27,380
|
|
19,014
|
|
16,392
|
|||||||||
|
Noncash investing activities:
|
|
|
|
||||||||||||
|
Loans receivable transferred to other real estate
|
|
1,052
|
|
545
|
|
2,171
|
|||||||||
|
Dividends declared but not paid in other liabilities
|
3,501
|
3,798
|
3,894
|
||||||||||||
See accompanying notes to consolidated financial statements
- 57 -
Waterstone Financial, Inc. and Subsidiaries
Notes to Consolidated Financial Statements
Years ended December 31, 2019, 2018 and 2017
| 1) |
Summary of Significant Accounting Policies
|
The following significant accounting and reporting policies of Waterstone Financial, Inc. and subsidiaries
(collectively, the “Company”), conform to U.S. generally accepted accounting principles, or (“GAAP”), and are used in preparing and presenting these consolidated financial statements.
Certain prior period amounts have been reclassified to conform to current period presentation. These reclassifications did
not result in any changes to previously reported net income. The Company reclassified the Cost of Shares Repurchased line item presented in prior periods to the Additional Paid in Capital line item in the Consolidated Statements of Financial
Condition. The Cost of Shares Repurchased column was reclassified to the Additional Paid in Capital line in the Consolidated Statements of Changes in Shareholders’ Equity.
| a) |
Nature of Operations
|
The Company is a one-bank holding company with two operating segments – community banking and mortgage
banking. WaterStone Bank SSB (the "Bank" or "WaterStone Bank") is principally engaged in the business of attracting deposits from the general public and using such deposits to originate real estate, business and consumer loans.
The Bank provides a full range of financial services to customers through branch locations in southeastern Wisconsin. In
addition, the Bank has a loan production office in Minneapolis, Minnesota. The Bank is subject to the regulations of certain federal and state agencies and undergoes periodic examinations by those regulatory authorities.
The Bank owns a mortgage banking subsidiary that originates residential real estate loans held for sale at various
branch offices across the country. Mortgage banking volume fluctuates widely in connection with movements in interest rates. Mortgage banking income is reported as a single line item in the statements of operations while mortgage banking expense is
distributed among the various noninterest expense lines. Compensation, payroll taxes and other employee benefits expense fluctuates in relation to fluctuations in mortgage banking income.
| b) |
Principles of Consolidation
|
The consolidated financial statements include the accounts and operations of Waterstone Financial, Inc. and its wholly
owned subsidiary, WaterStone Bank. The Bank has the following wholly owned subsidiaries: Wauwatosa Investments, Inc., Waterstone Mortgage Corporation, and Main Street Real Estate Holdings, LLC. All significant intercompany accounts and transactions
have been eliminated in consolidation.
| c) |
Use of Estimates
|
The preparation of the consolidated financial statements requires management of the Company to make a number of
estimates and assumptions relating to the reported amount of assets and liabilities and the disclosure of contingent assets and liabilities at the date of the consolidated financial statements and the reported amounts of revenues and expenses during
the period. Significant items subject to such estimates and assumptions include: the allowance for loan losses, income taxes, and fair value measurements.
| e) |
Cash and Cash Equivalents
|
The Company considers federal funds sold and highly liquid debt instruments with a maturity of three months months or
less when purchased to be cash equivalents.
| e) |
Securities
|
Available for Sale Securities
At the time of purchase, investment securities are classified as available for sale, as management has the intent and
ability to hold such securities for an indefinite period of time, but not necessarily to maturity. Any decision to sell investment securities available for sale would be based on various factors, including, but not limited to asset/liability
management strategies, changes in interest rates or prepayment risks, liquidity needs, or regulatory capital considerations. Available for sale securities are carried at fair value, with the unrealized gains and losses, net of deferred tax, reported
as a separate component of equity in accumulated other comprehensive income (loss). The cost of debt securities is adjusted for amortization of premiums and accretion of discounts to maturity or, in the case of mortgage-backed securities and
collateralized mortgage obligations, over the estimated life of the security. Such amortization or accretion is included in interest income from securities. Realized gains or losses on securities sales (using specific identification method) are
included in noninterest income. Declines in value judged to be other than temporary are included in net impairment losses recognized in earnings in the consolidated statements of operations.
- 58 -
Other Than Temporary Impairment
One of the significant estimates related to securities is the evaluation of investments for other than temporary
impairment. The Company assesses investment securities with unrealized loss positions for other than temporary impairment on at least a quarterly basis. When the fair value of an investment is less than its amortized cost at the balance sheet date
of the reporting period for which impairment is assessed, the impairment is designated as either temporary or other than temporary. In evaluating other than temporary impairment, management considers the length of time and extent to which the fair
value has been less than cost and the expected recovery period of the security, the financial condition and near-term prospects of the issuer, and the intent and ability of the Company to retain its investment in the issuer for a period of time
sufficient to allow for any anticipated recovery in fair value in the near term. Declines in the fair value of investment securities below amortized cost are deemed to be other than temporary when the Company cannot assert that it will recover its
amortized cost basis, including whether the present value of cash flows expected to be collected is less than the amortized cost basis of the security. If it is more likely than not that the Company will be required to sell the security before
recovery or if the Company has the intent to sell, an other than temporary impairment write down is recognized in earnings equal to the difference between the security’s amortized cost and its fair value. If it is not more likely than not that the
Company will be required to sell the security before recovery and if the Company does not intend to sell, the other than temporary impairment write down is separated into an amount representing credit loss, which is recognized in earnings, and an
amount related to other factors, which is recognized as a separate component of equity. Following the recognition of an other than temporary impairment representing credit loss, the book value of an investment less the impairment loss realized
becomes the new cost basis. The determination as to whether an other than temporary impairment exists and, if so, the amount considered other than temporarily impaired, or not impaired, is subjective and, therefore, the timing and amount of other
than temporary impairments constitute material estimates that are subject to significant change.
Federal Home Loan Bank Stock
Federal Home Loan Bank ("FHLB") stock is carried at cost, which is the amount that the stock is redeemable by tendering
to the FHLB or the amount at which shares can be sold to other FHLB members.
| f) |
Loans Held for Sale
|
The origination of residential real estate loans is an integral component of the business of the Company. The Company
generally sells its originations of long-term fixed interest rate mortgage loans in the secondary market, and on a selective basis, retains the rights to service the loans sold. Gains and losses on the sales of these loans are determined using the
specific identification method. Mortgage loans originated for sale are generally sold within 45 days after closing.
The Company has elected to carry loans held for sale at fair value. Fair value is generally determined by estimating a
gross premium or discount, which is derived from pricing currently observable in the market. The amount by which cost differs from market value is accounted for as a valuation adjustment to the carrying value of the loans. Changes in value are
included in mortgage banking income in the consolidated statements of operations.
Costs to originate loans held for sale are expensed as incurred and are included on the appropriate noninterest expense
lines of the statements of operations. Salaries, commissions and related payroll taxes are the primary costs to originate and comprised approximately 74.6% of total mortgage banking noninterest expense for 2019.
The value of mortgage loans held for sale and other residential mortgage loan commitments to customers are hedged by
utilizing both best efforts and mandatory forward commitments to sell loans to investors in the secondary market. Such forward commitments are generally entered into at the time when applications are taken to protect the value of the mortgage loans
from increases in market interest rates during the period held. The Company recognizes revenue associated with the expected future cash flows of servicing loans at the time a forward loan commitment is made.
| g) |
Loans Receivable and Related Interest Income
|
Loans are classified as held for investment when management has both the intent and ability to hold the loan for the
foreseeable future, or until maturity or payoff. Loans are carried at the principal amount outstanding, net of any unearned income, charge-offs and unamortized deferred fees and costs. Loan origination and commitment fees and certain direct loan
origination costs are deferred and the net amount amortized as an adjustment of the related loan yield. Amortization is based on a level-yield method over the contractual life of the related loans or until the loan is paid in full.
Loan interest income is recognized on the accrual basis. Accrual of interest is generally discontinued either when
reasonable doubt exists as to the full, timely collection of interest or principal, or when a loan becomes contractually past due 90 days or more with respect to interest or principal. At that time, previously accrued and uncollected interest on
such loans is reversed and additional income is recorded only to the extent that payments are received and the collection of principal is reasonably assured. Generally, loans are restored to accrual status when the obligation is brought current, has
performed in accordance with the contractual terms for a reasonable period of time, and the ultimate collectability of the total contractual principal and interest is no longer in doubt.
A loan is accounted for as a troubled debt restructuring if the Company, for economic reasons related to the borrower’s
financial condition, grants a concession to the borrower that it would not otherwise consider. A troubled debt restructuring typically involves a modification of terms such as a reduction of the stated interest rate, a deferral of principal payments
or a combination of both for a temporary period of time. If the borrower was performing in accordance with the original contractual terms at the time of the restructuring, the restructured loan is accounted for on an accruing basis as long as the
borrower continues to comply with the modified terms. If the loan was not accounted for on an accrual basis at the time of restructuring, the restructured loan remains in non-accrual status until the loan completes a minimum of six consecutive
contractual payments.
- 59 -
| h) |
Allowance for Loan Losses
|
The allowance for loan losses is presented as a reserve against loans and represents the Company’s assessment of
probable loan losses inherent in the loan portfolio. The allowance for loan losses is established as losses are estimated to have occurred through a provision for loan losses charged to income. Estimated loan losses are charged against the
allowance when the loan balance is confirmed to be uncollectible directly or indirectly by the borrower or upon initiation of a foreclosure action by the Company. Subsequent recoveries, if any, are credited to the allowance.
The allowance provides for probable losses that have been identified with specific customer relationships and for
probable losses believed to be inherent in the loan portfolio, but have not been specifically identified. The Company utilizes its own loss history to estimate inherent losses on loans. Although the Bank allocates portions of the allowance to
specific loans and loan types, the entire allowance is available for any loan losses that occur.
The Company evaluates the need for specific valuation allowances on loans that are considered impaired. A loan is
considered impaired when, based on current information and events, it is probable that the Company will not be able to collect all amounts due according to the contractual terms of the loan agreement. Within the loan portfolio, all non-accrual loans
and loans modified under troubled debt restructurings have been determined by the Company to meet the definition of an impaired loan. In addition, other loans may be considered impaired loans. A valuation allowance is established for an amount
equal to the impairment when the carrying amount of the loan exceeds the present value of the expected future cash flows, discounted at the loan’s original effective interest rate or the fair value of the underlying collateral.
The Company also establishes valuation allowances based on an evaluation of the various risk components that are
inherent in the loan portfolio. The risk components that are evaluated include past loan loss experience; the level of non-performing and classified assets; current economic conditions; volume, growth, and composition of the loan portfolio; adverse
situations that may affect the borrower’s ability to repay; the estimated value of any underlying collateral; regulatory guidance; and other relevant factors.
The appropriateness of the allowance for loan losses is approved quarterly by the Company’s board of directors. The
allowance reflects management’s best estimate of the amount needed to provide for the probable loss on impaired loans, as well as other credit risks of the Company, and is based on a risk model developed and implemented by management and approved by
the Company’s board of directors.
Actual results could differ from this estimate, and future additions to the allowance may be necessary based on
unforeseen changes in economic conditions. In addition, federal regulators periodically review the Company’s allowance for loan losses. Such regulators have the authority to require the Company to recognize additions to the allowance at the time of
their examination.
| i) |
Real Estate Owned
|
Real estate owned consists of properties acquired through, or in lieu of, loan foreclosure. Real estate owned is
transferred into the portfolio at estimated net realizable value. To the extent that the net carrying value of the loan exceeds the estimated fair value of the property at the date of transfer, the excess is charged to the allowance for loan losses
within 90 days of being transferred. Subsequent write-downs to reflect current fair value, as well as gains and losses upon disposition and revenue and expenses incurred in maintaining such properties, are treated as period costs and included in
real estate owned in the consolidated statements of operations.
| j) |
Mortgage Servicing Rights
|
The Company sells residential mortgage loans in the secondary market and, on a selective basis, retains the right to
service the loans sold. Upon sale, a mortgage servicing rights asset is capitalized, which represents the then current fair value of future net cash flows expected to be realized for performing servicing activities. Mortgage servicing rights, when
purchased, are initially recorded at fair value. Mortgage servicing rights are amortized over the period of estimated net servicing income, and assessed for impairment at each reporting date. Mortgage servicing rights are carried at the lower of the
initial capitalized amount, net of accumulated amortization, or estimated fair value, and are included in other assets, net in the consolidated balance sheets. To the extent that the Company sells mortgage servicing rights, a gain is recognized for
the amount of which sale proceeds exceed the remaining unamortized cost of the servicing rights that were sold. Gains on sale of mortgage servicing rights are included in other noninterest income in the consolidated statements of operations.
| k) |
Cash Surrender Value of Life Insurance
|
The Company purchases bank owned life insurance on the lives of certain employees. The Company is the beneficiary of
the life insurance policies. The cash surrender value of life insurance is reported at the amount that would be received in cash if the polices were surrendered. Increases in the cash value of the policies and proceeds of death benefits received
are recorded in noninterest income. The increase in cash surrender value of life insurance is not subject to income taxes, as long as the Company has the intent and ability to hold the policies until the death benefits are received.
- 60 -
| l) |
Office Properties and Equipment
|
Office properties and equipment, including leasehold improvements and software, are stated at cost, net of depreciation
and amortization. Depreciation and amortization are computed on the straight-line method over the estimated useful lives of the related assets. Leasehold improvements are amortized over the lease term, if shorter than the estimated useful life.
Maintenance and repairs are charged to expense as incurred, while additions or major improvements are capitalized and depreciated over their estimated useful lives. Estimated useful lives of the assets are 10 to 30 years for office properties, three
years to 10 years for equipment, and three years years for software.
| m) |
Income Taxes
|
The Company and its subsidiaries file consolidated federal and combined state income tax returns. The provision for
income taxes is based upon income in the consolidated financial statements, rather than amounts reported on the income tax returns. Deferred tax assets and liabilities are recognized for the future tax consequences attributable to differences
between the financial statement carrying amounts of existing assets and liabilities and their respective tax bases, as well as net operating loss carry forwards. Deferred tax assets and liabilities are measured using enacted tax rates expected to
apply to taxable income in the years in which those temporary differences are expected to be recovered or settled. The effect on deferred tax assets and liabilities of a change in tax rates is recognized as income or expense in the period that
includes the enactment date.
The Company evaluates the realizability of its deferred tax assets on a quarterly basis. Under generally accepted
accounting principles, a valuation allowance is required to be recognized if it is “more likely than not” that a deferred tax asset will not be realized. The determination of the realizability of the deferred tax assets is highly subjective and
dependent upon judgment concerning management's evaluation of both positive and negative evidence, the forecasts of future income, applicable tax planning strategies, and assessments of current and future economic and business conditions.
Positions taken in the Company’s tax returns may be subject to challenge by the taxing authorities upon
examination. The benefit of uncertain tax positions are initially recognized in the financial statements only when it is more likely than not the position will be sustained upon examination by the tax authorities. Such tax positions are both
initially and subsequently measured as the largest amount of tax benefit that is greater than 50% likely of being realized upon settlement with the tax authority, assuming full knowledge of the position and all relevant facts. Interest and
penalties on income tax uncertainties are classified within income tax expense in the income statement.
| n) |
Earnings Per Share
|
Earnings per share (EPS) are computed using the two-class method. Basic earnings per share is computed by dividing net
income allocated to common shareholders by the weighted average number of common shares outstanding during the applicable period, excluding outstanding participating securities. Diluted earnings per share is computed by dividing net income by the
weighted average number of common shares outstanding adjusted for the dilutive effect of all potential common shares. Diluted EPS reflects the potential dilution that could occur if securities or other contracts to issue common stock were
exercised. Shares of the Employee Stock Ownership Plan committed to be released are considered outstanding for both common and diluted EPS.
| o) |
Comprehensive Income
|
Comprehensive income is the total of reported net income and changes in unrealized gains or losses, net of tax, on
securities available for sale.
| p) |
Employee Stock Ownership Plan (ESOP)
|
Compensation expense under the ESOP is equal to the fair value of common shares released or committed to be released to
participants in the ESOP in each respective period. Common stock purchased by the ESOP and not committed to be released to participants is included in the consolidated statements of financial condition at cost as a reduction of shareholders’ equity.
| q) |
Share Repurchases
|
The Company has a share repurchase program. Repurchases under the repurchase program may be made in the open market,
through block trades and other negotiated transactions. The share repurchase program transactions take place primarily in open market transactions, subject to market conditions. There is no fixed termination date for the repurchase program, and the
program may be suspended. Under Maryland law, shares repurchased are constituted as authorized but unissued. The Company reduced the common stock at par value and to the extent the cost acquired exceeds par value, it is recorded through additional
paid-in capital on the consolidated statements of financial condition and consolidated statements of changes in shareholders’ equity.
- 61 -
| r) |
Impact of Recent Accounting Pronouncements
|
Accounting Standards
Codification (ASC) Topic 606 "Revenue from Contracts with Customers." Authoritative accounting guidance under ASC Topic 606, "Revenue from Contracts with Customers" amended prior guidance to require an entity to recognize revenue to depict
the transfer of promised goods or services to customers in an amount that reflects the consideration to which the entity expects to be entitled in exchange for those goods or services and to provide clarification on identifying performance
obligations and licensing implementation guidance. The Company's revenue is comprised of interest and non-interest revenue. The guidance does not apply to revenue associated with financial instruments, including loans and securities. The Company
completed its overall assessment of revenue streams and related contracts affected by the guidance, including asset management fees, deposit related fees, and other non-interest related fees. The Company adopted ASC 606 as of January 1, 2018 with no
impact on total shareholders' equity or net income.
Revenue Recognition
|
·
|
Debit and credit card
interchange fee income - Card processing fees consist of interchange fees from consumer debit and credit card networks and other card related services. Interchange fees are based on purchase volumes and other factors and are
recognized as transactions occur.
|
|
·
|
Service charges on deposit
accounts - Revenue from service charges on deposit accounts is earned through deposit-related services; as well as overdraft, non-sufficient funds, account management and other deposit-related fees. Revenue is recognized for these
services either over time, corresponding with deposit accounts' monthly cycle, or at a point in time for transactional related services and fees.
|
|
·
|
Service charges on loan accounts
- Revenue from loan accounts consists primarily of fees earned on prepayment penalties. Revenue is recognized for these services at a point in time for transactional related services and fees.
|
ASC Topic 825
"Financial Instruments." Authoritative accounting guidance under ASC Topic 825, "Financial Instruments" amended prior guidance to require equity investments (except those accounted for under the equity method of accounting) to be measured at
fair value with changes in fair value recognized in net income. An entity may choose to measure equity investments that do not have readily determinable fair values at cost minus impairment, if any, plus or minus changes resulting from observable
price changes in orderly transactions for the identical or similar investment of the same issuer. The guidance simplifies the impairment assessment of equity investments without readily determinable fair values, requires public entities to use the
exit price notion when measuring the fair value of financial instruments for disclosure purposes, requires an entity to present separately in other comprehensive income the portion of the total change in the fair value of a liability resulting from
changes in the instrument-specific credit risk when the entity has selected the fair value option for financial instruments and requires separate presentation of financial assets and liabilities by measurement category and form of financial asset.
The Company adopted ASC 825 as of January 1, 2018 with no material impact on the Company's statements of operations or financial condition.
ASC Topic 842 "Leases."
Authoritative accounting guidance under ASC Topic 842, "Leases" amended prior guidance to require lessees to recognize the assets and liabilities arising from all leases on the balance sheet. The authoritative guidance defines a lease as a contract,
or part of a contract, that conveys the right to control the use of identified property, plant, or equipment (an identified asset) for a period of time in exchange for consideration. In addition, the qualifications for a sale and leaseback
transaction have been amended. The authoritative guidance also requires qualitative and quantitative disclosures by lessees and lessors to meet the objective of enabling users of financial statements to assess the amount, timing, and uncertainty of
cash flows arising from leases. The Company used a prospective approach. The Company adopted ASC 842 as of January 1, 2019 with no impact on statement of operations. See the impact on the financial condition discussed in Note 21.
ASC Topic 326
"Financial Instruments - Credit Losses." Authoritative accounting guidance under ASC Topic 326, "Financial Instruments - Credit Losses" amended the incurred loss impairment methodology in current GAAP with a methodology that reflects
expected credit losses and requires consideration of a broader range of reasonable and supportable information for credit loss estimates. The measurement of expected credit losses is based on relevant information about past events, including
historical experience, current conditions, and reasonable and supportable forecasts that affect the collectability of the reported amount. The authoritative guidance also requires a financial asset (or a group of financial assets) measured at
amortized cost basis to be presented at the net amount expected to be collected (net of the allowance for credit losses). In addition, the credit losses relating to available-for-sale debt securities should be recorded through an allowance for credit
losses rather than a write-down. The authoritative guidance is effective for reporting periods after January 1, 2020.
The Company has input the available historical Company data to build an internal model and is reviewing the assumptions
to support the calculation. Management’s methodology for estimating the allowance for credit losses under CECL includes the use of relevant available information, from internal and external sources, relating to past events, current conditions, and
reasonable and supportable forecasts. Historical credit loss experience by vintage classified by loans with similar risk profiles provides the basis for the estimation of expected credit losses. Adjustments to historical loss information are
considered for differences in current loan-specific risk characteristics such as changes in underwriting standards, portfolio mix, portfolio volume, delinquency rates, interest rates, or other relevant factors. Management will continue to review and
adjust these and other factors. Ongoing evaluations have been performed by vintage adjusted for prepayments. For two portfolio segments, management expects to use a weighted average remaining maturity methodology, which contemplates loss expectations
on a pool basis, relying on historic loss rates.
Management is validating the CECL model and methodologies, however we expect an initial increase to the allowance for
credit loss, including reserves for unfunded commitments, not to exceed 130% of the December 31, 2019 allowance. When finalized, this one-time increase as a result of the adoption of CECL will be recorded, net of tax, as an adjustment to retained
earnings effective January 1, 2020. This estimate is subject to change based on continuing refinement and validation of the model and methodologies.
- 62 -
Financial statement users should be aware that the allowance for credit loss is, by design, inherently sensitive to
changes in economic outlook, loan and lease portfolio composition, portfolio duration, and other factors.
ASC Topic 310
"Receivables - Nonrefundable Fees and Other Costs." Authoritative accounting guidance under ASC Topic 310 "Receivables - Nonrefundable Fees and Other Costs" amends prior guidance by shortening the amortization period for certain callable
debt securities held at a premium requiring the premium to be amortized to the earliest call date. The Company adopted ASC 310 as of January 1, 2019 with no material impact on the Company's statements of operations or financial condition.
ASC Topic 220 "Income
Statement - Reporting Comprehensive Income." Authoritative accounting guidance under ASC Topic 220 "Income Statement - Reporting Comprehensive Income" allows Companies to make a one-time reclassification from accumulated other comprehensive
income (loss) to retained earnings for the effects of remeasuring deferred income taxes originally recorded in other comprehensive income as a result of the change in the federal income tax rate by the Tax Cuts and Jobs Act. The Company adopted this
guidance on January 1, 2018 with no impact on total shareholders' equity or net income.
| 2) |
Securities
|
Securities Available for Sale
The amortized cost and fair value of the Company’s investment in securities follow:
|
|
December 31, 2019
|
|||||||||||||||
|
|
Amortized cost
|
Gross unrealized gains
|
Gross unrealized losses
|
Fair value
|
||||||||||||
|
|
(In Thousands)
|
|||||||||||||||
|
Mortgage-backed securities
|
$
|
33,773
|
422
|
(45
|
)
|
34,150
|
||||||||||
|
Collateralized mortgage obligations
|
||||||||||||||||
|
Government sponsored enterprise issued
|
81,232
|
776
|
(254
|
)
|
81,754
|
|||||||||||
|
Mortgage related securities
|
115,005
|
1,198
|
(299
|
)
|
115,904
|
|||||||||||
|
|
||||||||||||||||
|
Municipal securities
|
51,898
|
1,795
|
(1
|
)
|
53,692
|
|||||||||||
|
Other debt securities
|
10,000
|
-
|
(1,120
|
)
|
8,880
|
|||||||||||
|
Debt securities
|
61,898
|
1,795
|
(1,121
|
)
|
62,572
|
|||||||||||
|
|
||||||||||||||||
|
|
$
|
176,903
|
2,993
|
(1,420
|
)
|
178,476
|
||||||||||
|
|
December 31, 2018
|
|||||||||||||||
|
|
Amortized cost
|
Gross unrealized gains
|
Gross unrealized losses
|
Fair value
|
||||||||||||
|
|
(In Thousands)
|
|||||||||||||||
|
Mortgage-backed securities
|
$
|
42,105
|
91
|
(565
|
)
|
41,631
|
||||||||||
|
Collateralized mortgage obligations
|
||||||||||||||||
|
Government sponsored enterprise issued
|
75,923
|
243
|
(1,211
|
)
|
74,955
|
|||||||||||
|
Mortgage related securities
|
118,028
|
334
|
(1,776
|
)
|
116,586
|
|||||||||||
|
|
||||||||||||||||
|
Municipal securities
|
55,242
|
825
|
(119
|
)
|
55,948
|
|||||||||||
|
Other debt securities
|
15,002
|
–
|
(1,816
|
)
|
13,186
|
|||||||||||
|
Debt securities
|
70,244
|
825
|
(1,935
|
)
|
69,134
|
|||||||||||
|
|
||||||||||||||||
|
|
$
|
188,272
|
1,159
|
(3,711
|
)
|
185,720
|
||||||||||
- 63 -
The Company’s mortgage-backed securities and collateralized mortgage obligations issued by government sponsored
enterprises are guaranteed by one of the following government sponsored enterprises: Fannie Mae, Freddie Mac or Ginnie Mae. At December 31, 2019, $1.2 million of the Company's mortgage related securities were pledged as collateral to secure mortgage banking related activities.
The amortized cost and fair value of securities at December 31, 2019, by contractual maturity, are shown below. Expected
maturities may differ from contractual maturities because issuers or borrowers may have the right to prepay obligations with or without prepayment penalties.
|
|
December 31, 2019
|
|||||||
|
|
Amortized cost
|
Fair value
|
||||||
|
|
(In Thousands)
|
|||||||
|
Debt securities:
|
||||||||
|
Due within one year
|
$
|
3,449
|
3,454
|
|||||
|
Due after one year through five years
|
33,200
|
33,843
|
||||||
|
Due after five years through ten years
|
14,615
|
15,618
|
||||||
|
Due after ten years
|
10,634
|
9,657
|
||||||
|
Mortgage-related securities
|
115,005
|
115,904
|
||||||
|
|
$
|
176,903
|
178,476
|
|||||
Total proceeds and gross gains and losses from sales of investment securities available for sale for each of periods
listed below.
|
|
December 31,
|
|||||||||||
|
|
2019
|
2018
|
2017
|
|||||||||
|
|
(In Thousands)
|
|||||||||||
|
Gross gains
|
$
|
-
|
-
|
-
|
||||||||
|
Gross losses
|
-
|
-
|
(107
|
)
|
||||||||
|
Losses on sale of investment securities, net
|
$
|
-
|
-
|
(107
|
)
|
|||||||
|
|
||||||||||||
|
Proceeds from sales of investment securities
|
$
|
-
|
-
|
448
|
||||||||
Gross unrealized losses on securities available for sale and the fair value of the related securities, aggregated by
investment category and length of time that individual securities have been in a continuous unrealized loss position, were as follows:
|
|
December 31, 2019
|
|||||||||||||||||||||||
|
|
Less than 12 months
|
12 months or longer
|
Total
|
|||||||||||||||||||||
|
|
Fair
value
|
Unrealized
loss
|
Fair
value
|
Unrealized
loss
|
Fair
value
|
Unrealized
loss
|
||||||||||||||||||
|
|
(In Thousands)
|
|||||||||||||||||||||||
|
Mortgage-backed securities
|
$
|
2,929
|
(20
|
)
|
2,849
|
(25
|
)
|
5,778
|
(45
|
)
|
||||||||||||||
|
Collateralized mortgage obligations
|
||||||||||||||||||||||||
|
Government sponsored enterprise issued
|
21,723
|
(136
|
)
|
7,180
|
(118
|
)
|
28,903
|
(254
|
)
|
|||||||||||||||
|
Municipal securities
|
100
|
(1
|
)
|
–
|
–
|
100
|
(1
|
)
|
||||||||||||||||
|
Other debt securities
|
-
|
-
|
8,880
|
(1,120
|
)
|
8,880
|
(1,120
|
)
|
||||||||||||||||
|
$
|
24,752
|
(157
|
)
|
18,909
|
(1,263
|
)
|
43,661
|
(1,420
|
)
|
|||||||||||||||
|
|
December 31, 2018
|
|||||||||||||||||||||||
|
|
Less than 12 months
|
12 months or longer
|
Total
|
|||||||||||||||||||||
|
|
Fair
value
|
Unrealized
loss
|
Fair
value
|
Unrealized
loss
|
Fair
value
|
Unrealized
loss
|
||||||||||||||||||
|
|
(In Thousands)
|
|||||||||||||||||||||||
|
Mortgage-backed securities
|
$
|
3,036
|
(9
|
)
|
33,029
|
(556
|
)
|
36,065
|
(565
|
)
|
||||||||||||||
|
Collateralized mortgage obligations
|
||||||||||||||||||||||||
|
Government sponsored enterprise issued
|
3,079
|
(13
|
)
|
47,279
|
(1,198
|
)
|
50,358
|
(1,211
|
)
|
|||||||||||||||
|
Municipal securities
|
7,595
|
(17
|
)
|
11,272
|
(102
|
)
|
18,867
|
(119
|
)
|
|||||||||||||||
|
Other debt securities
|
-
|
-
|
13,186
|
(1,816
|
)
|
13,186
|
(1,816
|
)
|
||||||||||||||||
|
$
|
13,710
|
(39
|
)
|
104,766
|
(3,672
|
)
|
118,476
|
(3,711
|
)
|
|||||||||||||||
- 64 -
The Company reviews the investment securities portfolio on a quarterly basis to monitor its exposure to
other-than-temporary impairment. In evaluating whether a security’s decline in market value is other-than-temporary, management considers the length of time and extent to which the fair value has been less than cost, financial condition of the
issuer and the underlying obligors, quality of credit enhancements, volatility of the fair value of the security, the expected recovery period of the security and ratings agency evaluations. In addition, the Company may also evaluate payment
structure, whether there are defaulted payments or expected defaults, prepayment speeds and the value of any underlying collateral.
As of December 31, 2019, the Company identified one municipal security that was deemed to be other-than-temporarily
impaired. The security was issued by a tax incremental district in a municipality located in Wisconsin. During the year ended December 31, 2012, the Company received audited financial statements with respect to the municipal issuer that called into
question the ability of the underlying taxing district that issued the securities to operate as a going concern. During the year ended December 31, 2012, the Company’s analysis of the security in this municipality resulted in $77,000 in credit
losses that were charged to earnings with respect to this municipal security. An additional $17,000 credit loss was charged to earnings during the year ended December 31, 2014 with respect to this security as a sale occurred at a discounted price. As
of December 31, 2019, the remaining impaired security had an amortized cost of $116,000 and a total life-to-date impairment of $94,000.
As of December 31, 2019, the Company had one corporate debt security, included in other deby securities, seven
mortgage-backed securities, and nine government sponsored enterprise issued securities which had been in an unrealized loss position for twelve months or longer. These securities were determined not to be other-than-temporarily impaired as of
December 31, 2019. The Company has determined that the decline in fair value of these securities is not attributable to credit deterioration, and as the Company does not intend to sell nor is it more likely than not that it will be required to sell
these securities before recovery of the amortized cost basis, these securities are not considered other-than-temporarily impaired.
The unrealized losses for the other debt security with an unrealized loss greater than 12 months is due to the current
slope of the yield curve. The security earns a floating rate that is indexed to the 10 year Treasury interest rate. The Company does not intend to sell nor does it believe that it will be required to sell the security before recovery of their
amortized cost basis.
- 65 -
| 3) |
Loans Receivable
|
Loans receivable at December 31, 2019 and 2018 are summarized as follows:
|
|
December 31,
|
|||||||
|
|
2019
|
2018
|
||||||
|
Mortgage loans:
|
(In Thousands)
|
|||||||
|
Residential real estate:
|
||||||||
|
One- to four-family
|
$
|
480,280
|
489,979
|
|||||
|
Multi family
|
584,859
|
597,087
|
||||||
|
Home equity
|
18,071
|
19,956
|
||||||
|
Construction and land
|
37,033
|
13,361
|
||||||
|
Commercial real estate
|
236,703
|
225,522
|
||||||
|
Consumer
|
832
|
433
|
||||||
|
Commercial loans
|
30,253
|
32,810
|
||||||
|
Total loans receivable
|
$
|
1,388,031
|
1,379,148
|
|||||
The Company provides several types of loans to its customers, including residential, construction, commercial and
consumer loans. Significant loan concentrations are considered to exist for a financial institution when there are amounts loaned to one borrower or to multiple borrowers engaged in similar activities that would cause them to be similarly impacted
by economic or other conditions. While credit risks tend to be geographically concentrated in the Company’s Milwaukee metropolitan area and while 78.0% of the Company’s loan portfolio involves loans that are secured by residential real estate, there
are no concentrations with individual or groups of related borrowers. While the real estate collateralizing these loans is primarily residential in nature, it ranges from owner-occupied single family homes to large apartment complexes.
Qualifying loans receivable totaling $1.07 billion and $1.00 billion are pledged as collateral against $470.0 million
and $430.0 million in outstanding Federal Home Loan Bank of Chicago advances under a blanket security agreement at both December 31, 2019 and December 31, 2018.
Certain of the Company's executive officers, directors, employees, and their related interests have loans with the
Bank. As of December 31, 2019 and December 31, 2018, loans aggregating approximately $6.3 million and $5.3 million, respectively, were outstanding to such parties. None of these loans were past due or considered impaired as of December 31, 2019 and
December 31, 2018.
- 66 -
An analysis of past due loans receivable as of December 31, 2019 and 2018 follows:
|
|
As of December 31, 2019
|
|||||||||||||||||||||||
|
|
1-59 Days Past
Due (1)
|
60-89 Days Past
Due (2)
|
Greater Than 90
Days
|
Total Past Due
|
Current (3)
|
Total Loans
|
||||||||||||||||||
|
Mortgage loans:
|
(In Thousands)
|
|||||||||||||||||||||||
|
Residential real estate:
|
||||||||||||||||||||||||
|
One- to four-family
|
$
|
1,179
|
638
|
3,969
|
5,786
|
474,494
|
480,280
|
|||||||||||||||||
|
Multi family
|
-
|
-
|
360
|
360
|
584,499
|
584,859
|
||||||||||||||||||
|
Home equity
|
-
|
10
|
-
|
10
|
18,061
|
18,071
|
||||||||||||||||||
|
Construction and land
|
-
|
-
|
-
|
-
|
37,033
|
37,033
|
||||||||||||||||||
|
Commercial real estate
|
-
|
-
|
303
|
303
|
236,400
|
236,703
|
||||||||||||||||||
|
Consumer
|
-
|
-
|
-
|
-
|
832
|
832
|
||||||||||||||||||
|
Commercial loans
|
6
|
-
|
-
|
6
|
30,247
|
30,253
|
||||||||||||||||||
|
Total
|
$
|
1,185
|
648
|
4,632
|
6,465
|
1,381,566
|
1,388,031
|
|||||||||||||||||
|
|
As of December 31, 2018
|
|||||||||||||||||||||||
|
|
1-59 Days Past
Due (1)
|
60-89 Days Past
Due (2)
|
Greater Than 90
Days
|
Total Past Due
|
Current (3)
|
Total Loans
|
||||||||||||||||||
|
Mortgage loans:
|
(In Thousands)
|
|||||||||||||||||||||||
|
Residential real estate:
|
||||||||||||||||||||||||
|
One- to four-family
|
$
|
1,523
|
76
|
3,834
|
5,433
|
484,546
|
489,979
|
|||||||||||||||||
|
Multi family
|
-
|
-
|
937
|
937
|
596,150
|
597,087
|
||||||||||||||||||
|
Home equity
|
216
|
42
|
111
|
369
|
19,587
|
19,956
|
||||||||||||||||||
|
Construction and land
|
-
|
-
|
-
|
-
|
13,361
|
13,361
|
||||||||||||||||||
|
Commercial real estate
|
39
|
-
|
125
|
164
|
225,358
|
225,522
|
||||||||||||||||||
|
Consumer
|
29
|
-
|
-
|
29
|
404
|
433
|
||||||||||||||||||
|
Commercial loans
|
-
|
-
|
18
|
18
|
32,792
|
32,810
|
||||||||||||||||||
|
Total
|
$
|
1,807
|
118
|
5,025
|
6,950
|
1,372,198
|
1,379,148
|
|||||||||||||||||
| (1) |
Includes $53,000 and $422,000 for December 31, 2019 and 2018, respectively, which are on non-accrual status.
|
| (2) |
Includes $291,000 and $118,000 for December 31, 2019 and 2018, respectively, which are on non-accrual status.
|
| (3) |
Includes $2.0 million and $990,000 for December 31, 2019 and 2018, respectively, which are on non-accrual status.
|
As of December 31, 2019 and 2018, there were no loans that were 90 or more days past due and still accruing interest.
- 67 -
A summary of the activity for the years ended 2019, 2018 and 2017 in the allowance for loan losses follows:
|
|
One- to Four-
Family
|
Multi
Family
|
Home Equity
|
Construction
and Land
|
Commercial
Real Estate
|
Consumer
|
Commercial
|
Total
|
||||||||||||||||||||||||
|
|
(In Thousands)
|
|||||||||||||||||||||||||||||||
|
Year ended December 31, 2019
|
||||||||||||||||||||||||||||||||
|
Balance at beginning of period
|
$
|
5,742
|
4,153
|
325
|
400
|
2,126
|
20
|
483
|
13,249
|
|||||||||||||||||||||||
|
Provision (credit) for loan losses
|
(845
|
)
|
(42
|
)
|
(107
|
)
|
210
|
(4
|
)
|
(1
|
)
|
(111
|
)
|
(900
|
)
|
|||||||||||||||||
|
Charge-offs
|
(125
|
)
|
(3
|
)
|
(44
|
)
|
-
|
(2
|
)
|
(5
|
)
|
-
|
(179
|
)
|
||||||||||||||||||
|
Recoveries
|
135
|
30
|
27
|
-
|
25
|
-
|
-
|
217
|
||||||||||||||||||||||||
|
Balance at end of period
|
$
|
4,907
|
4,138
|
201
|
610
|
2,145
|
14
|
372
|
12,387
|
|||||||||||||||||||||||
|
|
||||||||||||||||||||||||||||||||
|
Year ended December 31, 2018
|
||||||||||||||||||||||||||||||||
|
Balance at beginning of period
|
$
|
5,794
|
4,431
|
356
|
949
|
1,881
|
10
|
656
|
14,077
|
|||||||||||||||||||||||
|
Provision (credit) for loan losses
|
(142
|
)
|
(353
|
)
|
(56
|
)
|
(589
|
)
|
243
|
10
|
(173
|
)
|
(1,060
|
)
|
||||||||||||||||||
|
Charge-offs
|
(69
|
)
|
(14
|
)
|
(1
|
)
|
-
|
-
|
-
|
-
|
(84
|
)
|
||||||||||||||||||||
|
Recoveries
|
159
|
89
|
26
|
40
|
2
|
-
|
-
|
316
|
||||||||||||||||||||||||
|
Balance at end of period
|
$
|
5,742
|
4,153
|
325
|
400
|
2,126
|
20
|
483
|
13,249
|
|||||||||||||||||||||||
|
|
||||||||||||||||||||||||||||||||
|
Year ended December 31, 2017
|
||||||||||||||||||||||||||||||||
|
Balance at beginning of period
|
$
|
7,164
|
4,809
|
364
|
1,016
|
1,951
|
12
|
713
|
16,029
|
|||||||||||||||||||||||
|
Provision (credit) for loan losses
|
(299
|
)
|
(494
|
)
|
(34
|
)
|
(215
|
)
|
(64
|
)
|
(3
|
)
|
(57
|
)
|
(1,166
|
)
|
||||||||||||||||
|
Charge-offs
|
(1,364
|
)
|
(92
|
)
|
-
|
(14
|
)
|
(7
|
)
|
-
|
-
|
(1,477
|
)
|
|||||||||||||||||||
|
Recoveries
|
293
|
208
|
26
|
162
|
1
|
1
|
-
|
691
|
||||||||||||||||||||||||
|
Balance at end of period
|
$
|
5,794
|
4,431
|
356
|
949
|
1,881
|
10
|
656
|
14,077
|
|||||||||||||||||||||||
A summary of the allowance for loan loss for loans evaluated individually and collectively for impairment by collateral
class as of the year ended December 31, 2019 follows:
|
|
One- to Four-
Family
|
Multi
Family
|
Home Equity
|
Construction
and Land
|
Commercial
Real Estate
|
Consumer
|
Commercial
|
Total
|
||||||||||||||||||||||||
|
|
(In Thousands)
|
|||||||||||||||||||||||||||||||
|
Allowance related to loans individually evaluated for impairment
|
$
|
32
|
-
|
-
|
-
|
7
|
-
|
-
|
39
|
|||||||||||||||||||||||
|
Allowance related to loans collectively evaluated for impairment
|
4,875
|
4,138
|
201
|
610
|
2,138
|
14
|
372
|
12,348
|
||||||||||||||||||||||||
|
|
||||||||||||||||||||||||||||||||
|
Balance at end of period
|
$
|
4,907
|
4,138
|
201
|
610
|
2,145
|
14
|
372
|
12,387
|
|||||||||||||||||||||||
|
|
||||||||||||||||||||||||||||||||
|
Loans individually evaluated for impairment
|
$
|
8,725
|
667
|
84
|
-
|
581
|
-
|
-
|
10,057
|
|||||||||||||||||||||||
|
|
||||||||||||||||||||||||||||||||
|
Loans collectively evaluated for impairment
|
471,555
|
584,192
|
17,987
|
37,033
|
236,122
|
832
|
30,253
|
1,377,974
|
||||||||||||||||||||||||
|
Total gross loans
|
$
|
480,280
|
584,859
|
18,071
|
37,033
|
236,703
|
832
|
30,253
|
1,388,031
|
|||||||||||||||||||||||
- 68 -
A summary of the allowance for loan loss for loans evaluated individually and collectively for impairment by collateral
class as of the year ended December 31, 2018 follows:
|
|
One- to Four-
Family
|
Multi
Family
|
Home Equity
|
Construction
and Land
|
Commercial
Real Estate
|
Consumer
|
Commercial
|
Total
|
||||||||||||||||||||||||
|
|
(In Thousands)
|
|||||||||||||||||||||||||||||||
|
Allowance related to loans individually evaluated for impairment
|
$
|
73
|
-
|
46
|
-
|
67
|
-
|
-
|
186
|
|||||||||||||||||||||||
|
Allowance related to loans collectively evaluated for impairment
|
5,669
|
4,153
|
279
|
400
|
2,059
|
20
|
483
|
13,063
|
||||||||||||||||||||||||
|
|
||||||||||||||||||||||||||||||||
|
Balance at end of period
|
$
|
5,742
|
4,153
|
325
|
400
|
2,126
|
20
|
483
|
13,249
|
|||||||||||||||||||||||
|
|
||||||||||||||||||||||||||||||||
|
Loans individually evaluated for impairment
|
$
|
7,642
|
1,309
|
246
|
-
|
2,885
|
-
|
18
|
12,100
|
|||||||||||||||||||||||
|
|
||||||||||||||||||||||||||||||||
|
Loans collectively evaluated for impairment
|
482,337
|
595,778
|
19,710
|
13,361
|
222,637
|
433
|
32,792
|
1,367,048
|
||||||||||||||||||||||||
|
Total gross loans
|
$
|
489,979
|
597,087
|
19,956
|
13,361
|
225,522
|
433
|
32,810
|
1,379,148
|
|||||||||||||||||||||||
The following table presents information relating to the Company’s internal risk ratings of its loans receivable as of
December 31, 2019 and 2018:
|
|
One- to Four-
Family
|
Multi
Family
|
Home Equity
|
Construction
and Land
|
Commercial
Real Estate
|
Consumer
|
Commercial
|
Total
|
||||||||||||||||||||||||
|
At December 31, 2019
|
(In Thousands)
|
|||||||||||||||||||||||||||||||
|
Substandard
|
$
|
8,725
|
668
|
285
|
-
|
581
|
-
|
754
|
11,013
|
|||||||||||||||||||||||
|
Watch
|
5,975
|
-
|
3
|
-
|
1,412
|
-
|
847
|
8,237
|
||||||||||||||||||||||||
|
Pass
|
465,580
|
584,191
|
17,783
|
37,033
|
234,710
|
832
|
28,652
|
1,368,781
|
||||||||||||||||||||||||
|
|
$
|
480,280
|
584,859
|
18,071
|
37,033
|
236,703
|
832
|
30,253
|
1,388,031
|
|||||||||||||||||||||||
|
|
||||||||||||||||||||||||||||||||
|
At December 31, 2018
|
(In Thousands)
|
|||||||||||||||||||||||||||||||
|
Substandard
|
$
|
7,799
|
1,309
|
246
|
-
|
678
|
-
|
889
|
10,921
|
|||||||||||||||||||||||
|
Watch
|
4,662
|
491
|
468
|
-
|
4,343
|
-
|
906
|
10,870
|
||||||||||||||||||||||||
|
Pass
|
477,518
|
595,287
|
19,242
|
13,361
|
220,501
|
433
|
31,015
|
1,357,357
|
||||||||||||||||||||||||
|
|
$
|
489,979
|
597,087
|
19,956
|
13,361
|
225,522
|
433
|
32,810
|
1,379,148
|
|||||||||||||||||||||||
Factors that are important to managing overall credit quality include sound loan underwriting and administration,
systematic monitoring of existing loans and commitments, effective loan review on an ongoing basis, early identification of potential problems, an allowance for loan losses, and sound non-accrual and charge-off policies. Our underwriting policies
require an officers' loan committee review and approval of all loans in excess of $500,000. A member of the credit department, independent of the loan originator, performs a loan review for all loans. Our ability to manage credit risk depends in
large part on our ability to properly identify and manage problem loans. To do so, we maintain a loan review system under which our credit management personnel review non-owner occupied one- to four-family, multi-family, construction and land, and
commercial real estate that individually, or as part of an overall borrower relationship exceed $1.0 million in potential exposure and review commercial loans that individually, or as part of an overall borrower relationship exceed $200,000 in
potential exposure. Loans meeting these criteria are reviewed on an annual basis, or more frequently, if the loan renewal is less than one year year. With respect to this review process, management has determined that pass loans include loans that
exhibit acceptable financial statements, cash flow and leverage. Watch loans have potential weaknesses that deserve management’s attention, and if left uncorrected, these potential weaknesses may result in deterioration of the repayment prospects
for the credit. Substandard loans are considered inadequately protected by the current net worth and paying capacity of the obligor or the collateral pledged. These loans generally have a well-defined weakness that may jeopardize liquidation of the
debt and are characterized by the distinct possibility that the Bank will sustain some loss if the deficiencies are not corrected. Finally, a loan is considered to be impaired when it is probable that the Bank will not be able to collect all amounts
due according to the contractual terms of the loan agreement. Management has determined that all non-accrual loans and loans modified under troubled debt restructurings meet the definition of an impaired loan.
The Company’s procedures dictate that an updated valuation must be obtained with respect to underlying collateral at the
time a loan is deemed impaired. Updated valuations may also be obtained upon transfer from loans receivable to real estate owned based upon the age of the prior appraisal, changes in market conditions or known changes to the physical condition of
the property.
- 69 -
Estimated fair values are reduced to account for sales commissions, broker fees, unpaid property taxes and additional
selling expenses to arrive at an estimated net realizable value. This estimated adjustment factor is based upon the Company’s actual experience with respect to sales of real estate owned over the prior two years. In situations in which we are
placing reliance on an appraisal that is more than one year old, an additional adjustment factor is applied to account for downward market pressure since the date of appraisal. The additional adjustment factor is based upon relevant sales data
available for our general operating market as well as company-specific historical net realizable values as compared to the most recent appraisal prior to disposition.
With respect to over-four family income producing real estate, appraisals are reviewed and estimated collateral values
are adjusted by updating significant appraisal assumptions to reflect current real estate market conditions. Significant assumptions reviewed and updated include the capitalization rate, rental income and operating expenses. These adjusted
assumptions are based upon recent appraisals received on similar properties as well as on actual experience related to real estate owned and currently under Company management.
The following tables present data on impaired loans as of and for the year ended December 31, 2019 and 2018.
|
|
As of or for the Year Ended December 31, 2019
|
|||||||||||||||||||||||
|
|
Recorded
Investment
|
Unpaid
Principal
|
Reserve
|
Cumulative
Charge-Offs
|
Average
Recorded
Investment
|
Interest Paid YTD
|
||||||||||||||||||
|
Total Impaired with Reserve
|
||||||||||||||||||||||||
|
One- to four-family
|
$
|
217
|
217
|
32
|
-
|
221
|
15
|
|||||||||||||||||
|
Multi family
|
-
|
-
|
-
|
-
|
-
|
-
|
||||||||||||||||||
|
Home equity
|
-
|
-
|
-
|
-
|
-
|
-
|
||||||||||||||||||
|
Construction and land
|
-
|
-
|
-
|
-
|
-
|
-
|
||||||||||||||||||
|
Commercial real estate
|
7
|
416
|
7
|
409
|
10
|
-
|
||||||||||||||||||
|
Consumer
|
-
|
-
|
-
|
-
|
-
|
-
|
||||||||||||||||||
|
Commercial
|
-
|
-
|
-
|
-
|
-
|
-
|
||||||||||||||||||
|
|
$
|
224
|
633
|
39
|
409
|
231
|
15
|
|||||||||||||||||
|
|
||||||||||||||||||||||||
|
Total Impaired with no Reserve
|
||||||||||||||||||||||||
|
|
||||||||||||||||||||||||
|
One- to four-family
|
$
|
8,508
|
9,531
|
-
|
1,023
|
8,730
|
508
|
|||||||||||||||||
|
Multi family
|
667
|
1,491
|
-
|
824
|
705
|
78
|
||||||||||||||||||
|
Home equity
|
84
|
84
|
-
|
-
|
88
|
7
|
||||||||||||||||||
|
Construction and land
|
-
|
-
|
-
|
-
|
-
|
-
|
||||||||||||||||||
|
Commercial real estate
|
574
|
574
|
-
|
-
|
647
|
23
|
||||||||||||||||||
|
Consumer
|
-
|
-
|
-
|
-
|
-
|
-
|
||||||||||||||||||
|
Commercial
|
-
|
-
|
-
|
-
|
-
|
-
|
||||||||||||||||||
|
|
$
|
9,833
|
11,680
|
-
|
1,847
|
10,170
|
616
|
|||||||||||||||||
|
|
||||||||||||||||||||||||
|
Total Impaired
|
||||||||||||||||||||||||
|
|
||||||||||||||||||||||||
|
One- to four-family
|
$
|
8,725
|
9,748
|
32
|
1,023
|
8,951
|
523
|
|||||||||||||||||
|
Multi family
|
667
|
1,491
|
-
|
824
|
705
|
78
|
||||||||||||||||||
|
Home equity
|
84
|
84
|
-
|
-
|
88
|
7
|
||||||||||||||||||
|
Construction and land
|
-
|
-
|
-
|
-
|
-
|
-
|
||||||||||||||||||
|
Commercial real estate
|
581
|
990
|
7
|
409
|
657
|
23
|
||||||||||||||||||
|
Consumer
|
-
|
-
|
-
|
-
|
-
|
-
|
||||||||||||||||||
|
Commercial
|
-
|
-
|
-
|
-
|
-
|
-
|
||||||||||||||||||
|
|
$
|
10,057
|
12,313
|
39
|
2,256
|
10,401
|
631
|
|||||||||||||||||
- 70 -
|
|
As of or for the Year Ended December 31, 2018
|
|||||||||||||||||||||||
|
|
Recorded
Investment
|
Unpaid
Principal
|
Reserve
|
Cumulative
Charge-Offs
|
Average
Recorded
Investment
|
Interest Paid YTD
|
||||||||||||||||||
|
Total Impaired with Reserve
|
||||||||||||||||||||||||
|
One- to four-family
|
$
|
462
|
462
|
73
|
-
|
470
|
32
|
|||||||||||||||||
|
Multi family
|
-
|
-
|
-
|
-
|
-
|
-
|
||||||||||||||||||
|
Home equity
|
107
|
107
|
46
|
-
|
110
|
7
|
||||||||||||||||||
|
Construction and land
|
-
|
-
|
-
|
-
|
-
|
-
|
||||||||||||||||||
|
Commercial real estate
|
2,493
|
2,902
|
67
|
409
|
4,058
|
181
|
||||||||||||||||||
|
Consumer
|
-
|
-
|
-
|
-
|
-
|
-
|
||||||||||||||||||
|
Commercial
|
-
|
-
|
-
|
-
|
-
|
-
|
||||||||||||||||||
|
|
$
|
3,062
|
3,471
|
186
|
409
|
4,638
|
220
|
|||||||||||||||||
|
|
||||||||||||||||||||||||
|
Total Impaired with no Reserve
|
||||||||||||||||||||||||
|
|
||||||||||||||||||||||||
|
One- to four-family
|
$
|
7,180
|
8,120
|
-
|
940
|
7,355
|
383
|
|||||||||||||||||
|
Multi family
|
1,309
|
2,142
|
-
|
833
|
1,351
|
96
|
||||||||||||||||||
|
Home equity
|
139
|
139
|
-
|
-
|
144
|
5
|
||||||||||||||||||
|
Construction and land
|
-
|
-
|
-
|
-
|
-
|
-
|
||||||||||||||||||
|
Commercial real estate
|
392
|
392
|
-
|
-
|
431
|
15
|
||||||||||||||||||
|
Consumer
|
-
|
-
|
-
|
-
|
-
|
-
|
||||||||||||||||||
|
Commercial
|
18
|
18
|
-
|
-
|
25
|
-
|
||||||||||||||||||
|
|
$
|
9,038
|
10,811
|
-
|
1,773
|
9,306
|
499
|
|||||||||||||||||
|
|
||||||||||||||||||||||||
|
Total Impaired
|
||||||||||||||||||||||||
|
|
||||||||||||||||||||||||
|
One- to four-family
|
$
|
7,642
|
8,582
|
73
|
940
|
7,825
|
415
|
|||||||||||||||||
|
Multi family
|
1,309
|
2,142
|
-
|
833
|
1,351
|
96
|
||||||||||||||||||
|
Home equity
|
246
|
246
|
46
|
-
|
254
|
12
|
||||||||||||||||||
|
Construction and land
|
-
|
-
|
-
|
-
|
-
|
-
|
||||||||||||||||||
|
Commercial real estate
|
2,885
|
3,294
|
67
|
409
|
4,489
|
196
|
||||||||||||||||||
|
Consumer
|
-
|
-
|
-
|
-
|
-
|
-
|
||||||||||||||||||
|
Commercial
|
18
|
18
|
-
|
-
|
25
|
-
|
||||||||||||||||||
|
|
$
|
12,100
|
14,282
|
186
|
2,182
|
13,944
|
719
|
|||||||||||||||||
The difference between a loan’s recorded investment and the unpaid principal balance represents a partial charge-off
resulting from a confirmed loss due to the value of the collateral securing the loan being below the loan balance and management’s assessment that the full collection of the loan balance is not likely.
When a loan is considered impaired, interest payments received are treated as interest income on a cash basis as long as
the remaining book value of the loan (i.e., after charge-off of all identified losses) is deemed to be fully collectible. If the remaining book value is not deemed to be fully collectible, all payments received are applied to unpaid principal.
Determination as to the ultimate collectability of the remaining book value is supported by an updated credit department evaluation of the borrower’s financial condition and prospects for repayment, including consideration of the borrower’s sustained
historical repayment performance and other relevant factors.
- 71 -
The determination as to whether an allowance is required with respect to impaired loans is based upon an analysis of the
value of the underlying collateral and/or the borrower’s intent and ability to make all principal and interest payments in accordance with contractual terms. The evaluation process is subject to the use of significant estimates and actual results
could differ from estimates. This analysis is primarily based upon third party appraisals and/or a discounted cash flow analysis. In those cases in which no allowance has been provided for an impaired loan, the Company has determined that the
estimated value of the underlying collateral exceeds the remaining outstanding balance of the loan. Of the total $9.8 million of impaired loans as of December 31, 2019 for which no allowance has been provided, $1.8 million in charge-offs have been
recorded to reduce the unpaid principal balance to an amount that is commensurate with the loan’s net realizable value, using the estimated fair value of the underlying collateral. To the extent that further deterioration in property values
continues, the Company may have to reevaluate the sufficiency of the collateral servicing these impaired loans resulting in additional provisions to the allowance for loans losses or charge-offs.
The following presents data on troubled debt restructurings:
|
|
As of December 31, 2019
|
|||||||||||||||||||||||
|
|
Accruing
|
Non-accruing
|
Total
|
|||||||||||||||||||||
|
|
Amount
|
Number
|
Amount
|
Number
|
Amount
|
Number
|
||||||||||||||||||
|
|
(Dollars in Thousands)
|
|||||||||||||||||||||||
|
One- to four-family
|
$
|
2,740
|
2
|
$
|
685
|
5
|
$
|
3,425
|
7
|
|||||||||||||||
|
Multi family
|
-
|
-
|
308
|
2
|
308
|
2
|
||||||||||||||||||
|
Commercial real estate
|
278
|
1
|
7
|
1
|
285
|
2
|
||||||||||||||||||
|
|
$
|
3,018
|
3
|
$
|
1,000
|
8
|
$
|
4,018
|
11
|
|||||||||||||||
|
|
As of December 31, 2018
|
|||||||||||||||||||||||
|
|
Accruing
|
Non-accruing
|
Total
|
|||||||||||||||||||||
|
|
Amount
|
Number
|
Amount
|
Number
|
Amount
|
Number
|
||||||||||||||||||
|
|
(Dollars in Thousands)
|
|||||||||||||||||||||||
|
One- to four-family
|
$
|
2,740
|
2
|
$
|
844
|
5
|
$
|
3,584
|
7
|
|||||||||||||||
|
Multi family
|
-
|
-
|
372
|
2
|
372
|
2
|
||||||||||||||||||
|
Commercial real estate
|
2,759
|
2
|
17
|
1
|
2,776
|
3
|
||||||||||||||||||
|
|
$
|
5,499
|
4
|
$
|
1,233
|
8
|
$
|
6,732
|
12
|
|||||||||||||||
Troubled debt restructurings involve granting concessions to a borrower experiencing financial difficulty by modifying
the terms of the loan in an effort to avoid foreclosure. Typical restructured terms include six months to twelve months months of principal forbearance, a reduction in interest rate or both. In no instances have the restructured terms included a
reduction of outstanding principal balance. At December 31, 2019, $4.0 million in loans had been modified in troubled debt restructurings and $1.0 million of these loans were included in the non-accrual loan total. The remaining $3.0 million, while
meeting the internal requirements for modification in a troubled debt restructuring, were current with respect to payments under their original loan terms at the time of the restructuring, and thus continued to be included with accruing
loans. Provided these loans perform in accordance with the modified terms, they will continue to be accounted for on an accrual basis.
All loans that have been modified in a troubled debt restructuring are considered to be impaired. As such, an analysis
has been performed with respect to all of these loans to determine the need for a valuation reserve. When a loan is expected to perform in accordance with the restructured terms and ultimately return to and perform under contract terms, a valuation
allowance is established equal to the excess of the present value of the expected future cash flows under the original contract terms as compared with the modified terms, including an estimated default rate. When there is doubt as to the borrower’s
ability to perform under the restructured terms or ultimately return to and perform under market terms, a valuation allowance is established equal to the impairment when the carrying amount exceeds fair value of the underlying collateral. As a
result of the impairment analysis, a $7,000 valuation allowance has been established as of December 31, 2019 with respect to the $4.0 million in troubled debt restructurings. As of December 31, 2018, $67,000 in valuation allowance had been
established with respect to the $6.7 million in troubled debt restructurings.
If an updated credit department review indicates no other evidence of elevated credit risk and the borrower completes a
minimum of six consecutive contractual payments, the loan is returned to accrual status at that time.
- 72 -
The following presents troubled debt restructurings by concession type at December 31, 2019 and 2018:
|
|
As of December 31, 2019
|
|||||||||||||||||||||||
|
|
Performing in
accordance with
modified terms
|
In Default
|
Total
|
|||||||||||||||||||||
|
|
Amount
|
Number
|
Amount
|
Number
|
Amount
|
Number
|
||||||||||||||||||
|
|
(Dollars in Thousands)
|
|||||||||||||||||||||||
|
Interest reduction and principal forbearance
|
$
|
3,246
|
6
|
448
|
2
|
3,694
|
8
|
|||||||||||||||||
|
Interest reduction
|
324
|
3
|
-
|
-
|
324
|
3
|
||||||||||||||||||
|
|
$
|
3,570
|
9
|
448
|
2
|
4,018
|
11
|
|||||||||||||||||
|
|
As of December 31, 2018
|
|||||||||||||||||||||||
|
|
Performing in
accordance with
modified terms
|
In Default
|
Total
|
|||||||||||||||||||||
|
|
Amount
|
Number
|
Amount
|
Number
|
Amount
|
Number
|
||||||||||||||||||
|
|
(Dollars in Thousands)
|
|||||||||||||||||||||||
|
Interest reduction and principal forbearance
|
$
|
5,848
|
7
|
546
|
2
|
6,394
|
9
|
|||||||||||||||||
|
Interest reduction
|
338
|
3
|
-
|
-
|
338
|
3
|
||||||||||||||||||
|
|
$
|
6,186
|
10
|
546
|
2
|
6,732
|
12
|
|||||||||||||||||
The following presents data on troubled debt restructurings:
|
|
For the Year Ended
|
|||||||||||||||
|
|
December 31, 2019
|
December 31, 2018
|
||||||||||||||
|
|
Amount
|
Number
|
Amount
|
Number
|
||||||||||||
|
|
(Dollars in Thousands)
|
|||||||||||||||
|
Loans modified as a troubled debt restructure
|
||||||||||||||||
|
Commercial real estate
|
$
|
-
|
-
|
2,476
|
1
|
|||||||||||
|
|
$
|
-
|
-
|
2,476
|
1
|
|||||||||||
|
|
||||||||||||||||
There were no troubled debt restructurings within the past twelve months for which there was a default during the year ended December 31,
2019.
The following table presents data on non-accrual loans:
|
|
As of December 31,
|
|||||||
|
|
2019
|
2018
|
||||||
|
|
(Dollars in Thousands)
|
|||||||
|
Residential
|
||||||||
|
One- to four-family
|
$
|
5,985
|
4,902
|
|||||
|
Multi family
|
667
|
1,309
|
||||||
|
Home equity
|
70
|
201
|
||||||
|
Construction and land
|
-
|
-
|
||||||
|
Commercial real estate
|
303
|
125
|
||||||
|
Commercial
|
-
|
18
|
||||||
|
Consumer
|
-
|
-
|
||||||
|
Total non-accrual loans
|
$
|
7,025
|
6,555
|
|||||
|
|
||||||||
|
Total non-accrual loans to total loans
|
0.51
|
%
|
0.48
|
%
|
||||
|
Total non-accrual loans to total assets
|
0.35
|
%
|
0.34
|
%
|
||||
- 73 -
| 4) |
Office Properties and Equipment
|
Office properties and equipment are summarized as follows:
|
|
December 31,
|
|||||||
|
|
2019
|
2018
|
||||||
|
|
(In Thousands)
|
|||||||
|
Land
|
$
|
7,516
|
7,357
|
|||||
|
Office buildings and improvements
|
34,433
|
32,473
|
||||||
|
Furniture and equipment
|
13,468
|
13,518
|
||||||
|
|
55,417
|
53,348
|
||||||
|
Less accumulated depreciation
|
(30,389
|
)
|
(28,824
|
)
|
||||
|
|
$
|
25,028
|
24,524
|
|||||
Depreciation of premises and equipment totaled $2.5 million, $2.3 million and $2.1 million for the years ended December
31, 2019, 2018 and 2017, respectively.
| 5) |
Real Estate Owned
|
Real estate owned is summarized as follows:
|
|
December 31,
|
|||||||
|
|
2019
|
2018
|
||||||
|
|
(In Thousands)
|
|||||||
|
One- to four-family
|
$
|
46
|
163
|
|||||
|
Multi-family
|
-
|
-
|
||||||
|
Construction and land
|
1,256
|
3,327
|
||||||
|
Commercial real estate
|
-
|
300
|
||||||
|
Total
|
1,302
|
3,790
|
||||||
|
Valuation allowance at end of period
|
(554
|
)
|
(1,638
|
)
|
||||
|
Total real estate owned, net
|
$
|
748
|
2,152
|
|||||
The following table presents the activity in real estate owned:
|
|
Year Ended December 31,
|
|||||||
|
|
2019
|
2018
|
||||||
|
|
(In Thousands)
|
|||||||
|
Real estate owned at beginning of period
|
$
|
2,152
|
4,558
|
|||||
|
Transferred in from loans receivable
|
1,052
|
545
|
||||||
|
Sales
|
(2,446
|
)
|
(2,642
|
)
|
||||
|
Write downs
|
-
|
(309
|
)
|
|||||
|
Other activity
|
(10
|
)
|
-
|
|||||
|
Real estate owned at end of period
|
$
|
748
|
2,152
|
|||||
Residential one- to four-family mortgage loans that were in the process of foreclosure were $2.3 million and $2.2 million at December 31, 2019
and December 31, 2018, respectively.
- 74 -
| 6) |
Mortgage Servicing Rights
|
The following table presents the activity related to the Company’s mortgage servicing rights:
|
|
Year ended December 31,
|
|||||||
|
|
2019
|
2018
|
||||||
|
|
(In Thousands)
|
|||||||
|
Mortgage servicing rights at beginning of the period
|
$
|
109
|
$
|
888
|
||||
|
Additions
|
354
|
427
|
||||||
|
Amortization
|
(104
|
)
|
(191
|
)
|
||||
|
Sales
|
-
|
(1,015
|
)
|
|||||
|
Mortgage servicing rights at end of the period
|
359
|
109
|
||||||
|
Valuation allowance at end of period
|
(77
|
)
|
-
|
|||||
|
Mortgage servicing rights at the end of the period, net
|
$
|
282
|
$
|
109
|
||||
During the year ended December 31, 2019, on a consolidated basis, $2.85 billion in residential loans were originated for sale, which
excludes the loans originated from Waterstone Mortgage Corporation and purchased by WaterStone Bank. During the same period, sales of loans held for sale totaled $2.77 billion, generating mortgage banking income of $125.7 million. The unpaid
principal balance of loans serviced for others was $64.9 million and $14.1 million at December 31, 2019 and December 31, 2018 respectively. Loans serviced for others are not reflected in the consolidated statements of financial condition.
The fair value of mortgage servicing rights were $282,000 at December 31, 2019 and $109,000 at December 31, 2018.
During the year ended December 31, 2019, the Company did not sell any mortgage servicing rights. During the year ended December 31, 2018,
the Company sold mortgage servicing rights related to $148.7 million in loans receivable and with a book value of $1.0 million for $1.4 million resulting in a gain on sale of $417,000.
The following table shows the estimated future amortization expense for mortgage servicing rights at December 31, 2019 for
the years ended December 31 periods indicated:
|
|
(In Thousands)
|
|||
|
2020
|
$
|
63
|
||
|
2021
|
55
|
|||
|
2022
|
47
|
|||
|
2023
|
39
|
|||
|
2024
|
31
|
|||
|
Thereafter
|
47
|
|||
|
Total
|
$
|
282
|
||
- 75 -
| 7) |
Deposits
|
The aggregate amount of time deposit accounts with balances greater than $250,000 at December 31, 2019 and 2018 amounted
to $70.6 million and $60.1 million, respectively.
A summary of interest expense on deposits is as follows:
|
|
Years ended December 31,
|
|||||||||||
|
|
2019
|
2018
|
2017
|
|||||||||
|
|
(In Thousands)
|
|||||||||||
|
Interest-bearing demand deposits
|
$
|
33
|
33
|
28
|
||||||||
|
Money market, savings, and escrow deposits
|
1,247
|
599
|
401
|
|||||||||
|
Time deposits
|
15,998
|
10,995
|
7,310
|
|||||||||
|
|
$
|
17,278
|
11,627
|
7,739
|
||||||||
A summary of the contractual maturities of time deposits at December 31, 2019 is as follows:
|
|
(In Thousands)
|
|||
|
Within one year
|
$
|
665,703
|
||
|
One to two years
|
70,049
|
|||
|
Two to three years
|
2,352
|
|||
|
Three to four years
|
871
|
|||
|
Four through five years
|
796
|
|||
|
|
$
|
739,771
|
||
- 76 -
| 8) |
Borrowings
|
Borrowings consist of the following:
|
|
December 31, 2019
|
December 31, 2018
|
||||||||||||||
|
|
Balance
|
Weighted
Average
Rate
|
Balance
|
Weighted
Average
Rate
|
||||||||||||
|
|
(Dollars in Thousands)
|
|||||||||||||||
|
Short term:
|
||||||||||||||||
|
Repurchase agreements
|
$
|
13,562
|
4.66
|
%
|
$
|
5,046
|
5.39
|
%
|
||||||||
|
|
||||||||||||||||
|
Long term:
|
||||||||||||||||
|
Federal Home Loan Bank advances maturing:
|
||||||||||||||||
|
2027
|
50,000
|
1.73
|
%
|
175,000
|
1.38
|
%
|
||||||||||
|
2028
|
255,000
|
2.37
|
%
|
255,000
|
2.37
|
%
|
||||||||||
|
2029
|
165,000
|
1.61
|
%
|
-
|
-
|
|||||||||||
|
|
$
|
483,562
|
2.11
|
%
|
$
|
435,046
|
2.01
|
%
|
||||||||
The short-term repurchase agreements represents the outstanding portion of a total $35.0 million commitment with one
unrelated bank. The short-term repurchase agreement is utilized by Waterstone Mortgage Corporation to finance loans originated for sale. This agreement is secured by the underlying loans being financed. Related interest rates are based upon the
note rate associated with the loans being financed. The short-term repurchase agreement had a $13.6 million balance on a total commitment of $35.0 million at December 31, 2019.
The Company enters into agreements under which it sells loans held for sale subject to an obligation to repurchase the
same loans. Under these arrangements, the Company may transfer legal control over the assets but still retain effective control through an agreement that both entitles and obligates the Company to repurchase the assets. As a result, these repurchase
agreements are accounted for as collateralized financing arrangements (i.e., secured borrowings) and not as a sale and subsequent repurchase of assets. The obligation to repurchase the assets is reflected as a liability in the Company's consolidated
statements of condition, while the loans held for sale underlying the repurchase agreements remain in loans held for sale as an asset in the Company's consolidated statements of condition. In other words, there is no offsetting or netting of the
loans held for sale assets with the repurchase agreement liabilities. The Company's repurchase agreements are subject to master netting agreements, which sets forth the rights and obligations for repurchase and offset. Under the master netting
agreement, the Company is entitled to set off the collateral placed with a single counterparty against obligations owed to that counterparty.
The $50.0 million in advances due in 2027 has a fixed rate of 1.73% and has a contractual maturity date in December
2027.
The $255.0 million in advances due in 2028 consists of one $25.0 million advance with a fixed rate of 2.16% with a
FHLB single call option in March 2020, two advances totaling $55.0 million with a fixed rate of 2.27% and with a FHLB single call option in March 2021, one advance of $25.0 million with a fixed rate of 2.40% and with a FHLB single call option in May
2020, two advances totaling $50.0 million with fixed rates of 2.34% and 2.48% and with a FHLB single call option in May 2021, one advance of $50.0 million with a fixed rate of 2.34% and with a FHLB quarterly call option beginning in June 2020, and
one advance of $50.0 million with a fixed rate of 2.57% and with a FHLB quarterly call option beginning in September 2020.
The $165.0 million in advances due in 2029 consists of one $50.0 million advance with a fixed rate of 1.98% with a
FHLB quarterly call option in May 2022, one $50.0 million advance with a fixed rate of 1.75% with a FHLB quarterly call option in August 2021, one $25.0 million advance with a fixed rate of 1.52% with a FHLB quarterly call option in November 2020,
and one advance of $40.0 million with a fixed rate of 1.02% and with a FHLB quarterly call option.
The Company selects loans that meet underwriting criteria established by the Federal Home Loan Bank Chicago (FHLBC) as
collateral for outstanding advances. The Company’s borrowings at the FHLBC are limited to 80% of the carrying value of unencumbered one- to four-family mortgage loans, 64% of the carrying value of home equity loans and 75% of the carrying value of
over four-family loans. In addition, these advances are collateralized by FHLBC stock of $21.2 million at December 31, 2019 and $19.4 million at December 31, 2018. In the event of prepayment, the Company is obligated to pay all remaining contractual
interest on the advance.
- 77 -
| 9) |
Regulatory Capital
|
The Company and the Bank are subject to various regulatory capital requirements administered by the federal banking agencies. Failure to
meet minimum capital requirements, or overall financial performance deemed by the regulators to be inadequate, can initiate certain mandatory and possibly additional discretionary actions by regulators that, if undertaken, could have a direct
material effect on the Company’s financial condition and results of operations. Under capital adequacy guidelines and the regulatory framework for prompt corrective action, the Bank must meet specific capital guidelines that involve quantitative
measures of the Company's and Bank’s assets, liabilities, and certain off-balance-sheet items, as calculated under regulatory accounting practices. The Company's and Bank’s capital amounts and classification are also subject to qualitative judgments
by the regulators about components, risk weightings, and other factors.
The Federal Reserve Board and the FDIC issued final rules implementing the Basel III regulatory capital framework and related Dodd-Frank
Wall Street Reform and Consumer Protection Act changes. The rules revise minimum capital requirements and adjust prompt corrective action thresholds. The final rules revised the regulatory capital elements, added a new common equity Tier I capital
ratio, increased the minimum Tier 1 capital ratio requirements and implemented a new capital conservation buffer. The rules also permitted certain banking organizations to retain, through a one-time election, the existing treatment for accumulated
other comprehensive income. The Company and the Bank have made the election to retain the existing treatment for accumulated other comprehensive income. The final rules took effect for the Company and the Bank on January 1, 2015, subject to a
transition period for certain parts of the rules.
In addition, as a result of the legislation, the federal banking agencies are required to develop a “Community Bank Leverage Ratio” (the
ratio of a bank’s tangible equity capital to average total consolidated assets) for financial institutions with assets of less than $10 billion. A “qualifying community bank” that exceeds this ratio will be deemed to be in compliance with all other
capital and leverage requirements, including the capital requirements to be considered “well capitalized” under Prompt Corrective Action statutes. The federal banking agencies may consider a financial institution’s risk profile when evaluating
whether it qualifies as a community bank for purposes of the capital ratio requirement. On September 17, 2019, the Board of the Federal Deposit Insurance Corporation passed a final rule on the community bank leverage ratio, setting the minimum
required community bank leverage ratio at 9%. In addition, the Federal Reserve Board was required to raise the asset threshold under its Small Bank Holding Company Policy Statement from $1 billion to $3 billion for bank or savings and loan holding
companies that are exempt from consolidated capital requirements, provided that such companies meet certain other conditions such as not engaging in significant non-banking activities. The rule went into effect on January 1, 2020. A financial
institution can elect to be subject to this new definition.
The table below includes the regulatory capital ratio requirements that became effective on January 1, 2015. Beginning in 2016, an
additional capital conservation buffer was added to the minimum requirements for capital adequacy purposes, subject to a three year phase-in period. The capital conservation buffer was fully phased-in as of January 1, 2019 at 2.5%. A banking
organization with a conservation buffer of less than 2.5% will be subject to limitations on capital distributions, including dividend payments and certain discretionary bonus payments to executive officers. At December 31, 2019, the ratios for the
Company and the Bank are sufficient to meet the fully phased-in conservation buffer.
- 78 -
The actual and required capital amounts and ratios as of December 31, 2019 and 2018 are presented in the table below:
|
|
December 31, 2019
|
|||||||||||||||||||||||||||||||
|
|
Actual
|
For Capital
Adequacy Purposes
|
Minimum Capital Adequacy with Capital Buffer
|
To Be Well-Capitalized Under Prompt Corrective Action Provisions
|
||||||||||||||||||||||||||||
|
|
Amount
|
Ratio
|
Amount
|
Ratio
|
Amount
|
Ratio
|
Amount
|
Ratio
|
||||||||||||||||||||||||
|
|
(Dollars In Thousands)
|
|||||||||||||||||||||||||||||||
|
|
||||||||||||||||||||||||||||||||
|
Total capital (to risk-weighted assets)
|
||||||||||||||||||||||||||||||||
|
Consolidated Waterstone Financial , Inc.
|
$
|
404,748
|
26.17
|
%
|
123,731
|
8.00
|
%
|
162,398
|
10.500
|
%
|
N/A
|
N/A
|
||||||||||||||||||||
|
WaterStone Bank
|
353,357
|
22.85
|
%
|
123,716
|
8.00
|
%
|
162,378
|
10.500
|
%
|
154,646
|
10.00
|
%
|
||||||||||||||||||||
|
Tier I capital (to risk-weighted assets)
|
||||||||||||||||||||||||||||||||
|
Consolidated Waterstone Financial , Inc.
|
392,361
|
25.37
|
%
|
92,799
|
6.00
|
%
|
131,465
|
8.500
|
%
|
N/A
|
N/A
|
|||||||||||||||||||||
|
WaterStone Bank
|
340,970
|
22.05
|
%
|
92,787
|
6.00
|
%
|
131,449
|
8.500
|
%
|
123,716
|
8.00
|
%
|
||||||||||||||||||||
|
Common Equity Tier 1 Capital (to risk-weighted assets)
|
||||||||||||||||||||||||||||||||
|
Consolidated Waterstone Financial , Inc.
|
392,361
|
25.37
|
%
|
69,599
|
4.50
|
%
|
108,265
|
7.000
|
%
|
N/A
|
N/A
|
|||||||||||||||||||||
|
WaterStone Bank
|
340,970
|
22.05
|
%
|
69,590
|
4.50
|
%
|
108,252
|
7.000
|
%
|
100,520
|
6.50
|
%
|
||||||||||||||||||||
|
Tier I capital (to average assets)
|
||||||||||||||||||||||||||||||||
|
Consolidated Waterstone Financial , Inc.
|
392,361
|
19.69
|
%
|
79,691
|
4.00
|
%
|
N/A
|
N/A
|
N/A
|
N/A
|
||||||||||||||||||||||
|
WaterStone Bank
|
340,970
|
17.11
|
%
|
79,691
|
4.00
|
%
|
N/A
|
N/A
|
99,614
|
5.00
|
%
|
|||||||||||||||||||||
|
State of Wisconsin (to total assets)
|
||||||||||||||||||||||||||||||||
|
WaterStone Bank
|
340,970
|
17.11
|
%
|
119,590
|
6.00
|
%
|
N/A
|
N/A
|
N/A
|
N/A
|
||||||||||||||||||||||
|
|
||||||||||||||||||||||||||||||||
|
|
December 31, 2018
|
|||||||||||||||||||||||||||||||
|
|
(Dollars In Thousands)
|
|||||||||||||||||||||||||||||||
|
Total capital (to risk-weighted assets)
|
||||||||||||||||||||||||||||||||
|
Consolidated Waterstone Financial , Inc.
|
$
|
414,566
|
28.22
|
%
|
117,506
|
8.00
|
%
|
145,046
|
9.88
|
%
|
N/A
|
N/A
|
||||||||||||||||||||
|
WaterStone Bank
|
395,783
|
26.95
|
%
|
117,490
|
8.00
|
%
|
145,027
|
9.88
|
%
|
146,863
|
10.00
|
%
|
||||||||||||||||||||
|
Tier I capital (to risk-weighted assets)
|
||||||||||||||||||||||||||||||||
|
Consolidated Waterstone Financial , Inc.
|
401,317
|
27.32
|
%
|
88,130
|
6.00
|
%
|
115,670
|
7.88
|
%
|
N/A
|
N/A
|
|||||||||||||||||||||
|
WaterStone Bank
|
382,534
|
26.05
|
%
|
88,118
|
6.00
|
%
|
115,655
|
7.88
|
%
|
117,490
|
8.00
|
%
|
||||||||||||||||||||
|
Common Equity Tier 1 Capital (to risk-weighted assets)
|
||||||||||||||||||||||||||||||||
|
Consolidated Waterstone Financial , Inc.
|
401,317
|
27.32
|
%
|
66,097
|
4.50
|
%
|
93,638
|
6.38
|
%
|
N/A
|
N/A
|
|||||||||||||||||||||
|
WaterStone Bank
|
382,534
|
26.05
|
%
|
66,088
|
4.50
|
%
|
93,625
|
6.38
|
%
|
95,461
|
6.50
|
%
|
||||||||||||||||||||
|
Tier I capital (to average assets)
|
||||||||||||||||||||||||||||||||
|
Consolidated Waterstone Financial , Inc.
|
401,317
|
21.06
|
%
|
76,214
|
4.00
|
%
|
N/A
|
N/A
|
N/A
|
N/A
|
||||||||||||||||||||||
|
WaterStone Bank
|
382,534
|
20.08
|
%
|
76,214
|
4.00
|
%
|
N/A
|
N/A
|
95,268
|
5.00
|
%
|
|||||||||||||||||||||
|
State of Wisconsin (to total assets)
|
||||||||||||||||||||||||||||||||
|
WaterStone Bank
|
382,534
|
20.01
|
%
|
114,712
|
6.00
|
%
|
N/A
|
N/A
|
N/A
|
N/A
|
||||||||||||||||||||||
- 79 -
| 10) |
Stock Based Compensation
|
Stock-Based Compensation Plan
In 2006, the Company’s shareholders approved the 2006 Equity Incentive Plan. All stock awards granted under this plan
vest over a period of five years and are required to be settled in shares of the Company’s common stock. The exercise price for all stock options granted is equal to the quoted NASDAQ market closing price on the date that the awards were granted and
expire ten years after the grant date, if not exercised. All restricted stock grants are issued from previously unissued shares.
In 2015, the Company's shareholders approved the 2015 Equity Incentive Plan. A total of 2,530,000 stock options and
1,012,000 restricted shares were approved for award. A total of 1,302,000 stock options and 466,000 restricted stock are available to be issued as of December 31, 2019. The stock options granted to employees under this plan typically vest over a
period of five years. The stock option awards granted to directors under this plan vest over a period of eight years. The exercise price for all stock options granted is equal to the quoted NASDAQ market close price on the date that the awards were
granted and expire ten years after the grant date, if not exercised. The restricted stock awards granted to employees under this plan vest in five installments over four years with one installment vesting immediately. The stock awards granted to
directors under this plan vest in eight installments over seven years with one installment vesting immediately. The fair value of the restricted stock awards were equal to the quoted NASDAQ market closing price on the vest date.
Accounting for Stock-Based Compensation Plan
The fair value of stock options granted is estimated on the grant date using a Black-Scholes pricing model. The fair
value of restricted shares is equal to the quoted NASDAQ market closing price on the date of grant. The fair value of stock grants is recognized as compensation expense on a straight-line basis over the vesting period of the grants. Compensation
expense is included in compensation, payroll taxes and other employee benefits in the consolidated statements of income.
Assumptions are used in estimating the fair value of stock options granted. The weighted average expected life of the
stock options represent the period of time that the options are expected to be outstanding and is based on the historical results from the previous awards. The risk-free interest rate is based on the U.S. Treasury yield curve in effect at the time of
grant. The expected volatility is based on the actual volatility of Waterstone Financial, Inc. stock for the weighted average life time period prior to issuance date. The following assumptions were used in estimating the fair value of options granted
in the years ended December 31, 2019 and 2018.
|
2019
|
2018
|
|||||||||||||||
|
|
Minimum
|
Maximum
|
Minimum
|
Maximum
|
||||||||||||
|
Dividend yield
|
2.56
|
%
|
2.92
|
%
|
2.70
|
%
|
2.74
|
%
|
||||||||
|
Risk-free interest rate
|
1.42
|
%
|
2.28
|
%
|
2.57
|
%
|
2.96
|
%
|
||||||||
|
Expected volatility
|
16.07
|
%
|
16.37
|
%
|
16.27
|
%
|
30.88
|
%
|
||||||||
|
Weighted average expected life
|
5.0
|
5.8
|
5.4
|
6.2
|
||||||||||||
|
Weighted average per share value of options
|
$
|
1.72
|
2.12
|
1.97
|
4.26
|
|||||||||||
The Company's policy is to adjust compensation expense at the time of actual stock grant forfeiture.
- 80 -
A summary of the Company’s stock option activity for the years ended December 31, 2019, 2018 and 2017 is presented below.
|
Stock Options
|
Shares
|
Weighted Average
Exercise Price
|
Weighted Average
Years Remaining in
Contractual Term
|
Aggregate
Intrinsic Value
(000's)
|
||||||||||||
|
Outstanding December 31, 2016
|
1,362,499
|
$
|
11.83
|
7.74
|
8,785
|
|||||||||||
|
Options exercisable at December 31, 2016
|
304,595
|
9.66
|
6.44
|
2,625
|
||||||||||||
|
|
||||||||||||||||
|
Granted
|
20,000
|
18.78
|
(35
|
)
|
||||||||||||
|
Exercised
|
(211,205
|
)
|
6.48
|
2,233
|
||||||||||||
|
Forfeited
|
(12,195
|
)
|
14.83
|
27
|
||||||||||||
|
Outstanding December 31, 2017
|
1,159,099
|
12.89
|
7.24
|
4,870
|
||||||||||||
|
Options exercisable at December 31, 2017
|
331,097
|
12.53
|
7.10
|
1,501
|
||||||||||||
|
|
||||||||||||||||
|
Granted
|
80,000
|
17.23
|
3
|
|||||||||||||
|
Exercised
|
(106,030
|
)
|
12.30
|
473
|
||||||||||||
|
Forfeited
|
(72,000
|
)
|
13.97
|
224
|
||||||||||||
|
Outstanding December 31, 2018
|
1,061,069
|
13.21
|
6.47
|
3,850
|
||||||||||||
|
Options exercisable at December 31, 2018
|
421,068
|
12.78
|
6.23
|
1,688
|
||||||||||||
|
|
||||||||||||||||
|
Granted
|
30,000
|
17.13
|
56
|
|||||||||||||
|
Exercised
|
(50,298
|
)
|
13.10
|
298
|
||||||||||||
|
Forfeited
|
(15,000
|
)
|
15.62
|
51
|
||||||||||||
|
Outstanding December 31, 2019
|
1,025,771
|
13.29
|
5.56
|
5,887
|
||||||||||||
|
Options exercisable at December 31, 2019
|
546,770
|
12.93
|
5.31
|
3,335
|
||||||||||||
The following table summarizes information about the Company's stock options outstanding at December 31, 2019.
|
Options
Outstanding
|
Weighted
Average
Exercise Price
|
Remaining
Life
(Years)
|
Options
Exercisable
|
Weighted
Average
Exercise Price
|
Remaining
Life
(Years)
|
|||||||||||||||||||||
|
Range of Exercise Prices
|
||||||||||||||||||||||||||
|
$
|
0.01 - $5.00
|
4,233
|
$
|
1.73
|
2.01
|
4,233
|
$
|
1.73
|
2.01
|
|||||||||||||||||
|
$
|
5.01 - $10.00
|
-
|
-
|
-
|
-
|
-
|
-
|
|||||||||||||||||||
|
$
|
10.01 - $15.00
|
903,538
|
12.81
|
5.21
|
517,537
|
12.82
|
5.22
|
|||||||||||||||||||
|
Over $15.01
|
118,000
|
17.55
|
8.36
|
25,000
|
17.84
|
7.75
|
||||||||||||||||||||
|
1,025,771
|
$
|
13.29
|
5.56
|
546,770
|
$
|
12.93
|
5.31
|
|||||||||||||||||||
- 81 -
The following table summarizes information about the Company’s nonvested stock option activity for the years ended December
31, 2019 and 2018:
|
Stock Options
|
Shares
|
Weighted Average
Grant Date Fair Value
|
||||||
|
|
||||||||
|
Nonvested at December 31, 2017
|
828,002
|
$
|
3.27
|
|||||
|
Granted
|
80,000
|
3.66
|
||||||
|
Vested
|
(200,001
|
)
|
3.27
|
|||||
|
Forfeited
|
(68,000
|
)
|
3.46
|
|||||
|
Nonvested at December 31, 2018
|
640,001
|
3.30
|
||||||
|
|
||||||||
|
Nonvested at December 31, 2018
|
640,001
|
3.30
|
||||||
|
Granted
|
30,000
|
1.87
|
||||||
|
Vested
|
(176,000
|
)
|
3.28
|
|||||
|
Forfeited
|
(15,000
|
)
|
2.34
|
|||||
|
Nonvested at December 31, 2019
|
479,001
|
3.24
|
||||||
The Company amortizes the expense related to stock options as compensation expense over the vesting period. Expense for
the stock options granted of $582,000, $608,000 and $638,000 was recognized during the years ended December 31, 2019, 2018 and 2017, respectively. At December 31, 2019, the Company had $1.1 million in estimated unrecognized compensation costs
related to outstanding stock options that is expected to be recognized over a weighted average period of 24 months.
The following table summarizes information about the Company’s restricted stock shares activity for the years ended
December 31, 2019 and 2018:
|
Restricted Stock
|
Shares
|
Weighted Average
Grant Date Fair Value
|
||||||
|
Nonvested at December 31, 2017
|
259,200
|
$
|
12.85
|
|||||
|
Granted
|
-
|
-
|
||||||
|
Vested
|
(93,100
|
)
|
12.84
|
|||||
|
Forfeited
|
(3,500
|
)
|
12.75
|
|||||
|
Nonvested at December 31, 2018
|
162,600
|
12.85
|
||||||
|
|
||||||||
|
Nonvested at December 31, 2018
|
162,600
|
12.85
|
||||||
|
Granted
|
-
|
-
|
||||||
|
Vested
|
(89,600
|
)
|
12.84
|
|||||
|
Forfeited
|
-
|
-
|
||||||
|
Nonvested at December 31, 2019
|
73,000
|
12.86
|
||||||
The Company amortizes the expense related to restricted stock awards as compensation expense over the vesting
period. Expense for the restricted stock awards of $486,000, $1.2 million and $1.3 million was recorded for the years ended December 31, 2019, 2018 and 2017, respectively. At December 31, 2019, the Company had $660,000 of unrecognized compensation
expense related to restricted stock shares that is expected to be recognized over a weighted average period of 25 months.
- 82 -
| 11) |
Employee Benefit Plans
|
The Company has two 401(k) profit sharing plans and trusts covering substantially all employees. WaterStone Bank
employees over 18 years of age are immediately eligible to participate in the Bank’s plan. Waterstone Mortgage employees over 18 years of age are eligible to participate in its plan as of the first of the month following their date of
employment. Participating employees may annually contribute pretax compensation in accordance with IRS limits. The Company made matching contributions of $1.0 million, $971,000 and $825,000 to the plans during the years ended December 31, 2019,
2018 and 2017 respectively.
| 12) |
Employee Stock Ownership Plan
|
All employees are eligible to participate in the WaterStone Bank Employee Stock Ownership Plan (the “Plan”) after they
attain 21 years of age and complete 12 consecutive months of service in which they work at least 1,000 hours of service. The Plan debt is secured by shares of the Company. The Company has committed to make annual contributions to the Plan necessary
to repay the loan, including interest.
During the year ended December 31, 2005, the Plan borrowed $8.5 million from the Company and purchased 835,610 shares
of common stock of the Company in the open market. During the year ended December 31, 2014, the Plan borrowed an additional $23.8 million from the Company, refinanced the remaining 83,561 shares (related to the 2005 Plan purchase), and purchased an
additional 2,024,000 shares of common stock of the Company in the open market. While the shares are not released and allocated to Plan participants until the loan payment is made, the shares are deemed to be earned and are therefore, committed to be
released throughout the service period. As such, one-twentieth of the total 2,107,561 shares are scheduled to be released annually as shares are earned over a period of 20 years, beginning with the period ended December 31, 2014. As the debt is
repaid, shares are released from collateral and allocated to active participant accounts. The shares pledged as collateral are reported as “Unearned ESOP shares” in the consolidated statement of financial condition. As shares are committed to be
released from collateral, the Company reports compensation expense equal to the average fair market price of the shares, and the shares become outstanding for earnings per share computations. Compensation expense attributed to the ESOP was $1.8
million, $1.8 million and $2.0 million, respectively for the years ended December 31, 2019, 2018 and 2017.
The aggregate activity in the number of unearned ESOP shares, considering the allocation of those shares committed to be
released as of December 31, 2019 and 2018 is as follows:
|
|
2019
|
2018
|
||||||
|
Beginning ESOP shares
|
1,580,671
|
1,686,049
|
||||||
|
Shares committed to be released
|
(105,378
|
)
|
(105,378
|
)
|
||||
|
Unreleased shares
|
1,475,293
|
1,580,671
|
||||||
|
Fair value of unreleased shares (in millions)
|
$
|
28.1
|
26.5
|
|||||
| 13) |
Income Taxes
|
The provision for income taxes for the year ended December 31, 2019, 2018 and 2017 consists of the following:
|
|
Years ended December 31,
|
|||||||||||
|
|
2019
|
2018
|
2017
|
|||||||||
|
|
(In Thousands)
|
|||||||||||
|
Current:
|
||||||||||||
|
Federal
|
$
|
8,377
|
7,087
|
13,028
|
||||||||
|
State
|
2,655
|
1,904
|
2,362
|
|||||||||
|
|
11,032
|
8,991
|
15,390
|
|||||||||
|
Deferred:
|
||||||||||||
|
Federal
|
619
|
452
|
2,960
|
|||||||||
|
State
|
20
|
83
|
119
|
|||||||||
|
|
639
|
535
|
3,079
|
|||||||||
|
Total
|
$
|
11,671
|
9,526
|
18,469
|
||||||||
- 83 -
The income tax provisions differ from that computed at the Federal statutory corporate tax rate for the years ended
December 31, 2019, 2018 and 2017 as follows:
|
|
Years ended December 31,
|
|||||||||||
|
|
2019
|
2018
|
2017
|
|||||||||
|
|
(Dollars In Thousands)
|
|||||||||||
|
Income before income taxes
|
$
|
47,574
|
40,280
|
44,433
|
||||||||
|
Tax at Federal statutory rate (21% in 2019 and 2018, 35% in 2017)
|
9,991
|
8,459
|
15,552
|
|||||||||
|
Add (deduct) effect of:
|
||||||||||||
|
State income taxes net of Federal income tax benefit
|
2,113
|
1,570
|
1,613
|
|||||||||
|
Cash surrender value of life insurance
|
(406
|
)
|
(388
|
)
|
(632
|
)
|
||||||
|
Non-deductible ESOP and stock option expense
|
186
|
188
|
380
|
|||||||||
|
Tax-exempt interest income
|
(236
|
)
|
(248
|
)
|
(449
|
)
|
||||||
|
Non-deductible compensation
|
216
|
177
|
280
|
|||||||||
|
Deferred tax asset revaluation
|
-
|
-
|
2,644
|
|||||||||
|
Stock compensation
|
(146
|
)
|
(160
|
)
|
(1,074
|
)
|
||||||
|
Other
|
(47
|
)
|
(72
|
)
|
155
|
|||||||
|
Income tax provision
|
11,671
|
9,526
|
18,469
|
|||||||||
|
Effective tax rate
|
24.5
|
%
|
23.6
|
%
|
41.6
|
%
|
||||||
The significant components of the Company’s net deferred tax assets (liabilities) included in prepaid expenses and other
assets are as follows at December 31, 2019 and 2018:
|
|
December 31,
|
|||||||
|
|
2019
|
2018
|
||||||
|
Gross deferred tax assets:
|
(In Thousands)
|
|||||||
|
Restricted stock and stock options
|
440
|
526
|
||||||
|
Allowance for loan losses
|
3,031
|
3,239
|
||||||
|
Repurchase reserve for loans sold
|
244
|
139
|
||||||
|
Non-accrual interest
|
262
|
292
|
||||||
|
Real estate owned
|
305
|
741
|
||||||
|
Capital loss carryforward
|
-
|
23
|
||||||
|
Unrealized loss on impaired securities
|
23
|
23
|
||||||
|
Unrealized loss on securities available for sale, net
|
-
|
695
|
||||||
|
Lease liability
|
2,170
|
-
|
||||||
|
Other
|
32
|
98
|
||||||
|
Total gross deferred tax assets
|
6,507
|
5,776
|
||||||
|
Gross deferred tax liabilities:
|
||||||||
|
Excess tax depreciation
|
(80
|
)
|
(28
|
)
|
||||
|
Unrealized gain on securities available for sale, net
|
(429
|
)
|
-
|
|||||
|
Mortgage servicing rights
|
(75
|
)
|
(29
|
)
|
||||
|
FHLB stock dividends
|
(51
|
)
|
(68
|
)
|
||||
|
Lease asset
|
(2,053
|
)
|
-
|
|||||
|
Deferred loan fees
|
(406
|
)
|
(475
|
)
|
||||
|
Deferred liabilities
|
(3,094
|
)
|
(600
|
)
|
||||
|
Net deferred tax assets
|
$
|
3,413
|
5,176
|
|||||
- 84 -
The Company had a Wisconsin net operating loss carry forward of $22,000 at December 31, 2019 which will begin to expire
in 2028. The Company has no capital loss carryforwards as of December 31, 2019.
Under the Internal Revenue Code and Wisconsin Statutes, the Company was permitted to deduct, for tax years beginning
before 1988, an annual addition to a reserve for bad debts. This amount differs from the provision for loan losses recorded for financial accounting purposes. Under prior law, bad debt deductions for income tax purposes were included in taxable
income of later years only if the bad debt reserves were used for purposes other than to absorb bad debt losses. Because the Company did not intend to use the reserve for purposes other than to absorb losses, no deferred income taxes were provided.
Retained earnings at December 31, 2019 include approximately $16.7 million for which no deferred Federal or state income taxes were provided. Deferred income taxes have been provided on certain additions to the tax reserve for bad debts.
The Company and its subsidiaries file consolidated federal and combined state tax returns. One subsidiary also files
separate state income tax returns in certain states. The Company is no longer subject to state income tax examinations by certain state tax authorities for years before 2015 or subject to federal tax examinations for the years before 2016.
| 14) |
Commitments, Off-Balance Sheet Arrangements, and Contingent Liabilities
|
The Company is a party to financial instruments with off-balance-sheet risk in the normal course of business to meet the
financing needs of its customers. These financial instruments include commitments to extend credit and standby letters of credit. Those instruments involve, to varying degrees, elements of credit and interest rate risk in excess of the amounts
recognized in the consolidated balance sheets. The contract or notional amounts of those instruments reflect the extent of involvement the Company has in particular classes of financial instruments.
|
|
December 31,
|
|||||||
|
|
2019
|
2018
|
||||||
|
|
(In Thousands)
|
|||||||
|
Financial instruments whose contract amounts represent potential credit risk:
|
||||||||
|
Commitments to extend credit under first mortgage loans(1)
|
$
|
13,389
|
33,762
|
|||||
|
Commitments to extend credit under home equity lines of credit
|
13,776
|
14,903
|
||||||
|
Unused portion of construction loans
|
90,439
|
79,776
|
||||||
|
Unused portion of business lines of credit
|
14,623
|
16,778
|
||||||
|
Standby letters of credit
|
885
|
860
|
||||||
(1) Excludes commitments to originate loans held for sale, which are discussed in Footnote
15 - Derivative Financial Instruments.
Commitments to extend credit are agreements to lend to a customer as long as there is no violation of any condition
established in the contract. Commitments generally have fixed expiration dates or other termination clauses and may require payment of a fee. Since many of the commitments are expected to expire without being drawn upon, the total commitment amounts
do not necessarily represent future cash requirements of the Company. The Company evaluates each customer’s creditworthiness on a case-by-case basis. The amount of collateral obtained, if deemed necessary by the Company upon extension of credit, is
based on management’s credit evaluation of the counter-party. Collateral obtained generally consists of mortgages on the underlying real estate.
Standby letters of credit are conditional commitments issued by the Company to guarantee the performance of a customer
to a third party. The credit risk involved in issuing letters of credit is essentially the same as that involved in extending loan facilities to customers. The Company holds mortgages on the underlying real estate as collateral supporting those
commitments for which collateral is deemed necessary.
The Company has determined that there are no probable losses related to commitments to extend credit or the standby
letters of credit as of December 31, 2019 and 2018.
In the normal course of business, the Company, or it's subsidiaries are involved in various legal proceedings. In the
opinion of management, any liability resulting from pending proceedings would not be expected to have a material adverse effect on the Company's consolidated financial statements.
Herrington et al. v. Waterstone Mortgage Corporation
Waterstone Mortgage Corporation was a defendant in a class action lawsuit that was filed in the United States District
Court for the Western District of Wisconsin and subsequently compelled to arbitration before the American Arbitration Association. The plaintiff class alleged that Waterstone Mortgage Corporation violated certain provisions of the Fair Labor
Standards Act (FLSA) and failed to pay loan officers consistent with their employment agreements. On July 5, 2017, the arbitrator issued a Final Award finding Waterstone Mortgage Corporation liable for unpaid minimum wages, overtime, unreimbursed
business expenses, and liquidated damages under the FLSA. On December 8, 2017, the District Court confirmed the award in large part, and entered a judgment against Waterstone in the amount of $7,267,919 in damages to Claimants, $3,298,851 in attorney
fees and costs, and a $20,000 incentive fee to Plaintiff Herrington. The judgment was appealed by Waterstone to the Seventh Circuit Court of Appeals, where oral argument was held on May 29, 2018. On October 22, 2018, the Seventh Circuit issued a
ruling vacating the District Court's order enforcing the arbitration award. It found that Plaintiff Herrington had an enforceable class action waiver in her arbitration agreement, and remanded the case to the District Court. On April 25, 2019, the
District Court held that Plaintiff’s claims must be resolved through single-plaintiff arbitration. As a result, it vacated the July 5, 2017 arbitration award in its entirety, and issued a revised judgement in Waterstone’s favor.
- 85 -
In May 2019, Herrington re-initiated her individual arbitration. Over Waterstone’s objection, the arbitrator
considered evidence from the prior vacated proceeding. A hearing was held in Herrington’s individual arbitration in November 2019, and Herrington sought over $55,000 in damages on her individual claim, plus punitive damages, attorney fees and costs.
The arbitrator issued a written award on February 18, 2020 and in which he found Waterstone liable for damages. Herrington has requested damages of approximately $15,000. The arbitrator has not yet awarded a damages figure. The arbitrator also has
not yet ruled on the issue of attorney fees.
Waterstone disagrees with the ruling and will vigorously pursue all available challenges to it. Waterstone still
retains the right to challenge the award in Court, through a motion to vacate or modify the award. Even if the award is confirmed and a judgment is entered, it retains its appellate rights to challenge the award before the Seventh Circuit. Waterstone
believes there are meaningful avenues for appeal, including challenging the arbitrator’s reliance on prior findings from a vacated proceeding. Given these recent developments, Waterstone does not believe a loss is probable at this time, as that term
is used in assessing loss contingencies. Accordingly, in accordance with the authoritative guidance in the evaluation of contingencies, the Company has not recorded an accrual related to this matter. However, given the award, a loss is reasonably
possible and Waterstone would not characterize the chance of any loss as “remote.” If the arbitrator’s award is confirmed, we estimate that Herrington would recover approximately $15,000 in damages. The Company expects that Herrington will also seek to recover significant fees from both the individual and the prior vacated collective arbitration, but cannot estimate a reasonable range of the fees Herrington
will seek or that will be awarded at this time. On the other hand, if Waterstone prevails in challenging the award, it could be vacated in whole or in part.
Various Claimants v. Waterstone Mortgage Corporation
Waterstone Mortgage Corporation was a defendant in a class action lawsuit that was filed in the United States District
Court for the Western District of Wisconsin and subsequently compelled to arbitration before the American Arbitration Association. The plaintiff class alleged that Waterstone Mortgage Corporation violated certain provisions of the Fair Labor
Standards Act (FLSA) and failed to pay loan officers consistent with their employment agreements. On July 5, 2017, the arbitrator issued a Final Award finding Waterstone Mortgage Corporation liable for unpaid minimum wages, overtime, unreimbursed
business expenses, and liquidated damages under the FLSA. On December 8, 2017, the District Court entered a judgment against Waterstone in the amount of $7,267,919 in damages to Claimants, $3,298,851 in attorney fees and costs, and a $20,000
incentive fee to Plaintiff Herrington.
The judgment was then appealed by Waterstone to the Seventh Circuit Court of Appeals. On October 22, 2018, the Seventh
Circuit issued a ruling vacating the District Court’s order enforcing the arbitration award. It found that Plaintiff Herrington had an enforceable class action waiver in her arbitration agreement, and remanded the case to the District Court. On April
25, 2019, the District Court held that Plaintiff Herrington’s claims must be resolved through single-plaintiff arbitration. As a result, it vacated the July 5, 2017 arbitration award in its entirety, and issued a revised judgment in Waterstone’s
favor.
In May 2019, approximately 89 of the prior claimants in the aforementioned class action lawsuit filed new demands in
arbitration asserting similar claims (“the Arbitrations”). For the other claimants, Waterstone has answered those demands and denies the allegations, and Waterstone will continue to vigorously defend its interests in these matters. Waterstone does
not believe a loss is probable at this time, as that term is used in assessing loss contingencies. Accordingly, in accordance with the authoritative guidance in the evaluation of contingencies, the Company has not recorded an accrual related to this
matter. However, an unfavorable outcome is reasonably possible and Waterstone would not characterize the chance of any loss as “remote.” Given the early stage of the numerous proceedings, Waterstone cannot yet offer an opinion on the estimated range
of any possible loss, in the event of an unfavorable opinion.
- 86 -
| 15) |
Derivative Financial Instruments
|
In connection with its mortgage banking activities, the Company enters into derivative financial instruments as part of
its strategy to manage its exposure to changes in interest rates. Mortgage banking derivatives include interest rate lock commitments provided to customers to fund mortgage loans to be sold in the secondary market and forward commitments for the
future delivery of such loans. It is the Company’s practice to enter into forward commitments for the future delivery of residential mortgage loans when interest rate lock commitments are entered into in order to economically hedge the effect of
future changes in interest rates on its commitments to fund the loans as well as on its portfolio of mortgage loans held-for-sale. The Company’s mortgage banking derivatives have not been designated as being a hedge relationship. These instruments
are used to manage the Company’s exposure to interest rate movements and other identified risks but do not meet the strict hedge accounting requirements of ASC 815. Changes in the fair value of derivatives not designated in hedging relationships are
recorded directly in earnings. The Company does not use derivatives for speculative purposes.
Forward commitments to sell mortgage loans represent commitments obtained by the Company from a secondary market agency
to purchase mortgages from the Company at specified interest rates and within specified periods of time. Commitments to sell loans are made to mitigate interest rate risk on interest rate lock commitments to originate loans and loans held for
sale. At December 31, 2019, the Company had forward commitments to sell mortgage loans with an aggregate notional amount of $345.0 million and interest rate lock commitments with an aggregate notional amount of approximately $174.3 million. The
fair value of the forward commitments to sell mortgage loans at December 31, 2019 included a gain of $3,000 that is reported as a component of other assets on the Company's consolidated statement of financial condition. The fair value of the
interest rate locks at December 31, 2019 included a gain of $1.8 million that is reported as a component of other assets on the Company's consolidated statements of financial condition. At December 31, 2018, the Company had forward commitments to
sell mortgage loans with an aggregate notional amount of $276.3 million and interest rate lock commitments with an aggregate notional amount of approximately $164.9 million. The fair value of the forward commitments to sell mortgage loans at
December 31, 2018 included a loss of $1.1 million that is reported as a component of other liabilities on the Company's consolidated statement of financial condition. The fair value of the interest rate locks at December 31, 2018 included a gain of
$2.0 million that is reported as a component of other assets on the Company's consolidated statements of financial condition.
In determining the fair value of its derivative loan commitments, the Company considers the value that would be
generated when the loan arising from exercise of the loan commitment is sold in the secondary mortgage market. That value includes the price that the loan is expected to be sold for in the secondary mortgage market. The fair value of these
commitments is recorded on the consolidated statements of financial condition with the changes in fair value recorded as a component of mortgage banking income.
Residential mortgage loans sold to others are predominantly conventional residential first lien mortgages. The Company's
agreements to sell residential mortgage loans in the normal course of business usually require certain representations and warranties on the underlying loans sold related to credit information, loan documentation and collateral, which if subsequently
are untrue or breached, could require the Company to repurchase certain loans affected. The Company has only been required to make insignificant repurchases as a result of breaches of representations and warranties. The Company's agreements to sell
residential mortgage loans also contain limited recourse provisions. The recourse provisions are limited in that the recourse provision ends after certain payment criteria have been met. With respect to these loans, repurchase or a return of
servicing release premium could be required if defined delinquency issues or an early payoff occured during the limited recourse period.
The Company may offer derivative contracts to its customers in connection with their risk management needs. The Company
manages the risk associated with these contracts by entering into an equal and offsetting derivative with a third-party dealer. These derivatives generally work together as an economic interest rate hedge, but the Company does not designate them for
hedge accounting treatment. Consequently, changes in fair value of the corresponding derivative financial asset or liability are recorded as either a charge or credit to current earnings during the period in which the changes occurred. The fair
value of the swaps is recorded as both an asset and a liability, in other assets and other liabilities on the Company's consolidated statement of financial condition, respectively, in equal amounts for these transactions.
At December 31, 2019, the aggregate amortizing notional value of interest rate swaps with various commercial borrowers
was $30.9 million. The Company receives fixed rates and pays floating rates based upon LIBOR on the swaps with commercial borrowers. These interest rate swaps mature in December 2029. Commercial borrower swaps are completed independently with each
borrower and are not subject to master netting arrangements. These commercial borrower swaps were reported as a component of other assets on the Company's consolidated statement of financial condition of $680,000. As of December 31, 2019, no interest
rate swaps were in default.
At December 31, 2019, the aggregate amortizing notional value of interest rate swaps with dealer counterparties was also
$30.9 million. The Company pays fixed rates and receives floating rates based upon LIBOR on the swaps with dealer counterparties. These interest rate swaps mature in December 2029. Dealer counterparty swaps are subject to master netting agreements
among the contracts within our Bank and are reported as a component of other liabilities on the Company's consolidated statement of financial condition of $680,000. No right of offset existed with dealer counterparty swaps as of December 31, 2019.
All changes in the fair value of these instruments are recorded in other non-interest income. The Company pledged
$710,000 in cash to secure its obligation under these contracts at December 31, 2019.
There were no loan interest rate swaps as of December 31, 2018.
- 87 -
| 16) |
Fair Value Measurements
|
ASC Topic 820, “Fair Value Measurements and Disclosures” defines fair value, establishes a framework for measuring fair
value, and expands disclosures about fair value measurements. This accounting standard applies to reported balances that are required or permitted to be measured at fair value under existing accounting pronouncements. The standard also emphasizes
that fair value (i.e., the price that would be received in an orderly transaction that is not a forced liquidation or distressed sale at the measurement date), among other things, is based on exit price versus entry price, should include assumptions
about risk such as nonperformance risk in liability fair values, and is a market-based measurement, not an entity-specific measurement. When considering the assumptions that market participants would use in pricing the asset or liability, this
accounting standard establishes a fair value hierarchy that distinguishes between market participant assumptions based on market data obtained from sources independent of the reporting entity (observable inputs that are classified within Levels 1 and
2 of the hierarchy) and the reporting entity’s own assumptions about market participant assumptions (unobservable inputs classified within Level 3 of the hierarchy).
The fair value hierarchy prioritizes inputs used to measure fair value into three broad levels.
Level 1 inputs -
In general, fair values determined by Level 1 inputs use quoted prices in active markets for identical assets or liabilities that we have the ability to access.
Level 2 inputs -
Fair values determined by Level 2 inputs use inputs other than quoted prices included in Level 1 inputs that are observable for the asset or liability, either directly or indirectly. Level 2 inputs include quoted prices for similar assets and
liabilities in active markets, quoted prices for identical or similar assets or liabilities in markets where there are few transactions and inputs other than quoted prices that are observable for the asset or liability, such as interest rates and
yield curves that are observable at commonly quoted intervals.
Level 3 inputs -
Level 3 inputs are unobservable inputs for the asset or liability and include situations where there is little, if any, market activity for the asset or liability.
In instances where the determination of the fair value measurement is based on inputs from different levels of the fair
value hierarchy, the level in the fair value hierarchy within which the entire fair value measurement falls is based on the lowest level input that is significant to the fair value measurement in its entirety. The Company’s assessment of the
significance of a particular input to the fair value measurement in its entirety requires judgment, and considers factors specific to the asset or liability.
The following table presents information about our assets and liabilities recorded in our consolidated statement of
financial position at their fair value on a recurring basis as of December 31, 2019 and December 31, 2018, and indicates the fair value hierarchy of the valuation techniques utilized to determine such fair value.
|
|
Fair Value Measurements Using
|
|||||||||||||||
|
|
December 31, 2019
|
Level 1
|
Level 2
|
Level 3
|
||||||||||||
|
|
(In Thousands)
|
|||||||||||||||
|
Assets
|
||||||||||||||||
|
Available for sale securities
|
||||||||||||||||
|
Mortgage-backed securities
|
$
|
34,150
|
-
|
34,150
|
-
|
|||||||||||
|
Collateralized mortgage obligations
|
||||||||||||||||
|
Government sponsored enterprise issued
|
81,754
|
-
|
81,754
|
-
|
||||||||||||
|
Municipal securities
|
53,692
|
-
|
53,692
|
-
|
||||||||||||
|
Other debt securities
|
8,880
|
-
|
8,880
|
-
|
||||||||||||
|
Loans held for sale
|
220,123
|
-
|
220,123
|
-
|
||||||||||||
|
Mortgage banking derivative assets
|
1,835
|
-
|
-
|
1,835
|
||||||||||||
|
Interest rate swap assets
|
680
|
-
|
680
|
-
|
||||||||||||
|
Liabilities
|
||||||||||||||||
|
Mortgage banking derivative liabilities
|
-
|
-
|
-
|
-
|
||||||||||||
|
Interest rate swap liabilities
|
680
|
-
|
680
|
-
|
||||||||||||
|
|
||||||||||||||||
|
|
Fair Value Measurements Using
|
|||||||||||||||
|
|
December 31, 2018
|
Level 1
|
Level 2
|
Level 3
|
||||||||||||
|
|
(In Thousands)
|
|||||||||||||||
|
Assets
|
||||||||||||||||
|
Available for sale securities
|
||||||||||||||||
|
Mortgage-backed securities
|
$
|
41,631
|
-
|
41,631
|
-
|
|||||||||||
|
Collateralized mortgage obligations
|
||||||||||||||||
|
Government sponsored enterprise issued
|
74,955
|
-
|
74,955
|
-
|
||||||||||||
|
Municipal securities
|
55,948
|
-
|
55,948
|
-
|
||||||||||||
|
Other debt securities
|
13,186
|
-
|
13,186
|
-
|
||||||||||||
|
Loans held for sale
|
141,616
|
-
|
141,616
|
-
|
||||||||||||
|
Mortgage banking derivative assets
|
2,014
|
-
|
-
|
2,014
|
||||||||||||
|
Liabilities
|
||||||||||||||||
|
Mortgage banking derivative liabilities
|
1,116
|
-
|
-
|
1,116
|
||||||||||||
- 88 -
The following summarizes the valuation techniques for assets and liabilities recorded in our consolidated statements of
financial condition at their fair value on a recurring basis:
Available for sale securities – The Company's investment securities classified as available for sale include:
mortgage-backed securities, collateralized mortgage obligations, government sponsored enterprise bonds, municipal securities and other debt securities. The fair value of mortgage-backed securities, collateralized mortgage obligations and government
sponsored enterprise bonds are determined by a third party valuation source using observable market data utilizing a matrix or multi-dimensional relational pricing model. Standard inputs to these models include observable market data such as
benchmark yields, reported trades, broker quotes, issuer spreads, benchmark securities, prepayment models and bid/offer market data. For securities with an early redemption feature, an option adjusted spread model is utilized to adjust the issuer
spread. These model and matrix measurements are classified as Level 2 in the fair value hierarchy. The fair value of municipal and other debt securities is determined by a third party valuation source using observable market data utilizing a
multi-dimensional relational pricing model. Standard inputs to this model include observable market data such as benchmark yields, reported trades, broker quotes, rating updates and issuer spreads. These model measurements are classified as Level 2
in the fair value hierarchy. The change in fair value is recorded through an adjustment to the statement of comprehensive income.
Loans held for sale – The Company carries loans held for sale at fair value under the fair value option model. Fair
value is generally determined by estimating a gross premium or discount, which is derived from pricing currently observable in the secondary market, principally from observable prices for forward sale commitments. Loans held-for-sale are considered
to be Level 2 in the fair value hierarchy of valuation techniques. The change in fair value is recorded through an adjustment to the statement of operations.
Mortgage banking derivatives - Mortgage banking derivatives include interest rate lock commitments to originate
residential loans held for sale to individual customers and forward commitments to sell residential mortgage loans to various investors. The Company utilizes a valuation model to estimate the fair value of its interest rate lock commitments to
originate residential mortgage loans held for sale, which includes applying a pull through rate based upon historical experience and the current interest rate environment and then multiplying by quoted investor prices. The Company also utilizes a
valuation model to estimate the fair value of its forward commitments to sell residential loans, which includes matching specific terms and maturities of the forward commitments against applicable investor pricing available. While there are Level 2
and 3 inputs used in the valuation models, the Company has determined that one or more of the inputs significant in the valuation of both of the mortgage banking derivatives fall within Level 3 of the fair value hierarchy. The change in fair value is
recorded through an adjustment to the statement of operations, within mortgage banking income.
Interest rate swap assets/liabilities - The Company offers loan level swaps to its customers and offsets its exposure
from such contracts by entering into mirror image swaps with a financial institution / swap counterparty. The fair values of derivatives are based on valuation models using observable market data as of the measurement date. Our derivatives are
traded in an over-the-counter market where quoted market prices are not always available. Therefore, the fair values of derivatives are determined using quantitative models that utilize multiple market inputs. The inputs will vary based on the type
of derivative, but could include interest rates, prices and indices to generate continuous yield or pricing curves, prepayment rates, and volatility factors to value the position. The majority of market inputs are actively quoted and can be
validated through external sources, including brokers, market transactions and third-party pricing services. Interest rate swap assets and liabilities are considered to be Level 2 in the fair value hierarchy of valuation techniques. The change in
fair value is recorded through an adjustment to the statement of operations, within other income and other expense.
The table below presents reconciliation for all assets measured at fair value on a recurring basis using significant
unobservable inputs (Level 3) during 2019 and 2018.
|
|
Mortgage banking
derivatives, net
|
|||
|
|
||||
|
Balance at December 31, 2017
|
$
|
2,004
|
||
|
|
||||
|
Transfer into level 3
|
-
|
|||
|
Mortgage derivative loss, net
|
(1,106
|
)
|
||
|
Balance at December 31, 2018
|
898
|
|||
|
|
||||
|
Transfer into level 3
|
-
|
|||
|
Mortgage derivative gain, net
|
937
|
|||
|
Balance at December 31, 2019
|
$
|
1,835
|
||
- 89 -
Assets Recorded at Fair Value on a Non-recurring Basis
The following table presents information about our assets recorded in our consolidated statement of financial position
at their fair value on a non-recurring basis as of December 31, 2019 and December 31, 2018, and indicates the fair value hierarchy of the valuation techniques utilized to determine such fair value.
|
|
Fair Value Measurements Using
|
|||||||||||||||
|
|
December 31, 2019
|
Level 1
|
Level 2
|
Level 3
|
||||||||||||
|
|
(In Thousands)
|
|||||||||||||||
|
Impaired loans, net (1)
|
$
|
185
|
-
|
-
|
185
|
|||||||||||
|
Real estate owned
|
748
|
-
|
-
|
748
|
||||||||||||
|
Impaired mortgage servicing rights
|
206
|
-
|
-
|
206
|
||||||||||||
|
|
||||||||||||||||
|
|
Fair Value Measurements Using
|
|||||||||||||||
|
|
December 31, 2018
|
Level 1
|
Level 2
|
Level 3
|
||||||||||||
|
|
(In Thousands)
|
|||||||||||||||
|
Impaired loans, net (1)
|
$
|
2,876
|
-
|
-
|
2,876
|
|||||||||||
|
Real estate owned
|
2,152
|
-
|
-
|
2,152
|
||||||||||||
_________
(1) Represents collateral-dependent impaired loans, net, which are included in loans.
Loans – We do not record loans at fair value on a recurring basis. On a non-recurring basis, loans determined to be
impaired are analyzed to determine whether a collateral shortfall exists, and if such a shortfall exists, are recorded on our consolidated statements of financial condition at net realizable value of the underlying collateral. Fair value is
determined based on third party appraisals. Appraised values are adjusted to consider disposition costs and also to take into consideration the age of the most recent appraisal. Given the significance of the adjustments made to appraised values
necessary to estimate the fair value of impaired loans, loans that have been deemed to be impaired are considered to be Level 3 in the fair value hierarchy of valuation techniques. At December 31, 2019, loans determined to be impaired with an
outstanding balance of $224,000 were carried net of specific reserves of $39,000 for a fair value of $185,000. At December 31, 2018, loans determined to be impaired with an outstanding balance of $3.1 million were carried net of specific reserves of
$186,000 for a fair value of $2.9 million. Impaired loans collateralized by assets which are valued in excess of the net investment in the loan do not require any specific reserves.
Real estate owned – On a non-recurring basis, real estate owned, is recorded in our consolidated statements of
financial condition at the lower of cost or fair value. Fair value is determined based on third party appraisals and, if less than the carrying value of the foreclosed loan, the carrying value of the real estate owned is adjusted to the fair
value. Appraised values are adjusted to consider disposition costs and also to take into consideration the age of the most recent appraisal. Given the significance of the adjustments made to appraised values necessary to estimate the fair value of
the properties, real estate owned is considered to be Level 3 in the fair value hierarchy of valuation techniques. There were no changes in the fair value of real estate owned for the year ended December 31, 2019. Changes in the fair value of real
estate owned was $309,000 for the year ended December 31, 2018 and are recorded in real estate owned expense. At December 31, 2019 and December 31, 2018, real estate owned totaled $748,000 and $2.2 million, respectively.
Mortgage servicing rights - The Company utilizes an independent valuation from a third party which uses a
discounted cash flow model to estimate the fair value of mortgage servicing rights. The model utilizes prepayment assumptions to project cash flows related to the mortgage servicing rights based upon the current interest rate environment, which is
then discounted to estimate an expected fair value of the mortgage servicing rights. The model considers characteristics specific to the underlying mortgage portfolio, such as: contractually specified servicing fees, prepayment assumptions,
delinquency rates, late charges and costs to service. Given the significance of the unobservable inputs utilized in the estimation process, mortgage servicing rights are classified as Level 3 within the fair value hierarchy. The Company records
the mortgage servicing rights at the lower of amortized cost or fair value. For the purpose of measuring impairment, mortgage servicing rights are stratified based upon predominant risk characteristics of the underlying loans. At December 31,
2019, there was $77,000 of impairment on mortgage servicing rights. At December 31, 2018, there was no impairment identified for mortgage servicing rights.
For Level 3 assets and liabilities measured at fair value on a non-recurring basis, the significant unobservable inputs
used in the fair value measurements were as follows:
|
|
Fair Value at
|
Significant
|
Significant Unobservable Input Value
|
|||||||||||
|
|
December 31, 2019
|
Valuation
Technique
|
Unobservable
Inputs
|
Minimum
Value
|
Maximum
Value
|
|||||||||
|
Mortgage banking derivatives
|
1,835,000
|
Pricing models
|
Pull through rate
|
24.8
|
%
|
100.0
|
%
|
|||||||
|
Impaired loans
|
185,000
|
Market approach
|
Discount rates applied to appraisals
|
15.0
|
%
|
15.0
|
%
|
|||||||
|
Real estate owned
|
748,000
|
Market approach
|
Discount rates applied to appraisals
|
36.1
|
%
|
65.2
|
%
|
|||||||
|
Mortgage servicing rights
|
282,000
|
Pricing models
|
Prepayment rate
|
12.8
|
%
|
30.0
|
%
|
|||||||
|
Discount rate
|
11.0
|
%
|
12.1
|
%
|
||||||||||
|
Cost to service
|
$
|
82.00
|
$
|
247.00
|
||||||||||
- 90 -
A description of the valuation methodologies used for instruments measured at fair value, as well as the general
classification of such instruments pursuant to the valuation hierarchy, is set forth below.
Fair value information about financial instruments follows, whether or not recognized in the consolidated statements of
financial condition, for which it is practicable to estimate that value. In cases where quoted market prices are not available, fair values are based on estimates using present value or other valuation techniques. Those techniques are significantly
affected by the assumptions used, including the discount rate and estimates of future cash flows. In that regard, the derived fair value estimates cannot be substantiated by comparison to independent markets and, in many cases, could not be realized
in immediate settlement of the instrument. Certain financial instruments and all nonfinancial instruments are excluded from its disclosure requirements. Accordingly, the aggregate fair value amounts presented do not represent the underlying value of
the Company.
The carrying amounts and fair values of the Company’s financial instruments consist of the following at December 31,
2019 and December 31, 2018:
|
|
December 31, 2019
|
December 31, 2018
|
||||||||||||||||||||||||||||||||||||||
|
|
Carrying amount
|
Fair Value
|
Carrying amount
|
Fair Value
|
||||||||||||||||||||||||||||||||||||
|
|
Total
|
Level 1
|
Level 2
|
Level 3
|
Total
|
Level 1
|
Level 2
|
Level 3
|
||||||||||||||||||||||||||||||||
|
|
(In Thousands)
|
|||||||||||||||||||||||||||||||||||||||
|
Financial Assets
|
||||||||||||||||||||||||||||||||||||||||
|
Cash and cash equivalents
|
$
|
74,300
|
74,300
|
65,800
|
8,500
|
-
|
86,101
|
86,101
|
73,601
|
12,500
|
-
|
|||||||||||||||||||||||||||||
|
Securities available-for-sale
|
178,476
|
178,476
|
-
|
178,476
|
-
|
185,720
|
185,720
|
-
|
185,720
|
-
|
||||||||||||||||||||||||||||||
|
Loans held for sale
|
220,123
|
220,123
|
-
|
220,123
|
-
|
141,616
|
141,616
|
-
|
141,616
|
-
|
||||||||||||||||||||||||||||||
|
Loans receivable
|
1,388,031
|
1,426,224
|
-
|
-
|
1,426,224
|
1,379,148
|
1,311,633
|
-
|
-
|
1,311,633
|
||||||||||||||||||||||||||||||
|
FHLB stock
|
21,150
|
21,150
|
-
|
21,150
|
-
|
19,350
|
19,350
|
-
|
19,350
|
-
|
||||||||||||||||||||||||||||||
|
Accrued interest receivable
|
5,344
|
5,344
|
5,344
|
-
|
-
|
5,337
|
5,337
|
5,337
|
-
|
-
|
||||||||||||||||||||||||||||||
|
Mortgage servicing rights
|
282
|
282
|
-
|
-
|
282
|
109
|
109
|
-
|
-
|
109
|
||||||||||||||||||||||||||||||
|
Mortgage banking derivative assets
|
1,835
|
1,835
|
-
|
-
|
1,835
|
2,014
|
2,014
|
-
|
-
|
2,014
|
||||||||||||||||||||||||||||||
|
Interest rate swap assets
|
680
|
680
|
-
|
680
|
-
|
-
|
-
|
-
|
-
|
-
|
||||||||||||||||||||||||||||||
|
|
||||||||||||||||||||||||||||||||||||||||
|
Financial Liabilities
|
||||||||||||||||||||||||||||||||||||||||
|
Deposits
|
1,067,776
|
1,070,083
|
328,005
|
742,078
|
-
|
1,038,495
|
1,038,544
|
302,622
|
735,922
|
-
|
||||||||||||||||||||||||||||||
|
Advance payments by borrowers for taxes
|
4,212
|
4,212
|
4,212
|
-
|
-
|
4,371
|
4,371
|
4,371
|
-
|
-
|
||||||||||||||||||||||||||||||
|
Borrowings
|
483,562
|
483,846
|
-
|
483,846
|
-
|
435,046
|
432,269
|
-
|
432,269
|
-
|
||||||||||||||||||||||||||||||
|
Accrued interest payable
|
1,559
|
1,559
|
1,559
|
-
|
-
|
1,395
|
1,395
|
1,395
|
-
|
-
|
||||||||||||||||||||||||||||||
|
Mortgage banking derivative liabilities
|
-
|
-
|
-
|
-
|
-
|
1,116
|
1,116
|
-
|
-
|
1,116
|
||||||||||||||||||||||||||||||
|
Interest rate swap liabilities
|
680
|
680
|
-
|
680
|
-
|
-
|
-
|
-
|
-
|
-
|
||||||||||||||||||||||||||||||
|
|
||||||||||||||||||||||||||||||||||||||||
The following methods and assumptions were used by the Company in determining its fair value disclosures for financial
instruments.
Cash and Cash Equivalents
The carrying amount reported in the consolidated statements of financial condition for cash and cash equivalents is a
reasonable estimate of fair value. The commercial paper instruments with a maturity of less than 90 days also approximates its fair value with its carrying value.
Securities
The fair value of securities is determined by a third party valuation source using observable market data utilizing a
matrix or multi-dimensional relational pricing model. Standard inputs to these models include observable market data such as benchmark yields, reported trades, broker quotes, issuer spreads, benchmark securities and bid/offer market data. For
securities with an early redemption feature, an option adjusted spread model is utilized to adjust the issuer spread. Prepayment models are used for mortgage related securities with prepayment features.
- 91 -
Loans Held for Sale
Fair value is estimated using the prices of the Company’s existing commitments to sell such loans and/or the quoted
market price for commitments to sell similar loans.
Loans Receivable
The fair value estimation process for the loan portfolio uses an exit price concept and reflects discounts the Company
believes are consistent with discounts in the market place. Fair values are estimated for portfolios of loans with similar characteristics. Loans are segregated by type such as one- to four-family, multi-family, home equity, construction and land,
commercial real estate, commercial, and other consumer. The fair value of loans is estimated by discounting the future cash flows using the current rates at which similar loans would be made to borrowers with similar credit ratings and for similar
maturities. The fair value analysis also includes other assumptions to estimate fair value, intended to approximate those a market participant would use in an orderly transaction, with adjustments for discount rates, interest rates, liquidity, and
credit spreads, as appropriate.
FHLB Stock
For FHLB stock, the carrying amount is the amount at which shares can be redeemed with the FHLB and is a reasonable
estimate of fair value.
Deposits and Advance Payments by Borrowers for Taxes
The fair values for interest-bearing and noninterest-bearing negotiable order of withdrawal accounts, savings accounts,
and money market accounts are, by definition, equal to the amount payable on demand at the reporting date (i.e., their carrying amounts). The fair values for fixed-rate certificates of deposit are estimated using a discounted cash flow calculation
that applies interest rates currently being offered on certificates of similar remaining maturities to a schedule of aggregated expected monthly maturities of the outstanding certificates of deposit. The advance payments by borrowers for taxes are
equal to their carrying amounts at the reporting date.
Borrowings
Fair values for borrowings are estimated using a discounted cash flow calculation that applies current interest rates to
estimated future cash flows of the borrowings.
Accrued Interest Payable and Accrued Interest Receivable
For accrued interest payable and accrued interest receivable, the carrying amount is a reasonable estimate of fair
value.
Commitments to Extend Credit and Standby Letters of Credit
Commitments to extend credit and standby letters of credit are generally not marketable. Furthermore, interest rates on
any amounts drawn under such commitments would be generally established at market rates at the time of the draw. Fair values for the Company's commitments to extend credit and standby letters of credit are based on fees currently charged to enter
into similar agreements, taking into account the remaining terms of the agreements, the counterparty's credit standing, and discounted cash flow analyses. The fair value of the Company's commitments to extend credit was not material at December 31,
2019 and December 31, 2018.
Mortgage Banking Derivative Assets and Liabilities
Mortgage banking derivatives include interest rate lock commitments to originate residential loans held for sale to
individual customers and forward commitments to sell residential mortgage loans to various investors. The Company relies on a valuation model to estimate the fair value of its interest rate lock commitments to originate residential mortgage loans
held for sale, which includes applying a pull through rate based upon historical experience and the current interest rate environment, and then multiplying by quoted investor prices. The Company also relies on a valuation model to estimate the fair
value of its forward commitments to sell residential loans, which includes matching specific terms and maturities of the forward commitments against applicable investor pricing available. On the Company's Consolidated Statements of Condition,
instruments that have a positive fair value are included in prepaid expenses and other assets, and those instruments that have a negative fair value are included in other liabilities.
Interest Rate Swap Assets and Liabilities
The carrying value and fair value of existing derivative financial instruments are based upon independent valuation
models, which use widely accepted valuation techniques, including discounted cash flow analysis on the expected cash flows of each derivative contract. This analysis reflects the contractual terms of the derivatives, including the period to maturity,
and uses observable market-based inputs, including interest rate curves and implied volatilities.
- 92 -
| 17) |
Earnings Per Share
|
Earnings per share are computed using the two-class method. Basic earnings per share is computed by dividing net income
allocated to common shares by the weighted average number of common shares outstanding during the applicable period. Diluted earnings per share is computed by dividing net income by the weighted average number of common shares outstanding adjusted
for the dilutive effect of all potential common shares.
Presented below are the calculations for basic and diluted earnings per share:
|
|
For the year ended December 31,
|
|||||||||||
|
|
2019
|
2018
|
2017
|
|||||||||
|
|
(In Thousands, except per share amounts)
|
|||||||||||
|
Net income
|
$
|
35,903
|
30,754
|
25,964
|
||||||||
|
|
||||||||||||
|
Weighted average shares outstanding
|
26,021
|
27,363
|
27,467
|
|||||||||
|
Effect of dilutive potential common shares
|
226
|
271
|
432
|
|||||||||
|
Diluted weighted average shares outstanding
|
26,247
|
27,634
|
27,899
|
|||||||||
|
|
||||||||||||
|
Basic income per share
|
$
|
1.38
|
1.12
|
0.95
|
||||||||
|
Diluted income per share
|
$
|
1.37
|
1.11
|
0.93
|
||||||||
- 93 -
| 18) |
Condensed Parent Company Only Statements
|
Statements of Financial Condition
|
|
December 31,
|
|||||||
|
|
2019
|
2018
|
||||||
|
|
(In Thousands)
|
|||||||
|
Assets
|
||||||||
|
Cash and cash equivalents
|
$
|
54,730
|
20,116
|
|||||
|
Investment in subsidiaries
|
342,295
|
380,897
|
||||||
|
Other assets
|
187
|
2,476
|
||||||
|
Total Assets
|
$
|
397,212
|
403,489
|
|||||
|
|
||||||||
|
Liabilities and shareholders' equity
|
||||||||
|
Liabilities:
|
||||||||
|
Other liabilities
|
$
|
3,526
|
3,810
|
|||||
|
Shareholders' equity
|
||||||||
|
Preferred Stock (par value $.01 per share), Authorized - 50,000,000 shares in 2019 and 2018, no
shares issued
|
-
|
-
|
||||||
|
Common stock (par value $.01 per share), Authorized - 100,000,000 shares in 2019 and in 2018,
Issued - 27,148,411 in 2019 and 28,463,239 in 2018, Outstanding - 27,148,411 in 2019 and 28,463,239 in 2018
|
271
|
285
|
||||||
|
Additional paid-in-capital
|
211,997
|
232,406
|
||||||
|
Retained earnings
|
197,393
|
187,153
|
||||||
|
Unearned ESOP shares
|
(16,617
|
)
|
(17,804
|
)
|
||||
|
Accumulated other comprehensive gain (loss) (net of taxes)
|
642
|
(2,361
|
)
|
|||||
|
Total shareholders' equity
|
393,686
|
399,679
|
||||||
|
Total liabilities and shareholders' equity
|
$
|
397,212
|
403,489
|
|||||
Statements of Operations
|
|
For the year ended December 31,
|
|||||||||||
|
|
2019
|
2018
|
2017
|
|||||||||
|
|
(In Thousands)
|
|||||||||||
|
|
||||||||||||
|
Interest income
|
$
|
793
|
656
|
675
|
||||||||
|
Equity in income of subsidiaries (distributed and undistributed)
|
35,784
|
30,722
|
25,937
|
|||||||||
|
Total income
|
36,577
|
31,378
|
26,612
|
|||||||||
|
|
||||||||||||
|
Professional fees
|
58
|
37
|
57
|
|||||||||
|
Other expense
|
577
|
577
|
575
|
|||||||||
|
Total expense
|
635
|
614
|
632
|
|||||||||
|
|
||||||||||||
|
Income before income tax expense
|
35,942
|
30,764
|
25,980
|
|||||||||
|
|
||||||||||||
|
Income tax expense
|
39
|
10
|
16
|
|||||||||
|
Net income
|
$
|
35,903
|
30,754
|
25,964
|
||||||||
- 94 -
Statements of Cash Flows
|
|
For the year ended December 31,
|
|||||||||||
|
|
2019
|
2018
|
2017
|
|||||||||
|
|
(In Thousands)
|
|||||||||||
|
Cash flows from operating activities
|
||||||||||||
|
Net income
|
$
|
35,903
|
30,754
|
25,964
|
||||||||
|
Adjustments to reconcile net income to net cash provided by (used in) operating activities:
|
||||||||||||
|
Amortization of unearned ESOP
|
1,805
|
1,796
|
1,956
|
|||||||||
|
Stock based compensation
|
1,067
|
1,760
|
1,902
|
|||||||||
|
Deferred income taxes
|
-
|
-
|
(58
|
)
|
||||||||
|
Equity in earnings of subsidiaries
|
(35,784
|
)
|
(30,722
|
)
|
(25,937
|
)
|
||||||
|
Change in other assets and liabilities
|
1,235
|
(4,019
|
)
|
530
|
||||||||
|
Net cash provided by (used in) operating activities
|
4,226
|
(431
|
)
|
4,357
|
||||||||
|
|
||||||||||||
|
Net cash used in investing activities
|
-
|
-
|
-
|
|||||||||
|
Dividends received from subsidiary
|
78,456
|
36,535
|
14,698
|
|||||||||
|
Cash dividends on common stock
|
(25,960
|
)
|
(27,050
|
)
|
(26,952
|
)
|
||||||
|
Proceeds from stock option exercises
|
659
|
1,304
|
1,052
|
|||||||||
|
Purchase of common stock returned to authorized but unissued
|
(22,767
|
)
|
(19,196
|
)
|
(2,190
|
)
|
||||||
|
Net cash provided by (used in) financing activities
|
30,388
|
(8,407
|
)
|
(13,392
|
)
|
|||||||
|
Net increase (decrease) in cash
|
34,614
|
(8,838
|
)
|
(9,035
|
)
|
|||||||
|
Cash and cash equivalents at beginning of year
|
20,116
|
28,954
|
37,989
|
|||||||||
|
Cash and cash equivalents at end of year
|
$
|
54,730
|
20,116
|
28,954
|
||||||||
| 19) |
Segment Reporting
|
Selected financial and descriptive information is required to be provided about reportable operating segments,
considering a "management approach" concept as the basis for identifying reportable segments. The management approach is based on the way that management organizes the segments within the enterprise for making operating decisions, allocating
resources, and assessing performance. Consequently, the segments are evident from the structure of the enterprise's internal organization, focusing on financial information that an enterprise's chief operating decision-makers use to make decisions
about the enterprise's operating matters.
The Company has determined that it has two reportable segments: community banking and mortgage banking. The Company's
operating segments are presented based on its management structure and management accounting practices. The structure and practices are specific to the Company and therefore, the financial results of the Company's business segments are not
necessarily comparable with similar information for other financial institutions.
Community Banking
The Community Banking segment provides consumer and business banking products and services to customers primarily within
Southeastern Wisconsin along with a loan production office in Minneapolis, Minnesota. Within this segment, the following products and services are provided: (1) lending solutions such as residential mortgages, home equity loans and lines of credit,
personal and installment loans, real estate financing, business loans, and business lines of credit; (2) deposit and transactional solutions such as checking, credit, debit and pre-paid cards, online banking and bill pay, and money transfer services;
(3) investable funds solutions such as savings, money market deposit accounts, IRA accounts, certificates of deposit, and (4) fixed and variable annuities, insurance as well as trust and investment management accounts.
- 95 -
Consumer products include loan and deposit products: mortgage, home equity loans and lines, personal term loans, demand
deposit accounts, interest bearing transaction accounts and time deposits. Consumer products also include personal investment services. Business banking products include secured and unsecured lines and term loans for working capital, inventory and
general corporate use, commercial real estate construction loans, demand deposit accounts, interest bearing transaction accounts and time deposits.
Mortgage Banking
The Mortgage Banking segment provides residential mortgage loans for the primary purpose of sale in the secondary
market. Mortgage banking products and services are provided by offices in 24 states with the ability to lend in 48 states.
|
|
As of or for the Year ended December 31, 2019
|
|||||||||||||||
|
|
Community
Banking
|
Mortgage
Banking
|
Holding
Company and
Other
|
Consolidated
|
||||||||||||
|
|
(in thousands)
|
|||||||||||||||
|
Net interest income (loss)
|
$
|
54,019
|
(1,910
|
)
|
88
|
52,197
|
||||||||||
|
Provision (credit) for loan losses
|
(1,050
|
)
|
150
|
-
|
(900
|
)
|
||||||||||
|
Net interest income (loss) after provision for loan losses
|
55,069
|
(2,060
|
)
|
88
|
53,097
|
|||||||||||
|
|
||||||||||||||||
|
Noninterest income
|
5,020
|
126,910
|
(1,180
|
)
|
130,750
|
|||||||||||
|
|
||||||||||||||||
|
Noninterest expenses:
|
||||||||||||||||
|
Compensation, payroll taxes, and other employee benefits
|
18,195
|
84,230
|
(707
|
)
|
101,718
|
|||||||||||
|
Occupancy, office furniture, and equipment
|
3,752
|
6,854
|
-
|
10,606
|
||||||||||||
|
Advertising
|
920
|
2,965
|
-
|
3,885
|
||||||||||||
|
Data processing
|
2,121
|
1,493
|
16
|
3,630
|
||||||||||||
|
Communications
|
358
|
1,001
|
-
|
1,359
|
||||||||||||
|
Professional fees
|
813
|
2,734
|
58
|
3,605
|
||||||||||||
|
Real estate owned
|
(176
|
)
|
30
|
-
|
(146
|
)
|
||||||||||
|
Loan processing expense
|
-
|
3,288
|
-
|
3,288
|
||||||||||||
|
Other
|
2,205
|
6,741
|
(618
|
)
|
8,328
|
|||||||||||
|
Total noninterest expenses
|
28,188
|
109,336
|
(1,251
|
)
|
136,273
|
|||||||||||
|
Income before income taxes
|
31,901
|
15,514
|
159
|
47,574
|
||||||||||||
|
Income taxes
|
7,296
|
4,336
|
39
|
11,671
|
||||||||||||
|
Net income
|
$
|
24,605
|
11,178
|
120
|
35,903
|
|||||||||||
|
|
||||||||||||||||
|
Total Assets
|
$
|
1,955,999
|
258,928
|
(218,580
|
)
|
1,996,347
|
||||||||||
- 96 -
|
|
As of or for the Year ended December 31, 2018
|
|||||||||||||||
|
|
Community
Banking
|
Mortgage
Banking
|
Holding
Company and
Other
|
Consolidated
|
||||||||||||
|
|
(in thousands)
|
|||||||||||||||
|
Net interest income
|
$
|
54,946
|
(850
|
)
|
81
|
54,177
|
||||||||||
|
Provision (credit) for loan losses
|
(1,150
|
)
|
90
|
-
|
(1,060
|
)
|
||||||||||
|
Net interest income (loss) after provision for loan losses
|
56,096
|
(940
|
)
|
81
|
55,237
|
|||||||||||
|
|
||||||||||||||||
|
Noninterest income
|
4,299
|
115,429
|
(1,529
|
)
|
118,199
|
|||||||||||
|
|
||||||||||||||||
|
Noninterest expenses:
|
||||||||||||||||
|
Compensation, payroll taxes, and other employee benefits
|
18,385
|
79,982
|
(583
|
)
|
97,784
|
|||||||||||
|
Occupancy, office furniture and equipment
|
3,307
|
7,548
|
-
|
10,855
|
||||||||||||
|
Advertising
|
749
|
3,374
|
-
|
4,123
|
||||||||||||
|
Data processing
|
1,671
|
1,105
|
16
|
2,792
|
||||||||||||
|
Communications
|
425
|
1,186
|
-
|
1,611
|
||||||||||||
|
Professional fees
|
967
|
1,343
|
17
|
2,327
|
||||||||||||
|
Real estate owned
|
1
|
-
|
-
|
1
|
||||||||||||
|
Loan processing expense
|
-
|
3,372
|
-
|
3,372
|
||||||||||||
|
Other
|
2,715
|
8,522
|
(946
|
)
|
10,291
|
|||||||||||
|
Total noninterest expenses
|
28,220
|
106,432
|
(1,496
|
)
|
133,156
|
|||||||||||
|
Income before income taxes
|
32,175
|
8,057
|
48
|
40,280
|
||||||||||||
|
Income taxes
|
7,273
|
2,243
|
10
|
9,526
|
||||||||||||
|
Net income
|
$
|
24,902
|
5,814
|
38
|
30,754
|
|||||||||||
|
|
||||||||||||||||
|
Total Assets
|
$
|
1,913,647
|
166,926
|
(165,192
|
)
|
1,915,381
|
||||||||||
- 97 -
|
|
As of or for the Year ended December 31, 2017
|
|||||||||||||||
|
|
Community
Banking
|
Mortgage
Banking
|
Holding
Company and
Other
|
Consolidated
|
||||||||||||
|
|
(in thousands)
|
|||||||||||||||
|
|
||||||||||||||||
|
Net interest income
|
$
|
50,608
|
(49
|
)
|
174
|
50,733
|
||||||||||
|
Provision (credit) for loan losses
|
(1,300
|
)
|
134
|
-
|
(1,166
|
)
|
||||||||||
|
Net interest income (loss) after provision for loan losses
|
51,908
|
(183
|
)
|
174
|
51,899
|
|||||||||||
|
|
||||||||||||||||
|
Noninterest income
|
3,942
|
122,091
|
(1,620
|
)
|
124,413
|
|||||||||||
|
|
||||||||||||||||
|
Noninterest expenses:
|
||||||||||||||||
|
Compensation, payroll taxes, and other employee benefits
|
17,495
|
80,077
|
(488
|
)
|
97,084
|
|||||||||||
|
Occupancy, office furniture and equipment
|
3,127
|
7,051
|
-
|
10,178
|
||||||||||||
|
Advertising
|
627
|
2,706
|
-
|
3,333
|
||||||||||||
|
Data processing
|
1,619
|
805
|
15
|
2,439
|
||||||||||||
|
Communications
|
408
|
1,152
|
-
|
1,560
|
||||||||||||
|
Professional fees
|
782
|
1,837
|
37
|
2,656
|
||||||||||||
|
Real estate owned
|
379
|
-
|
-
|
379
|
||||||||||||
|
Loan processing expense
|
-
|
3,062
|
-
|
3,062
|
||||||||||||
|
Other
|
2,828
|
9,400
|
(1,040
|
)
|
11,188
|
|||||||||||
|
Total noninterest expenses
|
27,265
|
106,090
|
(1,476
|
)
|
131,879
|
|||||||||||
|
Income before income taxes
|
28,585
|
15,818
|
30
|
44,433
|
||||||||||||
|
Income taxes
|
12,228
|
6,225
|
16
|
18,469
|
||||||||||||
|
Net income
|
$
|
16,357
|
9,593
|
14
|
25,964
|
|||||||||||
|
|
||||||||||||||||
|
Total Assets
|
$
|
1,834,191
|
173,237
|
(201,027
|
)
|
1,806,401
|
||||||||||
- 98 -
20) Business Combination
Academy Mortgage Corporation Branch
On June 29, 2018, Waterstone Mortgage Corporation, a subsidiary of WaterStone Bank SSB, completed an acquisition of a branch of Academy
Mortgage Corporation ("Academy"), a mortgage banking company in New Mexico. Waterstone Mortgage Corporation paid Academy approximately $600,000 in cash for the transaction.
Waterstone Mortgage Corporation's acquisition of the branch was accounted for as a business combination. Under the transaction, fixed
assets and a customer list were acquired and the branch leases were assumed. Under this method of accounting, assets acquired are recorded at their estimated fair values. Total consideration paid less the fair value of assets acquired was recorded as
goodwill. The Company recorded an insignificant amount of goodwill as a result of this acquisition.
| 21) |
Leases
|
The Company has entered into operating lease agreements for two of its community banking branch locations, all of its mortgage banking office locations,
and some of its office equipment. The leases have fixed terms defined regarding the payments and length. The Company elected not to include short-term leases (i.e., leases with initial terms of twelve months or less), or equipment leases (deemed
immaterial) on the consolidated statements of financial condition. Some of the leases included options to extend the leases. These options are reviewed and factored into the length of the lease if the option is expected to be extended. Leases did
not contain an implicit rate; therefore, the Company used the incremental borrowing rates for the discount rate. There were no sale and leaseback transactions, leveraged leases, or lease transactions with related parties during the twelve months
ended December 31, 2019.
At December 31, 2019, the Company had lease liabilities totaling $8.9 million and right-of-use assets totaling $8.4 million related to these leases. Lease
liabilities and right-of-use assets are reflected in other liabilities and other assets, respectively, on the consolidated statements of financial condition.
The cost components of our operating leases were as follows for the year ended December 31, 2019:
|
Year ended December 31,
2019
|
||||
|
(In Thousands)
|
||||
|
Operating lease cost
|
$
|
2,988
|
||
|
Variable cost
|
822
|
|||
|
Short-term lease cost
|
965
|
|||
|
Total
|
$
|
4,775
|
||
At December 31, 2019, the Company had leases that had not yet commenced, but will create approximately $200,000 of additional lease liabilities and
right-of-use assets for the Company in the first quarter of 2020.
The table below summarizes other information related to our operating leases:
|
Year ended December 31, 2019
|
||||
|
(Dollars in Millions)
|
||||
|
Cash paid for amounts included in the measurement of lease liabilities
|
||||
|
Operating cash flows from operating leases
|
$
|
3.2
|
||
|
Initial recognition of right-of-use asset
|
11.4
|
|||
|
Initial recognition of lease liabilities
|
11.9
|
|||
|
Weighted average remaining lease term - operating leases, in years
|
3.11
|
|||
|
Weighted average discount rate - operating leases
|
5.9
|
%
|
||
- 99 -
As of December 31, 2019, lease liability information for the Company is summarized in the following table.
|
Maturity analysis
|
Operating leases
|
|||
|
(In Thousands)
|
||||
|
One year or less
|
$
|
3,222
|
||
|
More than one year through two years
|
2,490
|
|||
|
More than two years through three years
|
1,683
|
|||
|
More than three years through four years
|
1,259
|
|||
|
More than four years through five years
|
515
|
|||
|
More than five years
|
983
|
|||
|
Total lease payments
|
10,152
|
|||
|
Present value discount
|
(1,272
|
)
|
||
|
Lease liability
|
$
|
8,880
|
||
Disclosure Controls and Procedures: The Company's management,
with the participation of the Company's Chief Executive Officer and Chief Financial Officer, has evaluated the effectiveness of the Company's disclosure controls and procedures (as such term is defined in Rules 13a-15(e) and 15d-15(e) under the
Securities Exchange Act of 1934, as amended (the “Exchange Act”)) as of the end of the period covered by this report. Based on such evaluation, the Company's Chief Executive Officer and Chief Financial Officer have concluded that, as of the end of
such period, the Company's disclosure controls and procedures are effective in recording, processing, summarizing and reporting, on a timely basis, information required to be disclosed by the Company in the reports that it files or submits under the
Exchange Act.
Change in Internal Control Over
Financial Reporting: There have not been any changes in the Company's internal control over financial reporting (as such term is
defined in Rules 13a-15(f) and 15d-15(f) under the Exchange Act) during the final fiscal quarter of the period to which this report relates that have materially affected, or are reasonably likely to materially affect, the Company's internal control
over financial reporting.
- 100 -
Management’s Annual Report on Internal Control Over Financial Reporting
Management of the Company is responsible for establishing and maintaining adequate internal control over financial reporting. The Company’s
internal control over financial reporting is a process designed to provide reasonable assurance regarding the reliability of financial reporting and the preparation of the Company’s financial statements for external purposes in accordance with
generally accepted accounting principles. Internal control over financial reporting is defined in Rules 13a-15(f) and 15d-15(f) promulgated under the Exchange Act.
As of December 31, 2019, management assessed the effectiveness of the Company’s internal control over financial reporting based on criteria
for effective internal control over financial reporting established in “Internal Control—Integrated Framework,” issued by the Committee of Sponsoring Organization of the Treadway Commission (COSO) in 2013. Based on this assessment, management has
determined that the Company’s internal control over financial reporting as of December 31, 2019 is effective.
RSM US LLP, the independent registered public accounting firm that audited the consolidated financial statements of the Company included in
this Annual Report on Form 10-K, has issued a report on the effectiveness of the Company’s internal control over financial reporting as of December 31, 2019. The report, which expresses an unqualified opinion on the effectiveness of the Company’s
internal control over financial reporting as of December 31, 2019, is included below under the heading “Report of Independent Registered Public Accounting Firm.”
REPORT OF INDEPENDENT REGISTERED PUBLIC ACCOUNTING FIRM
To the Shareholders and the Board of Directors of Waterstone Financial, Inc.
Opinion on the Internal Control Over Financial Reporting
We have audited Waterstone Financial Inc. and Subsidiaries' (the Company) internal control over financial reporting as of December 31, 2019,
based on criteria established in Internal Control — Integrated Framework issued by the Committee of Sponsoring Organizations of the Treadway
Commission in 2013. In our opinion, the Company maintained, in all material respects, effective internal control over financial reporting as of December 31, 2019, based on criteria established in Internal Control — Integrated Framework issued by the Committee of Sponsoring Organizations of the Treadway Commission in 2013.
We have also audited, in accordance with the standards of the Public Company Accounting Oversight Board (United States) (PCAOB), the
consolidated financial statements of the Company and our report dated March 13, 2020 expressed an unqualified opinion.
Basis for Opinion
The Company’s management is responsible for maintaining effective internal control over financial reporting and for its assessment of the
effectiveness of internal control over financial reporting in the accompanying Management’s Annual Report on Internal Control over Financial Reporting. Our responsibility is to express an opinion on the Company’s internal control over financial
reporting based on our audit. We are a public accounting firm registered with the PCAOB and are required to be independent with respect to the Company in accordance with U.S. federal securities laws and the applicable rules and regulations of the
Securities and Exchange Commission and the PCAOB.
We conducted our audit in accordance with the standards of the PCAOB. Those standards require that we plan and perform the audit to obtain
reasonable assurance about whether effective internal control over financial reporting was maintained in all material respects. Our audit included obtaining an understanding of internal control over financial reporting, assessing the risk that a
material weakness exists, and testing and evaluating the design and operating effectiveness of internal control based on the assessed risk. Our audit also included performing such other procedures as we considered necessary in the circumstances. We
believe that our audit provides a reasonable basis for our opinion.
Definition and Limitations of Internal Control Over Financial Reporting
A company's internal control over financial reporting is a process designed to provide reasonable assurance regarding the reliability of
financial reporting and the preparation of financial statements for external purposes in accordance with generally accepted accounting principles. A company's internal control over financial reporting includes those policies and procedures that (1)
pertain to the maintenance of records that, in reasonable detail, accurately and fairly reflect the transactions and dispositions of the assets of the company; (2) provide reasonable assurance that transactions are recorded as necessary to permit
preparation of financial statements in accordance with generally accepted accounting principles, and that receipts and expenditures of the company are being made only in accordance with authorizations of management and directors of the company; and
(3) provide reasonable assurance regarding prevention or timely detection of unauthorized acquisition, use or disposition of the company's assets that could have a material effect on the financial statements.
Because of its inherent limitations, internal control over financial reporting may not prevent or detect misstatements. Also, projections of
any evaluation of effectiveness to future periods are subject to the risk that controls may become inadequate because of changes in conditions, or that the degree of compliance with the policies or procedures may deteriorate.
|
|
/s/ RSM US LLP
|
|
|
|
|
Chicago, Illinois
|
|
|
March 13, 2020
|
Part III
The information in the Company’s definitive Proxy Statement, prepared for the 2020 Annual Meeting of Shareholders, which
contains information concerning directors of the Company under the caption “Proposal 1 - Election of Directors” and compliance with Section 16 reporting requirements under the caption “Deliquent Section 16(a) Reports” continued below and information
concerning corporate governance under the caption “Other Board and Corporate Governance Matters” and "Board Meetings and Committees" in Part I hereof is incorporated herein by reference.
Executive Officers of the Registrant
The table below sets forth certain information regarding the persons who have been determined, by our board of
directors, to be executive officers of the Company. The executive officers of the Company are elected annually and hold office until their respective successors have been elected or until death, resignation, retirement or removal by the Board of
directors.
|
Name and Age
|
|
Offices and Positions with Waterstone Financial and Subsidiaries*
|
|
Executive
Officer
Since
|
|
Douglas S. Gordon, 62
|
|
Chief Executive Officer and President of Waterstone Financial and of WaterStone Bank
|
|
2005
|
|
William F. Bruss, 50
|
General Counsel, Executive Vice President and Secretary of Waterstone Financial and of WaterStone Bank
|
2005
|
||
|
Mark R. Gerke, 45
|
|
Chief Financial Officer and Vice President of Waterstone Financial and of WaterStone Bank
|
|
2016
|
|
Andy Peach, 54
|
|
Chief Executive Officer and President of Waterstone Mortgage Corporation
|
|
2019
|
|
Julie A. Glynn, 56
|
|
Senior Vice President and Director of Retail Banking of WaterStone Bank
|
|
2018
|
|
|
|
| * |
Excluding directorships and excluding positions with Bank subsidiary that do not constitute a substantial part of the officers’ duties.
|
The information in the Company’s definitive Proxy Statement, prepared for the 2020 Annual Meeting of Shareholders, which
contains information concerning this item under the captions “Executive Compensation,” “Director Compensation,” “Compensation Committee Interlocks and Insider Participation,” “Compensation Discussion and Analysis,” and “Compensation Committee Report”
is incorporated herein by reference.
Item
12. Security Ownership of Certain Beneficial Owners and Management and Related Stockholder Matters
The information in the Company’s definitive Proxy Statement, prepared for the 2020 Annual Meeting of Shareholders, which
contains information concerning this item under the caption “Beneficial Ownership of Common Stock” is incorporated herein by reference.
Compensation Plans
Set forth below is information as of December 31, 2019 regarding equity compensation plans that have been approved by
shareholders. The Company has no equity based benefit plans, other than its employee stock ownership plan, that were not approved by shareholders.
|
Plan
|
Number of shares to be issued upon exercise of outstanding options and rights
|
Weighted average option exercise price
|
Number of securities remaining available for issuance under plan
|
|||||||||
|
2006 Equity Incentive Plan
|
1,366,301
|
(1)
|
$
|
4.20
|
102,322
|
|||||||
|
2015 Equity Incentive Plan
|
1,759,000
|
(2)
|
$
|
13.27
|
1,783,000
|
|||||||
__________
| (1) |
Consists of 1,000,140 shares reserved for grants of stock options and 366,161 shares reserved for grants of restricted stock. On December 31, 2019,
7,237 options were outstanding with a weighted average exercise price of $4.20 of which 7,237 were exercisable as of that date.
|
| (2) |
Consists of 1,213,000 shares reserved for grants of stock options and 546,000 shares reserved for grants of restricted stock. On December 31, 2019,
1,053,832 options were outstanding with a weighted average exercise price of $13.27 of which 413,831 were exercisable as of that date.
|
- 102 -
The information in the Company’s definitive Proxy Statement, prepared for the 2020 Annual Meeting of Shareholders, which
contains information concerning this item under the captions “Transactions with Certain Related Parties” and “Board Meetings and Committees” is incorporated herein by reference.
The information in the Company’s definitive Proxy Statement, prepared for the 2020 Annual Meeting of Shareholders, which
contains information concerning this item under the caption “Ratification of the Appointment of Our Independent Registered Public Accounting Firm,” is incorporated herein by reference.
Part IV
| (a) |
Documents filed as part of the Report:
|
1. and 2. Financial Statements and
Financial Statement Schedules.
The following consolidated financial statements of Waterstone Financial, Inc. and subsidiaries are filed as part of this
report under Item 8, “Financial Statements and Supplementary Data”:
Report of RSM US LLP, Independent Registered Public Accounting Firm, on consolidated financial statements.
Consolidated Statements of Financial Condition – December 31, 2019 and 2018.
Consolidated Statements of Operations – Years ended December 31, 2019, 2018 and 2017.
Consolidated Statements of Comprehensive Income – Years ended December 31, 2019, 2018 and 2017.
Consolidated Statements of Changes in Shareholders’ Equity – Years ended December 31, 2019, 2018 and 2017.
Consolidated Statements of Cash Flows – Years ended December 31, 2019, 2018 and 2017.
Notes to Consolidated Financial Statements.
All schedules for which provision is made in the applicable accounting regulations of the Securities and Exchange
Commission are not required under the related instructions or are inapplicable, and therefore have been omitted.
(b). Exhibits. See
Exhibit Index following the signature page of this report, which is incorporated herein by reference. Each management contract or compensatory plan or arrangement required to be filed as an exhibit to this report is identified in the Exhibit Index
by an asterisk following its exhibit number.
WATERSTONE FINANCIAL, INC
(“Waterstone Financial” or the “Company”)
Commission File No. 000-51507
EXHIBIT INDEX
TO
2019 REPORT ON FORM 10-K
The following exhibits are filed with, or incorporated by reference in, this Annual Report on Form 10-K for the year ended December 31,
2019:
| Exhibit | Description | Incorporated Herein By Reference To |
Filed Herewith |
|
|
|
|
|
|
3.1
|
|
|
|
|
|
|
|
|
|
3.2
|
|
|
|
|
|
|
|
|
|
4.1
|
|
|
|
|
|
|
|
|
|
4.2
|
|
X
|
|
|
|
|
|
|
|
10.1
|
|
|
|
|
|
|
|
|
|
10.2
|
|
|
|
|
|
|
|
|
|
10.3
|
|
|
|
|
10.4
|
|||
|
10.5
|
|||
| 10.6 | Waterstone Financial, Inc. Incentive Plan †(6) |
||
|
10.7
|
|||
|
21.1
|
|
X
|
|
|
23.1
|
|
X
|
|
|
24.1
|
Signature Page
|
|
|
|
31.1
|
|
X
|
|
|
31.2
|
|
X
|
|
|
32.1
|
|
X
|
|
|
32.2
|
|
X
|
† Management compensation contract or agreement
(1) Incorporated by reference to the registration Statement on Form S-1 filed by
Wauwatosa Holdings, Inc. (the predecessor corporation to Waterstone Financial, Inc., a federal corporation) (Commission file no. 333-125715), filed with the U.S. Securities and Exchange Commission on June 10, 2005.
(2) Incorporated by reference to Appendix A to the Definitive Proxy Statement for
the 2006 Annual Meeting of Shareholders filed by Wauwatosa Holdings, Inc. (the predecessor corporation to Waterstone Financial, Inc., a federal corporation) (Commission file no. 000-51507), filed with the U.S. Securities and Exchange Commission on
March 27, 2006.
(3) Incorporated by reference to the registration Statement
on Form S-1 (Registration No. 333-189160), initially filed with the U.S. Securities and Exchange Commission on June 7, 2013.
(4) Incorporated by reference to Exhibit 10.1 to Report on Form 8-K filed with
the U.S. Securities and Exchange Commission on October 24, 2014 (File No. 001-36271).
(5) Incorporated by reference to Exhibit 10.6 to Report on Form 10-K filed
with the U.S. Securities and Exchange Commission on March 6, 2019 (File No. 001-36271).
(6) Incorporated by reference to Exhibit 10.1 to Report on Form 8-K filed with the U.S. Securities and Exchange Commission on March 25, 2019 (File No. 001-36271).
(7) Incorporated by reference to Exhibit 10.1 to Report on
Form 8-K filed with the U.S. Securities and Exchange Commission on April 4 2019 (File No. 001-36271).
(8) Incorporated by reference to Exhibit 10.1 to the Consent Report on Form 8-K filed with the SEC on September 19, 2019 (File No. 001-36271).
- 104 -
Pursuant to the requirements of Section 13 or 15(d) of the Securities Exchange Act of 1934, the registrant has duly
caused this report to be signed on its behalf by the undersigned, thereunto duly authorized.
|
|
|
WATERSTONE FINANCIAL, INC.
|
|
March 13, 2020
|
|
|
|
|
|
|
|
|
By:
|
/s/ Douglas S. Gordon
|
|
|
|
Douglas S. Gordon
|
|
|
|
Chief Executive Officer
|
Each person whose signature appears below hereby authorizes Douglas S. Gordon or Mark R. Gerke, or any of them, as
attorneys-in-fact with full power of substitution, to execute in the name and on behalf of such person, individually, and in each capacity stated below or otherwise, and to file, any and all amendments to this report.
Pursuant to the requirements of the Securities Exchange Act of 1934, this report has been signed below by the following
persons on behalf of the registrant and in the capacities indicated.*
Signature and Title
|
/s/ Douglas S. Gordon
|
|
/s/ Patrick S. Lawton
|
|
Douglas S. Gordon,
|
|
Patrick S. Lawton, Chairman and Director
|
|
Chief Executive Officer and Director
|
|
|
|
(Principal Executive Officer)
|
|
|
|
|
|
|
|
/s/ Mark R. Gerke
|
|
/s/ Ellen S. Bartel
|
|
Mark R. Gerke
|
|
Ellen S. Bartel, Director
|
|
Chief Financial Officer
|
|
|
|
|
|
|
|
|
/s/ Thomas E. Dalum
|
|
|
|
Thomas E Dalum, Director
|
|
|
|
|
|
|
|
|
|
|
|
/s/ Michael L. Hansen
|
|
|
|
Michael L. Hansen, Director
|
|
|
/s/ Kristine A. Rappé
|
||
|
Kristine A. Rappé, Director
|
||
|
/s/ Stephen J. Schmidt
|
||
|
Stephen J. Schmidt, Director
|
*Each of the above signatures is affixed as of March 13, 2020.
- 105 -