Attached files
| file | filename |
|---|---|
| EX-32 - EXHIBIT 32 - FUEL TECH, INC. | ftek-20191231xex32.htm |
| EX-31.2 - EXHIBIT 31.2 - FUEL TECH, INC. | ftek-20191231xex312.htm |
| EX-31.1 - EXHIBIT 31.1 - FUEL TECH, INC. | ftek-20191231xex311.htm |
| EX-23.1 - EXHIBIT 23.1 - FUEL TECH, INC. | ftek-20191231xex231.htm |
SECURITIES AND EXCHANGE COMMISSION
Washington, D.C. 20549
______________________________
Form 10-K
(Mark One)
ý | ANNUAL REPORT PURSUANT TO SECTION 13 OR 15(d) OF THE SECURITIES EXCHANGE ACT OF 1934 |
For the fiscal year ended: December 31, 2019
OR
¨ | TRANSITION REPORT PURSUANT TO SECTION 13 OR 15(d) OF THE SECURITIES EXCHANGE ACT OF 1934 |
For the transition period from to
Commission File Number 001-33059
______________________________
Fuel Tech, Inc.
(Exact name of registrant as specified in its charter)
______________________________
Delaware | 20-5657551 | |
(State of Incorporation) | (I.R.S. ID) | |
Fuel Tech, Inc.
27601 Bella Vista Parkway
Warrenville, IL 60555-1617
(630) 845-4500
www.ftek.com
Securities registered pursuant to Section 12(b) of the Act:
COMMON STOCK, $0.01 par value per share | NASDAQ | |
Securities registered pursuant to Section 12(g) of the Act: NONE
______________________________
Indicate by check mark if the registrant is a well-known seasoned issuer, as defined in Rule 405 of the Securities Act. Yes ¨ No ý
Indicate by check mark if the registrant is not required to file reports pursuant to Section 13 or Section 15(d) of the Exchange Act. Yes ¨ No ý
Indicate by check mark whether the registrant: (1) has filed all reports required to be filed by Section 13 or 15(d) of the Securities Exchange Act of 1934 during the preceding 12 months (or for such shorter period that the registrant was required to file such reports), and (2) has been subject to such filing requirements for the past 90 days. Yes ý No ¨
Indicate by check mark whether the registrant has submitted electronically and posted on its corporate Web site, if any, every Interactive Data File required to be submitted and posted pursuant to Rule 405 of Regulation S-T (§232.405 of this chapter) during the preceding 12 months (or for such shorter period that the registrant was required to submit and post such files). Yes ý No ¨
Indicate by check mark if disclosure of delinquent filers pursuant to Item 405 of Regulation S-K (§229.405 of this chapter) is not contained herein, and will not be contained, to the best of registrant’s knowledge, in definitive proxy or information statements incorporated by reference in Part III of this Form 10-K or any amendment to this Form 10-K.
Indicate by check mark whether the registrant is a large accelerated filer, an accelerated filer, a non-accelerated filer, smaller reporting company, or an emerging growth company. See definitions of “large accelerated filer,” “accelerated filer,” “smaller reporting company,” and “emerging growth company” in Rule 12b-2 of the Exchange Act. (Check one):
Large Accelerated Filer | ¨ | Accelerated Filer | ¨ | ||
Non-accelerated Filer | ý | Smaller reporting company | ý | ||
Emerging growth company | ¨ | ||||
If an emerging growth company, indicate by check mark if the registrant has elected not to use the extended transition period for complying with any new or revised financial accounting standards provided pursuant to Section 13(a) of the Exchange Act. Yes ¨ No ¨
Indicate by check mark whether the registrant is a shell company (as defined in Rule 12b-2 of the Exchange Act). Yes ¨ No ý
As of June 30, 2019, the aggregate market value of the registrant's common stock held by non-affiliates of the registrant was approximately $27,483,901 based on the closing sale price as reported on the NASDAQ National Market System.
As of February 28, 2020, there were 24,592,578 shares of common stock outstanding.
Documents incorporated by reference:
Portions of the definitive Proxy Statement to be delivered to shareholders in connection with the Annual Meeting of Shareholders to be held on May 20, 2020 are incorporated by reference into Part III.
TABLE OF CONTENTS
Page | ||
Item 1. | ||
Item 1A. | ||
Item 1B. | ||
Item 2. | ||
Item 3. | ||
Item 4. | ||
Item 5. | ||
Item 6. | ||
Item 7. | ||
Item 7A. | ||
Item 8. | ||
Item 9. | ||
Item 9A. | ||
Item 9B. | ||
Item 10. | ||
Item 11. | ||
Item 12. | ||
Item 13. | ||
Item 14. | ||
Item 15. | ||
TABLE OF DEFINED TERMS
Term | Definition | |
AIG | Ammonia Injection Grid | |
APC | Air Pollution Control Technology | |
ASCR™ | A trademark used to describe our Advanced Selective Catalytic Reduction process | |
CFD | Computational Fluid Dynamics | |
EPA | The U.S. Environmental Protection Agency | |
ESP | Electrostatic Precipitator | |
FGC | Flue Gas Conditioning | |
FUEL CHEM® | A trademark used to describe our fuel and flue gas treatment processes, including its TIFI® Targeted In-Furnace Injection™ technology to control slagging, fouling, corrosion and a variety of sulfur trioxide-related issues | |
GSG™ | Graduated Straightening Grid | |
HERT™ High Energy Reagent Technology™ | A trademark used to describe one of our SNCR processes for the reduction of NOx | |
I-NOx® | Systems can include LNB, OFA, and SNCR components, along with SCR technology, Ammonia Injection Grid (AIG), and Graduated Straightening Grid (GSG™) system | |
NOx | Oxides of nitrogen | |
NOxOUT® | A trademark used to describe one of our SNCR processes for the reduction of NOx | |
SCR | Selective Catalytic Reduction | |
SNCR | Selective Non-Catalytic Reduction | |
TIFI® Targeted In-Furnace Injection™ | A trademark used to describe our proprietary technology that enables the precise injection of a chemical reagent into a boiler or furnace as part of a FUEL CHEM program | |
UDI™ | Urea Direct Injection as the process to provide urea reagent directly into a duct for SCR applications | |
ULTRA® | A trademark used to describe our process for generating ammonia for use as a Selective Catalytic Reduction reagent | |
BREF | Best Available Reference Technology. European emission requirements. | |
ACE | Affordable Clean Energy. EPA rule to address greenhouse gas emissions. | |
DGI™ | Dissolved Gas Infusion | |
BACT | Best Available Control Technology | |
1
PART I
Forward-Looking Statements
This Annual Report on Form 10-K contains “forward-looking statements,” as defined in Section 21E of the Securities Exchange Act of 1934, as amended, that are made pursuant to the safe harbor provisions of the Private Securities Litigation Reform Act of 1995 and reflect our current expectations regarding our future growth, results of operations, cash flows, performance and business prospects, and opportunities, as well as assumptions made by, and information currently available to, our management. We have tried to identify forward-looking statements by using words such as “anticipate,” “believe,” “plan,” “expect,” “intend,” “will,” and similar expressions, but these words are not the exclusive means of identifying forward-looking statements. These statements are based on information currently available to us and are subject to various risks, uncertainties, and other factors, including, but not limited to, those discussed herein under the caption “Risk Factors” that could cause our actual growth, results of operations, financial condition, cash flows, performance and business prospects and opportunities to differ materially from those expressed in, or implied by, these statements. Except as expressly required by the federal securities laws, we undertake no obligation to update such factors or to publicly announce the results of any of the forward-looking statements contained herein to reflect future events, developments, or changed circumstances or for any other reason. Investors are cautioned that all forward-looking statements involve risks and uncertainties, including those detailed in our filings with the Securities and Exchange Commission. See “Risk Factors” in Item 1A.
ITEM 1 - BUSINESS
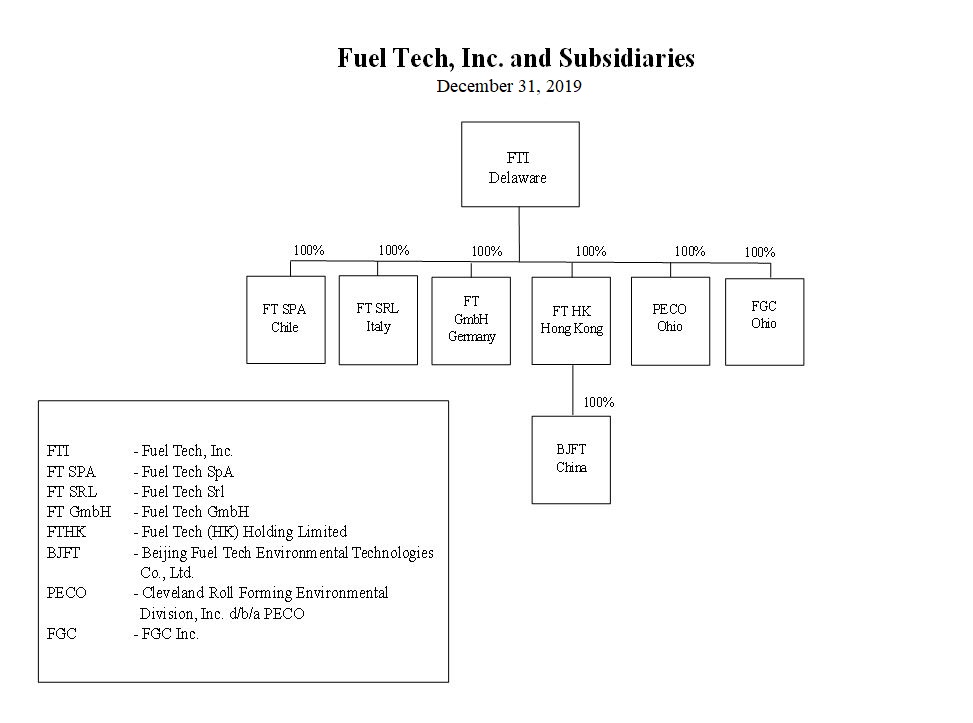
As used in this Annual Report on Form 10-K, the terms “we,” “us,” or “our,” refer to Fuel Tech, Inc. and our wholly-owned subsidiaries.
GENERAL
We are a leading technology company engaged in the worldwide development, commercialization and application of state-of-the-art proprietary technologies for air pollution control, process optimization, water treatment and advanced engineering services. These technologies enable our customers to operate efficiently in a cost-effective and environmentally sustainable manner.
• | The Company’s nitrogen oxide (NOx) reduction technologies include advanced combustion modification techniques and post-combustion NOx control approaches, including NOxOUT®, HERT™, and Advanced SNCR systems, ASCR™ Advanced Selective Catalytic Reduction systems, and I-NOx® Integrated NOx Reduction Systems, which utilize various combinations of these systems, along with the UDI™ Urea Direct Injection system for SCR reagent supply, and the ULTRA® process for safe ammonia generation. These technologies have established Fuel Tech as a leader in NOx reduction, with installations on over 1,100 units worldwide. |
• | Fuel Tech’s APC technologies include particulate control with Electrostatic Precipitator (ESP) products and services including complete turnkey capability for ESP retrofits, with experience on units up to 700 MW. Flue gas conditioning (FGC) systems include treatment using sulfur trioxide (SO3) and ammonia (NH3) based conditioning to improve the performance of ESPs by modifying the properties of fly ash particles. Fuel Tech’s particulate control technologies have been installed on more than 125 units worldwide. |
• | Our FUEL CHEM technologies revolve around the unique application of chemical injection programs which improve the efficiency, reliability, fuel flexibility, boiler heat rate and environmental status of combustion units by controlling slagging, fouling, corrosion, opacity and acid plume, as well as the formation of sulfur trioxide, ammonium bisulfate, particulate matter (PM2.5), sulfur dioxide (SO2), and carbon dioxide (CO2). We use our patented TIFI® Targeted In-Furnace Injection™ processes to apply specialty chemical programs to units burning a wide variety of fuels including coal, heavy oil, biomass, and municipal waste. These TIFI programs incorporate design, modeling, equipment, reagent, and service to provide complete customized on-site programs designed to improve plant operations and provide a return on investment in addition to helping meet emission regulatory requirements. |
• | Water treatment technologies include DGI™ Dissolved Gas Infusion Systems which utilize a patented nozzle to provide a competitive advantage over conventional utility and industrial aeration. An innovative alternative to current aeration technology among other applications, DGI systems can deliver supersaturated oxygen solutions and other gas-water combinations to target process applications or environmental issues. This infusion process has a variety of applications in the water and wastewater industries, including remediation, treatment, biological activity and wastewater odor management. DGI technology benefits include reduced energy consumption, installation costs, and operating costs, while improving treatment performance. The water treatment technology is not yet operational and there are currently no revenues associated with it. |
2
Many of our products and services rely heavily on our computational fluid dynamics and chemical kinetics modeling capabilities, which are enhanced by internally developed, high-end visualization software. These capabilities, coupled with our innovative technologies and multi-disciplined team approach, enable us to provide practical solutions to some of our customers' most challenging issues.
AIR POLLUTION CONTROL
Regulations and Markets: Domestic
The continued growth of our APC technology segment is dependent upon the adoption and enforcement of environmental regulations in the U.S. and globally. In the U.S., federal and state laws regulating the emission of NOx are the primary driver in our APC technology segment. The principal regulatory drivers currently in effect are as follows:
Clean Air Act: The Clean Air Act (CAA) requires the U.S. Environmental Protection Agency (EPA) to establish national ambient air quality standards (NAAQS) at levels that are protective of public health with an adequate margin of safety. The six pollutants specified include: Ozone (O3), Particulate Matter (PM), Nitrogen Dioxide (NO2), Sulfur Dioxide (SO2), Lead, and Carbon Monoxide (CO). The NAAQS provisions require that states comply with ozone and particulate emissions standards. NOx emissions are a precursor to ozone formation and also contribute to fine particulate emissions (PM2.5). NOx emissions were targeted as contributors to fine particulate emissions and ozone emissions. Since 1990, programs have been established by the EPA at the regional and federal level to help states in their mission to define and meet their State Implementation Plans (SIPs) for attainment. NAAQS PM standards were issued in 1997, with more stringent standards issued in 2006 and 2012. The NAAQS ozone standards issued in 1997 were made more stringent in 2008. On October 1, 2015, the EPA strengthened the NAAQS for ground-level ozone by reducing the minimum acceptable level from 75 to 70 parts per billion (ppb). Implementation of the 2015 NAAQS standards started in 2018 with finalization of the area designations. A number of Eastern States are considering NOx reduction system upgrades for existing sources to meet the 70 ppb requirement. 2020 NAAQS ozone standards are expected to remain at the 2015 limit.
Clean Air Visibility Rule (CAVR): The Clean Air Visibility Rule (CAVR), also known as the Regional Haze rule, is part of the Clean Air Act and was finalized in 2005. Under CAVR, certain States are required to submit implementation plans to the EPA to comply with the Regional Haze requirements, and updates are required every five years. A new CAVR was issued in January 2017 which requires states to implement new air pollution controls by 2021. The overall obligation of CAVR is to return the US scenic areas to “active” visibility by 2064.
New Unit Permits: New gas fired units for both electricity generation and industrial use will require BACT technology as a permit requirement. SCR technology is very often BACT for NOx, and these permit requirements generate new market opportunities.
Consent Decrees: Consent decree activity through the US Department of Justice or EPA may require emission sources to meet individual requirements. Sources may also agree to specific air pollution requirements with states or environmental groups.
Regulations and Markets: International
We also sell air pollution control systems outside the United States, specifically in Europe, Latin America, India (under a license agreement) and in the Pacific Rim. The demand for our technologies comes from specific governmental regulations in NOx and PM emission limits which vary by country. We expect that there will be further opportunities to implement our technologies globally in established as well as new geographies in 2020.
The European Union published the BREF (Best Available Reference Technology) emission guidelines in mid 2017 that further lowered emission targets over a span of the next four years. The compliance timeline is expected to be extended due to slow initial adoption. These measures are expected to lower the environmental impact of more than 3,000 large combustion plants throughout the European Union. Moreover, European countries that are not current EU members are expected to adopt these new standards as part of their approach to gain EU membership. Despite the significant expansion of renewable energy throughout Europe, the EU and neighboring states still rely heavily on coal generation to provide a stable base load to their power and heating demands. The BREF guidelines reduce NOx limit values by up to 25% which will require an upgrade of the first-generation NOx abatement systems, and that is expected to present new opportunities for Fuel Tech. However, the pace of implementation will still be dependent on each country's internal processes. European engineering companies are also supplying systems to industrial and utility customers globally. Fuel Tech’s NOx control technologies can be integrated into these systems.
3
The Indian government's initial compliance deadline of December 2017 has been delayed, but adoption of emission control technologies has started and it is expected to continue in 2020. The primary control technology under implementation is FGD systems for SOx abatement. The Indian government appears to be backing off the original NOx emission control targets for pre-2016 coal fired stations and this action is expected to significantly reduce demand for SNCR systems from levels previously projected. Particulate Matter (PM) emission reductions continue to be an area of focus in the country which presents an opportunity for Fuel Tech’s DFGC technology application. These technologies will be implemented through a collaboration with our local partner ISGEC.
Elsewhere in Southeast Asia, particulate emissions due to poor performing ESPs have been gaining attention by local authorities. Power generators in several countries like Vietnam, Malaysia and the Philippines are actively looking for corrective options and this presents Fuel Tech with opportunities to bring our DFGC technology to these markets.
Products
Our NOx reduction and particulate control technologies are installed worldwide on over 1,200 combustion units, including utility, industrial and municipal solid waste applications. Our products include customized NOx control systems and our patented ULTRA®technology, which converts urea-to-ammonia on site and provides safe reagent for use in Selective Catalytic Reduction (SCR) systems.
• | SNCR Systems: Our NOxOUT® and HERT™ SNCR processes use non-hazardous urea as the reagent rather than ammonia. Both the NOxOUT® and HERT™ processes on their own are capable of reducing NOx by up to 25% - 50% for utilities and by potentially significantly greater amounts for industrial units in many types of plants with capital costs ranging from $5 - $20/kW for utility boilers and with total annualized operating costs ranging from $1,000 - $2,000/ton of NOx removed. Advanced SNCR systems are also available to improve performance and minimize reagent costs through in-furnace monitoring and an advanced control system. |
• | I-NOx® Systems: Our I-NOx® systems can include LNB, OFA, and SNCR components, along with SCR technology, Ammonia Injection Grid (AIG), and Graduated Straightening Grid (GSG™) system. Together, these systems provide up to 90% NOx reduction at significantly lower capital and operating costs than conventional SCR systems while providing greater operational flexibility to plant operators. The capital costs for I-NOx® systems can range from $30 - $150/kW depending on boiler size and configuration, which is significantly less than that of conventional SCRs, which can cost $300/kW or more, while operating costs are competitive with those experienced by SCR systems. Our SCR systems utilize urea or ammonia as the SCR catalyst reagent to achieve NOx reductions of up to 85% from industrial combustion sources. |
• | ULTRA Technology: Our ULTRA® process is designed to convert urea to ammonia safely and economically for use as a reagent in the SCR process for NOx reduction. Recent local objections in the ammonia permitting process have raised concerns regarding the safety of ammonia shipment and storage in quantities sufficient to supply SCR. In addition, the Department of Homeland Security has characterized anhydrous ammonia as a Toxic Inhalation Hazard commodity. Our ULTRA® process is believed to be a market leader for the safe conversion of urea to ammonia just prior to injection into the flue gas duct, which is particularly important near densely populated cities, major waterways, harbors or islands, or where the transport of anhydrous or aqueous ammonia is a safety concern. Ammonia feed systems provide reagent flexibility for SCR reagent feed system, while our UDI™ Urea Direct Injection systems utilize direct injection of reagent without the need for an ammonia injection grid. |
• | SCR Processes and Services: Our SCR group provides process design optimization, performance testing and improvement, and catalyst selection services for SCR systems on coal-fired boilers. In addition, other related services, including start-ups, maintenance support and general consulting services for SCR systems, Ammonia Injection Grid design and tuning to help optimize catalyst performance, and catalyst management services to help optimize catalyst life, are now offered to customers around the world. We also specialize in computational fluid dynamics models, which simulate fluid flow by generating a virtual replication of real-world geometry and operating inputs. We design flow corrective devices, such as turning vanes, ash screens, static mixers and our patented GSG® Graduated Straightening Grid. Our models help clients optimize performance in flow critical equipment, such as selective catalytic reactors in SCR systems, where the effectiveness and longevity of catalysts are of utmost concern. The Company’s modeling capabilities are also applied to other power plant systems where proper flow distribution and mixing are important for performance, such as flue gas desulfurization- scrubbers, electrostatic precipitators, air heaters, exhaust stacks and carbon injection systems for mercury removal. |
• | ESP Processes and Services: ESP technologies for particulate control include Electrostatic Precipitator (ESP) products and services including ESP Inspection Services, Performance Modeling, and Performance and Efficiency Upgrades, along |
4
with complete turnkey capability for ESP retrofits. Flue gas conditioning (FGC) systems include treatment using sulfur trioxide (SO3) and ammonia (NH3) based systems to improve the performance of ESPs by modifying the properties of the fly ash particle. Our ULTRA technology can provide the ammonia system feed requirements for FGC applications as a safe alternative to ammonia reagent-based systems. FGC systems offer a lower capital cost approach to improving ash particulate capture versus the alternative of installing larger ESPs or utilizing fabric filter technology to meet targeted emissions and opacity limits. Fuel Tech’s particulate control technologies have been installed on more than 125 units worldwide.
• | Burner Systems: Low NOx Burners and Ultra Low NOx Burners (LNB and ULNB) are available for coal-, oil-, and gas-fired industrial and utility units. Each system application is specifically designed to maximize NOx reduction. Computational fluid dynamics combustion modeling is used to validate the design prior to fabrication of equipment. NOx reductions can range from 40%-60% depending on the fuel type. Over-Fire Air (OFA) systems stage combustion for enhanced NOx reduction. Additional NOx reductions, beyond Low NOx Burners, of 35% - 50% are possible on different boiler configurations on a range of fuel types. Combined overall reductions range from 50% - 70%, with overall capital costs ranging from $10 - $20/kW and total costs ranging from $300 - $1,500/ton of NOx removed, depending on the scope. |
A market factor for the APC product line is the continued use of coal for global electricity production. Coal currently accounts for approximately 25% of all U.S. electricity generation and roughly 59% of Chinese electricity generation. Major coal consumers include China, the United States and India. The growth of natural gas in the U.S. for industrial applications has increased the need for SCR technology since it often meets the definition of Best Available Control Technology and is required on new industrial units.
Sales of APC products were $14.1 million, $38.4 million, and $27.8 million for the years ended December 31, 2019, 2018 and 2017, respectively.
APC Competition
Competition with our NOx reduction suite of products may be expected from companies supplying SCR Systems and ammonia SNCR Systems, urea SNCR systems, ESP retrofits and FGC technologies. In addition, we experience competition in the urea-to-ammonia conversion market.
The SCR process is an effective and proven method of control for removal of NOx up to 90%. SCR systems have a high capital cost of $300+/kW on retrofit coal applications. Companies including GE, Babcock Power, Babcock & Wilcox (B&W) Company, CECO Environmental and Mitsubishi Hitachi, are active SCR system and reagent feed system providers.
The use of both urea and ammonia as the reagent for the SNCR process can reduce NOx by 30% - 70%, depending on a number of factors. Ammonia can be effective on incinerators and on Circulating Fluidized Bed combustion units, but has limited applicability for most utility boilers, where urea is dominant. Both urea and ammonia SNCR system capital costs range from $5 - $20/kW, with annualized operating costs ranging from $1,000 - $3,000/ton of NOx removed. The ammonia-based systems utilize either anhydrous or aqueous ammonia, both of which are hazardous substances. Competitors for ammonia based SNCR include CECO Environmental, B&W, and Yara, with Hamon and B&W for urea based SNCR systems.
ESP retrofit competitors include B&W, Southern Environmental and Hamon. Flue Gas Conditioning competition includes Wahlco, Inc. and Chemithon, Inc.
Lastly, with respect to urea-to-ammonia conversion technologies, a competitive approach to our controlled urea decomposition system competes with Harmon and Wahlco, which manufacture a system that hydrolyzes urea under high temperature and pressure.
APC Backlog
Consolidated APC segment backlog at December 31, 2019 was $9.7 million versus backlog at December 31, 2018 of $12.4 million. The Company expects to recognize revenue on approximately $5.8 million of the backlog over the next 12 months with the remaining recognized thereafter.
FUEL CHEM
Product and Markets
The FUEL CHEM® technology segment revolves around the unique application of specialty chemicals to improve the efficiency, reliability and environmental status of plants operating in the electric utility, industrial, pulp and paper, waste-to-energy, and university and district heating markets. FUEL CHEM programs are currently in place on combustion units in North America,
5
Mexico and Europe, treating a wide variety of solid and liquid fuels, including coal, heavy oil, black liquor, biomass and municipal waste.
Central to the FUEL CHEM approach is the introduction of chemical reagents, such as magnesium hydroxide, to combustion units via in-body fuel application (pre-combustion) or via direct injection (post-combustion) utilizing our proprietary TIFI® technology. By attacking performance-hindering problems, such as slagging, fouling and corrosion, as well as the formation of sulfur trioxide (SO3), and ammonium bisulfate (ABS), our programs offer numerous operational, financial and environmental benefits to owners of boilers, furnaces and other combustion units.
A key market factor for this product line is the continued use of coal for global electricity production. Coal currently accounts for approximately 25% of all U.S. electricity generation and roughly 59% of Chinese electricity generation. Major coal consumers include the United States, China and India. Additional market dynamics include a growing, worldwide utilization of biomass for both steam and electrical production, as well as the strengthening of the pulp and paper industry worldwide, resulting in black liquor recovery boilers needing to maximize throughput. A new potential driver in the US is the Affordable Clean Energy (ACE) Rule finalized by EPA in 2019 as a replacement for the Clean Power Plan which EPA repealed. This Rule calls for the use of a wide range of available boiler heat rate improvement technologies to improve efficiency to reduce greenhouse gas emissions.
The principal markets for this product line are electric power plants burning coals with slag-forming constituents such as sodium, iron and high levels of sulfur. Sodium is typically found in the Powder River Basin coals of Wyoming and Montana. Iron is typically found in coals produced in the Illinois Basin region. High sulfur content is typical of Illinois Basin coals and certain Appalachian coals. High sulfur content can give rise to unacceptable levels of SO3 formation especially in plants with SCR systems and flue gas desulphurization units (scrubbers). As coal units strive to compete in electricity supply markets, lower cost, higher slagging fuels can create more operational challenges which TIFI Programs can help mitigate.
The combination of slagging coals and SO3-related issues, such as “blue plume” formation, air pre-heater fouling and corrosion, SCR fouling and the proclivity to suppress certain mercury removal processes, represents an attractive market potential for Fuel Tech.
Sales of the FUEL CHEM products were $16.4 million, $18.1 million, and $17.4 million for the years ended December 31, 2019, 2018 and 2017, respectively.
Competition
Competition for our FUEL CHEM product line includes chemicals sold by specialty chemical companies, such as Imerys, Environmental Energy Services, Inc., and SUEZ Water Technologies. No technologically comparable substantive competition currently exists for our TIFI technology, which is designed primarily for slag control and SO3 abatement, but there can be no assurance that such lack of substantive competition will continue.
INTELLECTUAL PROPERTY
The majority of our products are protected by U.S. and non-U.S. patents. We own 54 granted patents worldwide and 15 allowed utility model patents in China. We have 16 patent applications pending; including 6 in the United States and 10 in non-U.S. Jurisdictions. These patents and applications cover some 29 inventions, 15 associated with our NOx reduction business, 12 associated with the FUEL CHEM business, and two associated with water treatment. Our granted patents have expiration dates ranging from July of 2020 to September of 2039.
Management believes that the protection provided by the numerous claims in the above referenced patents or patent applications is substantial, and afford us a significant competitive advantage in our business. Accordingly, any significant reduction in the protection afforded by these patents or any significant development in competing technologies could have a material adverse effect on our business.
EMPLOYEES
At December 31, 2019, we had 82 employees, 75 in North America, two in China and five in Europe. We enjoy good relations with our employees and are not a party to any labor management agreement.
6
RELATED PARTIES
Douglas G. Bailey, a member of our Board, is a stockholder of American Bailey Corporation (ABC), which is a related party. Please refer to Note 12 to the consolidated financial statements in this Form 10-K for information about our transactions with ABC. Additionally, see the more detailed information relating to this subject under the caption “Certain Relationships and Related Transactions” in our definitive Proxy Statement to be distributed in connection with our 2020 Annual Meeting of Stockholders, which information is incorporated by reference.
AVAILABLE INFORMATION
We are a fully integrated company using a suite of advanced technologies to provide boiler optimization, efficiency improvement and air pollution reduction and control solutions to utility and industrial customers worldwide. Originally incorporated in 1987 under the laws of the Netherlands Antilles as Fuel-Tech N.V., we were domesticated in the United States on September 30, 2006, and continue as a Delaware corporation with our corporate headquarters at 27601 Bella Vista Parkway, Warrenville, Illinois, 60555-1617. Fuel Tech maintains an Internet website at www.ftek.com. Our Annual Report on Form 10-K, quarterly reports on Form 10-Q, current reports on Form 8-K and any amendments to those reports filed or furnished pursuant to Section 13(a) of the Exchange Act are made available through our website as soon as reasonably practical after we electronically file or furnish the reports to the Securities and Exchange Commission. Our website also contains our Corporate Governance Guidelines and Code of Ethics and Business Conduct, as well as the charters of the Audit, Compensation, and Nominating and Corporate Governance committees of the Board of Directors. All of these documents are available in print without charge to stockholders who request them. Information on our website is not incorporated into this report.
ITEM 1A - RISK FACTORS
Investors in our Common Shares should be mindful of the following risk factors relative to our business.
Our Product Portfolio Lacks Diversification
We have two broad technology segments that provide advanced engineering solutions to meet the pollution control, efficiency improvement, and operational optimization needs of coal-fired energy-related facilities worldwide. They are as follows:
• | The Air Pollution Control technology segment includes technologies to reduce NOx emissions in flue gas from boilers, incinerators, furnaces and other stationary combustion sources. These include Low and Ultra Low NOx Burners (LNB and ULNB), Over-Fire Air (OFA) systems, NOxOUT® and HERT™ Selective Non-Catalytic Reduction (SNCR) systems, and Advanced Selective Catalytic Reduction (ASCR™) systems. The ASCR system includes ULNB, OFA, and SNCR components, along with a downsized SCR catalyst, Ammonia Injection Grid (AIG), and Graduated Straightening Grid (GSG™) systems to provide high NOx reductions at significantly lower capital and operating costs than conventional SCR systems. The NOxOUT CASCADE® and NOxOUT-SCR® processes are basic types of ASCR systems, using just SNCR and SCR catalyst components. ULTRA® technology creates ammonia at a plant site using safe urea for use with any SCR application. ESP technologies make use of electrostatic precipitator products and services to reduce particulate matter. Flue Gas Conditioning systems are chemical injection systems offered in markets outside the U.S. and Canada to enhance electrostatic precipitator and fabric filter performance in controlling particulate emissions. |
• | The FUEL CHEM® technology segment which uses chemical processes in combination with advanced Computational Fluid Dynamics (CFD) and Chemical Kinetics Modeling (CKM) boiler modeling for the control of slagging, fouling, corrosion, opacity and other sulfur trioxide-related issues in furnaces and boilers through the addition of chemicals into the furnace using TIFI® Targeted In-Furnace Injection™ technology. |
An adverse development in our advanced engineering solution business as a result of competition, technological change, government regulation, customers converting to use natural gas or other fuels, or any other factor could have a significantly greater impact than if we maintained more diverse operations.
We Face Substantial Competition
Competition in the Air Pollution Control market comes from competitors utilizing their own NOx reduction processes, including SNCR systems, Low NOx Burners, Over-Fire Air systems, flue gas recirculation, ammonia SNCR and SCR, which do not infringe our patented technologies. Indirect competition will also arise from business practices such as the purchase rather than the generation of electricity, fuel switching, closure or de-rating of units, and sale or trade of pollution credits and emission allowances. Utilization by customers of such processes or business practices or combinations thereof may adversely affect our pricing and participation in the NOx control market if customers elect to comply with regulations by methods other than the purchase of our Air Pollution Control products. See Item 1 “Products” and “APC Competition” in the Air Pollution Control segment overview.
7
Competition for our FUEL CHEM markets include chemicals sold by specialty chemical companies, such as Imerys, Environmental Energy Services, Inc., and SUEZ Water Technologies.
Demand for Our APC and FUEL CHEM Products is Affected by External Market Factors
Reduced coal-fired electricity demand across the United States has led to coal-fired electricity production declines. Contributing to this decline in coal-fired generations were 1) lower natural gas prices which allowed utility operators to increase the amount of power generated from natural gas plants, 2) increased cost of environmental compliance with current environmental regulations, 3) constrained funding for capital projects, and 4) the uncertainty of regulation resulted in electricity generating unit operators delaying investment in NOx emission remediation plans until such time as the United States Environmental Protection Agency further clarifies the regulations.
Our Business Is Dependent on Continuing Air Pollution Control Regulations and Enforcement
Our business is significantly impacted by and dependent upon the regulatory environment surrounding the electricity generation market. Our business will be adversely impacted to the extent that regulations are repealed or amended to significantly reduce the level of required NOx reduction, or to the extent that regulatory authorities delay or otherwise minimize enforcement of existing laws. Additionally, long-term changes in environmental regulation that threaten or preclude the use of coal or other fossil fuels as a primary fuel source for electricity production which result in the reduction or closure of a significant number of fossil fuel-fired power plants may adversely affect our business, financial condition and results of operations. See Item 1 above under the caption “Regulations and Markets” in the Air Pollution Control segment overview.
We May Not Be Able to Successfully Protect our Patents and Proprietary Rights
We hold licenses to or own a number of patents for our products and processes. In addition, we also have numerous patent applications pending both in the U.S. and abroad. There can be no assurance that any of our pending patent applications will be granted or that our outstanding patents will not be challenged, overturned or otherwise circumvented by competitors. In foreign markets, the absence of harmonized patent laws makes it more difficult to ensure consistent respect for our patent rights in emerging markets. In addition, certain critical technical information relating to our products which is not patented is held as trade secret, and protected by trade secret laws and restrictions on disclosure contained in our confidentiality and licensing agreements. There can be no assurance that such protections will prove adequate or that we will have adequate remedies against contractual counterparties for disclosure of our trade secrets or other violations of our intellectual property rights. See Item 1 above under the caption “Intellectual Property.”
Our Results May Be Affected By Foreign Operations
We currently have foreign operations predominantly in Europe with our offices located in Gallarate, Italy. The future business opportunities in this market are dependent on the continued implementation and enforcement of regulatory policies that will benefit our technologies, the acceptance of our engineering solutions in such markets, the ability of potential customers to utilize our technologies on a competitive, cost-effective basis, and our ability to protect and enforce our intellectual property rights.
On January 17, 2019, we announced the suspension of further business development activity for its Air Pollution Control operation in Beijing, China. Our future financial results will be impacted by our ability to successfully complete the remaining wind-down activities in Beijing during 2020.
In 2012, we expanded our operations in Latin and South America by establishing a wholly-owned subsidiary in Chile. We are in the process of successfully completing the closure of this subsidiary in Chile during 2020 given all of our existing Air Pollution Control operations are now complete.
Our Operating Results May Be Adversely Affected by Product Pricing
The onset of significant competition for either of the technology segments might require us to lower our product prices in order to remain competitive and have a corresponding adverse impact on our realized gross margins and operating profitability. See the risk factor entitled “We Face Substantial Competition” above.
We May Not Be Able to Purchase Raw Materials on Commercially Advantageous Terms
Our FUEL CHEM technology segment is dependent, in part, upon a supply of magnesium hydroxide. Any adverse changes in the availability of this chemical will likely have an adverse impact on ongoing operation of our FUEL CHEM programs. On March 4, 2009, we entered into a Restated Product Supply Agreement (“PSA”) with Martin Marietta Magnesia Specialties, LLC (MMMS) in order to assure the continuance of a stable supply from MMMS of magnesium hydroxide products for our requirements in the United States and Canada. The term of the PSA expires on December 31, 2021. Pursuant to the PSA, MMMS supplies us
8
with magnesium hydroxide products manufactured pursuant to our specifications and we have agreed to purchase from MMMS, and MMMS has agreed to supply, 100% of our requirements for such magnesium hydroxide products for our customers who purchase such products for delivery in the United States and Canada. There can be no assurance that we will be able to obtain a stable source of magnesium hydroxide in markets outside the United States.
Our Customer Base Is Highly Concentrated
A small number of customers have historically accounted for a significant portion of our revenues. There can be no assurance that our current customers will continue to place orders, that orders by existing customers will continue at the levels of previous periods, or that we will be able to obtain orders from new customers. The loss of one or more of our customers could have a material adverse effect on our sales and operating results.
An outbreak of disease or similar public health threat, such as the coronavirus, could have a material adverse impact on the Company's business, operating results and financial condition.
An outbreak of disease or similar public health threat, or fear of such an event, could have a material adverse impact on the Company's business, financial condition and operating results.
In December 2019, a novel strain of coronavirus ("COVID-19") was reported in Wuhan, China. The World Health Organization has declared COVID-19 to constitute a "Public Health Emergency of International Concern." Since we are in the process of suspending our operations in Beijing, China and have current operations in Gallarate, Italy, the impact of COVID-19 could have a significant impact in being able to conduct business in those geographies which could affect the Company's operational and financial performance.
ITEM 1B - UNRESOLVED STAFF COMMENTS
None
9
ITEM 2 - PROPERTIES
We own an office building in Warrenville, Illinois, which has served as our corporate headquarters since June 23, 2008. This facility, with approximately 40,000 square feet of office space, is sufficient to meet our requirements for the foreseeable future.
We also operate from leased office facilities and we do not segregate any of these leased facilities by operating business segment. The terms of the Company's four primary lease arrangements are as follows:
• | The Gallarate, Italy building lease, for approximately 1,636 square feet, runs from May 1, 2019 to April 30, 2025. This facility serves as the operating headquarters for our European operations. |
• | The Westlake, Ohio building lease, for approximately 3,000 square feet, runs from May 1, 2017 to April 30, 2020. This facility houses engineering operations. |
• | The Aurora, IL warehouse lease, for approximately 11,000 square feet, runs from September 1, 2013 to December 31, 2020. This facility serves as an outside warehouse facility. On January 30, 2020, the Company extended the lease for three years to expire on December 31, 2023. |
• | The Overland Park, KS lease, for approximately 600 square feet, runs from October 16, 2018 to October 15, 2021. This facility serves primarily as a sales office. |
ITEM 3 - LEGAL PROCEEDINGS
From time to time we are involved in litigation with respect to matters arising from the ordinary conduct of our business. In the opinion of management, based upon presently available information, either adequate provision for anticipated costs have been accrued or the ultimate anticipated costs will not materially affect our consolidated financial position, results of operations, or cash flows.
See Note 9 "Commitments and Contingencies" in the Notes to the Consolidated Financial Statements in this Annual Report on Form 10-K.
ITEM 4 – MINE SAFETY DISCLOSURES
Not Applicable
10
PART II
ITEM 5 - MARKET FOR REGISTRANT’S COMMON EQUITY, RELATED STOCKHOLDER MATTERS AND ISSUER PURCHASE OF EQUITY SECURITIES
Market
Our Common Shares have been traded since September 1993 on The NASDAQ Stock Market, Inc, where it trades under the symbol FTEK.
Prices
The table below sets forth the high and low sales prices during each calendar quarter since January 2018.
2019 | High | Low | ||||||
Fourth Quarter | $ | 1.08 | $ | 0.84 | ||||
Third Quarter | 1.43 | 0.82 | ||||||
Second Quarter | 2.80 | 1.22 | ||||||
First Quarter | 1.85 | 1.17 | ||||||
2018 | High | Low | ||||||
Fourth Quarter | $ | 1.49 | $ | 1.15 | ||||
Third Quarter | 1.42 | 0.97 | ||||||
Second Quarter | 1.42 | 1.00 | ||||||
First Quarter | 1.57 | 1.00 | ||||||
Dividends
We have never paid cash dividends on the Common Shares and have no current plan to do so in the foreseeable future. The declaration and payment of dividends on the Common Shares are subject to the discretion of our Board of Directors. The decision of the Board of Directors to pay future dividends will depend on general business conditions, the effect of a dividend payment on our financial condition, and other factors the Board of Directors may consider relevant. The current policy of the Board of Directors is to reinvest earnings in operations to promote future growth.
Holders
As of February 28, 2020, there were 89 holders of record of our common stock, which does not include the number of beneficial owners whose common stock was held in street name or through fiduciaries.
NASDAQ Delisting Notice
On January 7, 2020, Fuel Tech, Inc. (the “Company”) received a letter from the Listing Qualifications Department of The NASDAQ Stock Market (“NASDAQ”) notifying the Company that, based upon the closing bid price of the Company’s common stock that trades under the symbol “FTEK” (“Common Stock”), for the last 30 consecutive business days the Common Stock did not meet the minimum bid price of $1.00 per share required for continued listing on NASDAQ pursuant to NASDAQ Listing Rule 5450(a)(1) (the “Minimum Bid Rule”), initiating an automatic 180 calendar-day grace period for the Company to regain compliance.
The notice has no immediate effect on the listing or trading of the Company’s Common Stock, and the Common Stock will continue to trade on the NASDAQ under the symbol “FTEK”.
In accordance with NASDAQ Listing Rule 5810(c)(3)(A), the Company has a period of 180 calendar days from the date of the notification, or until July 6, 2020 to achieve compliance with the Minimum Bid Rule. The Company will regain compliance with the Minimum Bid Rule if at any time before July 6, 2020, the bid price for the Company’s Common Stock closes at or above $1.00 per share for a minimum of 10 consecutive business days.
The Company intends to meet the requirements for the Minimum Bid Rule in the future. This may include seeking the approval of stockholders at the Company’s next annual meeting to effect a reverse stock split.
11
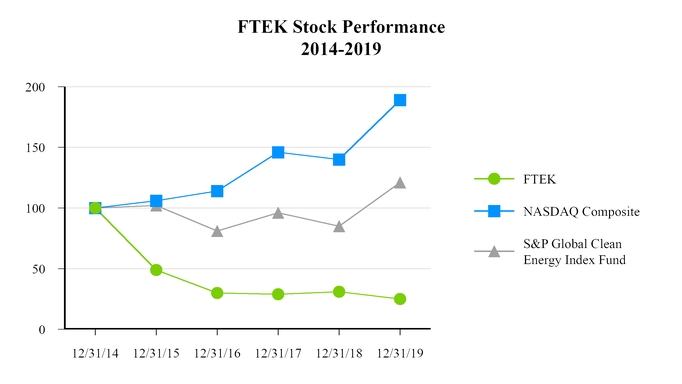
Performance Graph
The following line graph compares our total return to stockholders per common share for the five years ended December 31, 2019 to that of the NASDAQ Composite Index and the S&P Global Clean Energy Index Fund for the period December 31, 2014 through December 31, 2019. The graph tracks the performance of a $100 investment in the Company's common stock and in each of the indexes (with the reinvestment of all dividends) on December 31, 2014.
12
ITEM 6 - SELECTED FINANCIAL DATA
Selected financial data are presented below as of the end of and for each of the fiscal years in the five-year period ended December 31, 2019. The selected financial data should be read in conjunction with the audited consolidated financial statements as of and for the year ended December 31, 2019, and “Management’s Discussion and Analysis of Financial Condition and Results of Operations” included elsewhere in this report and the schedules thereto.
For the years ended December 31 | ||||||||||||||||||||
CONSOLIDATED STATEMENT OF OPERATIONS DATA | 2019 | 2018 | 2017 | 2016 | 2015 | |||||||||||||||
(in thousands of dollars, except for share and per-share data) | ||||||||||||||||||||
Revenues | $ | 30,467 | $ | 56,535 | $ | 45,166 | $ | 55,161 | $ | 73,664 | ||||||||||
Cost of sales | 19,637 | 36,471 | 27,144 | 36,367 | 45,107 | |||||||||||||||
Selling, general and administrative | 17,191 | 18,564 | 20,933 | 25,564 | 30,897 | |||||||||||||||
Restructuring charge | 625 | — | 119 | 1,428 | 219 | |||||||||||||||
Research and development | 1,127 | 1,073 | 1,070 | 1,752 | 1,447 | |||||||||||||||
Impairment and abandonment charges | 127 | 317 | 2,965 | 2,074 | 1,425 | |||||||||||||||
Operating (loss) income from continuing operations | (8,240 | ) | 110 | (7,065 | ) | (12,024 | ) | (5,431 | ) | |||||||||||
Net loss from continuing operations | (7,851 | ) | 85 | (6,535 | ) | (14,588 | ) | (9,554 | ) | |||||||||||
Loss from discontinued operations | (1 | ) | (113 | ) | (3,914 | ) | (2,800 | ) | (2,826 | ) | ||||||||||
Net loss | $ | (7,852 | ) | $ | (28 | ) | $ | (10,449 | ) | $ | (17,388 | ) | $ | (12,380 | ) | |||||
Net loss per common share: | ||||||||||||||||||||
Basic | ||||||||||||||||||||
Continuing operations | $ | (0.32 | ) | $ | — | $ | (0.28 | ) | $ | (0.62 | ) | $ | (0.41 | ) | ||||||
Discontinued operations | — | — | (0.16 | ) | (0.12 | ) | (0.13 | ) | ||||||||||||
Basic net loss per common share | $ | (0.32 | ) | $ | — | $ | (0.44 | ) | $ | (0.74 | ) | $ | (0.54 | ) | ||||||
Diluted | ||||||||||||||||||||
Continuing operations | $ | (0.32 | ) | $ | — | $ | (0.28 | ) | $ | (0.62 | ) | $ | (0.41 | ) | ||||||
Discontinued operations | — | — | (0.16 | ) | (0.12 | ) | (0.13 | ) | ||||||||||||
Diluted net loss per common share | $ | (0.32 | ) | $ | — | $ | (0.44 | ) | $ | (0.74 | ) | $ | (0.54 | ) | ||||||
Weighted-average basic shares outstanding | 24,202,000 | 24,164,000 | 23,872,000 | 23,365,000 | 23,101,000 | |||||||||||||||
Weighted-average diluted shares outstanding | 24,202,000 | 24,164,000 | 23,872,000 | 23,365,000 | 23,101,000 | |||||||||||||||
December 31 | ||||||||||||||||||||
CONSOLIDATED BALANCE SHEET DATA | 2019 | 2018 | 2017 | 2016 | 2015 | |||||||||||||||
(in thousands of dollars) | ||||||||||||||||||||
Working capital | $ | 16,698 | $ | 23,556 | $ | 18,025 | $ | 26,585 | $ | 35,865 | ||||||||||
Total assets | 32,224 | 51,719 | 50,484 | 57,788 | 76,011 | |||||||||||||||
Long-term obligations | 286 | 335 | 420 | 346 | 501 | |||||||||||||||
Total liabilities | 6,049 | 17,667 | 16,312 | 15,099 | 17,740 | |||||||||||||||
Stockholders’ equity (1) | 26,175 | 34,052 | 34,172 | 42,689 | 58,271 | |||||||||||||||
Notes:
(1) | Stockholders’ equity includes the principal amount of nil coupon non-redeemable perpetual loan notes. See Note 7 to the consolidated financial statements. |
13
ITEM 7 - MANAGEMENT’S DISCUSSION AND ANALYSIS OF FINANCIAL CONDITION AND RESULTS OF OPERATIONS (amounts in thousands of dollars)
Background
We have two broad technology segments that provide advanced engineered solutions to meet the pollution control, efficiency improvement and operational optimization needs of energy-related facilities worldwide. They are as follows:
Air Pollution Control Technologies
The Air Pollution Control technology segment includes technologies to reduce NOx emissions in flue gas from boilers, incinerators, furnaces and other stationary combustion sources. These include Low and Ultra Low NOx Burners (LNB and ULNB), OFA systems, NOxOUT and HERT SNCR systems, and ASCR systems. The ASCR system includes ULNB, OFA, and SNCR components, along with a downsized SCR catalyst, AIG, and GSG systems to provide high NOx reductions at significantly lower capital and operating costs than conventional SCR systems. The NOxOUT CASCADE and NOxOUT-SCR processes are basic types of ASCR systems, using just SNCR and SCR catalyst components. ULTRA technology creates ammonia at a plant site using safe urea for use with any SCR application. Our ESP products and services include complete turnkey ESP retrofits and related services. Flue Gas Conditioning systems are chemical injection systems offered in markets outside the U.S. and Canada to enhance electrostatic precipitator and fabric filter performance in controlling particulate emissions. We distribute our products through our direct sales force and third-party sales agents.
FUEL CHEM Technologies
The FUEL CHEM technology segment, which uses chemical processes in combination with advanced CFD and CKM boiler modeling, for the control of slagging, fouling, corrosion, opacity and other sulfur trioxide-related issues in furnaces and boilers through the addition of chemicals into the furnace using TIFI Targeted In-Furnace Injection technology. Fuel Tech sells its FUEL CHEM program through its direct sales force and agents to industrial and utility power-generation facilities. FUEL CHEM programs have been installed on combustion units in North America, Europe, China, and India, treating a wide variety of solid and liquid fuels, including coal, heavy oil, biomass and municipal waste. The FUEL CHEM program improves the efficiency, reliability and environmental status of plants operating in the electric utility, industrial, pulp and paper, waste-to-energy, university and district heating markets and offers numerous operational, financial and environmental benefits to owners of boilers, furnaces and other combustion units.
The key market dynamic for both technology segments is the continued use of fossil fuels, especially coal, as the principal fuel source for global electricity production. Coal currently accounts for approximately 25% of all U.S. electricity generation and roughly 59% of Chinese electricity generation. Major coal consumers include China, the United States and India.
Critical Accounting Policies and Estimates
The consolidated financial statements are prepared in accordance with accounting principles generally accepted in the United States of America, which require us to make estimates and assumptions. We believe that of our accounting policies (see Note 1 to the consolidated financial statements), the following involve a higher degree of judgment and complexity and are deemed critical. We routinely discuss our critical accounting policies with the Audit Committee of the Board of Directors.
Revenue Recognition
Change in Accounting Policy
On January 1, 2018, we adopted ASC 606 "Revenue from Contracts with Customers" ("ASC 606") using the modified retrospective method applied to those contracts which were not completed as of January 1, 2018. Results for reporting periods beginning after January 1, 2018 are presented under ASC 606, while prior period amounts are not adjusted and continue to be reported in accordance with our legacy accounting under Accounting Standards Codification Topic 605: Revenue Recognition (ASC 605).
For the years ended prior to January 1, 2018
Revenues from the sales of chemical products are recorded when title transfered, either at the point of shipment or at the point of destination, depending on the contract with the customer in accordance with ASC 605. We used the percentage of completion method of accounting for equipment construction, equipment supply and license contracts that are sold within the Air Pollution Control technology segment. Under the percentage of completion method, revenues are recognized as work is performed based
14
on the relationship between actual construction costs incurred and total estimated costs at completion. Construction costs include all direct costs such as materials, labor, and subcontracting costs, and indirect costs allocable to the particular contract such as indirect labor, tools and equipment, and supplies. Revisions in completion estimates and contract values are made in the period in which the facts giving rise to the revisions become known and can influence the timing of when revenues are recognized under the percentage of completion method of accounting. Such revisions have historically not had a material effect on the amount of revenue recognized. Provisions are made for estimated losses on uncompleted contracts in the period in which such losses are determined.
Years beginning after January 1, 2018
The Company recognizes revenue when control of the promised goods or services is transferred to our customers, in amount that reflects the consideration we expect to be entitled to in exchange for those goods or services. Fuel Tech’s sales of products to customers represent single performance obligations, which are not impacted upon the adoption of ASC 606. The majority of our contracts have a single performance obligation as the promise to transfer the individual goods or services is not separately identifiable from other promises in the contracts and, therefore, not distinct. Revenue is measured as the amount of consideration we expect to receive in exchange for transferring goods or providing services. Sales, value add, and other taxes we collect concurrent with revenue-producing activities are excluded from revenue.
FUEL CHEM
Revenues from the sale of chemical products are recognized when control transfers to customer upon shipment or delivery of the product based on the applicable shipping terms. We generally recognize revenue for these arrangements at a point in time based on our evaluation of when the customer obtains control of the promised goods or services.
Air Pollution Control Technology
Fuel Tech’s APC contracts are typically six to eighteen months in length. A typical contract will have three or four critical operational measurements that, when achieved, serve as the basis for us to invoice the customer via progress billings. At a minimum, these measurements will include the generation of engineering drawings, the shipment of equipment and the completion of a system performance test.
As part of most of its contractual APC project agreements, Fuel Tech will agree to customer-specific acceptance criteria that relate to the operational performance of the system that is being sold. These criteria are determined based on modeling that is performed by Fuel Tech personnel, which is based on operational inputs that are provided by the customer. The customer will warrant that these operational inputs are accurate as they are specified in the binding contractual agreement. Further, the customer is solely responsible for the accuracy of the operating condition information; typically all performance guarantees and equipment warranties granted by us are voidable if the operating condition information is inaccurate or is not met.
Since control transfers over time, revenue is recognized based on the extent of progress towards completion of the single performance obligation. Fuel Tech uses the cost-to-cost input measure of progress for our contracts since it best depicts the transfer of assets to the customer which occurs as we incur costs on our contracts. Under the cost-to-cost input measure of progress, the extent of progress towards completion is measured based on the ratio of costs incurred to date to the total estimated costs at completion of the performance obligation. Revenues are recorded proportionally as costs are incurred. Costs to fulfill include all internal and external engineering costs, equipment charges, inbound and outbound freight expenses, internal and site transfer costs, installation charges, purchasing and receiving costs, inspection costs, warehousing costs, project personnel travel expenses and other direct and indirect expenses specifically identified as project- or product-line related, as appropriate (e.g. test equipment depreciation and certain insurance expenses).
Fuel Tech has installed over 1,100 units with APC technology and normally provides performance guarantees to our customers based on the operating conditions for the project. As part of the project implementation process, we perform system start-up and optimization services that effectively serve as a test of actual project performance. We believe that this test, combined with the accuracy of the modeling that is performed, enables revenue to be recognized prior to the receipt of formal customer acceptance.
As of December 31, 2019 we had three construction contracts in progress that were identified as loss contracts and a provision for losses of $26 was recorded in other accrued liabilities on the consolidated balance sheet. As of December 31, 2018, we had five construction contracts in progress that were identified as loss contracts and a provision for losses of $123 was recorded in other accrued liabilities on the consolidated balance sheet.
15
The timing of revenue recognition, billings and cash collections results in billed accounts receivable, unbilled receivables (contract assets), and customer advances and deposits (contract liabilities) on the consolidated balance sheets. In our Air Pollution Control Technology segment, amounts are billed as work progresses in accordance with agreed-upon contractual terms. Generally, billing occurs subsequent to revenue recognition, resulting in contract assets. These assets are reported on the consolidated balance sheet on a contract-by-contract basis at the end of each reporting period. At December 31, 2019 and 2018, contract assets were approximately $1,857 and $5,540, respectively, and are included in accounts receivable on the consolidated balance sheets.
However, the Company will periodically bill in advance of costs incurred before revenue is recognized, resulting in contract liabilities. These liabilities are reported on the consolidated balance sheet on a contract-by-contract basis at the end of each reporting period. Contract liabilities were $712 and $1,234 at December 31, 2019 and 2018, respectively, and are included in other accrued liabilities on the consolidated balance sheets.
Allowance for Doubtful Accounts
The allowance for doubtful accounts is management’s best estimate of the amount of credit losses in accounts receivable. In order to control and monitor the credit risk associated with our customer base, we review the credit worthiness of customers on a recurring basis. Factors influencing the level of scrutiny include the level of business the customer has with us, the customer’s payment history and the customer’s financial stability. Receivables are considered past due if payment is not received by the date agreed upon with the customer, which is normally 30 days. Representatives of our management team review all past due accounts on a weekly basis to assess collectability. At the end of each reporting period, the allowance for doubtful accounts balance is reviewed relative to management’s collectability assessment and is adjusted if deemed necessary through a corresponding charge or credit to bad debts expense, which is included in selling, general, and administrative expenses in the consolidated statements of operations. Bad debt write-offs are made when management believes it is probable a receivable will not be recovered.
Inventories
Inventories consist primarily of spare parts and are stated at the lower of cost or net realizable value, using the weighted-average cost method. Usage is recorded in cost of sales in the period that parts were issued to a project or used to service equipment. Inventories are periodically evaluated to identify obsolete or otherwise impaired parts and are written off when management determines usage is not probable. The Company estimates the balance of excess and obsolete inventory by analyzing inventory by age using last used and original purchase date and existing sales pipeline for which the inventory could be used.
Assessment of Potential Impairments of Goodwill and Intangible Assets
Goodwill is not amortized, but rather is reviewed annually (in the fourth quarter) or more frequently if indicators arise, for impairment. We do not have any indefinite-lived intangible assets other than goodwill. Such indicators include a decline in expected cash flows, a significant adverse change in legal factors or in the business climate, unanticipated competition, a decrease in our market capitalization to an amount less than the carrying value of our assets, or slower growth rates, among others.
Goodwill is allocated among and evaluated for impairment at the reporting unit level, which is defined as an operating segment or one level below an operating segment. We have two reporting units: the FUEL CHEM segment and the APC technology segment.
Our evaluation of goodwill impairment involves first assessing qualitative factors to determine whether it is more likely than not that the fair value of a reporting unit is less than its carrying amount. We may bypass this qualitative assessment, or determine that based on our qualitative assessment considering the totality of events and circumstances including macroeconomic factors, industry and market considerations, current and projected financial performance, a sustained decrease in our share price, or other factors, that additional impairment analysis is necessary. This additional analysis involves comparing the current fair value of a reporting unit to its carrying value. Fuel Tech uses a discounted cash flow (DCF) model to determine the current fair value of its FUEL CHEM reporting unit as this methodology was deemed to best quantify the present values of our expected future cash flows and yield a fair value that should be in line with the aggregate market value placed on the outstanding number of Common Shares as reflected by the current stock price multiplied by the outstanding common shares. A number of significant assumptions and estimates are involved in the application of the DCF model to forecast operating cash flows, including markets and market share, sales volumes and prices, costs to produce and working capital changes. Events outside our control, specifically market conditions that impact revenue growth assumptions, could significantly impact the fair value calculated. Management considers historical experience and all available information at the time the fair values of its reporting units are estimated. However, actual fair values that could be realized in an actual transaction may differ from those used to evaluate the impairment of goodwill.
16
The application of our DCF model in estimating the fair value of each reporting segment is based on the ‘net asset’ approach to business valuation. In using this approach for each reportable segment, we forecast segment revenues and expenses out to perpetuity and then discount the resulting cash flows to their present value using an appropriate discount rate. The forecast considers, among other items, the current and expected business environment, expected changes in the fixed and variable cost structure as the business grows, and a revenue growth rate that we feel is both achievable and sustainable. The discount rate used is composed of a number of identifiable risk factors, including equity risk, company size, and certain company specific risk factors such as our debt-to-equity ratio, among other factors, that when added together, results in a total return that a prudent investor would demand for an investment in our company.
In the event the estimated fair value of a reporting unit per the DCF model is less than the carrying value, additional analysis would be required. The additional analysis would compare the carrying amount of the reporting unit’s goodwill with the implied fair value of that goodwill. The implied fair value of goodwill is the excess of the fair value of the reporting unit over the fair values assigned to all of the assets and liabilities of that unit as if the reporting unit was acquired in a business combination and the fair value of the reporting unit represented the purchase price.
In January 2017, the FASB issued ASU 2017-04, Intangibles-Goodwill and Other (Topic 350): Simplifying the Test for Goodwill Impairment. This ASU is meant to simplify how an entity is required to test goodwill for impairment by eliminating Step 2 from the goodwill impairment test. Step 2 measures a goodwill impairment loss by comparing the implied fair value of a reporting unit’s goodwill with the carrying amount of that goodwill. The Company early adopted ASU 2017-04 on October 1, 2018 for the annual goodwill impairment test completed during the fourth quarter which simplified the test by comparing the implied fair value of the reporting unit's goodwill with the carrying amount of goodwill and eliminating Step 2.
Fuel Tech performed its annual goodwill impairment analysis for each of its reporting units as of October 1, 2019 and determined that no impairment of goodwill existed within the FUEL CHEM technology segment.
Building Impairment
During the second quarter of 2017, we experienced a decrease in our stock price that caused our market capitalization to fall below the equity value on our consolidated balance sheet, which resulted in an indicator of impairment. This, along with an overall slowdown in APC technology and corresponding downward adjustments to our financial forecasts, was considered during a detailed evaluation of the fair value of our reporting units. As a result of these triggering events, Fuel Tech performed a long-lived asset impairment analysis for each of the reporting units as of April 1, 2017. Based on this evaluation, we determined that our APC segment failed the first step of our impairment analysis because the estimated gross cash flows and fair value of the reporting unit was less than its carrying value, thus requiring additional analysis of the segment. However, no impairment resulted as the fair values of the underlying patents and equipment equaled or exceeded their carrying values. We evaluated the corporate asset group, which contains our corporate headquarters office building and land in Warrenville, Illinois, using the residual method and management determined that there was not adequate gross cash flows to support the carrying value. After obtaining an appraisal from a third-party appraiser, management determined that the carrying value of the office building and land exceeded the fair value and recorded an impairment charge of $2,965 for the year ended December 31, 2017.
Impairment of Long-Lived Assets and Amortizable Intangible Assets
Long-lived assets, including property, plant and equipment (PP&E) and intangible assets, are reviewed for impairment when events and circumstances indicate that the carrying amount of the assets (or asset group) may not be recoverable. If impairment indicators exist, we perform a more detailed analysis and an impairment loss is recognized when estimated future undiscounted cash flows expected to result from the use of the asset (or asset group) and its eventual disposition are less than the carrying amount. This process of analyzing impairment involves examining the operating condition of individual assets (or asset group) and estimating a fair value based upon current condition, relevant market factors and remaining estimated operational life compared to the asset’s remaining depreciable life. Quoted market prices and other valuation techniques are used to determine expected cash flows. Due to the existence of impairment indicators as more fully described in Note 1 to our consolidated financial statements, we performed a more detailed analysis of potential long-lived and intangible asset impairment in the APC technology asset group during the fourth quarter of 2019 using the aforementioned undiscounted cash flows analysis.
During the second and third quarters of 2019, the Company recorded an abandonment charge of $127 principally associated with the remaining patent assets in China which the Company elected to not maintain and abandon as a result of the planned suspension of the APC business operation in China. The abandonment charge was calculated by determining the net book values of the abandoned patent assets by deducting the accumulated amortization from the acquisition cost. The abandonment charge is included in “Intangible assets abandonment and building impairment” line in the accompanying Consolidated Statements of Operations for the year then ended December 31, 2019.
17
In the second quarter of 2018, the Company recorded an abandonment charge of $317 associated with certain international patent assets which the Company elected to not maintain and abandon in certain international locations due to limited business opportunities in those regions. The abandonment charge was calculated by determining the net book values of the abandoned patent assets by deducting the accumulated amortization from the acquisition cost. The abandonment charge of $317 is included in “Intangible assets abandonment and building impairment” line in the accompanying Consolidated Statements of Operations for the year ended December 31, 2018.
A significant portion of our property and equipment is comprised of assets deployed at customer locations relating to our FUEL CHEM technology asset group, and due to the shorter-term duration over which this equipment is depreciated, the likelihood of impairment is mitigated. The discontinuation of a FUEL CHEM program at a customer site would most likely result in the re-deployment of all or most of the affected assets to another customer location rather than an impairment.
Valuation Allowance for Deferred Income Taxes
Deferred tax assets represent deductible temporary differences and net operating loss and tax credit carryforwards. A valuation allowance is recognized if it is more likely than not that some portion of the deferred tax asset will not be realized. At the end of each reporting period, management reviews the realizability of the deferred tax assets. As part of this review, we consider if there are taxable temporary differences that could generate taxable income in the future, if there is the ability to carry back the net operating losses or credits, if there is a projection of future taxable income, and if there are any tax planning strategies that can be readily implemented. As required by ASC 740 "Income Taxes", a valuation allowance must be established when it is more likely than not that all or a portion of a deferred tax asset will not be realized. This assessment resulted in a valuation allowance on our deferred tax assets of $15,394, $13,044 and $12,234 for the years ended December 31, 2019, 2018 and 2017 respectively.
Stock-Based Compensation
We recognize compensation expense for employee equity awards ratably over the requisite service period of the award, adjusted for estimated forfeitures.
We utilize the Black-Scholes option-pricing model to estimate the fair value of stock option awards. Determining the fair value of stock options using the Black-Scholes model requires judgment, including estimates for (1) risk-free interest rate - an estimate based on the yield of zero-coupon treasury securities with a maturity equal to the expected life of the option; (2) expected volatility - an estimate based on the historical volatility of our Common Shares for a period equal to the expected life of the option; and (3) expected life of the option - an estimate based on historical experience including the effect of employee terminations.
In addition, we utilize a Monte Carlo valuation pricing model to determine the fair value of certain restricted stock units (RSUs) that contain market conditions. Determining the fair value of these RSUs requires judgment and involves simulating potential future stock prices based on estimates for the risk-free interest rate, stock volatility, and correlations between our stock price and the stock prices of a peer group of companies. If any of these assumptions differ significantly from actual results, stock-based compensation expense could be impacted. There were no stock options or RSUs granted during the year ended December 31, 2019.
Recently Adopted Accounting Standards
Leases
On January 1, 2019, we adopted ASC 842 using the modified retrospective method outlined in ASU 2018-11, “Leases (Topic 842) Targeted Improvements.” Refer to Note 10 for further details regarding the effect of adoption. We determine if an arrangement is a lease at inception. Operating leases are included in right-of-use ("ROU") operating lease assets, operating lease liabilities - current, and operating lease liabilities - non-current on our Consolidated Balance Sheets.
Operating lease ROU assets and operating lease liabilities are recognized based on the present value of the future minimum lease payments over the lease term at commencement date. As most of our leases do not provide an implicit rate, we use our incremental borrowing rate based on the information available at commencement date in determining the present value of future payments. The operating lease ROU asset also includes any lease payments made and excludes lease incentives and initial direct costs incurred. Our lease terms may include options to extend or terminate the lease when it is reasonably certain that we will exercise that option. Lease expense for minimum lease payments is recognized on a straight-line basis over the lease term.
18
We have lease agreements with lease and non-lease components, which we elected the practical expedient to not separate lease and non-lease components for the majority of our leases. For certain equipment leases, such as vehicles, we account for the lease and non-lease components as a single lease component. We also elected the practical expedient to keep leases with an initial term of 12 months or less off of the consolidated balance sheet.
Revenue
In May 2014, the Financial Accounting Standards Board (FASB) issued ASU 2014-09 "Revenue from Contracts with Customers" (ASC 606). These changes created a comprehensive framework for all entities in all industries to apply in the determination of when to recognize revenue, and, therefore, supersede virtually all existing revenue recognition requirements and guidance. This framework is expected to result in less complex guidance in application while providing a consistent and comparable methodology for revenue recognition. The core principle of the guidance is that an entity should recognize revenue to depict the transfer of promised goods or services to customers in an amount that reflects the consideration to which the entity expects to be entitled in exchange for those goods or services. To achieve this principle, an entity should apply the following steps: (i) identify the contract(s) with a customer, (ii) identify the performance obligations in the contract(s), (iii) determine the transaction price, (iv) allocate the transaction price to the performance obligations in the contract(s), and (v) recognize revenue when, or as, the entity satisfies a performance obligation. The new standard also requires additional financial statement disclosures that will enable users to understand the nature, amount, timing and uncertainty of revenue and cash flows relating to customer contracts. In August 2015, the FASB approved a one-year deferral to January 1, 2018. The Company adopted the standard on January 1, 2018 using the modified retrospective transition method. See Note 3, Revenue Recognition, for further discussion.
Other Accounting Pronouncements
In November 2016, the FASB issued ASU 2016-18, Statement of Cash Flows (Topic 230): Restricted Cash (a consensus of the FASB Emerging Issues Task Force). The amendments in this Update require that a statement of cash flows explain the change during the period in the total of cash, cash equivalents, and amounts generally described as restricted cash or restricted cash equivalents. Accordingly, restricted cash will be included with cash and cash equivalents when reconciling the beginning-of period and end-of-period total amounts shown on the Consolidated Statement of Cash Flows. The Company adopted ASU 2016-18 beginning on January 1, 2018 and adopted the standard using a retrospective approach.
In January 2017, the FASB issued ASU 2017-04, Intangibles-Goodwill and Other (Topic 350): Simplifying the Test for Goodwill Impairment. This ASU is meant to simplify how an entity is required to test goodwill for impairment by eliminating Step 2 from the goodwill impairment test. Step 2 measures a goodwill impairment loss by comparing the implied fair value of a reporting unit’s goodwill with the carrying amount of that goodwill. ASU 2017-04 is effective for fiscal years beginning after December 15, 2019, with early adoption permitted for interim or annual goodwill impairment tests performed on testing dates after January 1, 2017. The Company early adopted ASU 2017-04 on October 1, 2018 for the annual goodwill impairment test completed during the fourth quarter which simplified the test by comparing the implied fair value of the reporting unit's goodwill with the carrying amount of goodwill and eliminating Step 2. The adoption did not have a material impact on the Company’s consolidated financial statements.
Recently Issued Accounting Pronouncements
In December 2019, the FASB issued ASU 2019-12, “Income Taxes (Topic 740): Simplifying the Accounting for Income Taxes.” The new rules reduce complexity by removing specific exceptions to general principles related to intraperiod tax allocations, ownership changes in foreign investments, and interim period income tax accounting for year-to-date losses that exceed anticipated losses. The new rules also simplify accounting for franchise taxes that are partially based on income, transactions with a government that result in a step up in the tax basis of goodwill, separate financial statements of legal entities that are not subject to tax, and enacted changes in tax laws in interim periods. The new rules will be effective for the Company in the first quarter of 2021, with early adoption permitted. The ASU permits either a retrospective basis or a modified retrospective transition approach. The Company is currently in the process of evaluating the impact of adoption of the new rules on the Company’s financial condition, results of operations, cash flows and disclosures.
In June 2016, the FASB issued ASU 2016-13, Financial Instruments - Credit Losses (Topic 326): Measurement of Credit Losses on Financial Instruments, which amends the current accounting guidance and requires the measurement of all expected losses based on historical experience, current conditions and reasonable and supportable forecasts. For trade receivables, loans, and other financial instruments, we will be required to use a forward-looking expected loss model rather than the incurred loss model for recognizing credit losses which reflects losses that are probable. The standard will become effective for interim and annual periods beginning after December 15, 2019, with early adoption permitted. Application of the amendments is through a
19
cumulative-effect adjustment to retained earnings as of the effective date. The Company is currently in the process of evaluating the impact of adoption, but we do not believe the adoption of this standard will have a material impact on our financial statements.
2019 versus 2018
Highlights for the year ended December 31, 2019, compared to 2018:
For the years ended December 31, | ||||||||||||
2019 | 2018 | Change | ||||||||||
Revenues | $ | 30,467 | $ | 56,535 | $ | (26,068 | ) | |||||
Costs and expenses: | ||||||||||||
Cost of sales | 19,637 | 36,471 | (16,834 | ) | ||||||||
Selling, general and administrative | 17,191 | 18,564 | (1,373 | ) | ||||||||
Restructuring charge | 625 | — | 625 | |||||||||
Research and development | 1,127 | 1,073 | 54 | |||||||||
Intangible assets abandonment and building impairment | 127 | 317 | (190 | ) | ||||||||
Total Costs and Expenses | 38,707 | 56,425 | (17,718 | ) | ||||||||
Operating income (loss) from continuing operations | (8,240 | ) | 110 | (8,350 | ) | |||||||
Interest income | 41 | 6 | 35 | |||||||||
Foreign exchange gain | 370 | — | 370 | |||||||||
Other expense | (8 | ) | 2 | (10 | ) | |||||||
Income (loss) from continuing operations before income taxes | (7,837 | ) | 118 | (7,955 | ) | |||||||
Income tax benefit (expense) | (14 | ) | (33 | ) | 19 | |||||||
Net income (loss) from continuing operations | (7,851 | ) | 85 | (7,936 | ) | |||||||
Loss from discontinued operations (net of income tax benefit of $0 in 2019 and 2018) | (1 | ) | (113 | ) | 112 | |||||||
Net loss | $ | (7,852 | ) | $ | (28 | ) | $ | (7,824 | ) | |||
Revenues
Revenues for the years ended December 31, 2019 and 2018 were $30,467 and $56,535, respectively. The year-over-year decrease of $26,068 or 46%, was driven by decreased revenue in both APC and FUEL CHEM technology segments in our United States (U.S.) operations. Our U.S. revenues decreased by $18,005 or 41% from $43,887 to $25,882, and our international revenues decreased by $8,063 or 64% from $12,648 to $4,585.
Revenues for the APC technology segment were $14,082 for the year ended December 31, 2019, a decrease of $24,335, or 63%, versus fiscal 2018. The decrease in APC revenue for the twelve month period ending December 31, 2019 in comparison to prior year amount was principally related to the timing of project execution and the decline in backlog of $9.7 million and $12.4 million,
for the years ended December 31, 2019 and 2018 respectively.
Revenues for the FUEL CHEM technology segment for the year ended December 31, 2019 were $16,385, a decrease of $1,733, or 10% versus fiscal 2018. We remain focused on attracting new customers in our FUEL CHEM business, for both coal and non-coal applications, but our ability to attract new coal customers continues to be affected by the soft electric demand market and fuel switching as a result of low natural gas prices.
Cost of sales and gross margin
Consolidated cost of sales for the years ended December 31, 2019 and 2018 were $19,637 and $36,471, respectively. Consolidated gross margin percentages for the years ended December 31, 2019 and 2018 were 36% and 35%, respectively. The gross margins for the APC technology segment decreased to 20% in 2019 from 29% in 2018. The overall decrease in gross margin in the APC technology segment from 2018 to 2019 is primarily due to project mix, timing of project execution and $2,241 of remediation costs incurred during 2019 to address non-conformance issues under the terms of a contract with a U.S. customer. Gross margin percentage for the FUEL CHEM technology segment decreased to 49% from 50% for the years ended December 31, 2019 and 2018.
Selling, general and administrative
20
Selling, general and administrative (SG&A) expenses for the years ended December 31, 2019 and 2018 were $17,191 and $18,564, respectively. The decrease of $1,373 or 7%, is primarily attributed to the following:
• | A decrease in employee related costs of $616 |
• | A decrease in office and administrative costs relating to our foreign subsidiaries of $788 primarily related to the suspension of the APC business in Beijing, China |
• | An increase in other administrative costs of $31 |
Restructuring charge
Restructuring costs were $625 and $0 for the years ended December 31, 2019 and 2018. On January 18, 2019, the Company announced a planned suspension the APC business operation in China. This action is part of Fuel Tech’s ongoing operational improvement initiatives designed to prioritize resource allocation, reduce costs, and drive profitability for the Company on a global basis. The transition associated with the suspension of the APC business includes staff rationalization, supplier and partner engagement, and the monetization of certain assets. See Note 16, Restructuring Activities, for further discussion.
Research and development
Research and development (“R&D”) expenses were $1,127 and $1,073 for the years ended December 31, 2019 and 2018, respectively.
Intangible assets abandonment and building impairment
During the second and third quarter of 2019, the Company recorded an abandonment charge of $127 principally associated with the remaining patent assets in China which the Company elected to not maintain and abandon as a result of the planned suspension of the APC business operation in China. The abandonment charge was calculated by determining the net book values of the abandoned patent assets by deducting the accumulated amortization from the acquisition cost. The abandonment charge is included in “Intangible assets abandonment and building impairment” line in the accompanying Consolidated Statements of Operations for the year then ended December 31, 2019.
In the second quarter of 2018, Fuel Tech recorded an abandonment charge of $317 associated with certain international patent assets which the Company elected to not maintain and abandon in certain international locations due to limited business opportunities in those regions. The abandonment charge was calculated by determining the net book values of the abandoned patent assets by deducting the accumulated amortization from the acquisition cost. The abandonment charge of $317 is included in “Intangible assets abandonment and building impairment” line in the accompanying Consolidated Statements of Operations for the twelve months ended December 31, 2019.
Interest income
Interest income for the year ended December 31, 2019 increased by $35 to $41 versus $6 in 2018.
Foreign exchange gain
Foreign exchange gain for the year ended December 31, 2019 of $370 primarily relates to realized foreign currency gains associated with the planned liquidation of the subsidiary in Chile.
Other expense
Other expenses remained consistent for the years ended December 31, 2019 and 2018 of $(8) from $2.
Income tax benefit (expense)
For the year ended December 31, 2019, we recorded an income tax expense of $14 on pre-tax loss of $7,837. Our effective tax rates were 0.2% and 676.3% for the years ended December 31, 2019 and 2018, respectively. The effective tax rate for the year-ended December 31, 2019, differed from the federal statutory rate of 21% as a result of establishing a deferred tax liability associated with a certain book-to-tax timing difference. For the year ended December 31, 2018, we recorded an income tax benefit of $33 on pre-tax loss of $118. The effective tax rate for the year-ended December 31, 2018 differed from the federal statutory rate of 34% as a result of net operating losses generated in the United States, China, and Italy, which were offset by establishment of full valuation allowances. The full valuation allowances previously established apply for the year ended December 31, 2019 as well.
Loss from discontinued operations
The activity of the Fuel Conversion discontinued operations consisted of Research and Development, severance, an impairment charge and other costs for the years ended December 31, 2019 and 2018 of $1 and $113, respectively. The activity of the Fuel Conversion discontinued operations consisted primarily of storage costs for holding the equipment at a third-party location totaling $21 for the year ended December 31, 2019 and the gain on sale of $20 from the sale of the remaining Fuel Conversion Assets Held for Sale recorded in discontinued operations. The loss from discontinued operations in the Consolidated Statement of
21
Operations for the year ended December 31, 2018 includes an impairment charge related to the Carbonite patent assets of $56 during the second quarter of 2018 as a result of not being able to reach an agreement with a third-party to acquire or license the Carbonite technology in combination with the sale of certain equipment included in Assets held for sale.
2018 versus 2017
Highlights for the year ended December 31, 2018, compared to 2017:
For the years ended December 31, | ||||||||||||
2018 | 2017 | Change | ||||||||||
Revenues | $ | 56,535 | $ | 45,166 | $ | 11,369 | ||||||
Costs and expenses: | ||||||||||||
Cost of sales | 36,471 | 27,144 | 9,327 | |||||||||
Selling, general and administrative | 18,564 | 20,933 | (2,369 | ) | ||||||||
Restructuring charge | — | 119 | (119 | ) | ||||||||
Research and development | 1,073 | 1,070 | 3 | |||||||||
Intangible assets abandonment and building impairment | 317 | 2,965 | (2,648 | ) | ||||||||
Total Costs and Expenses | 56,425 | 52,231 | 4,194 | |||||||||
Operating income (loss) from continuing operations | 110 | (7,065 | ) | 7,175 | ||||||||
Interest income | 6 | 10 | (4 | ) | ||||||||
Foreign exchange gain | — | — | — | |||||||||
Other expense | 2 | (60 | ) | 62 | ||||||||
Income (loss) from continuing operations before income taxes | 118 | (7,115 | ) | 7,233 | ||||||||
Income tax benefit (expense) | (33 | ) | 580 | (613 | ) | |||||||
Net income (loss) from continuing operations | 85 | (6,535 | ) | 6,620 | ||||||||
Loss from discontinued operations (net of income tax benefit of $0 in 2018 and 2017) | (113 | ) | (3,914 | ) | 3,801 | |||||||
Net loss | $ | (28 | ) | $ | (10,449 | ) | $ | 10,421 | ||||
Revenues
Revenues for the years ended December 31, 2018 and 2017 were $56,535 and $45,166, respectively. The year-over-year increase of $11,369 or 25%, was driven by increased revenue in both APC and FUEL CHEM technology segments in our United States (U.S.) operations. Our U.S. revenues increased by $14,377 or 49% from $29,510 to $43,887, and our international revenues decreased by $3,008 or 19% from $15,656 to $12,648.
Revenues for the APC technology segment were $38,417 for the year ended December 31, 2018, an increase of $10,609, or 38%, versus fiscal 2017. The increase in APC revenue for the twelve month period ending December 31, 2018 in comparison to prior year amount is related to the timing of project execution as a result of conversion of new orders announced during 2017 and 2018. Backlog for the years ended December 31, 2018 and 2017 was $12.4 million and $22.1 million, respectively.
Revenues for the FUEL CHEM technology segment for the year ended December 31, 2018 were $18,118, an increase of $760, or 4% versus fiscal 2017. We remain focused on attracting new customers in our FUEL CHEM business, for both coal and non-coal applications, but our ability to attract new coal customers continues to be affected by the soft electric demand market and fuel switching as a result of low natural gas prices.
Cost of sales and gross margin
Consolidated cost of sales for the years ended December 31, 2018 and 2017 were $36,471 and $27,144, respectively. Consolidated gross margin percentages for the years ended December 31, 2018 and 2017 were 35% and 40%, respectively. The gross margins for the APC technology segment decreased to 29% in 2018 from 34% in 2017. The overall decrease in gross margin in the APC technology segment from 2017 to 2018 is primarily due to project mix, timing of project execution and margin erosion on lower-margin projects being executed in foreign geographies, which will not recur. Gross margin percentage for the FUEL CHEM technology segment remained consistent at 50% for the years ended December 31, 2018 and 2017.
Selling, general and administrative
22
Selling, general and administrative (SG&A) expenses for the years ended December 31, 2018 and 2017 were $18,564 and $20,933, respectively. The decrease of $2,369 or 11%, is primarily attributed to the following:
• | A decrease in employee related costs of $1,004 |
• | A decrease in professional fees and consulting services of $438 |
• | A decrease in office and administrative costs relating to our foreign subsidiaries of $809 |
• | A decrease in other administrative costs, including depreciation and amortization of $118 |
Restructuring charge
Restructuring costs were $0 and $119 in connection with the workforce reduction for the years ended December 31, 2018 and 2017. See Note 15, Restructuring Activities, for further discussion.
Research and development
Research and development (“R&D”) expenses were $1,073 and $1,070 for the years ended December 31, 2018 and 2017, respectively.
Intangible assets abandonment and building impairment
In the second quarter of 2018, Fuel Tech recorded an abandonment charge of $317 associated with certain international patent assets which the Company elected to not maintain and abandon in certain international locations due to limited business opportunities in those regions. The abandonment charge was calculated by determining the net book values of the abandoned patent assets by deducting the accumulated amortization from the acquisition cost. The abandonment charge of $317 is included in “Intangible assets abandonment and building impairment” line in the accompanying Consolidated Statements of Operations for the twelve months ended December 31, 2018.
Interest income
Interest income for the year ended December 31, 2018 decreased by $4 to $6 versus $10 in 2017. Interest expense was $0 in both 2018 and 2017. Finally, the decrease in net other expenses to $2 from $60 in the prior year is due primarily to the impact of foreign exchange rates as it relates to settlement of balances denominated in foreign currencies, and certain other bank fees related to Letter of Credits.
Income tax benefit (expense)
For the year ended December 31, 2018, we recorded an income tax expense of $33 on pre-tax income of $118. Our effective tax rates were 676.3% and 4.5% for the years ended December 31, 2018 and 2017, respectively. The effective tax rate for the year-ended December 31, 2018, differed from the federal statutory rate of 21% as a result of establishing a deferred tax liability associated with a certain book-to-tax timing difference. For the year ended December 31, 2017, we recorded an income tax benefit of $580 on pre-tax loss of $7,115. The effective tax rate for the year-ended December 31, 2017 differed from the federal statutory rate of 34% as a result of net operating losses generated in the United States, China, and Italy, which were offset by establishment of full valuation allowances. The full valuation allowances previously established apply for the year ended December 31, 2019 as well.
Loss from discontinued operations
During the second quarter of 2017, the Company suspended all operations associated with the Fuel Conversion business segment. The activity of the Fuel Conversion discontinued operations consisted of Research and Development, severance and other costs for the for the year ended December 31, 2018 and 2017 of $113 and $3,914, respectively. The loss from discontinued operations in the Consolidated Statement of Operations for the year ended December 31, 2018 includes an impairment charge related to the Carbonite patent assets of $56 as a result of not being able to reach an agreement with a third-party to acquire or license the Carbonite technology in combination with the sale of certain equipment included in Assets held for sale. The Fuel Conversion business segment had no revenues associated with it. The overall decline in the discontinued operations for the year ended December 31, 2018 in comparison to the same periods in 2017 is due to the overall wind-down of operations for the Fuel Conversion discontinued operations.
Liquidity and Sources of Capital
At December 31, 2019, we had cash and cash equivalents of $10,914 (excluding restricted cash of $2,587) and working capital of $16,698 versus cash and cash equivalents of $12,039 (excluding restricted cash of $6,020) and working capital of $23,556 at December 31, 2018.
Operating activities used $3,387 of cash for the year ended December 31, 2019, primarily due to the add back of non-cash items from our net loss from continuing operations of $7,851 including stock compensation expense of $574, depreciation and amortization of $996, intangible assets abandonment charge of $127, a decrease in our accrued liabilities and other non-current
23
liabilities of $5,010, a decrease in our accounts payable balance of $7,331 offset by a decrease in prepaid expenses and other current and non-current assets of $2,239, a decrease in our inventory balance of $818 and a decrease in our accounts receivable balance of $11,415. Cash used by operating activities also included cash used of $21 associated with the remaining storage fees prior to the sale of the Assets Held for Sale associated with the Fuel Conversion discontinued operations.
Operating activities provided $4,927 of cash for the year ended December 31, 2018, primarily due to the add back of non-cash items from our net income from continuing operations of $85 including stock compensation expense of $233, depreciation and amortization of $847, intangible assets abandonment charge of $317, excess and obsolete inventory reserve of $78, a loss on sale of equipment of $142, a decrease in our accounts receivable balance of $848, an increase in our inventory balance of $108, a decrease in prepaid expenses and other current and non-current assets of $251, an increase in our accrued liabilities and other non-current liabilities of $1,897, and an increase in our accounts payable balance of $521. Cash provided by operating activities also included cash used of $122 associated with the activity of the Fuel Conversion discontinued operations.
Investing activities used cash of $45 and $569 for the years ended December 31, 2019 and 2018, respectively. Investing activities for the year ended December 31, 2019 consisted of principally of purchases of equipment of $550 offset by the proceeds from the sale of the remaining Assets Held for Sale for Fuel Conversion of $505. Investing activities for the year ended December 31, 2018 consisted of purchases of equipment, patents, and other intangibles of $570 and proceeds from sale of equipment of $1.
Financing activities used $128 and $12 of cash for the years ended December 31, 2019 and 2018 as a result of $128 and $12 in cash used for the acquisition of common shares held in treasury that were withheld for taxes due by employees upon lapsing of restricted stock units.
On June 19, 2019, the Company entered into a Cash Collateral Security agreement with BMO Harris Bank, N.A. (the BMO Harris agreement) to use for the sole purpose of issuing standby letters of credit. The BMO Harris agreement requires us to pledge as cash collateral 105% of the aggregate face amount of outstanding standby letters of credit. The Company pays 250 basis points on the face values of outstanding letters of credit. There are no financial covenants set forth in the BMO Harris agreement. At December 31, 2019, the Company had outstanding standby letters of credit totaling approximately $2,461 under the BMO Harris agreement. As of December 31, 2019, the Company held $2,587 in a separate restricted use designated BMO Harris Bank N.A. deposit account. Fuel Tech is committed to reimbursing the issuing bank for any payments made by the bank under these instruments.
In connection with the transition to BMO Harris Bank N.A., the Company canceled its U.S. Domestic credit facility (the Facility) with JPMorgan Chase Bank, N.A. (JPM Chase) effective on September 25, 2019.
The Company was previously obligated under the Facility with JPM Chase which provided for maximum revolving credit borrowings of $5,500. Fuel Tech used this Facility primarily for standby letters of credit. The Facility was secured by $5,500 in cash held by the Company in a separate restricted use designated JPM Chase deposit account and has the Company’s Italian subsidiary, Fuel Tech S.r.l., as a guarantor. Outstanding borrowings under the Facility beared interest at a rate of LIBOR plus 300 basis points. There were no financial covenants set forth in this Facility. The Facility was amended on several occasions during 2019 and 2018, most recently June 19, 2019, in order to amend the maximum availability under the Facility. As of December 31, 2018, there were no outstanding borrowings under the Facility.
At December 31, 2018, we had outstanding standby letters of credit and bank guarantees totaling approximately $5,028 on our domestic credit facility in connection with contracts in process. We are committed to reimbursing the issuing bank for any payments made by the bank under these instruments. At December 31, 2018, there were no cash borrowings under the domestic revolving credit facility and approximately $443 was available for future borrowings under the Facility. We paid a commitment fee of 0.25% per year on the unused portion of the revolving credit facility.
Beijing Fuel Tech Environmental Technologies Company, Ltd. (Beijing Fuel Tech), was previously obligated under a revolving credit facility (the China Facility) agreement, as most recently amended on October 19, 2018, with JPM Chase which provided for maximum revolving credit borrowings of RMB 2.625 million (approximately $382) and matured on June 30, 2019. The Facility was secured by $520 in cash held by the Company in a separate restricted use designated JPM Chase deposit account. The China Facility bears interest at a rate of 140% of the People’s Bank of China (PBOC) Base Rate, and is guaranteed by the Company. Beijing Fuel Tech can use this facility for cash advances and bank guarantees. As of December 31, 2018, Beijing Fuel Tech had no cash borrowings under the China Facility. At December 31, 2018, we had 0 outstanding standby letters of credit and bank guarantees on its Beijing Fuel Tech revolving credit facility in connection with contracts in process. At December 31, 2018, approximately $382 was available for future borrowings. As a result of the announcement of the suspension of the Air Pollution Control business in Beijing, the Company did not renew the China Facility upon its expiration on June 30, 2019.
24
For the year ended December 31, 2019, we have sustained loss before discontinued operations totaling $7,851. Our cash used by continuing operations for this same period totaled $3,366. We have taken measures to reduce our expense infrastructure and have eliminated approximately $13.7 million in aggregate selling, general and administrative expenses primarily through headcount and other operating expense cutbacks since 2015.
We have experienced continued declines in revenues and recurring losses. As a result, we have evaluated our ongoing business needs, and considered the cash requirements of our base business of Air Pollution Control (APC) and Fuel Chem businesses. This evaluation included consideration of the following: a) customer and revenue trends in our APC and Fuel Chem business segments, b) current operating structure and expenditure levels, c) current availability of working capital, and d) support for our research and development initiatives. We continue to monitor our liquidity needs and have taken measures to reduce expenses and restructure operations which we feel are necessary to ensure we maintain sufficient working capital and liquidity to operate the business and invest in our future. We believe our current cash position and net cash flows expected to be generated from operations are adequate to fund planned operations of the Company for the next 12 months. In the event we determine we need to raise additional working capital, we may consider various financing alternatives which may include debt financing, common stock offerings, or financing involving convertible debt or other equity-linked securities; however, such financing alternatives may not be available on acceptable terms or at all and any such additional financing could be dilutive to our shareholders.
Our cash balance as of December 31, 2019 totaled $13,501 (including our restricted cash balance), and our working capital totaled $16,698. We do not have any outstanding debt obligations other than for our letters of credit. We currently have the BMO Harris agreement which we use to issue letters of credit to our customers, which is a fully cash collateralized requiring us to deposit funds in a restricted cash account. We expect to continue operating under this arrangement for the foreseeable future. Our liquidity may be adversely affected to the extent we are required to collateralize further letters of credit by additional cash deposits.
Contractual Obligations and Commitments
In our normal course of business, we enter into agreements obligating us to make future payments. The contractual cash obligations noted below are primarily related to supporting the ongoing operations of the business.
Payments due by period in thousands of dollars
Contractual Cash Obligations | Total | 2020 | 2021 | 2022 | Thereafter | |||||||||||||||
Operating lease obligations | $ | 1,318 | $ | 319 | $ | 303 | $ | 249 | $ | 447 | ||||||||||
Total | $ | 1,318 | $ | 319 | $ | 303 | $ | 249 | $ | 447 | ||||||||||
In the normal course of our business, we use bank performance guarantees and letters of credit in support of construction contracts with customers as follows:
• | in support of the warranty period defined in the contract; or |
• | in support of the system performance criteria that are defined in the contract. |
In addition, we use bank performance guarantees with standby letters of credit and performance surety bonds as security for contract performance and other obligations as needed in the normal course of business. As of December 31, 2019, we had outstanding bank performance obligations that may or may not result in cash obligations as follows:
Commitment expiration by period in thousands of dollars
Commercial Commitments | Total | 2020 | 2021 | 2022 | Thereafter | |||||||||||||||
Standby letters of credit and bank guarantees | $ | 2,461 | $ | 1,978 | $ | 136 | $ | 89 | $ | 258 | ||||||||||
Total | $ | 2,461 | $ | 1,978 | $ | 136 | $ | 89 | $ | 258 | ||||||||||
Off-Balance-Sheet Transactions
There were no other off-balance-sheet transactions other than the obligations and commitments listed above for the year ended December 31, 2019.
25
ITEM 7A - QUANTITATIVE AND QUALITATIVE DISCLOSURES ABOUT MARKET RISK
Our earnings and cash flow are subject to fluctuations due to changes in foreign currency exchange rates. We do not enter into foreign currency forward contracts or into foreign currency option contracts to manage this risk due to the nature of the transactions involved.
We are also exposed to changes in interest rates primarily due to our debt arrangement (refer to Note 10 to the consolidated financial statements). A hypothetical 100 basis point adverse move in interest rates along the entire interest rate yield curve would not have a materially adverse effect on interest expense during the year ended December 31, 2019.
26
ITEM 8 - FINANCIAL STATEMENTS AND SUPPLEMENTARY DATA
Report of Independent Registered Public Accounting Firm
To the Stockholders and the Board of Directors of Fuel Tech, Inc.
Opinion on the Financial Statements
We have audited the accompanying consolidated balance sheets of Fuel Tech, Inc. (the Company) as of December 31, 2019 and 2018, the related consolidated statements of operations, comprehensive (loss) income, stockholders’ equity and cash flows for each of the three years in the period ended December 31, 2019, and the related notes to the consolidated financial statements (collectively, the financial statements). In our opinion, the financial statements present fairly, in all material respects, the financial position of the Company as of December 31, 2019 and 2018, and the results of its operations and its cash flows for each of the three years in the period ended December 31, 2019, in conformity with accounting principles generally accepted in the United States of America.
Basis for Opinion
These financial statements are the responsibility of the Company’s management. Our responsibility is to express an opinion on the Company’s financial statements based on our audits. We are a public accounting firm registered with the Public Company Accounting Oversight Board (United States) (PCAOB) and are required to be independent with respect to the Company in accordance with U.S. federal securities laws and the applicable rules and regulations of the Securities and Exchange Commission and the PCAOB.
We conducted our audits in accordance with the standards of the PCAOB. Those standards require that we plan and perform the audit to obtain reasonable assurance about whether the financial statements are free of material misstatement, whether due to error or fraud. The Company is not required to have, nor were we engaged to perform, an audit of its internal control over financial reporting. As part of our audits we are required to obtain an understanding of internal control over financial reporting but not for the purpose of expressing an opinion on the effectiveness of the Company’s internal control over financial reporting. Accordingly, we express no such opinion.
Our audits included performing procedures to assess the risks of material misstatement of the financial statements, whether due to error or fraud, and performing procedures that respond to those risks. Such procedures included examining, on a test basis, evidence regarding the amounts and disclosures in the financial statements. Our audits also included evaluating the accounting principles used and significant estimates made by management, as well as evaluating the overall presentation of the financial statements. We believe that our audits provide a reasonable basis for our opinion.
/s/ RSM US LLP |
We have served as the Company's auditor since 2010. |
Chicago, Illinois |
March 11, 2020 |
27
Fuel Tech, Inc.
Consolidated Balance Sheets
(in thousands of dollars, except share and per-share data)
December 31, | |||||||
2019 | 2018 | ||||||
ASSETS | |||||||
Current assets: | |||||||
Cash and cash equivalents | $ | 10,914 | $ | 12,039 | |||
Restricted cash | 2,080 | 6,020 | |||||
Accounts receivable, net | 6,473 | 18,399 | |||||
Inventories, net | 264 | 957 | |||||
Prepaid expenses and other current assets | 1,879 | 3,302 | |||||
Total current assets | 21,610 | 40,717 | |||||
Property and equipment, net | 5,662 | 5,976 | |||||
Goodwill | 2,116 | 2,116 | |||||
Other intangible assets, net | 906 | 1,164 | |||||
Restricted cash | 507 | — | |||||
Right-of-use operating lease assets | 980 | — | |||||
Assets held for sale | — | 485 | |||||
Other assets | 443 | 1,261 | |||||
Total assets | $ | 32,224 | $ | 51,719 | |||
LIABILITIES AND STOCKHOLDERS’ EQUITY | |||||||
Current liabilities: | |||||||
Accounts payable | $ | 2,117 | $ | 9,499 | |||
Accrued liabilities: | |||||||
Operating lease liabilities - current | 300 | — | |||||
Employee compensation | 519 | 1,563 | |||||
Other accrued liabilities | 1,976 | 6,099 | |||||
Total current liabilities | 4,912 | 17,161 | |||||
Operating lease liabilities - non-current | 680 | — | |||||
Deferred income taxes | 171 | 171 | |||||
Other liabilities | 286 | 335 | |||||
Total liabilities | 6,049 | 17,667 | |||||
COMMITMENTS AND CONTINGENCIES (Note 9) | |||||||
Stockholders’ equity: | |||||||
Common stock, $.01 par value, 40,000,000 shares authorized, 25,053,480 and 24,825,891 shares issued, and 24,592,578 and 24,170,585 outstanding in 2019 and 2018, respectively | 254 | 248 | |||||
Additional paid-in capital | 139,560 | 138,992 | |||||
Accumulated deficit | (110,325 | ) | (102,495 | ) | |||
Accumulated other comprehensive loss | (1,778 | ) | (1,285 | ) | |||
Nil coupon perpetual loan notes | 76 | 76 | |||||
Treasury stock, at cost (Note 6) | (1,612 | ) | (1,484 | ) | |||
Total shareholders’ equity | 26,175 | 34,052 | |||||
Total liabilities and shareholders’ equity | $ | 32,224 | $ | 51,719 | |||
See notes to consolidated financial statements.
28
Fuel Tech, Inc.
Consolidated Statements of Operations
(in thousands of dollars, except share and per-share data)
For the years ended December 31, | ||||||||||||
2019 | 2018 | 2017 | ||||||||||
Revenues | $ | 30,467 | $ | 56,535 | $ | 45,166 | ||||||
Costs and expenses: | ||||||||||||
Cost of sales | 19,637 | 36,471 | 27,144 | |||||||||
Selling, general and administrative | 17,191 | 18,564 | 20,933 | |||||||||
Restructuring charge | 625 | — | 119 | |||||||||
Research and development | 1,127 | 1,073 | 1,070 | |||||||||
Intangible assets abandonment and building impairment | 127 | 317 | 2,965 | |||||||||
Total Costs and Expenses | 38,707 | 56,425 | 52,231 | |||||||||
Operating income (loss) from continuing operations | (8,240 | ) | 110 | (7,065 | ) | |||||||
Interest income | 41 | 6 | 10 | |||||||||
Foreign exchange gain | 370 | — | — | |||||||||
Other expense | (8 | ) | 2 | (60 | ) | |||||||
Income (loss) from continuing operations before income taxes | (7,837 | ) | 118 | (7,115 | ) | |||||||
Income tax benefit (expense) | (14 | ) | (33 | ) | 580 | |||||||
Net income (loss) from continuing operations | (7,851 | ) | 85 | (6,535 | ) | |||||||
Loss from discontinued operations (net of income tax benefit of $0 in 2019, 2018 and 2017) | (1 | ) | (113 | ) | (3,914 | ) | ||||||
Net loss | $ | (7,852 | ) | $ | (28 | ) | $ | (10,449 | ) | |||
Net loss per common share: | ||||||||||||
Basic | ||||||||||||
Continuing operations | $ | (0.32 | ) | $ | — | $ | (0.28 | ) | ||||
Discontinued operations | $ | — | $ | — | $ | (0.16 | ) | |||||
Basic net loss per common share | $ | (0.32 | ) | $ | — | $ | (0.44 | ) | ||||
Diluted | ||||||||||||
Continuing operations | $ | (0.32 | ) | $ | — | $ | (0.28 | ) | ||||
Discontinued operations | $ | — | $ | — | $ | (0.16 | ) | |||||
Diluted net loss per common share | $ | (0.32 | ) | $ | — | $ | (0.44 | ) | ||||
Weighted-average number of common shares outstanding: | ||||||||||||
Basic | 24,202,000 | 24,164,000 | 23,872,000 | |||||||||
Diluted | 24,202,000 | 24,164,000 | 23,872,000 | |||||||||
See notes to consolidated financial statements.
29
Fuel Tech, Inc.
Consolidated Statements of Comprehensive (Loss) Income
(in thousands of dollars)
For the years ended December 31, | ||||||||||||
2019 | 2018 | 2017 | ||||||||||
Net loss | $ | (7,852 | ) | $ | (28 | ) | $ | (10,449 | ) | |||
Other comprehensive income (loss): | ||||||||||||
Foreign currency translation adjustments | (493 | ) | (513 | ) | 802 | |||||||
Unrealized losses from marketable securities, net of tax | — | (4 | ) | (2 | ) | |||||||
Total other comprehensive income (loss) | (493 | ) | (517 | ) | 800 | |||||||
Comprehensive loss | $ | (8,345 | ) | $ | (545 | ) | $ | (9,649 | ) | |||
See notes to consolidated financial statements.
30
Fuel Tech, Inc.
Consolidated Statements of Stockholders’ Equity
(in thousands of dollars or shares, as appropriate)
Common Stock | Additional Paid-in Capital | Accumulated Deficit | Accumulated Other Comprehensive Income (Loss) | Nil Coupon Perpetual Loan Notes | Treasury Stock | Total | |||||||||||||||||||||||||
Shares | Amount | ||||||||||||||||||||||||||||||
Balance at December 31, 2016 | 23,446 | $ | 238 | $ | 137,380 | $ | (92,223 | ) | $ | (1,568 | ) | $ | 76 | $ | (1,214 | ) | $ | 42,689 | |||||||||||||
Net loss | (10,449 | ) | (10,449 | ) | |||||||||||||||||||||||||||
Foreign currency translation adjustments | 802 | 802 | |||||||||||||||||||||||||||||
Unrealized loss on marketable securities, net of tax | (2 | ) | (2 | ) | |||||||||||||||||||||||||||
Stock compensation expense | 1,389 | 1,389 | |||||||||||||||||||||||||||||
Common shares issued upon vesting of restricted stock units | 976 | 10 | (9 | ) | 1 | ||||||||||||||||||||||||||
Treasury shares withheld | (289 | ) | (258 | ) | (258 | ) | |||||||||||||||||||||||||
Balance at December 31, 2017 | 24,133 | $ | 248 | $ | 138,760 | $ | (102,672 | ) | $ | (768 | ) | $ | 76 | $ | (1,472 | ) | $ | 34,172 | |||||||||||||
Net loss | (28 | ) | (28 | ) | |||||||||||||||||||||||||||
Foreign currency translation adjustments | (513 | ) | (513 | ) | |||||||||||||||||||||||||||
Unrealized loss on marketable securities, net of tax | (4 | ) | (4 | ) | |||||||||||||||||||||||||||
Stock compensation expense | 233 | 233 | |||||||||||||||||||||||||||||
Common shares issued upon vesting of restricted stock units | 49 | — | (1 | ) | (1 | ) | |||||||||||||||||||||||||
Treasury shares withheld | (12 | ) | (12 | ) | (12 | ) | |||||||||||||||||||||||||
Adoption of ASC 606 | 205 | 205 | |||||||||||||||||||||||||||||
Balance at December 31, 2018 | 24,170 | $ | 248 | $ | 138,992 | $ | (102,495 | ) | $ | (1,285 | ) | $ | 76 | $ | (1,484 | ) | $ | 34,052 | |||||||||||||
Net loss | (7,852 | ) | (7,852 | ) | |||||||||||||||||||||||||||
Foreign currency translation adjustments | (493 | ) | (493 | ) | |||||||||||||||||||||||||||
Stock compensation expense | 574 | 574 | |||||||||||||||||||||||||||||
Common shares issued upon vesting of restricted stock units | 563 | 6 | (6 | ) | — | ||||||||||||||||||||||||||
Treasury shares withheld | (141 | ) | (128 | ) | (128 | ) | |||||||||||||||||||||||||
Adoption of ASC 842 | 22 | 22 | |||||||||||||||||||||||||||||
Balance at December 31, 2019 | 24,592 | $ | 254 | $ | 139,560 | $ | (110,325 | ) | $ | (1,778 | ) | $ | 76 | $ | (1,612 | ) | $ | 26,175 | |||||||||||||
See notes to consolidated financial statements.
31
Fuel Tech, Inc.
Consolidated Statements of Cash Flows
(in thousands of dollars)
For the years ended December 31, | ||||||||||||
2019 | 2018 | 2017 | ||||||||||
OPERATING ACTIVITIES | ||||||||||||
Net loss | $ | (7,852 | ) | $ | (28 | ) | $ | (10,449 | ) | |||
Loss from discontinued operations | 1 | 113 | 3,914 | |||||||||
Net income (loss) from continuing operations | (7,851 | ) | 85 | (6,535 | ) | |||||||
Adjustments to reconcile net income (loss) to net cash used in operating activities: | ||||||||||||
Depreciation | 810 | 654 | 1,312 | |||||||||
Amortization | 186 | 193 | 215 | |||||||||
(Gain) loss on disposal of equipment | (3 | ) | 142 | 304 | ||||||||
Provision for doubtful accounts, net of recoveries | 421 | (64 | ) | — | ||||||||
Deferred income taxes | — | 2 | (534 | ) | ||||||||
Stock-based compensation, net of forfeitures | 574 | 233 | 1,389 | |||||||||
Intangible assets abandonment and building impairment | 127 | 317 | 2,965 | |||||||||
Excess and obsolete inventory provision | (131 | ) | 78 | 228 | ||||||||
Foreign exchange gain | 370 | — | — | |||||||||
Changes in operating assets and liabilities: | ||||||||||||
Accounts receivable | 11,415 | 848 | 113 | |||||||||
Inventories | 818 | (108 | ) | (134 | ) | |||||||
Prepaid expenses, other current assets and other non-current assets | 2,239 | 251 | (1,084 | ) | ||||||||
Accounts payable | (7,331 | ) | 521 | 2,500 | ||||||||
Accrued liabilities and other non-current liabilities | (5,010 | ) | 1,897 | (2,439 | ) | |||||||
Net cash provided by (used in) operating activities - continuing operations | (3,366 | ) | 5,049 | (1,700 | ) | |||||||
Net cash used in operating activities - discontinued operations | (21 | ) | (122 | ) | (1,868 | ) | ||||||
Net cash provided by (used in) operating activities | (3,387 | ) | 4,927 | (3,568 | ) | |||||||
INVESTING ACTIVITIES | ||||||||||||
Purchases of equipment and patents | (550 | ) | (570 | ) | (492 | ) | ||||||
Proceeds from the sale of equipment | — | 1 | 2 | |||||||||
Net cash used in investing activities - continued operations | (550 | ) | (569 | ) | (490 | ) | ||||||
Net cash provided by investing activities - discontinued operations | 505 | — | — | |||||||||
Net cash used in investing activities | (45 | ) | (569 | ) | (490 | ) | ||||||
FINANCING ACTIVITIES | ||||||||||||
Taxes paid on behalf of equity award participants | (128 | ) | (12 | ) | (258 | ) | ||||||
Net cash used in financing activities | (128 | ) | (12 | ) | (258 | ) | ||||||
Effect of exchange rate fluctuations on cash | (998 | ) | (673 | ) | 856 | |||||||
Net increase (decrease) in cash, cash equivalents and restricted cash | (4,558 | ) | 3,673 | (3,460 | ) | |||||||
Cash, cash equivalents and restricted cash at beginning of period | 18,059 | 14,386 | 17,846 | |||||||||
Cash, cash equivalents and restricted cash at end of period | $ | 13,501 | $ | 18,059 | $ | 14,386 | ||||||
Supplemental Cash Flow Information: | ||||||||||||
Cash paid for: | ||||||||||||
Interest | $ | — | $ | — | $ | — | ||||||
Income taxes paid | $ | 18 | $ | 27 | $ | 31 | ||||||
See notes to consolidated financial statements.
32
Notes to Consolidated Financial Statements
(in thousands of dollars, except share and per-share data)
1. ORGANIZATION AND SIGNIFICANT ACCOUNTING POLICIES
Organization
Fuel Tech, Inc. and subsidiaries ("Fuel Tech", the "Company", "we", "us" or "our") provides advanced engineered solutions for the optimization of combustion systems in utility and industrial applications. Our primary focus is on the worldwide marketing and sale of Air Pollution Control (APC) technologies as well as our FUEL CHEM program. The Company’s NOx reduction technologies reduce nitrogen oxide emissions from boilers, furnaces and other stationary combustion sources.
Our FUEL CHEM program is based on proprietary TIFI® Targeted In-Furnace™ Injection technology, in combination with advanced Computational Fluid Dynamics (CFD) and Chemical Kinetics Modeling (CKM) boiler modeling, in the unique application of specialty chemicals to improve the efficiency, reliability and environmental status of combustion units by controlling slagging, fouling, corrosion, opacity and other sulfur trioxide-related issues in the boiler.
Our business is materially dependent on the continued existence and enforcement of air quality regulations, particularly in the United States. We have expended significant resources in the research and development of new technologies in building our proprietary portfolio of air pollution control, fuel and boiler treatment chemicals, computer modeling and advanced visualization technologies.
International revenues were $4,585, $12,648, and $15,656 for the years ended December 31, 2019, 2018 and 2017, respectively. These amounts represented 15%, 22%, and 35% of Fuel Tech’s total revenues for the respective periods of time. Foreign currency changes did not have a material impact on the calculation of these percentages. We have foreign offices in Beijing, China and Gallarate, Italy.
Basis of Presentation
The consolidated financial statements include the accounts of Fuel Tech and its wholly-owned subsidiaries. All intercompany transactions have been eliminated.
The consolidated financial statements have been prepared in accordance with accounting principles generally accepted in the United States of America (GAAP). The books and records of subsidiaries located in foreign countries are maintained according to generally accepted accounting principles in those countries. Upon consolidation, the Company evaluates the differences in accounting principles and determines whether adjustments are necessary to convert the foreign financial statements to the accounting principles upon which the consolidated financial statements are based. As a result of this evaluation no material adjustments were identified. All intercompany transactions have been eliminated.
Liquidity
We have experienced continued declines in revenues and recurring losses. As a result, we have evaluated our ongoing business needs, and considered the cash requirements of our base business of Air Pollution Control (APC) and Fuel Chem businesses. This evaluation included consideration of the following: a) customer and revenue trends in our APC and Fuel Chem business segments, b) current operating structure and expenditure levels, c) current availability of working capital, and d) support for our research and development initiatives. We continue to monitor our liquidity needs and have taken measures to reduce expenses and restructure operations which we feel are necessary to ensure we maintain sufficient working capital and liquidity to operate the business and invest in our future. We believe our current cash position and net cash flows expected to be generated from operations are adequate to fund planned operations of the Company for the next 12 months. In the event we determine we need to raise additional working capital, we may consider various financing alternatives which may include debt financing, common stock offerings, or financing involving convertible debt or other equity-linked securities; however, such financing alternatives may not be available on acceptable terms or at all and any such additional financing could be dilutive to our shareholders.
Use of Estimates
The preparation of the financial statements in conformity with generally accepted accounting principles requires management to make estimates and assumptions that affect the amounts reported in the financial statements and accompanying notes. The Company uses estimates in accounting for, among other items, revenue recognition, allowance for doubtful accounts, income tax provisions, excess and obsolete inventory reserve, impairment of long-lived assets, and warranty expenses. Actual results could differ from those estimates.
33
Fair Value of Financial Instruments
The carrying values of cash and cash equivalents, accounts receivable, and accounts payable are reasonable estimates of their fair value due to their short-term nature.
Cash, cash equivalents and restricted cash
We include cash and investments having an original maturity of three months or less at the time of acquisition in cash and cash equivalents. We have never incurred realized or unrealized holdings gains or losses on securities classified as cash equivalents. Income resulting from short-term investments is recorded as interest income. At December 31, 2019, we had cash on hand of approximately $1,417 at our Beijing, China subsidiary that is subject to certain local regulations that may limit the immediate availability of these funds outside of China. Cash on hand at our Italy subsidiary totaled approximately $1,695 at December 31, 2019. Cash on hand at our Chilean subsidiary totaled approximately $322 at December 31, 2019.
Restricted cash as of December 31, 2019 represents funds that are restricted to satisfy any amount borrowed against the Company's Cash Collateral Security agreement with BMO Harris Bank N.A. The balance of restricted cash totaling $2,587 is comprised of $2,080 in current assets relating to existing standby letters of credit with varying maturity dates and expire no later than December 31, 2020 and $507 in long-term assets will remain through the expiration dates of the underlying standby letter of credits (the latest maturity date is February 1, 2023) with BMO Harris Bank N.A. Refer to Note 11 Debt Financing for further information on the Facility.
Restricted cash as of December 31, 2018 represents funds that are restricted to satisfy any amount borrowed against the Company's then existing revolving credit facility (the Facility) with JPMorgan Chase Bank, N.A. In connection with the transition to BMO Harris Bank N.A., the Company canceled its U.S. Domestic credit facility with JPMorgan Chase Bank, N.A. effective on September 25, 2019.
The following table provides a reconciliation of cash, cash equivalents, and restricted cash reported within the Consolidated Balance Sheet that sum to the total of the same such amounts shown in the Consolidated Statements of Cash Flows:
December 31, 2019 | December 31, 2018 | |||||
Cash and cash equivalents | $ | 10,914 | $ | 12,039 | ||
Restricted cash included in current assets | 2,080 | 6,020 | ||||
Restricted cash included in long-term assets | 507 | — | ||||
Total cash, cash equivalents, and restricted cash shown in the Consolidated Statements of Cash Flows | $ | 13,501 | $ | 18,059 | ||
Foreign Currency Risk Management
Our earnings and cash flows are subject to fluctuations due to changes in foreign currency exchange rates. We do not enter into foreign currency forward contracts or into foreign currency option contracts to manage this risk due to the nature of the transactions involved.
Accounts Receivable
Accounts receivable consist of amounts due to us in the normal course of our business, are not collateralized, and normally do not bear interest. Accounts receivable includes contract assets, billings occurring subsequent to revenue recognition under ASC 606 Revenue from Contracts with Customers. At December 31, 2019 and 2018, unbilled receivables were approximately $1,857 and $5,540, respectively. Refer to Note 3 for further detail.
Allowance for Doubtful Accounts
The allowance for doubtful accounts is our management's best estimate of the amount of credit losses in accounts receivable. In order to control and monitor the credit risk associated with our customer base, we review the credit worthiness of customers on a recurring basis. Factors influencing the level of scrutiny include the level of business the customer has with Fuel Tech, the customer’s payment history, and the customer’s financial stability. Receivables are considered past due if payment is not received by the date agreed upon with the customer, which is normally 30 days. Representatives of our management team review all past due accounts on a weekly basis to assess collectability. At the end of each reporting period, the allowance for doubtful accounts balance is reviewed relative to management’s collectability assessment and is adjusted if deemed necessary through a corresponding charge or credit to bad debts expense, which is included in selling, general, and administrative expenses in the consolidated statements
34
of operations. Bad debt write-offs are made when management believes it is probable a receivable will not be recovered. The table below sets forth the components of the Allowance for Doubtful Accounts for the years ended December 31.
Year | Balance at January 1 | Provision charged to expense | Write-offs / Recoveries | Balance at December 31 | ||||||||||||
2017 | $ | 1,569 | $ | — | $ | (24 | ) | $ | 1,545 | |||||||
2018 | $ | 1,545 | $ | — | $ | (134 | ) | $ | 1,411 | |||||||
2019 | $ | 1,411 | $ | 573 | $ | (168 | ) | $ | 1,816 | |||||||
Prepaid expenses and other current assets
Prepaid expenses and other current assets includes Chinese banker acceptances of $43 and $997 as of December 31, 2019 and 2018. These are short-term commitments of typically 30 to 60 days for future payments and can be redeemed at a discount or applied to future vendor payments.
Inventories
Inventories consist primarily of spare parts and are stated at the lower of cost or net realizable value, using the weighted-average cost method. Usage is recorded in cost of sales in the period that parts were issued to a project or used to service equipment. Inventories are periodically evaluated to identify obsolete or otherwise impaired parts and are written off when management determines usage is not probable. The Company estimates the balance of excess and obsolete inventory by analyzing inventory by age using last used and original purchase date and existing sales pipeline for which the inventory could be used. The table below sets forth the components of the Excess and Obsolete Inventory Reserve for the years ended December 31.
Year | Balance at January 1 | Provision charged to expense | Write-offs / Recoveries | Balance at December 31 | ||||||||
2017 | 825 | 228 | — | 1,053 | ||||||||
2018 | 1,053 | 78 | — | 1,131 | ||||||||
2019 | 1,131 | — | (131 | ) | 1,000 | |||||||
Foreign Currency Translation and Transactions
Assets and liabilities of consolidated foreign subsidiaries are translated into U.S. dollars at exchange rates in effect at year end. Revenues and expenses are translated at average exchange rates prevailing during the year. Gains or losses on foreign currency transactions and the related tax effects are reflected in net income. The resulting translation adjustments are included in stockholders’ equity as part of accumulated other comprehensive income.
During the fourth quarter of 2019, the Company reclassified the cumulative foreign currency translation associated with Fuel Tech S.p.A (Chile) of $370 to net income given the substantial completion of the liquidation of that legal entity in accordance with ASC 830 Foreign Currency Matters.
Accumulated Other Comprehensive (Loss)
The changes in accumulated other comprehensive (loss) by component were as follows:
December 31, | ||||||||
2019 | 2018 | |||||||
Foreign currency translation | ||||||||
Balance at beginning of period | $ | (1,285 | ) | $ | (772 | ) | ||
Other comprehensive (loss): | ||||||||
Foreign currency translation adjustments (1) | (493 | ) | (513 | ) | ||||
Balance at end of period | $ | (1,778 | ) | $ | (1,285 | ) | ||
Available-for-sale marketable securities | ||||||||
Balance at beginning of period | $ | — | $ | 4 | ||||
Other comprehensive (loss): | ||||||||
Net unrealized holding (loss) (2) | — | (4 | ) | |||||
Balance at end of period | $ | — | $ | — | ||||
Total accumulated other comprehensive (loss) | $ | (1,778 | ) | $ | (1,285 | ) | ||
35
(1) | In all periods presented, there were no tax impacts related to rate changes and certain foreign currency translation adjustments were reclassified to earnings in 2019. The adjustments reclassified to earnings in 2019 relate to the substantial completion of the liquidation of Fuel Tech S.p.A (Chile) during the fourth quarter of 2019. |
(2) | In all periods presented, there were no realized holding gains or losses and therefore no amounts were reclassified to earnings. |
Research and Development
Research and development costs are expensed as incurred. Research and development projects funded by customer contracts are reported as part of cost of goods sold. Internally funded research and development expenses are reported as operating expenses.
Product/System Warranty
We typically warrant our air pollution control products and systems against defects in design, materials and workmanship for one to two years. A provision for estimated future costs relating to warranty expense is recorded when the products/systems become commercially operational.
Goodwill
Goodwill is tested for impairment at least annually as of the first day of our fourth quarter, or more frequently if events or changes in circumstances indicate that the carrying value may not be recoverable. Our evaluation of goodwill impairment involves first assessing qualitative factors to determine whether it is more likely than not that the fair value of a reporting unit is less than its carrying amount. We may bypass this qualitative assessment, or determine that based on our qualitative assessment considering the totality of events and circumstances including macroeconomic factors, industry and market considerations, current and projected financial performance, a sustained decrease in our share price, or other factors, that additional impairment analysis is necessary. This additional analysis involves comparing the current fair value of our reporting units to their carrying values. We use a discounted cash flow (DCF) model to determine the current fair value of our two reporting units. A number of significant assumptions and estimates are involved in the application of the DCF model to forecast operating cash flows, including markets and market share, sales volumes and prices, costs to produce and working capital changes. Management considers historical experience and all available information at the time the fair values of its reporting units are estimated. However, actual fair values that could be realized in an actual transaction may differ from those used to evaluate the impairment of goodwill. For the APC business segment, the Company used working capital as a proxy of fair value for the business segment given the on-going losses in that segment. Fuel Tech performed its annual goodwill impairment analysis for each of its reporting units as of October 1, 2019 and determined that no impairment of goodwill existed within the FUEL CHEM technology segment.
Goodwill is allocated to each of our reporting units, which is defined as an operating segment or one level below an operating segment, upon acquisition after considering the nature of the net assets giving rise to the goodwill and how each reporting unit would enjoy the benefits and synergies of the net assets acquired. Goodwill is also evaluated for impairment at the reporting unit level. We have two reporting units for goodwill evaluation purposes: the FUEL CHEM technology segment and the APC technology segment. There is no goodwill associated with our APC business technology segment.
In January 2017, the FASB issued ASU 2017-04, Intangibles-Goodwill and Other (Topic 350): Simplifying the Test for Goodwill Impairment. This ASU is meant to simplify how an entity is required to test goodwill for impairment by eliminating Step 2 from the goodwill impairment test. Step 2 measures a goodwill impairment loss by comparing the implied fair value of a reporting unit’s goodwill with the carrying amount of that goodwill. The Company early adopted ASU 2017-04 on October 1, 2018 for the annual goodwill impairment test completed during the fourth quarter which simplified the test by comparing the implied fair value of the reporting unit's goodwill with the carrying amount of goodwill and eliminating Step 2.
The entire goodwill balance of $2,116 was allocated to the FUEL CHEM technology segment as of December 31, 2019 and 2018. The Company did not recognize a charge for goodwill impairment for the periods ended December 31, 2019, 2018 and 2017.
36
Other Intangible Assets
Management reviews other finite-lived intangible assets, which include customer lists and relationships, covenants not to compete, patent assets, trade names, and acquired technologies, for impairment when events or changes in circumstances indicate the carrying amount of an asset or asset group may not be recoverable. In the event that impairment indicators exist, a further analysis is performed and if the sum of the expected undiscounted future cash flows resulting from the use of the asset or asset group is less than the carrying amount of the asset or asset group, an impairment loss equal to the excess of the asset or asset group's carrying value over its fair value is recorded. Management considers historical experience and all available information at the time the estimates of future cash flows are made, however, the actual cash values that could be realized may differ from those that are estimated.
During the year ended December 31, 2019, the Company recorded an abandonment charge of $127 principally associated with the remaining patent assets in China which the Company elected to not maintain and abandon as a result of the planned suspension of the APC business operation in China. The abandonment charge was calculated by determining the net book values of the abandoned patent assets by deducting the accumulated amortization from the acquisition cost. The abandonment charge is included in “Intangible assets abandonment and building impairment” line in the accompanying Consolidated Statements of Operations for the year then ended December 31, 2019.
During the year ended December 31, 2018, Fuel Tech recorded an abandonment charge of $317 associated with certain international patent assets which the Company elected to not maintain and abandon due to limited business opportunities in those regions. The abandonment charge was calculated by determining the net book values of the abandoned patent assets by deducting the accumulated amortization from the acquisition cost. The abandonment charge of $317 is included in “Intangible assets abandonment and building impairment” line in the accompanying Consolidated Statements of Operations for the year ended December 31, 2018.
Third-party costs related to the development of patents are included within other intangible assets on the consolidated balance sheets. As of December 31, 2019 and 2018, the net patent asset balance was $906 and $1,164, respectively. The third-party costs capitalized as patent costs during the years ended December 31, 2019 and 2018 were $56 and $59, respectively. Third-party costs are comprised of legal fees that relate to the review and preparation of patent disclosures and filing fees incurred to present the patents to the required governing body.
Our intellectual property portfolio has been a significant building block for the Air Pollution Control and FUEL CHEM technology segments. The patents are essential to the generation of revenue for our businesses and are essential to protect us from competition in the markets in which we serve. These costs are being amortized on the straight-line method over the period beginning with the patent issuance date and ending on the patent expiration date. Patent maintenance fees are charged to operations as incurred.
Amortization expense from continuing operations for intangible assets was $186, $193 and $215 for the years ended December 31, 2019, 2018 and 2017, respectively. The table below shows the amortization period and other intangible asset cost by intangible asset as of December 31, 2019 and 2018, and the accumulated amortization and net intangible asset value in total for all other intangible assets.
2019 | 2018 | |||||||||||||||||||||||||
Description of Other Intangibles | Amortization Period | Gross Carrying Amount | Accumulated Amortization | Net Carrying Amount | Gross Carrying Amount | Accumulated Amortization | Net Carrying Amount | |||||||||||||||||||
Patent assets | 1- 20 years | 1,897 | (991 | ) | 906 | 2,092 | (928 | ) | 1,164 | |||||||||||||||||
Total | $ | 1,897 | $ | (991 | ) | $ | 906 | $ | 2,092 | $ | (928 | ) | $ | 1,164 | ||||||||||||
The table below shows the estimated future amortization expense for intangible assets:
Year | Estimated Amortization Expense | ||
2020 | $ | 144 | |
2021 | 150 | ||
2022 | 116 | ||
2023 | 83 | ||
2024 | 62 | ||
Thereafter | 351 | ||
Total | $ | 906 | |
37
Property and Equipment
Property and equipment is stated at historical cost. Provisions for depreciation are computed by the straight-line method, using estimated useful lives that range based on the nature of the asset. Leasehold improvements are depreciated over the shorter of the associated lease term or the estimated useful life of the asset. Depreciation expense from continuing operations was $810, $654, and $1,312 for the years ended December 31, 2019, 2018 and 2017, respectively. The table below shows the depreciable life and cost by asset class as of December 31, 2019 and 2018, and the accumulated depreciation and net book value in total for all classes of assets.
Description of Property and Equipment | Depreciable Life | 2019 | 2018 | |||||||
Land | $ | 1,050 | $ | 1,050 | ||||||
Building | 39 years | 3,950 | 3,950 | |||||||
Building and leasehold improvements | 3-39 years | 2,886 | 3,242 | |||||||
Field equipment | 3-4 years | 19,507 | 19,541 | |||||||
Computer equipment and software | 2-3 years | 2,936 | 3,154 | |||||||
Furniture and fixtures | 3-10 years | 1,475 | 1,535 | |||||||
Vehicles | 5 years | 32 | 32 | |||||||
Total cost | 31,836 | 32,504 | ||||||||
Less accumulated depreciation | (26,174 | ) | (26,528 | ) | ||||||
Total net book value | $ | 5,662 | $ | 5,976 | ||||||
Property and equipment is reviewed for impairment when events and circumstances indicate that the carrying amount of the assets (or asset group) may not be recoverable. If impairment indicators exists, we perform a more detailed analysis and an impairment loss is recognized when estimated future undiscounted cash flows expected to result from the use of the asset (or asset group) and its eventual disposition are less than the carrying amount. This process of analyzing impairment involves examining the operating condition of individual assets (or asset group) and estimating a fair value based upon current condition, relevant market factors and remaining estimated operational life compared to the asset’s remaining depreciable life. Quoted market prices and other valuation techniques are used to determine expected cash flows. A significant portion of our property and equipment is comprised of assets deployed at customer locations relating to our FUEL CHEM technology asset group, and due to the shorter-term duration over which this equipment is depreciated, the likelihood of impairment is mitigated. The discontinuation of a FUEL CHEM program at a customer site would most likely result in the re-deployment of all or most of the affected assets to another customer location rather than an impairment.
During the second quarter of 2017, we experienced a decrease in our stock price that caused our market capitalization to fall below the equity value on our consolidated balance sheet, which resulted in an indicator of impairment. This, along with an overall slowdown in APC technology and corresponding downward adjustments to our financial forecasts, was considered during a detailed evaluation of the fair value of our reporting units. As a result of these triggering events, Fuel Tech performed a long-lived asset impairment analysis for each of the reporting units as of April 1, 2017. Based on this evaluation, we determined that our APC segment failed the first step of our impairment analysis because the estimated gross cash flows and fair value of the reporting unit was less than its carrying value, thus requiring additional analysis of the segment. However, no impairment resulted as the fair values of the underlying patents and equipment equaled or exceeded their carrying values. We evaluated the corporate asset group, which contains our corporate headquarters office building and land in Warrenville, Illinois, using the residual method and management determined that there was not adequate gross cash flows to support the carrying value. After obtaining an appraisal from a third-party appraiser, management determined that the carrying value of the office building and land exceeded the fair value and recorded an impairment charge of $2,965 for the year ended December 31, 2017.
Revenue Recognition
On January 1, 2018, we adopted ASC 606 "Revenue from Contracts with Customers" ("ASC 606") using the modified retrospective method applied to those contracts which were not completed as of January 1, 2018. Results for reporting periods beginning after January 1, 2018 are presented under ASC 606, while prior period amounts are not adjusted and continue to be reported in accordance with our legacy accounting under Accounting Standards Codification Topic 605: Revenue Recognition (ASC 605).
38
For the years ended prior to January 1, 2018
Revenues from the sales of chemical products are recorded when title transferred, either at the point of shipment or at the point of destination, depending on the contract with the customer in accordance with ASC 605. We used the percentage of completion method of accounting for equipment construction, equipment supply and license contracts that are sold within the Air Pollution Control technology segment. Under the percentage of completion method, revenues are recognized as work is performed based on the relationship between actual construction costs incurred and total estimated costs at completion. Construction costs include all direct costs such as materials, labor, and subcontracting costs, and indirect costs allocable to the particular contract such as indirect labor, tools and equipment, and supplies. Revisions in completion estimates and contract values are made in the period in which the facts giving rise to the revisions become known and can influence the timing of when revenues are recognized under the percentage of completion method of accounting. Such revisions have historically not had a material effect on the amount of revenue recognized. Provisions are made for estimated losses on uncompleted contracts in the period in which such losses are determined.
Years beginning after January 1, 2018
The Company recognizes revenue when control of the promised goods or services is transferred to our customers, in amount that reflects the consideration we expect to be entitled to in exchange for those goods or services. Fuel Tech’s sales of products to customers represent single performance obligations, which are not impacted upon the adoption of ASC 606. The majority of our contracts have a single performance obligation as the promise to transfer the individual goods or services is not separately identifiable from other promises in the contracts and, therefore, not distinct. Revenue is measured as the amount of consideration we expect to receive in exchange for transferring goods or providing services. Sales, value add, and other taxes we collect concurrent with revenue-producing activities are excluded from revenue.
FUEL CHEM
Revenues from the sale of chemical products are recognized when control transfers to customer upon shipment or delivery of the product based on the applicable shipping terms. We generally recognize revenue for these arrangements at a point in time based on our evaluation of when the customer obtains control of the promised goods or services.
Air Pollution Control Technology
Fuel Tech’s APC contracts are typically six to eighteen months in length. A typical contract will have three or four critical operational measurements that, when achieved, serve as the basis for us to invoice the customer via progress billings. At a minimum, these measurements will include the generation of engineering drawings, the shipment of equipment and the completion of a system performance test.
As part of most of its contractual APC project agreements, Fuel Tech will agree to customer-specific acceptance criteria that relate to the operational performance of the system that is being sold. These criteria are determined based on modeling that is performed by Fuel Tech personnel, which is based on operational inputs that are provided by the customer. The customer will warrant that these operational inputs are accurate as they are specified in the binding contractual agreement. Further, the customer is solely responsible for the accuracy of the operating condition information; typically all performance guarantees and equipment warranties granted by us are voidable if the operating condition information is inaccurate or is not met.
Since control transfers over time, revenue is recognized based on the extent of progress towards completion of the single performance obligation. Fuel Tech uses the cost-to-cost input measure of progress for our contracts since it best depicts the transfer of assets to the customer which occurs as we incur costs on our contracts. Under the cost-to-cost input measure of progress, the extent of progress towards completion is measured based on the ratio of costs incurred to date to the total estimated costs at completion of the performance obligation. Revenues are recorded proportionally as costs are incurred. Costs to fulfill include all internal and external engineering costs, equipment charges, inbound and outbound freight expenses, internal and site transfer costs, installation charges, purchasing and receiving costs, inspection costs, warehousing costs, project personnel travel expenses and other direct and indirect expenses specifically identified as project- or product-line related, as appropriate (e.g. test equipment depreciation and certain insurance expenses).
Fuel Tech has installed over 1,100 units with APC technology and normally provides performance guarantees to our customers based on the operating conditions for the project. As part of the project implementation process, we perform system start-up and optimization services that effectively serve as a test of actual project performance. We believe that this test, combined with the accuracy of the modeling that is performed, enables revenue to be recognized prior to the receipt of formal customer acceptance.
39
Cost of Sales
Cost of sales includes all internal and external engineering costs, equipment and chemical charges, inbound and outbound freight expenses, internal and site transfer costs, installation charges, purchasing and receiving costs, inspection costs, warehousing costs, project personnel travel expenses and other direct and indirect expenses specifically identified as project- or product line-related, as appropriate (e.g., test equipment depreciation and certain insurance expenses). Certain depreciation and amortization expenses related to tangible and intangible assets, respectively, are allocated to cost of sales. We classify shipping and handling costs in cost of sales in the consolidated statements of operations.
Selling, General and Administrative Expenses
Selling, general and administrative expenses primarily include the following categories except where an allocation to the cost of sales line item is warranted due to the project- or product-line nature of a portion of the expense category: salaries and wages, employee benefits, non-project travel, insurance, legal, rent, accounting and auditing, recruiting, telephony, employee training, Board of Directors’ fees, auto rental, office supplies, dues and subscriptions, utilities, real estate taxes, commissions and bonuses, marketing materials, postage and business taxes. Departments comprising the selling, general and administrative line item primarily include the functions of executive management, finance and accounting, investor relations, regulatory affairs, marketing, business development, information technology, human resources, sales, legal and general administration.
Income Taxes
The provision for income taxes is determined using the asset and liability approach of accounting for income taxes. Under this approach, the provision for income taxes represents income taxes paid or payable (or received or receivable) for the current year plus the change in deferred taxes during the year. Deferred taxes represent the future tax consequences expected to occur when the reported amounts of assets and liabilities are recovered or paid, and result from differences between the financial and tax bases of our assets and liabilities and are adjusted for changes in tax rates and tax laws when enacted. Valuation allowances are recorded to reduce deferred tax assets when it is more likely than not that a tax benefit will not be realized. In evaluating the need for a valuation allowance, management considers all potential sources of taxable income, including income available in carryback periods, future reversals of taxable temporary differences, projections of taxable income, and income from tax planning strategies, as well as all available positive and negative evidence. Positive evidence includes factors such as a history of profitable operations, projections of future profitability within the carryforward period, including from tax planning strategies, and our experience with similar operations. Negative evidence includes items such as cumulative losses, projections of future losses, or carryforward periods that are not long enough to allow for the utilization of a deferred tax asset based on existing projections of income. Deferred tax assets for which no valuation allowance is recorded may not be realized upon changes in facts and circumstances.
Tax benefits related to uncertain tax positions taken or expected to be taken on a tax return are recorded when such benefits meet a more likely than not threshold. Otherwise, these tax benefits are recorded when a tax position has been effectively settled, which means that the statute of limitation has expired or the appropriate taxing authority has completed their examination even though the statute of limitations remains open. Interest and penalties related to uncertain tax positions are recognized as part of the provision for income taxes and are accrued beginning in the period that such interest and penalties would be applicable under relevant tax law until such time that the related tax benefits are recognized.
Leases
On January 1, 2019, we adopted ASC 842 "Leases" using the modified retrospective method outlined in ASU 2018-11, “Leases (Topic 842) Targeted Improvements.” Refer to Note 10 for further details regarding the effect of adoption. We determine if an arrangement is a lease at inception. Operating leases are included in right-of-use ("ROU") operating lease assets, operating lease liabilities - current, and operating lease liabilities - non-current on our Consolidated Balance Sheets.
Operating lease ROU assets and operating lease liabilities are recognized based on the present value of the future minimum lease payments over the lease term at commencement date. As most of our leases do not provide an implicit rate, we use our incremental borrowing rate based on the information available at commencement date in determining the present value of future payments. The operating lease ROU asset also includes any lease payments made and excludes lease incentives and initial direct costs incurred. Our lease terms may include options to extend or terminate the lease when it is reasonably certain that we will exercise that option. Lease expense for minimum lease payments is recognized on a straight-line basis over the lease term.
We have lease agreements with lease and non-lease components, which we elected the practical expedient to not separate lease and non-lease components for the majority of our leases. For certain equipment leases, such as vehicles, we account for the lease and non-lease components as a single lease component. We also elected the practical expedient to keep leases with an initial term of 12 months or less off of the consolidated balance sheet.
40
Stock-Based Compensation
Our stock-based employee compensation plan, referred to as the Fuel Tech, Inc. 2014 Long-Term Incentive Plan (Incentive Plan), was adopted in May 2014 and allows for awards to be granted to participants in the form of non-qualified stock options, incentive stock options, stock appreciation rights, restricted stock, restricted stock units, performance awards, and bonuses or other forms of share-based or non-share-based awards or combinations thereof. Participants in the Incentive Plan may be our directors, officers, employees, consultants or advisors (except consultants or advisors in capital-raising transactions) as the directors determine are key to the success of our business. There are a maximum of 5,600,676 shares that may be issued or reserved for awards to participants under the Incentive Plan as of December 31, 2019. Based on the existing issued or reserved awards in Incentive Plan, there are 2,231,382 shares available to be used for future awards to participants in the Incentive Plan as of December 31, 2019.
Basic and Diluted Earnings per Common Share
Basic earnings per share excludes the antidilutive effects of stock options, restricted stock units (RSUs) and the nil coupon non-redeemable convertible unsecured loan notes (see Note 7). Diluted earnings per share includes the dilutive effect of the nil coupon non-redeemable convertible unsecured loan notes, RSUs, and unexercised in-the-money stock options, except in periods of net loss where the effect of these instruments is antidilutive. Out-of-the-money stock options are excluded from diluted earnings per share because they are anti-dilutive. At December 31, 2019, 2018 and 2017, we had outstanding equity awards of 913,000, 757,000 and 2,210,000, respectively, which were antidilutive for the purpose of inclusion in the diluted earnings per share calculation because the exercise prices of the options were greater than the average market price of our common stock. As of December 31, 2019, 2018 and 2017, respectively, we had an additional 728,000, 620,000 and 168,000 equity awards that were antidilutive because of the net loss in the year then ended. These equity awards could potentially dilute basic EPS in future years.
The table below sets forth the weighted-average shares used at December 31 in calculating earnings (loss) per share:
2019 | 2018 | 2017 | |||||||
Basic weighted-average shares | 24,202,000 | 24,164,000 | 23,872,000 | ||||||
Conversion of unsecured loan notes | — | — | — | ||||||
Unexercised options and unvested restricted stock units | — | — | — | ||||||
Diluted weighted-average shares | 24,202,000 | 24,164,000 | 23,872,000 | ||||||
Risk Concentrations
Financial instruments that potentially subject the Company to a significant concentration of credit risk consist primarily of cash and cash equivalents and accounts receivable. The Company maintains deposits in federally insured financial institutions in excess of federally insured limits. However, management believes the Company is not exposed to significant credit risk due to the financial position of its primary depository institution where a significant portion of its deposits are held.
For the year ended December 31, 2019, we had three customers which individually represented greater than 10% of revenues. One customer contributed primarily to our APC technology segment and represented 19% of consolidated revenues. The other two customers contributed to FUEL CHEM technology segment and each customer represented 11% of consolidated revenues. We had no customers that accounted for greater than 10% of our current assets as of December 31, 2019.
For the year ended December 31, 2018, we had two customers which individually represented greater than 10% of revenues. One customer contributed primarily to our APC technology segment and represented 27% of consolidated revenues. The other customer contributed to our APC technology and FUEL CHEM technology segment and represented 13% of consolidated revenues. We had no customers that accounted for greater than 10% of our current assets as of December 31, 2018.
For the year ended December 31, 2017, we had one customer which individually represented greater than 10% of revenues. This customer contributed primarily to our FUEL CHEM technology segment and represented 10% of consolidated revenues. We had no customers that accounted for greater than 10% of our current assets as of December 31, 2017.
We control credit risk through requiring milestone payments on long-term contracts, performing ongoing credit evaluations of its customers, and in some cases obtaining security for payment through bank guarantees and letters of credit.
41
Treasury Stock
We use the cost method to account for its common stock repurchases. During the years ended December 31, 2019, 2018 and 2017, we withheld 140,784, 11,215 and 289,202 shares of our Common Shares, valued at approximately $128, $12 and $258, respectively, to settle personal tax withholding obligations that arose as a result of restricted stock units that vested. Refer to Note 6, “Treasury Stock,” for further discussion.
Recently Issued Accounting Pronouncements
In December 2019, the FASB issued ASU 2019-12, “Income Taxes (Topic 740): Simplifying the Accounting for Income Taxes.” The new rules reduce complexity by removing specific exceptions to general principles related to intraperiod tax allocations, ownership changes in foreign investments, and interim period income tax accounting for year-to-date losses that exceed anticipated losses. The new rules also simplify accounting for franchise taxes that are partially based on income, transactions with a government that result in a step up in the tax basis of goodwill, separate financial statements of legal entities that are not subject to tax, and enacted changes in tax laws in interim periods. The new rules will be effective for the Company in the first quarter of 2021, with early adoption permitted. The ASU permits either a retrospective basis or a modified retrospective transition approach. The Company is currently in the process of evaluating the impact of adoption of the new rules on the Company’s financial condition, results of operations, cash flows and disclosures.
In June 2016, the FASB issued ASU 2016-13, Financial Instruments - Credit Losses (Topic 326): Measurement of Credit Losses on Financial Instruments, which amends the current accounting guidance and requires the measurement of all expected losses based on historical experience, current conditions and reasonable and supportable forecasts. For trade receivables, loans, and other financial instruments, we will be required to use a forward-looking expected loss model rather than the incurred loss model for recognizing credit losses which reflects losses that are probable. The standard will become effective for interim and annual periods beginning after December 15, 2019, with early adoption permitted. Application of the amendments is through a cumulative-effect adjustment to retained earnings as of the effective date. The Company is currently in the process of evaluating the impact of adoption, but we do not believe the adoption of this standard will have a material impact on our financial statements.
2. DISCONTINUED OPERATIONS
During 2017, the Company suspended all operations associated with the Fuel Conversion business segment. The components of the net assets of the Fuel Conversion discontinued operations in Assets held for sale (which consisted primarily of certain equipment) on the Consolidated Balance Sheets totaling $0 and $485 as of December 31, 2019 and 2018, respectively. The Company sold the remaining Fuel Conversion equipment within Assets held during the year ended December 31, 2019 for sales proceeds net of selling costs of $505, resulting in a gain on sale of $20 recorded in discontinued operations. Following the sale of the remaining Fuel Conversion equipment during 2019, the Company completed the wind-down activities associated with the Fuel Conversion business segment. The Fuel Conversion business segment had no other assets or liabilities associated with it.
In addition, accrued severance of $0 and $65 is included in the other accrued liabilities line of the Consolidated Balance Sheets as of December 31, 2019 and 2018 respectively. The Company incurred $581 of severance costs relating to the suspension of the Fuel Conversion business segment, of which $205 was paid in 2017, $311was paid in 2018 and $65 was paid in 2019.
The activity of the Fuel Conversion discontinued operations consisted of Research and Development, severance, an impairment charge and other costs for the years ended December 31, 2019, 2018, and 2017 of $1, $113 and $3,914, respectively. The activity of the Fuel Conversion discontinued operations consisted primarily of storage costs for holding the equipment at a third-party location totaling $21 for the year ended December 31, 2019 and the gain on sale of $20 recorded in discontinued operations. The loss from discontinued operations in the Consolidated Statement of Operations for the year ended December 31, 2018 includes an impairment charge related to the Carbonite patent assets of $56 during the second quarter of 2018 as a result of not being able to reach an agreement with a third-party to acquire or license the Carbonite technology in combination with the sale of certain equipment included in Assets held for sale. The loss from discontinued operations in the Consolidated Statement of Operations for the year ended December 31, 2017 includes the severance charges associated with suspension of the Fuel Conversion business segment of $581. The loss from discontinued operations in the Consolidated Statement of Operations for the year ended December 31, 2017 includes an impairment charge related to the Carbonite intangible asset of $1,354 as a result of not being able to reach an agreement with a third-party to acquire or license the Carbonite technology. Absent a third-party agreement, management determined there was not adequate gross cash flows to support the carrying value of the asset and recorded the impairment charge during the fourth quarter of 2017. The Fuel Conversion business segment had no revenues associated with it.
3. REVENUE RECOGNITION
42
Adoption of ASC 606, "Revenue from Contracts with Customers"
On January 1, 2018, we adopted ASC 606 using the modified retrospective method applied to those contracts which were not completed as of January 1, 2018. Results for reporting periods beginning after January 1, 2018 are presented under ASC 606, while prior period amounts are not adjusted and continue to be reported in accordance with our legacy accounting under Accounting Standards Codification Topic 605: Revenue Recognition (ASC 605).
The cumulative effect of the changes made to our January 1, 2018 consolidated balance sheet for the adoption of ASC 606 were as follows:
Balance at December 31, 2017 | Adjustments Upon Adoption of ASC 606 | Balance at January 1, 2018 | ||||||
Liabilities | ||||||||
Other accrued liabilities | $ | 5,098 | (205 | ) | $ | 4,893 | ||
Equity | ||||||||
Accumulated deficit | (102,672 | ) | 205 | (102,467 | ) | |||
The adjustment made to the January 1, 2018 consolidated balance sheet related to deferred revenue under ASC 605 for the license of standalone functional intellectual property to a customer in one of our foreign locations which is recognized at a point in time upon adoption of ASC 606.
Practical Expedients and Exemptions
We generally expense sales commissions on a ratable basis when incurred because the amortization period would have been one year or less. These costs are recorded within selling, general and administrative expenses within the Consolidated Statements of Operations. A practical expedient was elected to not recognize shipping and handling costs as a separate performance obligation under ASC 606.
Disaggregated Revenue by Product Technology
The following table presents our revenues disaggregated by product technology:
Twelve Months Ended December 31, | |||||||||
2019 | 2018 | 2017 | |||||||
Air Pollution Control | |||||||||
Technology solutions | $ | 10,640 | $ | 35,176 | $ | 24,422 | |||
Spare parts | 1,031 | 1,083 | 1,022 | ||||||
Ancillary revenue | 2,411 | 2,158 | 2,364 | ||||||
Total Air Pollution Control Technology | 14,082 | 38,417 | 27,808 | ||||||
FUEL CHEM | |||||||||
FUEL CHEM technology solutions | 16,385 | 18,118 | 17,358 | ||||||
Total Revenues | $ | 30,467 | $ | 56,535 | $ | 45,166 | |||
(1) As noted above, 2017 amounts have not been adjusted under the modified retrospective method.
Disaggregated Revenue by Geography
The following table presents our revenues disaggregated by geography, based on the billing addresses of our customers:
43
Twelve Months Ended December 31, | |||||||||
2019 | 2018 | 2017 | |||||||
United States | $ | 25,882 | $ | 43,887 | $ | 29,510 | |||
Foreign Revenues | |||||||||
South America | 777 | 1,290 | 2,118 | ||||||
Europe | 2,322 | 6,260 | 6,206 | ||||||
Asia | 1,486 | 5,098 | 7,332 | ||||||
Total Foreign Revenues | 4,585 | 12,648 | 15,656 | ||||||
Total Revenues | $ | 30,467 | $ | 56,535 | $ | 45,166 | |||
(1) As noted above, 2017 amounts have not been adjusted under the modified retrospective method.
Timing of Revenue Recognition
The following table presents the timing of our revenue recognition:
Twelve Months Ended December 31, | |||||||||
2019 | 2018 | 2017 | |||||||
Products transferred at a point in time | $ | 19,827 | $ | 21,359 | $ | 20,744 | |||
Products and services transferred over time | 10,640 | 35,176 | 24,422 | ||||||
Total Revenues | $ | 30,467 | $ | 56,535 | $ | 45,166 | |||
(1) As noted above, 2017 amounts have not been adjusted under the modified retrospective method.
Contract Balances
The timing of revenue recognition, billings and cash collections results in billed accounts receivable, unbilled receivables (contract assets), and customer advances and deposits (contract liabilities) on the consolidated balance sheets. In our Air Pollution Control Technology segment, amounts are billed as work progresses in accordance with agreed-upon contractual terms. Generally, billing occurs subsequent to revenue recognition, resulting in contract assets. These assets are reported on the consolidated balance sheet on a contract-by-contract basis at the end of each reporting period. At December 31, 2019 and 2018, contract assets were approximately $1,857 and $5,540, respectively, and are included in accounts receivable on the consolidated balance sheets.
However, the Company will periodically bill in advance of costs incurred before revenue is recognized, resulting in contract liabilities. These liabilities are reported on the consolidated balance sheet on a contract-by-contract basis at the end of each reporting period. Contract liabilities were $712 and $1,234 at December 31, 2019 and 2018, respectively, and are included in other accrued liabilities on the consolidated balance sheets.
As of December 31, 2019 we had three construction contracts in progress that were identified as loss contracts and a provision for losses of $26 was recorded in other accrued liabilities on the consolidated balance sheet. As of December 31, 2018, we had five construction contracts in progress that were identified as loss contracts and a provision for losses of $123 was recorded in other accrued liabilities on the consolidated balance sheet.
Remaining Performance Obligations
Remaining performance obligations, represents the transaction price of Air Pollution Control technology booked orders for which work has not been performed. As of December 31, 2019, the aggregate amount of the transaction price allocated to remaining performance obligations was $9,671. The Company expects to recognize revenue on approximately $5,780 of the remaining performance obligations over the next 12 months with the remaining recognized thereafter.
Accounts Receivable
44
The components of accounts receivable are as follows:
As of | |||||||
December 31, 2019 | December 31, 2018 | ||||||
Trade receivables | $ | 6,425 | $ | 14,261 | |||
Unbilled receivables | 1,857 | 5,540 | |||||
Other short-term receivables | 7 | 9 | |||||
Allowance for doubtful accounts | (1,816 | ) | (1,411 | ) | |||
Total accounts receivable | $ | 6,473 | $ | 18,399 | |||
4. INCOME TAXES
On December 22, 2017, the United States (“U.S.”) enacted significant changes to the U.S. tax law following the passage and signing of H.R.1, “An Act to Provide for Reconciliation Pursuant to Titles II and V of the Concurrent Resolution on the Budget for Fiscal Year 2018” (the “Tax Act”) (previously known as “The Tax Cuts and Jobs Act”). The Tax Act included significant changes to existing tax law, including a permanent reduction to the U.S. federal corporate income tax rate from 35% to 21%, a one-time repatriation tax on deferred foreign income (“Transition Tax”), deductions, credits and business-related exclusions.
On December 22, 2017, the SEC issued guidance under Staff Accounting Bulletin No. 118, Income Tax Accounting Implications of the Tax Cuts and Jobs Act (“SAB 118”) directing taxpayers to consider the impact of the U.S. legislation as “provisional” when it does not have the necessary information available, prepared or analyzed (including computations) in reasonable detail to complete its accounting for the change in tax law. The Company did not record additional provisional income tax given the Company has full valuation allowances on its deferred tax assets and liabilities and the net operating loss generated in 2017.
Accordingly, the Company’s income tax provision as of December 31, 2018 and 2017 reflects (i) the current year impacts of the U.S. Tax Act on the estimated annual effective tax rate and (ii) the following discrete items resulting directly from the enactment of the Tax Act based on the information available, prepared, or analyzed (including computations) in reasonable detail:
(a) The Tax Act reduced the U.S. federal corporate tax rate from 35% to 21%. The impact from the permanent reduction to the U.S. federal corporate income tax rate from 35% to 21% is effective January 1, 2018. The Company adjusted the deferred tax asset and liabilities and the corresponding valuation reserve as a result of the reduction in the U.S. federal corporate tax rate.
The Tax Act created a new requirement that certain income (commonly referred to as “GILTI”) earned by controlled foreign corporations (CFC’s) must be included currently in the gross income of the CFC’s U.S. shareholder. Under U.S. GAAP, we are allowed to make an accounting policy choice of either (1) treating taxes due on U.S. inclusions in taxable income related to GILTI as a current period expense when incurred (the “period cost method”) or (2) factoring such amounts into the Company’s measurement of its deferred taxes (the “deferred method”). Our selection of an accounting policy of the new GILTI tax rules will depend on analyzing our global income to determine whether we expect to have future U.S. inclusions in taxable income related to GILTI and, if so, what the impact is expected to be. The Company has included an estimate of the GILTI tax in the Company’s annualized effective tax rate used to determine tax expense for the years ended December 31, 2019 and 2018.
Within the calculation of the Company’s annual effective tax rate the Company has used assumptions and estimates that may change as a result of future guidance, interpretation, and rule-making from the Internal Revenue Service, the SEC, and the FASB and/or various other taxing jurisdictions. For example, the Company anticipates that the state jurisdictions will continue to determine and announce their conformity to the Tax Act which could have an impact on the annual effective tax rate.
The components of income (loss) before taxes for the years ended December 31 are as follows:
Origin of income before taxes | 2019 | 2018 | 2017 | |||||||||
United States | $ | (5,387 | ) | $ | 3,277 | $ | (9,821 | ) | ||||
Foreign | (2,378 | ) | (3,272 | ) | (1,208 | ) | ||||||
Income (Loss) before income taxes | $ | (7,765 | ) | $ | 5 | $ | (11,029 | ) | ||||
45
Significant components of income tax benefit (expense) for the years ended December 31 are as follows:
2019 | 2018 | 2017 | ||||||||||
Current: | ||||||||||||
Federal | $ | — | $ | (18 | ) | $ | 111 | |||||
State | (14 | ) | (13 | ) | — | |||||||
Foreign | — | — | (65 | ) | ||||||||
Total current | (14 | ) | (31 | ) | 46 | |||||||
Deferred: | ||||||||||||
Federal | — | (2 | ) | 534 | ||||||||
Foreign | — | — | — | |||||||||
Total deferred | — | (2 | ) | 534 | ||||||||
Income tax benefit (expense) | $ | (14 | ) | $ | (33 | ) | $ | 580 | ||||
A reconciliation between the provision for income taxes calculated at the U.S. federal statutory income tax rate and the consolidated income tax expense in the consolidated statements of operations for the years ended December 31 is as follows:
2019 | 2018 | 2017 | |||||||
Provision at the U.S. federal statutory rate | 21.0 | % | 21.0 | % | 34.0 | % | |||
State taxes, net of federal benefit | 2.7 | % | (86.5 | )% | — | % | |||
Foreign tax rate differential | — | % | (2,210.3 | )% | (0.9 | )% | |||
Valuation allowance | (29.2 | )% | (7,152.8 | )% | 15.0 | % | |||
Federal tax rate change | — | % | — | % | (43.9 | )% | |||
Other true up | 1.6 | % | 8,904.9 | % | — | % | |||
Intangible assets impairment and other non-deductibles | 2.3 | % | 2,194.6 | % | (1.8 | )% | |||
Other | 1.8 | % | (994.6 | )% | 2.1 | % | |||
Income tax benefit (expense) effective rate | 0.2 | % | 676.3 | % | 4.5 | % | |||
The deferred tax assets and liabilities at December 31 are as follows:
2019 | 2018 | |||||||
Deferred tax assets: | ||||||||
Stock compensation expense | $ | 1,882 | $ | 1,867 | ||||
Goodwill | 1,490 | 1,927 | ||||||
Royalty accruals | 560 | 484 | ||||||
Bad debt allowance | 466 | 345 | ||||||
Net operating loss carryforwards | 9,146 | 6,654 | ||||||
Credit carry-forwards | 814 | 685 | ||||||
Inventory reserve | 243 | 277 | ||||||
Depreciation | 502 | 515 | ||||||
Other | 340 | 539 | ||||||
Total deferred tax assets | 15,443 | 13,293 | ||||||
Deferred tax liabilities: | ||||||||
Intangible assets | (220 | ) | (283 | ) | ||||
Other | — | (137 | ) | |||||
Total deferred tax liabilities | (220 | ) | (420 | ) | ||||
Net deferred tax asset before valuation allowance | 15,223 | 12,873 | ||||||
Valuation allowances for deferred tax assets | (15,394 | ) | (13,044 | ) | ||||
Net deferred tax liability | $ | (171 | ) | $ | (171 | ) | ||
46
The change in the valuation allowance for deferred tax assets for the years ended December 31 is as follows:
Year | Balance at January 1 | Charged to costs and expenses | (Deductions)/Other | Balance at December 31 | ||||||||||
2017 | $ | 13,179 | (945 | ) | — | $ | 12,234 | |||||||
2018 | $ | 12,234 | 810 | — | $ | 13,044 | ||||||||
2019 | $ | 13,044 | 2,350 | — | $ | 15,394 | ||||||||
For the years ended December 31, 2019, 2018 and 2017, there were no exercises of stock options.
As required by ASC 740, we recognize the financial statement benefit of a tax position only after determining that the relevant tax authority would more likely than not sustain the position following an audit. For tax positions meeting the more-likely-than-not threshold, the amount recognized in the financial statements is the largest benefit that has a greater than 50% likelihood of being realized upon ultimate settlement with the relevant tax authority.
We recognize interest and penalties related to unrecognized tax benefits in income tax expense for all periods presented. There were no interest and penalties recognized in income tax expense during the years ended December 31, 2019, 2018 and 2017. There were no unrecognized tax benefits as of December 31, 2019, 2018 and 2017.
We are subject to taxation in the U.S., various states, and in non-U.S. jurisdictions. Our U.S. income tax returns are primarily subject to examination from 2016 through 2018; however, U.S. tax authorities also have the ability to review prior tax years to the extent loss carryforwards and tax credit carryforwards are utilized. The open years for the non-U.S. tax returns range from 2011 through 2018 based on local statutes.
On April 3, 2019, the Company received notice from the Internal Revenue Service that our U.S. income tax return for the year ended December 31, 2016 is currently under audit.
Management periodically estimates our probable tax obligations using historical experience in tax jurisdictions and informed judgments. There are inherent uncertainties related to the interpretation of tax regulations in the jurisdictions in which we transact business. The judgments and estimates made at a point in time may change based on the outcome of tax audits, as well as changes to or further interpretations of regulations. If such changes take place, there is a risk that the tax rate may increase or decrease in any period. Tax accruals for tax liabilities related to potential changes in judgments and estimates for both federal and state tax issues are included in current liabilities on the consolidated balance sheet.
The investment in foreign subsidiaries other than Fuel Tech S.p.A (Chile) and Beijing Fuel Tech is considered to be indefinite in duration and therefore we have not provided a provision for deferred U.S. income taxes on the unremitted earnings from those subsidiaries. A provision has not been established because it is not practicable to determine the amount of unrecognized deferred tax liability for such unremitted foreign earnings and because it is our present intention to reinvest the undistributed earnings indefinitely.
As of December 31, 2019, the investment in Fuel Tech S.p.A (Chile) was no longer considered to be indefinite and a provision for deferred U.S income taxes was recorded. The deferred income taxes associated with this investment are offset by a valuation allowance.
As required by ASC 740, a valuation allowance must be established when it is more likely than not that all or a portion of a deferred tax asset will not be realized. We have approximately $17,469 of US net operating loss carryforwards available to offset future US taxable income as of December 31, 2019. The net operating loss carry-forwards related to tax losses generated in prior years in the US begin to expire in 2034. Further, we have tax loss carry-forwards of approximately $5,681 available to offset future foreign income in Italy as of December 31, 2019. We have recorded a full valuation allowance against the resulting $1,363 deferred tax asset because we cannot anticipate when or if this entity will have taxable income sufficient to utilize the net operating losses in the future. There is no expiration of the net operating loss carry-forwards related to tax losses generated in prior years in Italy. Finally, we have tax loss carry-forwards of approximately $12,689 available to offset future foreign income in China as of December 31, 2019. The net operating loss carry-forwards related to tax losses generated in prior years in China expire in 2022.
47
5. COMMON SHARES
At December 31, 2019 and 2018, respectively, we had 25,053,480 and 24,825,891 Common Shares issued and 24,592,578 and 24,170,585 outstanding, with an additional 6,715 shares reserved for issuance upon conversion of the nil coupon non-redeemable convertible unsecured loan notes (see Note 7). As of December 31, 2019, we had 5,600,676 shares reserved for issuance upon the exercise or vesting of equity awards, of which 747,500 are stock options that are currently exercisable (see Note 8).
6. TREASURY STOCK
Common shares held in treasury totaled 796,090 and 655,306 with a cost of $1,612 and $1,484 at December 31, 2019 and 2018, respectively. These shares were withheld from employees to settle personal tax withholding obligations that arose as a result of restricted stock units that vested during the current and prior years.
48
7. NIL COUPON NON-REDEEMABLE CONVERTIBLE UNSECURED LOAN NOTES
At December 31, 2019 and 2018, respectively, we had a principal amount of $76 of nil coupon non-redeemable convertible unsecured perpetual loan notes (the “Loan Notes”) outstanding. The Loan Notes are convertible at any time into Common Shares at rates of $6.50 and $11.43 per share, depending on the note. As of December 31, 2019, the nil coupon loan notes were convertible into 6,715 common shares. Based on our closing stock price of $0.95 at December 31, 2019, the aggregate fair value of the common shares that the holders would receive if all the loan notes were converted would be approximately $6, which is less than the principal amount of the loans outstanding as of that date. The Loan Notes bear no interest and have no maturity date. They are repayable in the event of our dissolution and the holders do not have the option to cash-settle the notes. Accordingly, they have been classified within stockholders’ equity in the accompanying balance sheet. The notes do not hold distribution or voting rights unless and until converted into common shares.
For the years ended December 31, 2019 and 2018, there were no Loan Notes repurchased by the Company.
8. STOCK-BASED COMPENSATION
Under our stock-based employee compensation plan, referred to as the Fuel Tech, Inc. 2014 Long-Term Incentive Plan (Incentive Plan), awards may be granted to participants in the form of Non-Qualified Stock Options, Incentive Stock Options, Stock Appreciation Rights, Restricted Stock, Restricted Stock Units (“RSUs”), Performance Awards, Bonuses or other forms of share-based or non-share-based awards or combinations thereof. Participants in the Incentive Plan may be our directors, officers, employees, consultants or advisors (except consultants or advisors in capital-raising transactions) as the directors determine are key to the success of our business. There are a maximum of 5,600,676 shares that may be issued or reserved for awards to participants under the Incentive Plan which includes 1,200,000 additional shares as a result of an amendment to the Incentive Plan approved by our stockholders in May 2018. At December 31, 2019, we had approximately 2,231,382 equity awards available for issuance under the Incentive Plan.
Stock-based compensation is included in selling, general and administrative costs in our consolidated statements of operations.
The components of stock-based compensation from continuing operations for the years ended December 31, 2019, 2018 and 2017 were as follows:
For the Year Ended December 31, | ||||||||||||
2019 | 2018 | 2017 | ||||||||||
Stock options | $ | — | $ | — | $ | 120 | ||||||
Restricted stock units | 574 | 233 | 1,269 | |||||||||
Total stock-based compensation expense | 574 | 233 | 1,389 | |||||||||
Tax benefit of stock-based compensation expense | — | — | — | |||||||||
After-tax effect of stock based compensation | $ | 574 | $ | 233 | $ | 1,389 | ||||||
As of December 31, 2019, there was $359 of total unrecognized compensation cost related to all non-vested share-based compensation arrangements granted under the Incentive Plan. That cost is expected to be recognized over the remaining requisite service period of 1.5 years.
Stock Options
The stock options granted to employees under the Incentive Plan have a 10-year life and they vest as follows: 50% after the second anniversary of the award date, 25% after the third anniversary, and the final 25% after the fourth anniversary of the award date. Fuel Tech calculates stock compensation expense for employee option awards based on the grant date fair value of the award, less expected annual forfeitures, and recognizes expense on a straight-line basis over the four-year service period of the award. Stock options granted to members of our Board of Directors vest immediately. Stock compensation for these awards is based on the grant date fair value of the award and is recognized in expense immediately.
Fuel Tech uses the Black-Scholes option pricing model to estimate the grant date fair value of employee stock options. The principal variable assumptions utilized in valuing options and the methodology for estimating such model inputs include: (1) risk-free interest rate – an estimate based on the yield of zero–coupon treasury securities with a maturity equal to the expected life of the option; (2) expected volatility – an estimate based on the historical volatility of Fuel Tech’s Common Stock for a period equal to the expected life of the option; and (3) expected life of the option – an estimate based on historical experience including the effect of employee terminations.
49
Based on the results of the model, the weighted-average fair value of the stock options granted during the 12-month period ended December 31, 2017 were $0.68 per share using the following weighted average assumptions:
2017 | |||
Expected dividend yield | — | % | |
Risk-free interest rate | 2.33 | % | |
Expected volatility | 61.2 | % | |
Expected life of option | 10 years | ||
There were no stock options granted during the year ended December 31, 2019 and 2018.
The following table presents a summary of our stock option activity and related information for the years ended December 31:
2019 | 2018 | 2017 | |||||||||||||||||||
Number of Options | Weighted- Average Exercise Price | Number of Options | Weighted- Average Exercise Price | Number of Options | Weighted- Average Exercise Price | ||||||||||||||||
Outstanding at beginning of year | 932,500 | $ | 4.68 | 1,116,750 | $ | 6.34 | 1,039,750 | $ | 8.39 | ||||||||||||
Granted | — | — | — | — | 176,000 | 0.96 | |||||||||||||||
Expired or forfeited | (185,000 | ) | 10.14 | (184,250 | ) | 14.72 | (99,000 | ) | 18.32 | ||||||||||||
Outstanding at end of year | 747,500 | $ | 3.33 | 932,500 | $ | 4.68 | 1,116,750 | $ | 6.34 | ||||||||||||
Exercisable at end of year | 747,500 | $ | 3.33 | 932,500 | $ | 4.68 | 1,116,750 | $ | 6.34 | ||||||||||||
Weighted-average fair value of options granted during the year | $ | — | $ | — | $ | 0.68 | |||||||||||||||
Weighted-Average Remaining Contractual Life | 4.73 years | 4.67 years | 4.80 years | ||||||||||||||||||
Aggregate Intrinsic Value | $ | — | $ | 40 | $ | 27 | |||||||||||||||
The aggregate intrinsic value in the preceding table represents the total pretax intrinsic value, based on our closing stock price of $0.95 as of December 31, 2019, which would have been received by the option holders had those options holders exercised their stock options as of that date.
The following table summarizes information about stock options outstanding at December 31, 2019:
Options Outstanding and Exercisable | |||||||||
Range of Exercise Prices | Number of Options | Weighted- Average Remaining Contractual Life | Weighted- Average Exercise Price | ||||||
$0.96 - $1.27 | 176,000 | 7.9 years | $ | 0.97 | |||||
$1.28 - $3.00 | 207,000 | 5.8 years | 2.10 | ||||||
$3.01 - $4.54 | 140,000 | 3.0 years | 3.72 | ||||||
$4.55 - $9.06 | 224,500 | 2.4 years | 6.08 | ||||||
747,500 | 4.7 years | $ | 3.33 | ||||||
As of and for the 12 months ended December 31, 2019, there was no non-vested stock option activity and $0 of total unrecognized compensation cost related to non-vested stock options granted under the Incentive Plan. Fuel Tech received no proceeds from the exercise of stock options in the years ended December 31, 2019, 2018 and 2017, respectively. It is our policy to issue new shares upon option exercises, loan conversions, and vesting of restricted stock units. We have not used cash and do not anticipate any future use of cash to settle equity instruments granted under share-based payment arrangements.
Restricted Stock Units
50
Restricted stock units (RSUs) granted to employees vest over time based on continued service (typically vesting over a period between two and four years). Such time-vested RSUs are valued at the date of grant using the intrinsic value method based on the closing price of the Common Shares on the grant date. Compensation cost, adjusted for estimated forfeitures, is amortized on a straight-line basis over the requisite service period.
During the years ended December 31, 2019 and 2018, there were 562,777 and 48,890 restricted stock units that vested with a grant date fair value of $554 and $77, respectively.
A summary of restricted stock unit activity for the years ended December 31, 2019, 2018 and 2017 is as follows:
Shares | Weighted Average Grant Date Fair Value | |||||
Unvested restricted stock units at December 31, 2016 | 1,463,796 | 2.82 | ||||
Granted | 1,090,000 | 0.97 | ||||
Forfeited | (213,001 | ) | 2.99 | |||
Vested (1) | (981,633 | ) | 2.85 | |||
Unvested restricted stock units at December 31, 2017 | 1,359,162 | 1.28 | ||||
Forfeited | (199,995 | ) | 1.59 | |||
Vested | (48,890 | ) | 1.59 | |||
Unvested restricted stock units at December 31, 2018 | 1,110,277 | 1.21 | ||||
Granted | 228,135 | 1.52 | ||||
Vested | (562,777 | ) | 0.98 | |||
Unvested restricted stock units at December 31, 2019 | 775,635 | 1.47 | ||||
(1) The increase in shares vested in 2017 is due to the accelerated time vesting of outstanding remaining restricted stock units approved by the Company's Board of Directors on June 28, 2017.
Deferred Directors Fees
In addition to the Incentive Plan, Fuel Tech has a Deferred Compensation Plan for Directors (Deferred Plan). Under the terms of the Deferred Plan, Directors can elect to defer Directors’ fees for shares of Fuel Tech Common Stock that are issuable at a future date as defined in the agreement. In accordance with ASC 718, Fuel Tech accounts for these awards as equity awards as opposed to liability awards. In 2019, 2018 and 2017, there was no stock-based compensation expense under the Deferred Plan.
9. COMMITMENTS AND CONTINGENCIES
Fuel Tech is subject to various claims and contingencies related to, among other things, workers compensation, general liability (including product liability), and lawsuits. The Company records liabilities where a contingent loss is probable and can be reasonably estimated. If the reasonable estimate of a probable loss is a range, the Company records the most probable estimate of the loss or the minimum amount when no amount within the range is a better estimate than any other amount. The Company discloses a contingent liability even if the liability is not probable or the amount is not estimable, or both, if there is a reasonable possibility that a material loss may have been incurred.
From time to time we are involved in litigation with respect to matters arising from the ordinary conduct of our business. In the opinion of management, based upon presently available information, either adequate provision for anticipated costs have been accrued or the ultimate anticipated costs will not materially affect our consolidated financial position, results of operations, or cash flows. We do not believe we have any pending loss contingencies that are probable or reasonably possible of having a material impact on our consolidated financial position, results of operations or cash flows.
During the fourth quarter of 2018, we were notified of certain design non-conformances in a project with a U.S. customer that required remedial warranty work under the contract. For the year ended December 31, 2019, we recognized remediation costs of $2,241 included within costs of sales in the Consolidated Statements of Operations. The Company believes there are no ongoing remedial obligations to the customer. In connection with this matter, in early 2019 we notified our errors and omission insurer of the claim and were issued a letter confirming coverage of the claim under the applicable policy. Although we have periodically submitted expenses for reimbursement to our insurer, as of the filing date the insurer has not yet fully completed its
51
review of submitted reimbursement requests. In light of the pending status of the settlement, the Company determined, in the exercise of its judgment as prescribed by ASC 450 Contingencies, to not reflect any benefits that might be realized from our insurer and will reflect such benefit at such time as settlement with our insurer becomes certain.
As of December 31, 2019, we have recorded no receivables from the insurance carrier and a total accrued liability associated with the completion of the non-conformance issues of $146 in the other accrued liabilities line of the Consolidated Balance Sheets.
Performance Guarantees
The majority of Fuel Tech’s long-term equipment construction contracts contain language guaranteeing that the performance of the system that is being sold to the customer will meet specific criteria. On occasion, performance surety bonds and bank performance guarantees/letters of credit are issued to the customer in support of the construction contracts as follows:
• | in support of the warranty period defined in the contract; or |
• | in support of the system performance criteria that are defined in the contract. |
As of December 31, 2019, we had outstanding bank performance guarantees and letters of credit in the amount of $2,461 in support of equipment construction contracts that have not completed their final acceptance test or that are still operating under a warranty period. The performance guarantees and letters of credit expire in dates ranging from May 2020 through February 2023. The expiration dates may be extended if the project completion dates are extended. Our management believes it is probable that these projects will be successfully completed and that there will not be a material adverse impact on our operations from these bank performance guarantees and letters of credit. As a result, no liability has been recorded for these performance guarantees.
Product Warranties
We issue a standard product warranty with the sale of our products to customers. Our recognition of warranty liability is based primarily on analyses of warranty claims experience in the preceding years as the nature of our historical product sales for which we offer a warranty are substantially unchanged. This approach provides an aggregate warranty accrual that is historically aligned with actual warranty claims experienced. There was 0 changes in the warranty liability from continuing operations in 2019, 2018 and 2017. The warranty balance was $159 at December 31, 2019, 2018 and 2017.
10. LEASES
Adoption of ASC 842, "Leases"
On January 1, 2019, we adopted ASC 842 using the modified retrospective method outlined in ASU 2018-11 "Leases (Topic 842) Targeted Improvements." Results for reporting periods beginning after January 1, 2019 are presented under ASC 842, while prior period amounts are not adjusted and continue to be reported in accordance with our legacy accounting under Accounting Standards Codification Topic 840: Leases (ASC 840). The Company recorded the transition to ASC 842 by recognizing a cumulative-effect adjustment to the opening balance of retained earnings in the period of adoption rather than in the earliest period presented.
We have elected the package of practical expedients permitted under the transition guidance, which among other things, allow us to carry forward the historical accounting relating to lease identification and classification for existing leases upon adoption. We have also elected the practical expedient to not separate lease and non-lease components for the majority of our leases and the election to keep leases with an initial term of 12 months or less off of the consolidated balance sheet.
The cumulative effect of the changes made to our January 1, 2019 consolidated balance sheet for the adoption of ASC 842 were as follows:
52
Balance at December 31, 2018 | Adjustments Upon Adoption of ASC 842 | Balance at January 1, 2019 | |||||||
Assets | |||||||||
Right-of-use operating lease assets | $ | — | $ | 1,592 | $ | 1,592 | |||
Liabilities | |||||||||
Other accrued liabilities | 6,099 | (22 | ) | 6,077 | |||||
Operating lease liabilities - current | — | 650 | 650 | ||||||
Operating lease liabilities - non-current | — | 942 | 942 | ||||||
Equity | |||||||||
Accumulated deficit | (102,495 | ) | 22 | (102,473 | ) | ||||
The adjustment made to the January 1, 2019 consolidated balance sheet related to an accrued liability for lease escalation clauses in certain of our leases under ASC 840 which is a cumulative-effect adjustment to the opening balance of accumulated deficit upon the adoption of ASC 842.
Leases
The terms of the Company’s four primary office space lease arrangements are as follows:
• | The Gallarate, Italy building lease, for approximately 1,636 square feet, runs from May 1, 2019 to April 30, 2025. This facility serves as the operating headquarters for our European operations. |
• | The Westlake, Ohio building lease, for approximately 3,000 square feet, runs from May 1, 2017 to April 30, 2020. This facility houses engineering operations. |
• | The Aurora, IL warehouse lease, for approximately 11,000 square feet, runs from September 1, 2013 to December 31, 2020. This facility serves as an outside warehouse facility. On January 30, 2020, the Company extended the lease for three years to expire on December 31, 2023. |
• | The Overland Park, KS lease, for approximately 600 square feet, runs from October 16, 2018 to October 15, 2021. This facility serves primarily as a sales office. |
The Company also has four additional operating leases related to certain office equipment and company leased vehicles. Our leases have remaining lease terms of 1 year to 6 years. Our leases do not contain any material residual value guarantees or material restricted covenants and we currently have no material sublease arrangements. We have no financing leases as defined under ASC 842.
We were party to a sublease agreement with American Bailey Corporation (ABC) that obligated ABC to reimburse us for its share of lease and lease-related expenses under our February 1, 2010 lease of executive offices in Stamford, Connecticut. The Company did not renew the lease following its expiration on December 31, 2019. Please refer to Note 12 to the consolidated financial statements for a discussion of our relationship with ABC.
Total operating lease expense for the year ended December 31, 2019 is as follows:
Operating lease cost | $ | 661 | |
Short-term lease cost | 136 | ||
Total lease cost | $ | 797 | |
Prior to the adoption of ASC 842, rent expense, net of related party sub-lease income, was approximately $745 and $902 for the years ended December 31, 2018 and 2017.
The weighted average remaining lease term was 4.5 years as of December 31, 2019. The weighted average discount rate was 3.37% as of December 31, 2019.
53
Remaining maturities of our existing lease liabilities as of December 31, 2019 were as follows:
Year Ending December 31, | Operating Leases | ||
2020 | 318 | ||
2021 | 227 | ||
2022 | 170 | ||
2023 | 161 | ||
Thereafter | 207 | ||
Total lease payments | $ | 1,083 | |
Less imputed interest | (103 | ) | |
Total | $ | 980 | |
The following is the balance sheet classification of our existing lease liabilities as of December 31, 2019:
Operating lease liabilities - current | $ | 300 | |
Operating lease liabilities - non-current | 680 | ||
Total operating lease liabilities | $ | 980 | |
Supplemental cash flow information related to leases was as follows:
For the Twelve Months ended December 31, 2019 | |||
Cash paid for amounts included in the measurement of lease liabilities | $ | 645 | |
Leased assets obtained in exchange for operating lease liabilities | 609 | ||
11. DEBT FINANCING
On June 19, 2019, the Company entered into a Cash Collateral Security agreement with BMO Harris Bank, N.A. (the BMO Harris agreement) to use for the sole purpose of issuing standby letters of credit. The BMO Harris agreement requires us to pledge as cash collateral 105% of the aggregate face amount of outstanding standby letters of credit. The Company pays 250 basis points on the face values of outstanding letters of credit. There are no financial covenants set forth in the BMO Harris agreement. At December 31, 2019, the Company had outstanding standby letters of credit totaling approximately $2,461 under the BMO Harris agreement. As of December 31, 2019, the Company held $2,587 in a separate restricted use designated BMO Harris Bank N.A. deposit account. Fuel Tech is committed to reimbursing the issuing bank for any payments made by the bank under these instruments.
In connection with the transition to BMO Harris Bank N.A., the Company canceled its U.S. Domestic credit facility (the Facility) with JPMorgan Chase Bank, N.A. (JPM Chase) effective on September 25, 2019.
The Company was previously obligated under the Facility with JPM Chase which provided for maximum revolving credit borrowings of $5,500. Fuel Tech used this Facility primarily for standby letters of credit. The Facility was secured by $5,500 in cash held by the Company in a separate restricted use designated JPM Chase deposit account and has the Company’s Italian subsidiary, Fuel Tech S.r.l., as a guarantor. Outstanding borrowings under the Facility bore interest at a rate of LIBOR plus 300 basis points. There were no financial covenants set forth in this Facility. The Facility was amended on several occasions during 2019 and 2018, most recently June 19, 2019, in order to amend the maximum availability under the Facility. As of December 31, 2018, there were no outstanding borrowings under the Facility.
At December 31, 2018, we had outstanding standby letters of credit and bank guarantees totaling approximately $5,028 on our domestic credit facility in connection with contracts in process. We were committed to reimbursing the issuing bank for any payments made by the bank under these instruments. At December 31, 2018, there were no cash borrowings under the domestic revolving credit facility and approximately $443 was available for future borrowings under the Facility. We paid a commitment fee of 0.25% per year on the unused portion of the revolving credit facility.
54
Beijing Fuel Tech Environmental Technologies Company, Ltd. (Beijing Fuel Tech), was previously obligated under a revolving credit facility (the China Facility) agreement, as most recently amended on October 19, 2018, with JPM Chase which provided for maximum revolving credit borrowings of RMB 2.625 million (approximately $382) and matured on June 30, 2019. The Facility was secured by $520 in cash held by the Company in a separate restricted use designated JPM Chase deposit account. The China Facility bears interest at a rate of 140% of the People’s Bank of China (PBOC) Base Rate, and is guaranteed by the Company. Beijing Fuel Tech can use this facility for cash advances and bank guarantees. As of December 31, 2018, Beijing Fuel Tech had no cash borrowings under the China Facility. At December 31, 2018, we had no outstanding standby letters of credit and bank guarantees on its Beijing Fuel Tech revolving credit facility in connection with contracts in process. At December 31, 2018, approximately $382 was available for future borrowings. As a result of the announcement of the suspension of the Air Pollution Control business in Beijing, the Company did not renew the China Facility upon its expiration on June 30, 2019.
12. RELATED PARTY TRANSACTIONS
Persons now or formerly associated with American Bailey Corporation (ABC) currently own approximately 27% of our outstanding Common Shares. ABC was a sub-lessee under our February 1, 2010 lease of its offices in Stamford, Connecticut, which ran through December 31, 2019. The Company did not renew the lease following its expiration on December 31, 2019. ABC reimburses us for its share of lease and lease-related expenses under the sublease agreement. The Stamford facility houses certain administrative functions. The amounts earned from ABC related to the subleases for the years ended December 31, 2019, 2018 and 2017, were $165, $164 and $164, respectively. The amount due from ABC related to the sublease agreement was $27 and $40 at December 31, 2019 and 2018 respectively.
13. DEFINED CONTRIBUTION PLAN
We have a retirement savings plan available for all our U.S. employees who have met minimum length-of-service requirements. Our contributions are determined based upon amounts contributed by the employees with additional contributions made at the discretion of the Board of Directors. Costs related to this plan were $262, $231 and $285 in 2019, 2018 and 2017, respectively.
14. BUSINESS SEGMENT, GEOGRAPHIC AND QUARTERLY FINANCIAL DATA
Business Segment Financial Data
We segregate our financial results into two reportable segments representing two broad technology segments as follows:
• | The Air Pollution Control technology segment includes technologies to reduce NOx emissions in flue gas from boilers, incinerators, furnaces and other stationary combustion sources. These include Low and Ultra Low NOx Burners (LNB and ULNB), Over-Fire Air (OFA) systems, NOxOUT® and HERT™ Selective Non-Catalytic Reduction (SNCR) systems, and Advanced Selective Catalytic Reduction (ASCR™) systems. Our ASCR systems include ULNB, OFA, and SNCR components, along with a downsized SCR catalyst, Ammonia Injection Grid (AIG), and Graduated Straightening Grid GSG™ systems to provide high NOx reductions at significantly lower capital and operating costs than conventional SCR systems. The NOxOUT CASCADE® and NOxOUT-SCR® processes are more basic, using just SNCR and SCR catalyst components. ULTRA® technology creates ammonia at a plant site using safe urea for use with any SCR application. Flue Gas Conditioning systems are chemical injection systems offered in markets outside the U.S. and Canada to enhance electrostatic precipitator and fabric filter performance in controlling particulate emissions. |
• | The FUEL CHEM® technology segment, which uses chemical processes in combination with advanced CFD and CKM boiler modeling, for the control of slagging, fouling, corrosion, opacity and other sulfur trioxide-related issues in furnaces and boilers through the addition of chemicals into the furnace using TIFI® Targeted In-Furnace Injection™ technology. |
The “Other” classification includes those profit and loss items not allocated to either reportable segment. There are no inter-segment sales that require elimination.
We evaluate performance and allocate resources based on gross margin by reportable segment. The accounting policies of the reportable segments are the same as those described in the summary of significant accounting policies. We do not review assets by reportable segment, but rather, in aggregate for the Company as a whole.
Information about reporting segment net sales and gross margin from continuing operations are provided below:
55
For the year ended December 31, 2019 | Air Pollution Control Segment | FUEL CHEM Segment | Other | Total | ||||||||||||
Revenues from external customers | $ | 14,082 | $ | 16,385 | $ | — | $ | 30,467 | ||||||||
Cost of sales | (11,256 | ) | (8,381 | ) | — | (19,637 | ) | |||||||||
Gross margin | 2,826 | 8,004 | — | 10,830 | ||||||||||||
Selling, general and administrative | — | — | (17,191 | ) | (17,191 | ) | ||||||||||
Restructuring charge | (625 | ) | — | — | (625 | ) | ||||||||||
Research and development | — | — | (1,127 | ) | (1,127 | ) | ||||||||||
Intangible assets abandonment | — | — | (127 | ) | (127 | ) | ||||||||||
Operating income (loss) from continuing operations | $ | 2,201 | $ | 8,004 | $ | (18,445 | ) | $ | (8,240 | ) | ||||||
For the year ended December 31, 2018 | Air Pollution Control Segment | FUEL CHEM Segment | Other | Total | ||||||||||||
Revenues from external customers | $ | 38,417 | $ | 18,118 | $ | — | $ | 56,535 | ||||||||
Cost of sales | (27,382 | ) | (9,089 | ) | — | (36,471 | ) | |||||||||
Gross margin | 11,035 | 9,029 | — | 20,064 | ||||||||||||
Selling, general and administrative | — | — | (18,564 | ) | (18,564 | ) | ||||||||||
Research and development | — | — | (1,073 | ) | (1,073 | ) | ||||||||||
Intangible assets abandonment | — | — | (317 | ) | (317 | ) | ||||||||||
Operating income (loss) from continuing operations | $ | 11,035 | $ | 9,029 | $ | (19,954 | ) | $ | 110 | |||||||
For the year ended December 31, 2017 | Air Pollution Control Segment | FUEL CHEM Segment | Other | Total | ||||||||||||
Revenues from external customers | $ | 27,808 | $ | 17,358 | $ | — | $ | 45,166 | ||||||||
Cost of sales | (18,478 | ) | (8,666 | ) | — | (27,144 | ) | |||||||||
Gross margin | 9,330 | 8,692 | — | 18,022 | ||||||||||||
Selling, general and administrative | — | — | (20,933 | ) | (20,933 | ) | ||||||||||
Restructuring charge | (58 | ) | (61 | ) | — | (119 | ) | |||||||||
Research and development | — | — | (1,070 | ) | (1,070 | ) | ||||||||||
Building impairment | — | — | (2,965 | ) | (2,965 | ) | ||||||||||
Operating income (loss) from continuing operations | $ | 9,272 | $ | 8,631 | $ | (24,968 | ) | $ | (7,065 | ) | ||||||
Geographic Segment Financial Data
Information concerning our operations by geographic area is provided below. Revenues are attributed to countries based on the location of the customer. Assets are those directly associated with operations of the geographic area.
For the years ended December 31, | 2019 | 2018 | 2017 | |||||||||
Revenues: | ||||||||||||
United States | $ | 25,882 | $ | 43,887 | $ | 29,510 | ||||||
Foreign | 4,585 | 12,648 | 15,656 | |||||||||
$ | 30,467 | $ | 56,535 | $ | 45,166 | |||||||
As of December 31, | 2019 | 2018 | ||||||
Assets: | ||||||||
United States | $ | 23,460 | $ | 36,784 | ||||
Foreign | 8,764 | 14,935 | ||||||
$ | 32,224 | $ | 51,719 | |||||
56
15. FAIR VALUE MEASUREMENTS
We apply authoritative accounting guidance for fair value measurements of financial and non-financial assets and liabilities. This guidance defines fair value, establishes a consistent framework for measuring fair value and expands disclosure for each major asset and liability category measured at fair value on either a recurring or nonrecurring basis and clarifies that fair value is an exit price, representing the amount that would be received to sell an asset or paid to transfer a liability in an orderly transaction between market participants. As such, fair value is a market-based measurement that should be determined based on assumptions that market participants would use in pricing an asset or liability. As a basis for considering such assumptions, the standard establishes a three-tier fair value hierarchy, which prioritizes the inputs used in measuring fair value as follows:
• | Level 1 – Observable inputs to the valuation methodology such as quoted prices in active markets for identical assets or liabilities |
• | Level 2 – Inputs to the valuation methodology including quoted prices for similar assets or liabilities in active markets, quoted prices for identical assets or liabilities in inactive markets, inputs other than quoted prices that are observable for the asset or liability, and inputs that are derived principally from or corroborated by observable market data by correlation or other means |
• | Level 3 – Significant unobservable inputs in which there is little or no market data, which require the reporting entity to develop its own estimates and assumptions or those expected to be used by market participants. Generally, these fair value measures are model-based valuation techniques such as discounted cash flows, option pricing models, and other commonly used valuation techniques |
Transfers between levels of the fair value hierarchy are recognized based on the actual date of the event or change in circumstances that caused the transfer. We had no assets or liabilities that were valued using level 2 or level 3 inputs and therefore there were no transfers between levels of the fair value hierarchy during the periods ended December 31, 2019 and 2018.
16. RESTRUCTURING ACTIVITIES
On January 18, 2019, the Company announced a planned suspension of its Air Pollution Control (“APC”) business operation in China (“Beijing Fuel Tech”). This action is part of Fuel Tech’s ongoing operational improvement initiatives designed to prioritize resource allocation, reduce costs, and drive profitability for the Company on a global basis. The transition associated with the suspension of the APC business includes staff rationalization, supplier and partner engagement, and the monetization of certain assets. The remaining transition activities include the execution of the remaining activities to satisfy the requirements for the remaining APC projects in China (with a backlog totaling approximately $35) in addition to collection efforts for the remaining accounts receivable.
The following table presents our revenues and net loss in China for the years ended December 31, 2019, 2018 and 2017:
2019 | 2018 | 2017 | ||||||||||
Total revenues | $ | 329 | $ | 3,006 | $ | 8,034 | ||||||
Net loss | (1,767 | ) | (1,868 | ) | (1,343 | ) | ||||||
The following table presents net assets in China for the years ended December 31, 2019, 2018 and 2017:
2019 | 2018 | 2017 | ||||||||||
Total assets | $ | 4,249 | $ | 8,546 | $ | 13,005 | ||||||
Total liabilities | 399 | 2,953 | 5,245 | |||||||||
Total net assets | 3,850 | 5,593 | 7,760 | |||||||||
Total assets primarily consist of cash, accounts receivable, contract assets, prepaid expenses and other current assets. Total liabilities consist of accounts payable and certain accrued liabilities.
The Company recorded restructuring charges $625 for the twelve months ended December 31, 2019 associated with the suspension of its APC business operation in China. The charge consisted primarily of one-time severance costs of $562 and the early termination penalty for our lease associated with the suspension of our APC business in China of $63. On January 23, 2019, the Company notified the landlord of our intention to early terminate the lease on July 22, 2019 resulting in the early termination penalty.
57
The Company recorded no restructuring charge for the twelve-months ending December 31, 2018. The Company recorded a charge of approximately $700 in 2017 in connection with the workforce reduction. This charge included $581 related to severance and benefit continuation costs due to the suspension of all operations associated with the Fuel Conversion business segment. The following is a reconciliation of the accrual for the workforce reduction that is included within the "Accrued Liabilities" line of the consolidated balance sheets:
Twelve Months Ended | |||||||||
2019 | 2018 | 2017 | |||||||
Restructuring liability at January 1, | $ | 65 | $ | 391 | $ | 309 | |||
Amounts expensed | 625 | — | 119 | ||||||
Amounts expensed - discontinued operations | — | — | 581 | ||||||
Amounts paid | (690 | ) | (326 | ) | (618 | ) | |||
Restructuring liability at December 31, | $ | — | $ | 65 | $ | 391 | |||
17. Unaudited Quarterly Financial Data
Set forth below are the unaudited quarterly financial data for the fiscal years ended December 31, 2019 and 2018.
For the quarters ended | March 31 | June 30 | September 30 | December 31 | ||||||||||||
2019 | ||||||||||||||||
Revenues | $ | 10,155 | $ | 8,948 | $ | 6,452 | $ | 4,912 | ||||||||
Cost of sales | 6,141 | 5,050 | 3,563 | 4,883 | ||||||||||||
Net (loss) from continuing operations | (1,279 | ) | (936 | ) | (1,296 | ) | (4,340 | ) | ||||||||
Income (loss) from discontinued operations | (10 | ) | (9 | ) | 18 | — | ||||||||||
Net income (loss) | (1,289 | ) | (945 | ) | (1,278 | ) | (4,340 | ) | ||||||||
Basic net income (loss) per common share: | ||||||||||||||||
Continuing operations | (0.05 | ) | (0.04 | ) | (0.05 | ) | (0.18 | ) | ||||||||
Discontinued operations | — | — | — | — | ||||||||||||
Basic net income (loss) per common share: | $ | (0.05 | ) | $ | (0.04 | ) | $ | (0.05 | ) | $ | (0.18 | ) | ||||
Diluted net income (loss) per common share: | ||||||||||||||||
Continuing operations | (0.05 | ) | (0.04 | ) | (0.05 | ) | (0.18 | ) | ||||||||
Discontinued operations | — | — | — | — | ||||||||||||
Diluted net income (loss) per common share: | $ | (0.05 | ) | $ | (0.04 | ) | $ | (0.05 | ) | $ | (0.18 | ) | ||||
2018 | ||||||||||||||||
Revenues | $ | 12,791 | $ | 11,847 | $ | 16,070 | $ | 15,827 | ||||||||
Cost of sales | 7,766 | 8,125 | 10,654 | 9,926 | ||||||||||||
Net income (loss) from continuing operations | (191 | ) | (1,679 | ) | 1,055 | 900 | ||||||||||
Loss from discontinued operations | (25 | ) | (74 | ) | (10 | ) | (4 | ) | ||||||||
Net income (loss) | (216 | ) | (1,753 | ) | 1,045 | 896 | ||||||||||
Basic net income (loss) per common share: | — | — | ||||||||||||||
Continuing operations | (0.01 | ) | (0.07 | ) | 0.04 | 0.04 | ||||||||||
Discontinued operations | — | — | — | — | ||||||||||||
Basic net income (loss) per common share: | $ | (0.01 | ) | $ | (0.07 | ) | $ | 0.04 | $ | 0.04 | ||||||
Diluted net income (loss) per common share: | — | |||||||||||||||
Continuing operations | (0.01 | ) | (0.07 | ) | 0.04 | 0.04 | ||||||||||
Discontinued operations | — | — | — | — | ||||||||||||
Diluted net income (loss) per common share: | $ | (0.01 | ) | $ | (0.07 | ) | $ | 0.04 | $ | 0.04 | ||||||
ITEM 9 - CHANGES IN AND DISAGREEMENTS WITH ACCOUNTANTS ON ACCOUNTING AND FINANCIAL DISCLOSURE
None
58
ITEM 9A - CONTROLS AND PROCEDURES
Disclosure Controls and Procedures
Under the supervision and with the participation of our Chief Executive Officer and Principal Financial Officer, our management evaluated the effectiveness of the design and operation of our disclosure controls and procedures (as defined in Rule 13a-15(e) under the Exchange Act), as of the end of the period covered by this Annual Report on Form 10-K (the “Evaluation Date”). Based upon that evaluation, our Chief Executive Officer and Principal Financial Officer concluded that, as of the Evaluation Date, our disclosure controls and procedures are effective to ensure that information required to be disclosed in the reports that we file or submit under the Exchange Act is (i) recorded, processed, summarized and reported, within the time periods specified in the Commission’s rules and forms and (ii) accumulated and communicated to our management, including our Chief Executive Officer and Principal Financial Officer, as appropriate to allow timely decisions regarding required disclosure.
Change in Internal Controls
Beginning January 1, 2019, we adopted ASC 842 "Leases". It did not have a material impact on our ongoing net income; however, we implemented changes to our processes related to accounting for leases and related internal controls. These changes included the development of new policies related to the new leasing framework, training, ongoing contract review requirements, and gathering of information to comply with disclosure requirements.
There has been no change in the Company's internal control over financial reporting during the quarter covered by this report that has materially affected, or is reasonably likely to materially affect, its internal control over financial reporting.
Management’s Report on Internal Control Over Financial Reporting
Our management is responsible for establishing and maintaining adequate internal control over financial reporting, as such term is defined in Rule 13a-15(f) under the Exchange Act. As required by Rule 13a-15(c) under the Exchange Act, our management has carried out an evaluation, with the participation of the Chief Executive Officer and Principal Financial Officer, of the effectiveness of its internal control over financial reporting as of the end of the last fiscal year. The framework on which such evaluation was based is contained in the report entitled “Internal Control—Integrated Framework” issued by the Committee of Sponsoring Organizations of the Treadway Commission (the “COSO Report”) in 2013.
Our system of internal control over financial reporting is designed to provide reasonable assurance regarding the reliability of financial reporting and the preparation of financial statements for external purposes in accordance with generally accepted accounting principles. Because of its inherent limitations, internal control over financial reporting may not prevent or detect misstatements. Also, projections of any evaluation of effectiveness to future periods are subject to the risk that controls may become inadequate because of changes in conditions, or that the degree of compliance with the policies or procedures may deteriorate.
Based on its assessment, management has concluded that we maintained effective internal control over financial reporting as of December 31, 2019, based on criteria in “Internal Control - Integrated Framework” issued by the COSO in 2013.
ITEM 9B - OTHER INFORMATION
None
59
PART III
ITEM 10 – DIRECTORS, EXECUTIVE OFFICERS AND CORPORATE GOVERNANCE
Information required by this Item will be set forth under the captions “Election of Directors,” “Directors and Executive Officers of Fuel Tech,” “Compensation Committee,” “Audit Committee,” and “Financial Experts” in our definitive Proxy Statement related to the 2020 Annual Meeting of Stockholders (the “Proxy Statement”) and is incorporated by reference.
We have adopted a Code of Ethics and Business Conduct (the “Code”) that applies to all employees, officers and directors, including the Chief Executive Officer and Principal Financial Officer. A copy of the Code is available free of charge to any person on written or telephone request to our Legal Department at the address or telephone number described in Item 1 under the heading "Available Information." The Code is also available on our website at www.ftek.com.
Other information concerning our directors and executive officers and relating to corporate governance will be set forth under the captions “Election of Directors,” “Audit Committee,” “Compensation and Nominating Committee,” “Financial Experts,” “Corporate Governance” and “General” in our Proxy Statement related to the 2020 Annual Meeting of Stockholders and is incorporated by reference.
ITEM 11 - EXECUTIVE COMPENSATION
Information required by this Item will be set forth under the caption “Executive Compensation” in our definitive Proxy Statement and is incorporated by reference.
ITEM 12 - SECURITY OWNERSHIP OF CERTAIN BENEFICIAL OWNERS AND MANAGEMENT AND RELATED STOCKHOLDER MATTERS
The following table provides information for all equity compensation plans as of the fiscal year ended December 31, 2019, under which our securities were authorized for issuance:
Plan Category | Number of Securities to be issued upon exercise of outstanding options and vesting of restricted stock units | Weighted-average exercise price of outstanding options | Number of securities remaining available for future issuance under equity compensation plan excluding securities listed in column (a) | |||||||
(a) | (b) | (c) | ||||||||
Equity compensation plans approved by security holders | 1,523,135 | $ | 3.33 | 2,231,382 | ||||||
In addition to the plans listed above, we have a Deferred Compensation Plan for directors under which 100,000 Common Shares have been reserved for issuance as deferred compensation with respect to director's fees.
Further information required by this Item will be set forth under the caption “Principal Stockholders and Stock Ownership of Management” in the definitive Proxy Statement and is incorporated by reference.
ITEM 13 - CERTAIN RELATIONSHIPS AND RELATED TRANSACTIONS, AND DIRECTOR INDEPENDENCE
Information required by this Item will be set forth under the captions “Compensation Committee Interlocks and Insider Participation” and “Certain Relationships and Related Transactions” in our definitive Proxy Statement and is incorporated by reference.
ITEM 14 - PRINCIPAL ACCOUNTANT FEES AND SERVICES
Information required by this Item will be set forth under the caption “Approval of Appointment of Auditors” in our definitive Proxy Statement and is incorporated by reference.
60
PART IV
ITEM 15 - EXHIBITS AND FINANCIAL STATEMENT SCHEDULES
(a) | (1) Financial Statements |
The financial statements identified below and required by Part II, Item 8 of this Form 10-K are set forth above.
Management’s Report on Internal Control Over Financial Reporting
Report of Independent Registered Public Accounting Firm
Consolidated Balance Sheets as of December 31, 2019 and 2018
Consolidated Statements of Operations for Years Ended December 31, 2019, 2018 and 2017
Consolidated Statements of Comprehensive Loss for Years Ended December 31, 2019, 2018 and 2017
Consolidated Statements of Stockholders’ Equity for the Years Ended December 31, 2019, 2018 and 2017
Consolidated Statements of Cash Flows for the Years Ended December 31, 2019, 2018 and 2017
Notes to Consolidated Financial Statements
(2) Financial Statement Schedules
All other schedules have been omitted because of the absence of the conditions under which they are required or because the required information, where material, is shown in the financial statements or the notes thereto.
(3)Exhibits
Incorporated by Reference | ||||||||||||
Exhibit | Description | Filed Herewith | Form | Period ending | Exhibit | Filing date | ||||||
3.1 | 8-K | 3.2 | 10/5/2006 | |||||||||
3.2 | 8-K | 3.1 | 10/5/2006 | |||||||||
3.3 | 8-K | 3.1 | 6/1/2015 | |||||||||
4.1 | 10-Q | 9/30/2009 | 4.1 | 11/4/2009 | ||||||||
4.2 | 10-Q | 9/30/2009 | 4.2 | 11/4/2009 | ||||||||
4.3 | 10-Q | 9/30/2009 | 4.3 | 11/4/2009 | ||||||||
4.4* | S-8 | 4.1 | 10/2/2006 | |||||||||
4.5* | S-8 | 4.1 | 3/31/2014 | |||||||||
4.6* | 10-K | 12/31/2006 | 4.6 | 3/6/2007 | ||||||||
4.7 | 10-Q | 6/30/2014 | 4.2 | 8/11/2014 | ||||||||
4.8* | 10-K | 12/31/2006 | 4.7 | 3/6/2007 | ||||||||
4.9* | 10-K | 12/31/2006 | 4.8 | 3/6/2007 | ||||||||
4.10* | 10-K | 12/31/2011 | 4.9 | 3/5/2012 | ||||||||
4.11* | 10-Q | 6/30/2014 | 4.1 | 8/11/2014 | ||||||||
4.12* | 10-Q | 3/31/2015 | 10.2 | 5/11/2015 | ||||||||
4.13* | 10-K | 12/31/2015 | 4.17 | 3/24/2016 | ||||||||
4.14* | 8-K | 10.1 | 3/2/2020 | |||||||||
61
10.1 | 8-K | 99.1 | 2/7/2007 | |||||||||
10.4 | 10-Q | 9/30/2009 | 10.5 | 11/4/2009 | ||||||||
10.5 | 10-Q | 9/30/2009 | 10.6 | 11/4/2009 | ||||||||
10.6 | 10-Q | 9/30/2009 | 10.7 | 11/4/2009 | ||||||||
10.7 | 10-Q | 6/30/2011 | 4.1 | 8/8/2011 | ||||||||
10.8 | 10-Q | 6/30/2013 | 4.1 | 8/7/2013 | ||||||||
10.9 | 10-K | 12/31/2015 | 10.12 | 3/24/2015 | ||||||||
10.10 | 10-Q | 6/30/2015 | 10.2 | 8/10/2015 | ||||||||
10.11 | 10-K | 12/31/2015 | 10.14 | 3/24/2015 | ||||||||
10.12 | 10-Q | 3/31/2016 | 10.1 | 5/10/2016 | ||||||||
10.13 | 10-Q | 6/30/2017 | 10.1 | 8/14/2017 | ||||||||
10.14 | 10-K | 12/31/2017 | 10.2 | 3/12/2018 | ||||||||
10.15 | 10-Q | 6/30/2018 | 10.2 | 8/13/2018 | ||||||||
10.16 | 10-Q | 9/30/2018 | 10.1 | 11/13/2018 | ||||||||
10.17 | 10-Q | 9/30/2018 | 10.2 | 11/13/2018 | ||||||||
10.18 | 10-Q | 6/30/2019 | 10.1 | 8/13/2019 | ||||||||
10.19 | 10-Q | 6/30/2018 | 10.1 | 8/13/2018 | ||||||||
10.20 | 10-Q | 9/30/2018 | 10.3 | 11/13/2018 | ||||||||
10.21 | 10-Q | 6/30/2016 | 10.1 | 8/9/2016 | ||||||||
10.22 | 10-K | 12/31/2009 | 10.14 | 3/4/2010 | ||||||||
10.24* | 10-K | 12/31/2018 | 10.24 | 3/14/2019 | ||||||||
10.25* | 8-K | 10.2 | 3/2/2020 | |||||||||
62
10.27* | 8-K | 12/14/2018 | 99.2 | 12/14/2018 | ||||||||
10.28* | 8-K | 12/10/2019 | 99.2 | 12/12/2020 | ||||||||
10.29* | 10-K | 12/31/2017 | 10.29 | 3/12/2018 | ||||||||
10.30* | 8-K | 12/14/2018 | 99.1 | 12/14/2018 | ||||||||
10.31* | 8-K | 12/10/2019 | 99.1 | 12/12/2020 | ||||||||
10.32* | 10-K | 12/31/2009 | 10.10 | 3/14/2010 | ||||||||
10.33* | 10-K | 12/31/2011 | 10.21 | 3/5/2012 | ||||||||
10.34* | 10-K | 12/31/2017 | 10.35 | 3/12/2018 | ||||||||
23.1 | X | |||||||||||
31.1 | X | |||||||||||
31.2 | X | |||||||||||
32 | X | |||||||||||
101.1 INS | XBRL Instance Document. | |
101.2 SCH | XBRL Taxonomy Extension Schema Document. | |
101.3 CAL | XBRL Taxonomy Extension Calculation Linkbase Document. | |
101.4 DEF | XBRL Taxonomy Extension Definition Linkbase Document. | |
101.5 LAB | XBRL Taxonomy Extension Label Linkbase Document. | |
101.6 PRE | XBRL Taxonomy Extension Presentation Linkbase Document. | |
* Indicates a management contract or compensatory plan or arrangement.
** | Portions of this document have been omitted pursuant to a request for confidential treatment and the omitted information has been filed separately with the Securities and Exchange Commission. |
63
SIGNATURES AND CERTIFICATIONS
Pursuant to the requirements of the Securities Exchange Act of 1934, the Registrant has duly caused this report to be signed on its behalf by the undersigned thereunto duly authorized.
FUEL TECH, INC. | ||
Date: March 11, 2020 | By: | /s/ Vincent J. Arnone |
Vincent J. Arnone | ||
President and Chief Executive Officer | ||
(Principal Executive Officer) | ||
Date: March 11, 2020 | By: | /s/ James M. Pach |
James M. Pach | ||
Vice President, Treasurer and Controller | ||
(Principal Financial Officer) | ||
64
Pursuant to the requirements of the Securities and Exchange Act of 1934, this report has been duly signed below by the following persons on behalf of Fuel Tech, Inc. and in the capacities and on the date indicated.
Date: March 11, 2020
Signature | Title | |
/s/ Vincent J. Arnone | President and Chief Executive Officer (Principal Executive Officer) | |
Vincent J. Arnone | ||
/s/ James M. Pach | Vice President, Treasurer and Controller (Principal Financial Officer) | |
James M. Pach | ||
/s/ Douglas G. Bailey | Director | |
Douglas G. Bailey | ||
/s/ Thomas S. Shaw, Jr. | Director | |
Thomas S. Shaw, Jr. | ||
/s/ Dennis L. Zeitler | Director | |
Dennis L. Zeitler | ||
/s/ James J. Markowsky, Ph.D. | Director | |
James J. Markowsky, Ph.D. | ||
/s/ Sharon L. Jones | Director | |
Sharon L. Jones | ||
65