Attached files
UNITED STATES
SECURITIES AND EXCHANGE COMMISSION
Washington, D.C. 20549
FORM 10-K
[x] ANNUAL REPORT PURSUANT TO SECTION 13 OR 15(d) OF THE SECURITIES EXCHANGE ACT OF 1934
For the fiscal year ended December 31, 2019
or
[ ] TRANSITION REPORT PURSUANT TO SECTION 13 OR 15(d) OF THE SECURITIES EXCHANGE ACT OF 1934
For the transition period from to
Commission File Number: 000-51395
FEDERAL HOME LOAN BANK OF PITTSBURGH
(Exact name of registrant as specified in its charter)
Federally Chartered Corporation | 25-6001324 | |
(State or other jurisdiction of incorporation or organization) | (IRS Employer Identification No.) | |
601 Grant Street Pittsburgh, PA (Address of principal executive offices) | 15219 (Zip Code) | |
(412) 288-3400
(Registrant’s telephone number, including area code)
Securities registered pursuant to Section 12(b) of the Act:
Title of each class | Trading Symbol(s) | Name of each exchange on which registered |
— | — | — |
Securities registered pursuant to Section 12(g) of the Act: | ||
Capital Stock, putable, par value $100 | ||
(Title of Class) | ||
Indicate by check mark if the registrant is a well-known seasoned issuer, as defined in Rule 405 of the Securities Act. []Yes [x]No
Indicate by check mark if the registrant is not required to file reports pursuant to Section 13 or Section 15(d) of the Act. []Yes [x]No
Indicate by check mark whether the registrant (1) has filed all reports required to be filed by Section 13 or 15(d) of the Securities Exchange Act of 1934 during the preceding 12 months (or for such shorter period that the registrant was required to file such reports), and (2) has been subject to such filing requirements for the past 90 days. [x]Yes []No
Indicate by check mark whether the registrant has submitted electronically every Interactive Data File required to be submitted pursuant to Rule 405 of Regulation S-T during the preceding 12 months (or for such shorter period that the registrant was required to submit such files). [x] Yes [] No
Indicate by check mark whether the registrant is a large accelerated filer, an accelerated filer, a non-accelerated filer, smaller reporting company, or an emerging growth company. See the definitions of “large accelerated filer,” “accelerated filer,” “smaller reporting company,” and “emerging growth company” in Rule 12b-2 of the Exchange Act.
o Large accelerated filer | o Accelerated filer | o Emerging growth company |
x Non-accelerated filer | o Smaller reporting company | |
If an emerging growth company, indicate by check mark if the registrant has elected not to use the extended transition period for complying with any new or revised financial accounting standards provided pursuant to Section 13(a) of the Exchange Act. []
Indicate by check mark whether the registrant is a shell company (as defined in Rule 12b-2 of the Exchange Act). [] Yes [x] No
Registrant’s stock is not publicly traded and is only issued to members of the registrant. Such stock is issued and redeemed at par value, $100 per share, subject to certain regulatory and statutory limits. At June 30, 2019, the aggregate par value of the stock held by current and former members of the registrant was approximately $3,987.0 million. There were 29,985,999 shares of common stock outstanding at February 28, 2020.
FEDERAL HOME LOAN BANK OF PITTSBURGH
TABLE OF CONTENTS
PART I | ||
Item 1: Business | ||
Item 1A: Risk Factors | ||
Item 1B: Unresolved Staff Comments | ||
Item 2: Properties | ||
Item 3: Legal Proceedings | ||
Item 4: Mine Safety Disclosures | ||
PART II | ||
Item 5: Market for Registrant’s Common Equity, Related Stockholder Matters and Issuer Purchases of Equity Securities | ||
Item 6: Selected Financial Data | ||
Item 7: Management’s Discussion and Analysis of Financial Condition and Results of Operations | ||
Risk Management | ||
Item 7A: Quantitative and Qualitative Disclosures about Market Risk | ||
Item 8: Financial Statements and Supplementary Financial Data | ||
Financial Statements for the Years 2019, 2018, and 2017 | ||
Notes to Financial Statements | ||
Item 9: Changes in and Disagreements with Accountants on Accounting and Financial Disclosure | ||
Item 9A: Controls and Procedures | ||
Item 9B: Other Information | ||
PART III | ||
Item 10: Directors, Executive Officers and Corporate Governance | ||
Item 11: Executive Compensation | ||
Item 12: Security Ownership of Certain Beneficial Owners and Management and Related Stockholder Matters | ||
Item 13: Certain Relationships and Related Transactions, and Director Independence | ||
Item 14: Principal Accountant Fees and Services | ||
PART IV | ||
Item 15: Exhibits and Financial Statement Schedules | ||
Item 16: Form 10-K Summary | ||
Glossary | ||
Signatures | ||
i.
PART I
Forward-Looking Information
Statements contained in this Form 10-K, including statements describing the objectives, projections, estimates, or predictions of the future of the Federal Home Loan Bank of Pittsburgh (the Bank), may be “forward-looking statements.” These statements may use forward-looking terms, such as “anticipates,” “believes,” “could,” “estimates,” “may,” “should,” “will,” or their negatives or other variations on these terms. The Bank cautions that, by their nature, forward-looking statements involve risk or uncertainty and that actual results could differ materially from those expressed or implied in these forward-looking statements or could affect the extent to which a particular objective, projection, estimate, or prediction is realized. These forward-looking statements involve risks and uncertainties including, but not limited to, the following: economic and market conditions, including, but not limited to, real estate, credit and mortgage markets; volatility of market prices, rates, and indices related to financial instruments; including but not limited to, the possible discontinuance of the London Interbank Offered Rate (LIBOR) and the related effect on the Bank's LIBOR-based financial products, investments and contracts; the occurrence of man-made or natural disasters, global pandemics, conflicts or terrorist attacks or other geopolitical events; political, legislative, regulatory, litigation, or judicial events or actions; risks related to mortgage-backed securities (MBS); changes in the assumptions used to estimate credit losses; changes in the Bank’s capital structure; changes in the Bank’s capital requirements; changes in expectations regarding the Bank’s payment of dividends; membership changes; changes in the demand by Bank members for Bank advances; an increase in advance prepayments; competitive forces, including the availability of other sources of funding for Bank members; changes in investor demand for consolidated obligations and/or the terms of interest rate exchange agreements and similar agreements; changes in the Federal Home Loan Bank (FHLBank) System’s debt rating or the Bank’s rating; the ability of the Bank to introduce new products and services to meet market demand and to manage successfully the risks associated with new products and services; the ability of each of the other FHLBanks to repay the principal and interest on consolidated obligations for which it is the primary obligor and with respect to which the Bank has joint and several liability; applicable Bank policy requirements for retained earnings and the ratio of the market value of equity to par value of capital stock; the Bank’s ability to maintain adequate capital levels (including meeting applicable regulatory capital requirements); business and capital plan adjustments and amendments; technology and cyber-security risks; and timing and volume of market activity.
Item 1: Business
The Bank’s mission is to provide its members with readily available liquidity, including serving as a low-cost source of funds for housing and community development. The Bank strives to enhance the availability of credit for residential mortgages and targeted community development. The Bank manages its own liquidity so that funds are available to meet members’ demand for advances (loans to members and eligible nonmember housing associates). By providing needed liquidity and enhancing competition in the mortgage market, the Bank’s lending programs benefit homebuyers and communities. For additional information regarding the Bank’s financial condition and financial statements, refer to Item 7. Management’s Discussion and Analysis and Item 8. Financial Statements and Supplementary Financial Data in this Form 10-K. For additional information regarding the Bank’s business risks, refer to Item 1A. Risk Factors in this Form 10-K.
General
History. The Bank is one of 11 FHLBanks. The FHLBanks operate as separate entities with their own management, employees and board of directors. The 11 FHLBanks, along with the Office of Finance (OF - the FHLBanks’ fiscal agent) comprise the FHLBank System. The FHLBanks were organized under the authority of the Federal Home Loan Bank Act of 1932, as amended (the Act). The FHLBanks are commonly referred to as government-sponsored enterprises (GSEs), which generally means they are a combination of private capital and public sponsorship. The public sponsorship attributes include:
• | being exempt from federal, state and local taxation, except real estate taxes; |
• | being exempt from registration under the Securities Act of 1933 (the 1933 Act), although the FHLBanks are required by Federal Housing Finance Agency (FHFA or Finance Agency) regulation and the Housing and Economic Recovery Act of 2008 (the Housing Act or HERA) to register a class of their equity securities under the Securities Exchange Act of 1934 (the 1934 Act); and |
• | having a line of credit with the U.S. Treasury. This line represents the U.S. Treasury’s authority to purchase consolidated obligations in an amount up to $4 billion. |
1
Cooperative. The Bank is a cooperative institution, owned by member financial institutions that are also its primary customers. Any building and loan association, savings and loan association, commercial bank, homestead association, insurance company, savings bank, credit union, community development financial institution (CDFI), or insured depository institution that maintains its principal place of business in Delaware, Pennsylvania or West Virginia and that meets varying requirements can apply for membership in the Bank. All members are required to purchase capital stock in the Bank as a condition of membership. The capital stock of the Bank can be purchased only by members.
Mission. The Bank’s primary mission is to assure the flow of credit to its members to support housing finance and community lending and to provide related services that enhance their businesses and vitalize their communities. The Bank provides credit for housing and community development through two primary programs. First, it provides members with advances secured by residential mortgages and other types of high-quality collateral. Second, the Bank purchases residential mortgage loans originated by or through eligible member institutions. The Bank also offers other credit and noncredit products and services to member institutions. These include letters of credit, affordable housing grants, securities safekeeping, and deposit products and services. The Bank issues debt to the public (consolidated obligation bonds and discount notes) in the capital markets through the OF and uses these funds to provide its member financial institutions with a reliable source of liquidity. The U.S. government does not guarantee the debt securities or other obligations of the Bank or the FHLBank System.
Overview. As a GSE, the Bank is able to raise funds in the capital markets at narrow spreads to the U.S. Treasury yield curve. This fundamental competitive advantage, coupled with the joint and several liability on FHLBank System debt, enables the Bank to provide attractively priced funding to members. Though chartered by Congress, the Bank is privately capitalized by its member institutions, which are voluntary participants in its cooperative structure. The characterization of the Bank as a voluntary cooperative with the status of a federal instrumentality differentiates the Bank from a traditional banking institution in three principal ways:
• | Financial institutions choose membership in the Bank principally for access to liquidity, the value of the products offered, and the potential to receive dividends. |
• | Because the Bank’s customers and shareholders are predominantly the same institutions, normally there is a need to balance the pricing expectations of customers with the dividend expectations of shareholders. By charging wider spreads on loans to customers, the Bank could potentially generate higher earnings and dividends for shareholders. Yet these same shareholders are also customers who would generally prefer narrower loan spreads. The Bank strives to achieve a balance between the goals of providing liquidity and other services to members at advantageous prices and potentially generating an attractive dividend. The Bank typically does not strive to maximize the dividend yield on the stock, but to produce a dividend that compares favorably to short-term interest rates, thus compensating members for the cost of the capital they have invested in the Bank. |
• | The Bank’s GSE charter is based on a public policy purpose to assure liquidity for its members and to enhance the availability of affordable housing for lower-income households. In upholding its public policy mission, the Bank offers products that consume a portion of its earnings. The cooperative GSE character of this voluntary membership organization leads management to optimize the primary purpose of membership, access to liquidity, as well as the overall value of Bank membership. |
Nonmember Borrowers. In addition to member institutions, the Bank is permitted under the Act to make advances to nonmember housing associates that are approved mortgagees under Title II of the National Housing Act. These eligible housing associates must be chartered under law, be subject to inspection and supervision by a governmental agency, and lend their own funds as their principal activity in the mortgage field. The Bank must approve each applicant. Housing associates are not subject to certain provisions of the Act that are applicable to members, such as the capital stock purchase requirements. However, they are generally subject to more restrictive lending and collateral requirements than those applicable to members. As of December 31, 2019, the Bank maintains relationships with three approved state housing finance agencies (HFAs). Each is currently eligible to borrow from the Bank and one of the housing associates had an advance balance of $14.9 million as of December 31, 2019.
2
Regulatory Oversight, Audits and Examinations
Supervision and Regulation. The Bank and OF are supervised and regulated by the Finance Agency, which is an independent agency in the executive branch of the United States government. The Finance Agency ensures that the Bank carries out its housing finance mission, remains adequately capitalized and operates in a safe and sound manner. The Finance Agency establishes regulations, issues advisory bulletins (ABs), and otherwise supervises Bank operations primarily via periodic examinations. The Government Corporation Control Act provides that, before a government corporation issues and offers obligations to the public, the Secretary of the U.S. Treasury has the authority to prescribe the form, denomination, maturity, interest rate, and conditions of the obligations; the way and time issued; and the selling price. The U.S. Treasury receives the Finance Agency’s annual report to Congress and other reports on operations. The Bank is also subject to regulation by the Securities and Exchange Commission (SEC).
Examination. At a minimum, the Finance Agency conducts annual onsite examinations of the operations of the Bank. In addition, the Comptroller General has authority under the Act to audit or examine the Finance Agency and the Bank and to decide the extent to which they fairly and effectively fulfill the purposes of the Act. Furthermore, the Government Corporation Control Act provides that the Comptroller General may review any audit of the financial statements conducted by an independent registered public accounting firm. If the Comptroller General conducts such a review, then he or she must report the results and provide his or her recommendations to Congress, the Office of Management and Budget (OMB), and the FHLBank in question. The Comptroller General may also conduct his or her own audit of the financial statements of the Bank.
Audit. The Bank has an internal audit department that reports directly to the Audit Committee of the Bank’s Board of Directors (Board). In addition, an independent Registered Public Accounting Firm (RPAF) audits the annual financial statements and internal controls over financial reporting of the Bank. The independent RPAF conducts these audits following the Standards of the Public Company Accounting Oversight Board (PCAOB) of the United States of America and Government Auditing Standards issued by the Comptroller General. The Bank, the Finance Agency, and Congress all receive the independent RPAF audit reports.
3
Advances
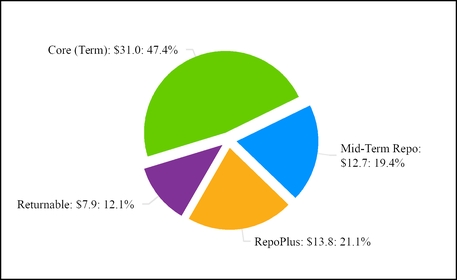
Advance Products. The Bank makes advances on the security of pledged mortgage loans and other eligible types of collateral. The following table summarizes the advance products offered by the Bank as of December 31, 2019.
Product | Description | Maturity | Key Features |
RepoPlus | Short-term, fixed-rate advances; principal and interest paid at maturity | 1 day to 89 days | The RepoPlus advance products serve member short-term liquidity needs. RepoPlus is typically a short-term, fixed-rate product while the Open RepoPlus is a revolving line of credit which allows members to borrow, repay and re-borrow based on the terms of the line of credit. These balances tend to be extremely volatile as members borrow and repay frequently. |
Mid-Term Repo | Mid-term, fixed-rate and adjustable-rate advances(1); principal paid at maturity; interest paid monthly or quarterly | 3 months to 3 years (2) | The Mid-Term Repo product assists members with managing intermediate-term interest rate risk. To assist members with managing basis risk, or the risk of a change in the spread relationship between two indices, the Bank offers adjustable-rate Mid-Term Repo advances. The Bank also offers Mid-Term fixed-rate advances. These balances tend to be somewhat unpredictable as these advances are not always replaced as they mature. |
Core (Term) | Long-term, fixed-rate and adjustable-rate advances(1); principal paid at maturity; interest paid monthly or quarterly (Note: amortizing loans principal and interest paid monthly) | 1 year to 30 years (2) | For managing longer-term interest rate risk and to assist with asset/liability management, the Bank offers long-term fixed-rate and adjustable-rate advances. Amortizing long-term fixed-rate advances can be fully amortized on a monthly basis over the term of the loan or amortized balloon-style, based on an amortization term longer than the maturity of the loan. |
Returnable | Short-term and long-term, fixed-rate and adjustable-rate advances with return options owned by member; principal paid at maturity; interest paid monthly or quarterly | 2 months to 30 years | These advances permit the member to prepay an advance on certain pre-determined date(s) without a fee. |
Notes:
(1) May include loans made under the Community Lending Program (CLP).
(2) Terms dependent upon market conditions.
4
The following chart shows the percentage of advances at par by product type and dollar amount (in billions) as of December 31, 2019.
Letters of Credit. Standby letters of credit are issued by the Bank for a fee on behalf of its members and housing associates to support certain obligations to third-party beneficiaries and are backed by an irrevocable, independent obligation from the Bank. These are subject to the same collateralization and borrowing limits that apply to advances. Standby letters of credit can be valuable tools to support community lending activities, including arranging financing to support bond issuances for community and economic development as well as affordable housing projects. The letters of credit offer customizable terms available to meet unique and evolving needs. If the Bank is required to make payment for a beneficiary’s draw, these amounts are withdrawn from the member/housing associates’ demand deposit account (DDA). Any remaining amounts not covered by the DDA withdrawal are converted into a collateralized overnight advance.
Collateral
The Bank protects against credit risk by fully collateralizing all member and nonmember housing associate advances and other credit products. The Act requires the Bank to obtain and maintain a security interest in eligible collateral at the time it originates or renews an advance.
Collateral Agreements. All members must enter into either the Advances, Collateral Pledge and Security Agreement or the Advances, Specific Collateral Pledge and Security Agreement with the Bank (both hereafter referred to as Master Agreement) in order to obtain advances or other credit products. In both cases, the Bank perfects its security interest under Article 9 of the Uniform Commercial Code (UCC) by filing a financing statement. The Specific Collateral Pledge and Security Agreement covers only those assets or categories of assets identified; the Bank therefore relies on a specific subset of the member’s total eligible collateral as security for the member’s obligations to the Bank. The Bank requires CDFIs, housing finance agencies (HFAs) and insurance companies to sign a specific collateral pledge agreement. See the Credit and Counterparty Risk - TCE and Collateral discussion in Risk Management in Item 7. Management’s Discussion and Analysis in this Form 10-K for a description of blanket and specific agreements.
Collateral Status. The Master Agreement identifies three types of collateral status: undelivered, undelivered detailed listing or specific pledge, and delivered status. All securities pledged must be delivered. A member is assigned a collateral status based on the member’s business needs and on the Bank’s determination of the member’s current financial condition and credit product usage, as well as other available information.
Undelivered Collateral Status. The Bank monitors eligible loan collateral using the Qualifying Collateral Report (QCR), derived from regulatory financial reports which are submitted quarterly (or monthly) to the Bank by the member. For members that submit a QCR on a quarterly basis, lending value is determined based on a percentage of the unpaid principal balance of qualifying collateral (commonly referred to as the collateral weight). Qualifying collateral is determined by deducting ineligible loans from the gross call report amount for each asset category. In addition, members are required to complete an Annual Collateral Certification Report (ACCR).
5
Undelivered Collateral Status: Detailed Listing or Specific Pledge. The Bank may require a member to provide a detailed listing of eligible collateral being pledged if the member is under a specific agreement, or if participating in the Bank’s market-value based pricing program, or as determined based on its credit condition. The member typically retains physical possession of collateral pledged to the Bank but provides a listing of assets pledged. In some cases, the member may benefit by choosing to list collateral, in lieu of non-listed status, since it may result in a higher collateral weighting being applied to the collateral. The Bank benefits from detailed listing collateral status because it provides more loan information to calculate a more precise valuation of the collateral.
Delivered Collateral Status. In this case, the Bank requires the member to deliver physical possession, or grant control of, eligible collateral in an amount sufficient to fully secure its total credit exposure (TCE) to the Bank. Typically, the Bank takes physical possession/control of collateral if the financial condition of the member is deteriorating. Delivery of collateral also may be required if there is action taken against the member by its regulator. Collateral delivery status is often required for members borrowing under specific pledge agreements as a practical means for maintaining specifically listed collateral. Securities collateral qualifies on a delivered basis only (i.e., held in a Bank restricted account or at an approved third-party custodian and subject to a control agreement in favor of the Bank). The Bank also requires delivery of collateral from de novo members at least until two consecutive quarters of profitability are achieved and for any other new member where a pre-existing blanket lien is in force with another creditor unless an effective subordination agreement is executed with such other creditor.
With respect to certain specific collateral pledge agreement borrowers (typically CDFIs, HFAs, and insurance companies), the Bank takes control of all collateral pledged at the time the loan is made through the delivery of securities or, where applicable, mortgage loans to the Bank or its custodian. See the Credit and Counterparty Risk - TCE and Collateral discussion in Risk Management in Item 7. Management’s Discussion and Analysis in this Form 10-K for further details on collateral status and types.
All eligible collateral securing advances is discounted to protect the Bank from loss in the event of default, including under adverse conditions. These discounts, also referred to as lending value or “haircuts”, vary by collateral type and the value of the collateral. The Bank’s collateral discounted values are presented in the table titled “Lending Value Assigned to the Collateral as a Percentage of Value” at the end of this subsection. The discounts typically include margins for estimated costs to sell or liquidate the collateral and the risk of a decline in the collateral value due to market or credit volatility. The Bank reviews the collateral weightings periodically and may adjust them, as well as the members’ reporting requirements to the Bank, for individual borrowers on a case-by-case basis.
The Bank determines the type and amount of collateral each member has available to pledge as security for a member’s obligations to the Bank by reviewing, on a quarterly basis, call reports the members file with their primary regulators. The resulting total value of collateral available to be pledged to the Bank after any collateral weighting is referred to as a member’s maximum borrowing capacity (MBC). Depending on a member’s credit product usage and current financial condition, that member may also be required to file a QCR on a quarterly or monthly basis. At a minimum, all members whose TCE exceeds 20% of their MBC and all members who are not community financial institutions (CFIs) as defined below must file a QCR quarterly.
The Bank also performs periodic on-site collateral reviews of its borrowing members to confirm the amounts and quality of the eligible collateral pledged for the members’ obligations to the Bank. For certain pledged residential and commercial mortgage loan collateral, as well as delivered and Bank-controlled securities, the Bank employs outside service providers to assist in determining market values. In addition, the Bank has developed and maintains an Internal Credit Rating (ICR) system that assigns each member a numerical credit rating on a scale of one to ten, with one being the best rating. Credit availability and term guidelines are based on a member’s ICR and MBC usage. The Bank reserves the right, at its discretion, to refuse certain collateral or to adjust collateral weightings. In addition, the Bank can require additional or substitute collateral while any obligations of a member to the Bank remain outstanding to protect the Bank’s security interest and ensure that it remains fully secured at all times.
See the Credit and Counterparty Risk - TCE and Collateral discussion in Risk Management in Item 7. Management’s Discussion and Analysis in this Form 10-K for further information on collateral policies and practices and details of eligible collateral, including amounts and percentages of eligible collateral securing members’ obligations to the Bank as of December 31, 2019.
As additional security for each member’s obligations to the Bank, the Bank has a statutory lien on the member’s capital stock in the Bank. In the event of deterioration in the financial condition of a member, the Bank will take possession or control
6
of sufficient eligible collateral to further perfect its security interest in collateral pledged to secure the member’s obligations to the Bank. Members with deteriorating creditworthiness are required to deliver collateral to the Bank or the Bank’s custodian to secure the members’ obligations with the Bank. Furthermore, the Bank requires specific approval of each of such members’ new or renewed advances.
Priority. The Act affords any security interest granted to the Bank by any member, or any affiliate of a member, priority over the claims and rights of any third party, including any receiver, conservator, trustee or similar party having rights of a lien creditor. The only two exceptions are: (1) claims and rights that would be entitled to priority under otherwise applicable law and are held by actual bona fide purchasers for value; and (2) parties that are secured by actual perfected security interests ahead of the Bank’s security interest. The Bank has detailed liquidation plans in place to promptly exercise the Bank’s rights regarding securities, loan collateral, and other collateral upon the failure of a member. Management believes that adequate policies and procedures are in place to effectively manage the Bank’s credit risk associated with lending to members and nonmember housing associates.
Types of Collateral. Single-family, residential mortgage loans may be used to secure members’ obligations to the Bank. The Bank contracts with a leading provider of comprehensive mortgage analytical pricing to provide market valuations of some listed and delivered residential mortgage loan collateral. In determining borrowing capacity for members with non-listed and non-delivered collateral, the Bank utilizes book value as reported on each member's regulatory call report. Loans that do not have a paper-based promissory note with a “wet ink” signature are ineligible for collateral purposes.
The Bank also may accept other real estate related collateral (ORERC) as eligible collateral if it has a readily ascertainable value and the Bank is able to perfect its security interest in such collateral. Types of eligible ORERC include commercial mortgage loans, multi-family residential mortgage loans, and second-mortgage installment loans. The Bank uses a leading provider of multi-family and commercial mortgage analytical pricing to provide more precise valuations of listed and delivered multi-family and commercial mortgage loan collateral.
A third category of eligible collateral is high quality investment securities as included in the table below. See the Credit and Counterparty Risk - TCE and Collateral discussion in Risk Management in Item 7. Management’s Discussion and Analysis in this Form 10-K for a definition of these securities. Members have the option to deliver such high quality investment securities to the Bank to obtain or increase their MBC. Upon delivery, these securities are valued daily and all non-government or agency securities are subject to weekly ratings reviews.
The Bank also accepts FHLBank cash deposits as eligible collateral. In addition, member CFIs may pledge a broader array of collateral to the Bank, including secured small business, small farm, small agri-business and community development loans. The Housing Act defines member CFIs as Federal Deposit Insurance Corporation (FDIC)-insured institutions with no more than $1.2 billion (the limit during 2019) in average assets over the past three years. This limit may be adjusted by the Finance Agency based on changes in the Consumer Price Index. The determination to accept such collateral is at the discretion of the Bank and is made on a case-by-case basis. Advances to CFIs are also collateralized by sufficient levels of non-CFI collateral. See the Credit and Counterparty Risk - TCE and Collateral discussion in Risk Management in Item 7. Management’s Discussion and Analysis in this Form 10-K for the percentage of each type of collateral held by the Bank at December 31, 2019.
The Bank does not accept subprime residential mortgage loans (defined as FICO® score of 660 or below. FICO is a registered trademark of Fair Isaac Corporation) as qualifying collateral unless certain mitigating factors are met. The Bank requires members to identify the amount of subprime and nontraditional mortgage collateral in their QCRs.
Nontraditional residential mortgage loans are defined by the Bank’s Collateral Policy as mortgage loans that allow borrowers to defer payment of principal or interest. These loans exhibit characteristics that may result in increased risk relative to traditional residential mortgage loan products. They may pose even greater risk when granted to borrowers with undocumented or undemonstrated repayment capacity, for example, low or no documentation loans or credit characteristics that would be characterized as subprime. The potential for increased risk is particularly true if the nontraditional residential mortgage loans are not underwritten to the fully indexed rate.
Regarding nontraditional mortgage collateral for the QCR, the Bank requires filing members to stratify their holdings of first lien residential mortgage loans into traditional, qualifying low FICO, and qualifying unknown FICO categories. Under limited circumstances, the Bank allows nontraditional residential mortgage loans that are consistent with Federal Financial Institutions Examination Council (FFIEC) guidance to be pledged as collateral and used to determine a member’s MBC.
7
Management believes that the Bank has limited collateral exposure to subprime and nontraditional loans due to its conservative policies pertaining to collateral and low credit risk due to the design of its mortgage loan purchase programs. See the Credit and Counterparty Risk - TCE and Collateral discussion in Risk Management in Item 7. Management’s Discussion and Analysis in this Form 10-K for specific requirements regarding subprime and nontraditional loan collateral.
The various types of eligible collateral and related lending values as of December 31, 2019 are summarized below. The weightings are analyzed on at least a semi-annual basis and adjusted as necessary. At the discretion of the Bank, on a case-by-case basis, the collateral weighting on loan categories may be increased (up to a maximum of 85%) upon completion of specific market valuation of such collateral and authorization from the Bank’s Membership and Credit Committee.
Securities Collateral | Lending Values as a Percentage of Fair Value for All Members |
Deposits held by the Bank and pledged to, and under the sole control of, the Bank | 100% |
U.S. Treasury securities; U.S. Agency securities, including securities of FNMA, FHLMC, FFCB, NCUA, SBA, USDA and FDIC notes; FHLBank consolidated obligations; REFCORP Bonds (1) | 97% |
MBS, including collateralized mortgage obligations (CMOs) issued or guaranteed by GNMA, FHLMC, and FNMA | 95% |
U.S. Treasury STRIPs | 90% |
Non-agency residential MBS, including CMOs, representing a whole interest in such mortgages. | AAA 85% |
AA 75% | |
A 70% | |
Commercial mortgage-backed securities (CMBS) | AAA 85% |
AA 75% | |
A 70% | |
Securities issued by a state or local government or its agencies, or authorities or instrumentalities in the United States (municipals) with a real estate nexus. | AAA 92% |
AA 90% | |
A 88% | |
Loan Collateral | Lending Values | ||
% of Unpaid Principal Balance | % of Fair Value | ||
QCR Filer or Full Collateral Delivery Policy Reasons | Full Collateral Credit Reasons | Market Valuation Program | |
Federal Housing Administration (FHA), Department of Veterans Affairs (VA) and Conventional whole, fully disbursed, first mortgage loans secured by 1-to-4 family residences (Note: Includes first lien HELOCs for listing members only) | 80% | 70% | 85% |
Nontraditional mortgage loans and loans with unknown FICO (2) scores | 70% | 60% | 80% |
Conventional and FHA whole, fully-disbursed mortgage loans secured by multifamily properties | 75% | 65% | 85% |
Farmland loans | 70% | 60% | n/a |
Commercial real estate loans (owner & non-owner occupied) | 70% | 60% | 80% |
Low FICO score loans with mitigating factors as defined by the Bank | 60% | 50% | 75% |
Conventional, fully disbursed, second-mortgage loans secured by 1-to-4 family residences. Both term loans and HELOCs | 60% | 50% | |
CFI Collateral | 60% | 50% | n/a |
Notes:
(1) Defined as Federal National Mortgage Association (Fannie Mae or FNMA), Federal Home Loan Mortgage Corporation (Freddie Mac or FHLMC), Federal Farm Credit Bank (FFCB), Government National Mortgage Association (Ginnie Mae or GNMA), Home Equity Line of Credit (HELOC), National Credit Union Administration (NCUA), Resolution Funding Corporation (REFCORP), Small Business Administration (SBA), and U.S. Department of Agriculture (USDA).
(2) Nontraditional mortgage loan portfolios may be required to be independently identified for collateral review and valuation for inclusion in a member’s MBC. This may include a request for loan-level listing on a periodic basis.
During 2019, the Bank implemented some changes to its collateral policies and practices. See the Credit and Counterparty Risk - TCE and Collateral discussion in Risk Management in Item 7. Management’s Discussion and Analysis in this Form 10-K for details regarding these changes.
8
Investments
Overview. The Bank maintains a portfolio of investments for two main purposes: liquidity and additional earnings. The Bank invests in short term instruments for operating liquidity, including interest-bearing deposits, Federal funds, securities purchased under agreements to resell, as well as U.S. Treasury and GSE obligations that are classified as trading. The Bank also maintains a contingency liquidity investment portfolio which consists of certificate of deposits and unencumbered repurchase-eligible assets within its available-for-sale (AFS) and held-to-maturity (HTM) securities portfolio. These securities may also be pledged as collateral for derivative transactions on occasion.
The Bank further enhances income by acquiring securities issued by GSEs and state and local government agencies as well as Agency MBS. The Bank's private label MBS portfolio continues to run-off; no private label MBS have been purchased since late 2007. Securities currently in the portfolio were required to carry one of the top two ratings from Moody’s Investors Service, Inc. (Moody’s), Standard & Poor’s Ratings Services (S&P) or Fitch Ratings (Fitch) at the time of purchase.
The long-term investment portfolio is intended to provide the Bank with higher returns than those available in the short-term money markets. See the Credit and Counterparty Risk – Investments discussion in Risk Management in Item 7. Management’s Discussion and Analysis in this Form 10-K for discussion of the credit risk of the investment portfolio and further information on these securities’ current ratings.
Prohibitions. Under Finance Agency regulations, the Bank is prohibited from purchasing certain types of securities, including:
• | instruments, such as common stock, that represent an ownership interest in an entity, other than stock in small business investment companies or certain investments targeted to low-income persons or communities; |
• | instruments issued by non-U.S. entities, other than those issued by United States branches and agency offices of foreign commercial banks; |
• | non-investment-grade debt instruments, other than certain investments targeted to low-income persons or communities and instruments that were downgraded after purchase by the Bank; |
• | whole mortgages or other whole loans, other than: (1) those acquired under the Bank’s mortgage purchase program; (2) certain investments targeted to low-income persons or communities; (3) certain marketable direct obligations of state, local or tribal government units or agencies that are of investment quality; (4) MBS or asset-backed securities (ABS) backed by manufactured housing loans or home equity loans (HELOCs); and (5) certain foreign housing loans authorized under Section 12(b) of the Act; and |
• | non-U.S. dollar denominated securities. |
The provisions of Finance Agency regulation further limit the Bank’s investment in MBS and ABS. These provisions require that the total book value of MBS owned by the Bank not exceed 300% of the Bank’s previous month-end regulatory capital on the day of purchase of additional MBS. In addition, the Bank is prohibited from purchasing:
• | interest-only or principal-only strips of MBS; |
• | residual-interest or interest-accrual classes of collateralized mortgage obligations and real estate mortgage investment conduits; and |
• | fixed-rate or floating-rate MBS that on the trade date are at rates equal to their contractual cap and that have average lives that vary by more than six years under an assumed instantaneous interest rate change of 300 basis points. |
The FHLBanks are prohibited from purchasing an FHLBank consolidated obligation as part of the consolidated obligation’s initial issuance. The Bank’s investment policy is even more restrictive, as it prohibits it from investing in FHLBank consolidated obligations for which another FHLBank is the primary obligor. The Federal Reserve Board (Federal Reserve) requires Federal Reserve Banks (FRBs) to release interest and principal payments on the FHLBank System consolidated obligations only when there are sufficient funds in the FHLBanks’ account to cover these payments. The prohibitions on purchasing FHLBank consolidated obligations noted above will be temporarily waived if the Bank is obligated to accept the direct placement of consolidated obligation discount notes to assist in the management of any daily funding shortfall of another FHLBank.
The Bank does not consolidate any off-balance sheet special-purpose entities or other conduits.
9
Mortgage Partnership Finance® (MPF®) Program
Under the MPF Program, the Bank purchases qualifying 5- to 30-year conventional conforming and government-insured fixed-rate mortgage loans secured by one-to-four family residential properties. The MPF Program provides participating members and eligible housing associates a secondary market alternative that allows for increased balance sheet liquidity and provides a method for removal of assets that carry interest rate and prepayment risks from their balance sheets. In addition, the MPF Program provides a greater degree of competition among mortgage purchasers and allows small and mid-sized community-based financial institutions to participate more effectively in the secondary mortgage market.
The Bank currently offers five products under the MPF Program to Participating Financial Institutions (PFIs): MPF Original, MPF 35, MPF Government, MPF Direct and MPF Xtra. The MPF Direct and MPF Xtra products are described below. Further details regarding the credit risk structure for each of the other MPF products, as well as additional information regarding the MPF Program and the products offered by the Bank, is provided in the Financial Condition section and the Credit and Counterparty Risk - Mortgage Loans discussion in Risk Management, both in Item 7. Management’s Discussion and Analysis in this Form 10-K.
PFI. Members and eligible housing associates must specifically apply to become a PFI. The Bank reviews their eligibility including servicing qualifications and ability to supply documents, data and reports required to be delivered under the MPF Program. The Bank added one new PFI in 2019, and as of December 31, 2019, 128 members were approved participants in the MPF Program.
Under the MPF Program, PFIs generally market, originate and service qualifying residential mortgages for sale to the Bank. Member banks have direct knowledge of their mortgage markets and have developed expertise in underwriting and servicing residential mortgage loans. By allowing PFIs to originate mortgage loans, whether through retail or wholesale operations, and to retain or sell servicing of mortgage loans, the MPF Program gives control of the mortgage process to PFIs. PFIs also may earn servicing income if they choose to retain loan servicing or receive a servicing released premium, if they chose to sell servicing rights to a third-party.
During the life of the loan, PFIs are paid a credit enhancement (CE) fee for retaining and managing a portion of the credit risk in the conventional mortgage loan portfolios sold to the Bank under the MPF Original and MPF 35 Programs. The CE structure motivates PFIs to minimize loan losses on mortgage loans sold to the Bank. The Bank is responsible for managing the interest rate risk, prepayment risk, liquidity risk and a portion of the credit risk associated with the mortgage loans.
Mortgage Loan Purchases. The Bank and the PFI enter into a Master Commitment which provides the general terms under which the PFI will deliver mortgage loans, including a maximum loan delivery amount, maximum CE amount and expiration date. Mortgage loans are purchased by the Bank directly from a PFI pursuant to a delivery commitment, a binding agreement between the PFI and the Bank.
Mortgage Loan Participations. The Bank may sell participation interests in purchased mortgage loans to other FHLBanks, institutional third party investors approved in writing by the FHLBank of Chicago, the member that provided the CE, and other members of the FHLBank System. The Bank also may purchase mortgage loans from other FHLBanks.
Mortgage Loan Servicing. Under the MPF Program, PFIs may retain or sell servicing to third parties. The Bank does not service loans or own any servicing rights. The FHLBank of Chicago acts as the master servicer for the Bank and has contracted with Wells Fargo Bank, N.A. to fulfill the master servicing duties. The Bank pays the PFI or third-party servicer a servicing fee to perform these duties. The servicing fee is 25 basis points for conventional loans and 44 basis points for government loans.
MPF Xtra. MPF Xtra allows PFIs to sell residential, conforming, fixed-rate mortgages to FHLBank of Chicago, which concurrently sells them to Fannie Mae on a nonrecourse basis. MPF Xtra does not have the CE structure of the traditional MPF Program. Additionally, because these loans are sold from the PFI to FHLBank of Chicago to Fannie Mae, they are not reported on the Bank’s Statement of Condition. With the MPF Xtra product, there is no credit obligation assumed by the PFI or the Bank and no CE fees are paid. PFIs which have completed all required documentation and training are eligible to offer the product. As of December 31, 2019, 39 PFIs were eligible to offer the product. The Bank receives a nominal fee for facilitating these MPF Xtra transactions.
MPF Direct. This is operationally similar to MPF Xtra and allows PFIs to sell residential, jumbo, fixed-rate mortgages to FHLBank Chicago, which concurrently sells them to a third party on a nonrecourse basis. PFIs which have completed all required documentation and training are eligible to offer the product. MPF Direct does not have the credit structure of the traditional MPF Program, and there is no CE obligation assumed by the PFI or the Bank and no CE fees are paid. The Bank
10
receives a nominal fee for facilitating MPF Direct transactions. Given the arrangement, these loans are not reported on the Bank's Statement of Condition.
The FHLBank of Chicago, in its role as MPF Provider, provides the programmatic and operational support for the MPF Program and is responsible for the development and maintenance of the origination, underwriting and servicing guides.
“Mortgage Partnership Finance”, “MPF”, “MPF Xtra”, “MPF Direct” and “MPF 35” are registered trademarks of the FHLBank of Chicago.
Specialized Programs
For additional information on Affordable Housing Program (AHP) and other similar programs, refer to the Community Investment Products section in Item 7. Management’s Discussion and Analysis in this Form 10-K.
Deposits
The Act allows the Bank to accept deposits from its members, from any institution for which it is providing correspondent services, from other FHLBanks, or from other Federal instrumentalities. Deposit programs are low-cost funding resources for the Bank, which also provide members a low-risk earning asset that is used in meeting their regulatory liquidity requirements. The Bank offers several types of deposit programs to its members including demand, overnight and term deposits.
Debt Financing — Consolidated Obligations
The primary source of funds for the Bank is the issuance of debt securities, known as consolidated obligations, which are then sold by dealers to investors. These consolidated obligations are issued as both bonds and discount notes, depending on maturity. Consolidated obligations are the joint and several obligations of the 11 FHLBanks. Consolidated obligations are not obligations of the U.S. government, and the U.S. government does not guarantee them. Moody’s has rated consolidated obligations Aaa with stable outlook/P-1, and S&P has rated them AA+ with stable outlook/A-1+. The following table presents the total par value of the consolidated obligations of the Bank and the FHLBank System at December 31, 2019 and 2018.
(in millions) | December 31, 2019 | December 31, 2018 | ||||
Consolidated obligation bonds | $ | 66,704.2 | $ | 64,368.4 | ||
Consolidated obligation discount notes | 23,211.5 | 36,985.0 | ||||
Total Bank consolidated obligations | 89,915.7 | 101,353.4 | ||||
Total FHLBank System combined consolidated obligations | $ | 1,025,894.7 | $ | 1,031,617.5 | ||
OF. The OF has responsibility for facilitating the issuance and servicing of consolidated obligations on behalf of the FHLBanks. The OF also serves as a source of information for the Bank on capital market developments, markets the FHLBank System’s consolidations obligations on behalf of the FHLBanks, selects and evaluates underwriters, prepares combined financial statements, and manages the Banks’ relationship with the rating agencies and the U.S. Treasury with respect to the consolidated obligations.
Consolidated Obligation Bonds. On behalf of the Bank, the OF issues bonds that the Bank uses to fund advances, the MPF Program and its investment portfolio. Generally, the maturity of these bonds ranges from one year to ten years, although the maturity is not subject to any statutory or regulatory limit. Bonds can be issued and distributed through negotiated or competitively bid transactions with approved underwriters or selling group members. In some instances, the Bank swaps its term fixed-rate debt issuance to floating rates through the use of interest rate swaps. Bonds can be issued through:
• | a daily auction for both bullet (non-callable and non-amortizing) and American-style (callable daily after lockout period expires) callable bonds |
• | a selling group, which typically has multiple lead investment banks on each issue |
• | a negotiated transaction with one or more dealers |
The process for issuing bonds under the three methods above can vary depending on whether the bonds are non-callable or callable. For example, the Bank can request funding through the TAP auction program (quarterly debt issuances that reopen or “tap” into the same CUSIP number) for fixed-rate non-callable (bullet) bonds. This program uses specific maturities that may be reopened daily during a three-month period through competitive auctions. The goal of the TAP program is to aggregate frequent smaller issues into a larger bond issue that may have greater market liquidity.
11
Consolidated Obligation Discount Notes. The OF also issues discount notes to provide short-term funds for advances for seasonal and cyclical fluctuations in deposit flows, mortgage financing, short-term investments and other funding needs. Discount notes are sold at a discount and mature at par. These securities have maturities of up to 365 days. There are three methods for issuing discount notes:
• | The OF auctions one-, two-, three- and six-month discount notes twice per week and any FHLBank can request an amount to be issued. The market sets the price for these securities. |
• | Via the OF’s window program, through which any FHLBank can offer a specified amount of discount notes at a maximum rate and a specified term up to 365 days. These securities are offered daily through a consolidated discount note selling group of broker-dealers. |
• | Via reverse inquiry, wherein a dealer requests a specified amount of discount notes be issued for a specific date and price. The OF presents reverse inquiries to the FHLBanks, which may or may not choose to issue those particular discount notes. |
See the Liquidity and Funding Risk discussion in the Risk Management section in Item 7. Management’s Discussion and Analysis in this Form 10-K for further information regarding consolidated obligations and related liquidity risk.
Capital Resources
Capital Plan. The Bank currently has two subclasses of capital stock: B1 membership and B2 activity. The Capital Plan generally sets the calculation of the annual Membership Asset Value (MAV) stock purchase requirement based on the member’s assets as set forth in its prior December 31 call report data. Membership assets include, but are not limited to, the following: U.S. Treasury securities; U.S. Agency securities; U.S. Agency MBS; non-Agency MBS; 1-4 family residential first mortgage loans; multi-family mortgage loans; 1-4 family residential second mortgage loans; home equity lines of credit; and commercial real estate loans. A factor is applied to each membership asset category and the resulting MAV is determined by summing the products of the membership asset categories and the respective factor. Adjustments to the amount of membership and activity stock that each member must hold can be made periodically by the Bank's Board in accordance with the terms of the Capital Plan. Ranges have been built into the Capital Plan to allow the Bank to adjust the stock purchase requirement to meet its regulatory capital requirements, if necessary. Currently, these are the stock purchase requirements for each class of stock.
Each member is required to purchase and maintain membership stock equal to the following:
Range of membership stock requirement according to the Capital Plan | |||
Minimum | Maximum | Current requirement | |
% of membership assets | 0.05% | 1.0% | 0.1% |
Membership stock cap | $5 million | $100 million | $45 million |
Membership stock floor | $10 thousand | ||
Each member is required to purchase and maintain activity stock equal to the percentage of the book value of the following transactions as shown in the table below:
Range of activity stock requirement according to the Capital Plan | |||
Minimum | Maximum | Current requirement | |
Outstanding advances | 2.0% | 6.0% | 4.0% |
Acquired member assets (AMA) | 0.0% | 6.0% | 4.0% |
Letters of credit | 0.0% | 4.0% | 0.75% |
Outstanding advance commitments (settling more than 30 days after trade date) | 0.0% | 6.0% | 0.0% |
Bank capital stock is not publicly traded; it may be issued, redeemed and repurchased at its stated par value of $100 per share. Under the Capital Plan, capital stock is redeemed upon five years’ notice, subject to certain conditions. In addition, the Bank has the discretion to repurchase excess stock from members. The Bank's current practice is to repurchase all excess capital stock on a weekly basis.
12
Dividends and Retained Earnings. As prescribed in the Capital Plan, the Bank may pay dividends on its capital stock only out of unrestricted retained earnings or current net income, subject to certain limitations and conditions. The Bank’s Board may declare and pay dividends in either cash or capital stock. The Bank’s practice has been to pay only a cash dividend. The amount of dividends the Board determines to pay out is affected by, among other factors, the level of retained earnings recommended under the Bank’s retained earnings policy. In addition, as set forth in the Capital Plan, the dividends paid on subclass B2 activity stock will be equal to or higher than the dividends being paid on subclass B1 membership stock at that time. For further information on dividends, see Note 15 - Capital in the Notes to Financial Statements in Item 8. of this Form 10-K.
As of December 31, 2019, the balance in retained earnings was $1,326.0 million, of which $415.3 million was deemed restricted. Refer to the Capital Resources section and the Risk Governance discussion in Risk Management, both in Item 7. Management’s Discussion and Analysis in this Form 10-K for additional discussion of the Bank’s capital-related metrics, retained earnings, dividend payments, capital levels and regulatory capital requirements.
Derivatives and Hedging Activities
The Bank may enter into interest rate swaps, swaptions, to-be-announced (TBAs), and interest rate cap and floor agreements (collectively, derivatives) to manage its exposure to changes in interest rates and prepayment risk. The Bank uses these derivatives to adjust the effective maturity, repricing frequency, or option characteristics of financial instruments to achieve its risk management objectives. The Bank may use derivative financial instruments in the following ways: (1) by designating them as a fair value hedge of an underlying financial instrument or a firm commitment; or (2) in asset/liability management (i.e., an economic hedge).
The Finance Agency regulates the Bank’s use of derivatives. The regulations prohibit the trading in or speculative use of these instruments and limit credit risk arising from these instruments. All derivatives are recorded in the Statement of Condition at fair value. See Note 11- Derivatives and Hedging Activities to the audited financial statements in Item 8. Financial Statements and Supplementary Financial Data in this Form 10-K for additional information.
Competition
Advances. The Bank competes with other suppliers of wholesale funding, both secured and unsecured, including the FRBs, commercial banks, investment banking divisions of commercial banks, and brokered deposits, largely on the basis of interest rates as well as types and weightings of collateral. Competition is often more significant when originating advances to larger members, which have greater access to the capital markets. Competition within the FHLBank System is somewhat limited; however, there may be some members of the Bank that have affiliates that are members of other FHLBanks. The Bank's ability to compete successfully with other suppliers of wholesale funding for business depends primarily on pricing, dividends, capital stock requirements, credit and collateral terms, and products offered.
Purchase of Mortgage Loans. Members have several alternative outlets for their mortgage loan production including Fannie Mae, Freddie Mac, and other secondary market conduits. The MPF Program competes with these alternatives on the basis of price and product attributes. Additionally, a member may elect to hold all or a portion of its mortgage loan production in portfolio, potentially funded by an advance from the Bank.
Issuance of Consolidated Obligations. The Bank competes with the U.S. Treasury, Fannie Mae, Freddie Mac and other GSEs as well as corporate, sovereign and supranational entities for funds raised through the issuance of unsecured debt in the national and global debt markets. Increases in the supply of competing debt products may, in the absence of increases in demand, result in higher debt cost. The Bank’s status as a GSE affords certain preferential treatment for its debt obligations under the current regulatory scheme for depository institutions operating in the U.S. as well as preferential tax treatment in a number of state and municipal jurisdictions. Any change in these regulatory conditions as they affect the holders of Bank debt obligations would likely alter the relative competitive position of such debt issuance and result in potentially higher costs to the Bank.
Major Customers
Ally Bank, JP Morgan Chase Bank, N.A., PNC Bank, N.A. and Santander Bank, each had advance balances in excess of 10% of the Bank’s total portfolio as of December 31, 2019. See further discussion in Item 1A. Risk Factors and the Credit and Counterparty Risk - TCE and Collateral discussion in the Risk Management section in Item 7. Management’s Discussion and Analysis, both in this Form 10-K.
13
Personnel
As of December 31, 2019, the Bank had 224 full-time employee positions and four part-time employee positions, for a total of 226 full-time equivalents. The employees are not represented by a collective bargaining unit and the Bank considers its relationship with its employees to be good.
Taxation
The Bank is exempt from all Federal, state and local taxation with the exception of real estate property taxes and certain employer payroll taxes.
AHP
The FHLBanks must set aside for the AHP annually, on a combined basis, the greater of $100 million or 10% of current year’s net income (GAAP net income before interest expense related to mandatorily redeemable capital stock and the assessment for AHP). If the Bank experienced a full year net loss, as defined in Note 14 - Affordable Housing Program (AHP) to the audited financial statements in Item 8. Financial Statements and Supplementary Financial Data in this Form 10-K, the Bank would have no obligation to the AHP for the year except in the following circumstance: if the result of the combined 10% calculation described above is less than $100 million for all 11 FHLBanks, then the Act requires that each FHLBank contribute such prorated sums as may be required to assure that the aggregate contributions of the FHLBanks equal $100 million. The proration would be made on the basis of an FHLBank’s net income in relation to the income of all FHLBanks for the previous year. Each FHLBank’s required annual AHP contribution is limited to its annual net income. If an FHLBank finds that its required contributions are negatively impacting the financial stability of that FHLBank, it may apply to the Finance Agency for a temporary suspension of its contributions. As allowed by AHP regulations, an FHLBank can elect to allot fundings based on future periods’ required AHP contributions to be awarded during a year (referred to as Accelerated AHP). Accelerated AHP allows an FHLBank to commit and disburse AHP funds to meet the FHLBank’s mission when it would otherwise be unable to do so, based on its normal funding mechanism.
For additional details regarding the AHP assessment, please see the Earnings Performance discussion in Item 7. Management’s Discussion and Analysis and Note 14 - Affordable Housing Program (AHP) in Item 8. Financial Statements and Supplementary Financial Data in this Form 10-K.
SEC Reports and Corporate Governance Information
The Bank is subject to the informational requirements of the 1934 Act and, in accordance with the 1934 Act, files annual, quarterly and current reports with the SEC. The Bank’s SEC File Number is 000-51395. The SEC maintains an internet site that contains reports, proxy and information statements and other information regarding registrants that file electronically with the SEC, including the Bank’s filings. The Bank’s financial information is also filed in eXtensible Business Reporting Language (XBRL) as required by the SEC. The SEC’s website address is www.sec.gov.
The Bank also makes the Annual Reports filed on Form 10-K, Quarterly Reports filed on Form 10-Q, certain Current Reports filed on Form 8-K, and amendments to those reports filed with or furnished to the SEC pursuant to Section 13(a) or 15(d) of the 1934 Act available free of charge on or through its internet website as soon as reasonably practicable after such material is filed with or furnished to the SEC. The Bank’s internet website address is www.fhlb-pgh.com. The Bank filed the certifications of the President and Chief Executive Officer, Chief Operating Officer (principal financial officer), and the Chief Accounting Officer pursuant to Sections 302 and 906 of the Sarbanes-Oxley Act of 2002 with respect to the Bank’s 2019 Annual Report on Form 10-K as exhibits to this Report.
Information about the Bank’s Board and its committees and corporate governance, as well as the Bank’s Code of Conduct, is available in the corporate governance section of the “About Us” dropdown on the Bank’s website at www.fhlb-pgh.com. Printed copies of this information may be requested without charge by written request to the Bank’s Legal Department.
Item 1A: Risk Factors
There are many factors - including those beyond the Bank's control - that could cause financial results to differ significantly from the Bank's expectations. The following discussion summarizes some of the more important factors that should be considered carefully in evaluating the Bank's business. This discussion is not exhaustive and there may be other factors not described or factors, such as business, credit, market/liquidity and operational risks, which are described elsewhere in this report (see the Risk Management discussion in Item 7. Management's Discussion and Analysis in this Form 10-K),
14
which could cause results to differ materially from the Bank's expectations. However, management believes that these risks represent the material risks relevant to the Bank, its business and industry. Any factor described in this report could by itself, or together with one or more other factors, adversely affect the Bank's business operations, future results of operations, financial condition or cash flows.
BUSINESS RISK
The Bank is subject to legislative and regulatory actions, including a complex body of Finance Agency regulations, which may be amended in a manner that may affect the Bank's business, operations and financial condition and members' investment in the Bank. Additionally, legislation and regulations applicable to Bank members may affect the Bank’s business as well.
The FHLBanks' business operations, funding costs, rights, obligations, and the environment in which FHLBanks carry out their liquidity mission continue to be impacted by the evolving regulations impacting the finance industry. The Housing Act or HERA was intended to, among other things, expand the Finance Agency's authority and address GSE reform issues. Over the last few years, there have been several legislative efforts and policy proposals regarding reform of the Housing Enterprises, Fannie Mae and Freddie Mac, and the federal government’s ongoing role in the mortgage market. Congress continues to consider GSE reform legislation. Depending on the terms of any such legislation, it could have a material effect on the Bank including debt issuance, financial condition and results of operations. In addition, future legislative changes to the Act or HERA may affect the Bank's business, risk profile, results of operations and financial condition. Recently, there have been legislative efforts and discussions regarding allowing non-banks such as captive insurers, mortgage banks, fintech companies and other financial companies to become members of the FHLBank System. Such entities are subject to different regulatory requirements and may have different risk appetites than the Bank’s current members and, if such entities were to become members of the Bank, it could materially impact the Bank’s risk profile and results of financial condition.
The FHLBanks are also governed by regulations as adopted by the Finance Agency pursuant to their authority under federal laws. The Finance Agency's extensive statutory and regulatory authority over the FHLBanks includes, without limitation, the authority to liquidate, merge or consolidate FHLBanks, redistrict or adjust equities among the FHLBanks. The Bank cannot predict if or how the Finance Agency could exercise such authority in regard to any FHLBank or the potential impact of such action on members' investment in the Bank. The Finance Agency also has authority over the scope of permissible FHLBank products and activities, including the authority to impose limits on those products and activities. The Finance Agency supervises the Bank and establishes the regulations governing the Bank. Changes in Finance Agency leadership may also impact the nature and extent of any new or revised regulations on the Bank.
The Bank cannot predict new guidance or the effect of any new regulations on the Bank's operations. Regulatory requirements on the Bank’s members may affect their capacity and demand for Bank products, and as a result, impact the Bank’s operations and financial condition. Changes in Finance Agency regulations and other Finance Agency regulatory actions could result in, among other things, changes in the Bank's capital composition, an increase in the Banks' cost of funding, a change in permissible business activities, a decrease in the size, scope, or nature of the Banks' lending, investment or mortgage purchase program activities, or a decrease in demand for the Bank's products and services, which could negatively affect its financial condition and results of operations and members' investment in the Bank.
Regulatory changes drive updates to the Bank's computer information systems to support these requirements. Heightened regulatory focus on technology operations including cyber-security, cloud computing and vendor oversight influence the Bank’s operations. Legislation and regulation regarding enhanced cyber-security standards and requirements necessitates additional work to appropriately mitigate the risks and align with requirements. The Finance Agency has issued guidance for the FHLBanks regarding information security and cyber risk management, business resiliency, vendor risk management and cloud. These are all areas of operational risk that are expected to have an ongoing area of regulatory focus. See the Legislative and Regulatory Developments section of Item 7. Management’s Discussion and Analysis in this Form 10-K regarding recent Finance Agency guidance in these areas.
The intention of the United Kingdom’s Financial Conduct Authority (FCA) is to cease sustaining LIBOR after 2021. The introduction of alternative interest rates could adversely affect the Bank’s business, financial condition, and results of operations and increase operational risk.
In July 2017, the Chief Executive of the FCA announced the FCA’s intention to cease sustaining LIBOR after 2021. The Federal Reserve convened the Alternative Reference Rates Committee (ARRC) to identify a set of alternative reference interest rates for possible use as market benchmarks. The ARRC identified the Secured Overnight Financing Rate (SOFR) as such an alternative rate, and the FRB of New York began publishing SOFR rates in the second quarter of 2018.
15
The Bank is not able to predict with certainty that LIBOR will cease to be available after 2021. While the Bank is planning for LIBOR to cease to exist, the market’s transition from LIBOR to alternative rates (e.g., SOFR) is expected to be complicated. Risks relating to the market demand for the Bank’s products, changes in legacy contractual terms on the Bank’s financial assets, liabilities and derivatives, and critical vendors being able to adjust systems to properly process and account for alternative rates are examples of the risks. Additionally, the introduction of alternative rates also may create additional basis risk and increased volatility for market participants including the Bank, as alternative indices are utilized along with LIBOR. Alternative rates and other market changes related to the replacement of LIBOR, including the introduction of financial products and changes in market practices, may lead to risk modeling and valuation challenges. For further details regarding LIBOR/SOFR transition, refer to the Operational and Business Risks section in Item 7: Management’s Discussion and Analysis in this Form 10-K.
The Bank's business is dependent upon its computer information systems. An inability to process or physically secure information or implement technological changes, or an interruption in the Bank's systems, may result in lost business or increased operational risk. The Bank's dependence on computer systems and technologies to engage in business transactions and to communicate with its stakeholders has increased the Bank's exposure to cyber-security risks.
Cyber threats include computer viruses, malicious or destructive code, phishing attacks, brute force attacks, ransomware attacks, denial of service or information or other security breaches. They could result in the unauthorized release, gathering, monitoring, misuse, loss or destruction of confidential, proprietary and other information of the Bank, its employees, its members or other third parties, or otherwise materially disrupt the Bank’s or its members’ or other third parties’ network access, business operations or ability to provide services. For example, the Bank provides on-line banking transactional capability to enable its members to execute borrowing and other transactions with the Bank. The Bank like many financial institutions and others businesses faces cyber attack attempts routinely, for example, from phishing campaigns and denial of service attempts. Although the Bank has both information and physical security measures in place and devotes significant resources to secure the Bank's computer systems and networks, it might not be able to anticipate or implement effective preventive measures against all security breaches, particularly given that such attacks have significantly evolved in scale and maliciousness during the past few years. Additionally, cyber vulnerabilities and/or attacks could go undetected for a period of time. During such time, the Bank may not necessarily know the extent of the harm and certain actions could be compounded before they are discovered and remediated, any or all of which could further increase the consequences of a cyber attack.
As cyber threats continue to evolve, the Bank may be required to expend significant additional resources to continue to modify or enhance its layers of defense or to investigate and remediate any information security vulnerabilities. Previously, the Bank had experienced a limited number of successful desktop (e.g., malware) security incidents. However, these incidents were limited and did not involve any breaches of data such as those that trigger notice requirements under applicable law. Each of these incidents was responded to appropriately which prevented material impact on the Bank’s operations. The Bank’s technology control environment, along with security policies and standards, incident response procedures, security controls testing and dedicated information security resources, have protected the Bank against material cyber-security attacks. In addition, the Bank completes periodic independent assessments that leverage industry recognized frameworks in order to continually improve the Bank’s control environment against cyber-security attacks. If a successful penetration were to occur, it might result in unauthorized access to digital systems for purposes of misappropriating assets (including loss of funds), or sensitive information (including confidential information of the Bank, members, counterparties or mortgage loan borrowers), corrupt data or cause operational disruption. This may result in financial loss or a violation of privacy or other laws. The Bank could incur substantial costs and suffer other negative consequences as a result, including but not limited to remediation costs, increased security costs, litigation, penalties, and reputational damage.
In addition, the Bank's business is dependent upon its ability to effectively exchange and process information using its computer information systems. The Bank's products and services require a complex and sophisticated computing environment, which includes licensed or purchased, custom-developed software, and software-as-a-service (SaaS). Maintaining the effectiveness and efficiency of the Bank's operations is dependent upon the continued timely implementation of technology solutions and systems, which may require ongoing expenditures, as well as the ability to sustain ongoing operations during technology solution implementations or upgrades. If the Bank were unable to sustain its technological capabilities, it may not be able to remain competitive, and its business, financial condition and profitability may be significantly compromised. To advance its disaster recovery and continuous operations, the Bank continues to take steps to review and improve its recovery facilities and processes through its Business Continuity Plan and testing those plans annually. Nonetheless, the Bank cannot guarantee the effectiveness of its Business Continuity Plan or other related policies, procedures and systems to protect the Bank in any particular future situation.
16
Global financial market disruptions could result in uncertainty and unpredictability for the Bank in managing its business. Geopolitical conditions, widespread health emergencies or a natural disaster, especially those affecting the Bank or the Bank's district, customers or counterparties, could also adversely affect the Bank's business, results of operations or financial condition.
The Bank's business, earnings and risk profile are affected by international, domestic and district-specific business and economic conditions and disruptions, including for example, U.S. government shutdowns, any increasing U.S. debt burden, uncertainty around Brexit outcomes, and tariffs. These economic conditions, which may also affect counterparty and members' business, include real estate values, residential mortgage originations, short-term and long-term interest rates, inflation and inflation expectations, unemployment levels, money supply, fluctuations in both debt and equity markets, and the strength of the foreign, domestic and local economies in which the Bank operates. These are examples of potential market disruptions that could increase the Bank’s credit, market, liquidity and operational risk beyond what is currently reported and measured. Widespread health emergencies or pandemics, including the recent outbreak of coronavirus, could also adversely affect the Bank’s results of operations or financial condition by negatively impacting the global markets or by softening the economy in general, creating a reduced demand for the Bank’s products and services. Additionally, climate change may cause natural disasters, which could damage the facilities of the Bank’s members, increase lending losses at its members, damage or destroy collateral that members have pledged to secure advances or mortgages that the Bank holds for its portfolio, and which could cause the Bank to experience losses or be exposed to a greater risk that pledged collateral would be inadequate in the event of a default.
CREDIT RISK
The loss of significant Bank members or borrowers may have a negative impact on the Bank's advances and capital stock outstanding and could result in lower demand for its products and services, lower dividends paid to members and higher borrowing costs for remaining members, all of which may affect the Bank's results of operations and financial condition.
One or more significant Bank borrowing members could choose to decrease their business activities with the Bank, move their business to another FHLBank district, merge into a nonmember, withdraw their membership, or fail which could lead to a significant decrease in the Bank's total assets. In the event the Bank would lose one or more large borrowers that represent a significant proportion of its business, the Bank could, depending on the magnitude of the impact, compensate for the loss by suspending, or otherwise restricting, dividend payments and repurchases of excess capital stock, raising advance rates, attempting to reduce operating expenses (which could cause a reduction in service levels or products offered) or by undertaking some combination of these actions. The magnitude of the impact would depend, in part, on the Bank's size and profitability at the time the financial institution ceases to be a borrower.
At December 31, 2019, the Bank's five largest customers, Ally Bank, JP Morgan Chase Bank, N.A. (a non-member borrower), PNC Bank, N.A., Santander Bank, N.A. and TD Bank, N.A., accounted for 70% of its total credit exposure (TCE) and owned 65% of its outstanding capital stock. Of these, Ally Bank, JP Morgan Chase Bank, N.A., Santander Bank, N.A. and PNC Bank N.A. each had outstanding advance balances in excess of 10% of the total portfolio. If any of the Bank’s five largest customers paid off their outstanding advances, reduced their letter of credit activity with the Bank or, if applicable, withdrew from membership, the Bank could experience a material adverse effect on its outstanding advance levels and TCE, which would impact the Bank's financial condition and results of operations. Effective May 18, 2019, the Bank’s member, Chase Bank USA, N.A., merged with and into JP Morgan Chase Bank, N.A. and ceased being a member. JP Morgan Chase Bank, N.A.’s outstanding advance balance as of December 31, 2019 was $8.0 billion.
The Bank faces competition for advances, mortgage loan purchases and access to funding, which could negatively impact earnings.
The Bank's primary business is making advances to its members. The Bank competes with other suppliers of wholesale funding, both secured and unsecured, including commercial banks and their investment banking divisions, the FRBs, providers of brokered deposits and, in some circumstances, other FHLBanks. Members have access to alternative funding sources, which may offer more favorable terms than the Bank offers on its advances, including more flexible credit or collateral standards. In addition, many of the Bank's competitors are not subject to the same body of regulations applicable to the Bank, which enables those competitors to offer products and terms that the Bank is not able to offer.
In connection with the MPF Program, the Bank is subject to competition regarding the purchase of conventional, conforming fixed-rate mortgage loans. In this regard, the Bank faces competition in the areas of customer service, purchase prices for the MPF loans and ancillary services such as automated underwriting. The Bank's strongest competitors are large mortgage aggregators, non-depository mortgage entities, and the other housing GSEs, Fannie Mae and Freddie Mac. The Bank
17
may also compete with other FHLBanks with which members have a relationship through affiliates. Most of the FHLBanks participate in the MPF Program or similar programs. Competition among FHLBanks for MPF business may be affected by the requirement that a member and its affiliates can sell loans into the MPF Program through only one FHLBank relationship at a time. Some of these mortgage loan competitors have greater resources, larger volumes of business, longer operating histories and more product offerings. In addition, because the volume of conventional, conforming fixed-rate mortgages fluctuates depending on the level of interest rates, the demand for MPF Program products could diminish. Increased competition can result in a reduction in the amount of mortgage loans the Bank is able to purchase and consequently lower net income.
The FHLBanks also compete with the U.S. Treasury and GSEs as well as corporate, sovereign and supranational entities for funds raised through the issuance of unsecured debt in the national and global debt markets. Increases in the supply of competing debt products may, in the absence of increases in demand, result in higher debt costs or lower amounts of debt issued at the same cost than otherwise would be the case. Increased competition could adversely affect the Bank's ability to have access to funding, reduce the amount of funding available or increase the cost of funding. Any of these effects could adversely affect the Bank's financial condition and results of operations.
The Bank is subject to credit risk due to default, including failure or ongoing instability of any of the Bank's member, derivative, money market or other counterparties, which could adversely affect the Bank's results of operations or financial condition.
The Bank faces credit risk on advances, mortgage loans, investment securities, money market investments, derivatives, certificates of deposit, and other financial instruments. A member failure without liquidation proceeds satisfying the amount of the failed institution’s obligations and the operational cost of liquidating the collateral could impact the Bank’s ability to issue debt. The Bank protects against credit risk on advances through credit underwriting standards and collateralization which includes blanket lien and specific collateral pledge agreements. In addition, the Bank has the right to obtain additional or substitute collateral during the life of an advance to protect its security interest. The Act defines eligible collateral as certain investment securities, residential mortgage loans, deposits with the Bank, and other real estate related assets. All capital stock of the Bank owned by the borrower is also available as supplemental collateral. In addition, members that qualify as CFIs may pledge secured small-business, small-farm, and small-agribusiness and community development loans as collateral for advances. The Bank is also allowed to make advances to nonmember housing associates and requires them to deliver adequate collateral.
The types of collateral pledged by members are evaluated and assigned a borrowing capacity, generally based on a percentage of its value. This value can be based on either book value or market value, depending on the nature and form of the collateral being pledged. The volatility of market prices and interest rates could affect the value of the collateral held by the Bank as security for the obligations of Bank members as well as the ability of the Bank to liquidate the collateral in the event of a default by the obligor. Volatility within collateral indices may affect the method used in determining collateral weightings, which would ultimately affect the eventual collateral value. With respect to TCE, including advances, the Bank's policies require the Bank to be over-collateralized. In addition, all advances are current and no loss has ever been incurred in the portfolio. Based on these factors, no allowance for credit losses on advances is required. The Bank has policies and procedures in place to manage the collateral positions; these are subject to ongoing review, evaluation and enhancements as necessary.
Member institution failures may reduce the number of current and potential members in the Bank's district. The resulting loss of business could negatively impact the Bank's financial condition and results of operations. Additionally, if a Bank member fails and the FDIC or the member (or another applicable entity) does not either (1) promptly repay all of the failed institution's obligations to the Bank or (2) assume the outstanding advances, the Bank may be required to liquidate the collateral pledged by the failed institution to satisfy its obligations to the Bank. If that were the case, the proceeds realized from the liquidation of pledged collateral may not be sufficient to fully satisfy the amount of the failed institution's obligations and the operational cost of liquidating the collateral.
There are several unique risks the Bank may be exposed to regarding members in the insurance industry. To the extent the Bank determines that the risk it faces regarding an insurance company or insurance company members in a specific state requires additional mitigation, the Bank takes steps to mitigate this risk. These steps may include limits on eligible collateral and establishing over-collateralization levels to address risk of collateral volatility.
The Bank currently has two CDFI members, which are not generally subject to banking or insurance regulations. The Bank takes steps to mitigate this risk, which may include requiring specific over-collateralization levels or limits on eligible collateral. For all CDFI members, the Bank requires delivery of collateral pledged to secure the Bank’s advances and other credit products provided to such members.
18
The Bank follows Board-established guidelines on unsecured extensions of credit which limit the amounts and terms of unsecured credit exposure to investment grade counterparties, the U.S. government and other FHLBanks. The Bank's primary unsecured credit exposure includes Federal funds and other liquid transactions. Unsecured credit exposure to any counterparty is limited by the credit quality and capital level of the counterparty and by the capital level of the Bank. Nevertheless, the insolvency of a major counterparty or the inability of a major counterparty to meet its obligations under such transactions or other agreement could cause the Bank to incur losses and have an adverse effect on the Bank's financial condition and results of operations.
In addition, the Bank's ability to engage in routine derivatives, funding and other transactions could be adversely affected by the actions and commercial soundness of other financial institutions. Financial institutions are interrelated as a result of trading, clearing, repos, or other relationships. As a result, defaults by, or even rumors or questions about, one or more financial services institutions, or the financial services industry generally, could lead to market-wide disruptions in which it may be difficult for the Bank to find counterparties for such transactions.
If the number of high quality counterparties available for uncleared hedging transactions decreases, the Bank's ability to enter into hedging transactions may be constrained. As a result, the Bank may not be able to effectively manage interest rate risk, which could negatively affect its results of operations and financial condition. In addition, the Bank may be limited in the number of counterparties available with which it can conduct business with respect to money market investments, liquidity positions and other business transactions. It may also affect the Bank's credit risk position and the advance products the Bank can offer to members. For additional discussion regarding the Bank's credit and counterparty risk, see the Credit and Counterparty Risk discussion in Risk Management in Item 7. Management's Discussion and Analysis in this Form 10-K.
The Bank invests in mortgages and is subject to the risk of credit deterioration, which could adversely impact the Bank's results of operations and could impact the Bank’s capital position.
The Bank currently invests in Agency and other U.S. obligation MBS, which support the Bank’s mission. The Bank still has an investment in its legacy private label MBS portfolio, however, none have been purchased since 2007 and it continues to run off. The Bank has incurred credit losses on this portfolio in previous years and cannot estimate future amounts of additional credit losses in future periods.
MBS are backed by residential mortgage loans, the properties of which are geographically diverse. The MBS portfolio is also subject to interest rate risk, prepayment risk, operational risk, servicer risk and originator risk, all of which can have a negative impact on the underlying collateral of the MBS investments. The rate and timing of unscheduled payments and collections of principal on mortgage loans serving as collateral for these securities are difficult to predict and can be affected by a variety of factors, including the level of prevailing interest rates, restrictions on voluntary prepayments contained in the mortgage loans, the availability of lender credit, loan modifications and other economic, demographic, geographic, tax and legal factors.
The MPF Program has different risks than those related to the Bank's traditional advance business, which could adversely impact the Bank's profitability.
The Bank participates in the MPF Program with the FHLBank of Chicago as MPF provider. Net mortgage loans held for portfolio accounted for 5.3% of the Bank's total assets as of December 31, 2019 and approximately 6.3% of the Bank's total interest income in 2019. During 2019, the Bank purchased 66% of the mortgage loans from one member. This member also held 46% of the total outstanding portfolio. The loss of this member could adversely affect the Banks’ future results of operations.
In contrast to the Bank's traditional member advance business, the MPF Program is highly subject to competitive pressures, more susceptible to loan losses, and also carries more interest rate risk, prepayment risk and operational complexity. The residential mortgage loan origination business historically has been a cyclical industry, enjoying periods of strong growth and profitability followed by periods of shrinking volumes and industry-wide losses. General changes in market conditions could have a negative effect on the mortgage loan market. These would include, but are not limited to: rising interest rates slowing mortgage loan originations; an economic downturn creating increased defaults and lowered housing prices; innovative products that do not currently meet the criteria of the MPF Program; and new government programs or mandates. Any of these changes could have a negative impact on the profitability of the MPF Program. While many governmental loan modification programs are ending due to regulatory, business and customer expectations, servicers are expected to continue to offer other loan modification programs. The Bank offers a loan modification program for its MPF Program loans as well. To date, the Bank has not experienced any significant impact on its portfolio levels from the Bank's MPF loan modification program or
19
other foreclosure prevention programs. However, program execution and related changes, as well as any new programs in the market may change that experience.
The rate and timing of unscheduled payments and collections of principal on mortgage loans are difficult to predict and can be affected by a variety of factors, including the level of prevailing interest rates, the availability of lender credit, and other economic, demographic, geographic, tax and legal factors. The Bank manages prepayment risk through a combination of consolidated obligation issuance and, to a lesser extent, derivatives. If the level of actual prepayments is higher or lower than expected, the Bank may experience a mismatch with a related consolidated obligation issuance, which could have an adverse impact on net interest income. Also, increased prepayment levels will cause premium amortization to increase, reducing net interest income, and increase the potential for debt overhang. In certain MPF Program products, increased prepayments may also reduce credit enhancements available to absorb credit losses. To the extent one or more of the geographic areas in which the Bank's MPF loan portfolio is concentrated experiences considerable declines in the local housing market, declining economic conditions or a natural disaster, the Bank could experience an increase in the required allowance for loan losses on this portfolio.
The MPF Program is subject to risk that the borrower becomes delinquent or defaults on the Bank’s MPF loans. In addition, changes in real estate values could impact borrower repayment behavior. If delinquency and default rates on MPF loans increase, or there are additional declines in residential real estate values, the Bank will likely experience additional credit losses on its MPF loan portfolio. To mitigate some of this risk, the MPF Program has established a credit sharing structure with its members, referred to as MPF credit enhancements, which may reduce the impact of borrower defaults.
If FHLBank of Chicago changes or ceases to operate the MPF Program, this could have a negative impact on the Bank's mortgage purchase business, and, consequently, a related decrease in the Bank's financial condition and results of operations. Additionally, if FHLBank of Chicago or any of its third party vendors experiences operational difficulties, such difficulties could have a negative impact on the Bank's financial condition and results of operations.
For a description of the MPF Program, the obligations of the Bank with respect to loan losses and a PFI's obligation to provide credit enhancement, see the Mortgage Partnership Finance Program discussion in Item 1. Business, and Item 7. Management's Discussion and Analysis in this Form 10-K. See additional details regarding Supplemental Mortgage Insurance (SMI) exposure in the Credit and Counterparty Risk - Mortgage Loans, BOB Loans and Derivatives discussion in Risk Management in Item 7. Management's Discussion and Analysis in this Form 10-K.
MARKET/LIQUIDITY RISK
The Bank may be limited in its ability to access the capital markets, which could adversely affect the Bank's liquidity. In addition, if the Bank's ability to access the long-term debt markets would be limited, this may have a material adverse effect on its results of operations and financial condition, as well as its ability to fund operations, including advances.
The Bank's ability to operate its business, meet its obligations and generate net interest income depends primarily on the ability to issue large amounts of debt frequently, with a variety of maturities and call features and at attractive rates. The Bank actively manages its liquidity position to maintain stable, reliable, and cost-effective sources of funds, while taking into account market conditions, member credit demand for short-and long-term advances, investment opportunities and the maturity profile of the Bank's assets and liabilities. The Bank recognizes that managing liquidity is critical to achieving its statutory mission of providing low-cost funding to its members. In managing liquidity risk, the Bank is required to maintain a level of liquidity in accordance with policies established by management and the Board and Finance Agency guidance.
The ability to obtain funds through the sale of consolidated obligations depends in part on current conditions in the capital markets and the short-term capital markets in particular. Accordingly, the Bank may not be able to obtain funding on acceptable terms (interest rate risk), if at all (refunding risk). If the Bank cannot access funding when needed, its ability to support and continue its operations, including providing term funding to members, would be adversely affected, which would negatively affect its financial condition and results of operations. The Bank’s exposure to interest rate risk and refunding risk may be impacted by the asset/liability maturity profile of the Bank. See the Liquidity and Funding discussion in Risk Management in Item 7. Management’s Discussion and Analysis in this Form 10-K for additional information.
The U.S. Treasury has the authority to prescribe the form, denomination, maturity, interest rate and conditions of consolidated obligations issued by the FHLBanks. In addition, the Finance Agency could require the Bank to hold additional liquidity, which could adversely impact the type, amount and profitability of various advance products the Bank could make available to its members.
20
The Bank is jointly and severally liable for the consolidated obligations of other FHLBanks. Additionally, the Bank may receive from or provide financial assistance to the other FHLBanks. Changes in the Bank's, other FHLBanks' or other GSEs' credit ratings, as well as the rating of the U.S. Government, may adversely affect the Bank's ability to issue consolidated obligations and enter into derivative transactions on acceptable terms.
Each of the FHLBanks relies upon the issuance of consolidated obligations as a primary source of funds. Consolidated obligations are the joint and several obligations of all of the FHLBanks, backed only by the financial resources of the FHLBanks. Accordingly, the Bank is jointly and severally liable with the other FHLBanks for all consolidated obligations issued, regardless of whether the Bank receives all or any portion of the proceeds from any particular issuance of consolidated obligations. As of December 31, 2019, out of a total of $1,025.9 billion in par value of consolidated obligations outstanding, the Bank was the primary obligor on $89.9 billion, or approximately 8.8% of the total.
The Finance Agency at its discretion may also require any FHLBank to make principal or interest payments due on any consolidated obligation, whether or not the primary obligor FHLBank has defaulted on the payment of that obligation. For example, the Finance Agency could simply allocate the outstanding liability of an FHLBank among the other FHLBanks on a pro-rata or other basis. Accordingly, the Bank could incur significant liability beyond its primary obligation under consolidated obligations which could negatively affect the Bank's financial condition and results of operations.
FHLBank System consolidated obligation bonds have been assigned Aaa/stable outlook and AA+/stable outlook ratings by Moody's and S&P, respectively. Consolidated obligation discount notes have been assigned a P-1 and A-1+ rating by Moody's and S&P, respectively. In addition, all FHLBanks have been assigned a long-term rating of Aaa/stable outlook and AA+/stable outlook by Moody’s and S&P, respectively. All FHLBanks have been assigned a short-term rating of P-1 and A-1+ by Moody’s and S&P, respectively. These ratings reflect an opinion held by certain third parties that the FHLBanks have a strong capacity to meet their commitments to pay principal of and interest on consolidated obligations and that the consolidated obligations are judged to be of high quality with minimal credit risk. The ratings also reflect the FHLBanks' status as GSEs.
Additional ratings actions or negative guidance may adversely affect the Bank's cost of funds and ability to issue consolidated obligations and enter into derivative transactions on acceptable terms, which could negatively affect financial condition and results of operations. In some states, acceptance of the Bank's letters of credit as collateral for public funds deposits requires an AAA rating from at least one rating agency. If all of the NRSROs downgrade their ratings, the Bank's letters of credit business in those states may be affected and the amount of the Bank's letters of credit may be reduced, both of which could negatively affect financial condition and results of operations. The Bank's costs of doing business and ability to attract and retain members could also be adversely affected if the credit ratings assigned to the consolidated obligations were lowered from AA+.
The Bank may be unable to optimally manage its market risk due to unexpected sizable adverse market movements that threaten the Bank's interest rate risk/market risk profile faster than Bank strategies can offset. In addition, the Bank’s mortgage related portfolio introduces specific interest rate and prepayment risk, which may impact the value of and income associated with those investments. Not prudently managing this risk may adversely affect the Bank's results of operations.
The Bank is subject to various market risks, including interest rate risk and prepayment risk. The Bank realizes income primarily from the spread between interest earned on advances, MPF loans and investment securities and interest paid on debt and other liabilities, known as net interest income. The Bank's financial performance is affected by fiscal and monetary policies of the Federal government and its agencies and in particular by the policies of the Federal Reserve. The Federal Reserve's policies, which are difficult to predict, directly and indirectly influence the yield on the Bank's interest-earning assets and the cost of interest-bearing liabilities. Although the Bank uses various methods and procedures to monitor and manage exposures due to changes in interest rates, the Bank will experience instances when the timing of the re-pricing of interest-bearing liabilities does not coincide with the timing of re-pricing of interest-earning assets, or when the timing of the maturity or paydown of interest-bearing liabilities does not coincide with the timing of the maturity or paydown of the interest-earning assets. The Bank’s profitability and the market value of its equity are significantly affected by its ability to manage interest rate risk.
The Bank's ability to anticipate changes regarding the direction and speed of interest rate changes, or to hedge the related exposures, significantly affects the success of the asset and liability management activities and the level of net interest income. The Bank uses derivative instruments to reduce interest rate risk. The Bank has strategies which reduce the amount of one-sided fair value adjustments and the resulting impact to the Bank's income. However, market movements and volatility affecting the valuation of instruments in hedging relationships can also cause income volatility to the degree that the change in the value of the derivative does not perfectly offset the change in the value of the hedged item.. Should the use of derivatives be
21
limited, with that activity being replaced with a higher volume of long-term debt funding, the Bank may still experience income volatility driven by the market and interest rate sensitivities.
The Bank uses a number of measures and analyses to monitor and manage interest rate risk. Given the unpredictability of the financial markets, capturing all potential outcomes in these analyses is not practical. Key assumptions include, but are not limited to, advance volumes and pricing, market conditions for the Bank's consolidated obligations, interest rate spreads and prepayment speeds and cash flows on mortgage-related assets. These assumptions are inherently uncertain and, as a result, the measures cannot precisely predict the impact of higher or lower interest rates on net interest income or the market value of equity. Actual results will differ from simulated results due to the timing, magnitude, and frequency of interest rate changes and changes in market conditions and management strategies, among other factors.
With respect to the Bank’s MBS and MPF portfolios, increases in interest rates may slow prepayments and extend mortgage cash flows. If the debt funding the mortgage assets matures, it could be re-issued at a higher rate and decrease the Bank's net interest income. Decreases in interest rates may cause an increase in mortgage prepayments and may result in increased premium amortization expense and substandard performance in the Bank's mortgage portfolio as the Bank experiences a return of principal that it must re-invest in a lower rate environment, adversely affecting net interest income over time, if associated debt remains outstanding (i.e., debt overhang).
See additional discussion in Risk Management in Item 7. Management's Discussion and Analysis in this Form 10-K.
The Bank may fail to maintain a sufficient level of retained earnings, fail to meet its minimum regulatory capital requirements, or be otherwise designated by the Finance Agency as undercapitalized, which would impact the Bank's ability to conduct business “as usual,” result in prohibitions on dividends, excess capital stock repurchases and capital stock redemptions and potentially impact the value of Bank membership. This designation may also negatively impact the Bank's high credit rating provided by certain NRSROs and could hinder the achievement of the Bank's economic/community development mission.
The Bank may fail to have enough permanent capital, defined as the sum of capital stock and retained earnings, to meet its risk based capital (RBC) requirements. These requirements include components for credit risk, market risk and operational risk. Each of the Bank's investments carries a credit RBC requirement that is based on the rating of the investment. As a result, ratings downgrades or credit deterioration of individual investments would cause an increase in the total credit RBC requirement. The Bank is also required to maintain certain regulatory capital and leverage ratios, which it has done. Any violation of these requirements will result in prohibitions on stock redemptions and repurchases and dividend payments.
Under the Finance Agency's Prompt Corrective Action (PCA) Regulation, if the Bank becomes undercapitalized by failing to meet its regulatory capital requirements, by the Finance Agency exercising its discretion to categorize an FHLBank as undercapitalized or by the Bank failing to meet any additional Finance Agency-imposed minimum capital requirements, it will also be subject to asset growth limits. This is in addition to the capital stock redemption, excess capital stock repurchase and dividend prohibitions noted above. If the Bank becomes significantly undercapitalized, it could be subject to additional actions such as replacement of its Board and management, required capital stock purchase increases and required asset divestiture. The regulatory actions applicable to an FHLBank in a significantly undercapitalized status may also be imposed on an FHLBank by the Finance Agency at its discretion on an undercapitalized FHLBank. Violations could also result in changes in the Bank's member lending, investment or MPF Program purchase activities and changes in permissible business activities, as well as restrictions on dividend payments and capital stock redemptions and repurchases.
Declines in market conditions could also result in a violation of regulatory or statutory capital requirements and may impact the Bank's ability to redeem capital stock at par value. For example, this could occur if: (1) a member were to withdraw from membership (or seek to have its excess capital stock redeemed) at a time when the Bank is not in compliance with its minimum capital requirements or is deemed to be undercapitalized despite being in compliance with its minimum capital requirements; or (2) it is determined the Bank's capital stock is or is likely to be impaired as a result of losses in, or the depreciation of, assets which may not be recoverable in future periods. The Bank's primary business is making advances to its members, which in turn creates capital for the Bank. As members increase borrowings, the Bank's capital grows. As advance demand declines, so does the amount of capital required to support those balances. Ultimately, this capital would be returned to the member. Without new borrowing activity to offset the run-off of existing borrowings, capital levels could eventually decline. The Bank has the ability to increase the capital requirements on existing borrowings to boost capital levels; however, this may deter new borrowings and reduce the value of membership as the return on that investment may not be as profitable to the member as other investment opportunities.
22
Under Finance Agency regulation, the Bank may pay dividends on its capital stock only out of unrestricted retained earnings or current net income. The payment of dividends is subject to certain statutory and regulatory restrictions (including that the Bank shall be in compliance with all minimum capital requirements and shall not have been designated undercapitalized by the Finance Agency) and is highly dependent on the Bank's ability to continue to generate future net income and maintain adequate retained earnings and capital levels.
OPERATIONAL RISK
Failures of critical vendors and other third parties could disrupt the Bank’s ability to conduct business.
The Bank relies on third party vendors and service providers for many of its communications and information systems needs. Any failure or interruption of these systems, or any disruption of service, including as a result of a security breach, cyber attack, natural disaster, terrorist attack, widespread health emergency or pandemic, could result in failures or interruptions in the Bank's ability to conduct and manage its business effectively. While the Bank has implemented a Business Continuity Plan, there is no assurance that such failures or interruptions will not occur or, if they do occur, that they will be adequately addressed by the Bank or the third parties on which the Bank relies. Any failure or interruption could significantly harm the Bank's reputation, customer relations and business operations, which could negatively affect its financial condition, profitability and cash flows. Additionally, any breach of sensitive Bank data stored at a third party could result in financial loss, damage to the Bank’s reputation, litigation, potential legal or regulatory actions and penalties, increased regulatory scrutiny and increased expense in terms of incident response costs and damages. While the Bank regularly assesses the adequacy of security controls for its significant third parties, there is no assurance that a breach will not occur. Additionally, the use of vendors, including cloud service providers and other third parties, could expose the Bank to the risk of a financial loss, loss of intellectual property or confidential information or other harm. Even though the Bank has enhanced its third party vendor management process, including an on-going vendor cyber-security review and cyber monitoring, the Bank could be adversely affected if the Bank’s vendors (including, but not limited to, software as a service (SaaS) vendors) are impacted by security breaches or cyber attacks.
The Bank relies on both internally and externally developed models and end user computing tools to manage market and other risks, to make business decisions and for financial accounting and reporting purposes. The Bank's business could be adversely affected if these models fail to produce reliable results or if the results are not used appropriately.
The Bank makes significant use of business and financial models and end user computing tools for making business decisions, managing risk and financial reporting. For example, the Bank uses models to measure and monitor exposures to market risks and credit and collateral risks. A credit scoring model is used in part as a basis for credit decisions. The Bank also uses models in determining the fair value of certain financial instruments and estimating credit losses.
Models are inherently imperfect predictors of actual results because they are based on assumptions about future performance. Estimations produced by the Bank's models may be different from actual results, which could adversely affect the Bank's business results. If the models or end user computing tools are not reliable or the Bank does not use them appropriately, the Bank could make poor business decisions, including risk management decisions, or other decisions, which could result in an adverse financial impact. Further, any controls, such as a model risk management function, that the Bank employs to attempt to manage the risks associated with the use of models may not be effective.
Changes in any models or in any of the inputs, assumptions, judgments or estimates used in the models may cause the results generated by the model to be materially different. Changes to the Bank’s models could occur due to changes in market participants’ practices, including the use of alternative rates.
The loss of key employees or lack of a diverse and inclusive workforce and Bank activities may have an adverse effect on the Bank's business and operations.
A skilled, diverse and inclusive workforce is important to the continued successful operation of the Bank. Failure to attract or retain this type of workforce may adversely affect the Bank's business operations. It may result in increased operating expenses (i.e., consultant expense to address new hire) and operational risks as responsibilities are transitioned between employees. The loss of a key employee or not having a diverse and inclusive workforce may also result in incremental regulatory scrutiny of the quality of the Bank's overall corporate governance.
Item 1B: Unresolved Staff Comments
None
23
Item 2: Properties
The Bank leases 96,240 square feet of office space at 601 Grant Street, Pittsburgh, Pennsylvania, 15219 and additional office space at the following locations: (1) 1325 G Street, Washington, D.C. 20005; (2) 2300 Computer Avenue, Willow Grove, Pennsylvania, 19090; (3) 435 N. DuPont Highway, Dover, Delaware 19904; (4) 1137 Branchton Road, Boyers, Pennsylvania 16020, (5) 609 Hamilton Street, Allentown, Pennsylvania 18101 and (6) 580 Vista Park Drive, Pittsburgh, Pennsylvania 15205. The Washington, D.C. office space is shared with the FHLBanks of Atlanta and Des Moines. Essentially all of the Bank’s operations are housed at the Bank’s headquarters at the Grant Street location.
Item 3: Legal Proceedings
The Bank may be subject to various legal proceedings arising in the normal course of business. After consultation with legal counsel, management is not aware of any such proceedings that might result in the Bank’s ultimate liability in an amount that will have a material effect on the Bank’s financial condition or results of operations.
Item 4: Mine Safety Disclosures
Not applicable.
PART II
Item 5: Market for Registrant’s Common Equity, Related Stockholder Matters and Issuer Purchases of Equity Securities
The capital stock of the Bank can be purchased only by members and may be held by nonmembers due to out of district mergers. There is no established marketplace for the Bank’s stock; the Bank’s stock is not publicly traded and may be repurchased or redeemed by the Bank at par value. The Bank has two subclasses of capital stock: B1 membership and B2 activity.
The members may request that the Bank redeem all or part of the common stock they hold in the Bank five years after the Bank receives a written request by a member. This is referred to as mandatorily redeemable capital stock. The Bank reclassifies stock subject to redemption from capital stock to a liability after a member provides written notice of redemption, gives notice of intention to withdraw from membership, or attains nonmember status by merger or acquisition, charter termination or other involuntary termination from membership. In addition, the Bank, at its discretion, may repurchase shares held by members in excess of their required stock holdings upon one business day’s notice. Excess stock is Bank capital stock not required to be held by the member to meet its minimum stock purchase requirement under the Bank’s Capital Plan. The Bank's current practice is to repurchase all excess capital stock, including excess capital stock that is classified as mandatorily redeemable, on a weekly basis.
The members’ minimum stock purchase requirement is subject to change from time to time at the discretion of the Board of Directors of the Bank in accordance with the Capital Plan. Par value of each share of capital stock is $100. As of December 31, 2019, the total mandatorily redeemable capital stock reflected the balance for five institutions, four of which were merged out of district and considered to be nonmembers. One institution relocated and became a member of another FHLBank at which time the membership with the Bank terminated.
In February 2020, the Bank paid quarterly dividends of 7.75% annualized on activity stock and 4.5% annualized on membership stock. The dividends were based on average member capital stock held for the fourth quarter of 2019. The amount of any future dividends will depend on economic and market conditions and the Bank’s financial condition and operating results.
The total number of shares of capital stock outstanding as of December 31, 2019 was 33,985,713 of which members held 30,549,963 shares and nonmembers held 3,435,750 shares. As of February 28, 2020, a total of 290 members and nonmembers held shares of the Bank’s stock.
24
See Note 15 - Capital to the audited financial statements in Item 8. Financial Statements and Supplementary Financial Data in this Form 10-K for further information regarding statutory and regulatory restrictions on capital stock redemption.
Item 6: Selected Financial Data
The following should be read in conjunction with the financial statements and Item 7. Management’s Discussion and Analysis, each included in this Form 10-K. The Condensed Statements of Income data for 2019, 2018 and 2017, and the Condensed Statements of Condition data as of December 31, 2019 and 2018 are derived from the financial statements included in Item 8. Financial Statements and Supplementary Financial Data in this Form 10-K. The Condensed Statements of Income data for 2016 and 2015 and the Condensed Statements of Condition data as of December 31, 2017 and 2016 are derived from the financial statements in Item 8. Financial Statements and Supplementary Financial Data included in the Bank’s 2017 Form 10-K. The Condensed Statements of Condition data as of December 31, 2015 is derived from the financial statements in Item 8. Financial Statements and Supplementary Financial Data included in the Bank’s 2016 Form 10-K.
Condensed Statements of Income
Year Ended December 31, | |||||||||||||||
(in millions) | 2019 | 2018 | 2017 | 2016 | 2015 | ||||||||||
Net interest income | $ | 453.8 | $ | 470.1 | $ | 435.5 | $ | 348.9 | $ | 317.8 | |||||
Provision (benefit) for credit losses | 1.3 | 3.1 | 0.2 | 1.2 | (0.2 | ) | |||||||||
Other noninterest income | 3.0 | 11.0 | 32.2 | 25.0 | 44.5 | ||||||||||
Other expense | 101.5 | 92.1 | 90.1 | 83.8 | 77.5 | ||||||||||
Income before assessments | 354.0 | 385.9 | 377.4 | 288.9 | 285.0 | ||||||||||
AHP assessment (1) | 37.1 | 38.7 | 37.8 | 28.9 | 28.5 | ||||||||||
Net income | $ | 316.9 | $ | 347.2 | $ | 339.6 | $ | 260.0 | $ | 256.5 | |||||
Dividends (in millions) | $ | 266.8 | $ | 229.1 | $ | 168.0 | $ | 155.0 | $ | 212.8 | |||||
Dividends per share | 7.82 | 6.33 | 4.71 | 4.65 | 6.67 | ||||||||||
Weighted average dividend rate | 7.45 | % | 6.42 | % | 4.70 | % | 4.71 | % | 5.22 | % | |||||
Dividend payout ratio(2) | 84.19 | % | 66.00 | % | 49.46 | % | 59.64 | % | 82.96 | % | |||||
Return on average equity | 6.58 | % | 7.03 | % | 7.17 | % | 5.96 | % | 6.16 | % | |||||
Return on average assets | 0.31 | % | 0.36 | % | 0.35 | % | 0.28 | % | 0.29 | % | |||||
Net interest margin (3) | 0.45 | % | 0.49 | % | 0.46 | % | 0.38 | % | 0.36 | % | |||||
Regulatory capital ratio (4) | 4.94 | % | 4.95 | % | 4.84 | % | 4.69 | % | 4.60 | % | |||||
GAAP capital ratio(5) | 4.67 | % | 5.00 | % | 4.94 | % | 4.73 | % | 4.67 | % | |||||
Total average equity to average assets | 4.70 | % | 5.11 | % | 4.90 | % | 4.72 | % | 4.66 | % | |||||
Notes:
(1) Although the Bank is not subject to federal or state income taxes, by regulation, the Bank is required to allocate 10% of its income before assessments to fund the AHP.
(2) Represents dividends paid as a percentage of net income for the respective periods presented.
(3) Net interest margin is net interest income before provision for credit losses as a percentage of average interest-earning assets.
(4) Regulatory capital ratio is the sum of capital stock, mandatorily redeemable capital stock, and retained earnings as a percentage of total assets at period-end.
(5) GAAP capital ratio is sum of capital stock, retained earnings and accumulated other comprehensive income (AOCI) as a percentage of total assets at period-end.
25
Condensed Statements of Condition
December 31, | |||||||||||||||
(in millions) | 2019 | 2018 | 2017 | 2016 | 2015 | ||||||||||
Cash and due from banks | $ | 21.5 | $ | 71.3 | $ | 3,415.0 | $ | 3,587.6 | $ | 2,377.0 | |||||
Investments(1) | 24,572.0 | 20,076.6 | 17,757.1 | 17,227.3 | 16,144.0 | ||||||||||
Advances | 65,610.1 | 82,475.5 | 74,279.8 | 76,808.7 | 74,504.8 | ||||||||||
Mortgage loans held for portfolio, net | 5,114.6 | 4,461.6 | 3,923.1 | 3,390.7 | 3,086.9 | ||||||||||
Total assets | 95,724.1 | 107,486.5 | 99,663.0 | 101,260.0 | 96,329.8 | ||||||||||
Consolidated obligations: | |||||||||||||||
Discount notes | 23,141.4 | 36,896.6 | 36,193.3 | 28,500.3 | 42,275.5 | ||||||||||
Bonds | 66,807.8 | 64,298.6 | 57,533.7 | 67,156.0 | 48,600.8 | ||||||||||
Total consolidated obligations | 89,949.2 | 101,195.2 | 93,727.0 | 95,656.3 | 90,876.3 | ||||||||||
Deposits | 573.4 | 387.0 | 538.1 | 558.9 | 686.0 | ||||||||||
Total liabilities | 91,251.3 | 102,110.2 | 94,735.5 | 96,466.1 | 91,828.2 | ||||||||||
Capital stock - putable | 3,055.0 | 4,027.3 | 3,658.7 | 3,755.4 | 3,539.7 | ||||||||||
Retained earnings | 1,326.0 | 1,275.9 | 1,157.9 | 986.2 | 881.2 | ||||||||||
Total capital | 4,472.8 | 5,376.3 | 4,927.5 | 4,793.9 | 4,501.6 | ||||||||||
Notes:
(1) Includes interest-bearing deposits, Federal funds sold, securities purchased under agreements to resell and trading, AFS and HTM investment securities.
Item 7: Management’s Discussion and Analysis of Financial Condition and Results of Operations
Forward-Looking Information
Statements contained in this Form 10-K, including statements describing the objectives, projections, estimates, or predictions of the future of the Bank, may be “forward-looking statements.” These statements may use forward-looking terms, such as “anticipates,” “believes,” “could,” “estimates,” “may,” “should,” “will,” or their negatives or other variations on these terms. The Bank cautions that, by their nature, forward-looking statements involve risk or uncertainty and that actual results could differ materially from those expressed or implied in these forward-looking statements or could affect the extent to which a particular objective, projection, estimate, or prediction is realized. These forward-looking statements involve risks and uncertainties including, but not limited to, the following: economic and market conditions, including, but not limited to real estate, credit and mortgage markets; volatility of market prices, rates, and indices related to financial instruments; including but not limited to, the possible discontinuance of LIBOR and the related effect on the Bank's LIBOR-based financial products, investments and contracts; the occurrence of man-made or natural disasters, global pandemics, conflicts or terrorist attacks or other geopolitical events; political, legislative, regulatory, litigation, or judicial events or actions; risks related to MBS; changes in the assumptions used to estimate credit losses; changes in the Bank’s capital structure; changes in the Bank’s capital requirements; changes in expectations regarding the Bank’s payment of dividends; membership changes; changes in the demand by Bank members for Bank advances; an increase in advance prepayments; competitive forces, including the availability of other sources of funding for Bank members; changes in investor demand for consolidated obligations and/or the terms of interest rate exchange agreements and similar agreements; changes in the FHLBank System’s debt rating or the Bank’s rating; the ability of the Bank to introduce new products and services to meet market demand and to manage successfully the risks associated with new products and services; the ability of each of the other FHLBanks to repay the principal and interest on consolidated obligations for which it is the primary obligor and with respect to which the Bank has joint and several liability; applicable Bank policy requirements for retained earnings and the ratio of the market value of equity to par value of capital stock; the Bank’s ability to maintain adequate capital levels (including meeting applicable regulatory capital requirements); business and capital plan adjustments and amendments; technology and cyber-security risks; and timing and volume of market activity.
This Management’s Discussion and Analysis (MD&A) should be read in conjunction with the Bank’s audited financial statements in Item 8. Financial Statements and Supplementary Data and all risks and uncertainties addressed throughout this report, as well as those discussed under Item 1A. Risk Factors included herein.
26
Executive Summary
Overview. The Bank's financial condition and results of operations are influenced by global and national economies, local economies within its three-state district, and the conditions in the financial, housing and credit markets, all of which impact the interest rate environment.
The interest rate environment significantly impacts the Bank's profitability. Net interest income is affected by several external factors, including market interest rate levels and volatility, credit spreads and the general state of the economy. To manage interest rate risk in connection with advances and debt, the Bank executes interest-rate exchange agreements. Short-term interest rates also directly affect the Bank's earnings on invested capital. Finally, the Bank's mortgage-related assets make it sensitive to changes in mortgage rates. The Bank earns relatively narrow spreads between yields on assets (particularly advances, its largest asset) and the rates paid on corresponding liabilities.
The Bank's earnings are affected not only by rising or falling interest rates but also by the particular path and volatility of changes in market interest rates and the prevailing shape of the yield curve. The flattening of the yield curve tends to compress the Bank's net interest margin, while steepening of the curve offers better opportunities to purchase assets with wider net interest spreads. The performance of the Bank's mortgage asset portfolios is particularly affected by shifts in the 10-year maturity range of the yield curve, which is the point that heavily influences mortgage rates and potential refinancings. Yield curve shape can also influence the pace at which borrowers refinance or prepay their existing loans, as borrowers may select shorter-duration mortgage products.
Results of Operations. The Bank’s net income for 2019 totaled $316.9 million, compared to $347.2 million for 2018. This $30.3 million decrease was primarily driven by lower net interest income, higher other expenses, and lower other noninterest income. Net interest income was $453.8 million for 2019, a decrease of $16.3 million compared to $470.1 million in 2018. Lower net interest income was primarily due to increased interest expense on mandatorily redeemable capital stock. Total other expenses in 2019 totaled $101.5 million versus $92.1 million in 2018, reflecting increases in compensation and benefits and technology-related costs. Noninterest income in 2019 was $3.0 million, an $8.0 million decrease compared to $11.0 million in 2018. Lower noninterest income was primarily due to net losses on derivatives and hedging activities, which were partially offset by net gains on investment securities. The net interest margin was 45 basis points and 49 basis points for 2019 and 2018, respectively.
For the fourth quarter of 2019, net income was $80.9 million, an increase of $2.7 million compared to $78.2 million in the fourth quarter of 2018. Higher net income was primarily due to net gains on derivatives and hedging activities, which was partially offset by net losses on investment activities and lower net interest income in the fourth quarter of 2019.
Financial Condition. Advances. Advances totaled $65.6 billion at December 31, 2019, a decrease of $16.9 billion compared to $82.5 billion at December 31, 2018. It is not uncommon for the Bank to experience variances in the overall advance portfolio driven primarily by changes in member needs. While the advance portfolio decreased compared to December 31, 2018, the term of advances also decreased. At December 31, 2019, approximately 37% of the par value of advances in the portfolio had a remaining maturity of more than one year, compared to 54% at December 31, 2018.
The ability to grow and/or maintain the advance portfolio is affected by, among other things, the following: (1) the liquidity demands of the Bank’s borrowers; (2) the composition of the Bank's membership; (3) members’ regulatory requirements; (4) current and future credit market conditions; (5) housing market trends; (6) the shape of the yield curve and (7) advance pricing.
Liquidity. The Bank maintains liquidity to meet member borrowing needs and regulatory standards. Liquidity is comprised of cash, interest-bearing deposits, Federal funds sold, securities purchased under agreements to resell, and U.S. Treasury obligations classified as trading or AFS. At December 31, 2019, the Bank held $10.9 billion of liquid assets compared to $9.2 billion at December 31, 2018. The $1.7 billion increase was primarily due to changes in the liquidity regulations issued by the Finance Agency in 2019, which lead to the increased investment in U.S. Treasury obligations.
Investments. To enhance earnings, the Bank also maintains investments classified as AFS and HTM as well as certain trading securities. The Bank held $13.7 billion in its investment portfolio at December 31, 2019, compared with $10.9 billion at December 31, 2018, an increase of $2.8 billion. The increase reflects the addition of GSE MBS to the AFS portfolio in response to widening mortgage spreads.
27
Consolidated Obligations. The Bank's consolidated obligations totaled $89.9 billion at December 31, 2019, a decrease of $11.3 billion from December 31, 2018. At December 31, 2019, bonds represented 74% of the Bank's consolidated obligations, compared with 64% at December 31, 2018. Discount notes represented 26% of the Bank's consolidated obligations at December 31, 2019 compared with 36% at year-end 2018. The overall decrease in consolidated obligations is largely consistent with the change in total assets.
Capital Position and Regulatory Requirements. Total capital at December 31, 2019 was $4.5 billion, compared to $5.4 billion at December 31, 2018. Total retained earnings at December 31, 2019 were $1.3 billion, up $50.1 million from year-end 2018, reflecting the Bank's net income for 2019 which was largely offset by dividends paid. AOCI was $91.8 million at December 31, 2019, an increase of $18.7 million from December 31, 2018. This increase was primarily due to changes in the fair values of securities within the AFS portfolio.
In February, April, July and October 2019, the Bank paid quarterly dividends of 7.75% annualized on activity stock and 4.5% annualized on membership stock. These dividends were based on stockholders' average balances for the fourth quarter of 2018 (February dividend), the first quarter of 2019 (April dividend), the second quarter of 2019 (July dividend) and the third quarter of 2019 (October dividend).
In February 2020, the Bank paid quarterly dividends of 7.75% annualized on activity stock and 4.5% annualized on membership stock. The dividends were based on average member capital stock held for the fourth quarter of 2019. The amount of any future dividends will depend on economic and market conditions and the Bank’s financial condition and operating results.
The Bank met all of its capital requirements as of December 31, 2019, and in the Finance Agency’s most recent determination, as of September 30, 2019, the Bank was deemed "adequately capitalized."
28
2020 Outlook
The Bank expects that members will continue to utilize advances to meet liquidity needs during 2020. The Bank, however, anticipates that advances will decline in 2020, including $5.0 billion of advances to JP Morgan Chase Bank, N.A. that have a contractual maturity during 2020. JP Morgan Chase Bank, N.A. is one of the Bank’s top five borrowers as of December 31, 2019 and became a non-member when its charter was merged with an entity outside of the Bank’s district. The borrowing activities of a few larger members have been the predominant driver of change in the Bank’s advance balances, and it is expected that some short-term advances will be not be renewed at maturity.
Also, the Bank expects lower interest income due to the low level of interest rates and the Federal Reserve’s actions to provide additional liquidity to stimulate economic growth. Even with the anticipated decline in advances, the Bank expects strong but lower financial performance. As the Bank is a cooperative, it is designed to meet the liquidity and other needs of its members, whether those needs increase or decrease.
Access to debt markets has been reliable. Going forward, as the Bank prepares for the cessation of LIBOR and transition to an alternative rate, the Bank expects more of its adjustable-rate funding to be indexed to SOFR. The SOFR market has developed rapidly, and the trend is expected to accelerate as the Bank positions its consolidated obligations to meet bond investor appetite for an alternative to LIBOR indexed debt.
Recent market volatility, interest rate adjustments and any widespread health emergencies or pandemics, including the recent outbreak of coronavirus, could negatively impact financial markets and the demand for liquidity. Additionally, future opportunities and challenges may arise with potential changes in the Bank's operating landscape including various legislative actions and changes in the Bank’s regulatory compliance requirements. However, the Bank has been, and will continue to be, mission driven. Advances are central to the Bank’s mission and, along with other key activities, are crucial to the Bank continuing to meet the needs of its membership and communities.
Earnings Performance
The following should be read in conjunction with the Bank's audited financial statements included in Item 8. Financial Statements and Supplementary Financial Data in this Form 10-K.
Summary of Financial Results
Net Income and Return on Average Equity. The Bank’s net income for 2019 totaled $316.9 million, compared to $347.2 million for 2018. This $30.3 million decrease was primarily driven by lower net interest income, higher other expenses and lower other noninterest income. Net interest income was $453.8 million for 2019, a decrease of $16.3 million compared to $470.1 million in 2018. Lower net interest income was primarily due to increased interest expense on mandatorily redeemable capital stock. Total other expenses in 2019 totaled $101.5 million versus $92.1 million in 2018, reflecting increases in compensation and benefits and technology-related costs. Noninterest income in 2019 was $3.0 million, an $8.0 million decrease compared to $11.0 million in 2018. Lower noninterest income was primarily due to net losses on derivatives and hedging activities, which were partially offset by net gains on investment securities. The Bank’s return on average equity for 2019 was 6.58% compared to 7.03% for 2018.
2018 vs 2017. For discussion of this year-to-year comparison, refer to the Summary of Financial Results disclosure included in Item 7: Management’s Discussion and Analysis of Financial Condition and Results of Operations in the Bank’s 2018 Form 10-K.
29
Net Interest Income
The following table summarizes the yields and rates paid on interest-earning assets and interest-bearing liabilities, respectively, the average balance for each of the primary balance sheet classifications and the net interest margin for 2019 and 2018. For discussion related to 2018 compared to 2017, refer to the Net Interest Income disclosure included in Item 7: Management’s Discussion and Analysis of Financial Condition and Results of Operations in the Bank’s 2018 Form 10-K.
Average Balances and Interest Yields/Rates Paid
2019 | 2018 | |||||||||||||
(dollars in millions) | Average Balance | Interest Income/ Expense (1) | Avg. Yield/ Rate (%) | Average Balance | Interest Income/ Expense | Avg. Yield/ Rate (%) | ||||||||
Assets: | ||||||||||||||
Federal funds sold and securities purchased under agreements to resell(2) | $ | 8,498.4 | $ | 185.9 | 2.19 | $ | 6,985.1 | $ | 128.1 | 1.83 | ||||
Interest-bearing deposits(3) | 1,708.3 | 38.6 | 2.26 | 869.2 | 16.7 | 1.93 | ||||||||
Investment securities(4) | 14,338.9 | 421.2 | 2.94 | 11,378.7 | 317.1 | 2.79 | ||||||||
Advances(5) | 72,172.7 | 1,871.2 | 2.59 | 72,373.5 | 1,648.5 | 2.28 | ||||||||
Mortgage loans held for portfolio(6) | 4,716.2 | 170.1 | 3.61 | 4,193.0 | 151.0 | 3.60 | ||||||||
Total interest-earning assets | 101,434.5 | 2,687.0 | 2.65 | 95,799.5 | 2,261.4 | 2.36 | ||||||||
Other assets(7) | 1,030.5 | 818.1 | ||||||||||||
Total assets | $ | 102,465.0 | $ | 96,617.6 | ||||||||||
Liabilities and capital: | ||||||||||||||
Deposits (3) | $ | 578.6 | $ | 11.3 | 1.95 | $ | 477.3 | $ | 7.9 | 1.65 | ||||
Consolidated obligation discount notes | 26,717.4 | 601.2 | 2.25 | 26,463.9 | 494.2 | 1.87 | ||||||||
Consolidated obligation bonds(8) | 69,155.0 | 1,603.4 | 2.32 | 64,032.7 | 1,288.2 | 2.01 | ||||||||
Other borrowings | 224.3 | 17.3 | 7.74 | 14.5 | 1.0 | 6.91 | ||||||||
Total interest-bearing liabilities | 96,675.3 | 2,233.2 | 2.31 | 90,988.4 | 1,791.3 | 1.97 | ||||||||
Other liabilities | 973.6 | 693.4 | ||||||||||||
Total capital | 4,816.1 | 4,935.8 | ||||||||||||
Total liabilities and capital | $ | 102,465.0 | $ | 96,617.6 | ||||||||||
Net interest spread | 0.34 | 0.39 | ||||||||||||
Impact of noninterest-bearing funds | 0.11 | 0.10 | ||||||||||||
Net interest income/net interest margin | $ | 453.8 | 0.45 | $ | 470.1 | 0.49 | ||||||||
Average interest-bearing assets to interest-bearing liabilities | 104.9 | % | 105.3 | % | ||||||||||
Notes:
(1) On January 1, 2019, the Bank adopted ASU 2017-12. Changes in fair value of derivative instruments and the related hedged item for designated fair value hedges are now included in net interest income for reporting purposes. Prior to adoption, these amounts were reported in other noninterest income.
(2) The average balance of Federal funds sold and securities purchased under agreements to resell and the related interest income and average yield calculations may include loans to other FHLBanks.
(3) Average balances of deposits (assets and liabilities) include cash collateral received from/paid to counterparties which is reflected in the Statements of Condition as derivative assets/liabilities.
(4) Investment securities include trading, AFS and HTM securities. The average balances of AFS and HTM are reflected at amortized cost.
(5) Average balances reflect noninterest-earning hedge accounting adjustments of $93.6 million and $(249.7) million in 2019 and 2018, respectively.
(6) Nonaccrual mortgage loans are included in average balances in determining the average rate.
(7) The allowance for credit losses and the noncredit portion of other-than-temporary-impairment (OTTI) losses on investment securities is reflected in other assets for this presentation.
(8) Average balances reflect noninterest-bearing hedge accounting adjustments of $(14.1) million and $(212.7) million in 2019 and 2018, respectively.
Net interest income decreased $16.3 million in 2019 compared to 2018 due to an increase in interest expense, partially offset by an increase in interest income. The rate paid on interest-bearing liabilities increased 34 basis points due to higher funding costs on consolidated obligations bonds and discount notes. In addition, interest expense was higher due to increased
30
interest expense on mandatorily redeemable capital stock. Interest-earning assets increased 6% primarily due to higher amount of investments and increased purchases in the Bank’s liquidity portfolio. The rate earned on interest-earning assets increased 29 basis points primarily due to a higher yield on advances. Interest income increased across all categories. The increase was driven by an increase in yield on advances and both higher volume and an increase in yield in all other categories. The impact of noninterest-bearing funds increased one basis point due to higher interest rates.
Rate/Volume Analysis. Changes in both volume and interest rates influence changes in net interest income and net interest margin. The following table summarizes changes in interest income and interest expense between 2019 and 2018.
Increase (Decrease) in Interest Income/Expense Due to Changes in Rate/Volume | |||||||||
2019 Compared to 2018 | |||||||||
(in millions) | Volume | Rate | Total | ||||||
Federal funds sold | $ | 30.6 | $ | 27.2 | $ | 57.8 | |||
Interest-bearing deposits | 18.5 | 3.4 | 21.9 | ||||||
Investment securities | 86.2 | 17.9 | 104.1 | ||||||
Advances | (4.6 | ) | 227.3 | 222.7 | |||||
Mortgage loans held for portfolio | 18.9 | 0.2 | 19.1 | ||||||
Total interest-earning assets | $ | 149.6 | $ | 276.0 | $ | 425.6 | |||
Interest-bearing deposits | $ | 1.8 | $ | 1.6 | $ | 3.4 | |||
Consolidated obligation discount notes | 4.8 | 102.2 | 107.0 | ||||||
Consolidated obligation bonds | 108.5 | 206.7 | 315.2 | ||||||
Other borrowings | 16.2 | 0.1 | 16.3 | ||||||
Total interest-bearing liabilities | $ | 131.3 | $ | 310.6 | $ | 441.9 | |||
Total increase in net interest income | $ | 18.3 | $ | (34.6 | ) | $ | (16.3 | ) | |
Interest income and interest expense increased in 2019 compared to 2018. Higher rates drove the increases in both interest income and interest expense augmented by higher volumes. The rate increase was primarily due to an increase in market interest rates as the Federal funds target rate increased in 2018 and the first half of 2019, before falling again in the second half of 2019.
Interest expense on the average consolidated obligations portfolio increased in 2019 compared to 2018. Rates paid on both discount notes and bonds rose due to the rise in market interest rates. Average discount note and bond balances both increased year-over-year. A portion of the bond portfolio is currently swapped to a variable rate; therefore, as the variable rate (decreases) increases, interest expense on swapped bonds, including the impact of swaps, (decreases) increases. See details regarding the impact of swaps on the rates paid in the “Interest Income Derivatives Effects” discussion below.
The following table presents the average par balances of the Bank's advance portfolio for 2019 and 2018 . These balances do not reflect any hedge accounting adjustments.
(in millions) | ||||||
Product | 2019 | 2018 | ||||
RepoPlus /Mid-Term Repo | $ | 20,581.7 | $ | 22,112.1 | ||
Core (Term) | 51,477.9 | 50,486.0 | ||||
Convertible Select | 20.0 | 25.3 | ||||
Total par value | $ | 72,079.6 | $ | 72,623.4 | ||
Derivative Effects on Interest Income. On January 1, 2019, the Bank adopted ASU 2017-12. Changes in fair value of derivative instruments and the related hedged item for designated fair value hedges are now included in net interest income for reporting purposes. Prior to adoption, these amounts were reported in other noninterest income. See Note 2 - Changes in Accounting Principle and Recently Issued Accounting Standards and Interpretations and Note 11 - Derivatives and Hedging Activities in this Form 10-K for additional information.
31
The following tables quantify the effects of the Bank’s derivative activities on interest income and interest expense for 2019 and 2018. Derivative and hedging activities are discussed below.
2019 (dollars in millions) | Average Balance | Interest Inc./ Exp. with Derivatives | Avg. Yield/ Rate (%) | Interest Inc./ Exp. without Derivatives | Avg. Yield/ Rate (%) | Impact of Derivatives | Incr./ (Decr.) (%) | |||||||||
Assets: | ||||||||||||||||
Advances | $ | 72,172.7 | $ | 1,871.2 | 2.59 | $ | 1,826.4 | 2.53 | $ | 44.8 | 0.06 | |||||
Mortgage loans held for portfolio | 4,716.2 | 170.1 | 3.61 | 173.3 | 3.68 | (3.2 | ) | (0.07 | ) | |||||||
All other interest-earning assets | 24,545.6 | 645.7 | 2.63 | 648.0 | 2.64 | (2.3 | ) | (0.01 | ) | |||||||
Total interest-earning assets | $ | 101,434.5 | $ | 2,687.0 | 2.65 | $ | 2,647.7 | 2.61 | $ | 39.3 | 0.04 | |||||
Liabilities: | ||||||||||||||||
Consolidated obligation bonds | $ | 69,155.0 | $ | 1,603.4 | 2.32 | $ | 1,541.3 | 2.23 | $ | 62.1 | 0.09 | |||||
All other interest-bearing liabilities | 27,520.3 | 629.8 | 2.29 | 629.8 | 2.29 | — | — | |||||||||
Total interest-bearing liabilities | $ | 96,675.3 | $ | 2,233.2 | 2.31 | $ | 2,171.1 | 2.25 | $ | 62.1 | 0.06 | |||||
Net interest income/net interest spread | $ | 453.8 | 0.34 | $ | 476.6 | 0.36 | $ | (22.8 | ) | (0.02 | ) | |||||
2018 (dollars in millions) | Average Balance | Interest Inc./ Exp. with Derivatives | Avg. Yield/ Rate (%) | Interest Inc./ Exp. without Derivatives | Avg. Yield/ Rate (%) | Impact of Derivatives | Incr./ (Decr.) (%) | |||||||||
Assets: | ||||||||||||||||
Advances | $ | 72,373.5 | $ | 1,648.5 | 2.28 | $ | 1,610.2 | 2.22 | $ | 38.3 | 0.06 | |||||
Mortgage loans held for portfolio | 4,193.0 | 151.0 | 3.60 | 154.0 | 3.67 | (3.0 | ) | (0.07 | ) | |||||||
All other interest-earning assets | 19,233.0 | 461.9 | 2.40 | 465.8 | 2.42 | (3.9 | ) | (0.02 | ) | |||||||
Total interest-earning assets | $ | 95,799.5 | $ | 2,261.4 | 2.36 | $ | 2,230.0 | 2.33 | $ | 31.4 | 0.03 | |||||
Liabilities: | ||||||||||||||||
Consolidated obligation bonds | $ | 64,032.7 | $ | 1,288.2 | 2.01 | $ | 1,205.8 | 1.88 | $ | 82.4 | 0.13 | |||||
All other interest-bearing liabilities | 26,955.7 | 503.1 | 1.87 | 503.1 | 1.87 | — | — | |||||||||
Total interest-bearing liabilities | $ | 90,988.4 | $ | 1,791.3 | 1.97 | $ | 1,708.9 | 1.88 | $ | 82.4 | 0.09 | |||||
Net interest income/net interest spread | $ | 470.1 | 0.39 | $ | 521.1 | 0.45 | $ | (51.0 | ) | (0.06 | ) | |||||
The use of derivatives negatively impacted both net interest income and net interest spread in 2019 and 2018. The variances in the advances and consolidated obligation derivative impacts from period to period are driven by the change in the average variable rate, the timing of interest rate resets and the average hedged portfolio balances outstanding during any given period.
The Bank uses derivatives to hedge the fair market value changes attributable to the change in the benchmark interest rates. The Bank generally uses interest rate swaps to hedge a portion of advances and consolidated obligations which convert the interest rates on those instruments from a fixed rate to a variable rate. The purpose of this strategy is to protect the interest rate spread. Using derivatives to convert interest rates from fixed to variable can increase or decrease net interest income.
32
The Bank uses many different funding and hedging strategies. These strategies involve closely match-funding bullet advances with bullet debt. This is designed in part to avoid the use of derivatives where prudent and reduce the Bank's reliance on short-term funding.
Provision for Credit Losses. The provision for credit losses on mortgage loans held for portfolio and Banking on Business (BOB) loans for 2019 was $1.3 million compared to $3.1 million in 2018. The decrease was primarily attributable to a non-recurring adjustment to the MPF Plus product which was made in the first quarter of 2018.
Other Noninterest Income
(in millions) | 2019 | 2018 | ||||
Net OTTI losses | $ | (0.6 | ) | $ | (1.0 | ) |
Net gains (losses) on trading securities | 18.7 | (9.7 | ) | |||
Net gains (losses) on derivatives and hedging activities | (39.8 | ) | (4.5 | ) | ||
Standby letters of credit fees | 21.8 | 23.6 | ||||
Other, net | 2.9 | 2.6 | ||||
Total other noninterest income | $ | 3.0 | $ | 11.0 | ||
The Bank's lower total other noninterest income for 2019 compared to 2018 was due primarily to higher net losses on derivatives and hedging activities, partially offset by the positive variance in net gains (losses) on trading securities. The activity related to derivatives and hedging activities is discussed in more detail below. The net gains on trading securities reflects the impact of fair market value changes on Agency and U.S. Treasury investments held in the Bank’s trading portfolio.
2018 vs 2017. For discussion of this year-to-year comparison, refer to the Other Noninterest Income disclosure included in Item 7: Management’s Discussion and Analysis of Financial Condition and Results of Operations in the Bank’s 2018 Form 10-K.
Derivatives and Hedging Activities. The Bank enters into interest rate swaps, TBAs, interest rate caps and floors and swaption agreements, referred to as derivatives transactions. The Bank enters into derivatives transactions to offset all or portions of the financial risk exposures inherent in its member lending, investment and funding activities. All derivatives are recorded on the balance sheet at fair value. Changes in derivatives’ fair values are recorded in the Statements of Income.
The Bank's hedging strategies consist of fair value accounting hedges and economic hedges. For 2019, due to the Bank's adoption of ASU 2017-12, fair value hedges impact net interest income and are discussed in more detail below. Economic hedges address specific risks inherent in the Bank's balance sheet, but either they do not qualify for hedge accounting or the Bank does not elect to apply hedge accounting. As a result, income recognition on the derivatives in economic hedges may vary considerably compared to the timing of income recognition on the underlying asset or liability. The Bank does not enter into derivatives for speculative purposes nor does it have any cash flow hedges.
Regardless of the hedge strategy employed, the Bank's predominant hedging instrument is an interest rate swap. At the time of inception, the fair market value of an interest rate swap generally equals or is close to zero. Notwithstanding the exchange of interest payments made during the life of the swap, which are recorded as either interest income/expense or as a gain (loss) on derivatives, depending upon the accounting classification of the hedging instrument, the fair value of an interest rate swap returns to zero at the end of its contractual term. Therefore, although the fair value of an interest rate swap is likely to change over the course of its full term, upon maturity any unrealized gains and losses generally net to zero.
33
On January 1, 2019, the Bank adopted ASU 2017-12. Changes in fair value of the derivative instruments and the related hedged item for designated fair value hedges are now included in net interest income for reporting purposes. Prior to adoption, these amounts were reported in other noninterest income. The following tables detail the net effect of derivatives and hedging activities on non-interest income 2019 and 2018.
2019 | |||||||||||||||||||||
(in millions) | Advances | Investments | Mortgage Loans | Bonds | Discount Notes | Other | Total | ||||||||||||||
Net gains (losses) on derivatives and hedging activities: | |||||||||||||||||||||
Gains (losses) on derivatives not receiving hedge accounting, including net interest settlements | $ | (12.9 | ) | $ | (29.3 | ) | $ | (29.6 | ) | $ | 32.1 | $ | (0.4 | ) | $ | — | $ | (40.1 | ) | ||
Other (1) | — | — | — | — | — | 0.3 | 0.3 | ||||||||||||||
Total net gains (losses) on derivatives and hedging activities | $ | (12.9 | ) | $ | (29.3 | ) | $ | (29.6 | ) | $ | 32.1 | $ | (0.4 | ) | $ | 0.3 | $ | (39.8 | ) | ||
2018 | |||||||||||||||||||||
(in millions) | Advances | Investments | Mortgage Loans | Bonds | Discount Notes | Other | Total | ||||||||||||||
Net gains (losses) on derivatives and hedging activities: | |||||||||||||||||||||
Gains (losses) on fair value hedges | $ | 0.3 | $ | 1.3 | $ | — | $ | (1.2 | ) | $ | — | $ | — | $ | 0.4 | ||||||
Gains (losses) on derivatives not receiving hedge accounting, including net interest settlements | 0.6 | 13.3 | 3.3 | (17.8 | ) | (0.8 | ) | — | (1.4 | ) | |||||||||||
Other (1) | — | — | — | — | — | (3.5 | ) | (3.5 | ) | ||||||||||||
Total net gains (losses) on derivatives and hedging activities | $ | 0.9 | $ | 14.6 | $ | 3.3 | $ | (19.0 | ) | $ | (0.8 | ) | $ | (3.5 | ) | $ | (4.5 | ) | |||
Notes:
(1) Represents the price alignment amount on derivatives for which variation margin is characterized as a daily settled contract. Refer to Note 11 - Derivatives and Hedging Activities in this Form 10-K.
Derivatives not receiving hedge accounting. For derivatives not receiving hedge accounting, also referred to as economic hedges, the Bank includes the net interest settlements and the fair value changes in the “Net gains (losses) on derivatives and hedging activities” financial statement line item. For economic hedges, the Bank recorded net losses of $(40.1) million in 2019 compared to net losses of $(1.4) million in 2018. The losses during 2019 were primarily on the Bank's asset swaps due to decreases in interest rates throughout the year. In contrast, the smaller loss amount during 2018 was due to more frequent periods of rising interest rates during the year. The total notional amount of economic hedges, which includes mortgage delivery commitments, was $11.8 billion at December 31, 2019 and $7.7 billion at December 31, 2018.
2018 vs 2017. For discussion of this year-to-year comparison, refer to the Derivatives and Hedging Activities disclosure included in Item 7: Management’s Discussion and Analysis of Financial Condition and Results of Operations in the Bank’s 2018 Form 10-K.
Other Expense
(in millions) | 2019 | 2018 | ||||
Compensation and benefits | $ | 50.6 | $ | 46.3 | ||
Other | 38.5 | 34.9 | ||||
Finance Agency | 6.7 | 5.9 | ||||
Office of Finance | 5.7 | 5.0 | ||||
Total other expenses | $ | 101.5 | $ | 92.1 | ||
The Bank's total other expenses increased $9.4 million to $101.5 million for 2019 compared to $92.1 million for 2018. The increase was primarily due to higher compensation and benefits, increases in technology-related costs and higher fees paid
34
to the Finance Agency and the OF. Collectively, the 11 FHLBanks are responsible for the operating expenses of the Finance Agency and the OF. These payments are allocated among the FHLBanks according to a cost-sharing formula.
2018 vs 2017. For discussion of this year-to-year comparison, refer to the Other Expense disclosure included in Item 7: Management’s Discussion and Analysis of Financial Condition and Results of Operations in the Bank’s 2018 Form 10-K.
Community Investment Products
The Bank helps members meet their Community Reinvestment Act (CRA) responsibilities. Through community investment cash advance products such as AHP and CLP, members have access to subsidized and other low-cost funding. Members use the funds from these products to create affordable rental and homeownership opportunities, and for community and economic development activities that benefit low- and moderate-income neighborhoods and help revitalize their communities.
The Bank’s mission includes the important public policy goal of making funds available for housing and economic development in the communities served by the Bank’s member financial institutions. In support of this goal, the Bank administers a number of products, some mandated and some voluntary, which make Bank funds available through member financial institutions. In all of these products, the Bank’s funding flows through member financial institutions into areas of need throughout the region.
AHP. The AHP, mandated by the Act, is the largest and primary public policy product of the Bank. The AHP funds, which are offered on a competitive basis, provide grants and below-market loans for both rental and owner-occupied housing for households at 80% or less of the area median income. The Bank is required to contribute approximately 10% of its income (GAAP net income before interest expense related to mandatorily redeemable capital stock and the assessment for AHP) to AHP and makes these funds available for use in the subsequent year. Each year, the Bank’s Board adopts an implementation plan that defines the structure of the product pursuant to the AHP regulations. The Bank’s contribution was $37.1 million and $38.7 million for 2019 and 2018, respectively. The following table details the funding rounds the Bank conducted and the distribution of AHP funds for 2019 and 2018.
2019 | 2018 | |
Funding rounds | 1 | 1 |
Eligible applications | 165 | 156 |
Grants | $33.9 million | $34.2 million |
Projects | 64 | 68 |
Project development costs | $334.9 million | $250.8 million |
Units of affordable housing | 1,727 | 1,714 |
In addition, the First Front Door product (FFD) offers grants to first time homebuyers up to $5,000 to assist with the purchase of a home. FFD grants are available to households earning 80% or less of the area median income. The FFD grants disbursed were $8.5 million and $7.9 million during 2019 and 2018, respectively.
In 2016, the Bank initiated a Disaster Relief Program (DRP) which was made available to members to assist households affected by historic flooding in 12 West Virginia counties. The funds for this product were set-aside from the overall 2016 AHP subsidy pool and were used for owner-occupied rehabilitation up to $15,000 per household or for home purchase assistance of up to $7,500 per household. The DRP closed in June 2019 and had disbursed grants of $555,000.
Other Products. The CLP offers advances at the Bank’s cost of funds providing the full advantage of a low-cost funding source. CLP loans help member institutions finance housing construction and rehabilitation, infrastructure improvement, and economic and community development projects that benefit targeted neighborhoods and households. At December 31, 2019, the CLP loan balance totaled $1,339.7 million compared to $1,191.7 million at December 31, 2018, reflecting an increase of $148 million, or 12%.
The Bank’s BOB loan product to members is targeted to small businesses to assist in the growth and development of small business, including both the start-up and expansion. The Bank makes funds available to members to extend credit to approved small business borrowers, enabling small businesses to qualify for credit that would otherwise not be available. For both 2019 and 2018, the Bank made $6.0 million available for each year, to assist small businesses through the BOB loan product.
35
In addition, the Bank has a homeless initiative called Home4Good. Home4Good is designed to support activities or actions that lead to stable housing for individuals and families who are homeless or who are at risk of becoming homeless. It is offered in partnership with state housing finance agencies in Pennsylvania, West Virginia, and Delaware. The Bank contributed $4.8 million to this initiative for both 2019 and 2018.
Financial Condition
The following should be read in conjunction with the Bank’s audited financial statements in Item 8. Financial Statements and Supplementary Financial Data in this Form 10-K.
Assets
Total assets were $95.7 billion at December 31, 2019, compared with $107.5 billion at December 31, 2018, a decrease of $11.8 billion. The decrease was primarily due to lower advances activity. Advances totaled $65.6 billion at December 31, 2019, a decrease of $16.9 billion, compared to $82.5 billion at December 31, 2018.
The Bank's core mission activities include the issuance of advances and acquiring member assets through the MPF® program. The core mission asset ratio, defined as the ratio of par amount of advances and MPF loans relative to consolidated obligations adjusted for high quality liquid assets using full year average balances, was 82.2% and 84.6% for 2019 and 2018, respectively.
Advances. Advances (par) totaled $65.4 billion at December 31, 2019 compared to $82.6 billion at December 31, 2018. At December 31, 2019, the Bank had advances to 161 borrowing members, compared to 184 borrowing members at December 31, 2018. A significant amount of the advances continued to be generated from the Bank’s five largest borrowers, reflecting the asset concentration mix of the Bank’s membership base. Advances outstanding to the Bank’s five largest borrowers increased to 77.7% of total advances as of December 31, 2019, compared to 77.2% at December 31, 2018. In the second quarter of 2019, Chase Bank USA, N.A. (Chase), one of the Bank’s five largest borrowers, became a non-member as its charter was merged with an entity outside of the Bank’s district (JP Morgan Chase Bank, N.A). J.P. Morgan Chase Bank, N.A's outstanding advance balance as of December 31, 2019, was $8.0 billion.
36
The following table provides information on advances at par by redemption terms at December 31, 2019 and December 31, 2018.
December 31, | ||||||
(in millions) | 2019 | 2018 | ||||
Fixed-rate | ||||||
Due in 1 year or less (1) | $ | 21,783.1 | $ | 22,556.5 | ||
Due after 1 year through 3 years | 13,523.4 | 11,897.9 | ||||
Due after 3 years through 5 years | 2,012.5 | 4,973.7 | ||||
Thereafter | 594.4 | 632.6 | ||||
Total par value | $ | 37,913.4 | $ | 40,060.7 | ||
Fixed-rate, callable or prepayable (1) | ||||||
Due after 1 year through 3 years | $ | 20.0 | $ | — | ||
Total par value | $ | 20.0 | $ | — | ||
Variable-rate | ||||||
Due in 1 year or less (1) | $ | 14,129.5 | $ | 8,813.9 | ||
Due after 1 year through 3 years | 5,025.0 | 17,313.0 | ||||
Due after 3 years through 5 years | 53.1 | 100.0 | ||||
Thereafter | — | 3.1 | ||||
Total par value | $ | 19,207.6 | $ | 26,230.0 | ||
Variable-rate, callable or prepayable (2) | ||||||
Due in 1 year or less | $ | 5,225.0 | $ | 6,115.0 | ||
Due after 1 year through 3 years | 2,635.0 | 9,725.0 | ||||
Due after 3 years through 5 years | 40.0 | 10.0 | ||||
Total par value | $ | 7,900.0 | $ | 15,850.0 | ||
Other (3) | ||||||
Due in 1 year or less | $ | 123.7 | $ | 147.1 | ||
Due after 1 year through 3 years | 147.4 | 161.0 | ||||
Due after 3 years through 5 years | 69.7 | 75.0 | ||||
Thereafter | 57.3 | 73.8 | ||||
Total par value | $ | 398.1 | $ | 456.9 | ||
Total par balance | $ | 65,439.1 | $ | 82,597.6 | ||
Notes:
(1) Includes overnight advances.
(2) Prepayable advances are those advances that may be contractually prepaid by the borrower on specified dates without incurring prepayment or termination fees.
(3) Includes fixed-rate amortizing/mortgage matched, convertible, and other advances.
The Bank had no putable advances at December 31, 2019 or December 31, 2018.
37
The following table provides a distribution of the number of members, categorized by individual member asset size (as reported quarterly) that had an outstanding advance balance during the years ended 2019 and 2018. Commercial Bank, Savings Institution, and Credit Union members are classified by asset size as follows: Large (over $25 billion), Regional ($4 billion to $25 billion), Mid-size ($1.2 billion to $4 billion) and CFI (under $1.2 billion).
December 31, | ||||
Member Classification | 2019 | 2018 | ||
Large | 6 | 7 | ||
Regional | 15 | 17 | ||
Mid-size | 28 | 29 | ||
CFI (1) | 176 | 177 | ||
Insurance | 24 | 17 | ||
Total borrowing members during the period | 249 | 247 | ||
Total membership | 286 | 291 | ||
Percentage of members borrowing during the period | 87.1 | % | 84.9 | % |
(1) For purposes of this member classification reporting, the Bank groups CDFIs with CFIs.
The following table provides information at par on advances by member classification at December 31, 2019 and December 31, 2018.
(in millions) | December 31, 2019 | December 31, 2018 | ||||
Member Classification | ||||||
Large | $ | 43,165.0 | $ | 63,675.0 | ||
Regional | 5,256.1 | 8,835.7 | ||||
Mid-size | 4,197.7 | 4,062.9 | ||||
CFI | 2,887.3 | 3,739.0 | ||||
Insurance | 1,416.5 | 1,783.2 | ||||
Non-member | 8,516.5 | 501.8 | ||||
Total | $ | 65,439.1 | $ | 82,597.6 | ||
As of December 31, 2019, total advances decreased 21% compared with balances at December 31, 2018. It is not uncommon for the Bank to experience variances in the overall advance portfolio driven primarily by changes in member needs. In addition, in the second quarter of 2019, Chase Bank USA, N.A. (Chase) became a non-member as its charter was merged with an entity outside of the Bank’s district (JP Morgan Chase Bank, N.A). Advances of $8.0 billion to J.P. Morgan Chase Bank, N.A. moved from the Large member classification to Non-member in the table above.
See the Credit and Counterparty Risk -TCE and Collateral discussion in the Risk Management section of this Item 7. Management’s Discussion and Analysis in this Form 10-K for further information on collateral policies and practices and details regarding eligible collateral, including amounts and percentages of eligible collateral securing member advances as of December 31, 2019.
Mortgage Loans Held for Portfolio. Mortgage loans held for portfolio, net of allowance for credit losses was $5.1 billion and $4.5 billion at December 31, 2019 and December 31, 2018, respectively.
The Bank places conventional mortgage loans that are 90 days or more delinquent on nonaccrual status. In addition, the Bank records cash payments received as a reduction of principal until the remaining principal amount due is expected to be collected and then as a recovery of any charge-off, if applicable, followed by the recording of interest income. However, government mortgage loans that are 90 days or more delinquent remain in accrual status due to government guarantees or insurance. The Bank has a loan modification program for PFIs under the MPF Program. The Bank considers loan modifications or Chapter 7 bankruptcies where the obligation is discharged and not reaffirmed under the MPF Program to be troubled debt restructurings (TDRs), since some form of concession has been made by the Bank.
38
Foregone interest represents income the Bank would have recorded if the loan was paying according to its contractual terms. Foregone interest for years 2015 through 2019 was immaterial for both the Bank’s mortgage loans and BOB loans. Balances regarding the Bank’s loan products are summarized below.
December 31, | |||||||||||||||
(in millions) | 2019 | 2018 | 2017 | 2016 | 2015 | ||||||||||
Advances(1) | $ | 65,610.1 | $ | 82,475.5 | $ | 74,279.8 | $ | 76,808.7 | $ | 74,504.8 | |||||
Mortgage loans held for portfolio, net(2) | 5,114.6 | 4,461.6 | 3,923.1 | 3,390.7 | 3,086.9 | ||||||||||
Nonaccrual mortgage loans(3) | 15.6 | 16.6 | 22.8 | 26.6 | 32.5 | ||||||||||
Mortgage loans 90 days or more delinquent and still accruing interest(4) | 3.3 | 4.1 | 4.8 | 4.0 | 4.2 | ||||||||||
BOB loans, net | 19.7 | 17.3 | 14.1 | 12.3 | 11.3 | ||||||||||
Notes:
(1) There are no advances which are past due or on nonaccrual status.
(2) All mortgage loans are fixed-rate. Balances are reflected net of the allowance for credit losses.
(3) Nonaccrual mortgage loans are reported net of interest applied to principal and do not include performing TDRs.
(4) Only government-insured or -guaranteed loans continue to accrue interest after becoming 90 days or more delinquent.
The performance of the mortgage loans in the Bank’s MPF Program has been relatively stable, and the MPF Original portfolio continues to outperform the market based on national delinquency statistics. The Bank’s seriously delinquent mortgage loans (90 days or more delinquent or in the process of foreclosure) represented 0.4% of the MPF Original portfolio and 2.2% of the MPF Plus portfolio for both December 31, 2019 and December 31, 2018. The MPF 35 portfolio delinquency remains minimal at 0.03% and 0.02% at December 31, 2019, and December 31, 2018, respectively.
Allowance for Credit Losses (ACL). The Bank has not incurred any losses on advances since its inception in 1932. Due to the collateral held as security and the repayment history for advances, specifically in cases where a member fails, management has determined that a zero ACL for advances is supportable under GAAP. This assessment also includes letters of credit, which have the same collateral requirements as advances. For additional information, see discussion regarding collateral policies and standards on the advances portfolio in the Advance Products and Collateral discussion in Item 1. Business in this Form 10-K.
The ACL on mortgage loans is based on the losses inherent in the Bank's mortgage loan portfolio after taking into consideration the CE structure of the MPF Program. The losses inherent in the portfolio are based on either an individual or collective assessment of the mortgage loans. The Bank purchases government-guaranteed and/or -insured and conventional fixed-rate residential mortgage loans. Because the credit risk on the government-guaranteed/insured loans is predominantly assumed by other entities, only conventional mortgage loans are evaluated for an ACL.
The Bank’s conventional mortgage loan portfolio is comprised of large groups of smaller-balance homogeneous loans made to borrowers of PFIs that are secured by residential real estate. A mortgage loan is considered impaired when it is probable that all contractual principal and interest payments will not be collected as scheduled based on current information and events. The Bank evaluates certain conventional mortgage loans for impairment individually and the related credit loss is charged-off against the reserve. However, if the estimated loss can be recovered through CE, a receivable is established, resulting in a net charge-off. The CE receivable is evaluated for collectibility, and a reserve, included as part of the allowance for credit losses, is established, if required.
The remainder of the portfolio's incurred loss is estimated using a collective assessment, which is based on probability of default and loss given default. Probability of default and loss given default are based on the prior 12 month historical performance of the Bank's mortgage loans. Probability of default is based on a migration analysis, and loss given default is based on realized losses incurred on the sale of mortgage loan collateral including a factor that reduces estimated proceeds from primary mortgage insurance (PMI) given the credit deterioration experienced by those companies.
39
The following table presents the rollforward of ACL on the mortgage loans held for portfolio for the years 2015 through 2019.
(in millions) | 2019 | 2018 | 2017 | 2016 | 2015 | ||||||||||
Balance, beginning of year | $ | 7.3 | $ | 6.0 | $ | 6.2 | $ | 5.7 | $ | 7.3 | |||||
(Charge-offs) Recoveries, net | (0.2 | ) | (1.3 | ) | (0.1 | ) | (0.2 | ) | (0.8 | ) | |||||
Provision (benefit) for credit losses | 0.7 | 2.6 | (0.1 | ) | 0.7 | (0.8 | ) | ||||||||
Balance, end of year | $ | 7.8 | $ | 7.3 | $ | 6.0 | $ | 6.2 | $ | 5.7 | |||||
As a % of mortgage loans held for portfolio | 0.2 | % | 0.2 | % | 0.2 | % | 0.2 | % | 0.2 | % | |||||
Mortgage loans are assessed by a third party's credit model at acquisition and a CE is calculated based on loan attributes and the Bank’s risk tolerance on its entire MPF portfolio. Credit losses on a mortgage loan may only be absorbed by the CE amount in the master commitment related to the loan. In addition, the CE structure of the MPF Program is designed such that initial losses on mortgage loans are incurred by the Bank up to an agreed upon amount, referred to as the First Loss Account (FLA). Additional eligible credit losses are covered by CEs provided by PFIs (available CE) until exhausted. Certain losses incurred by the Bank on MPF 35 and MPF Plus can be recaptured by withholding fees paid to the PFI for its retention of credit risk. All additional losses are incurred by the Bank.
The following table presents the impact of the CE structure on the ACL and the balance of the FLA and available CE at December 31, 2019 and December 31, 2018.
MPF CE structure December 31, 2019 | ACL December 31, 2019 | |||||||||||||||||
(in millions) | FLA | Available CE | Estimate of Credit Loss | Charge -offs | Reduction to the ACL due to CE | ACL | ||||||||||||
MPF Original | $ | 6.1 | $ | 82.6 | $ | 3.9 | $ | (1.3 | ) | $ | (2.2 | ) | $ | 0.4 | ||||
MPF 35 | 10.3 | 107.1 | 0.7 | — | (0.7 | ) | — | |||||||||||
MPF Plus | 15.6 | 5.6 | 9.0 | — | (1.6 | ) | 7.4 | |||||||||||
Total | $ | 32.0 | $ | 195.3 | $ | 13.6 | $ | (1.3 | ) | $ | (4.5 | ) | $ | 7.8 | ||||
MPF CE structure December 31, 2018 | ACL December 31, 2018 | |||||||||||||||||
(in millions) | FLA | Available CE | Estimate of Credit Loss | Charge -offs | Reduction to the ACL due to CE | ACL | ||||||||||||
MPF Original | $ | 5.4 | $ | 80.0 | $ | 4.5 | $ | (1.2 | ) | $ | (2.9 | ) | $ | 0.4 | ||||
MPF 35 | 7.0 | 74.3 | 0.3 | — | (0.3 | ) | — | |||||||||||
MPF Plus | 16.5 | 7.6 | 8.9 | — | (2.0 | ) | 6.9 | |||||||||||
Total | $ | 28.9 | $ | 161.9 | $ | 13.7 | $ | (1.2 | ) | $ | (5.2 | ) | $ | 7.3 | ||||
The ACL on mortgage loans increased $0.5 million during 2019. The increase is primarily due to an increase in the ACL associated with the MPF Plus product due to lower CE fee recovery resulting from a shorter weighted average life of the portfolio. The ACL associated with MPF Original remained consistent, and the ACL associated with the MPF 35 program remained zero due to the nature of its credit structure and performance.
Real Estate Owned (REO). When a PFI or servicer forecloses on a delinquent mortgage loan, the Bank reclassifies the carrying value of the loan to other assets as REO at fair value less estimated selling expenses. If the fair value of the REO property is lower than the carrying value of the loan, then the difference to the extent such amount is not expected to be recovered through recapture of performance-based CE fees is recorded as a charge-off to the ACL. The fair value less estimated costs to sell the property becomes the new cost basis for subsequent accounting. If the fair value of the REO property is higher than the carrying value of the loan, then the REO property is recorded at fair value less estimated selling costs. This is rare as the Bank believes this situation would require additional validation of the fair value. The servicer is charged with the responsibility for disposing of real estate on defaulted mortgage loans on behalf of the Bank. Once a property has been sold, the
40
servicer presents a summary of the gain or loss for the individual mortgage loan to the master servicer for reimbursement of any loss. Gains on the sale of REO property are held and offset by future losses in the pool of loans, ahead of any remaining balances in the FLA. Losses are deducted from the FLA, if it has not been fully used. The Bank held $2.0 million and $2.9 million of REO at December 31, 2019 and December 31, 2018, respectively.
Cash and Investments. The Bank’s strategy is to maintain its short-term liquidity position in part to be able to meet members’ loan demand and regulatory liquidity requirements. Excess cash is typically invested in overnight investments. The Bank also maintains an investment portfolio to enhance earnings. These investments may be classified as trading, AFS or HTM.
The Bank maintains a liquidity portfolio comprised of cash, interest-bearing deposits, Federal funds sold, securities purchased under agreements to resell, and U.S. Treasury obligations classified as trading or AFS. The liquidity portfolio at December 31, 2019 increased by $1.7 billion compared to December 31, 2018, primarily due to increased investment in U.S. Treasury obligations and as a result of changes in the liquidity regulations issued by the Finance Agency, effective March 31, 2019. At December 31, 2018, liquidity also included GSE and Tennessee Valley Authority (TVA) obligations classified as trading.
The Bank's investment portfolio is comprised of trading, AFS and HTM investments (excluding those investments included in the liquidity portfolio). The investments must meet the Bank's risk guidelines and certain other requirements, such as yield. The Bank's investment portfolio totaled $13.7 billion and $10.9 billion at December 31, 2019 and December 31, 2018, respectively.
Investment securities, including all trading, AFS, and HTM securities, totaled $17.1 billion at December 31, 2019, compared to $12.2 billion at December 31, 2018. Details of the investment securities follow.
Carrying Value | ||||||
December 31, | ||||||
(in millions) | 2019 | 2018 | ||||
Trading securities: | ||||||
Non-MBS: | ||||||
U.S. Treasury obligations | $ | 3,390.7 | $ | 997.1 | ||
GSE and TVA obligations | 240.9 | 284.0 | ||||
Total trading securities | $ | 3,631.6 | $ | 1,281.1 | ||
AFS securities: | ||||||
GSE and TVA obligations | $ | 1,550.7 | $ | 1,785.3 | ||
State or local agency obligations | 247.9 | 245.9 | ||||
MBS: | ||||||
U.S. obligations single-family MBS | 807.6 | 218.5 | ||||
GSE single-family MBS | 4,055.8 | 2,581.5 | ||||
GSE multifamily MBS | 4,109.6 | 2,605.5 | ||||
Private label MBS | 326.2 | 409.6 | ||||
Total AFS securities | $ | 11,097.8 | $ | 7,846.3 | ||
HTM securities: | ||||||
Certificates of deposit | $ | — | $ | 700.0 | ||
State or local agency obligations | 94.3 | 102.7 | ||||
MBS: | ||||||
U.S. obligations single-family MBS | 250.2 | 325.2 | ||||
GSE single-family MBS | 1,156.6 | 899.9 | ||||
GSE multifamily MBS | 770.8 | 853.0 | ||||
Private label MBS | 123.8 | 205.2 | ||||
Total HTM securities | $ | 2,395.7 | $ | 3,086.0 | ||
Total investment securities | $ | 17,125.1 | $ | 12,213.4 | ||
41
The following table presents the composition of investment securities and investments, assuming no principal prepayments, as of December 31, 2019. Contractual maturity of MBS is not a reliable indicator of their expected life because borrowers generally have the right to prepay their obligation at any time.
(dollars in millions) | Due in 1 year or less | Due after 1 year through 5 years | Due after 5 years through 10 years | Due after 10 years | Carrying Value | ||||||||||
Trading securities: | |||||||||||||||
Non-MBS: | |||||||||||||||
U.S. Treasury obligations | $ | 1,072.8 | $ | 2,317.9 | $ | — | $ | — | $ | 3,390.7 | |||||
GSE and TVA obligations | — | 73.5 | 139.9 | 27.5 | 240.9 | ||||||||||
Total trading securities | $ | 1,072.8 | $ | 2,391.4 | $ | 139.9 | $ | 27.5 | $ | 3,631.6 | |||||
Yield on trading securities | 1.82 | % | 2.04 | % | 3.13 | % | 3.28 | % | 2.02 | % | |||||
AFS securities: | |||||||||||||||
GSE and TVA obligations | $ | — | $ | 533.6 | $ | 704.5 | $ | 312.6 | $ | 1,550.7 | |||||
State or local agency obligations | — | 1.0 | 15.2 | 231.7 | 247.9 | ||||||||||
MBS: | |||||||||||||||
U.S. obligations single-family MBS | — | — | — | 807.6 | 807.6 | ||||||||||
GSE single-family MBS | — | 7.3 | 100.2 | 3,948.3 | 4,055.8 | ||||||||||
GSE multifamily MBS | 5.7 | 608.0 | 3,495.9 | — | 4,109.6 | ||||||||||
Private label MBS | — | — | — | 326.2 | 326.2 | ||||||||||
Total AFS securities | $ | 5.7 | $ | 1,149.9 | $ | 4,315.8 | $ | 5,626.4 | $ | 11,097.8 | |||||
Yield on AFS Securities | 2.57 | % | 2.66 | % | 2.33 | % | 2.74 | % | 2.58 | % | |||||
HTM securities: | |||||||||||||||
State or local agency obligations | $ | — | $ | — | $ | 31.9 | $ | 62.4 | $ | 94.3 | |||||
MBS: | |||||||||||||||
U.S. obligations single-family MBS | 75.7 | — | — | 174.5 | 250.2 | ||||||||||
GSE single-family MBS | — | — | 24.8 | 1,131.8 | 1,156.6 | ||||||||||
GSE multifamily MBS | 195.9 | 322.9 | 252.0 | — | 770.8 | ||||||||||
Private label MBS | 0.5 | — | — | 123.3 | 123.8 | ||||||||||
Total HTM securities | $ | 272.1 | $ | 322.9 | $ | 308.7 | $ | 1,492.0 | $ | 2,395.7 | |||||
Yield on HTM securities | 3.25 | % | 2.79 | % | 3.59 | % | 3.23 | % | 3.22 | % | |||||
Total investment securities | $ | 1,350.6 | $ | 3,864.2 | $ | 4,764.4 | $ | 7,145.9 | $ | 17,125.1 | |||||
Yield on investment securities | 2.11 | % | 2.28 | % | 2.44 | % | 2.85 | % | 2.55 | % | |||||
Interest-bearing deposits | $ | 1,476.9 | $ | — | $ | — | $ | — | $ | 1,476.9 | |||||
Federal funds sold | 3,770.0 | — | — | — | 3,770.0 | ||||||||||
Securities purchased under agreements to resell | 2,200.0 | — | — | — | 2,200.0 | ||||||||||
Total investments | $ | 8,797.5 | $ | 3,864.2 | $ | 4,764.4 | $ | 7,145.9 | $ | 24,572.0 | |||||
As of December 31, 2019, the Bank held securities from the following issuers with a book value greater than 10% of Bank total capital.
Total Book Value | Total Fair Value | |||||
(in millions) | ||||||
Fannie Mae | $ | 6,960.5 | $ | 6,975.6 | ||
U.S. Treasury | 3,390.8 | 3,390.8 | ||||
Freddie Mac | 3,157.7 | 3,189.2 | ||||
Federal Farm Credit Banks | 1,682.2 | 1,682.2 | ||||
Ginnie Mae | 982.1 | 983.1 | ||||
Total | $ | 16,173.3 | $ | 16,220.9 | ||
42
For additional information on the credit risk of the investment portfolio, see the Credit and Counterparty Risk - Investments discussion in the Risk Management section of this Item 7. Management’s Discussion and Analysis in this Form 10-K.
Liabilities and Capital
For discussion of the 2018 to 2017 comparison, refer to the Liabilities and Capital disclosure included in Item 7: Management’s Discussion and Analysis of Financial Condition and Results of Operations in the Bank’s 2018 Form 10-K.
Deposits. The Bank offers demand, overnight and term deposits for members and qualifying nonmembers. Total deposits at December 31, 2019 increased to $573.4 million from $387.0 million at December 31, 2018. Interest-bearing deposits classified as demand and overnight pay interest based on a daily interest rate. Term deposits pay interest based on a fixed rate determined at the issuance of the deposit. The weighted-average interest rates paid on interest bearing deposits were 1.95% and 1.65% during 2019 and 2018, respectively.
Factors that generally influence deposit levels include turnover in members’ investment securities portfolios, changes in member demand for liquidity driven by member institution deposit growth, the slope of the yield curve and the Bank’s deposit pricing compared to other short-term money market rates. Fluctuations in this source of the Bank’s funding are typically offset by changes in the issuance of consolidated obligation discount notes. The Act requires the Bank to have assets, referred to as deposit reserves, invested in obligations of the United States, deposits in eligible banks or trust companies or loans with a maturity not exceeding five years, totaling at least equal to the current deposit balance. As of December 31, 2019 and 2018, excess deposit reserves were $69.4 billion and $84.6 billion, respectively.
Time Deposits. At December 31, 2019 and December 31, 2018, the Bank had no time deposits.
Consolidated Obligations. Consolidated obligations consist of bonds and discount notes. The Bank's consolidated obligations totaled $89.9 billion at December 31, 2019, a decrease of $11.3 billion from December 31, 2018. At December 31, 2019, the Bank’s consolidated obligation bonds outstanding increased to $66.8 billion compared to $64.3 billion at December 31, 2018. However, discount notes outstanding at December 31, 2019 decreased to $23.1 billion from $36.9 billion at December 31, 2018. The decreases in consolidated obligations reflect the decrease in advances at year end.
Consolidated obligations bonds often have investor-determined features. The decision to issue a bond using a particular structure is based upon the desired amount of funding, and the ability of the Bank to hedge the risks. The issuance of a bond with a simultaneously-transacted interest-rate exchange agreement usually results in a funding vehicle with a lower cost than the Bank could otherwise achieve. The continued attractiveness of such debt/swap transactions depends on price relationships in both the consolidated bond and interest-rate exchange markets. If conditions in these markets change, the Bank may alter the types or terms of the bonds issued. The increase in funding alternatives available to the Bank through negotiated debt/swap transactions is beneficial to the Bank because it may reduce funding costs and provide additional asset/liability management tools. The types of consolidated obligations bonds issued can fluctuate based on comparative changes in their cost levels, supply and demand conditions, advance demand, and the Bank’s balance sheet management strategy.
The Bank primarily uses noncallable bonds as a source of funding but also utilizes structured notes such as callable bonds. Unswapped callable bonds primarily fund the Bank’s mortgage portfolio while swapped callable bonds fund other floating rate assets. For additional information on the Bank’s consolidated obligations, refer to Note 13 to the audited financial statements in Item 8. Financial Statements and Supplementary Financial Data in this Form 10-K.
43
Short-term Borrowings. For the table below, borrowings with original maturities of one year or less are classified as short-term. The following is a summary of key statistics for the Bank’s short-term borrowings at par.
Consolidated Obligations - Discount Notes | Consolidated Obligations -Bonds with original maturities of one year or less | |||||||||||
(dollars in millions) | 2019 | 2018 | 2019 | 2018 | ||||||||
Outstanding at the end of the period | $ | 23,211.5 | $ | 36,985.0 | $ | 29,526.2 | $ | 14,301.0 | ||||
Weighted average rate at end of the period | 1.61 | % | 2.36 | % | 1.71 | % | 2.34 | % | ||||
Daily average outstanding for the period | $ | 26,793.8 | $ | 26,532.8 | $ | 23,570.4 | $ | 19,216.4 | ||||
Weighted average rate for the period | 2.23 | % | 1.85 | % | 2.18 | % | 1.84 | % | ||||
Highest outstanding at any month-end | $ | 37,483.2 | $ | 36,985.0 | $ | 29,526.2 | $ | 26,069.4 | ||||
Contractual Obligations. The following table summarizes the expected payment of significant contractual obligations by due date or stated maturity date at December 31, 2019.
(in millions) | Total | Less than 1 Year | 1 to 3 Years | 4 to 5 Years | Thereafter | ||||||||||
Consolidated obligations (at par): | |||||||||||||||
Bonds (1) | $ | 66,704.2 | $ | 50,306.9 | $ | 9,974.1 | $ | 2,416.8 | $ | 4,006.4 | |||||
Discount notes | 23,211.5 | 23,211.5 | — | — | — | ||||||||||
Mandatorily redeemable capital stock | 343.6 | 3.3 | — | 340.0 | 0.3 | ||||||||||
Operating leases | 10.7 | 2.1 | 4.1 | 3.9 | 0.6 | ||||||||||
Pension and post-retirement contributions | 21.8 | 1.7 | 2.9 | 4.5 | 12.7 | ||||||||||
Total | $ | 90,291.8 | $ | 73,525.5 | $ | 9,981.1 | $ | 2,765.2 | $ | 4,020.0 | |||||
Note:
(1) Specific bonds or notes incorporate features, such as calls or indices, which could cause redemption at different times than the stated maturity dates.
Commitments and Off-Balance Sheet Items. As of December 31, 2019, the Bank was obligated to fund approximately $19.8 million in additional advances and BOB loans, $73.6 million of mortgage loans and to issue $1.1 billion in consolidated obligations. In addition, the Bank had $17.4 billion in outstanding standby letters of credit as of December 31, 2019. The Bank does not consolidate any off-balance sheet special purpose entities or other off-balance sheet conduits.
In accordance with regulations governing the operations of the FHLBanks, each FHLBank, including the Bank, is jointly and severally liable for the FHLBank System’s consolidated obligations. The joint and several liability regulation authorizes the Finance Agency to require any FHLBank to repay all or a portion of the principal or interest on consolidated obligations for which another FHLBank is the primary obligor. Refer to the Liquidity and Funding Risk section in Item 7. Management’s Discussion and Analysis for FHLBank System consolidated obligations. For additional information on the Bank’s commitments and contingencies, refer to Note - 19 in this Form 10-K.
Capital and Retained Earnings. The Bank’s capital stock is owned by its members. The concentration of the Bank’s capital stock by institution type is presented below.
(dollars in millions) | December 31, 2019 | December 31, 2018 | ||||||||
Commercial banks | 140 | $ | 2,729.6 | 146 | $ | 3,629.2 | ||||
Savings institutions | 53 | 148.2 | 58 | 197.9 | ||||||
Insurance companies | 31 | 109.3 | 29 | 131.6 | ||||||
Credit unions | 60 | 67.5 | 56 | 68.2 | ||||||
CDFIs | 2 | 0.4 | 2 | 0.4 | ||||||
Total member institutions / total GAAP capital stock | 286 | $ | 3,055.0 | 291 | $ | 4,027.3 | ||||
Mandatorily redeemable capital stock | 343.6 | 24.1 | ||||||||
Total capital stock | $ | 3,398.6 | $ | 4,051.4 | ||||||
44
The total number of members as of December 31, 2019 decreased by five members compared to December 31, 2018. The Bank added seven new members and lost 12 members. Three members merged with other institutions outside of the Bank's district; one member completed their membership withdrawal; and eight members merged with other institutions within the Bank's district.
The following tables present member holdings of 10% or more of the Bank’s total capital stock including mandatorily redeemable capital stock outstanding as of December 31, 2019 and December 31, 2018.
(dollars in millions) | December 31, 2019 | ||||
Member(1) | Capital Stock | % of Total | |||
PNC Bank, N.A., Wilmington, DE | $ | 746.6 | 22.0 | % | |
Ally Bank, Midvale, UT | 700.8 | 20.6 | |||
(dollars in millions) | December 31, 2018 | ||||
Member(1) | Capital Stock | % of Total | |||
PNC Bank, N.A., Wilmington, DE | $ | 947.4 | 23.4 | % | |
Ally Bank, Midvale, UT | 903.5 | 22.3 | |||
JP Morgan Chase Bank, N.A., Columbus, OH | 537.2 | 13.3 | |||
Note:
(1) For Bank membership purposes, the principal place of business for PNC Bank is Pittsburgh, PA. For Ally Bank, the principal place of business is Horsham, PA.
The Finance Agency has issued regulatory guidance to the FHLBanks relating to capital management and retained earnings. The guidance directs each FHLBank to assess, at least annually, the adequacy of its retained earnings with consideration given to future possible financial and economic scenarios. The guidance also outlines the considerations that each FHLBank should undertake in assessing the adequacy of its retained earnings.
Management monitors capital adequacy, including the level of retained earnings, through the evaluation of market value of equity to par value of capital stock (MV/CS) as well as other risk metrics. Details regarding these metrics are discussed in the Risk Management portion in Item 7. Management’s Discussion and Analysis in this Form 10-K.
Management has developed and adopted a framework for evaluating retained earnings adequacy, consistent with regulatory guidance and requirements. Retained earnings are intended to cover unexpected losses and protect members’ par value of capital stock. The framework includes four risk elements that comprise the Bank’s total retained earnings target: (1) market risk; (2) credit risk; (3) operational risk; and (4) accounting risk. The retained earnings target generated from this framework is sensitive to changes in the Bank’s risk profile, whether favorable or unfavorable. The framework assists management in its overall analysis of the level of future dividends. The framework generated a retained earnings target of $488.0 million as of December 31, 2019. The Bank’s retained earnings were $1,326.0 million at December 31, 2019.
Retained earnings increased $50.1 million to $1,326.0 million at December 31, 2019, compared to $1,275.9 million at December 31, 2018. The increase in retained earnings during 2018 reflected net income that was largely offset by dividends paid. Total retained earnings at December 31, 2019 included unrestricted retained earnings of $910.7 million and restricted retained earnings (RRE) of $415.3 million.
45
Other Financial Information
Selected Quarterly Financial Data
The following tables present the Bank’s unaudited quarterly operating results for each quarter in 2019 and 2018.
2019 | ||||||||||||
(in millions) | Fourth Quarter | Third Quarter | Second Quarter | First Quarter | ||||||||
Interest income | $ | 560.5 | $ | 700.0 | $ | 697.0 | $ | 729.5 | ||||
Interest expense | 456.3 | 590.9 | 586.4 | 599.6 | ||||||||
Net interest income | 104.2 | 109.1 | 110.6 | 129.9 | ||||||||
Provision (benefit) for credit losses | (0.5 | ) | 0.4 | 1.0 | 0.4 | |||||||
Net interest income after provision (benefit) for credit losses | 104.7 | 108.7 | 109.6 | 129.5 | ||||||||
Other noninterest income (loss): | ||||||||||||
Net OTTI losses | (0.3 | ) | (0.3 | ) | — | — | ||||||
Net gains (losses) on investment securities | (4.6 | ) | 5.4 | 7.8 | 10.1 | |||||||
Net gains (losses) on derivatives and hedging activities | 15.4 | (17.4 | ) | (24.8 | ) | (13.0 | ) | |||||
Other, net | 6.5 | 5.6 | 5.6 | 7.0 | ||||||||
Total other noninterest income (loss) | 17.0 | (6.7 | ) | (11.4 | ) | 4.1 | ||||||
Other expense | 31.1 | 23.2 | 22.6 | 24.6 | ||||||||
Income before assessments | 90.6 | 78.8 | 75.6 | 109.0 | ||||||||
AHP assessment | 9.7 | 8.5 | 7.9 | 11.0 | ||||||||
Net income | $ | 80.9 | $ | 70.3 | $ | 67.7 | $ | 98.0 | ||||
2018 | ||||||||||||
(in millions) | Fourth Quarter | Third Quarter | Second Quarter | First Quarter | ||||||||
Interest income | $ | 660.5 | $ | 592.0 | $ | 553.0 | $ | 455.9 | ||||
Interest expense | 537.2 | 471.9 | 435.9 | 346.3 | ||||||||
Net interest income | 123.3 | 120.1 | 117.1 | 109.6 | ||||||||
Provision for credit losses | 0.3 | — | 0.4 | 2.4 | ||||||||
Net interest income after provision for credit losses | 123.0 | 120.1 | 116.7 | 107.2 | ||||||||
Other noninterest income (loss): | ||||||||||||
Net OTTI losses | (0.6 | ) | — | (0.1 | ) | (0.3 | ) | |||||
Net gains (losses) on investment securities | 4.7 | (3.0 | ) | (2.7 | ) | (8.7 | ) | |||||
Net gains (losses) on derivatives and hedging activities | (20.5 | ) | 7.8 | 4.1 | 4.1 | |||||||
Other, net | 6.1 | 7.2 | 6.3 | 6.6 | ||||||||
Total other noninterest income (loss) | (10.3 | ) | 12.0 | 7.6 | 1.7 | |||||||
Other expense | 25.8 | 22.6 | 22.5 | 21.2 | ||||||||
Income before assessments | 86.9 | 109.5 | 101.8 | 87.7 | ||||||||
AHP assessment | 8.7 | 11.0 | 10.2 | 8.8 | ||||||||
Net income | $ | 78.2 | $ | 98.5 | $ | 91.6 | $ | 78.9 | ||||
46
Capital Resources
The following should be read in conjunction with Note 15 - Capital to the audited financial statements in Item 8. Financial Statements and Supplementary Financial Data in this Form 10-K.
Liquidity and Funding. Refer to the Liquidity and Funding Risk section of Risk Management in Item 7. Management’s Discussion and Analysis in this Form 10-K for details.
Capital Plan and Dividends. Refer to the Capital Resources section of Item 1. Business in this Form 10-K for details.
Risk-Based Capital (RBC)
The Finance Agency’s RBC regulatory framework requires the Bank to maintain sufficient permanent capital, defined as retained earnings plus capital stock, to meet its combined credit risk, market risk and operations risk. Each of these components is computed as specified in regulations and directives issued by the Finance Agency.
December 31, | ||||||
(in millions) | 2019 | 2018 | ||||
Permanent capital: | ||||||
Capital stock (1) | $ | 3,398.6 | $ | 4,051.4 | ||
Retained earnings | 1,326.0 | 1,275.9 | ||||
Total permanent capital | $ | 4,724.6 | $ | 5,327.3 | ||
RBC requirement: | ||||||
Credit risk capital | $ | 337.9 | $ | 375.7 | ||
Market risk capital | 131.8 | 577.1 | ||||
Operations risk capital | 140.9 | 285.9 | ||||
Total RBC requirement | $ | 610.6 | $ | 1,238.7 | ||
Excess permanent capital over RBC requirement | $ | 4,114.0 | $ | 4,088.6 | ||
Note: | ||||||
(1) Capital stock includes mandatorily redeemable capital stock. | ||||||
The decrease in the total RBC requirement as of December 31, 2019 is mainly related to the change in the market risk capital component as further described below. The Bank continues to maintain significant excess permanent capital over the RBC requirement. On December 13, 2019, the Bank received final notification from the Finance Agency that it was considered “adequately capitalized” for the quarter ended September 30, 2019. As of the date of this filing, the Bank has not received final notice from the Finance Agency regarding its capital classification for the quarter ended December 31, 2019.
Credit Risk Capital. The Bank’s credit risk capital requirement is the sum of credit risk capital charges computed for assets, off-balance sheet items, and derivative contracts based on the credit risk percentages assigned to each item as determined by the Finance Agency.
Market Risk Capital. The Bank’s market risk capital requirement is the sum of the market value of the Bank’s portfolio at risk from movements in interest rates and the amount, if any, by which the Bank’s current market value of equity is less than 85% of the Bank’s book value of equity as of the measurement calculation date. The Bank calculates the market value of its portfolio at risk and the current market value of its total capital by using a market risk model that is subject to annual independent validation.
The market risk component of the overall RBC framework is designed around a “stress test” approach. Simulations of several hundred historical market interest rate scenarios are generated and, under each scenario, the hypothetical beneficial/adverse effects on the Bank’s current market value of equity are determined. The hypothetical beneficial/adverse effect associated with each historical scenario is calculated by simulating the effect of each set of market conditions upon the Bank’s current risk position, which reflects current assets, liabilities, derivatives and off-balance sheet commitment positions as of the measurement date. From the resulting simulated scenarios, the most severe deterioration in market value of capital is identified as that scenario associated with a probability of occurrence of not more than 1% (i.e., a 99% confidence interval). The
47
hypothetical deterioration in market value of equity in this scenario, derived under the methodology described above, represents the market value risk component of the Bank’s regulatory RBC requirement. The significant decrease in the market risk component in 2019 compared to 2018 was primarily a result of a decrease in the severity of the scenarios modeled as a result of lower interest rates, along with the impact of members exercising their return option on returnable advances. The Finance Agency has issued an Advisory Bulletin effective for RBC reporting beginning with the first quarter of 2020, which revises the market risk scenario methodology and significantly lessens the influence of the level of interest rates on the scenarios modeled.
Operations Risk Capital. The Bank’s operations risk capital requirement as prescribed by Finance Agency regulation is equal to 30% of the sum of its credit risk capital requirement and its market risk capital requirement.
Critical Accounting Policies and Estimates
The Bank’s financial statements are prepared by applying certain accounting policies. Note 1 - Summary of Significant Accounting Policies in the Notes to Financial Statements in Item 8. of this Form 10-K describes the most significant accounting policies used by the Bank. Certain of these policies require management to make estimates or economic assumptions that may prove inaccurate or be subject to variations that may significantly affect the Bank’s reported results and financial position for the period or in future periods.
Fair Value Estimates Based on Pricing Models that use Discounted Cash Flows. Pricing models that use discounted cash flows incorporate assumptions that may have a significant effect on the reported fair values of assets and liabilities and the income and expense related thereto. These assumptions are highly subjective and are based on the best estimates of management regarding the amount and timing of future cash flows, volatility of interest rates and the selection of discount rates that appropriately reflect market and credit risks. The use of different assumptions, as well as changes in market conditions, could result in materially different net income and retained earnings. Pricing models are based on the best estimates of management with respect to:
• | interest rate projections; |
• | discount rates; |
• | prepayments; |
• | market volatility; and |
• | other factors. |
The Bank categorizes financial instruments carried at fair value into a three-level hierarchy. The valuation hierarchy is based upon the transparency (observability) of inputs to the valuation of an asset or liability as of the measurement date. Observable inputs reflect market data obtained from independent sources, while unobservable inputs reflect the Bank’s own assumptions that it believes market participants would use. With respect to fair values of certain assets and liabilities estimated using a pricing model, the inputs used to determine fair value are either observable (e.g., interest rates and yield curves that are observable at commonly quoted intervals, and implied volatilities) or are derived principally from or corroborated by observable market data by correlation or other means.
The Bank regularly validates its pricing models that use discounted cash flows. Such model validations are performed by the Bank’s model risk management department, which is separate from the model owner. In addition, the Bank benchmarks model-derived fair values to those provided by third-parties or alternative internal valuation models. The benchmarking analysis is performed by a group that is separate from the model owner. Results of the model validations and benchmarking analyses, as well as changes to the valuation methodologies and inputs, are reported to the Bank’s Asset and Liability Committee (ALCO) (or subcommittee of), which is responsible for overseeing market risk.
Investment Securities. The Bank uses pricing models that use discounted cash flows to estimate the fair value of its GSE obligations. These investments are classified as AFS or trading and recognized on the Statement of Condition at fair value. The Bank incorporates significant inputs, which include a market-observable interest rate curve and a discount spread, if applicable. The Bank uses the CO curve as the market-observable interest rate curve for its GSE obligations and may also incorporate additional inputs that calibrate the model for market volatility.
Derivatives and Hedged Items. The Bank uses pricing models that use discounted cash flows to estimate the fair value of its derivatives and the benchmark fair value of the related hedged items. Derivatives are recognized on the Statement of Condition at fair value and the hedged items are recognized on the Statement of Condition at benchmark fair value.
48
To estimate the fair value of the derivative, the pricing model utilizes market-observable inputs (inputs that are actively quoted and can be validated to external sources). Inputs are as follows:
•Discount rate assumption. Overnight Index Swap (OIS) curve;
• | Forward interest rate assumption (rates projected in order to calculate cash flows through the designated term of the hedge relationship). LIBOR Swap curve, OIS curve, or SOFR curve; |
• | Volatility assumption. Market-based expectations of future interest rate volatility implied for current market prices for similar options. |
• | TBA security prices for mortgage delivery commitments. Market-based prices of TBAs are determined by coupon class and expected term until settlement and pricing adjustment reflective of the secondary mortgage market. |
The Bank designates eligible advances, investment securities or consolidated obligations as hedged items in fair value hedge relationships. For long-haul hedge relationships, the Bank calculates a gain or loss on the hedged item attributable to changes in the benchmark interest rate being hedged. The change in value associated with the hedged item is calculated each period by projecting future hedged item cash flows based on the fixed interest rate assigned to the hedged item. For floating rate option embedded hedged items, the model projects cash flows utilizing the assigned forward interest rate curve and appropriate option pricing model. The projected future cash flows are then discounted using the rate curves corresponding to the designated benchmark rate plus a discount spread. The discount spread is calculated and set at hedge inception and is the amount added to the discount rate resulting in a fair value of zero at the inception of the hedging relationship.
Accounting for Derivatives. The Bank uses derivative instruments as part of its risk management activities to protect the value of certain assets, liabilities and future cash flows against adverse interest rate movements. The Bank is prohibited by Finance Agency regulation from entering into hedging relationships for speculative purposes.
The accounting for derivatives is subject to complex accounting rules and strict documentation requirements. Proper application of these rules and requirements permits the Bank to utilize the favorable accounting treatment provided by hedge accounting. Not receiving hedge accounting could have a material impact on the Bank’s financial results, including increased earnings volatility.
Derivatives are recognized on the Statement of Condition at fair value, with changes recognized in earnings. The change in fair value of the derivative and benchmark fair value of the hedged item should effectively offset for an effective hedging relationship, which reduces earnings volatility. To qualify for hedge accounting, the hedging relationship must meet certain criteria, which must be documented at inception, and it must be expected to be highly effective. To assess effectiveness, the Bank uses either the short-cut or long-haul method.
Hedging relationships that meet certain criteria qualify for the short-cut method of hedge accounting. In these instances, the Bank may assume that the change in fair value of a hedged item, due to changes in the benchmark rate, exactly offsets the change in fair value of the related derivative. As the hedging relationship is assumed to be perfectly effective, the Bank does not record any hedge ineffectiveness in earnings. The Bank documents at hedge inception its long-haul fallback methodology, including the quantitative method to be used to assess hedge effectiveness if the short-cut method were to no longer be appropriate during the hedging relationship. If the short-cut method is misapplied, the Bank must assess effectiveness using the documented long-haul method and recognize the difference between the fair value of the derivative and benchmark fair value of the hedged item in earnings.
The application of the long-haul method requires an assessment (at least quarterly) of hedge effectiveness. The Bank performs regression analyses to evaluate effectiveness. For hedge relationships that meet certain requirements, subsequent hedge effectiveness assessments may be completed qualitatively. The difference in the change in fair value of the derivative and the change in the benchmark fair value of the hedged item (i.e., hedge ineffectiveness), is recognized in earnings. If the hedging relationship fails effectiveness testing, the derivative loses hedge accounting and is accounted for as an economic derivative.
Derivatives that do not qualify for hedge accounting are referred to as economic derivatives. Economic derivatives require the Bank to recognize the changes in the fair value in earnings without the offset of the benchmark fair value of the hedged items and result in increased earnings volatility.
Certain of the Bank’s economic derivatives are used to hedge instruments that are recorded at fair value. These transactions are not required to comply with the complex hedge accounting rules and result in a similar impact on earnings as an effective derivative.
49
Recent Accounting Developments. See Note 2 - Changes in Accounting Principle and Recently Issued Accounting Standards and Interpretations to the audited financial statements in Item 8. Financial Statements and Supplementary Financial Data in this Form 10-K. Note 2 contains information on new accounting pronouncements impacting the 2019 financial statements or that will become effective for the Bank in future periods.
Legislative and Regulatory Developments
Advisory Bulletin 2020-01 FHLBank Risk Management of Acquired Member Assets (AMA). On January 31, 2020, the Finance Agency released guidance on risk management of acquired member assets. The guidance communicates the Finance Agency’s expectations with respect to an FHLBank’s funding of its members through the purchase of eligible mortgage loans and includes expectations that an FHLBank will have board-established limits on AMA portfolios and management-established thresholds to serve as monitoring tools to manage AMA-related risk exposure. The guidance provides that the board of an FHLBank should ensure that the FHLBank serves as a liquidity source for members, and it should ensure that its portfolio limits do not result in the FHLBank’s acquisition of mortgages from smaller members being “crowded out” by the acquisition of mortgages from larger members. The advisory bulletin contains the expectation that the board of an FHLBank should set limits on the size and growth of portfolios and on acquisitions from a single participating financial institution. In addition, the guidance sets forth that the board of an FHLBank should consider concentration risk in the areas of geographic area, high-balance loans, and in third-party loan originations. The Bank continues to evaluate the potential impact of this advisory bulletin on its financial condition and results of operations.
Finance Agency Proposed Amendments to Stress Test Rule. On December 16, 2019, the Finance Agency published a proposed rule amending its stress testing rule, consistent with section 401 of the Economic Growth, Regulatory Relief, and Consumer Protection Act of 2018 (EGRRCPA), to (i) raise the minimum threshold to conduct periodic stress tests for entities regulated by the Finance Agency from those with consolidated assets of more than $10 billion to those with consolidated assets of more than $250 billion; (ii) remove the requirements for FHLBanks to conduct stress tests; and (iii) remove the adverse scenario from the list of required scenarios. The proposed rule maintains the Finance Agency’s discretion to require that an FHLBank with total consolidated assets below the $250 billion threshold conduct stress testing. The proposed amendments align the Finance Agency’s stress testing rules with rules adopted by other financial institution regulators that implement the Dodd-Frank Wall Street Reform and Consumer Protection Act stress testing requirements, as amended by the EGRRCPA. The results of the Bank’s most recent annual severely adverse economic conditions stress test were published to the Bank’s public website on November 15, 2019. If the rule is adopted as proposed, it will eliminate these stress testing requirements for FHLBanks, unless the Finance Agency exercises its discretion to require stress testing in the future. The Bank does not expect this rule, if adopted as proposed, to have a material effect on the Bank’s financial condition or results of operations.
FDIC Brokered Deposits Restrictions. On December 12, 2019, the FDIC issued a proposed rule to amend its brokered deposits restrictions that apply to less than well capitalized insured depository institutions. The FDIC states that the proposed amendments are intended to modernize its brokered deposit regulations and would establish a new framework for analyzing whether deposits placed through deposit placement arrangements qualify as brokered deposits. These deposit placement arrangements include those between insured depository institutions and third parties, such as financial technology companies, for a variety of business purposes, including access to deposits. By creating a new framework for analyzing certain provisions of the “deposit broker” definition, including shortening the list of activities considered “facilitating” and expanding the scope of the “primary purpose” exception, the proposed rule would narrow the definition of “deposit broker” and exclude more deposits from treatment as “brokered deposits.” The proposed rule would also establish an application and reporting process with respect to the primary purpose exception. The Bank does not expect this rule, if adopted as proposed, to materially affect the Bank’s financial condition or results of operations.
Finance Agency Supervisory Letter - Planning for LIBOR Phase-Out. On September 27, 2019, the Finance Agency issued a Supervisory Letter (the Supervisory Letter) to the FHLBanks that the Finance Agency stated is designed to ensure the FHLBanks will be able to identify and prudently manage the risks associated with the termination of LIBOR in a safe and sound manner. The Supervisory Letter provides that the FHLBanks should, by March 31, 2020, cease entering into new LIBOR referenced financial assets, liabilities, and derivatives with maturities beyond December 31, 2021 for all product types except investments. With respect to investments, the FHLBanks must, by December 31, 2019, stop purchasing investments that reference LIBOR and mature after December 31, 2021. These phase-out dates do not apply to collateral accepted by the FHLBanks. The Supervisory Letter also directs the FHLBanks to update their pledged collateral certification reporting requirements by March 31, 2020 in an effort to encourage members to distinguish LIBOR-linked collateral maturing after December 31, 2021.
50
As a result of the Supervisory Letter, the Bank expects to suspend transactions in certain advances with terms directly linked to LIBOR that mature after December 31, 2021. In addition, the Bank has ceased entering into derivatives with swaps, caps, or floors indexed to LIBOR that terminate after December 31, 2021. The Bank has already ceased purchasing investments that reference LIBOR and mature after December 31, 2021. The Bank does not expect the Supervisory Letter to have a material impact on the Bank’s financial condition or results of operations.
Finance Agency Advisory Bulletin 2019-03 - Capital Stock Management. On August 14, 2019, the Finance Agency issued an Advisory Bulletin providing for each FHLBank to maintain a ratio of at least two percent of capital stock to total assets in order to help preserve the cooperative structure incentives that encourage members to remain fully engaged in the oversight of their investment in the Bank. In February 2020, the Finance Agency began to consider the proportion of capital stock to assets, measured on a daily average basis at month end, when assessing each FHLBank’s capital management practices. The Bank does not expect the Advisory Bulletin to have a material impact on the Bank’s capital management practices, financial condition, and/or results of operations.
Final Rule on FHLBank Capital Requirements. On February 20, 2019, the Finance Agency published a final rule, effective January 1, 2020, that adopted, with amendments, the regulations of the Federal Housing Finance Board (predecessor to the Finance Agency) (the Finance Board) pertaining to the capital requirements for the FHLBanks. The final rule carries over most of the prior Finance Board regulations without material change but substantively revises the credit risk component of the risk-based capital requirement, as well as the limitations on extensions of unsecured credit. The main revisions remove requirements that the Bank calculate credit risk capital charges and unsecured credit limits based on ratings issued by a Nationally Recognized Statistical Rating Organization (NRSRO), and instead require that the Bank establish and use its own internal rating methodology (which may include, but not solely rely on, NRSRO ratings). The rule imposes a new credit risk capital charge for cleared derivatives. The final rule also revises the percentages used in the regulation’s tables to calculate credit risk capital charges for advances and for non-mortgage assets. The final rule also rescinds certain contingency liquidity requirements that were part of the Finance Board regulations, as these requirements are now addressed in an Advisory Bulletin on FHLBank Liquidity Guidance issued by the Finance Agency in 2018. The Bank does not expect this rule to materially affect the Bank’s financial condition or results of operations.
FDIC Final Rule on Reciprocal Deposits. On February 4, 2019, the FDIC published a final rule, effective March 6, 2019, related to the treatment of “reciprocal deposits,” which implements Section 202 of the EGRRCPA. The final rule exempts, for certain insured depository institutions (depositories), certain reciprocal deposits (deposits acquired by a depository from a network of participating depositories that enables depositors to receive FDIC insurance coverage for the entire amount of their deposits) from being subject to FDIC restrictions on brokered deposits. Under the rule, well-capitalized and well-rated depositories are not required to treat reciprocal deposits as brokered deposits up to the lesser of twenty percent of their total liabilities or $5 billion. Reciprocal deposits held by depositories that are not well-capitalized and well-rated may also be excluded from brokered deposit treatment in certain circumstances. The Bank does not expect the rule to materially affect the Bank’s financial condition or results of operations. The rule could, however, enhance depositories’ liquidity by increasing the attractiveness of deposits that exceed FDIC insurance limits. This could affect the demand for certain advance products.
In 2019 and 2020, certain developments applicable to swaps occurred:
Uncertainty Regarding Brexit. In June 2016, the United Kingdom (the UK) voted in favor of leaving the European Union (the EU), and in March 2017, Article 50 of the Lisbon Treaty was invoked, commencing a period of negotiations between the UK and the European Council for the UK’s withdrawal from the EU, which was subsequently extended by the European Council members in agreement with the UK. On January 31, 2020, the UK withdrew from the EU under the European Union Withdrawal Agreement Act 2020, with a transition period to last until December 31, 2020, which period may be extended for an additional two years. During this transition period, the UK and the EU will negotiate the details of their future relationship, including what conditions will apply to EU-based entities that want to do business with the UK, and vice versa, after the transition period. From time to time the Bank may have exposure to UK-based and EU-based counterparties and a UK-based derivatives clearing organization for our cleared derivatives. At this time, it is not possible to predict the date on which the transition period will end or whether any agreement reached between the UK and the EU will have a material adverse effect on the financial instruments the Bank has with these counterparties or on its derivatives cleared in the UK.
Commodity Futures Trading Commission (CFTC) No-action Relief for LIBOR Amendments. On December 17, 2019, three divisions of the CFTC issued no-action letters to provide relief with respect to the transition away from LIBOR and other interbank offered rates (IBORs). Among other forms of relief, the letters, subject to certain limitations:
(i) permit registered swap dealers, major swap participants, security-based swap participants, and major security-based swap participants (covered swap entities) to amend an uncleared swap entered into before the compliance date of the
51
CFTC’s uncleared swap margin requirements (such swap, a legacy swap, and such requirements, the CFTC margin rules) to include LIBOR or other IBOR fallbacks without the legacy swap becoming subject to the CFTC margin rules; and
(ii) provide time-limited relief, until December 31, 2021, for (a) swaps that are not subject to the central clearing requirement because they were executed prior to the relevant compliance date and (b) swaps that are subject to the trade execution requirement to be amended to include LIBOR or other IBOR fallbacks without becoming subject to such clearing or trade execution requirements.
The Bank believes this relief may assist in the market’s and the Bank’s transition away from LIBOR.
Margin and Capital Requirements for Covered Swap Entities. On November 7, 2019, the Office of the Comptroller of the Currency, the Federal Reserve, the FDIC, the Farm Credit Administration and the Finance Agency (collectively, the Agencies) jointly published a proposed rule that would amend the Agencies’ regulations that established minimum margin and capital requirements for uncleared swaps (the prudential margin rules) for covered swap entities under the jurisdiction of one of the Agencies. In addition to other changes, the proposed amendments would permit those uncleared swaps entered into by a covered swap entity before the compliance date of the prudential margin rules to retain their legacy status and not become subject to the prudential margin rules in the event that they are amended to replace LIBOR or another rate that is reasonably expected to be discontinued or is reasonably determined to have lost its relevance as a reliable benchmark due to a significant impairment. Among other things, the proposed rule would also amend the prudential margin rules to (i) extend the phase-in compliance date of the covered swap entities for initial margin requirements from September 1, 2020 to September 1, 2021 for counterparties with an average daily aggregate notional amount (AANA) of non-cleared swaps from $8 billion to $50 billion, (ii) clarify that a covered swap entity does not have to execute initial margin trading documentation with a counterparty prior to the time that the counterparty is required to collect or post initial margin, and (iii) permit legacy swaps to retain their legacy status and not become subject to the prudential margin rules in the event that they are amended due to certain life-cycle activities, such as reductions of notional amounts or portfolio compression exercises.
On October 24, 2019, the CFTC proposed an amendment to its CFTC margin rules, which among other changes, would similarly extend the phase-in compliance date for initial margin requirements from September 1, 2020 to September 1, 2021 for counterparties with an AANA of non-cleared swaps from $8 billion to $50 billion. The Bank does not expect any of the foregoing proposed amendments, if adopted as proposed, to have a material effect on the Bank’s financial condition or results of operations.
CFTC Advisory on Initial Margin Documentation Requirements. On July 9, 2019, the CFTC issued an advisory (the Advisory) on the CFTC margin rules to clarify that documentation governing the posting, collection, and custody of initial margin is not required to be completed until entities that are in scope for exchanging initial margin under the uncleared margin rules have an aggregate unmargined exposure to a counterparty (and its margin affiliates) that exceeds an initial margin threshold of $50 million. The Advisory instructs CFTC covered swap entities to closely monitor initial margin amounts if they are approaching the $50 million initial margin threshold with a counterparty and to take appropriate steps to ensure that the required documentation is in place at such time as the threshold is reached. The Bank is not yet in scope for exchanging initial margin, but will closely monitor the initial margin thresholds on a counterparty-by-counterparty basis when required. The Bank does not currently expect its documentation requirements to change based on the clarification to the CFTC margin rules provided by the CFTC Advisory.
Risk Management
The Bank employs a corporate governance and internal control framework designed to support the effective management of the Bank’s business activities and the related inherent risks. As part of this framework, the Board has approved a Risk Governance Policy and a Member Products Policy, both of which are reviewed regularly and re-approved at least annually. The Risk Governance Policy establishes risk guidelines, limits (if applicable), and standards for credit risk, market risk, liquidity risk, business risk and various forms of operational and technology risk, in accordance with Finance Agency regulations and consistent with the Bank’s risk appetite. The Member Products Policy establishes the eligibility and authorization requirements, policy limits and restrictions, and the terms applicable to each type of Bank product or service, as well as collateral requirements. The risk appetite is established by the Board, as are other applicable guidelines in connection with the Bank’s Capital Plan and overall risk management.
52
Risk Governance
The Bank’s lending, investment and funding activities and use of derivative instruments expose the Bank to a number of risks that include market and interest rate risk, credit and counterparty risk, liquidity and funding risk, and operational and business risks. These include risks such as use and reliance on models and end-user computing tools, technology and information security risk, among others. In addition, the Bank’s risks are affected by current and projected financial and residential mortgage market trends including those described in Item 1A. Risk Factors in this Form 10-K.
The Bank believes that a strong and dynamic risk management process serves as a base for building member value in the cooperative. The Bank has a risk management infrastructure that addresses risk governance, appetite, measurement and assessment, and reporting, along with top and emerging risks, as follows:
• | the Bank’s policies and committees provide effective governance over the risk management process; |
• | the Bank’s risk appetite is integrated with the strategic plan and reinforced through management initiatives; |
• | all material risk exposures have been reviewed to establish a robust set of key indicators, many with associated limits and guidelines; |
• | the Bank has a risk reporting system that provides for management and Board oversight of risk and a clear understanding of risks that the Bank faces; and |
• | management and the Board are actively engaged in surveying and assessing top and emerging risks. |
Top risks are existing, material risks the Bank faces; these are regularly reviewed and actively managed. Emerging risks are those risks that are new or evolving forms of existing risks; once identified, potential action plans are considered based on probability and severity.
The Board and its committees have adopted a comprehensive risk governance framework to oversee the risk management process and manage the Bank’s risk exposures which is shown in the chart below. All Board members are provided training dealing with the specific risk issues relevant to the Bank.
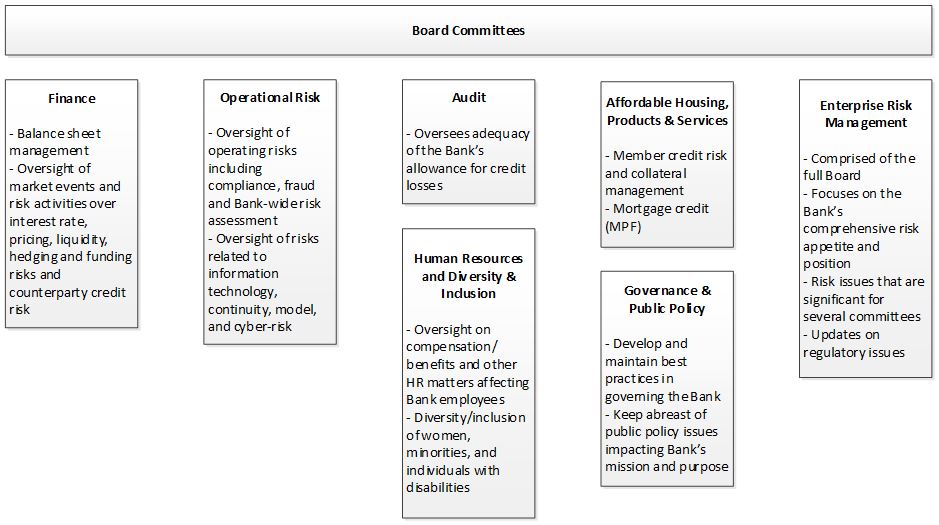
As previously mentioned, key components of this risk governance framework are the Board-level Member Products Policy and Risk Governance Policy. The Member Products Policy, which applies to products offered to members and housing associates, addresses the credit risk of secured credit by establishing appropriate collateralization levels and collateral valuation methodologies. The Risk Governance Policy establishes risk limits for the Bank in accordance with the risk profile established by the Board, Finance Agency regulations, credit underwriting criteria, and other applicable guidelines. The magnitude of the risk limits reflects the Bank’s risk appetite given the market environment, the business strategy and the financial resources available to absorb potential losses. The limits are reviewed and continually re-evaluated with adjustments requiring Board
53
approval and processes are included in the Risk Governance Policy. All breaches of risk limits are reported in a timely manner to the appropriate Board and senior management and the affected business unit must take appropriate action, as applicable, to rationalize and/or reduce affected positions. The risk governance framework also includes supplemental risk management policies and procedures that are reviewed on a regular basis to ensure that they provide effective governance of the Bank’s risk-taking activities.
As noted above, the Board and its Operational Risk Committee have oversight of the Bank’s cyber-security program. On an ongoing basis, the Board receives updates on the program’s maturity, independent third party assessments periodically performed, emerging threats and notable cyber events. Additionally, the Bank performs an advanced penetration test that is composed of blended attacks against the Bank, emulating an advanced, real-world adversary, targeting the organization in a persistent manner. The results of these attacks along with management’s response are shared with the Board.
In addition, the Bank has management committees which provide oversight and operational support in managing its risks.
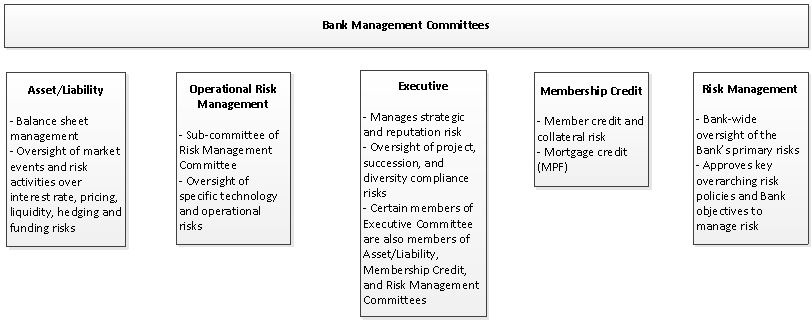
Further, Internal Audit provides an assessment of the internal control systems. Internal Audit activities are designed to provide reasonable assurance for the Board that: (1) risks are appropriately identified and managed; (2) significant financial, managerial and operating information is materially accurate, reliable and timely; and (3) employees’ actions are in compliance with Bank policies, standards, procedures and applicable laws and regulations. Additionally, as a GSE, the Bank is subject to a comprehensive examination by the Finance Agency which executes its responsibilities via onsite examinations, periodic offsite evaluations, and through monitoring of the various compliance and activity reports provided by the Bank.
Capital Adequacy Measures. MV/CS provides a current assessment of the liquidation value of the balance sheet and measures the Bank’s current ability to honor the par put redemption feature of its capital stock. This is one of the risk metrics used to evaluate the adequacy of retained earnings which is used to develop dividend payment recommendations and support the repurchase of excess capital stock.
The current Board-approved floor for MV/CS is 90.0%. MV/CS is measured against the floor monthly. When MV/CS is below the established floor, excess capital stock repurchases and dividend payouts are restricted.
The MV/CS ratio was 145.1% at December 31, 2019 and 134.0% at December 31, 2018. The increase was primarily due to the decrease in capital stock as a result of lower advances, as well as growth in retained earnings and funding spread changes.
Subprime and Nontraditional Loan Exposure. The Bank policy definitions of subprime and nontraditional residential mortgage loans and securities are consistent with FFIEC and Finance Agency guidance. According to policy, the Bank does not accept subprime residential mortgage loans (defined as FICO score of 660 or below) as qualifying collateral unless certain mitigating factors are met. The Bank requires members to identify the amount of subprime and nontraditional mortgage collateral in their QCR each quarter and provide periodic certification that they comply with the FFIEC guidance. See the Credit and Counterparty Risk - TCE and Collateral discussion in Risk Management in Item 7. Management’s Discussion and Analysis in this Form 10-K for specific requirements regarding subprime and nontraditional loan collateral.
54
Results of the Finance Agency Stress Tests Severely Adverse Scenario. The Finance Agency requires the FHLBanks to conduct annual stress testing to determine whether the FHLBanks have the capital necessary to absorb losses under adverse economic conditions. The FHLBanks must also consider the results when making changes to capital structure; when assessing exposures, concentrations, and risk positions; and in improving overall risk management. The Finance Agency provides the inputs and key assumptions, and the results should not be viewed as a forecast of expected likely outcomes of future results. Results were projected over a nine-quarter period from the first quarter of 2019 to the first quarter of 2021, starting with December 31, 2018 balances.
In addition, the FHLBanks are required to disclose the results of the severely adverse stress test scenario. The Bank disclosed on its website the results of the severely adverse stress test scenario on November 15, 2019. The Bank's severely adverse stress test scenario results demonstrated capital adequacy as projected regulatory capital and leverage capital ratios exceeded regulatory requirements. The Bank regularly uses stress tests including those required by the Dodd-Frank Act in capital planning to measure the exposure to material risks and to evaluate the adequacy of capital resources available to absorb potential losses arising from those risks. The Finance Agency has proposed amendments to the stress test rule. Refer to Legislative and Regulatory Developments in this Item 7. for more information.
Qualitative and Quantitative Disclosures Regarding Market Risk
Managing Market Risk. The Bank’s market risk management objective is to protect member/shareholder and bondholder value consistent with the Bank’s housing mission and safe and sound operations across a wide range of interest rate environments. Management believes that a disciplined approach to market risk management is essential to maintaining a strong capital base and uninterrupted access to the capital markets.
Market risk is defined as the risk to earnings or capital arising from adverse changes in market rates, prices and other relevant market factors. Interest rate risk, which represents the primary market risk exposure to the Bank, is the risk that relative and absolute changes in prevailing interest rates may adversely affect an institution’s financial performance or condition. Interest rate risk arises from a variety of sources, including repricing risk, yield curve risk, basis risk and options risk. The Bank invests in mortgage assets, such as mortgage loans and MBS, which together represent the primary source of options risk. Management regularly reviews the estimated market risk of the entire portfolio of assets and related funding and hedges to assess the need for re-balancing strategies. These re-balancing strategies may include entering into new funding and hedging transactions, terminating existing funding and hedging transactions, or forgoing or modifying certain funding or hedging transactions normally executed with asset acquisition or debt issuance.
The Bank’s Market Risk Model. Significant resources are devoted to ensuring that the level of market risk in the balance sheet is accurately measured, thus allowing management to monitor the risk against policy and regulatory limits. The Bank uses externally developed models to evaluate its financial position and market risk. One of the most critical market-based models relates to the prepayment of principal on mortgage-related instruments. Management regularly reviews the major assumptions and methodologies used in its models, as well as the performance of the models relative to empirical results, so that appropriate changes to the models can be made.
The Bank regularly validates the models used to measure market risk. Such model validations are performed by the Bank’s model risk management department, which is separate from the model owner. These model validations may include third-party specialists when appropriate. The model validations are supplemented by performance monitoring by the model owner which is reported to the Bank’s model risk management department. In addition, the Bank benchmarks model-derived fair values to those provided by third-party services or alternative internal valuation models. The benchmarking analysis is performed by a group that is separate from the model owner. Results of the model validations and benchmarking analysis, as well as any changes to the valuation methodologies and inputs, are reported to the Bank’s ALCO (or subcommittee of) which is responsible for overseeing market risk.
Duration of Equity. One key risk metric used by the Bank is duration. Duration is a measure of the sensitivity of a financial instrument’s value, or the value of a portfolio of instruments, to a 100 basis point parallel shift in interest rates. Duration (typically expressed in years) is commonly used by investors throughout the fixed income securities market as a measure of financial instrument price sensitivity.
The Bank’s asset/liability management policy approved by the Board calls for actual duration of equity to be maintained within a + 4.5 year range in the base case. In addition, the duration of equity exposure limit in an instantaneous parallel interest rate shock of + 200 basis points is + 7 years. Management analyzes the duration of equity exposure against this policy limit on a daily basis and regularly evaluates its market risk management strategies.
55
The following table presents the Bank's duration of equity exposure at December 31, 2019 and December 31, 2018. Given the low level of interest rates, an instantaneous parallel interest rate shock of "down 200 basis points" could not be meaningfully measured for these periods and therefore is not presented.
(in years) | Down 100 basis points | Base Case | Up 100 basis points | Up 200 basis points |
Actual Duration of Equity: | ||||
December 31, 2019 | 0.1 | 0.1 | 1.3 | 2.3 |
December 31, 2018 | (0.3) | 0.1 | 0.3 | 0.5 |
Duration of equity changes in 2019 were primarily the result of lower interest rates and balance sheet management actions (e.g. funding and hedging decisions). The Bank continues to monitor the mortgage and related fixed-income markets, including the impact that changes in the market or anticipated modeling changes may have on duration of equity and other market risk measures and may take actions to reduce market risk exposures as needed. Management believes that the Bank's current market risk profile is reasonable given these market conditions.
Return on Equity (ROE) Spread Volatility. Interest rate risk is also measured based on the volatility in the Bank’s projected return on capital in excess of the return of an established benchmark market index. ROE spread is defined as the Bank's return on average equity, including capital stock and retained earnings, in excess of the average of 3-month LIBOR. ROE spread volatility is a measure of the variability of the Bank’s projected ROE spread in response to shifts in interest rates and represents the change in ROE spread compared to an ROE spread that is generated by the Bank in its base forecasting scenario. ROE spread volatility is measured over a rolling forward 12 month period for selected interest rate scenarios and excludes the income sensitivity resulting from mark-to-market changes which are separately described below.
The ROE spread volatility presented in the table below reflects spreads relative to 3-month LIBOR. Management uses both parallel and non-parallel rate scenarios to assess interest rate risk. The steeper and flatter yield curve shift scenarios are represented by appropriate increases and decreases in short-term and long-term interest rates using the three-year point on the yield curve as the pivot point. Given the low rate environment, management replaced a "down 200 basis points parallel rate" scenario with a "down 100 basis point longer term rate" shock as an additional non-parallel rate scenario that reflects a decline in longer-term rates.
ROE Spread Volatility Increase/(Decline) | |||||
(in basis points) | Down 100 bps Longer Term Rate Shock | Down 100 bps Parallel Shock | 100 bps Steeper | 100 bps Flatter | Up 200 bps Parallel Shock |
December 31, 2019 | (22) | 22 | 53 | (9) | (18) |
December 31, 2018 | (1) | (16) | (15) | 23 | 23 |
Changes in ROE spread volatility in 2019 primarily reflect the impact of lower interest rates and balance sheet management actions (e.g. funding and hedging decisions). For each scenario, the Board's limit on the decline in ROE spread is set at no greater than 100 basis points. The Bank was in compliance with the ROE spread volatility limit across all selected interest rate shock scenarios at December 31, 2019 and December 31, 2018.
Mark-to-Market Risk. The Bank measures earnings risk associated with certain mark-to-market positions, including economic hedges. This framework measures forward-looking, scenario-based exposure based on interest rate and volatility shocks that are applied to any existing transaction that is marked to market through the income statement without an offsetting mark arising from a qualifying hedge relationship. In addition, the Bank’s Capital Markets and Corporate Risk Management departments monitor the actual profit/loss change on a daily, monthly cumulative, and quarterly cumulative basis. The Bank's ALCO monitors mark-to-market risk through a daily exposure guideline and quarterly profit/loss reporting trigger.
Derivatives and Hedging Activities. Members may obtain loans through a variety of product types that include features such as variable- and fixed-rate coupons, overnight to 30-year maturities, and bullet or amortizing redemption schedules. The Bank funds loans primarily through the issuance of consolidated obligation bonds and discount notes. The terms and amounts of these consolidated obligations and the timing of their issuance is determined by the Bank and is subject to investor demand as well as FHLBank System debt issuance policies. The intermediation of the timing, structure, and amount of Bank members’ credit needs with the investment requirements of the Bank’s creditors is made possible by the extensive use of interest rate derivatives. The Bank’s general practice is to simultaneously execute interest rate swaps or other derivative transactions when
56
extending term and option-embedded advances and/or issuing liabilities to convert the instruments’ cash flows to a floating-rate that is indexed to LIBOR, OIS or SOFR. By doing so, the Bank strives to reduce its interest rate risk exposure and preserve the value of, and attempts to earn more stable returns on, its members’ capital investment.
The Bank may also acquire assets with structural characteristics that reduce the Bank’s ability to enter into interest rate exchange agreements having mirror image terms. These assets can include small fixed-rate, fixed-term loans and small fixed schedule amortizing loans. These assets may require the Bank to employ risk management strategies in which the Bank hedges the aggregated risks. The Bank may use fixed-rate, callable or non-callable debt or interest rate swaps to manage these aggregated risks.
The use of derivatives is integral to the Bank’s financial management strategy, and their impact on the Bank’s financial statements is significant. Management has a risk management framework that outlines the permitted uses of derivatives that adjusts the effective maturity, repricing frequency or option characteristics of various financial instruments to achieve the Bank’s risk and earnings objectives. The Bank utilizes derivatives to hedge identifiable risks; none are used for speculative purposes.
The Bank uses derivatives as follows: (1) by designating them as either a fair value hedge of an underlying financial instrument or a firm commitment; or (2) in asset/liability management (i.e., an economic hedge). For example, the Bank uses derivatives in its overall interest rate risk management to adjust the interest rate sensitivity of consolidated obligations to approximate more closely the interest rate sensitivity of assets (advances, investment securities, and mortgage loans), and/or to adjust the interest rate sensitivity of advances, investment securities, or mortgage loans to approximate more closely the interest rate sensitivity of liabilities. In addition to using derivatives to hedge mismatches of interest rates between assets and liabilities, the Bank also uses derivatives to hedge: (1) embedded options in assets and liabilities; (2) the market value of existing assets and liabilities and anticipated transactions; or (3) the duration risk of prepayable instruments. See Note 11 - Derivatives and Hedging Activities of the audited financial statements in Item 8. Financial Statements and Supplementary Financial Data in this Form 10-K for additional information regarding the Bank’s derivative and hedging activities.
57
The following tables summarize the derivative instruments, along with the specific hedge transaction utilized to manage various interest rate and other risks as noted below.
Hedged Item/Hedging Instrument | Hedging Objective | Hedge Accounting Designation (1) | Notional Amount at December 31, 2019 (in billions) | ||
Advances | |||||
Pay-fixed, receive floating interest rate swap (without options) | Converts the advance’s fixed rate to a variable rate index. | Fair Value | $ | 16.5 | |
Economic | 0.6 | ||||
Subtotal - advances | $ | 17.1 | |||
Investments | |||||
Pay-fixed, receive floating interest-rate swap | Converts the investment’s fixed rate to a variable-rate index. | Fair Value | $ | 1.3 | |
Economic | 3.6 | ||||
Interest-rate cap or floor | Offsets the interest-rate cap or floor embedded in a variable rate investment. | Economic | 1.3 | ||
Subtotal - investments | $ | 6.2 | |||
Mortgage Loans | |||||
Pay-fixed, receive floating interest rate swap | Converts the mortgage loan’s fixed rate to a variable rate index. | Economic | $ | 0.2 | |
Consolidated Obligation Bonds | |||||
Receive-fixed, pay floating interest rate swap (without options) | Converts the bond’s fixed rate to a variable rate index. | Fair Value | $ | 14.4 | |
Economic | 0.8 | ||||
Receive-fixed, pay floating interest rate swap (with options) | Converts the bond’s fixed rate to a variable rate index and offsets option risk in the bond. | Fair Value | 2.2 | ||
Economic | 0.5 | ||||
Receive-float with embedded features, pay floating interest rate swap (callable) | Reduces interest rate sensitivity and repricing gaps by converting the bond’s variable rate to a different variable rate index and/or offsets embedded option risk in the bond. | Fair Value | 0.1 | ||
Economic | 0.1 | ||||
Receive-float, pay-float basis swap | Reduces interest-rate sensitivity and repricing gaps by converting the bond’s variable rate to a different variable rate index. | Economic | 0.4 | ||
Subtotal - consolidated obligation bonds | $ | 18.5 | |||
Consolidated Obligation Discount Notes | |||||
Receive-fixed, pay floating interest rate swap | Converts the discount note’s fixed rate to a variable-rate index. | Economic | $ | 4.4 | |
Total notional amount | $ | 46.4 | |||
Note:
(1) The Fair Value designation represents hedging strategies for which qualifying hedge accounting is achieved. The Economic designation represents hedging strategies for which qualifying hedge accounting is not achieved.
58
Credit and Counterparty Risk - Total Credit Exposure (TCE) and Collateral
TCE. The Bank manages the credit risk of each member on the basis of the member’s TCE to the Bank, which includes advances and related accrued interest, fees, basis adjustments and estimated prepayment fees; letters of credit; forward-dated advance commitments; and MPF credit enhancement and related obligations. This credit risk is managed by monitoring the financial condition of borrowers and by requiring all borrowers (and, where applicable in connection with member affiliate pledge arrangements approved by the Bank, their affiliates) to pledge sufficient eligible collateral for all borrower obligations to the Bank to ensure that all potential forms of credit-related exposures are covered by sufficient eligible collateral. At December 31, 2019, aggregate TCE was $84.7 billion, comprised of approximately $65.4 billion in advance principal outstanding, $18.8 billion in letters of credit (including forward commitments), $0.4 billion in advance commitments, accrued interest, prepayment fees, MPF credit enhancement obligations and other fees.
The Bank establishes an MBC for each member based on collateral weightings applied to eligible collateral as described in the Bank’s Member Products Policy. Details regarding this policy are available in the Advance Products discussion in Item 1. Business in this Form 10-K. According to the Policy, eligible collateral is weighted to help ensure that the collateral value will exceed the amount that may be owed to the Bank in the event of a default. The Bank also has the ability to call for additional or substitute collateral while any indebtedness is outstanding to protect the Bank’s fully secured position. At December 31, 2019 and 2018, on a borrower-by-borrower basis, the Bank had a perfected security interest in eligible collateral with an estimated collateral value (after collateral weightings) in excess of the book value of all members’ and nonmember housing associates’ obligations to the Bank.
The financial condition of all members and eligible non-member housing associates is closely monitored for compliance with financial criteria as set forth in the Bank’s credit policies. The Bank has developed an ICR system that calculates financial scores and rates member institutions on a quarterly basis using a numerical rating scale from one to ten, with one being the best rating. Generally, scores are objectively calculated based on financial ratios computed from publicly available data. The scoring system gives the highest weighting to the member’s asset quality and capitalization. Other key factors include earnings and balance sheet composition. Operating results which include net income, capital levels, reserve coverage and other factors for the previous four quarters are used. The most recent quarter’s results are given a higher weighting. Additionally, a member’s credit score can be adjusted for various qualitative factors, such as the financial condition of the member’s holding company. A rating in one of the higher number (i.e., worse) categories indicates that a member exhibits well defined financial weaknesses as described in the Bank’s policy. Members in these categories are reviewed for potential collateral delivery status. Other uses of the ICR include the scheduling of on-site collateral reviews. Insurance company members are rated on the same credit scale as depository institutions, but the analysis includes both quantitative and qualitative factors. While depository institution member analysis is based on standardized regulatory Call Report data and risk modeling, insurance company credit risk analysis is based on various forms of financial data, including, but not limited to, statutory reporting filed by insurance companies with state insurance regulators, which requires specialized methodologies and dedicated underwriting resources.
Management believes that it has adequate policies and procedures in place to effectively manage credit risk exposure related to member TCE. These credit and collateral policies balance the Bank’s dual goals of meeting members’ needs as a reliable source of liquidity and limiting credit loss by adjusting the credit and collateral terms in response to deterioration in creditworthiness. The Bank has never experienced a loss on its advance exposure.
59
The following table presents the Bank’s top five financial entities with respect to their TCE at December 31, 2019.
December 31, 2019 | |||||
(dollars in millions) | TCE | % of Total | |||
PNC Bank, National Association, DE (1) | $ | 16,371.0 | 19.3 | % | |
Ally Bank, UT (2) | 16,319.7 | 19.3 | |||
TD Bank, National Association, DE | 10,604.9 | 12.5 | |||
JP Morgan Chase Bank, N.A., OH (3) | 8,009.4 | 9.5 | |||
Santander Bank, National Association, DE (4) | 7,916.8 | 9.4 | |||
59,221.8 | 70.0 | ||||
Other financial institutions | 25,462.3 | 30.0 | |||
Total TCE outstanding | $ | 84,684.1 | 100.0 | % | |
Notes:
(1) For Bank membership purposes, principal place of business is Pittsburgh, PA.
(2) For Bank membership purposes, principal place of business is Horsham, PA.
(3) In the second quarter of 2019, the Bank’s member Chase Bank USA, N.A. merged into JP Morgan Chase Bank, N.A. a non-member of the Bank.
(4) Santander Bank, N.A. is a subsidiary of Banco Santander, which is located in Spain.
Advance Concentration Risk. The following table lists the Bank’s top five borrowers based on advance balances at par as of December 31, 2019.
December 31, 2019 | |||||
(dollars in millions) | Advance Balance | % of Total | |||
PNC Bank, National Association, DE (1) | $ | 16,340.0 | 25.0 | % | |
Ally Bank, UT (2) | 16,275.0 | 24.9 | |||
JP Morgan Chase Bank, N.A., OH (3) | 8,000.0 | 12.2 | |||
Santander Bank, National Association, DE (4) | 7,035.0 | 10.7 | |||
First National Bank of Pennsylvania, PA | 3,190.0 | 4.9 | |||
50,840.0 | 77.7 | ||||
Other borrowers | 14,599.1 | 22.3 | |||
Total advances | $ | 65,439.1 | 100.0 | % | |
Notes:
(1) For Bank membership purposes, principal place of business is Pittsburgh, PA.
(2) For Bank membership purposes, principal place of business is Horsham, PA.
(3) In the second quarter of 2019, the Bank’s member Chase Bank USA, N.A. merged into JP Morgan Chase Bank, N.A. a non-member of the Bank.
(4) Santander Bank, N.A. is a subsidiary of Banco Santander, which is located in Spain.
The average 2019 balances for the five largest borrowers totaled $56.6 billion, or 78.5% of total average advances outstanding. The advances made by the Bank to each of these borrowers are secured by collateral with an estimated value, after collateral weightings, in excess of the book value of the advances. The Bank has implemented specific credit and collateral review monitoring for these members.
Letters of Credit. The letter of credit product is collateralized under the same policies, procedures and guidelines that apply to advances. Outstanding letters of credit totaled $17.4 billion at December 31, 2019 and $20.2 billion at December 31, 2018, primarily related to public unit deposits. Available master standby letters of credit of $1.4 billion and $1.0 billion at December 31, 2019 and December 31, 2018, are also not included in these totals. At December 31, 2019, the Bank had a concentration of letters of credit with one member (TD Bank) totaling $9.8 billion or 56.3% of the total amount. At December 31, 2018, $12.1 billion or 59.8% of the letters of credit were concentrated with two members, TD Bank and PNC Bank.
Collateral Policies and Practices. All members are required to maintain eligible collateral to secure their TCE in accordance with the most recent version of the Member Products Policy which was updated in October 2019. The Bank periodically reviews the collateral pledged by members or affiliates, where applicable. Additionally, the Bank conducts
60
periodic collateral verification reviews to ensure the eligibility, adequacy and sufficiency of the collateral pledged. The Bank may, in its discretion, require the delivery of loan collateral at any time.
The Bank reviews and assigns borrowing capacities based on this collateral, taking into account the known credit attributes in assigning the appropriate secondary market discounts to determine that a member’s TCE is fully collateralized. Other factors that the Bank may consider in calculating a member’s MBC include the collateral status for loans, frequency of loan data reporting, collateral field review results, the member’s financial strength and condition, and the concentration of collateral type by member.
The Bank uses a QCR that is designed to provide timely, detailed collateral information. Depending on a member’s credit product usage and financial condition, a member may be required to file the QCR on a quarterly or monthly basis. The QCR is designed to strengthen the Bank’s collateral analytical review procedures. The output of the QCR is a member’s loan-based MBC. For the small number of members who opt out of QCR filing, MBC is calculated by the Bank, based on the member’s regulatory filing data. For such members, final MBC is established at 20% of the aggregate weighted collateral value. Such members are required to file an Annual Collateral Certification Report.
The Bank does not accept subprime residential mortgage loans (defined as FICO score of 660 or below) as qualifying collateral unless there are other mitigating factors, including a LTV ratio of 65% or less (100% if loan level data is provided by the member for valuation and FICO score is at least 600), and one of the following: (1) a debt-to-income ratio of 35% (50% if loan level data is provided and FICO score is at least 600) or less; or (2) a satisfactory payment history over the past 12 months (i.e., no 30-day delinquencies). Loans which do not have the mitigating factors described above are not included in a member’s MBC. For loans identified as low FICO with mitigating factors and for those in which no FICO score is available, a reduced collateral weighting ranging from 50-75%, depending on pledging and delivery status, will apply. The Bank allows nontraditional residential mortgage loans to be included in collateral and used to determine a member’s MBC.
A limit of 25% has been established for the percentage of member collateral that is categorized as low FICO (with acceptable mitigating factors), missing (unknown) FICO score loans and nontraditional loans and securities. A limit of 25% has also been established for total Bank-wide exposure related to nontraditional, subprime and low FICO whole mortgage loans acquired through the Bank’s MPF program, and the Bank’s MBS investment portfolio.
The Bank may require specific loan level characteristic reporting on nontraditional residential mortgage loans and will generally assign a reduced collateral weighting ranging from 60-80% depending on pledging and delivery status. At December 31, 2019, less than 12.5% of the Bank’s total pledged collateral was considered to be nontraditional.
The Bank is allowed by regulation to expand eligible collateral for many of its members. Members that qualify as CFIs can pledge expanded collateral which includes small-business, small-farm, small-agribusiness and community development loans as collateral for credit products from the Bank. At December 31, 2019, loans to CFIs secured with both eligible standard and expanded collateral represented approximately $4.1 billion, or 4.9% of total par value of loans outstanding. Eligible expanded collateral represented 7.5% of total eligible collateral for these loans. However, these loans were collateralized by sufficient levels of standard collateral.
Collateral Agreements and Valuation. The Bank provides members with two types of collateral agreements: a blanket lien collateral pledge agreement and a specific collateral pledge agreement. Under a blanket lien agreement, the Bank obtains a lien against all of the member’s unencumbered eligible collateral assets and most ineligible assets to secure the member’s obligations with the Bank. Under a specific collateral pledge agreement, the Bank obtains a lien against specific eligible collateral assets of the member or its affiliate (if applicable) to secure the member’s obligations with the Bank. The member provides a detailed listing, as an addendum to the specific collateral agreement, identifying those assets pledged as collateral or delivered to the Bank or its third party custodian.
High quality investment securities are defined as U.S. Treasury and U.S. Agency securities, REFCORP bonds, GSE MBS, commercial and residential private label MBS with a minimum credit rating of single A, which the Bank considers as part of its evaluation of the collateral. In addition, municipal securities (or portions thereof) with a real estate nexus (e.g. proceeds primarily used for real estate development) with a minimum credit rating of single A are included. Members have the option to deliver such high quality investment securities to the Bank to increase their maximum borrowing capacity. Upon delivery, these securities are valued daily and all non-government or agency securities are subject to weekly ratings reviews. Reported amount also includes pledged FHLBank cash deposits.
61
The following table summarizes average lending values assigned to various types of collateral which are part of the Bank’s Member Products Policy. The reported range of effective lending values applied to collateral may be impacted by collateral adjustments applied to individual members. At the discretion of the Bank, on a case-by-case basis, the collateral weighting on loan categories may be increased (up to a maximum of 85%) upon completion of specific market valuation of such collateral and authorization from the Bank’s Membership and Credit Committee.
Collateral Type | Standard Weighting (1) | Range of Effective Lending Values Applied to Collateral (2) | Combined Average Lending Value |
Blanket Lien (4) (5) | |||
Single-family mortgage loans (3) | 80% | 60-85% | 80% |
Multi-family mortgage loans | 75% | 65-85% | 80% |
Home equity loans/lines of credit | 60% | 60-85% | 67% |
CFI collateral | 60% | 50-70% | 64% |
Commercial real estate loans | 70% | 55-80% | 75% |
Other loan collateral (farmland) | 70% | N/A | N/A |
Delivered (5) | |||
FHLBank deposits | 100% | 100% | 100% |
U.S. government /U.S. Treasury/U.S. Agency securities and notes, REFCORP bonds | 97% | 90-97% | 96% |
U.S. Treasury Strips (interest-only and principal-only) | 90% | 90% | 90% |
State and local government securities (municipal) (rated A/AA/AAA) | 88/90/92% | 88-92% | 85% |
U.S. Agency MBS and CMOs | 95% | 90-95% | 94% |
Private label MBS and CMOs (rated A/AA/AAA) | 70/75/85% | 65-85% | 80% |
Commercial MBS (rated A/AA/AAA) | 70/75/85% | 70-85% | 81% |
Single-family mortgage loans (3) | 70% | 50-70% | 65% |
Multi-family mortgage loans | 65% | 65% | 65% |
Home equity loans/lines of credit | 50% | 50% | 50% |
CFI collateral | 50% | 50-60% | 60% |
Commercial real estate loans | 60% | 60% | 60% |
Other loan collateral (farmland) | 60% | N/A | N/A |
Notes: | |||
(1) Represents the Bank's standard collateral weighting percentages. | |||
(2) Effective lending value in excess of standard weighting is due to one or more large borrowing members utilizing the Bank’s market-value based collateral weighting program. This program permits a lending value in excess of the standard weighting. | |||
(3) Includes nontraditional loans, loans with unknown FICO scores, and low FICO loans with mitigating factors, which all receive a lower collateral weighting. | |||
(4) Includes QCR filer, full collateral delivery policy reasons and market valuation. | |||
(5) Includes specific pledge loans and specific pledge delivered securities. | |||
62
For members/borrowers, the following tables present information on a combined basis regarding the type of collateral securing their outstanding credit exposure and the collateral status as of December 31, 2019 and December 31, 2018.
December 31, 2019 | ||||||||||||||||||||
(dollars in millions) | Blanket Lien | Listing | Delivery | Total | ||||||||||||||||
Amount | % | Amount | % | Amount | % | Amount | % | |||||||||||||
One-to-four single-family residential mortgage loans | $ | 90,403.5 | 43.8 | % | $ | 5,658.5 | 81.2 | % | $ | 9,267.4 | 87.8 | % | $ | 105,329.4 | 47.1 | % | ||||
High quality investment securities | 4,452.4 | 2.2 | 1,306.4 | 18.8 | 1,265.6 | 12.0 | 7,024.4 | 3.1 | ||||||||||||
ORERC/ CFI eligible collateral | 91,434.3 | 44.3 | — | — | 20.2 | 0.2 | 91,454.5 | 40.9 | ||||||||||||
Multi-family residential mortgage loans | 19,956.5 | 9.7 | — | — | 0.1 | — | 19,956.6 | 8.9 | ||||||||||||
Total eligible collateral value | $ | 206,246.7 | 100.0 | % | $ | 6,964.9 | 100.0 | % | $ | 10,553.3 | 100.0 | % | $ | 223,764.9 | 100.0 | % | ||||
Total TCE | $ | 74,267.6 | 87.7 | % | $ | 1,494.0 | 1.8 | % | $ | 8,922.5 | 10.5 | % | $ | 84,684.1 | 100.0 | % | ||||
Number of members | 179 | 88.2 | % | 10 | 4.9 | % | 14 | 6.9 | % | 203 | 100.0 | % | ||||||||
December 31, 2018 | ||||||||||||||||||||
(dollars in millions) | Blanket Lien | Listing | Delivery | Total | ||||||||||||||||
Amount | % | Amount | % | Amount | % | Amount | % | |||||||||||||
One-to-four single-family residential mortgage loans | $ | 84,382.9 | 40.7 | % | $ | 20,917.0 | 92.4 | % | $ | 14.3 | 1.1 | % | $ | 105,314.2 | 45.5 | % | ||||
High quality investment securities | 11,484.7 | 5.5 | 1,719.3 | 7.6 | 1,252.5 | 97.1 | 14,456.5 | 6.2 | ||||||||||||
ORERC/ CFI eligible collateral | 92,568.1 | 44.6 | — | — | 23.5 | 1.8 | 92,591.6 | 40.0 | ||||||||||||
Multi-family residential mortgage loans | 19,173.1 | 9.2 | — | — | 0.1 | — | 19,173.2 | 8.3 | ||||||||||||
Total eligible collateral value | $ | 207,608.8 | 100.0 | % | $ | 22,636.3 | 100.0 | % | $ | 1,290.4 | 100.0 | % | $ | 231,535.5 | 100.0 | % | ||||
Total TCE | $ | 86,398.3 | 82.8 | % | $ | 16,986.0 | 16.2 | % | $ | 1,012.7 | 1.0 | % | $ | 104,397.0 | 100.0 | % | ||||
Number of members | 193 | 88.5 | % | 12 | 5.5 | % | 13 | 6.0 | % | 218 | 100.0 | % | ||||||||
Credit and Counterparty Risk - Investments
The Bank is also subject to credit risk on investments consisting of money market investments and investment securities. The Bank considers a variety of credit quality factors when analyzing potential investments, including collateral performance, marketability, asset class or sector considerations, local and regional economic conditions, credit ratings based on NRSROs, and/or the financial health of the underlying issuer.
63
Investment Quality and External Credit Ratings. The following tables present the Bank’s investment carrying values as of December 31, 2019 and December 31, 2018 based on the lowest credit rating from the NRSROs (Moody’s, S&P and Fitch).
December 31, 2019(1) | |||||||||||||||||||||
Long-Term Rating | |||||||||||||||||||||
(in millions) | AAA | AA | A | BBB | Below Investment Grade | Unrated | Total | ||||||||||||||
Money market investments: | |||||||||||||||||||||
Interest-bearing deposits | $ | — | $ | — | $ | 1,471.7 | $ | — | $ | — | $ | — | $ | 1,471.7 | |||||||
Securities purchased under agreements to resell | 600.0 | — | 1,000.0 | 600.0 | — | — | 2,200.0 | ||||||||||||||
Federal funds sold | — | 800.0 | 2,820.0 | 150.0 | — | — | 3,770.0 | ||||||||||||||
Total money market investments | 600.0 | 800.0 | 5,291.7 | 750.0 | — | — | 7,441.7 | ||||||||||||||
Investment securities: | |||||||||||||||||||||
U.S. Treasury obligations | — | 3,390.7 | — | — | — | — | 3,390.7 | ||||||||||||||
GSE and TVA obligations | — | 1,791.6 | — | — | — | — | 1,791.6 | ||||||||||||||
State or local agency obligations | 25.6 | 316.6 | — | — | — | — | 342.2 | ||||||||||||||
Total non-MBS | 25.6 | 5,498.9 | — | — | — | — | 5,524.5 | ||||||||||||||
U.S. obligations single-family MBS | — | 1,057.8 | — | — | — | — | 1,057.8 | ||||||||||||||
GSE single-family MBS | — | 5,212.4 | — | — | — | — | 5,212.4 | ||||||||||||||
GSE multifamily MBS | — | 4,880.4 | — | — | — | — | 4,880.4 | ||||||||||||||
Private label MBS | — | 20.1 | 27.8 | 36.3 | 152.1 | 213.7 | 450.0 | ||||||||||||||
Total MBS | — | 11,170.7 | 27.8 | 36.3 | 152.1 | 213.7 | 11,600.6 | ||||||||||||||
Total investments | $ | 625.6 | $ | 17,469.6 | $ | 5,319.5 | $ | 786.3 | $ | 152.1 | $ | 213.7 | $ | 24,566.8 | |||||||
December 31, 2018 (1) | |||||||||||||||||||||
Long-Term Rating | |||||||||||||||||||||
(in millions) | AAA | AA | A | BBB | Below Investment Grade | Unrated | Total | ||||||||||||||
Money market investments: | |||||||||||||||||||||
Interest-bearing deposits | $ | — | $ | — | $ | 2,117.8 | $ | — | $ | — | $ | — | $ | 2,117.8 | |||||||
Securities purchased under agreements to resell | — | — | — | — | 1,000.0 | — | 1,000.0 | ||||||||||||||
Federal funds sold | — | 1,000.0 | 3,590.0 | 150.0 | — | — | 4,740.0 | ||||||||||||||
Total money market investments | — | 1,000.0 | 5,707.8 | 150.0 | 1,000.0 | — | 7,857.8 | ||||||||||||||
Investment securities: | |||||||||||||||||||||
U.S. Treasury obligations | — | 997.1 | — | — | — | — | 997.1 | ||||||||||||||
Certificates of deposit | — | 200.0 | 500.0 | — | — | — | 700.0 | ||||||||||||||
GSE and TVA obligations | — | 2,069.3 | — | — | — | — | 2,069.3 | ||||||||||||||
State or local agency obligations | 25.4 | 323.2 | — | — | — | — | 348.6 | ||||||||||||||
Total non-MBS | 25.4 | 3,589.6 | 500.0 | — | — | — | 4,115.0 | ||||||||||||||
U.S. obligations single-family MBS | — | 543.7 | — | — | — | — | 543.7 | ||||||||||||||
GSE single-family MBS | — | 3,481.4 | — | — | — | — | 3,481.4 | ||||||||||||||
GSE multifamily MBS | — | 3,458.5 | — | — | — | — | 3,458.5 | ||||||||||||||
Private label MBS | — | 40.9 | 53.0 | 47.5 | 197.4 | 276.0 | 614.8 | ||||||||||||||
Total MBS | — | 7,524.5 | 53.0 | 47.5 | 197.4 | 276.0 | 8,098.4 | ||||||||||||||
Total investments | $ | 25.4 | $ | 12,114.1 | $ | 6,260.8 | $ | 197.5 | $ | 1,197.4 | $ | 276.0 | $ | 20,071.2 | |||||||
(1) Balances exclude total accrued interest of $46.7 million and $35.6 million at December 31, 2019 and December 31, 2018, respectively.
The Bank also manages credit risk based on an internal credit rating system. For purposes of determining the internal credit rating, the Bank measures credit exposure through a process which includes internal credit review and various external factors, including placement of the counterparty on negative watch by one or more NRSROs. For internal reporting purposes, the incorporation of negative credit watch into the credit rating analysis of an investment may translate into a downgrade of one
64
credit rating level from the external rating. The Bank does not rely solely on any NRSRO rating in deriving its final internal credit rating.
Short-term Investments. Within the portfolio of short-term investments, the Bank faces credit risk from unsecured exposures. The Bank's unsecured credit investments have maturities generally ranging between overnight and six months and may include the following types:
• | Interest-bearing deposits. Primarily consists of unsecured deposits that earn interest; |
• | Federal funds sold. Unsecured loans of reserve balances at the FRBs between financial institutions that are made on an overnight and term basis; and |
• | Certificates of deposit. Unsecured negotiable promissory notes issued by banks and payable to the bearer at maturity or on demand. |
Under the Bank’s Risk Governance Policy, the Bank can place money market investments, which include those investment types listed above, on an unsecured basis with large financial institutions with long-term credit ratings no lower than BBB. Management actively monitors the credit quality of these counterparties.
As of December 31, 2019, the Bank had unsecured exposure to 12 counterparties totaling $5.2 billion with three counterparties each exceeding 10% of the total exposure. The following table presents the Banks' unsecured credit exposure with non-governmental counterparties by investment type at December 31, 2019 and December 31, 2018. The unsecured investment credit exposure presented may not reflect the average or maximum exposure during the period.
(in millions) | ||||||
Carrying Value (1) | December 31, 2019 | December 31, 2018 | ||||
Interest-bearing deposits | $ | 1,471.7 | $ | 2,117.8 | ||
Certificates of deposit | — | 700.0 | ||||
Federal funds sold | 3,770.0 | 4,740.0 | ||||
Total | $ | 5,241.7 | $ | 7,557.8 | ||
Note:
(1) Excludes unsecured investment credit exposure to U.S. government, U.S. government agencies and instrumentalities, GSEs, and supranational entities.
As of December 31, 2019, 69.1% of the Bank’s unsecured investment credit exposures were to U.S. branches and agency offices of foreign commercial banks. The Bank actively monitors its credit exposures and the credit quality of its counterparties, including an assessment of each counterparty’s financial performance, capital adequacy, sovereign support, and the current market perceptions of the counterparties. General macro-economic, political and market conditions may also be considered when deciding on unsecured exposure. As a result, the Bank may limit or suspend existing exposures.
Finance Agency regulations include limits on the amount of unsecured credit the Bank may extend to a counterparty or to a group of affiliated counterparties. This limit is based on a percentage of eligible regulatory capital and the counterparty's overall credit rating. Under these regulations, the level of eligible regulatory capital is determined as the lesser of the Bank's total regulatory capital or the eligible amount of regulatory capital of the counterparty. The eligible amount of regulatory capital is then multiplied by a stated percentage. This percentage is 1% to 15% and is based on the counterparty's credit rating. The calculation of term extensions of unsecured credit includes on-balance sheet transactions, off-balance sheet commitments, and derivative transactions.
Finance Agency regulation also permits the Bank to extend additional unsecured credit for overnight transactions and for sales of Federal funds subject to continuing contracts that renew automatically. For overnight exposures only, the Bank's total unsecured exposure to a counterparty may not exceed twice the applicable regulatory limit, or a total of 2% to 30% of the eligible amount of regulatory capital, based on the counterparty's credit rating. As of December 31, 2019, the Bank was in compliance with the regulatory limits established for unsecured credit.
The Bank's unsecured credit exposures to U.S. branches and agency offices of foreign commercial banks include the risk that, as a result of political or economic conditions in a country, the counterparty may be unable to meet their contractual repayment obligations. The Bank's unsecured credit exposures to domestic counterparties and U.S. subsidiaries of foreign commercial banks include the risk that these counterparties have extended credit to foreign counterparties.
65
The following table presents the long-term credit ratings of the unsecured investment credit exposures by the domicile of the counterparty or the domicile of the counterparty's immediate parent for U.S. subsidiaries or branches and agency offices of foreign commercial banks based on the NRSROs used. This table does not reflect the foreign sovereign government's credit rating.
(in millions) | ||||||||||||
December 31, 2019 (1) (2) | ||||||||||||
Carrying Value | ||||||||||||
Domicile of Counterparty | Investment Grade (3) (4) | |||||||||||
AA | A | BBB | Total | |||||||||
Domestic | $ | — | $ | 1,471.7 | $ | 150.0 | $ | 1,621.7 | ||||
U.S. branches and agency offices of foreign commercial banks: | ||||||||||||
Australia | 500.0 | — | — | 500.0 | ||||||||
Canada | — | 1,270.0 | — | 1,270.0 | ||||||||
Finland | 300.0 | — | — | 300.0 | ||||||||
Netherlands | — | 750.0 | — | 750.0 | ||||||||
Norway | — | 100.0 | — | 100.0 | ||||||||
Switzerland | — | 700.0 | — | 700.0 | ||||||||
Total U.S. branches and agency offices of foreign commercial banks | 800.0 | 2,820.0 | — | 3,620.0 | ||||||||
Total unsecured investment credit exposure | $ | 800.0 | $ | 4,291.7 | $ | 150.0 | $ | 5,241.7 | ||||
(in millions) | ||||||||||||
December 31, 2018 (1) (2) | ||||||||||||
Carrying Value | ||||||||||||
Domicile of Counterparty | Investment Grade (3) (4) | |||||||||||
AA | A | BBB | Total | |||||||||
Domestic | $ | — | $ | 3,942.8 | $ | 150.0 | $ | 4,092.8 | ||||
U.S. branches and agency offices of foreign commercial banks: | ||||||||||||
Australia | 1,000.0 | — | — | 1,000.0 | ||||||||
Austria | — | 100.0 | — | 100.0 | ||||||||
Canada | 100.0 | 1,200.0 | — | 1,300.0 | ||||||||
Finland | 100.0 | — | — | 100.0 | ||||||||
France | — | 100.0 | — | 100.0 | ||||||||
Germany | — | 100.0 | — | 100.0 | ||||||||
Netherlands | — | 665.0 | — | 665.0 | ||||||||
Norway | — | 100.0 | — | 100.0 | ||||||||
Total U.S. branches and agency offices of foreign commercial banks | 1,200.0 | 2,265.0 | — | 3,465.0 | ||||||||
Total unsecured investment credit exposure | $ | 1,200.0 | $ | 6,207.8 | $ | 150.0 | $ | 7,557.8 | ||||
Notes:
(1) Ratings are as of the respective dates.
(2) These ratings represent the lowest rating available for each security owned by the Bank based on the NRSROs used by the Bank. The Bank’s internal ratings may differ from those obtained from the NRSROs.
(3) Excludes unsecured investment credit exposure to U.S. government, U.S. government agencies and instrumentalities, GSEs, and supranational entities.
(4) Represents the NRSRO rating of the counterparty not the country. There were no AAA rated investments at December 31, 2019 or December 31, 2018.
66
The following table presents the remaining contractual maturity of the Bank's unsecured investment credit exposure by the domicile of the counterparty or the domicile of the counterparty's parent for U.S. subsidiaries or branches and agency offices of foreign commercial banks. The Bank also mitigates the credit risk on investments by generally investing in investments that have short-term maturities.
(in millions) | ||||||||||||
December 31, 2019 | ||||||||||||
Carrying Value | ||||||||||||
Domicile of Counterparty | Overnight | Due 2 days through 30 days | Due 31 days through 90 days | Total | ||||||||
Domestic | $ | 1,621.7 | $ | — | $ | — | $ | 1,621.7 | ||||
U.S. branches and agency offices of foreign commercial banks: | ||||||||||||
Australia | 500.0 | — | — | 500.0 | ||||||||
Canada | 1,270.0 | — | — | 1,270.0 | ||||||||
Finland | 300.0 | — | — | 300.0 | ||||||||
Netherlands | 750.0 | — | — | 750.0 | ||||||||
Norway | 100.0 | — | — | 100.0 | ||||||||
Switzerland | 700.0 | — | — | 700.0 | ||||||||
Total U.S. branches and agency offices of foreign commercial banks | 3,620.0 | — | — | 3,620.0 | ||||||||
Total unsecured investment credit exposure | $ | 5,241.7 | $ | — | $ | — | $ | 5,241.7 | ||||
(in millions) | ||||||||||||
December 31, 2018 | ||||||||||||
Carrying Value | ||||||||||||
Domicile of Counterparty | Overnight | Due 2 days through 30 days | Due 31 days through 90 days | Total | ||||||||
Domestic | $ | 4,092.8 | $ | — | $ | — | $ | 4,092.8 | ||||
U.S. branches and agency offices of foreign commercial banks: | ||||||||||||
Australia | 1,000.0 | — | — | 1,000.0 | ||||||||
Austria | — | — | 100.0 | 100.0 | ||||||||
Canada | 1,100.0 | — | 200.0 | 1,300.0 | ||||||||
Finland | — | — | 100.0 | 100.0 | ||||||||
France | — | — | 100.0 | 100.0 | ||||||||
Germany | — | 100.0 | — | 100.0 | ||||||||
Netherlands | 665.0 | — | — | 665.0 | ||||||||
Norway | — | — | 100.0 | 100.0 | ||||||||
Total U.S. branches and agency offices of foreign commercial banks | 2,765.0 | 100.0 | 600.0 | 3,465.0 | ||||||||
Total unsecured investment credit exposure | $ | 6,857.8 | $ | 100.0 | $ | 600.0 | $ | 7,557.8 | ||||
U.S. Treasury Obligations. The Bank invests in U.S. Treasury obligations that are explicitly fully guaranteed by the U.S. government. This portfolio totaled $3.4 billion at December 31, 2019 and $1.0 billion at December 31, 2018.
Agency/GSE Securities and Agency/GSE MBS. The Bank invests in and is subject to credit risk related to securities issued by Federal Agencies or U.S. government corporations. In addition, the Bank invests in MBS issued by these same entities that are directly supported by underlying mortgage loans. Both the securities and MBS are either explicitly or implicitly guaranteed by the U.S. government. These portfolios totaled $12.9 billion at December 31, 2019 and $9.6 billion at December 31, 2018.
State and Local Agency Obligations. The Bank invests in and is subject to credit risk related to a portfolio of state and local agency obligations (i.e., Housing Finance Agency bonds) that are directly or indirectly supported by underlying mortgage loans. These portfolios totaled $342.2 million at December 31, 2019 and $348.6 million at December 31, 2018.
67
Private Label MBS. The Bank also holds investments in private label MBS, which are supported by underlying mortgage loans. The Bank made investments in private label MBS that were rated AAA at the time of purchase with the exception of one, which was rated AA at the time of purchase. However, since the time of purchase, there have been significant downgrades. Current ratings are in the table below. In late 2007, the Bank discontinued the purchase of private label MBS. The carrying value of the Bank’s private label MBS portfolio at December 31, 2019 was $450.0 million which was a decrease of $164.8 million from December 31, 2018. This decline was primarily due to repayments.
Unrealized gains of OTTI securities in AOCI at December 31, 2019 was $51.7 million compared to $65.1 million at December 31, 2018. The weighted average prices on OTTI securities was 86.5 at December 31, 2019 and 87.5 at December 31, 2018. These fair values are determined using unobservable inputs (i.e., Level 3) derived from multiple third-party pricing services. There continues to be unobservable inputs and a lack of significant market activity for private label MBS; therefore, as of December 31, 2019, the Bank classified private label MBS as Level 3. The Bank uses the unadjusted prices received from the third-party pricing services in its process relating to fair value calculations and methodologies as described further in the Critical Accounting Policies and Estimates section in this Item 7.
Participants in the mortgage market have often characterized single-family loans based upon their overall credit quality at the time of origination, generally considering them to be Prime, Alt-A or subprime. There has been no universally accepted definition of these segments or classifications. The subprime segment of the mortgage market primarily served borrowers with poorer credit payment histories, and such loans typically had a mix of credit characteristics that indicate a higher likelihood of default and higher loss severities than Prime loans. Further, many mortgage participants classified single-family loans with credit characteristics that range between Prime and subprime categories as Alt-A because these loans had a combination of characteristics of each category or may have been underwritten with low or no documentation compared to a full documentation mortgage loan. Industry participants often used this classification principally to describe loans for which the underwriting process was less rigorous and the documentation requirements of the borrower were reduced.
Private Label MBS Collateral Statistics. The following tables provide collateral performance and credit enhancement information for the Bank’s private label MBS portfolio by par and by collateral type as of December 31, 2019.
Private Label MBS | ||||||||||||
(dollars in millions) | Prime | Alt-A | Subprime | Total | ||||||||
Par by lowest external long-term rating: | ||||||||||||
AA | $ | 15.2 | $ | 4.9 | $ | — | $ | 20.1 | ||||
A | 20.8 | 7.0 | — | 27.8 | ||||||||
BBB | 14.6 | 19.0 | 3.2 | 36.8 | ||||||||
Below investment grade: | ||||||||||||
BB | 32.1 | 1.1 | — | 33.2 | ||||||||
B | 2.4 | — | — | 2.4 | ||||||||
CCC | 3.7 | 57.8 | — | 61.5 | ||||||||
CC | — | 33.4 | — | 33.4 | ||||||||
D | 31.0 | 9.4 | — | 40.4 | ||||||||
Unrated | 110.7 | 135.0 | — | 245.7 | ||||||||
Total | $ | 230.5 | $ | 267.6 | $ | 3.2 | $ | 501.3 | ||||
Amortized cost | $ | 189.0 | $ | 206.3 | $ | 3.2 | $ | 398.5 | ||||
Gross unrealized losses (1) | (0.4 | ) | (0.2 | ) | (0.2 | ) | (0.8 | ) | ||||
Fair value | 214.2 | 233.1 | 3.0 | 450.3 | ||||||||
Net OTTI losses | (0.1 | ) | (0.5 | ) | — | (0.6 | ) | |||||
Weighted average fair value/par | 92.9 | % | 87.1 | % | 93.8 | % | 89.8 | % | ||||
Original weighted average credit support | 7.2 | 10.4 | 12.5 | 8.6 | ||||||||
Weighted-average credit support - current | 7.4 | 3.6 | 40.8 | 5.6 | ||||||||
Weighted avg. collateral delinquency(3) | 10.1 | 13.1 | 10.8 | 11.6 | ||||||||
Notes:
(1) Represents total gross unrealized losses including non-credit-related OTTI recognized in AOCI. The unpaid principal balance and amortized cost of private label MBS in a gross unrealized loss position were both $49.6 million at December 31, 2019.
(2) For the year ended December 31, 2019.
(3) Delinquency information is presented at the cross-collateralization level.
68
OTTI. The Bank recognized $0.6 million and $1.0 million of credit-related OTTI charges in earnings during 2019 and 2018, respectively. Because the Bank does not intend to sell and it is not more likely than not that the Bank will be required to sell any OTTI securities before anticipated recovery of their amortized cost basis, the Bank does not have an additional OTTI charge for the difference between amortized cost and fair value. The Bank has not recorded OTTI on any other type of security (i.e., U.S. Agency MBS or non-MBS securities).
The Bank’s estimate of cash flows has a significant impact on the determination of credit losses. Cash flows expected to be collected are based on the performance and type of private label MBS and the Bank’s expectations of the economic environment. To ensure consistency in determination of the OTTI for private label MBS among all FHLBanks, each quarter the Bank works with the OTTI Governance Committee to update its OTTI analysis based on actual loan performance and current housing market assumptions in the collateral loss projection models, which generate the estimated cash flows from the Bank’s private label MBS. This process is described in Note 7 - OTTI to the audited financial statements in Item 8. Financial Statements and Supplementary Financial Data in this Form 10-K.
The Bank’s quarterly OTTI analysis is based on current and forecasted economic trends. Significant assumptions used on the Bank’s private label MBS as part of its fourth quarter 2019 analysis are presented below.
Significant Inputs for Private Label MBS | |||||||
Prepayment Rates | Default Rates | Loss Severities | Current Credit Enhancement | ||||
Category at origination | Weighted Avg % | Weighted Avg % | Weighted Avg % | Weighted Avg % | |||
Prime | 13.6 | 8.4 | 24.5 | 6.9 | |||
Alt-A | 15.4 | 14.4 | 39.7 | 3.5 | |||
Subprime | 3.9 | 19.0 | 54.3 | 40.8 | |||
Total Private Label MBS | 14.5 | 11.7 | 33.0 | 5.3 | |||
The Bank’s life-to-date credit losses are concentrated in its 2006 and 2007 vintage bonds. These vintages represent 92% of life-to-date credit losses, of which 48% relates to Prime and 44% relates to Alt-A, with the remainder in subprime and HELOC. The Bank has recognized life-to-date OTTI as follows:
(dollars in millions) | December 31, 2019 | December 31, 2018 | ||||
Number of private label MBS with an OTTI charge: | ||||||
Life-to-date | 60 | 60 | ||||
Still outstanding | 35 | 38 | ||||
Total OTTI credit loss recorded life-to-date | $ | 458.6 | $ | 458.0 | ||
Principal write-downs on private label MBS | (157.9 | ) | (150.9 | ) | ||
Credit losses on private label MBS no longer owned: | ||||||
Private label MBS sold | (116.5 | ) | (116.5 | ) | ||
Private label MBS matured (less principal write-downs realized) | (18.7 | ) | (7.1 | ) | ||
Remaining amount of previously recognized OTTI credit losses | $ | 165.5 | $ | 183.5 | ||
The table above excludes recoveries of OTTI through interest income, which occur if there is a significant increase in estimated cash flows whereby the Bank increases the yield on the Bank’s investment and recognizes recovery as interest income over the life of the investment. OTTI recovered through interest income on these securities was $19.6 million and $20.6 million for 2019 and 2018, respectively, and $179.0 million life-to-date. The same private label MBS can have multiple increases in cash flows that are deemed to be significant.
The Bank transfers private label MBS from HTM to AFS when an OTTI credit loss is recorded on a security. The Bank believes that a credit loss constitutes evidence of deterioration in the credit quality of the security. The Bank believes that the transfer increases its flexibility to potentially sell other-than-temporarily-impaired securities if it makes economic sense. There were no transfers during 2019 or 2018.
As discussed above, the projection of cash flows expected to be collected on private label MBS involves significant judgment with respect to key modeling assumptions. Therefore, on all private label MBS, the Bank performed a cash flow analysis under one additional scenario, which was agreed to by the OTTI Governance Committee, that represented meaningful,
69
plausible and more adverse external assumptions. This more adverse scenario decreases the short-term housing-price forecast by five percentage points, and slows housing price recovery rates by 33%. The adverse scenario estimated cash flows were generated using the same model (Prime, Alt-A or subprime) as the base scenario. Using a model with more severe assumptions could increase the estimated credit loss recorded by the Bank. The securities included in this stress scenario were only those that were in an unrealized loss position at December 31, 2019. Additionally, the maximum credit loss under the adverse case was limited to the amount of the security's unrealized loss. The adverse case housing price forecast is not management’s current best estimate of cash flows and is therefore not used as a basis for determining OTTI. The results of the analysis were immaterial.
Credit and Counterparty Risk - Mortgage Loans, BOB Loans and Derivatives
Mortgage Loans. The Finance Agency has authorized the Bank to hold mortgage loans under the MPF Program whereby the Bank acquires mortgage loans from participating members in a shared credit risk structure. These assets carry CEs on any conventional mortgage loans acquired such that the Bank has a high degree of confidence that it will be paid principal and interest in all material respects, even under reasonably likely adverse changes to expected economic conditions. Loans are assessed by a third-party credit model at acquisition, and a CE is calculated based on loan attributes and the Bank’s risk tolerance with respect to its MPF portfolio.
The Bank had net mortgage loans held for portfolio of $5.1 billion and $4.5 billion at December 31, 2019 and December 31, 2018, respectively, after an allowance for credit losses of $7.8 million and $7.3 million, respectively. The tables and graphs below present additional mortgage loan portfolio statistics including portfolio balances categorized by product. The data in the FICO and LTV ratio range graphs is based on original FICO scores and LTV ratios and unpaid principal balance for the loans remaining in the portfolio at December 31, 2019 and December 31, 2018. The geographic breakdown graphs are also based on the unpaid principal balance at December 31, 2019 and December 31, 2018 .
(dollars in millions) | December 31, 2019 | December 31, 2018 | ||||||
Balance | % of Total | Balance | % of Total | |||||
Conventional loans: | ||||||||
MPF Original | $ | 1,967.0 | 39.1 | $ | 1,971.1 | 45.0 | ||
MPF Plus | 293.8 | 5.8 | 359.0 | 8.2 | ||||
MPF 35 | 2,595.7 | 51.6 | 1,864.3 | 42.5 | ||||
Total conventional loans | $ | 4,856.5 | 96.5 | $ | 4,194.4 | 95.7 | ||
Government-insured loans: | ||||||||
MPF Government | 173.8 | 3.5 | 187.8 | 4.3 | ||||
Total par value | $ | 5,030.3 | 100.0 | $ | 4,382.2 | 100.0 | ||
(dollars in millions) | 2019 | 2018 | ||||
Mortgage loans interest income | $ | 170.1 | $ | 151.0 | ||
Average mortgage loans portfolio balance | $ | 4,716.2 | $ | 4,193.0 | ||
Average yield | 3.61 | % | 3.60 | % | ||
Weighted average coupon (WAC) | 4.37 | % | 4.33 | % | ||
Weighted average estimated life (WAL) | 6.2 years | 7.5 years | ||||
70
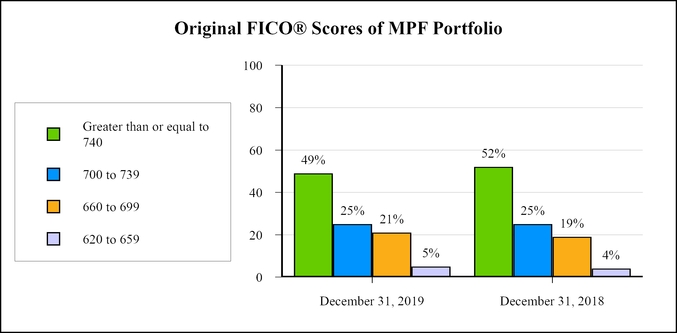
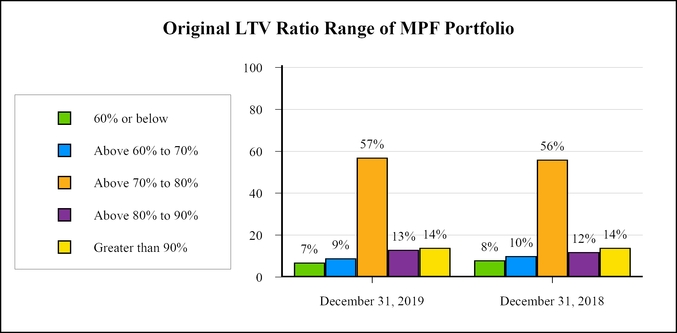
71
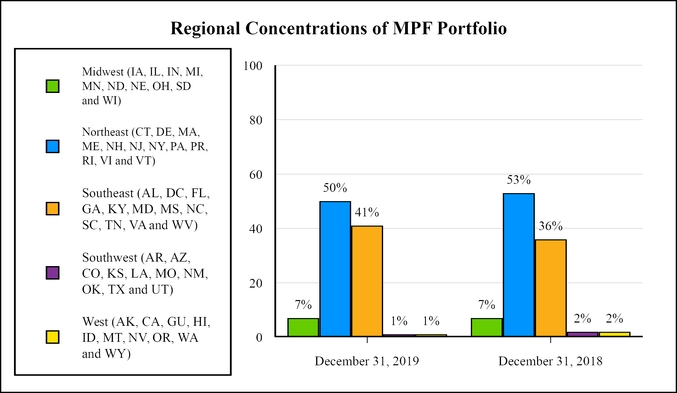
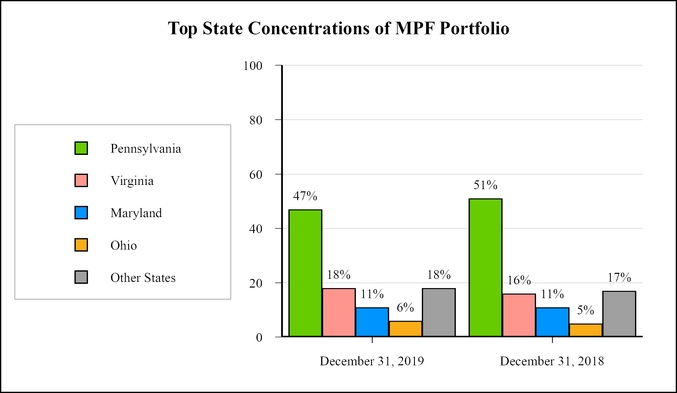
Underwriting Standards. Purchased mortgage loans must meet certain underwriting standards established in the MPF Program guidelines. Key standards and/or eligibility guidelines include the following loan criteria:
• | Conforming loan size, established annually; may not exceed the loan limits set by the Finance Agency; |
• | Fixed-rate, fully-amortizing loans with terms from 5 to 30 years; |
• | Secured by first lien mortgages on owner-occupied residential properties and second homes; |
72
• | Generally, 95% maximum LTV; all LTV ratio criteria generally are based on the loan purpose, occupancy and borrower citizenship status; all loans with LTV ratios above 80% require PMI coverage; and |
• | Unseasoned or current production with up to 24 payments made by the borrowers. |
The following types of mortgage loans are not eligible for delivery under the MPF Program: (1) mortgage loans that are not ratable by S&P; (2) mortgage loans not meeting the MPF Program eligibility requirements as set forth in the MPF Guides and agreements; and (3) mortgage loans that are classified as high cost, high rate, Home Ownership and Equity Protection Act (HOEPA) loans, or loans in similar categories defined under predatory lending or abusive lending laws.
Under the MPF Program, the FHLBank of Chicago (in its role as MPF Provider) and the PFI both conduct quality assurance reviews on a sample of the conventional mortgage loans to ensure compliance with MPF Program requirements. The PFI may be required to repurchase at book value the individual loans which fail these reviews. Subsequent to this quality assurance review, any loans which are discovered to breach representations and warranties may be required to be repurchased by the PFI. Additionally, MPF Government residential mortgage loans which are 90 days or more past due are contractually permitted to be repurchased by the PFI. For 2019 and 2018, the total funded amount of conventional and government repurchased mortgage loans was $4.8 million, or 0.4%, and $7.2 million, or 0.7%, respectively, of total funded loans.
Layers of Loss Protection. The Bank is required to put a CE structure in place at purchase that assures that, on any mortgage loans acquired, the Bank has a high degree of confidence that it will be paid the principal and interest in all material respects, even under reasonably likely adverse changes to expected economic conditions. The PFI must bear a specified portion of the direct economic consequences of actual loan losses on the individual mortgage loans or pool of loans, which may be provided by a CE obligation or SMI. Each MPF product structure has various layers of loss protection as presented below.
Layer | MPF Original | MPF Plus | MPF 35 |
First | Borrower’s equity in the property | Borrower’s equity in the property | Borrower’s equity in the property |
Second (required for mortgage loans with LTV greater than 80%) | PMI issued by qualified mortgage insurance companies (if applicable) | PMI issued by qualified mortgage insurance companies (if applicable) | PMI issued by qualified mortgage insurance companies (if applicable) |
Third | Bank FLA (1) (allocated amount) | Bank FLA (1) (upfront amount) | Bank FLA (1) (upfront amount) |
Fourth | PFI CE amount (2) | SMI and/or PFI CE amount, if applicable (2) | PFI CE amount (2) |
Final | Bank loss | Bank loss | Bank loss |
Notes:
(1) The FLA either builds over time or is an amount equal to an agreed-upon percentage of the aggregate balance of the mortgage loans purchased. The type of FLA is established by MPF product. The Bank does not receive fees in connection with the FLA.
(2) The PFI’s CE amount for each pool of loans, together with any PMI or SMI, is sized at the time of loan purchase to equal the amount of losses in excess of the FLA to the equivalent of an AA rated mortgage investment.
By credit enhancing each loan pool, the PFI maintains an interest in the performance of the mortgage loans it sells to the Bank and may service for the Bank. For managing this risk, the PFI is paid a monthly CE fee by the Bank. CE fees are recorded as an offset to mortgage loan net interest income in the Statement of Income. For 2019 and 2018, CE fees were $5.3 million and $4.6 million, respectively. Performance-based CE fees paid are reduced by losses absorbed through the FLA, where applicable.
MPF Original. Under MPF Original, the FLA is zero on the day the first loan is purchased and increases steadily over the life of the Master Commitment based on the month-end outstanding aggregate principal balance. Loan losses not covered by PMI, but not to exceed the FLA, are deducted from the FLA and recorded as losses by the Bank for financial reporting purposes. Losses in excess of FLA are allocated to the PFI under its CE obligation for each pool of loans. The PFI is paid a fixed CE fee for providing this CE obligation. Loan losses in excess of both the FLA and the CE amount are recorded as losses by the Bank.
MPF Plus. Under MPF Plus, the first layer of losses (following any PMI coverage) is applied to the FLA equal to a specified percentage of the loans in the pool as of the sale date. Any losses allocated to this FLA are the responsibility of the Bank. The PFI obtains additional CE in the form of a SMI policy to cover losses in excess of the deductible of the policy, which is equal to the FLA. Loan losses not covered by the FLA and SMI are paid by the PFI, up to the amount of the PFI’s CE obligation, if any, for each pool of loans. If applicable, the PFI is paid a fixed CE fee and a performance-based fee for providing the CE obligation. Loan losses applied to the FLA as well as losses in excess of the combined FLA, the SMI policy amount,
73
and the PFI’s CE obligation are recorded by the Bank based on the Bank’s participation interest. Losses incurred by the Bank up to its exposure under the FLA may be able to be recaptured through the recovery of future performance-based CE fees earned by the PFI. Any loan losses in excess of both the FLA and the CE amounts are recorded as losses by the Bank. Since July 2016, the Bank has not been offering the MPF Plus product.
MPF 35. Under MPF 35, the FLA is equal to a specified percentage of the amount of loans funded in the Master Commitment. Loan losses not covered by PMI, but not to exceed the FLA, are deducted from the FLA and recorded as losses by the Bank for financial reporting purposes. Losses in excess of FLA are allocated to the PFI under its CE obligation. The PFI is paid a fixed CE fee and a performance-based fee for providing the CE obligation. Losses incurred by the Bank up to its exposure under the FLA may be recaptured through recovery of future performance-based CE fees earned by the PFI. Any loan losses in excess of both the FLA and the CE amounts are recorded as losses by the Bank.
The following table presents the outstanding balances in the FLAs for the MPF Original, MPF Plus, and MPF 35 products.
(in millions) | MPF Original | MPF Plus | MPF 35 | Total | ||||||||
December 31, 2019 | $ | 6.1 | $ | 15.6 | $ | 10.8 | $ | 32.5 | ||||
December 31, 2018 | 5.5 | 16.5 | 7.1 | 29.1 | ||||||||
Mortgage Insurers. The Bank’s MPF Program currently has credit exposure to nine mortgage insurance companies which provide PMI and/or SMI for the Bank’s various products. To be active, the mortgage insurance company must be approved as a qualified insurer in accordance with the AMA regulation. Every two years, the Bank reviews the qualified insurers to determine if they continue to meet the financial and operational standards set by the Bank.
None of the Bank’s mortgage insurers currently maintain a rating by at least one NRSRO of A+ or better. As required by the MPF Program, for originations with PMI, the ratings model currently requires additional CE from the PFI to compensate for the mortgage insurer rating when it is below A+.
The MPF Plus product required SMI under the MPF Program when each pool was established. At December 31, 2019, five of the 14 MPF Plus pools still have SMI policies in place. The Bank does not currently offer the MPF Plus product and has not purchased loans under MPF Plus Commitments since July 2006. Per MPF Program guidelines, the existing MPF Plus product exposure is required to be secured by the PFI once the SMI company is rated below AA-. The Finance Agency guidelines require mortgage insurers that underwrite SMI to be rated AA- or better. This requirement has been temporarily waived by the Finance Agency provided that the Bank otherwise mitigates the risk by requiring the PFI to secure the exposure. As of December 31, 2019, all of the SMI exposure is fully collateralized.
The unpaid principal balance and maximum coverage outstanding for seriously delinquent loans with PMI as of December 31, 2019 was $5.3 million and $2.0 million, respectively. The corresponding amounts at December 31, 2018 were $5.1 million and $2.1 million.
BOB Loans. See Note 1 - Summary of Significant Accounting Policies in Item 8. in this Form 10-K for a description of the BOB program. At December 31, 2019 and December 31, 2018, the allowance for credit losses on BOB loans was $3.1 million and $2.6 million, respectively.
Derivative Counterparties. To manage interest rate risk, the Bank enters into derivative contracts. Derivative transactions may be either executed with a counterparty (referred to as uncleared derivatives) or cleared through a Futures Commission Merchant (i.e., clearing agent) or a Swap Execution Facility with a Derivatives Clearing Organization (referred to as cleared derivatives). For uncleared derivatives, the Bank transacts most of its derivatives with large banks and major broker-dealers. Some of these banks and broker-dealers or their affiliates buy, sell, and distribute consolidated obligations. The Bank is not a derivatives dealer and does not trade derivatives for short-term profit.
The Bank uses Chicago Mercantile Exchange (CME) Clearing as the Clearing House for all cleared derivative transactions. Variation margin payments are characterized as daily settlement payments, rather than collateral. Initial margin is considered cash collateral. A discussion of the update to the Bank's accounting policy is in the Critical Accounting Policies and Estimates section of this Item 7.
The Bank is subject to credit risk due to the risk of non-performance by counterparties to its derivative transactions. The amount of credit risk on derivatives depends on the extent to which netting procedures, collateral requirements, daily settlement
74
and other credit enhancements are used and are effective in mitigating the risk. The Bank manages credit risk through credit analysis, collateral management, and other credit enhancements.
Uncleared Derivatives. The Bank is subject to non-performance by counterparties to its uncleared derivative transactions. The Bank requires collateral on uncleared derivative transactions. The amount of net unsecured credit exposure that is permissible with respect to each counterparty depends on the credit rating of that counterparty. A counterparty must deliver collateral to the Bank if the total market value of the Bank's exposure to that counterparty rises above a specific trigger point. As a result of these risk mitigation initiatives, the Bank does not anticipate any credit losses on its uncleared derivative transactions with counterparties as of December 31, 2019.
Cleared Derivatives. The Bank is subject to credit risk exposure to the Clearing Houses and clearing agent. The requirement that the Bank post initial margin and exchange variation margin settlement payments, through the clearing agent, to the Clearing Houses, exposes the Bank to institutional credit risk in the event that the clearing agent or the Clearing Houses fail to meet their obligations. Initial margin is the amount calculated based on anticipated exposure to future changes in the value of a swap and protects the Clearing Houses from market risk in the event of default by one of its clearing agents. Variation margin is the amount accumulated through daily settlement of the current exposure arising from changes in the market value of the position since the trade was executed. The Bank's use of cleared derivatives is intended to mitigate credit risk exposure because a central counterparty is substituted for individual counterparties and collateral postings and variation margin settlement payments are made daily for changes in the value of cleared derivatives through a clearing agent. The Bank does not anticipate any credit losses on its cleared derivatives as of December 31, 2019.
The contractual or notional amount of derivative transactions reflects the involvement of the Bank in the various classes of financial instruments. The maximum credit risk of the Bank with respect to derivative transactions is the estimated cost of replacing the derivative transactions if there is a default, minus the value of any related collateral, including initial margin and variation margin settlements on cleared derivatives. In determining maximum credit risk, the Bank considers accrued interest receivables and payables as well as the netting requirements to net assets and liabilities. The following table presents the derivative positions with non-member counterparties and member institutions to which the Bank has credit exposure at December 31, 2019 and December 31, 2018.
(in millions) | December 31, 2019 | |||||||||||
Credit Rating (1) | Notional Amount | Fair Value Before Collateral | Cash Collateral Pledged To (From) Counterparties | Net Credit Exposure to Counterparties | ||||||||
Non-member counterparties | ||||||||||||
Asset positions with credit exposure: | ||||||||||||
Uncleared derivatives | ||||||||||||
A | $ | 1,475.6 | $ | 3.9 | $ | (3.7 | ) | $ | 0.2 | |||
Cleared derivatives(2) | 41,954.8 | 5.8 | 133.3 | 139.1 | ||||||||
Liability positions with credit exposure: | ||||||||||||
Uncleared derivatives | ||||||||||||
A | 242.6 | (2.0 | ) | 2.6 | 0.6 | |||||||
BBB | 663.7 | (1.8 | ) | 2.2 | 0.4 | |||||||
Total derivative positions with credit exposure to non-member counterparties | 44,336.7 | 5.9 | 134.4 | 140.3 | ||||||||
Member institutions (3) | 73.6 | — | — | — | ||||||||
Total | $ | 44,410.3 | $ | 5.9 | $ | 134.4 | $ | 140.3 | ||||
Derivative positions without credit exposure | 1,979.3 | |||||||||||
Total notional | $ | 46,389.6 | ||||||||||
75
(in millions) | December 31, 2018 | |||||||||||
Credit Rating (1) | Notional Amount | Fair Value Before Collateral | Cash Collateral Pledged To (From) Counterparties | Net Credit Exposure to Counterparties | ||||||||
Non-member counterparties | ||||||||||||
Asset positions with credit exposure: | ||||||||||||
Uncleared derivatives | ||||||||||||
AA | $ | 105.0 | $ | 1.0 | $ | (0.5 | ) | $ | 0.5 | |||
A | 539.0 | 2.1 | (1.0 | ) | 1.1 | |||||||
BBB | 907.3 | 3.4 | (3.1 | ) | 0.3 | |||||||
Liability positions with credit exposure: | ||||||||||||
Uncleared derivatives | ||||||||||||
A | 2,414.7 | (28.2 | ) | 30.7 | 2.5 | |||||||
BBB | 1,610.3 | (14.3 | ) | 14.6 | 0.3 | |||||||
Cleared derivatives (2) | 38,038.5 | — | 105.6 | 105.6 | ||||||||
Total derivative positions with credit exposure to non-member counterparties | 43,614.8 | (36.0 | ) | 146.3 | 110.3 | |||||||
Member institutions (3) | 17.4 | — | — | — | ||||||||
Total | $ | 43,632.2 | $ | (36.0 | ) | $ | 146.3 | $ | 110.3 | |||
Derivative positions without credit exposure | 2,142.5 | |||||||||||
Total notional | $ | 45,774.7 | ||||||||||
Notes:
(1) This table does not reflect any changes in rating, outlook or watch status occurring after December 31, 2019. The ratings presented in this table represent the lowest long-term counterparty credit rating available for each counterparty based on the NRSROs used by the Bank.
(2) Represents derivative transactions cleared through Clearing Houses.
(3) Member institutions include mortgage delivery commitments.
The following tables summarize the Bank’s uncleared derivative counterparties which represent more than 10% of the Bank’s total uncleared notional amount outstanding as of December 31, 2019 and December 31, 2018. The Bank’s total net credit exposure to uncleared derivative counterparties was $1.2 million and $4.7 million as of December 31, 2019 and December 31, 2018, respectively.
Notional Greater Than 10% | December 31, 2019 | December 31, 2018 | ||||||||
(dollars in millions) Derivative Counterparty | Credit Rating | Notional | % of Notional | Credit Rating | Notional | % of Notional | ||||
Bank of America, NA | A | $ | 1,475.6 | 33.3 | (1) | (1) | (1) | |||
Morgan Stanley Capital | BBB | 663.7 | 15.0 | BBB | $ | 1,610.3 | 20.8 | |||
Wells Fargo, NA | (1) | (1) | (1) | A | 899.0 | 11.6 | ||||
All others | n/a | 2,295.5 | 51.7 | n/a | 5,226.9 | 67.6 | ||||
Total | $ | 4,434.8 | 100.0 | $ | 7,736.2 | 100.0 | ||||
Notes:
(1) The percentage of notional was not greater than 10%.
To appropriately assess potential credit risk to its European holdings, the Bank annually underwrites each counterparty and country and regularly monitors NRSRO rating actions and other publications for changes to credit quality. The Bank also actively monitors its counterparties' approximate indirect exposure to European sovereign debt and considers this exposure as a component of its credit risk review process.
Liquidity and Funding Risk
As a wholesale bank, the Bank employs financial strategies which enable it to expand and contract its assets, liabilities and capital in response to changes in member credit demand, membership composition and other market factors. In addition, the Bank is required to maintain a level of liquidity in accordance with the FHLBank Act, Finance Agency regulations and policies
76
established by its management and board of directors. The Bank’s liquidity resources are designed to support these strategies and requirements through a focus on maintaining a liquidity and funding balance between its financial assets and financial liabilities.
Asset/Liability Maturity Profile. The Bank is focused on maintaining adequate liquidity and funding balances with its financial assets and financial liabilities, and the FHLBanks work collectively to manage system-wide liquidity and funding needs. The FHLBanks jointly monitor the combined risks, primarily by tracking the maturities of financial assets and financial liabilities. The Bank also monitors the funding balance between financial assets and financial liabilities and is committed to prudent risk management practices. External factors including member borrowing needs, supply and demand in the debt markets, and other factors may affect liquidity balances and the funding balances between financial assets and financial liabilities.
Sources of Liquidity. The Bank’s primary sources of liquidity are proceeds from the issuance of consolidated obligations and a liquidity investment portfolio, as well as proceeds from the issuance of capital stock.
Consolidated Obligations. The Bank’s ability to operate its business, meet its obligations and generate net interest income depends primarily on the ability to issue large amounts of various debt structures at attractive rates. Investor demand for FHLBank debt remains strong. Consolidated obligation bonds and discount notes, along with member deposits and capital, represent the primary funding sources used by the Bank to support its asset base. Consolidated obligations benefit from the Bank’s GSE status; however, they are not obligations of the U.S., and the U.S. government does not guarantee them. Consolidated obligation bonds and discount notes are rated Aaa with stable outlook/P-1 by Moody’s and AA+ with stable outlook/A-1+ by S&P as of December 31, 2019. These ratings measure the likelihood of timely payment of principal and interest.
Liquidity Investment Portfolio. The Bank’s liquidity for regulatory purposes is comprised of cash, interest-bearing deposits, Federal funds sold, securities purchased under agreements to resell, and U.S. Treasury obligations classified as trading or AFS.
Contingency Liquidity. If a market or operational disruption occurred that prevented the issuance of new consolidated obligations or discount notes, the Bank could meet its obligations by: (1) allowing short-term liquid investments to mature; (2) purchasing Federal funds; (3) using eligible securities as collateral for repurchase agreement borrowings; and (4) if necessary, allowing advances to mature without renewal. The Bank’s GSE status and the FHLBank System consolidated obligation credit rating, which reflects the fact that all 11 FHLBanks share a joint and several liability on the consolidated obligations, have historically provided excellent capital market access.
The Bank’s liquidity measures are estimates which are dependent upon certain assumptions which may or may not prove valid in the event of an actual complete capital market disruption. Management believes that under normal operating conditions, routine member borrowing needs and consolidated obligation maturities could be met under these requirements; however, under extremely adverse market conditions, the Bank’s ability to meet a significant increase in member loan demand could be impaired without immediate access to the consolidated obligation debt markets.
The Bank’s access to the capital markets has never been interrupted to the extent the Bank’s ability to meet its obligations was compromised, and the Bank currently has no reason to believe that its ability to issue consolidated obligations will be impeded to that extent. Specifically, the Bank’s sources of contingency liquidity include maturing overnight and short-term investments, maturing advances, unencumbered repurchase-eligible assets, trading securities, AFS, certificates of deposits and MBS repayments. Uses of contingency liquidity include net settlements of consolidated obligations, member loan commitments, mortgage loan purchase commitments, deposit outflows and maturing other borrowed funds. Excess contingency liquidity is calculated as the difference between sources and uses of contingency liquidity. At December 31, 2019 and December 31, 2018, excess contingency liquidity was approximately $31.3 billion and $18.3 billion, respectively.
The OF has developed a standard methodology for the allocation of the proceeds from the issuance of consolidated obligations when consolidated obligations cannot be issued in sufficient amounts to satisfy all FHLBank demand for funding during periods of financial distress and when its existing allocation processes are deemed insufficient. In general, this methodology provides that the proceeds in such circumstances will be allocated among the FHLBanks based on relative FHLBank total regulatory capital unless the OF determines that there is an overwhelming reason to adopt a different allocation method. As is the case during any instance of a disruption in the Bank's ability to access the capital markets, market conditions or this allocation could adversely impact the Bank's ability to finance operations, which could thereby adversely impact its financial condition and results of operations.
77
In addition, by law, the Secretary of the Treasury may acquire up to $4 billion of consolidated obligations of the FHLBanks. This authority may be exercised only if alternative means cannot be effectively employed to permit the FHLBanks to continue to supply reasonable amounts of funds to the mortgage market, and the ability to supply such funds is substantially impaired because of monetary stringency and a high level of interest rates. Any funds borrowed shall be repaid by the FHLBanks at the earliest practicable date.
Funding and Debt Issuance. Changes or disruptions in the capital markets could limit the Bank’s ability to issue consolidated obligations. During 2019, the Bank maintained continual access to funding. Access to short-term debt markets has been reliable because investors, driven by increased liquidity preferences and risk aversion, including the effects of money market fund reform, have sought the FHLBank’s short-term debt as an asset of choice. This has led to advantageous funding opportunities and increased utilization of debt maturing in one year or less. The FHLBanks have comparatively stable access to funding through a diverse investor base at relatively favorable spreads to U.S. Treasury rates.
Refinancing Risk. There are inherent risks in utilizing short-term funding to support longer-dated assets and the Bank may be exposed to refinancing and investor concentration risks (collectively, refinancing risk). Refinancing risk includes the risk the Bank could have difficulty in rolling over short-term obligations when market conditions change. In managing and monitoring the amounts of financial assets that require refinancing, the Bank considers their contractual maturities, as well as certain assumptions regarding expected cash flows (i.e., estimated prepayments, embedded call optionality, and scheduled amortizations). The Bank and the OF jointly monitor the combined refinancing risk of the FHLBank system. In managing and monitoring the amounts of assets that require refunding, the Bank may consider contractual maturities of the financial assets, as well as certain assumptions regarding expected cash flows (i.e., estimated prepayments and scheduled amortizations).
Interest Rate Risk. The Bank may use a portion of the short-term consolidated obligations issued to fund both short- and long-term variable rate-indexed assets. However, funding longer-term variable rate-indexed assets with shorter-term liabilities generally does not expose the Bank to interest rate risk because the rates on the variable rate-indexed assets reset similar to the liabilities. The Bank measures and monitors interest rate-risk with commonly used methods and metrics, which include the calculations of market value of equity, duration of equity, and duration gap.
Regulatory Liquidity Requirements. The Bank is required to maintain a level of liquidity in accordance with certain Finance Agency guidance. Under these policies and guidelines, the Bank is required to maintain contingency liquidity to meet liquidity needs in an amount at least equal to its anticipated net cash outflows under certain scenarios. In addition, the Finance Agency issued an Advisory Bulletin on FHLBank liquidity (the Liquidity Guidance AB), effective March 31, 2019, that communicates the Finance Agency’s expectations with respect to the maintenance of sufficient liquidity to enable the Bank to provide advances and letters of credit for members.
The Bank's liquidity resources are designed to support these strategies and requirements. As a result of the new liquidity requirements, the Bank increased its liquidity portfolio at December 31, 2019 by $1.7 billion compared to December 31, 2018. In accordance with the Liquidity Guidance AB effective March 31, 2019, one scenario assumes that the Bank cannot access the capital markets for a period of 10 days and during that time members would renew any maturing, prepaid or called advances. Effective December 31, 2019, the period that the Bank cannot access the capital markets increases from 10 days to 20 days. In addition, the Bank is required to perform and report to the Finance Agency the results of an annual liquidity stress test. The Bank was in compliance with these requirements at December 31, 2019.
Negative Pledge Requirement. Finance Agency regulations require the Bank to maintain qualifying assets free from any lien or pledge in an amount at least equal to its portion of the total consolidated obligations outstanding issued on its behalf. Qualifying assets meeting the negative pledge requirement are defined as: (1) cash; (2) obligations of, or fully guaranteed by, the United States; (3) secured advances; (4) mortgages which have any guaranty, insurance or commitment from the United States or a Federal agency; and (5) investments described in Section 16(a) of the Act, which includes securities that a fiduciary or trust fund may purchase under the laws of any of the three states in which the Bank operates. As of December 31, 2019 and December 31, 2018, the Bank held total negative pledge qualifying assets in excess of total consolidated obligations of $5.6 billion and $6.2 billion, respectively. The FHLBanks will continue to be required to operate individually and collectively to ensure that consolidated obligations maintain a high level of acceptance and are perceived by investors as presenting a low level of credit risk.
Joint and Several Liability. Although the Bank is primarily liable for its portion of consolidated obligations, (i.e., those issued on its behalf), the Bank is also jointly and severally liable with the other 10 FHLBanks for the payment of principal and interest on consolidated obligations of all the FHLBanks. The Finance Agency, in its discretion and notwithstanding any other provisions, may at any time order any FHLBank to make principal or interest payments due on any consolidated obligation, even in the absence of default by the primary obligor. To the extent that an FHLBank makes any payment on a consolidated
78
obligation on behalf of another FHLBank, the paying FHLBank shall be entitled to reimbursement from the non-paying FHLBank, which has a corresponding obligation to reimburse the FHLBank to the extent of such assistance and other associated costs. However, if the Finance Agency determines that the non-paying FHLBank is unable to satisfy its obligations, then the Finance Agency may allocate the outstanding liability among the remaining FHLBanks on a pro rata basis in proportion to each FHLBank’s participation in all consolidated obligations outstanding, or on any other basis the Finance Agency may determine. Finance Agency regulations govern the issuance of debt on behalf of the FHLBanks and authorize the FHLBanks to issue consolidated obligations, through the OF as its agent. The Bank is not permitted to issue individual debt without Finance Agency approval. See Note 13 - Consolidated Obligations of the audited financial statements in Item 8. Financial Statements and Supplementary Financial Data in this Form 10-K for additional information.
Consolidated obligation bonds and discount notes outstanding for each of the FHLBanks acting as primary obligor are presented in the following table, exclusive of combining adjustments. The Bank’s total consolidated obligation bonds and discount notes represented 8.8% and 9.8% of total FHLBank System consolidated obligations at December 31, 2019 and December 31, 2018, respectively.
December 31, 2019 | December 31, 2018 | |||||||||||||||||||||
Discount | Discount | |||||||||||||||||||||
(in millions - par value) | Bonds | Notes | Total | Bonds | Notes | Total | ||||||||||||||||
Atlanta | $ | 88,483.3 | $ | 52,298.0 | $ | 140,781.3 | $ | 79,266.3 | $ | 66,270.1 | $ | 145,536.4 | ||||||||||
Boston | 23,804.8 | 27,733.2 | 51,538.0 | 25,901.3 | 33,147.1 | 59,048.4 | ||||||||||||||||
Chicago | 50,398.4 | 41,770.0 | 92,168.4 | 42,486.0 | 43,279.8 | 85,765.8 | ||||||||||||||||
Cincinnati | 38,380.6 | 49,177.0 | 87,557.6 | 45,647.2 | 47,071.1 | 92,718.3 | ||||||||||||||||
Dallas | 35,684.3 | 34,405.7 | 70,090.0 | 32,113.9 | 35,882.0 | 67,995.9 | ||||||||||||||||
Des Moines | 91,373.3 | 29,592.4 | 120,965.7 | 94,024.1 | 43,052.1 | 137,076.2 | ||||||||||||||||
Indianapolis | 44,662.9 | 17,713.2 | 62,376.1 | 40,374.9 | 20,952.7 | 61,327.6 | ||||||||||||||||
New York | 78,108.8 | 74,094.6 | 152,203.4 | 83,758.0 | 50,805.5 | 134,563.5 | ||||||||||||||||
Pittsburgh | 66,704.2 | 23,211.5 | 89,915.7 | 64,368.4 | 36,985.0 | 101,353.4 | ||||||||||||||||
San Francisco | 71,370.2 | 27,447.6 | 98,817.8 | 72,336.1 | 29,272.9 | 101,609.0 | ||||||||||||||||
Topeka | 31,970.7 | 27,510.0 | 59,480.7 | 23,973.9 | 20,649.1 | 44,623.0 | ||||||||||||||||
Total FHLBank System | $ | 620,941.5 | $ | 404,953.2 | $ | 1,025,894.7 | $ | 604,250.1 | $ | 427,367.4 | $ | 1,031,617.5 | ||||||||||
Operational and Business Risks
Operational Risk. Operational Risk is defined as the potential for loss resulting from inadequate or failed internal processes, people, and systems, or from external events and encompasses risks related to housing mission-related activities, including activities associated with affordable housing programs or goals. The Bank considers various sources of risk of unexpected loss, including human error, fraud, unenforceability of legal contracts, deficiencies in internal controls and/or information systems, or damage from fire, theft, natural disaster or acts of terrorism. Generally, the category of operational risk includes loss exposures of a physical or procedural nature. Specifically, operational risk includes compliance, fraud, information/transaction, legal, cyber, vendor, people, succession and model risk.The Bank has established policies and procedures to manage each of the specific operational risks.
The Bank has established policies and procedures to manage each of the specific operational risks. The Bank’s Internal Audit department, which reports directly to the Audit Committee of the Board, regularly monitors compliance with established policies and procedures. Management monitors the effectiveness of the internal control environment on an ongoing basis and takes action as appropriate to enhance the environment. Some operational risk may also result from external factors, such as the failure of other parties with which the Bank conducts business to adequately address their own operational risks.
Governance over the management of operational risks takes place through the Bank’s various risk management committees. Business areas retain primary responsibility for identifying, assessing and reporting their operational risks. To assist them in discharging this responsibility and to ensure that operational risk is managed consistently throughout the organization, the Bank has an effective operational risk management framework, which includes quantitative and qualitative key risk indicators, as well as a Bank-wide compliance framework designed to promote awareness of compliance requirements and monitor compliance activities.
79
In addition to the particular risks and challenges that it faces, the Bank also experiences ongoing operational risks that are similar to those of other large financial institutions. The Bank relies on third-party vendors and other service providers for ongoing support of business activities. Disruption or failure of service or breach of security at one of these suppliers could impact the Bank’s ability to conduct business or expose the Bank to financial loss, loss of intellectual property, or confidential information. The Bank has vendor management processes in place to manage third-party relationships. The Bank is also exposed to the risk that a catastrophic event could result in significant business disruption and an inability to process transactions through normal business processes. To mitigate these risks, the Bank maintains and tests business continuity plans and has established backup facilities for critical business processes and systems away from its headquarters. The Bank also has a reciprocal backup agreement in place with another FHLBank to provide its members short-term loans and debt servicing of the Bank in the event that both of the Pittsburgh facilities are inoperable. The results of the Bank’s periodic business continuity tests are presented annually to the Board. Management can make no assurances that these measures will be sufficient to respond to the full range of catastrophic events that might occur.
The Bank's business is dependent upon its ability to effectively exchange and process information using its computer information systems. The Bank's products and services require a complex and sophisticated computing environment, which includes licensed or purchased, custom-developed software and SaaS. Maintaining the effectiveness and efficiency of the Bank's operations is dependent upon the continued timely implementation of technology solutions and systems, which may require ongoing expenditures, as well as the ability to sustain ongoing operations during technology solution implementations or upgrades. If the Bank were unable to sustain its technological capabilities, it may not be able to remain competitive, and its business, financial condition and profitability may be significantly compromised. To advance its disaster recovery and continuous operations, the Bank continues to take steps to review and improve its recovery facilities and processes through its Business Continuity Plan. Nonetheless, the Bank cannot guarantee the effectiveness of its Business Continuity Plan or other related policies, procedures and systems to protect the Bank in any particular future situation.
The Bank maintains insurance coverage for employee misappropriation, as well as director and officer liability protection. Additionally, insurance coverage is in place for electronic data-processing equipment and software, personal property, leasehold improvements, property damage, personal injury and cyber-related incidents. The Bank maintains additional insurance protection as deemed appropriate. The Bank regularly reviews its insurance coverage for adequacy as well as the financial claims paying ability of its insurance carriers.
Business Risk. Business risk is the possibility of an adverse impact on the Bank’s profitability or financial or business strategies resulting from external factors that may occur in the short-term and/or long-term. This risk includes the potential for strategic business constraints to be imposed through regulatory, legislative or political changes. Examples of external factors may include, but are not limited to: continued financial services industry consolidation, a declining membership base, concentration of borrowing among members, the introduction of new competing products and services, increased non-Bank competition, weakening of the FHLBank System’s GSE status, changes in the deposit and mortgage markets for the Bank’s members, mortgage market changes that could occur if new GSE legislation is implemented, and other factors that may have a significant direct or indirect impact on the ability of the Bank to achieve its mission and strategic objectives. The Bank’s Risk Management Committee monitors economic indicators and the external environment in which the Bank operates for alignment with the Bank's risk appetite. A discussion of various Bank risks is also included in Item 1A. Risk Factors in this Form 10-K.
The Bank continues to evaluate its risks and monitor the changes in the market as it relates to the cessation of LIBOR and the transition to an alternative rate (e.g., SOFR). The Bank has developed a LIBOR transition plan which addresses considerations such as: exposure, fallback language, systems preparation, and balance sheet management. In addition, beginning in 2020, the Bank has changed the index upon which it bases risk measures and executive compensation from LIBOR to average Federal funds rate.
80
The Bank has assessed its exposure to LIBOR by developing an inventory of impacted financial instruments. The Bank assumes LIBOR will continue to exist as the market benchmark rate until the end of 2021. The Bank manages interest rate risk between its assets and liabilities by entering into derivatives to preserve the value of and earn stable returns on its assets. These instruments may have different fallback features when LIBOR ceases. The following table presents the Bank’s LIBOR-indexed financial instruments, excluding interest rate caps, by year of contractual maturity as of December 31, 2019.
(in millions) | 2020 | 2021 | Thereafter | Total | ||||||||
Assets Indexed to LIBOR | ||||||||||||
Principal Amount: | ||||||||||||
Advances | $ | 17,933.0 | $ | 7,600.0 | $ | 153.1 | $ | 25,686.1 | ||||
Investments: | ||||||||||||
Non-MBS | — | — | 94.3 | 94.3 | ||||||||
MBS | 84.7 | 3.9 | 8,079.1 | 8,167.7 | ||||||||
Derivatives Hedging Assets (Receive Leg LIBOR) | ||||||||||||
Notional Amount: | ||||||||||||
Cleared | 3,932.2 | 6,480.5 | 5,929.7 | 16,342.4 | ||||||||
Uncleared | 14.5 | — | 272.1 | 286.6 | ||||||||
Total Principal/Notional Amounts | $ | 21,964.4 | $ | 14,084.4 | $ | 14,528.3 | $ | 50,577.1 | ||||
Liabilities Indexed to LIBOR | ||||||||||||
Principal Amount: | ||||||||||||
Consolidated Obligations | $ | 28,585.0 | $ | 1,445.0 | $ | 640.0 | $ | 30,670.0 | ||||
Derivatives Hedging Liabilities (Pay Leg LIBOR) | ||||||||||||
Notional Amount: | ||||||||||||
Cleared | 16,528.9 | 1,219.3 | 610.5 | 18,358.7 | ||||||||
Uncleared | 1,307.6 | 702.0 | 735.0 | 2,744.6 | ||||||||
Total Principal/Notional Amounts | $ | 46,421.5 | $ | 3,366.3 | $ | 1,985.5 | $ | 51,773.3 | ||||
To assess trigger events requiring potential fallback language, the Bank has evaluated its contracts. As to advance contracts with its members, the Bank has added or adjusted fallback language. Similarly, fallback language has been added to consolidated obligation agreements. As to derivatives and investments held by the Bank that are tied to LIBOR, the Bank is monitoring market-wide efforts to enhance fallback language for new activity and develop frameworks to address existing transactions. The operational impact of adjusting terms and conditions to reflect the fallback language may be impacted by the number of financial instruments and counterparties.
81
The Bank continues to execute certain variable rate instruments that are indexed to LIBOR. The Bank is assessing its operational readiness including potential effects on core Bank systems. From a balance sheet management perspective, the Bank has issued SOFR-indexed debt and SOFR-indexed advance products. Additionally, the Bank has been executing OIS and SOFR indexed derivatives as alternative interest rate hedging strategies. The following table presents the Bank’s variable rate financial instruments, excluding interest rate caps, by index as of December 31, 2019.
(in millions) | LIBOR | SOFR | OIS | Other | Total | ||||||||||
Assets Indexed to a Variable Rate | |||||||||||||||
Principal Amount: | |||||||||||||||
Advances | $ | 25,686.1 | $ | 50.0 | $ | — | $ | 1,371.5 | $ | 27,107.6 | |||||
Investments: | |||||||||||||||
Non-MBS | 94.3 | — | — | — | 94.3 | ||||||||||
MBS | 8,167.7 | — | — | 127.6 | 8,295.3 | ||||||||||
Derivatives Hedging Assets (Receive Leg Variable Rate) | |||||||||||||||
Notional Amount | 16,629.0 | 3,251.3 | 2,357.3 | — | 22,237.6 | ||||||||||
Total Principal/Notional Amounts | $ | 50,577.1 | $ | 3,301.3 | $ | 2,357.3 | $ | 1,499.1 | $ | 57,734.8 | |||||
Liabilities Indexed to a Variable Rate | |||||||||||||||
Principal Amount: | |||||||||||||||
Consolidated obligations | $ | 30,670.0 | $ | 6,742.0 | $ | — | $ | — | $ | 37,412.0 | |||||
Derivatives Hedging Liabilities (Pay Leg Variable Rate) | |||||||||||||||
Notional Amount | 21,103.3 | 1,475.0 | 170.1 | — | 22,748.4 | ||||||||||
Total Principal/Notional Amounts | $ | 51,773.3 | $ | 8,217.0 | $ | 170.1 | $ | — | $ | 60,160.4 | |||||
In September 2019, the Finance Agency issued a supervisory letter to the FHLBanks providing LIBOR transition guidance. The supervisory letter states that by March 31, 2020, the FHLBanks should no longer enter into new financial assets, liabilities, and derivatives that reference LIBOR and mature after December 31, 2021, for all product types except investments. By December 31, 2019, the FHLBanks stopped purchasing investments that reference LIBOR and mature after December 31, 2021. In addition, the Bank has ceased entering into derivatives with swaps, caps, or floors indexed to LIBOR that terminate after December 31, 2021. See Legislative and Regulatory Developments in Item 7. of this Form 10-K for more information.
Item 7A: Quantitative and Qualitative Disclosures about Market Risk
See the Risk Management section of Item 7. Management’s Discussion and Analysis in this Form 10-K.
82
Item 8: Financial Statements and Supplementary Financial Data
Supplementary financial data for each full quarter within the two years ended December 31, 2019 and December 31, 2018 are in the table entitled Selected Quarterly Financial Data in Item 7. Other Financial Information in Management's Discussion and Analysis of Financial Condition and Results of Operations in this Form 10-K.
Management’s Report on Internal Control over Financial Reporting
The management of the Bank is responsible for establishing and maintaining adequate internal control over financial reporting, as such term is defined in Exchange Act Rule 13a-15(f). The Bank’s internal control over financial reporting is designed by and under the supervision of the Bank’s management, including the Chief Executive Officer, Chief Operating Officer, and the Chief Accounting Officer. The Bank’s internal controls over financial reporting are to provide reasonable assurance regarding the reliability of financial reporting and the preparation of financial statements for external reporting purposes in accordance with GAAP in the United States of America.
Because of its inherent limitations, internal control over financial reporting may not prevent or detect misstatements. Also, projections of any evaluation of effectiveness to future periods are subject to the risk that controls may become inadequate because of changes in conditions, or that the degree of compliance with the policies or procedures may deteriorate. The Bank’s management assessed the effectiveness of the Bank’s internal control over financial reporting as of December 31, 2019. In making this assessment, it used the criteria set forth by the Committee of Sponsoring Organizations of the Treadway Commission (COSO) in the Internal Control-Integrated Framework (2013). Based on its assessment, management of the Bank determined that as of December 31, 2019, the Bank’s internal control over financial reporting was effective based on those criteria.
The effectiveness of the Bank’s internal control over financial reporting as of December 31, 2019 has been audited by PricewaterhouseCoopers LLP, the Bank’s independent registered public accounting firm, as stated in their report that follows.
83
Report of Independent Registered Public Accounting Firm
To the Board of Directors and Shareholders of the
Federal Home Loan Bank of Pittsburgh:
Opinions on the Financial Statements and Internal Control over Financial Reporting
We have audited the accompanying statements of condition of the Federal Home Loan Bank of Pittsburgh (the “FHLBank”) as of December 31, 2019 and 2018, and the related statements of income, comprehensive income, cash flows, and changes in capital for each of the three years in the period ended December 31, 2019, including the related notes (collectively referred to as the “financial statements”). We also have audited the FHLBank’s internal control over financial reporting as of December 31, 2019, based on criteria established in Internal Control - Integrated Framework (2013) issued by the Committee of Sponsoring Organizations of the Treadway Commission (COSO).
In our opinion, the financial statements referred to above present fairly, in all material respects, the financial position of the FHLBank as of December 31, 2019 and 2018, and the results of its operations and its cash flows for each of the three years in the period ended December 31, 2019 in conformity with accounting principles generally accepted in the United States of America. Also in our opinion, the FHLBank maintained, in all material respects, effective internal control over financial reporting as of December 31, 2019, based on criteria established in Internal Control - Integrated Framework (2013) issued by the COSO.
Basis for Opinions
The FHLBank’s management is responsible for these financial statements, for maintaining effective internal control over financial reporting, and for its assessment of the effectiveness of internal control over financial reporting, included in the accompanying Management's Report on Internal Control over Financial Reporting. Our responsibility is to express opinions on the FHLBank’s financial statements and on the FHLBank’s internal control over financial reporting based on our audits. We are a public accounting firm registered with the Public Company Accounting Oversight Board (United States) (“PCAOB”) and are required to be independent with respect to the FHLBank in accordance with the U.S. federal securities laws and the applicable rules and regulations of the Securities and Exchange Commission and the PCAOB.
We conducted our audits in accordance with the standards of the PCAOB. Those standards require that we plan and perform the audits to obtain reasonable assurance about whether the financial statements are free of material misstatement, whether due to error or fraud, and whether effective internal control over financial reporting was maintained in all material respects.
Our audits of the financial statements included performing procedures to assess the risks of material misstatement of the financial statements, whether due to error or fraud, and performing procedures that respond to those risks. Such procedures included examining, on a test basis, evidence regarding the amounts and disclosures in the financial statements. Our audits also included evaluating the accounting principles used and significant estimates made by management, as well as evaluating the overall presentation of the financial statements. Our audit of internal control over financial reporting included obtaining an understanding of internal control over financial reporting, assessing the risk that a material weakness exists, and testing and evaluating the design and operating effectiveness of internal control based on the assessed risk. Our audits also included performing such other procedures as we considered necessary in the circumstances. We believe that our audits provide a reasonable basis for our opinions.
Definition and Limitations of Internal Control over Financial Reporting
A company’s internal control over financial reporting is a process designed to provide reasonable assurance regarding the reliability of financial reporting and the preparation of financial statements for external purposes in accordance with generally accepted accounting principles. A company’s internal control over financial reporting includes those policies and procedures that (i) pertain to the maintenance of records that, in reasonable detail, accurately and fairly reflect the transactions and dispositions of the assets of the company; (ii) provide reasonable assurance that transactions are recorded as necessary to permit preparation of financial statements in accordance with generally accepted accounting principles, and that receipts and expenditures of the company are being made only in accordance with authorizations of management and directors of the company; and (iii) provide reasonable assurance regarding prevention or timely detection of unauthorized acquisition, use, or disposition of the company’s assets that could have a material effect on the financial statements.
84
Because of its inherent limitations, internal control over financial reporting may not prevent or detect misstatements. Also, projections of any evaluation of effectiveness to future periods are subject to the risk that controls may become inadequate because of changes in conditions, or that the degree of compliance with the policies or procedures may deteriorate.
/s/ PricewaterhouseCoopers LLP
Pittsburgh, Pennsylvania
March 10, 2020
We have served as the FHLBank’s auditor since 1990.
85
Federal Home Loan Bank of Pittsburgh
Statements of Income
Year Ended December 31, | |||||||||
(in thousands) | 2019 | 2018 | 2017 | ||||||
Interest income: | |||||||||
Advances | $ | 1,871,151 | $ | 1,648,474 | $ | 987,272 | |||
Interest-bearing deposits | 38,602 | 16,737 | 2,408 | ||||||
Securities purchased under agreements to resell | 33,411 | 13,458 | 1,834 | ||||||
Federal funds sold | 152,502 | 114,635 | 74,881 | ||||||
Trading securities | 62,258 | 13,839 | 11,266 | ||||||
Available-for-sale (AFS) securities | 275,427 | 224,978 | 188,462 | ||||||
Held-to-maturity (HTM) securities | 83,523 | 78,267 | 54,969 | ||||||
Mortgage loans held for portfolio | 170,136 | 151,002 | 132,622 | ||||||
Total interest income | 2,687,010 | 2,261,390 | 1,453,714 | ||||||
Interest expense: | |||||||||
Consolidated obligations - discount notes | 601,223 | 494,173 | 287,021 | ||||||
Consolidated obligations - bonds | 1,603,336 | 1,288,245 | 725,948 | ||||||
Deposits | 11,261 | 7,878 | 4,914 | ||||||
Mandatorily redeemable capital stock and other borrowings | 17,348 | 1,005 | 363 | ||||||
Total interest expense | 2,233,168 | 1,791,301 | 1,018,246 | ||||||
Net interest income | 453,842 | 470,089 | 435,468 | ||||||
Provision for credit losses | 1,263 | 3,121 | 178 | ||||||
Net interest income after provision for credit losses | 452,579 | 466,968 | 435,290 | ||||||
Other noninterest income (loss): | |||||||||
Net OTTI losses (Note 7) | (570 | ) | (957 | ) | (959 | ) | |||
Net gains (losses) on investment securities (Notes 4 and 5) | 18,705 | (9,743 | ) | 2,672 | |||||
Net gains (losses) on derivatives and hedging activities (Note 11) | (39,795 | ) | (4,537 | ) | 4,586 | ||||
Standby letters of credit fees | 21,827 | 23,675 | 24,289 | ||||||
Other, net | 2,859 | 2,541 | 1,635 | ||||||
Total other noninterest income (loss) | 3,026 | 10,979 | 32,223 | ||||||
Other expense: | |||||||||
Compensation and benefits | 50,659 | 46,273 | 49,649 | ||||||
Other operating | 38,441 | 34,941 | 30,199 | ||||||
Finance Agency | 6,671 | 5,954 | 5,538 | ||||||
Office of Finance | 5,769 | 4,945 | 4,727 | ||||||
Total other expense | 101,540 | 92,113 | 90,113 | ||||||
Income before assessments | 354,065 | 385,834 | 377,400 | ||||||
Affordable Housing Program (AHP) assessment (Note 14) | 37,140 | 38,683 | 37,768 | ||||||
Net income | $ | 316,925 | $ | 347,151 | $ | 339,632 | |||
The accompanying notes are an integral part of these financial statements.
86
Federal Home Loan Bank of Pittsburgh
Statements of Comprehensive Income
Year ended December 31, | |||||||||
(in thousands) | 2019 | 2018 | 2017 | ||||||
Net income | $ | 316,925 | $ | 347,151 | $ | 339,632 | |||
Other comprehensive income (loss): | |||||||||
Net unrealized gains (losses) on AFS securities | 35,268 | (31,323 | ) | 54,045 | |||||
Net non-credit portion of OTTI gains (losses) on AFS securities | (13,429 | ) | (7,820 | ) | 5,529 | ||||
Reclassification of net (gains) included in net income relating to hedging activities | (27 | ) | (24 | ) | (23 | ) | |||
Pension and post-retirement benefits | (3,132 | ) | 1,349 | (883 | ) | ||||
Total other comprehensive income (loss) | 18,680 | (37,818 | ) | 58,668 | |||||
Total comprehensive income | $ | 335,605 | $ | 309,333 | $ | 398,300 | |||
The accompanying notes are an integral part of these financial statements.
87
Federal Home Loan Bank of Pittsburgh
Statements of Condition
December 31, | ||||||
(in thousands) | 2019 | 2018 | ||||
ASSETS | ||||||
Cash and due from banks (Note 3) | $ | 21,490 | $ | 71,320 | ||
Interest-bearing deposits | 1,476,890 | 2,123,240 | ||||
Federal funds sold | 3,770,000 | 4,740,000 | ||||
Securities purchased under agreements to resell | 2,200,000 | 1,000,000 | ||||
Investment securities: | ||||||
Trading securities (Note 4) | 3,631,650 | 1,281,053 | ||||
AFS securities, at fair value (Note 5) | 11,097,769 | 7,846,257 | ||||
HTM securities; fair value of $2,440,288 and $3,101,133, respectively (Note 6) | 2,395,691 | 3,086,032 | ||||
Total investment securities | 17,125,110 | 12,213,342 | ||||
Advances (Note 8) | 65,610,075 | 82,475,547 | ||||
Mortgage loans held for portfolio (Note 9), net of allowance for credit losses of $7,832 and $7,309, respectively (Note 10) | 5,114,625 | 4,461,612 | ||||
Banking on Business (BOB) loans, net of allowance for credit losses of $3,065 and $2,560, respectively (Note 10) | 19,706 | 17,371 | ||||
Accrued interest receivable | 193,352 | 234,161 | ||||
Derivative assets (Note 11) | 140,251 | 110,269 | ||||
Other assets | 52,630 | 39,657 | ||||
Total assets | $ | 95,724,129 | $ | 107,486,519 | ||
LIABILITIES AND CAPITAL | ||||||
Liabilities | ||||||
Deposits (Note 12) | $ | 573,382 | $ | 387,085 | ||
Consolidated obligations (Note 13) | ||||||
Discount notes | 23,141,362 | 36,896,603 | ||||
Bonds | 66,807,807 | 64,298,628 | ||||
Total consolidated obligations | 89,949,169 | 101,195,231 | ||||
Mandatorily redeemable capital stock (Note 15) | 343,575 | 24,099 | ||||
Accrued interest payable | 205,118 | 226,537 | ||||
AHP payable (Note 14) | 112,289 | 99,578 | ||||
Derivative liabilities (Note 11) | 3,024 | 25,511 | ||||
Other liabilities | 64,736 | 152,184 | ||||
Total liabilities | 91,251,293 | 102,110,225 | ||||
Commitments and contingencies (Note 19) | ||||||
Capital (Note 15) | ||||||
Capital stock - putable ($100 par value) issued and outstanding 30,550 and 40,272 shares | 3,054,996 | 4,027,244 | ||||
Retained earnings: | ||||||
Unrestricted | 910,726 | 924,001 | ||||
Restricted | 415,288 | 351,903 | ||||
Total retained earnings | 1,326,014 | 1,275,904 | ||||
Accumulated Other Comprehensive Income (AOCI) | 91,826 | 73,146 | ||||
Total capital | 4,472,836 | 5,376,294 | ||||
Total liabilities and capital | $ | 95,724,129 | $ | 107,486,519 | ||
The accompanying notes are an integral part of these financial statements.
88
Federal Home Loan Bank of Pittsburgh
Statements of Cash Flows
Year Ended December 31, | |||||||||
(in thousands) | 2019 | 2018 | 2017 | ||||||
OPERATING ACTIVITIES | |||||||||
Net income | $ | 316,925 | $ | 347,151 | $ | 339,632 | |||
Adjustments to reconcile net income to net cash provided by (used in) operating activities: | |||||||||
Depreciation and amortization | (75,948 | ) | 4,023 | 26,927 | |||||
Net change in derivative and hedging activities | (284,511 | ) | 71,235 | 43,973 | |||||
Net OTTI credit losses | 570 | 957 | 959 | ||||||
Other adjustments | 3,276 | 3,124 | 178 | ||||||
Net change in: | |||||||||
Trading securities | (2,350,597 | ) | (891,414 | ) | (4,049 | ) | |||
Accrued interest receivable | 40,781 | (69,918 | ) | (40,103 | ) | ||||
Other assets | (7,251 | ) | (5,432 | ) | (5,191 | ) | |||
Accrued interest payable | (21,414 | ) | 108,071 | 1,289 | |||||
Other liabilities | 16,804 | 10,867 | 18,711 | ||||||
Net cash provided by (used in) operating activities | $ | (2,361,365 | ) | $ | (421,336 | ) | $ | 382,326 | |
INVESTING ACTIVITIES | |||||||||
Net change in: | |||||||||
Interest-bearing deposits (including $238, $(71) and $569 (to)/from other FHLBanks) | $ | 662,920 | $ | (1,882,865 | ) | $ | (262,366 | ) | |
Securities purchased under agreements to resell | (1,200,000 | ) | (500,000 | ) | 1,500,000 | ||||
Federal funds sold | 970,000 | 910,000 | (2,428,000 | ) | |||||
AFS securities: | |||||||||
Proceeds | 2,115,531 | 2,356,790 | 1,562,845 | ||||||
Purchases | (5,364,087 | ) | (1,298,323 | ) | (1,305,985 | ) | |||
HTM securities: | |||||||||
Proceeds | 1,716,232 | 3,703,274 | 3,004,705 | ||||||
Purchases | (1,026,982 | ) | (4,907,754 | ) | (2,323,286 | ) | |||
Advances: | |||||||||
Repaid | 1,052,295,531 | 1,220,509,586 | 925,066,860 | ||||||
Originated | (1,035,138,092 | ) | (1,228,727,329 | ) | (922,617,397 | ) | |||
Mortgage loans held for portfolio: | |||||||||
Proceeds | 639,308 | 418,510 | 447,613 | ||||||
Purchases | (1,311,077 | ) | (976,565 | ) | (999,977 | ) | |||
Other investing activities, net | 2,699 | 4,896 | 6,144 | ||||||
Net cash provided by (used in) investing activities | $ | 14,361,983 | $ | (10,389,780 | ) | $ | 1,651,156 | ||
89
Federal Home Loan Bank of Pittsburgh Statements of Cash Flows (continued) | |||||||||
Year Ended December 31, | |||||||||
(in thousands) | 2019 | 2018 | 2017 | ||||||
FINANCING ACTIVITIES | |||||||||
Net change in deposits | $ | 189,283 | $ | (145,780 | ) | $ | (20,815 | ) | |
Net proceeds from issuance of consolidated obligations: | |||||||||
Discount notes | 454,063,438 | 463,639,676 | 352,450,978 | ||||||
Bonds | 69,344,940 | 55,384,368 | 46,624,789 | ||||||
Payments for maturing and retiring consolidated obligations: | |||||||||
Discount notes | (467,767,787 | ) | (462,967,221 | ) | (344,814,684 | ) | |||
Bonds | (66,960,735 | ) | (48,602,058 | ) | (56,181,533 | ) | |||
Proceeds from issuance of capital stock | 6,451,262 | 5,991,346 | 4,312,855 | ||||||
Payments for repurchase/redemption of capital stock | (7,061,961 | ) | (5,580,025 | ) | (4,402,864 | ) | |||
Payments for repurchase/redemption of mandatorily redeemable capital stock | (42,073 | ) | (23,747 | ) | (6,849 | ) | |||
Cash dividends paid | (266,815 | ) | (229,115 | ) | (167,972 | ) | |||
Net cash provided by (used in) financing activities | $ | (12,050,448 | ) | $ | 7,467,444 | $ | (2,206,095 | ) | |
Net increase (decrease) in cash and due from banks | $ | (49,830 | ) | $ | (3,343,672 | ) | $ | (172,613 | ) |
Cash and due from banks at beginning of the period | 71,320 | 3,414,992 | 3,587,605 | ||||||
Cash and due from banks at end of the period | $ | 21,490 | $ | 71,320 | $ | 3,414,992 | |||
Supplemental disclosures: | |||||||||
Interest paid | $ | 2,351,624 | $ | 1,688,240 | $ | 986,348 | |||
AHP payments | 24,429 | 30,668 | 22,917 | ||||||
Variation margin recharacterized as settlement payments on derivative contracts | — | — | 44,674 | ||||||
Capital stock reclassified to mandatorily redeemable capital stock | 361,549 | 42,733 | 6,746 | ||||||
The accompanying notes are an integral part of these financial statements.
90
Federal Home Loan Bank of Pittsburgh
Statements of Changes in Capital
Capital Stock - Putable | Retained Earnings | |||||||||||||||||||||||||
(in thousands) | Shares | Par Value | Unrestricted | Restricted | Total | AOCI | Total Capital | |||||||||||||||||||
December 31, 2016 | 37,554 | $ | 3,755,411 | $ | 771,661 | $ | 214,547 | $ | 986,208 | $ | 52,296 | $ | 4,793,915 | |||||||||||||
Comprehensive income | — | — | 271,706 | 67,926 | 339,632 | 58,668 | 398,300 | |||||||||||||||||||
Issuance of capital stock | 43,129 | 4,312,855 | — | — | — | — | 4,312,855 | |||||||||||||||||||
Repurchase/redemption of capital stock | (44,028 | ) | (4,402,864 | ) | — | — | — | — | (4,402,864 | ) | ||||||||||||||||
Shares reclassified to mandatorily redeemable capital stock | (68 | ) | (6,746 | ) | — | — | — | — | (6,746 | ) | ||||||||||||||||
Cash dividends | — | — | (167,972 | ) | — | (167,972 | ) | — | (167,972 | ) | ||||||||||||||||
December 31, 2017 | 36,587 | $ | 3,658,656 | $ | 875,395 | $ | 282,473 | $ | 1,157,868 | $ | 110,964 | $ | 4,927,488 | |||||||||||||
Capital Stock - Putable | Retained Earnings | |||||||||||||||||||||||||
(in thousands) | Shares | Par Value | Unrestricted | Restricted | Total | AOCI | Total Capital | |||||||||||||||||||
December 31, 2017 | 36,587 | $ | 3,658,656 | $ | 875,395 | $ | 282,473 | $ | 1,157,868 | $ | 110,964 | $ | 4,927,488 | |||||||||||||
Comprehensive income (loss) | — | — | 277,721 | 69,430 | 347,151 | (37,818 | ) | 309,333 | ||||||||||||||||||
Issuance of capital stock | 59,913 | 5,991,346 | — | — | — | — | 5,991,346 | |||||||||||||||||||
Repurchase/redemption of capital stock | (55,801 | ) | (5,580,025 | ) | — | — | — | — | (5,580,025 | ) | ||||||||||||||||
Shares reclassified to mandatorily redeemable capital stock | (427 | ) | (42,733 | ) | — | — | — | — | (42,733 | ) | ||||||||||||||||
Cash dividends | — | — | (229,115 | ) | — | (229,115 | ) | — | (229,115 | ) | ||||||||||||||||
December 31, 2018 | 40,272 | $ | 4,027,244 | $ | 924,001 | $ | 351,903 | $ | 1,275,904 | $ | 73,146 | $ | 5,376,294 | |||||||||||||
Capital Stock - Putable | Retained Earnings | |||||||||||||||||||||||||
(in thousands) | Shares | Par Value | Unrestricted | Restricted | Total | AOCI | Total Capital | |||||||||||||||||||
December 31, 2018 | 40,272 | $ | 4,027,244 | $ | 924,001 | $ | 351,903 | $ | 1,275,904 | $ | 73,146 | $ | 5,376,294 | |||||||||||||
Comprehensive income | — | — | 253,540 | 63,385 | 316,925 | 18,680 | 335,605 | |||||||||||||||||||
Issuance of capital stock | 64,512 | 6,451,262 | — | — | — | — | 6,451,262 | |||||||||||||||||||
Repurchase/redemption of capital stock | (70,619 | ) | (7,061,961 | ) | — | — | — | — | (7,061,961 | ) | ||||||||||||||||
Shares reclassified to mandatorily redeemable capital stock | (3,615 | ) | (361,549 | ) | — | — | — | — | (361,549 | ) | ||||||||||||||||
Cash dividends | — | — | (266,815 | ) | — | (266,815 | ) | — | (266,815 | ) | ||||||||||||||||
December 31, 2019 | 30,550 | $ | 3,054,996 | $ | 910,726 | $ | 415,288 | $ | 1,326,014 | $ | 91,826 | $ | 4,472,836 | |||||||||||||
The accompanying notes are an integral part of these financial statements.
91
Federal Home Loan Bank of Pittsburgh
Notes to Financial Statements
Background Information
The Bank, a federally chartered corporation, is one of 11 district Federal Home Loan Banks (FHLBanks). The FHLBanks are government-sponsored enterprises (GSEs) that serve the public by increasing the availability of credit for residential mortgages and community development. The Bank provides a readily available, low-cost source of funds to its member institutions. The Bank is a cooperative, which means that current members own nearly all of the outstanding capital stock of the Bank. All holders of the Bank’s capital stock may, to the extent declared by the Board, receive dividends on their capital stock. Regulated financial depositories and insurance companies engaged in residential housing finance that maintain their principal place of business (as defined by Finance Agency regulation) in Delaware, Pennsylvania or West Virginia may apply for membership. Community Development Financial Institutions (CDFIs) which meet membership regulation standards are also eligible to become Bank members. State and local housing associates that meet certain statutory and regulatory criteria may also borrow from the Bank. While eligible to borrow, state and local housing associates are not members of the Bank and, as such, do not hold capital stock.
All members must purchase capital stock in the Bank. The amount of capital stock a member owns is based on membership requirements (membership asset value) and activity requirements (i.e., outstanding advances, letters of credit, and the principal balance of certain residential mortgage loans sold to the Bank). The Bank considers those members with capital stock outstanding in excess of 10% of total capital stock outstanding to be related parties. See Note 17 - Transactions with Related Parties for additional information.
The Federal Housing Finance Agency (Finance Agency) is the independent regulator of the FHLBanks. The mission of the Finance Agency is to ensure the FHLBanks operate in a safe and sound manner so they serve as a reliable source for liquidity and funding for housing finance and community investment. Each FHLBank operates as a separate entity with its own management, employees and board of directors. The Bank does not consolidate any off-balance sheet special-purpose entities or other conduits.
As provided by the Federal Home Loan Bank Act (FHLBank Act) or Finance Agency regulation, the Bank’s debt instruments, referred to as consolidated obligations, are joint and several obligations of all the FHLBanks and are the primary source of funds for the FHLBanks. These funds are primarily used to provide advances, purchase mortgages from members through the Mortgage Partnership Finance® (MPF®) Program and purchase certain investments. See Note 13 - Consolidated Obligations for additional information. The Office of Finance (OF) is a joint office of the FHLBanks established to facilitate the issuance and servicing of the consolidated obligations of the FHLBanks and to prepare the combined quarterly and annual financial reports of all the FHLBanks. Deposits, other borrowings, and capital stock issued to members provide other funds. The Bank primarily invests these funds in short-term investments to provide liquidity. The Bank also provides member institutions with correspondent services, such as wire transfer, safekeeping and settlement with the Federal Reserve.
92
Notes to Financial Statements (continued)
Note 1 – Summary of Significant Accounting Policies
Basis of Presentation
These financial statements are prepared in accordance with generally accepted accounting principles in the United States of America (GAAP).
Variable Interest Entities (VIEs). The Bank is not the primary beneficiary of any VIEs for which consolidation would be required.
Significant Accounting Policies
Use of Estimates. The preparation of financial statements in accordance with GAAP requires management to make subjective assumptions and estimates that may affect the reported amounts of assets and liabilities, the disclosure of contingent assets and liabilities, and the reported amounts of income and expense. The most significant of these estimates include the fair value of derivatives and certain investment securities that are reported at fair value in the Statement of Condition, determination of other-than-temporary impairments of certain mortgage-backed securities, and the determination of the Allowance for Credit Losses. Actual results could differ from these estimates significantly.
Fair Value. The fair value amounts, recorded on the Statement of Condition and in the note disclosures for the periods presented, have been determined by the Bank using available market and other pertinent information, and reflect the Bank’s best judgment of appropriate valuation methods. Although the Bank uses its best judgment in estimating the fair value of these financial instruments, there are inherent limitations in any valuation technique. Therefore, these fair values may not be indicative of the amounts that would be realized in current market transactions, although they do reflect the Bank’s judgment of how a market participant would estimate the fair values. See Note 18 - Estimated Fair Values for more information.
Financial Instruments Meeting Netting Requirements. The Bank presents certain financial instruments on a net basis when it has a legal right of offset and all other requirements for netting are met (collectively referred to as the netting requirements). For these financial instruments, the Bank has elected to offset its asset and liability positions, as well as cash collateral received or pledged.
The net exposure for these financial instruments can change on a daily basis; therefore, there may be a delay between the time this exposure change is identified and additional collateral is requested, and the time when this collateral is received or pledged. Likewise, there may be a delay for excess collateral to be returned. For derivative instruments that meet the netting requirements, any excess cash collateral received or pledged is recognized as a derivative liability or derivative asset. See Note 11 - Derivatives and Hedging Activities for additional information regarding these agreements.
Interest-Bearing Deposits, Federal Funds Sold, and Securities Purchased under Agreements to Resell. Interest-bearing deposits, Federal funds sold and securities purchased under agreements to resell, provide short-term liquidity and are carried at cost. Interest-bearing deposits can include certificates of deposit and bank notes not meeting the definition of a security. Federal funds sold consist of short-term, unsecured loans generally transacted with counterparties that are considered by an FHLBank to be of investment quality. The Bank treats securities purchased under agreements to resell as short-term collateralized loans that are classified as assets in the Statement of Condition. Securities purchased under agreements to resell are held in safekeeping in the name of the Bank by third-party custodians approved by the Bank. If the fair value of the underlying securities decreases below the fair value required as collateral, the counterparty has the option to (1) place an equivalent amount of additional securities in safekeeping in the name of the Bank or (2) remit an equivalent amount of cash.
Investment Securities. The Bank classifies investment securities as trading, AFS and HTM at the date of acquisition. Purchases and sales of securities are recorded on a trade date basis.
Trading. Securities classified as trading are carried at fair value. The Bank records changes in the fair value of these investments through noninterest income as “Net gains (losses) on investment securities.”
Available-for-Sale (AFS). Securities that are not classified as HTM or trading are classified as AFS and are carried at fair value. Generally, the Bank records changes in the fair value of these securities in AOCI as “Net unrealized gains (losses) on AFS securities.” Beginning January 1, 2019, the Bank adopted new hedging accounting guidance, which, among other things, impacts the income statement presentation of gains (losses) on derivatives and hedging activities for qualifying hedges, including hedges of AFS securities. For AFS securities that have been hedged and qualify as a fair value hedge, the Bank
93
Notes to Financial Statements (continued)
records the portion of the change in the fair value of the investment related to the risk being hedged in interest income within the “AFS securities” section together with the related change in the fair value of the derivative, and records the remainder of the change in the fair value of the investment in AOCI as “Net unrealized gains (losses) on AFS securities.”
Prior to January 1, 2019, for AFS securities that had been hedged and qualified as a fair value hedge, the Bank recorded the portion of the change in the fair value of the investment related to the risk being hedged in the noninterest income as “Net gains (losses) on derivative and hedging activities” together with the related change in the fair value of the derivative, and recorded the remainder of the change in the fair value of the investment in AOCI as “Net unrealized gains (losses) on AFS securities.”
Held-to-Maturity (HTM). Securities that the Bank has both the ability and intent to hold to maturity are classified as HTM and are carried at amortized cost, representing the amount at which an investment is acquired adjusted for periodic principal repayments, amortization of premiums and accretion of discounts.
Certain changes in circumstances may cause the Bank to change its intent to hold a security to maturity without calling into question its intent to hold other debt securities to maturity. Thus, the sale or transfer of an HTM security due to certain changes in circumstances, such as evidence of significant deterioration in the issuer’s creditworthiness or changes in regulatory requirements, is not considered to be inconsistent with its original classification. Other events that are isolated, nonrecurring, and unusual for the Bank that could not have been reasonably anticipated may cause the Bank to sell or transfer an HTM security without necessarily calling into question its intent to hold other debt securities to maturity. In addition, a sale of a debt security that meets either of the following two conditions would not be considered inconsistent with the original classification of that security:
(1) The sale occurs near enough to its maturity date (for example, within three months of maturity), or call date if exercise of the call is probable that interest-rate risk is substantially eliminated as a pricing factor and the changes in market interest rates would not have a significant effect on the security’s fair value, or
(2) The sale of a security occurs after the Bank has already collected a substantial portion (at least 85%) of the principal outstanding at acquisition due either to prepayments on the debt security or to scheduled payments on a debt security payable in equal installments (both principal and interest) over its term.
Premiums and Discounts. The Bank amortizes purchased premiums and accretes purchased discounts on investment securities using the contractual level-yield method (contractual method). The contractual method recognizes the income effects of premiums and discounts over the contractual life of the securities based on the actual behavior of the underlying assets, including adjustments for actual prepayment activities, and reflects the contractual terms of the securities without regard to changes in estimated prepayments based on assumptions about future borrower behavior.
Gains and Losses on Sales. The Bank computes gains and losses on sales of its investment securities using the specific identification method and includes these gains and losses in other noninterest income (loss).
Investment Securities - OTTI. The Bank evaluates its individual AFS and HTM securities in unrealized loss positions for OTTI on a quarterly basis. A security is considered impaired (i.e. in an unrealized loss position) when its fair value is less than its amortized cost. The Bank considers an OTTI to have occurred under any of the following conditions:
• | It has an intent to sell the impaired debt security; |
• | If, based on available evidence, it believes it is more likely than not that it will be required to sell the impaired debt security before the recovery of its amortized cost basis; or |
• | It does not expect to recover the entire amortized cost basis of the impaired debt security. |
Recognition of OTTI. If either of the first two conditions is met, the Bank recognizes an OTTI charge in earnings equal to the entire difference between the security’s amortized cost basis and its fair value as of the Statement of Condition date. For a security in an unrealized loss position that does not meet either of the first two conditions, the security is evaluated to determine the extent and amount of credit loss.
To determine whether a credit loss exists, the Bank performs an analysis, which includes a cash flow analysis for private label mortgage-backed securities (MBS), to determine if it will recover the entire amortized cost basis of each of these securities. The present value of the cash flows expected to be collected is compared to the amortized cost of the debt security. If there is a credit loss (the difference between the present value of the cash flows expected to be collected and the amortized cost basis of the debt security), the carrying value of the debt security is adjusted to its fair value. However, rather than recognizing the entire difference between the amortized cost basis and fair value in earnings, only the amount of the impairment
94
Notes to Financial Statements (continued)
representing the credit loss (i.e., the credit component) is recognized in earnings, while the amount related to all other factors (i.e., the non-credit component) is recognized in AOCI which is a component of capital. The credit loss on a debt security is limited to the amount of that security’s unrealized losses.
The net OTTI is presented in the Statement of Income with the related offset representing the non-credit portion of OTTI that is recognized in AOCI. The remaining amount on the Statement of Income represents the credit loss for the period.
Accounting for OTTI Recognized in AOCI. For subsequent accounting of an other-than-temporarily impaired security, the Bank records an additional OTTI if the present value of cash flows expected to be collected is less than the amortized cost of the security. The total amount of this additional OTTI (both credit and non-credit component, if any) is determined as the difference between the security’s amortized cost less the amount of OTTI recognized in AOCI prior to the determination of this additional OTTI and its fair value. Any additional credit loss is limited to that security’s unrealized losses, or the difference between the security’s amortized cost and its fair value, as of the Statement of Condition date. This additional credit loss, up to the amount in AOCI related to the security, is reclassified out of AOCI and recognized in earnings. The non-credit component, if any, is recognized in AOCI.
Subsequent related increases and decreases (if not an additional OTTI) in the fair value of AFS securities are netted against the non-credit component of OTTI recognized previously in AOCI. For debt securities classified as AFS, the Bank does not accrete the OTTI recognized in AOCI to the carrying value because the subsequent measurement basis for these securities is fair value.
Interest Income Recognition. When a debt security has been other-than-temporarily impaired, a new accretable yield is calculated for that security at its impairment measurement date. This adjusted yield is used to calculate the interest income recognized over the remaining life of that security, matching the amount and timing of its estimated future collectible cash flows. Subsequent to that security’s initial OTTI, the Bank re-evaluates estimated future collectible cash flows on a quarterly basis. If the security has no additional OTTI based on this evaluation, the accretable yield is reassessed for possible upward adjustment on a prospective basis. The accretable yield is adjusted if there is a significant increase in the security’s expected cash flows.
Advances. The Bank reports advances (secured loans to members, former members or housing associates) at amortized cost net of premiums and discounts (including discounts related to AHP and hedging adjustments). The Bank amortizes/accretes premiums, discounts and hedging adjustments to interest income using the contractual method. The Bank records interest on advances to interest income as earned.
Commitment Fees. The Bank records fees for standby letters of credit as a deferred credit when the Bank receives the fee and accretes them using the straight-line method over the term of the standby letter of credit.
Advance Modifications. In cases in which the Bank funds a new advance concurrently with or within a short period of time before or after the prepayment of an existing advance, the Bank evaluates whether the new advance meets the accounting criteria to qualify as a modification of an existing advance or whether it constitutes a new advance. The Bank compares the present value of cash flows on the new advance to the present value of cash flows remaining on the existing advance. If there is at least a 10% difference in the present value of cash flows or if, based on a qualitative assessment of the modifications made to the original contractual terms, the Bank will conclude that the modifications are more than minor, and the advance is accounted for as a new advance. In all other instances, the new advance is accounted for as a modification.
Prepayment Fees. The Bank charges a borrower a prepayment fee when the borrower prepays certain advances before the original maturity. In the event that a new advance is issued in connection with a prepayment of an outstanding advance but the new advance does not qualify as a modification of an existing advance, any prepayment fee, net of hedging activities, is recorded in “Advances” in the interest income section of the Statement of Income. If a new advance qualifies as a modification of an existing advance, any prepayment fee, net of hedging activities, is deferred and amortized using the contractual method.
Mortgage Loans Held for Portfolio. The Bank participates in the MPF Program under which the Bank invests in residential mortgage loans, which are purchased from members that are Participating Financial Institutions (PFIs). The Bank manages the liquidity, interest-rate risk (including prepayment risk) and optionality of the loans, while the PFI may retain the marketing and servicing activities. The Bank and the PFI share in the credit risk of the conventional loans with the Bank assuming the first loss obligation limited by the First Loss Account (FLA), while the PFI assumes credit losses in excess of the FLA, referred to as Credit Enhancement (CE) obligation, up to the amount of the CE obligation as specified in the master commitment. The Bank assumes losses in excess of the CE obligation.
95
Notes to Financial Statements (continued)
The Bank classifies mortgage loans that it has the intent and ability to hold for the foreseeable future as held for portfolio. Accordingly, these mortgage loans are reported net of premiums, discounts, deferred loan fees or costs, hedging adjustments, charge-offs, and the allowance for credit losses.
Premiums and Discounts. The Bank defers and amortizes/accretes mortgage loan premiums and discounts paid to and received from the Bank’s PFIs, deferred loan fees or costs, and hedging basis adjustments to interest income using the contractual method.
CE Fees. For conventional mortgage loans, PFIs retain a portion of the credit risk on the loans they sell to the Bank by providing CE either through a direct liability to pay credit losses up to a specified amount or through a contractual obligation to provide Supplemental Mortgage Insurance (SMI). PFIs are paid a CE fee for assuming credit risk, and in some instances all or a portion of the CE fee may be performance-based. CE fees are paid monthly based on the remaining unpaid principal balance of the loans in a master commitment. CE fees are recorded as an offset to mortgage loan interest income. To the extent the Bank experiences losses in a master commitment, it may be able to recapture CE fees paid to the PFIs to offset these losses.
Other Fees. The Bank may receive other non-origination fees, such as delivery commitment extension fees, pair-off fees and price adjustment fees. Delivery commitment extension fees are received when a PFI requests an extension of the delivery commitment period beyond the original stated expiration. These fees compensate the Bank for lost interest as a result of late funding and are recorded as part of the mark-to-market of the delivery commitment derivatives, and as such, eventually become basis adjustments to the mortgage loans funded as part of the delivery commitment. Pair-off fees represent a make-whole provision and are received when the amount funded is less than a specific percentage of the delivery commitment amount and are recorded in noninterest income. Price adjustment fees are received when the amount funded is greater than a specified percentage of the delivery commitment amount; they represent purchase price adjustments to the related loans acquired and are recorded as a part of the carrying value of the loans.
BOB Loans. The Bank’s BOB loan program to members is targeted to small businesses.. The program’s objective is to assist in the growth and development of small business, including both their start-up and expansion. The Bank makes funds available to members to extend credit to approved small business borrowers, enabling small businesses to qualify for credit that would otherwise not be available. The intent of the BOB program is to help facilitate community economic development; however, repayment provisions require that the BOB program be accounted for as an unsecured loan. As the members collect directly from the borrowers, the members remit repayment of the loans to the Bank. If the business is unable to repay the loan, it may be forgiven at the member’s request, subject to the Bank’s approval, at which time the BOB loan is charged off. The Bank places a BOB loan that is delinquent or deferred on non-accrual status and accrued but uncollected interest is reversed. At times, the Bank permits a borrower to defer payment of principal and interest for up to one year. A BOB loan may be restored to accrual when none of its contractual principal and interest due are unpaid.
Allowance for Credit Losses. Establishing Allowance for Credit Losses. An allowance for credit losses is a valuation allowance separately established for each identified portfolio segment, if it is probable that impairment has occurred in the Bank’s portfolio as of the Statement of Condition date and the amount of loss can be reasonably estimated. A loan is considered impaired when, based on current information and events, it is probable that the Bank will be unable to collect all amounts due according to the contractual terms of the loan agreement. To the extent necessary, an allowance for credit losses for off-balance sheet credit exposures is recorded as a liability.
Portfolio Segments. A portfolio segment is defined as the level at which an entity develops and documents a systematic methodology for determining its allowance for credit losses. The Bank has developed and documented a systematic methodology for determining an allowance for credit losses, where applicable, for:
• | advances, letters of credit and other extensions of credit to members, collectively referred to as credit products; |
• | government-guaranteed or insured mortgage loans held for portfolio; |
• | conventional MPF loans held for portfolio; and |
• | BOB loans. |
Classes of Financing Receivables. Classes of financing receivables generally are a disaggregation of a portfolio segment to the extent that disaggregation is needed to understand the exposure to credit risk arising from these financing receivables. The Bank determined that no further disaggregation of the portfolio segments is needed as the credit risk arising from these financing receivables is assessed and measured by the Bank at the portfolio segment level.
Nonaccrual Loans. The Bank places a conventional mortgage loan on nonaccrual status if it is determined that either (1) the collection of interest or principal is doubtful or (2) interest or principal is past due for 90 days or more, except when the
96
Notes to Financial Statements (continued)
loan is well-secured (e.g., through CE) and in the process of collection. For those mortgage loans placed on nonaccrual status, accrued but uncollected interest is charged against interest income. The Bank records cash payments received as a reduction of principal because the collection of the remaining principal amount due is considered doubtful and cash payments received are applied first solely to principal until the remaining principal amount due is expected to be collected and then as a recovery of any charge-off, if applicable, followed by recording interest income. A loan on nonaccrual status may be restored to accrual when (1) none of its contractual principal and interest is due and unpaid, and the Bank expects repayment of the remaining contractual interest and principal or (2) it otherwise becomes well secured and in the process of collection.
Troubled Debt Restructuring (TDR). The Bank considers a troubled debt restructuring to have occurred when a concession is granted to a borrower for economic or legal reasons related to the borrower’s financial difficulties and that concession would not have been considered otherwise, such as a loan modification. Loans that are discharged in Chapter 7 bankruptcy and have not been reaffirmed by the borrowers are also considered to be troubled debt restructurings, except in cases where all contractual amounts due are expected to be collected as a result of government guarantees or insurance.
Collateral-Dependent Loans. An impaired loan is considered collateral-dependent if repayment is expected to be provided solely by the sale of the underlying property; that is, there is no other reliable source of repayment available. Loans that are considered collateral-dependent are measured for impairment based on the fair value of the underlying property less estimated selling costs, with any shortfall recognized as a charge-off. Interest income on impaired loans is recognized in the same manner as non-accrual loans.
Charge-off Policy. A charge-off is recorded if it is estimated that the recorded investment in a loan will not be recovered. The Bank evaluates whether to record a charge-off on a conventional mortgage loan upon the occurrence of a confirming event. Confirming events include, but are not limited to, the occurrence of foreclosure, notification of a claim against any of the CE, a loan that is 180 or more days delinquent, or certain loans for which the borrower has filed for bankruptcy. If the loss is expected to be recovered through CE, the Bank recognizes a CE fee receivable for the amount of the loss and assesses it for collectability along with the mortgage loans. The CE fee receivable is recorded in other assets.
BOB Loans. See Note 10 - Allowance for Credit Losses for a description of the allowance for credit losses policies relating to the BOB program.
Real Estate Owned (REO). REO includes assets that have been received in satisfaction of debt through foreclosures. REO is initially recorded at fair value less estimated selling costs and is subsequently carried at the lower of that amount or current fair value less estimated selling costs. The Bank recognizes a charge-off to the allowance for credit losses and/or CE fee receivable if the fair value of the REO less estimated selling costs is less than the recorded investment in the loan at the date of transfer from loans to REO. Any subsequent realized gains, realized or unrealized losses and carrying costs are included in other noninterest expense in the Statement of Income. REO is recorded in other assets on the Statement of Condition.
Derivatives and Hedging Activities. All derivatives are recognized on the Statement of Condition at fair value and are reported as either derivative assets or derivative liabilities, net of cash collateral, including initial margin, and accrued interest received from or pledged to clearing agents and/or counterparties. Variation margin payments are characterized as daily settlement payments, rather than collateral. The fair value of derivatives is netted by clearing agent and/or counterparty when the netting requirements have been met. If these netted amounts are positive, they are classified as an asset and, if negative, they are classified as a liability. Cash flows associated with derivatives are reflected as cash flows from operating activities in the Statement of Cash Flows unless the derivative meets the criteria to be a financing derivative.
Derivative Designations. Each derivative is designated as either:
• | a qualifying hedge of the change in fair value of a recognized asset or liability or an unrecognized firm commitment (a fair value hedge); or |
• | a non-qualifying hedge (an economic hedge) for asset and liability management purposes. |
Accounting for Fair Value Hedges. If hedging relationships meet certain criteria, including, but not limited to, formal documentation of the hedging relationship, and are expected to be highly effective, they qualify for fair value hedge accounting.
Two approaches to hedge accounting include:
• | Long-haul hedge accounting. The application of long-haul hedge accounting requires the Bank to formally assess (both at the hedge’s inception and at least quarterly) whether the derivatives that are used in hedging transactions have been highly effective in offsetting changes in the fair value of hedged items or forecasted transactions |
97
Notes to Financial Statements (continued)
attributable to the hedged risk and whether those derivatives may be expected to remain highly effective in future periods. For hedge relationships that meet certain requirements, this assessment may be completed qualitatively.
• | Short-cut hedge accounting. Transactions that meet certain criteria qualify for the short-cut method of hedge accounting in which an assumption can be made that the change in fair value of a hedged item, due to changes in the benchmark rate, exactly offsets the change in fair value of the related derivative. Under the short-cut method, the entire change in fair value of the interest rate swap is considered to be highly effective at achieving offsetting changes in fair values of the hedged asset or liability. The Bank documents fallback language at hedge inception, including the quantitative method it would use to assess hedge effectiveness and measure hedge results if the short-cut method were to no longer be appropriate during the life of the hedging relationship. |
Derivatives are typically executed at the same time as the hedged item, and the Bank designates the hedged item in a qualifying hedge relationship at the trade date. In many hedging relationships, the Bank may designate the hedging relationship upon its commitment to disburse an advance or trade a consolidated obligation in which settlement occurs within normal market settlement conventions. The Bank then records the changes in fair value of the derivative and the hedged item beginning on the trade date.
Beginning January 1, 2019, the Bank adopted new hedging accounting guidance, which, among other things, impacts the presentation of gains (losses) on derivatives and hedging activities for qualifying hedges. Net interest settlements, as well as changes in the fair value of a derivative and the related hedged item for designated fair value hedges, are recorded in net interest income in the same line as the hedged item.
Prior to January 1, 2019, for fair value hedges, any hedge ineffectiveness (which represented the amount by which the change in the fair value of the derivative differed from the change in the fair value of the hedged item attributable to the hedged risk) was recorded in other noninterest income as “Net gains (losses) on derivatives and hedging activities.”
Accounting for Economic Hedges. An economic hedge is defined as a derivative, hedging specific or non-specific underlying assets, liabilities or firm commitments, that does not qualify or was not designated for fair value hedge accounting, but is an acceptable hedging strategy under the Bank’s risk management program. These economic hedging strategies also comply with Finance Agency regulatory requirements prohibiting speculative hedge transactions. An economic hedge introduces the potential for earnings variability caused by the changes in fair value of the derivatives that are recorded in the Bank’s income. but that are not offset by corresponding changes in the value of the economically hedged assets, liabilities, or firm commitments. As a result, the Bank recognizes the net interest settlements and the change in fair value of these derivatives in other noninterest income as “Net gains (losses) on derivatives and hedging activities” with no offsetting fair value adjustments for the assets, liabilities, or firm commitments.
Accrued Interest Receivables and Payables. The net settlements of interest receivables and payables related to derivatives designated in fair value hedge relationships are recognized as adjustments to the income or expense of the designated hedged item.
Discontinuance of Hedge Accounting. The Bank discontinues hedge accounting prospectively when:
• | it determines that the derivative is no longer highly effective in offsetting changes in the fair value of a hedged item attributable to the hedged risk (including hedged items such as firm commitments); |
• | the derivative and/or the hedged item expires or is sold, terminated, or exercised; |
• | a hedged firm commitment no longer meets the definition of a firm commitment; or |
• | management determines that designating the derivative as a hedging instrument is no longer appropriate. |
When hedge accounting is discontinued, the Bank either terminates the derivative or continues to carry the derivative on the Statement of Condition at its fair value, ceases to adjust the hedged asset or liability for changes in fair value, and amortizes the cumulative basis adjustment on the hedged item into earnings over the remaining life of the hedged item using the contractual method.
When hedge accounting is discontinued because the hedged item no longer meets the definition of a firm commitment, the Bank continues to carry the derivative on the Statement of Condition at its fair value, removing from the Statement of Condition any asset or liability that was recorded to recognize the firm commitment and recording it as a gain or loss in current period earnings.
Embedded Derivatives. The Bank may issue debt, make advances, or purchase financial instruments in which a derivative instrument is “embedded.” Upon execution of these transactions, the Bank assesses whether the economic characteristics of the
98
Notes to Financial Statements (continued)
embedded derivative are clearly and closely related to the economic characteristics of the remaining component of the advance, debt or purchased financial instrument (the host contract) and whether a separate, non-embedded instrument with the same terms as the embedded instrument would meet the definition of a derivative instrument. The embedded derivative is separated from the host contract, carried at fair value, and designated as a stand-alone derivative instrument (pursuant to an economic hedge) when the Bank determines that: (1) the embedded derivative has economic characteristics that are not clearly and closely related to the economic characteristics of the host contract and (2) a separate, stand-alone instrument with the same terms would qualify as a derivative instrument. However, the entire contract is carried at fair value and no portion of the contract is designated as a hedging instrument if the entire contract (the host contract and the embedded derivative) is to be measured at fair value, with changes in fair value reported in current period earnings (such as an investment security classified as “trading”), or if the Bank cannot reliably identify and measure the embedded derivative for purposes of separating that derivative from its host contract.
Premises, Software and Equipment. The Bank records premises, software and equipment at cost less accumulated depreciation and amortization and computes depreciation using the straight-line method over the estimated useful lives of the assets, which range from one to ten years. The Bank amortizes leasehold improvements using the straight-line method over the shorter of the estimated useful life of the improvement or the remaining term of the lease. The Bank capitalizes improvements and major renewals but expenses ordinary maintenance and repairs when incurred. Premises, software and equipment are included in “Other assets” on the Statement of Condition. The Bank includes gains and losses on the disposal of premises, software and equipment in “Other noninterest income (loss).”
At December 31, 2019 and 2018, premises, software, and equipment, net of accumulated depreciation and amortization were $8.4 million and $8.7 million, respectively. For the years ended December 31, 2019, 2018, and 2017, the related depreciation and amortization expense was $3.3 million, $2.8 million, and $3.9 million, respectively.
Hosting arrangements, also known as Software as a Service (SaaS), are assessed for whether they should be accounted for as software or a service contract. SaaS accounted for as a service contract is expensed as incurred, which could result in the SaaS being recognized as a prepaid asset and recorded in Other assets on the Statement of Condition, if appropriate. Implementation costs related to SaaS are recorded as software. At December 31, 2019 and 2018, SaaS accounted for as a service contract was immaterial.
Leases. The Bank leases office space and office equipment to run its business operations. As a result of adopting the Leases Accounting Standards Update (ASU) on January 1, 2019, the Bank recognizes its lease right-of-use assets in Other assets and the related lease liabilities in Other liabilities in its Statement of Condition. Prior to 2019, its leases were not recognized on the Statement of Condition. At adoption, the Bank elected to account for the lease and non-lease components of its real estate, including leasehold improvement, asset class as a single lease component. The Bank also elected not to recognize leases with a term of 12 months on the Statement of Condition.
At December 31, 2019, lease right-of-use assets were $10.2 million and lease liabilities were $10.7 million. The Bank recognized operating lease costs in the Other operating expense line of the Statement of Income of $2.0 million, $2.2 million, and $2.1 million for the years ended December 31, 2019, 2018, and 2017, respectively.
Consolidated Obligations. Consolidated obligations are recorded at amortized cost.
Discounts and Premiums. The Bank amortizes premiums and accretes discounts as well as hedging basis adjustments on consolidated obligations to interest expense using the contractual method.
Concessions. The Bank pays concessions to dealers in connection with the issuance of certain consolidated obligations. Concessions paid on consolidated obligations are recorded as a direct deduction from the carrying amount of the debt and amortized using the contractual method. The amortization of such concessions is included in consolidated obligation interest expense.
Mandatorily Redeemable Capital Stock. The Bank reclassifies stock subject to redemption from capital stock to a liability after a member provides written notice of redemption, gives notice of intention to withdraw from membership, or attains non-member status by merger or acquisition, charter termination or other involuntary termination from membership, because the member’s shares will then meet the definition of a mandatorily redeemable financial instrument. Shares meeting this definition are reclassified to a liability at fair value, which is par plus estimated dividends. Dividends declared on shares classified as a liability are accrued at the expected dividend rate and reflected as interest expense in the Statement of Income. The repurchase or redemption of mandatorily redeemable capital stock is reflected as a financing cash outflow in the Statement of Cash Flows.
99
Notes to Financial Statements (continued)
If a member cancels its written notice of redemption or notice of withdrawal, the Bank will reclassify mandatorily redeemable capital stock from liabilities to capital. After the reclassification, dividends on the capital stock will no longer be classified as interest expense.
Restricted Retained Earnings (RRE). In accordance with the Joint Capital Enhancement Agreement (JCEA) entered into by the Bank, as amended, the Bank allocates 20% of its quarterly net income to a separate restricted retained earnings account until the account balance equals at least 1% of the Bank’s average balance of outstanding consolidated obligations for the previous quarter. These restricted retained earnings are not available to pay dividends and are presented separately on the Statement of Condition. See Note 15 - Capital for more information.
Finance Agency Expenses. The portion of the Finance Agency’s expenses and working capital fund paid by the FHLBanks are allocated among the FHLBanks based on the prorata share of the annual assessments (which are based on the ratio between each FHLBank’s minimum required regulatory capital and the aggregate minimum required regulatory capital of every FHLBank).
Office of Finance Expenses. The Bank’s proportionate share of the OF operating and capital expenditures is calculated using a formula based upon the following components: (1) two-thirds based upon its share of total consolidated obligations outstanding and (2) one-third based upon an equal pro-rata allocation.
AHP. The FHLBank Act requires each FHLBank to establish and fund an AHP, providing subsidies to members to assist in the purchase, construction, or rehabilitation of housing for very low-to-moderate-income households. The Bank charges the required funding for AHP to earnings and establishes a liability. As allowed per AHP regulations, the Bank can elect to allot fundings based on future periods’ required AHP contributions (referred to as Accelerated AHP). The Accelerated AHP allows the Bank to commit and disburse AHP funds to meet the Bank’s mission when it would otherwise be unable to do so based on its normal funding mechanism.
The Bank primarily makes the AHP subsidy available to members as a grant. Alternatively, the Bank could provide the member with an interest rate below a normal advance rate. This will create a discount which will be the present value of the difference between the cash flow generated using an AHP advance rate and the Bank’s cost of funds. If the Bank provides a discounted interest rate, this discount is accreted to interest income using the contractual method over the life of the advance. See Note 14 - AHP for more information.
100
Notes to Financial Statements (continued)
Note 2 – Changes in Accounting Principle and Recently Issued Accounting Standards and Interpretations
The Bank adopted the following new accounting standards during the year ended December 31, 2019.
Standard | Description | Adoption Date and Transition | Effect on the Financial Statements or Other Significant Matters |
ASU 2018-16: Inclusion of the Secured Overnight Financing Rate (SOFR) Overnight Index Swap (OIS) Rate as a Benchmark Interest Rate for Hedge Accounting Purposes | This ASU adds the OIS rate based on SOFR as a benchmark interest rate for hedge accounting purposes to facilitate the transition of the replacement of LIBOR. | The Bank adopted this ASU on January 1, 2019 on a prospective basis. | The adoption of this ASU did not impact the Bank’s financial condition or results of operations. This guidance could affect the Bank’s hedging strategies and application of hedge accounting for qualifying new or re-designated hedging relationships entered into on or after January 1, 2019. |
ASU 2018-08: Contributions Received and Contributions Made | This ASU clarifies the distinction between exchange transactions and contributions, including whether a contribution is conditional. | The Bank adopted this ASU on January 1, 2019 on a modified prospective basis. | The adoption of this ASU did not impact the Bank’s financial condition or results of operations. The Bank will apply the amended guidance when accounting for contributions made. |
ASU 2017-12: Targeted Improvements to Accounting for Hedging Activities, as amended | This ASU makes amendments to the accounting for derivatives and hedging activities intended to better portray the economics of the transactions. | The Bank adopted this ASU on January 1, 2019 and applied it to existing hedging relationships as of January 1, 2019. | The adoption of this ASU did not affect the Bank’s application of hedge accounting for existing hedge strategies, with the following exceptions: 1) designation of a fallback long-haul method for its short-cut hedge strategies and 2) use of qualitative hedge effectiveness assessments for an appropriate subset of fair value hedge relationships. Upon adoption, the Bank modified its presentation of hedge results for fair value hedges within the results of operations, as well as relevant disclosures. See Note 11 - Derivatives and Hedging Activities for further discussion. The Bank will continue to assess opportunities enabled by the new guidance to expand its risk management strategies. |
ASU 2017-08: Premium Amortization on Purchased Callable Debt Securities | This ASU requires that the amortization period for premiums on certain purchased callable debt securities be shortened to the earliest call date, rather than contractual maturity. | This ASU was adopted by the Bank on January 1, 2019 on a modified retrospective basis. | The adoption of this ASU did not impact the Bank’s financial condition or results of operations. |
ASU 2016-02: Leases, as amended | This ASU amends the accounting for leases. It requires lessees to recognize a right-of-use asset and lease liability for virtually all leases. | The Bank adopted this ASU on January 1, 2019 on a modified retrospective basis. The Bank was not required to restate comparative reporting periods. | The adoption of this ASU did not materially impact the Bank’s financial condition, results of operations, and statement of cash flows. Upon adoption, the Bank increased its “Other Assets” and “Other Liabilities” for operating leases capitalized. The Bank’s most significant lease is its headquarters. |
101
Notes to Financial Statements (continued)
The following table provides a brief description of recently issued accounting standards which may have an impact on the Bank.
Standard | Description | Effective Date and Transition | Effect on the Financial Statements or Other Significant Matters |
ASU 2018-15: Customer's Accounting for Implementation Costs Incurred in a Cloud Computing Service Arrangement That Is a Service Contract | This ASU reduces diversity in practice by aligning the requirements for capitalizing implementation costs incurred in a hosting arrangement with internal-use software. | This ASU was effective for the Bank beginning January 1, 2020 and was adopted on a prospective basis. | The adoption of this ASU did not have a significant impact on the Bank’s financial condition or results of operations. |
ASU 2018-14: Changes to the Disclosure Requirements for Defined Benefit Plans | This ASU adds, removes, and clarifies certain disclosure requirements for employers that sponsor defined benefit pension or other postretirement plans. | This ASU will be effective for the Bank for the year ending December 31, 2020. | The adoption of this ASU will not have a significant impact on the Bank's disclosures, which will be revised as appropriate. |
ASU 2018-13: Changes to the Disclosure Requirements for Fair Value Measurement | This ASU adds, removes, and modifies certain fair value disclosure requirements. | This ASU was effective for the Bank beginning January 1, 2020. | The adoption of this ASU will not have a significant impact on the Bank's disclosures, which will be revised as appropriate. |
ASU 2016-13: Financial Instruments - Credit Losses, as amended | This ASU makes substantial changes to the accounting for credit losses on certain financial instruments. It replaces the current incurred loss model with a new model based on lifetime expected credit losses, which the FASB believes will result in more timely recognition of credit losses. | This ASU was effective for the Bank beginning January 1, 2020 and was generally adopted on a modified retrospective basis, with the exception of previously-OTTI AFS debt securities, for which the guidance was applied prospectively. | The adoption of this ASU did not have a significant impact on the Bank's financial statements. The Bank recognized zero credit losses on advances and GSE/U.S. investments. The impact on the Bank’s financial statements for all other financial instruments including securities purchased under agreements to resell, interest bearing deposits, federal funds sold, state or local agency obligations, private label MBS, BOB loans, and MPF loans was immaterial. |
Note 3 – Cash and Due from Banks
Cash and due from banks on the Statement of Condition includes cash on hand, cash items in the process of collection, compensating balances, and amounts due from correspondent banks and the Federal Reserve Bank (FRB). The Bank maintains compensating and collected cash balances with commercial banks in return for certain services. These agreements contain no legal restrictions about the withdrawal of funds. The average compensating and collected cash balances for the years ended December 31, 2019 and December 31, 2018 were $43.1 million and $84.9 million, respectively.
Note 4 – Trading Securities
The following table presents trading securities as of December 31, 2019 and December 31, 2018.
(in thousands) | December 31, 2019 | December 31, 2018 | ||||
U.S. Treasury obligations | $ | 3,390,772 | $ | 997,061 | ||
GSE and Tennessee Valley Authority (TVA) obligations | 240,878 | 283,992 | ||||
Total | $ | 3,631,650 | $ | 1,281,053 | ||
102
Notes to Financial Statements (continued)
The following table presents net gains (losses) on trading securities for 2019, 2018 and 2017.
Year ended December 31, | |||||||||
(in thousands) | 2019 | 2018 | 2017 | ||||||
Net unrealized gains (losses) on trading securities held at year-end | $ | 16,197 | $ | (4,816 | ) | $ | 2,672 | ||
Net unrealized and realized gains (losses) on trading securities sold/matured during the year | 2,508 | (4,927 | ) | — | |||||
Net gains (losses) on trading securities | $ | 18,705 | $ | (9,743 | ) | $ | 2,672 | ||
Note 5 – Available-for-Sale (AFS) Securities
The following tables present AFS securities as of December 31, 2019 and December 31, 2018.
December 31, 2019 | |||||||||||||||
(in thousands) | Amortized Cost(1) | OTTI Recognized in AOCI(2) | Gross Unrealized Gains | Gross Unrealized Losses | Fair Value | ||||||||||
Non-MBS: | |||||||||||||||
GSE and TVA obligations | $ | 1,508,264 | $ | — | $ | 42,435 | $ | — | $ | 1,550,699 | |||||
State or local agency obligations | 238,496 | — | 9,398 | — | 247,894 | ||||||||||
Total non-MBS | $ | 1,746,760 | $ | — | $ | 51,833 | $ | — | $ | 1,798,593 | |||||
MBS: | |||||||||||||||
U.S. obligations single-family MBS | $ | 805,294 | $ | — | $ | 3,590 | $ | (1,298 | ) | $ | 807,586 | ||||
GSE single-family MBS | 4,053,700 | — | 9,574 | (7,415 | ) | 4,055,859 | |||||||||
GSE multifamily MBS | 4,120,532 | — | 4,581 | (15,528 | ) | 4,109,585 | |||||||||
Private label MBS | 274,624 | — | 51,704 | (182 | ) | 326,146 | |||||||||
Total MBS | $ | 9,254,150 | $ | — | $ | 69,449 | $ | (24,423 | ) | $ | 9,299,176 | ||||
Total AFS securities | $ | 11,000,910 | $ | — | $ | 121,282 | $ | (24,423 | ) | $ | 11,097,769 | ||||
December 31, 2018 | |||||||||||||||
(in thousands) | Amortized Cost(1) | OTTI Recognized in AOCI(2) | Gross Unrealized Gains | Gross Unrealized Losses | Fair Value | ||||||||||
Non-MBS: | |||||||||||||||
GSE and TVA obligations | $ | 1,771,573 | $ | — | $ | 15,801 | $ | (2,057 | ) | $ | 1,785,317 | ||||
State or local agency obligations | 250,789 | — | 1,975 | (6,825 | ) | 245,939 | |||||||||
Total non-MBS | $ | 2,022,362 | $ | — | $ | 17,776 | $ | (8,882 | ) | $ | 2,031,256 | ||||
MBS: | |||||||||||||||
U.S. obligations single-family MBS | $ | 216,594 | $ | — | $ | 1,988 | $ | (88 | ) | $ | 218,494 | ||||
GSE single-family MBS | 2,575,361 | — | 12,013 | (5,871 | ) | 2,581,503 | |||||||||
GSE multifamily MBS | 2,612,289 | — | 550 | (7,385 | ) | 2,605,454 | |||||||||
Private label MBS | 344,631 | — | 65,133 | (214 | ) | 409,550 | |||||||||
Total MBS | $ | 5,748,875 | $ | — | $ | 79,684 | $ | (13,558 | ) | $ | 5,815,001 | ||||
Total AFS securities | $ | 7,771,237 | $ | — | $ | 97,460 | $ | (22,440 | ) | $ | 7,846,257 | ||||
Notes:
(1) Amortized cost includes adjustments made to the cost basis of an investment for accretion of discounts and/or amortization of premiums, collection of cash, OTTI recognized, and/or fair value hedge accounting adjustments.
(2) Represents the non-credit portion of an OTTI recognized during the life of the security.
103
Notes to Financial Statements (continued)
As of December 31, 2019, the amortized cost of the Bank’s MBS classified as AFS included net purchased discounts of $9.9 million, credit losses of $165.5 million and OTTI-related accretion adjustments of $76.1 million. As of December 31, 2018, these amounts were $18.5 million, $183.5 million, and $77.5 million, respectively.
The following table presents a reconciliation of the AFS OTTI loss recognized through AOCI to the total net non-credit portion of OTTI gains on AFS securities in AOCI as of December 31, 2019 and December 31, 2018.
(in thousands) | December 31, 2019 | December 31, 2018 | ||||
Non-credit portion of OTTI losses | $ | — | $ | — | ||
Net unrealized gains on OTTI securities since their last OTTI credit charge | 51,704 | 65,133 | ||||
Net non-credit portion of OTTI gains on AFS securities in AOCI | $ | 51,704 | $ | 65,133 | ||
The following tables summarize the AFS securities with unrealized losses as of December 31, 2019 and December 31, 2018. The unrealized losses are aggregated by major security type and length of time that individual securities have been in a continuous unrealized loss position.
December 31, 2019 | ||||||||||||||||||
Less than 12 Months | Greater than 12 Months | Total | ||||||||||||||||
(in thousands) | Fair Value | Unrealized Losses | Fair Value | Unrealized Losses | Fair Value | Unrealized Losses(1) | ||||||||||||
MBS: | ||||||||||||||||||
U.S. obligations single-family MBS | $ | 492,038 | $ | (1,022 | ) | $ | 46,104 | $ | (276 | ) | $ | 538,142 | $ | (1,298 | ) | |||
GSE single-family MBS | 2,458,728 | (6,318 | ) | 221,806 | (1,097 | ) | 2,680,534 | (7,415 | ) | |||||||||
GSE multifamily MBS | 2,515,001 | (10,683 | ) | 1,181,509 | (4,845 | ) | 3,696,510 | (15,528 | ) | |||||||||
Private label MBS | — | — | 2,979 | (182 | ) | 2,979 | (182 | ) | ||||||||||
Total MBS | $ | 5,465,767 | $ | (18,023 | ) | $ | 1,452,398 | $ | (6,400 | ) | $ | 6,918,165 | $ | (24,423 | ) | |||
Total | $ | 5,465,767 | $ | (18,023 | ) | $ | 1,452,398 | $ | (6,400 | ) | $ | 6,918,165 | $ | (24,423 | ) | |||
December 31, 2018 | ||||||||||||||||||
Less than 12 Months | Greater than 12 Months | Total | ||||||||||||||||
(in thousands) | Fair Value | Unrealized Losses | Fair Value | Unrealized Losses | Fair Value | Unrealized Losses(1) | ||||||||||||
Non-MBS: | ||||||||||||||||||
GSE and TVA obligations | $ | 27,641 | $ | (98 | ) | $ | 273,433 | $ | (1,959 | ) | $ | 301,074 | $ | (2,057 | ) | |||
State or local agency obligations | 20,575 | (180 | ) | 122,664 | (6,645 | ) | 143,239 | (6,825 | ) | |||||||||
Total non-MBS | $ | 48,216 | $ | (278 | ) | $ | 396,097 | $ | (8,604 | ) | $ | 444,313 | $ | (8,882 | ) | |||
MBS: | ||||||||||||||||||
U.S. obligations single-family MBS | $ | 61,868 | $ | (88 | ) | $ | — | $ | — | $ | 61,868 | $ | (88 | ) | ||||
GSE single-family MBS | 499,383 | (1,423 | ) | 185,711 | (4,448 | ) | 685,094 | (5,871 | ) | |||||||||
GSE multifamily MBS | 1,600,825 | (2,933 | ) | 522,918 | (4,452 | ) | 2,123,743 | (7,385 | ) | |||||||||
Private label MBS | — | — | 2,946 | (214 | ) | 2,946 | (214 | ) | ||||||||||
Total MBS | $ | 2,162,076 | $ | (4,444 | ) | $ | 711,575 | $ | (9,114 | ) | $ | 2,873,651 | $ | (13,558 | ) | |||
Total | $ | 2,210,292 | $ | (4,722 | ) | $ | 1,107,672 | $ | (17,718 | ) | $ | 3,317,964 | $ | (22,440 | ) | |||
Note:
(1) Total unrealized losses equal the sum of “OTTI Recognized in AOCI” and “Gross Unrealized Losses” in the first two tables of this Note 5.
104
Notes to Financial Statements (continued)
Redemption Terms. The amortized cost and fair value of AFS securities by contractual maturity as of December 31, 2019 and December 31, 2018 are presented below. Expected maturities of some securities will differ from contractual maturities because borrowers may have the right to call or prepay obligations with or without call or prepayment fees.
(in thousands) | December 31, 2019 | December 31, 2018 | |||||||||||
Year of Maturity | Amortized Cost | Fair Value | Amortized Cost | Fair Value | |||||||||
Due in one year or less | $ | — | $ | — | $ | 334,985 | $ | 334,428 | |||||
Due after one year through five years | 525,301 | 534,642 | 436,904 | 441,263 | |||||||||
Due after five years through ten years | 700,613 | 719,672 | 660,043 | 664,031 | |||||||||
Due in more than ten years | 520,846 | 544,279 | 590,430 | 591,534 | |||||||||
Total non-MBS | 1,746,760 | 1,798,593 | 2,022,362 | 2,031,256 | |||||||||
MBS | 9,254,150 | 9,299,176 | 5,748,875 | 5,815,001 | |||||||||
Total AFS securities | $ | 11,000,910 | $ | 11,097,769 | $ | 7,771,237 | $ | 7,846,257 | |||||
Interest Rate Payment Terms. The following table details interest payment terms at December 31, 2019 and December 31, 2018.
(in thousands) | December 31, 2019 | December 31, 2018 | |||||
Amortized cost of AFS non-MBS: | |||||||
Fixed-rate | $ | 1,746,760 | $ | 1,937,376 | |||
Variable-rate | — | 84,986 | |||||
Total non-MBS | $ | 1,746,760 | $ | 2,022,362 | |||
Amortized cost of AFS MBS: | |||||||
Fixed-rate | $ | 1,444,111 | $ | 1,261,019 | |||
Variable-rate | 7,810,039 | 4,487,856 | |||||
Total MBS | $ | 9,254,150 | $ | 5,748,875 | |||
Total amortized cost of AFS securities | $ | 11,000,910 | $ | 7,771,237 | |||
105
Notes to Financial Statements (continued)
Note 6 – Held-to-Maturity (HTM) Securities
The following tables present HTM securities as of December 31, 2019 and December 31, 2018.
December 31, 2019 | ||||||||||||
(in thousands) | Amortized Cost | Gross Unrealized Holding Gains | Gross Unrealized Holding Losses | Fair Value | ||||||||
Non-MBS: | ||||||||||||
State or local agency obligations | $ | 94,310 | $ | — | $ | (3,394 | ) | $ | 90,916 | |||
MBS: | ||||||||||||
U.S. obligations single-family MBS | $ | 250,195 | $ | 1,087 | $ | (78 | ) | $ | 251,204 | |||
GSE single-family MBS | 1,156,545 | 20,896 | (254 | ) | 1,177,187 | |||||||
GSE multifamily MBS | 770,823 | 26,231 | (252 | ) | 796,802 | |||||||
Private label MBS | 123,818 | 881 | (520 | ) | 124,179 | |||||||
Total MBS | $ | 2,301,381 | $ | 49,095 | $ | (1,104 | ) | $ | 2,349,372 | |||
Total HTM securities | $ | 2,395,691 | $ | 49,095 | $ | (4,498 | ) | $ | 2,440,288 | |||
December 31, 2018 | ||||||||||||
(in thousands) | Amortized Cost | Gross Unrealized Holding Gains | Gross Unrealized Holding Losses | Fair Value | ||||||||
Non-MBS: | ||||||||||||
Certificates of deposit | $ | 700,000 | $ | 64 | $ | — | $ | 700,064 | ||||
State or local agency obligations | 102,705 | — | (3,969 | ) | 98,736 | |||||||
Total non-MBS | $ | 802,705 | $ | 64 | $ | (3,969 | ) | $ | 798,800 | |||
MBS: | ||||||||||||
U.S. obligations single-family MBS | $ | 325,178 | $ | 2,195 | $ | (4 | ) | $ | 327,369 | |||
GSE single-family MBS | 899,875 | 13,402 | (92 | ) | 913,185 | |||||||
GSE multifamily MBS | 853,053 | 9,224 | (6,818 | ) | 855,459 | |||||||
Private label MBS | 205,221 | 1,765 | (666 | ) | 206,320 | |||||||
Total MBS | $ | 2,283,327 | $ | 26,586 | $ | (7,580 | ) | $ | 2,302,333 | |||
Total HTM securities | $ | 3,086,032 | $ | 26,650 | $ | (11,549 | ) | $ | 3,101,133 | |||
106
Notes to Financial Statements (continued)
The following tables summarize the HTM securities with unrealized losses as of December 31, 2019 and December 31, 2018. The unrealized losses are aggregated by major security type and length of time that individual securities have been in a continuous unrealized loss position.
December 31, 2019 | |||||||||||||||||||
Less than 12 Months | Greater than 12 Months | Total | |||||||||||||||||
(in thousands) | Fair Value | Unrealized Losses | Fair Value | Unrealized Losses | Fair Value | Unrealized Losses | |||||||||||||
Non-MBS: | |||||||||||||||||||
State or local agency obligations | $ | — | $ | — | $ | 90,916 | $ | (3,394 | ) | $ | 90,916 | $ | (3,394 | ) | |||||
MBS: | |||||||||||||||||||
U.S. obligations single-family MBS | $ | 29,639 | $ | (78 | ) | $ | — | $ | — | $ | 29,639 | $ | (78 | ) | |||||
GSE single-family MBS | 80,788 | (230 | ) | 3,743 | (24 | ) | 84,531 | (254 | ) | ||||||||||
GSE multifamily MBS | 75,797 | (252 | ) | — | — | 75,797 | (252 | ) | |||||||||||
Private label MBS | 24,700 | (69 | ) | 21,181 | (451 | ) | 45,881 | (520 | ) | ||||||||||
Total MBS | $ | 210,924 | $ | (629 | ) | $ | 24,924 | $ | (475 | ) | $ | 235,848 | $ | (1,104 | ) | ||||
Total | $ | 210,924 | $ | (629 | ) | $ | 115,840 | $ | (3,869 | ) | $ | 326,764 | $ | (4,498 | ) | ||||
December 31, 2018 | |||||||||||||||||||
Less than 12 Months | Greater than 12 Months | Total | |||||||||||||||||
(in thousands) | Fair Value | Unrealized Losses | Fair Value | Unrealized Losses | Fair Value | Unrealized Losses | |||||||||||||
Non-MBS: | |||||||||||||||||||
State or local agency obligations | $ | — | $ | — | $ | 98,736 | $ | (3,969 | ) | $ | 98,736 | $ | (3,969 | ) | |||||
MBS: | |||||||||||||||||||
U.S. obligations single-family MBS | $ | 19,016 | $ | (4 | ) | $ | — | $ | — | $ | 19,016 | $ | (4 | ) | |||||
GSE single-family MBS | 22,995 | (62 | ) | 4,443 | (30 | ) | 27,438 | (92 | ) | ||||||||||
GSE multifamily MBS | 25,963 | (56 | ) | 319,473 | (6,762 | ) | 345,436 | (6,818 | ) | ||||||||||
Private label MBS | 36,413 | (402 | ) | 7,904 | (264 | ) | 44,317 | (666 | ) | ||||||||||
Total MBS | $ | 104,387 | $ | (524 | ) | $ | 331,820 | $ | (7,056 | ) | $ | 436,207 | $ | (7,580 | ) | ||||
Total | $ | 104,387 | $ | (524 | ) | $ | 430,556 | $ | (11,025 | ) | $ | 534,943 | $ | (11,549 | ) | ||||
107
Notes to Financial Statements (continued)
Redemption Terms. The amortized cost and fair value of HTM securities by contractual maturity as of December 31, 2019 and December 31, 2018 are presented below. Expected maturities of some securities will differ from contractual maturities because borrowers may have the right to call or prepay obligations with or without call or prepayment fees.
(in thousands) | December 31, 2019 | December 31, 2018 | |||||||||||
Year of Maturity | Amortized Cost | Fair Value | Amortized Cost | Fair Value | |||||||||
Non-MBS: | |||||||||||||
Due in one year or less | $ | — | $ | — | $ | 700,000 | $ | 700,064 | |||||
Due after one year through five years | — | — | — | — | |||||||||
Due after five years through ten years | 31,925 | 31,381 | 37,015 | 36,288 | |||||||||
Due after ten years | 62,385 | 59,535 | 65,690 | 62,448 | |||||||||
Total non-MBS | 94,310 | 90,916 | 802,705 | 798,800 | |||||||||
MBS | 2,301,381 | 2,349,372 | 2,283,327 | 2,302,333 | |||||||||
Total HTM securities | $ | 2,395,691 | $ | 2,440,288 | $ | 3,086,032 | $ | 3,101,133 | |||||
Interest Rate Payment Terms. The following table details interest rate payment terms at December 31, 2019 and December 31, 2018.
(in thousands) | December 31, 2019 | December 31, 2018 | |||||
Amortized cost of HTM non-MBS: | |||||||
Fixed-rate | $ | — | $ | 700,000 | |||
Variable-rate | 94,310 | 102,705 | |||||
Total non-MBS | $ | 94,310 | $ | 802,705 | |||
Amortized cost of HTM MBS: | |||||||
Fixed-rate | $ | 1,878,151 | $ | 1,682,100 | |||
Variable-rate | 423,230 | 601,227 | |||||
Total MBS | $ | 2,301,381 | $ | 2,283,327 | |||
Total HTM securities | $ | 2,395,691 | $ | 3,086,032 | |||
Note 7 – Other-Than-Temporary Impairment (OTTI)
The Bank evaluates its individual AFS and HTM securities in an unrealized loss position for OTTI on a quarterly basis. The Bank assesses whether there is OTTI by performing an analysis to determine if any securities will incur a credit loss, the amount of which could be up to the difference between the security’s amortized cost basis and its fair value, and records any difference in its Statement of Income. The Bank completes its OTTI analysis of private label MBS based on the methodologies and key modeling assumptions provided by the FHLBanks’ OTTI Governance Committee. The OTTI analysis is a cash flow analysis generated on a common platform. The Bank performs the cash flow analysis on all of its private label MBS portfolio that have available data. For certain securities where underlying collateral data is not available, alternate procedures, as prescribed by the FHLBanks’ OTTI Governance Committee, are used by the Bank to assess these securities for OTTI. Securities evaluated using alternative procedures were not significant to the Bank.
The Bank’s evaluation includes estimating the projected cash flows that the Bank is likely to collect based on an assessment of all available information, including the structure of the applicable security and certain assumptions, to determine whether the Bank will recover the entire amortized cost basis of the security, such as:
• | the remaining payment terms for the security; |
• | prepayment speeds and default rates; |
• | loss severity on the collateral supporting each security based on underlying loan-level borrower and loan characteristics; |
• | expected housing price changes; and |
• | interest-rate assumptions. |
108
Notes to Financial Statements (continued)
To determine the amount of the credit loss, the Bank compares the present value of the cash flows expected to be collected from its private label MBS to its amortized cost basis. For the Bank’s private label MBS, the Bank uses a forward interest rate curve to project the future estimated cash flows. To calculate the present value of the estimated cash flows for fixed rate bonds the Bank uses the effective interest rate for the security prior to impairment. To calculate the present value of the estimated cash flows for variable rate and hybrid private label MBS, the Bank uses the contractual interest rate plus a fixed spread that sets the present value of cash flows equal to amortized cost before impairment. For securities previously identified as other-than-temporarily impaired, the Bank updates its estimate of future estimated cash flows on a quarterly basis and uses the previous effective rate or spread until there is a significant increase in cash flows. When the Bank determines there is a significant increase in cash flows, the effective rate is increased.
The Bank performed a cash flow analysis using third-party models to assess whether the amortized cost basis of its private label MBS will be recovered. During the fourth quarter of 2019, the OTTI Governance Committee developed a short-term housing price forecast using whole percentages with changes ranging from (4.0)% to 8.0% over the 12 month period beginning October 1, 2019. For the vast majority of markets the short-term forecast has changes from 2.0% to 6.0%. Thereafter, a unique path is projected for each geographic area based on an internally developed framework derived from historical data.
The month-by-month projections of future loan performance derived from the first model, which reflect projected prepayments, defaults, and loss severities, are then input into a second model that allocates the projected loan level cash flows and losses to the various security classes in the securitization structure in accordance with its prescribed cash flow and loss allocation rules. In a securitization in which the credit enhancement for the senior securities is derived from the presence of subordinate securities, losses are generally allocated first to the subordinate securities until their principal balance is reduced to zero.
All of the Bank's other-than-temporarily impaired securities were classified as AFS as of December 31, 2019. The “Total OTTI securities” balances below summarize the Bank’s securities as of December 31, 2019 for which an OTTI has been recognized during the life of the security. The “Private label MBS with no OTTI” balances below represent AFS securities on which an OTTI was not taken. The sum of these two amounts reflects the total AFS private label MBS balance.
OTTI Recognized During the Life of the Security | |||||||||
(in thousands) | Unpaid Principal Balance | Amortized Cost(1) | Fair Value | ||||||
Private label MBS: | |||||||||
Prime | $ | 141,994 | $ | 101,005 | $ | 126,125 | |||
Alt-A | 231,796 | 170,459 | 197,043 | ||||||
Total OTTI securities | 373,790 | 271,464 | 323,168 | ||||||
Private label MBS with no OTTI | 3,160 | 3,160 | 2,978 | ||||||
Total AFS private label MBS | $ | 376,950 | $ | 274,624 | $ | 326,146 | |||
Notes:
(1) Amortized cost includes adjustments made to the cost basis of an investment for accretion of discounts and/or amortization of premiums, collection of cash, and/or OTTI recognized.
The following table presents the rollforward of the amounts related to OTTI credit losses recognized during the life of the security for which a portion of the OTTI charges was recognized in AOCI for 2019, 2018 and 2017.
(in thousands) | 2019 | 2018 | 2017 | ||||||
Beginning balance | $ | 191,234 | $ | 210,875 | $ | 236,461 | |||
Additions: | |||||||||
Additional OTTI credit losses for which an OTTI charge was previously recognized(1) | 570 | 957 | 959 | ||||||
Reductions: | |||||||||
Securities sold and matured during the period(2) | (3,810 | ) | — | 95 | |||||
Increases in cash flows expected to be collected (accreted as interest income over the remaining lives of the applicable securities) | (19,643 | ) | (20,598 | ) | (26,640 | ) | |||
Ending balance | $ | 168,351 | $ | 191,234 | $ | 210,875 | |||
Notes:
(1) For 2019, 2018 and 2017, additional OTTI credit losses for which an OTTI charge was previously recognized relate to all securities that were also previously impaired prior to January 1 of the applicable year.
109
Notes to Financial Statements (continued)
(2) Represents reductions related to securities sold or having reached final maturity during the period, and therefore are no longer held by the Bank at the end of the period.
All Other AFS and HTM Investments. At December 31, 2019, the Bank held certain securities in an unrealized loss position. These unrealized losses were considered to be temporary as the Bank expects to recover the entire amortized cost basis on the remaining securities in unrealized loss positions based on the creditworthiness of the underlying creditor, guarantor, or implicit government support, and the Bank neither intends to sell these securities nor considers it more likely than not that the Bank would be required to sell any such security before its anticipated recovery. As a result, the Bank did not consider any of these other investments to be other-than-temporarily impaired at December 31, 2019.
Note 8 – Advances
General Terms. The Bank offers a wide-range of fixed- and variable-rate advance products with different maturities, interest rates, payment characteristics and optionality. Fixed-rate advances generally have maturities ranging from overnight to 30 years. Variable-rate advances generally have maturities ranging from overnight to 10 years, and the interest rates reset periodically at a fixed spread to LIBOR, SOFR or other specified indices.
At December 31, 2019 and December 31, 2018, the Bank had advances outstanding, including AHP advances, with interest rates ranging from 1.15% to 7.40% and 0.83% and 7.40%, respectively.
The following table details the Bank’s advances portfolio by year of redemption as of December 31, 2019 and December 31, 2018.
(dollars in thousands) | December 31, 2019 | December 31, 2018 | |||||||||
Year of Redemption | Amount | Weighted Average Interest Rate | Amount | Weighted Average Interest Rate | |||||||
Due in 1 year or less | $ | 41,261,372 | 1.97 | % | $ | 37,632,513 | 2.56 | % | |||
Due after 1 year through 2 years | 15,285,269 | 2.31 | 24,728,488 | 2.58 | |||||||
Due after 2 years through 3 years | 6,065,460 | 2.52 | 14,368,363 | 2.64 | |||||||
Due after 3 years through 4 years | 1,305,453 | 2.50 | 4,360,603 | 2.58 | |||||||
Due after 4 years through 5 years | 869,892 | 2.10 | 798,145 | 2.87 | |||||||
Thereafter | 651,673 | 2.76 | 709,479 | 2.79 | |||||||
Total par value | 65,439,119 | 2.12 | % | 82,597,591 | 2.58 | % | |||||
Deferred prepayment fees | (1,814 | ) | (59 | ) | |||||||
Hedging adjustments | 172,770 | (121,985 | ) | ||||||||
Total book value | $ | 65,610,075 | $ | 82,475,547 | |||||||
The Bank also offers convertible advances. Convertible advances allow the Bank to convert an advance from one interest rate structure to another. When issuing convertible advances, the Bank may purchase put options from a member that allow the Bank to convert the fixed-rate advance to a variable-rate advance at the current market rate or another structure after an agreed-upon lockout period. A convertible advance carries a lower interest rate than a comparable-maturity fixed-rate advance without the conversion feature. In addition, the Bank offers certain advances to members that provide a member the right, based upon predetermined exercise dates, to prepay the advance prior to maturity without incurring prepayment or termination fees (returnable advances).
At December 31, 2019 and December 31, 2018, the Bank did not have any advances with embedded features that met the requirements to separate the embedded feature from the host contract and designate the embedded feature as a stand-alone derivative.
110
Notes to Financial Statements (continued)
The following table summarizes advances by the earlier of (i) year of redemption or next call date and (ii) year of redemption or next convertible date as of December 31, 2019 and December 31, 2018.
Year of Redemption or Next Call Date | Year of Redemption or Next Convertible Date | |||||||||||
(in thousands) | December 31, 2019 | December 31, 2018 | December 31, 2019 | December 31, 2018 | ||||||||
Due in 1 year or less | $ | 42,556,372 | $ | 43,667,513 | $ | 41,281,372 | $ | 37,652,513 | ||||
Due after 1 year through 2 years | 14,060,269 | 20,703,488 | 15,285,269 | 24,728,488 | ||||||||
Due after 2 years through 3 years | 6,035,460 | 12,368,363 | 6,065,460 | 14,368,363 | ||||||||
Due after 3 years through 4 years | 1,305,453 | 4,350,603 | 1,299,453 | 4,360,603 | ||||||||
Due after 4 years through 5 years | 829,892 | 798,145 | 864,892 | 792,145 | ||||||||
Thereafter | 651,673 | 709,479 | 642,673 | 695,479 | ||||||||
Total par value | $ | 65,439,119 | $ | 82,597,591 | $ | 65,439,119 | $ | 82,597,591 | ||||
Interest Rate Payment Terms. The following table details interest rate payment terms by year of redemption for advances as of December 31, 2019 and December 31, 2018.
(in thousands) | December 31, 2019 | December 31, 2018 | ||||
Fixed-rate – overnight | $ | 3,847,547 | $ | 4,934,461 | ||
Fixed-rate – term: | ||||||
Due in 1 year or less | 18,059,289 | 17,769,178 | ||||
Thereafter | 16,424,647 | 17,813,978 | ||||
Total fixed-rate | 38,331,483 | 40,517,617 | ||||
Variable-rate: | ||||||
Due in 1 year or less | 19,354,536 | 14,928,874 | ||||
Thereafter | 7,753,100 | 27,151,100 | ||||
Total variable-rate | 27,107,636 | 42,079,974 | ||||
Total par value | $ | 65,439,119 | $ | 82,597,591 | ||
Advance Concentrations. The Bank’s advances are concentrated in commercial banks and savings institutions. As of December 31, 2019, the Bank had advances of $50.8 billion outstanding to the five largest borrowers, which represented 77.7% of the total principal amount of advances outstanding. Of these five, four had outstanding advance balances that were each in excess of 10% of the total portfolio at December 31, 2019.
As of December 31, 2018, the Bank had advances of $63.7 billion outstanding to the five largest borrowers, which represented 77.2% of the total principal amount of advances outstanding. Of these five, three had outstanding advance balances that were each in excess of 10% of the total portfolio at December 31, 2018.
See Note 10 for information related to the Bank’s allowance for credit losses.
Note 9 – Mortgage Loans Held for Portfolio
Under the MPF Program, the Bank invests in mortgage loans that it purchases from its participating members and housing associates. The Bank’s participating members originate, service, and credit enhance residential mortgage loans that are sold to the Bank. See Note 17 for further information regarding transactions with related parties.
111
Notes to Financial Statements (continued)
The following table presents balances as of December 31, 2019 and December 31, 2018 for mortgage loans held for portfolio.
(in thousands) | December 31, 2019 | December 31, 2018 | ||||
Fixed-rate long-term single-family mortgages(1) | $ | 4,863,177 | $ | 4,180,239 | ||
Fixed-rate medium-term single-family mortgages(1) | 167,156 | 201,923 | ||||
Total par value | 5,030,333 | 4,382,162 | ||||
Premiums | 82,108 | 72,756 | ||||
Discounts | (3,616 | ) | (4,123 | ) | ||
Hedging adjustments | 13,632 | 18,126 | ||||
Total mortgage loans held for portfolio | $ | 5,122,457 | $ | 4,468,921 | ||
Note:
(1) Long-term is defined as greater than 15 years. Medium-term is defined as a term of 15 years or less.
The following table details the par value of mortgage loans held for portfolio outstanding categorized by type as of December 31, 2019 and December 31, 2018.
(in thousands) | December 31, 2019 | December 31, 2018 | ||||
Conventional loans | $ | 4,856,543 | $ | 4,194,364 | ||
Government-guaranteed/insured loans | 173,790 | 187,798 | ||||
Total par value | $ | 5,030,333 | $ | 4,382,162 | ||
See Note 10 - Allowance for Credit Losses for information related to the Bank’s credit risk on mortgage loans and allowance for credit losses.
Note 10 – Allowance for Credit Losses
The Bank has established an allowance methodology for each of the Bank’s portfolio segments: credit products, government-guaranteed or insured MPF loans held for portfolio, conventional MPF loans held for portfolio, and BOB loans.
Credit Products. The Bank manages its total credit exposure (TCE), which includes advances, letters of credit, advance commitments, and other credit product exposure, through an integrated approach. This approach generally requires a credit limit to be established for each borrower. This approach includes an ongoing review of each borrower’s financial condition in conjunction with the Bank’s collateral and lending policies to limit risk of loss while balancing each borrower’s need for a reliable source of funding. In addition, the Bank lends to its members in accordance with the FHLBank Act and Finance Agency regulations. Specifically, the FHLBank Act requires the Bank to obtain collateral to fully secure credit products. The estimated value of the collateral required to secure each member’s credit products is calculated by applying collateral weightings, or haircuts, to the value of the collateral. The Bank accepts cash, certain investment securities, residential mortgage loans, deposits, and other real estate related assets as collateral. In addition, Community Financial Institutions (CFIs) are eligible to utilize expanded statutory collateral provisions for small business, agriculture, and community development loans. The Bank’s capital stock owned by the borrowing member is pledged as secondary collateral. Collateral arrangements may vary depending upon borrower credit quality, financial condition and performance, borrowing capacity, and overall credit exposure to the borrower. The Bank can require additional or substitute collateral to help ensure that credit products continue to be secured by adequate collateral.
Based upon the financial condition of the member, the Bank either allows a member to retain physical possession of the collateral assigned to the Bank or requires the member to specifically deliver physical possession or control of the collateral to the Bank or its custodians. However, regardless of the member’s financial condition, the Bank always takes possession or control of securities used as collateral. The Bank perfects its security interest in all pledged collateral. The FHLBank Act affords any security interest granted to the Bank by a member (or an affiliate of a member) priority over the claims or rights of any other party except for claims or rights of a third party that would be otherwise entitled to priority under applicable law and that are held by a bona fide purchaser for value or by a secured party holding a prior perfected security interest.
112
Notes to Financial Statements (continued)
Using a risk-based approach, the Bank considers the payment status, collateral types and concentration levels, and borrower’s financial condition to be indicators of credit quality on its credit products. At December 31, 2019 and December 31, 2018, the Bank had rights to collateral on a member-by-member basis with a value in excess of its outstanding extensions of credit.
The Bank continues to evaluate and, as necessary, make changes to its collateral guidelines based on current market conditions. At December 31, 2019 and December 31, 2018, the Bank did not have any credit products that were past due, on nonaccrual status, or considered impaired. In addition, the Bank did not have any credit products considered to be TDRs.
Based upon the collateral held as security, its credit extension policies, collateral policies, management’s credit analysis and the repayment history on credit products, the Bank has not incurred any credit losses on credit products since inception. Accordingly, the Bank has not recorded any allowance for credit losses for these products.
BOB Loans. Both the probability of default and loss given default are determined and used to estimate the allowance for credit losses on BOB loans. Loss given default is considered to be 100% due to the fact that the BOB program has no collateral or credit enhancements. The probability of default is based on the actual performance of the BOB program. The Bank considers BOB loans that are delinquent to be nonperforming assets. The allowance for credit losses on BOB loans was immaterial as of December 31, 2019 and December 31, 2018 and is not included in the tables that follow.
TDRs - BOB Loans. The Bank offers a BOB loan deferral, which the Bank considers a TDR. A deferred BOB loan is not required to pay principal or accrue interest for a period up to one year. The credit loss is measured by factoring expected shortfalls incurred as of the reporting date. BOB loan TDRs are immaterial.
Mortgage Loans - Government-Guaranteed or Insured. The Bank invests in government-guaranteed or insured fixed-rate mortgage loans secured by one-to-four family residential properties. Government-guaranteed mortgage loans are those insured or guaranteed by the Federal Housing Administration (FHA), Department of Veterans Affairs (VA), the Rural Housing Service (RHS) of the Department of Agriculture and/or by Housing and Urban Development (HUD). Any losses from such loans are expected to be recovered from those entities. If not, losses from such loans must be contractually absorbed by the servicers. Therefore, there is no allowance for credit losses on government-guaranteed or insured mortgage loans.
Mortgage Loans - Conventional MPF. The allowances for conventional loans are determined by analyses that include consideration of various data observations such as past performance, current performance, loan portfolio characteristics, collateral-related characteristics, industry data, and prevailing economic conditions. The measurement of the allowance for credit losses includes: (1) reviewing all residential mortgage loans at the individual master commitment level; (2) reviewing specifically identified collateral-dependent loans for impairment; and/or (3) reviewing homogeneous pools of residential mortgage loans.
The Bank’s allowance for credit losses takes into consideration the CE associated with conventional mortgage loans under the MPF Program. Specifically, the determination of the allowance generally considers expected Primary Mortgage Insurance (PMI), SMI, and other CE amounts. Any incurred losses that are expected to be recovered from the CE reduce the Bank’s allowance for credit losses.
For conventional MPF loans, credit losses that are not fully covered by PMI are allocated to the Bank up to an agreed-upon amount, referred to as the FLA. The FLA functions as a tracking mechanism for determining the point after which the PFI is required to cover losses. The Bank pays the PFI a fee, a portion of which may be based on the credit performance of the mortgage loans, in exchange for absorbing the second layer of losses up to an agreed-upon CE amount. The CE amount may be a direct obligation of the PFI and/or an SMI policy paid for by the PFI, and may include performance-based fees which can be withheld to cover losses allocated to the Bank (referred to as recaptured CE fees). The PFI is required to pledge collateral to secure any portion of its CE amount that is a direct obligation. A receivable which is assessed for collectibility is generally established for losses expected to be recovered by withholding CE fees. Estimated losses exceeding the CE, if any, are incurred by the Bank. At December 31, 2019 and December 31, 2018, the MPF exposure under the FLA was $32.5 million and $29.1 million, respectively. The Bank records CE fees paid to PFIs as a reduction to mortgage loan interest income. The Bank incurred CE fees of $5.3 million, $4.6 million and $3.7 million in 2019, 2018 and 2017, respectively.
Individually Evaluated Mortgage Loans. The Bank evaluates certain conventional mortgage loans for impairment individually. This includes impaired loans considered collateral-dependent loans where repayment is expected to be provided by the sale of the underlying property, which primarily consists of MPF loans that are 180 days or more delinquent, troubled debt restructurings, and other loans where the borrower has filed for bankruptcy.
113
Notes to Financial Statements (continued)
The estimated credit losses on impaired collateral-dependent loans are separately determined because sufficient information exists to make a reasonable estimate of the inherent loss for such loans on an individual basis. The incurred loss on each loan is equal to the difference between the carrying value of the loan and the estimated fair value of the collateral less estimated selling costs and recovery through PMI. The estimated fair value is determined based on a value provided by a third party's retail-based Automated Valuation Model (AVM). The Bank adjusts the AVM based on the amount it has historically received on liquidations. The estimated credit loss on individually evaluated MPF loans is charged-off against the reserve. However, if the estimated loss can be recovered through CE, a receivable is established, resulting in a net charge-off. The CE receivable is evaluated for collectibility, and a reserve, included as part of the allowance for credit losses, is established if required.
Collectively Evaluated Mortgage Loans. For the remainder of the portfolio, the Bank evaluates the homogeneous mortgage loan portfolio collectively for impairment. The allowance for credit loss methodology for mortgage loans considers loan pool specific attribute data, applies loss severities and incorporates the CEs of the MPF Program and PMI. The probability of default and loss given default are based on the actual 12-month historical performance of the Bank’s mortgage loans. Actual probability of default was determined by applying migration analysis to categories of mortgage loans (current, 30 days past due, 60 days past due, and 90 days past due). Actual loss given default was determined based on realized losses incurred on the sale of mortgage loan collateral over the previous 12 months. The resulting estimated losses are reduced by the CEs the Bank expects to be eligible to receive. The CEs are contractually set and calculated by a master commitment agreement between the Bank and the PFI. Losses in excess of the CEs are incurred by the Bank.
Rollforward of Allowance for Credit Losses. Mortgage Loans - Conventional MPF.
(in thousands) | 2019 | 2018 | 2017 | ||||||
Balance, beginning of period | $ | 7,309 | $ | 5,954 | $ | 6,231 | |||
(Charge-offs) Recoveries, net (1) | (138 | ) | (1,311 | ) | (160 | ) | |||
Provision (benefit) for credit losses | 661 | 2,666 | (117 | ) | |||||
Balance, December 31 | $ | 7,832 | $ | 7,309 | $ | 5,954 | |||
(1) Net charge-offs that the Bank does not expect to recover through CE receivable.
Allowances for Credit Losses and Recorded Investment by Impairment Methodology. Mortgage Loans - Conventional MPF.
(in thousands) | 2019 | 2018 | 2017 | ||||||
Ending balance, individually evaluated for impairment | $ | 6,266 | $ | 6,238 | $ | 5,218 | |||
Ending balance, collectively evaluated for impairment | 1,566 | 1,071 | 736 | ||||||
Total allowance for credit losses | $ | 7,832 | $ | 7,309 | $ | 5,954 | |||
Recorded investment balance, end of period: | |||||||||
Individually evaluated for impairment, with or without a related allowance | $ | 43,943 | $ | 46,287 | $ | 52,505 | |||
Collectively evaluated for impairment | 4,926,039 | 4,251,857 | 3,682,167 | ||||||
Total recorded investment | $ | 4,969,982 | $ | 4,298,144 | $ | 3,734,672 | |||
114
Notes to Financial Statements (continued)
Credit Quality Indicator - Mortgage Loans. Key credit quality indicators include the migration of past due loans and nonaccrual loans.
(in thousands) | December 31, 2019 | ||||||||
Recorded investment:(1) | Conventional MPF Loans | Government-Guaranteed or Insured Loans (2) | Total | ||||||
Past due 30-59 days | $ | 43,872 | $ | 7,653 | $ | 51,525 | |||
Past due 60-89 days | 8,601 | 2,028 | 10,629 | ||||||
Past due 90 days or more | 12,826 | 3,363 | 16,189 | ||||||
Total past due loans | $ | 65,299 | $ | 13,044 | $ | 78,343 | |||
Total current loans | 4,904,683 | 166,287 | 5,070,970 | ||||||
Total loans | $ | 4,969,982 | $ | 179,331 | $ | 5,149,313 | |||
Other delinquency statistics: | |||||||||
In process of foreclosures, included above (3) | $ | 4,740 | $ | 1,110 | $ | 5,850 | |||
Serious delinquency rate (4) | 0.3 | % | 1.9 | % | 0.3 | % | |||
Past due 90 days or more still accruing interest | $ | — | $ | 3,363 | $ | 3,363 | |||
Loans on nonaccrual status | $ | 14,890 | $ | — | $ | 14,890 | |||
(in thousands) | December 31, 2018 | ||||||||
Recorded investment:(1) | Conventional MPF Loans | Government-Guaranteed or Insured Loans (2) | Total | ||||||
Past due 30-59 days | $ | 33,935 | $ | 9,533 | $ | 43,468 | |||
Past due 60-89 days | 10,055 | 1,668 | 11,723 | ||||||
Past due 90 days or more | 12,495 | 4,245 | 16,740 | ||||||
Total past due loans | $ | 56,485 | $ | 15,446 | $ | 71,931 | |||
Total current loans | 4,241,659 | 178,607 | 4,420,266 | ||||||
Total loans | $ | 4,298,144 | $ | 194,053 | $ | 4,492,197 | |||
Other delinquency statistics: | |||||||||
In process of foreclosures, included above (3) | $ | 6,458 | $ | 1,450 | $ | 7,908 | |||
Serious delinquency rate (4) | 0.3 | % | 2.2 | % | 0.4 | % | |||
Past due 90 days or more still accruing interest | $ | — | $ | 4,245 | $ | 4,245 | |||
Loans on nonaccrual status | $ | 15,728 | $ | — | $ | 15,728 | |||
Notes:
(1) The recorded investment in a loan is the unpaid principal balance, adjusted for charge-offs of estimated losses, accrued interest, net deferred loan fees or costs, unamortized premiums, unaccreted discounts and adjustments for hedging. The recorded investment is not net of any valuation allowance.
(2) The Bank has not recorded any allowance for credit losses on government-guaranteed or -insured mortgage loans at December 31, 2019 or December 31, 2018.
(3) Includes loans where the decision of foreclosure or similar alternative such as pursuit of deed-in-lieu has been reported. Loans in process of foreclosure are included in past due or current loans dependent on their delinquency status.
(4) Loans that are 90 days or more past due or in the process of foreclosure expressed as a percentage of the total loan portfolio class.
TDRs - Mortgage Loans - Conventional MPF. TDRs are considered to have occurred when a concession is granted to the debtor that would not have been considered had it not been for economic or legal reasons related to the debtor’s financial difficulties. The Bank offers a loan modification program for its MPF Program. Loan modifications may include temporary interest rate reductions, deferral or temporary reductions in payment, or capitalization of past due amounts. The loans modified under this program are considered TDRs. The Bank also considers a TDR to have occurred when a borrower files for Chapter 7 bankruptcy, the bankruptcy court discharges the borrower’s obligation and the borrower does not reaffirm the debt. The recorded investment in mortgage loans classified as TDRs was $7.8 million and $9.1 million as of December 31, 2019 and December 31, 2018, respectively. The financial amounts related to TDRs are not material to the Bank’s financial condition, results of operations, or cash flows.
115
Notes to Financial Statements (continued)
REO. The Bank had $2.0 million and $2.9 million of REO reported in Other assets on the Statement of Condition at December 31, 2019 and December 31, 2018, respectively.
Purchases, Sales and Reclassifications. During 2019 and 2018, there were no significant purchases or sales of financing receivables. Furthermore, none of the financing receivables were reclassified to held-for-sale.
Note 11 – Derivatives and Hedging Activities
Nature of Business Activity. The Bank is exposed to interest rate risk primarily from the effect of interest rate changes on its interest-earning assets and interest-bearing liabilities that finance these assets. The goal of the Bank’s interest rate risk management strategy is not to eliminate interest rate risk but to manage it within appropriate limits. To mitigate the risk of loss, the Bank has established policies and procedures that include guidelines on the amount of exposure to interest rate changes it is willing to accept. In addition, the Bank monitors the risk to its interest income, net interest margin and average maturity of interest-earning assets, and interest-bearing liabilities.
Consistent with Finance Agency requirements, the Bank enters into derivatives to manage the interest rate risk exposures inherent in otherwise unhedged assets and funding positions and to achieve the Bank’s risk management objectives. Finance Agency regulation and the Bank’s Risk Governance Policy prohibit trading in or the speculative use of derivative instruments and limit credit risk arising from these instruments. Derivatives are an integral part of the Bank’s financial management strategy. The Bank may use derivatives to:
• | reduce interest rate sensitivity and repricing gaps of assets and liabilities; |
• | preserve a favorable interest rate spread between the yield of an asset (e.g., an advance) and the cost of the related liability (e.g., the consolidated obligation bond used to fund the advance); |
• | mitigate the adverse earnings effects of the shortening or extension of certain assets (e.g., advances or mortgage assets) and liabilities; |
• | manage embedded options in assets and liabilities; |
• | reduce funding costs by combining a derivative with a consolidated obligation as the cost of a combined funding structure can be lower than the cost of a comparable consolidated obligation bond; and |
• | protect the value of existing asset or liability positions or firm commitments |
Types of Derivatives. The Bank’s Risk Governance Policy establishes guidelines for its use of derivatives. The Bank can use instruments such as the following to reduce funding costs and to manage exposure to interest rate risks inherent in the normal course of business:
• | interest rate swaps |
• | interest rate swaptions |
• | interest rate caps or floors; and |
• | futures and forward contracts |
Interest Rate Swaps. An interest rate swap is an agreement between two entities to exchange cash flows in the future. The agreement sets the dates on which the cash flows will be exchanged and the manner in which the cash flows will be calculated. One of the simplest forms of an interest rate swap involves the promise by one party to pay cash flows equivalent to the interest on a notional amount at a predetermined fixed rate for a given period of time. In return for this promise, this party receives cash flows equivalent to the interest on the same notional amount at a variable-rate index for the same period of time. The variable rate received or paid by the Bank on derivatives are LIBOR, SOFR or OIS.
Swaptions. A swaption is an option that gives the buyer the right to enter into a specified interest rate swap at a certain time in the future. When used as a hedge, a swaption can protect the Bank when it is planning to lend or borrow funds in the future against future interest rate changes. The Bank may enter into both payer swaptions and receiver swaptions. A payer swaption is the option to make fixed interest payments at a later date and a receiver swaption is the option to receive fixed interest payments at a later date.
Interest Rate Cap and Floor Agreements. In an interest rate cap agreement, a cash flow is generated if the price or rate of an underlying variable rises above a certain threshold (or cap) price. In an interest rate floor agreement, a cash flow is generated if the price or rate of an underlying variable falls below a certain threshold (or floor) price. Caps and floors are designed as protection against the interest rate on a variable-rate asset or liability falling below or rising above a certain level.
116
Notes to Financial Statements (continued)
Futures and Forwards Contracts. Futures and forwards contracts give the buyer the right to buy or sell a specific type of asset at a specific time at a given price. For example, certain mortgage purchase commitments entered into by the Bank are considered derivatives. The Bank may hedge these commitments by selling to-be-announced (TBA) mortgage-backed securities for forward settlement. A TBA represents a forward contract for the sale of mortgage-backed securities at a future agreed upon date for an established price.
Application of Derivatives. The Bank documents at inception all relationships between derivatives designated as hedging instruments and hedged items, its risk management objectives and strategies for undertaking various hedge transactions, and its method of assessing effectiveness. This process includes linking all derivatives that are designated as fair value hedges to (1) assets and liabilities on the Statement of Condition, or (2) firm commitments.
Derivative financial instruments are designated by the Bank as follows:
• | a qualifying fair value hedge of an associated financial instrument or firm commitment; or |
• | a non-qualifying economic hedge to manage certain defined risks on the Statement of Condition. These hedges are primarily used to: (1) manage mismatches between the coupon features of assets and liabilities, (2) offset prepayment risks in certain assets, (3) mitigate the income statement volatility that occurs when financial instruments are recorded at fair value and hedge accounting is not permitted, or (4) to reduce exposure to reset risk. |
There are two approaches to fair value hedge accounting - long-haul hedge accounting and short-cut hedge accounting. Refer to Note 1 - Significant Accounting Policies for more details.
Derivative transactions may be executed either with a counterparty (referred to as uncleared derivatives) or cleared through a Futures Commission Merchant (i.e., clearing agent) with a Derivatives Clearing Organization (referred to as cleared derivatives). Once a derivative transaction has been accepted for clearing by a Derivative Clearing Organization (Clearing House), the executing counterparty is replaced with the Clearing House. The Bank is not a derivatives dealer and does not trade derivatives for short-term profit. The Bank transacts uncleared derivatives with large banks and major broker-dealers. Some of these banks and broker-dealers or their affiliates buy, sell, and distribute consolidated obligations.
Types of Hedged Items. The Bank has the following types of hedged items:
Investments. The Bank primarily invests in certificates of deposit, U.S. Treasuries, U.S. agency obligations, MBS, and the taxable portion of state or local housing finance agency obligations, which may be classified as HTM, AFS or trading securities. The interest rate and prepayment risks associated with these investment securities are managed through a combination of debt issuance and derivatives. The Bank may manage the prepayment and interest rate risk by funding investment securities with consolidated obligations that have call features or by hedging the prepayment risk with caps or floors, callable swaps or swaptions. The Bank may manage duration risk by funding investment securities with consolidated obligations that contain call features. The Bank may also manage the risk arising from changing market prices and volatility of investment securities by entering into economic derivatives that generally offset the changes in fair value of the securities. Derivatives hedging trading securities (carried at fair value) or HTM securities (carried at amortized cost) are designated as economic hedges. Derivatives hedging AFS securities may be designated as either fair value or economic hedges.
Advances. The Bank offers a wide range of fixed- and variable-rate advance products with different maturities, interest rates, payment characteristics, and optionality. The Bank may use derivatives to manage the repricing and/or options characteristics of advances to match more closely the characteristics of the funding liabilities. In general, whenever a member executes a fixed-rate advance or a variable-rate advance with embedded options, the Bank may simultaneously execute a derivative that offsets the terms and embedded options, if any, in the advance. For example, the Bank may hedge a fixed-rate advance with an interest rate swap where the Bank pays a fixed-rate and receives a variable-rate, effectively converting the fixed-rate advance to a variable-rate advance. This type of hedge is typically treated as a fair value hedge. In addition, the Bank may hedge a callable, prepayable or convertible advance by entering into a cancellable interest-rate swap.
Mortgage Loans. The Bank invests in fixed-rate mortgage loans. The prepayment options embedded in these mortgage loans can result in extensions or contractions in the expected repayment of these investments, depending on changes in estimated prepayment speeds. The Bank manages the interest rate and prepayment risks associated with mortgage loans through a combination of debt issuance and, at times, derivatives, such as interest rate caps and floors, swaptions and callable swaps. Although these derivatives are valid economic hedges against the prepayment risk of the loans, they are not specifically linked to individual loans and, therefore, do not receive hedge accounting.
117
Notes to Financial Statements (continued)
Consolidated Obligations. The Bank may enter into derivatives to hedge the interest rate risk associated with its specific debt issuances. The Bank manages the risk arising from changing market prices and volatility of a consolidated obligation by matching the cash inflow on the derivative with the cash outflow on the consolidated obligation.
For instance, in a typical transaction, fixed-rate consolidated obligations are issued by the Bank, and the Bank simultaneously enters into a matching derivative in which the counterparty pays fixed cash flows designed to mirror, in timing and amount, the cash outflows the Bank pays on the consolidated obligation. The Bank pays a variable cash flow that closely matches the interest payments it receives on short-term or variable-rate advances. The fixed-rate obligation and matching derivative are treated as fair value hedge relationships.
This strategy of issuing consolidated obligations while simultaneously entering into derivatives enables the Bank to offer a wider range of attractively-priced advances to its members and may allow the Bank to reduce its funding costs. The continued attractiveness of this strategy depends on yield relationships between the Bank’s consolidated obligations and derivative markets. If conditions change, the Bank may alter the types or terms of the consolidated obligations that it issues.
Firm Commitments. The Bank’s mortgage loan purchase commitments are considered derivatives and are recorded at fair value. When the mortgage loan purchase commitment derivative settles, the current market value of the commitment is included with the basis of the mortgage loan and amortized accordingly. Because the market in which the purchase of MPF loans differs from the principal market, the transaction price may not equal fair value on the date of the inception of the commitment and may result in a gain or loss for the Bank.
The Bank may also hedge a firm commitment for a forward starting advance through the use of an interest rate swap. In this case, the interest-rate swap functions as the hedging instrument for both the firm commitment and the subsequent advance and is treated as a fair value hedge. Because the firm commitment ends at the same exact time that the advance is settled, the fair value change associated with the firm commitment is effectively rolled into the basis of the advance.
Financial Statement Effect and Additional Financial Information. Derivative Notional Amounts. The notional amount of derivatives serves as a factor in determining periodic interest payments or cash flows received and paid. However, the notional amount of derivatives reflects the Banks' involvement in the various classes of financial instruments and represents neither the actual amounts exchanged nor the overall exposure of the Bank to credit and market risk; the overall risk is much smaller. The risks of derivatives can be measured meaningfully on a portfolio basis that takes into account the counterparties, the types of derivatives, the items being hedged and any offsets between the derivatives and the items being hedged. Additionally, notional values are not meaningful measures of the risks associated with derivatives.
118
Notes to Financial Statements (continued)
The following tables summarize the notional amount and fair value of derivative instruments and total derivatives assets and liabilities. Total derivative assets and liabilities include the effect of netting adjustments and cash collateral. For purposes of this disclosure, the derivative values include the fair value of derivatives and the related accrued interest.
December 31, 2019 | |||||||||
(in thousands) | Notional Amount of Derivatives | Derivative Assets | Derivative Liabilities | ||||||
Derivatives designated as hedging instruments: | |||||||||
Interest rate swaps | $ | 34,572,128 | $ | 14,079 | $ | 4,148 | |||
Derivatives not designated as hedging instruments: | |||||||||
Interest rate swaps | $ | 10,413,906 | $ | 1,676 | $ | 4,642 | |||
Interest rate caps or floors | 1,330,000 | 417 | — | ||||||
Mortgage delivery commitments | 73,574 | 29 | 79 | ||||||
Total derivatives not designated as hedging instruments: | $ | 11,817,480 | $ | 2,122 | $ | 4,721 | |||
Total derivatives before netting and collateral adjustments | $ | 46,389,608 | $ | 16,201 | $ | 8,869 | |||
Netting adjustments and cash collateral (1) | 124,050 | (5,845 | ) | ||||||
Derivative assets and derivative liabilities as reported on the Statement of Condition | $ | 140,251 | $ | 3,024 | |||||
December 31, 2018 | |||||||||
(in thousands) | Notional Amount of Derivatives | Derivative Assets | Derivative Liabilities | ||||||
Derivatives designated as hedging instruments: | |||||||||
Interest rate swaps | $ | 38,062,453 | $ | 9,858 | $ | 60,119 | |||
Derivatives not designated as hedging instruments: | |||||||||
Interest rate swaps | $ | 6,259,799 | $ | 7,701 | $ | 24,533 | |||
Interest rate caps or floors | 1,435,000 | 2,267 | — | ||||||
Mortgage delivery commitments | 17,391 | 29 | 22 | ||||||
Total derivatives not designated as hedging instruments | $ | 7,712,190 | $ | 9,997 | $ | 24,555 | |||
Total derivatives before netting and collateral adjustments | $ | 45,774,643 | $ | 19,855 | $ | 84,674 | |||
Netting adjustments and cash collateral (1) | 90,414 | (59,163 | ) | ||||||
Derivative assets and derivative liabilities as reported on the Statement of Condition | $ | 110,269 | $ | 25,511 | |||||
Note:
(1) Amounts represent the application of the netting requirements that allow the Bank to settle positive and negative positions, cash collateral and related accrued interest held or placed with the same clearing agent and/or counterparties. Cash collateral posted and related accrued interest was $138.1 million and $154.8 million at December 31, 2019 and December 31, 2018, respectively. Cash collateral received was $8.2 million for December 31, 2019 and was $5.2 million at December 31, 2018.
With the adoption of the new hedge accounting guidance, beginning on January 1, 2019, changes in fair value of the derivative and the hedged item attributable to the hedged risk for designated fair value hedges are recorded in net interest income in the same line as the earnings effect of the hedged item. Prior to January 1, 2019, any hedge ineffectiveness (which represented the amount by which the change in the fair value of the derivative differed from the change in the fair value of the hedge item) was recorded in noninterest income as net gains (losses) on derivatives and hedging activities.
119
Notes to Financial Statements (continued)
The following table presents, by type of hedged item, the gains (losses) on derivatives and the related hedged items in fair value hedging relationships and the impact of those derivatives on the Bank’s net interest income. Also included is the amortization of basis adjustments related to mortgage delivery commitments, which are characterized as derivatives, but are not designated in fair value hedge relationships. Beginning on January 1, 2019, gains (losses) on derivatives include unrealized changes in fair value and are included in net interest income.
(in thousands) | Gains/(Losses) on Derivative | Gains/ (Losses) on Hedged Item | Net Interest Settlements | Effect of Derivatives on Net Interest Income | Total Interest Income/ (Expense) Recorded in the Statement of Income | ||||||||||
2019 | |||||||||||||||
Hedged item type: | |||||||||||||||
Advances | $ | (294,994 | ) | $ | 294,750 | $ | 45,080 | $ | 44,836 | $ | 1,871,151 | ||||
AFS securities | (74,404 | ) | 71,490 | 656 | (2,258 | ) | 275,427 | ||||||||
Mortgage loans held for portfolio | — | (3,224 | ) | — | (3,224 | ) | 170,136 | ||||||||
Consolidated obligations – bonds | 154,698 | (156,276 | ) | (60,498 | ) | (62,076 | ) | (1,603,336 | ) | ||||||
Total | $ | (214,700 | ) | $ | 206,740 | $ | (14,762 | ) | $ | (22,722 | ) | ||||
Prior to January 1, 2019, changes in fair value of derivative instruments and the related hedged items for designated fair value hedges were reported in other noninterest income and are presented in the table below.
(in thousands) | Gains/(Losses) on Derivative | Gains/(Losses) on Hedged Item | Net Fair Value Hedge Ineffectiveness in Other Noninterest Income | Effect of Derivatives on Net Interest Income(1) | ||||||||
2018 | ||||||||||||
Hedged item type: | ||||||||||||
Advances | $ | 18,741 | $ | (18,416 | ) | $ | 325 | $ | 38,444 | |||
AFS securities | 29,357 | (28,065 | ) | 1,292 | (3,740 | ) | ||||||
Consolidated obligations – bonds | 9,593 | (10,795 | ) | (1,202 | ) | (82,065 | ) | |||||
Total | $ | 57,691 | $ | (57,276 | ) | $ | 415 | $ | (47,361 | ) | ||
(in thousands) | Gains/(Losses) on Derivative | Gains/(Losses) on Hedged Item | Net Fair Value Hedge Ineffectiveness in Other Noninterest Income | Effect of Derivatives on Net Interest Income(1) | ||||||||
2017 | ||||||||||||
Hedged item type: | ||||||||||||
Advances | $ | 80,621 | $ | (80,759 | ) | $ | (138 | ) | $ | (32,613 | ) | |
AFS securities | 6,158 | (6,928 | ) | (770 | ) | (16,683 | ) | |||||
Consolidated obligations – bonds | (37,418 | ) | 39,519 | 2,101 | 6,751 | |||||||
Total | $ | 49,361 | $ | (48,168 | ) | $ | 1,193 | $ | (42,545 | ) | ||
Note:
(1) Represents the net interest settlements on derivatives in fair value hedge relationships presented in the interest income/expense line item of the respective hedged item. These amounts do not include $(3.6) million and $(3.9) million of amortization/accretion of the basis adjustment related to discontinued fair value hedging relationships for the years ended December 31, 2018 and 2017.
120
Notes to Financial Statements (continued)
The following table presents the cumulative amount of fair value hedging adjustments and the related carrying amount of the hedged items.
(in thousands) | December 31, 2019 | |||||||||||
Hedged item type | Carrying Amount of Hedged Assets/Liabilities (1) | Cumulative Amount of Fair Value Hedging Adjustments Included in the Carrying Amount of the Hedged Assets/Liabilities | Fair Value Hedging Adjustments for Discontinued Hedging Relationships | Cumulative Amount of Fair Value Hedging Adjustments | ||||||||
Advances | $ | 16,724,094 | $ | 172,779 | $ | (9 | ) | $ | 172,770 | |||
AFS securities | 1,391,938 | 48,946 | 1,281 | 50,227 | ||||||||
Consolidated obligations – bonds | 16,715,492 | 32,886 | 160 | 33,046 | ||||||||
Note:
(1) Includes carrying value of hedged items in current fair value hedging relationships.
The following table presents net gains (losses) related to derivatives and hedging activities in other noninterest income. For fair value hedging relationships, the portion of net gains (losses) representing hedge ineffectiveness is recorded in other noninterest income for periods prior to January 1, 2019.
Year ended December 31, | |||||||||
(in thousands) | 2019 | 2018 | 2017 | ||||||
Derivatives designated as hedging instruments: | |||||||||
Interest rate swaps (1) | N/A | $ | 415 | $ | 1,193 | ||||
Derivatives not designated as hedging instruments: | |||||||||
Economic hedges: | |||||||||
Interest rate swaps | $ | (30,295 | ) | $ | 9,573 | $ | 12,776 | ||
Interest rate caps or floors | (1,850 | ) | 482 | (4,245 | ) | ||||
Net interest settlements | (6,846 | ) | (9,075 | ) | (4,683 | ) | |||
TBAs | (53 | ) | (33 | ) | — | ||||
Mortgage delivery commitments | (1,106 | ) | (2,387 | ) | (1,058 | ) | |||
Other | 27 | 23 | 23 | ||||||
Total net gains (losses) related to derivatives not designated as hedging instruments | $ | (40,123 | ) | $ | (1,417 | ) | $ | 2,813 | |
Other - price alignment amount on cleared derivatives (2) | 328 | (3,535 | ) | 580 | |||||
Net gains (losses) on derivatives and hedging activities | $ | (39,795 | ) | $ | (4,537 | ) | $ | 4,586 | |
Notes:
(1) Pertains to total net gains (losses) for fair value hedge ineffectiveness included in other noninterest income. N/A represents not applicable.
(2) This amount is for derivatives for which variation margin is characterized as a daily settled contract.
The Bank had no active cash flow hedging relationships during 2019, 2018 or 2017.
Managing Credit Risk on Derivatives. The Bank is subject to credit risk due to the risk of nonperformance by counterparties to its derivative transactions. The Bank manages counterparty credit risk through credit analysis, collateral requirements, and adherence to the requirements set forth in its policies, U.S. Commodity Futures Trading Commission regulations, and Finance Agency regulations.
Uncleared Derivatives. For uncleared derivatives, the degree of credit risk depends on the extent to which netting arrangements are included in such contracts to mitigate the risk. The Bank requires collateral agreements with collateral delivery thresholds on all uncleared derivatives.
121
Notes to Financial Statements (continued)
Generally, the Bank is subject to certain ISDA agreements for uncleared derivatives that require the Bank to post additional collateral with its counterparties if there is deterioration in the Bank’s credit rating and the net liability position exceeds the relevant threshold. If the Bank’s credit rating were to be lowered by a major credit rating agency, the Bank would be required to deliver additional collateral on uncleared derivative instruments in net liability positions, unless the collateral delivery threshold is set to zero. The aggregate fair value of all uncleared derivative instruments with credit-risk related contingent features that require the Bank to deliver additional collateral due to a credit downgrade and were in a net liability position (before cash collateral and related accrued interest) at December 31, 2019 was $1.6 million. The Bank had no collateral posted against this position and even if the Bank’s credit rating had been lowered one notch (i.e., from its current rating to the next lower rating), the Bank would not have been required to deliver any additional collateral to its derivative counterparties at December 31, 2019.
Cleared Derivatives. For cleared derivatives, Derivative Clearing Organizations (Clearing Houses) are the Bank's counterparties. The Clearing House notifies the clearing agent of the required initial and variation margin. The requirement that the Bank post initial margin and exchange variation margin settlement payments through the clearing agent, which notifies the Bank on behalf of the Clearing Houses, exposes the Bank to institutional credit risk in the event that the clearing agent or the Clearing Houses fail to meet their respective obligations. The use of cleared derivatives is intended to mitigate credit risk exposure through the use of a central counterparty instead of individual counterparties. Collateral postings and variation margin settlement payments are made daily, through a clearing agent, for changes in the value of cleared derivatives. Initial margin is the amount calculated based on anticipated exposure to future changes in the value of a swap and protects the Clearing Houses from market risk in the event of default by one of their respective clearing agents. Variation margin is paid daily to settle the exposure arising from changes in the market value of the position. The Bank uses Chicago Mercantile Exchange (CME) Clearing as the Clearing House for all cleared derivative transactions. Variation margin payments are characterized as daily settlement payments, rather than collateral. Initial margin is considered cash collateral.
Based on credit analyses and collateral requirements, the Bank does not anticipate credit losses related to its derivative agreements. See Note 18 - Estimated Fair Values for discussion regarding the Bank's fair value methodology for derivative assets and liabilities, including an evaluation of the potential for the fair value of these instruments to be affected by counterparty credit risk.
For cleared derivatives, the Clearing House determines initial margin requirements and generally credit ratings are not factored into the initial margin. However, clearing agents may require additional initial margin to be posted based on credit considerations, including but not limited to credit rating downgrades. The Bank was not required by its clearing agents to post additional initial margin at December 31, 2019.
Offsetting of Derivative Assets and Derivative Liabilities. When it has met the netting requirements, the Bank presents derivative instruments, related cash collateral, received or pledged and associated accrued interest on a net basis by clearing agent and/or by counterparty. The Bank has analyzed the enforceability of offsetting rights incorporated in its cleared derivative transactions and determined that the exercise of those offsetting rights by a non-defaulting party under these transactions should be upheld under applicable law upon an event of default including a bankruptcy, insolvency or similar proceeding involving the Clearing Houses or the Bank’s clearing agent, or both. Based on this analysis, the Bank nets derivative fair values on all of its transactions through a particular clearing agent with a particular Clearing House (including settled variation margin) into one net asset or net liability exposure. Initial margin posted to the clearing house is presented as a derivative asset.
122
Notes to Financial Statements (continued)
The following tables present separately the fair value of derivative instruments meeting or not meeting netting requirements. Gross recognized amounts do not include the related collateral received from or pledged to counterparties. Net amounts reflect the adjustments of collateral received from or pledged to counterparties.
Derivative Assets | |||||||
(in thousands) | December 31, 2019 | December 31, 2018 | |||||
Derivative instruments meeting netting requirements: | |||||||
Gross recognized amount: | |||||||
Uncleared derivatives | $ | 8,743 | $ | 17,899 | |||
Cleared derivatives | 7,429 | 1,927 | |||||
Total gross recognized amount | 16,172 | 19,826 | |||||
Gross amounts of netting adjustments and cash collateral | |||||||
Uncleared derivatives | (7,631 | ) | (13,290 | ) | |||
Cleared derivatives | 131,681 | 103,704 | |||||
Total gross amounts of netting adjustments and cash collateral | 124,050 | 90,414 | |||||
Net amounts after netting adjustments and cash collateral | |||||||
Uncleared derivatives | 1,112 | 4,609 | |||||
Cleared derivatives | 139,110 | 105,631 | |||||
Total net amounts after netting adjustments and cash collateral | 140,222 | 110,240 | |||||
Derivative instruments not meeting netting requirements: (1) | |||||||
Uncleared derivatives | 29 | 29 | |||||
Cleared derivatives | — | — | |||||
Total derivative instruments not meeting netting requirements: | 29 | 29 | |||||
Total derivative assets: | |||||||
Uncleared derivatives | 1,141 | 4,638 | |||||
Cleared derivatives | 139,110 | 105,631 | |||||
Total derivative assets as reported in the Statement of Condition | 140,251 | 110,269 | |||||
Net unsecured amount: | |||||||
Uncleared derivatives | 1,141 | 4,638 | |||||
Cleared derivatives | 139,110 | 105,631 | |||||
Total net unsecured amount | $ | 140,251 | $ | 110,269 | |||
123
Notes to Financial Statements (continued)
Derivative Liabilities | |||||||
(in thousands) | December 31, 2019 | December 31, 2018 | |||||
Derivative instruments meeting netting requirements: | |||||||
Gross recognized amount: | |||||||
Uncleared derivatives | $ | 7,135 | $ | 64,038 | |||
Cleared derivatives | 1,655 | 20,614 | |||||
Total gross recognized amount | 8,790 | 84,652 | |||||
Gross amounts of netting adjustments and cash collateral | |||||||
Uncleared derivatives | (4,190 | ) | (57,236 | ) | |||
Cleared derivatives | (1,655 | ) | (1,927 | ) | |||
Total gross amounts of netting adjustments and cash collateral | (5,845 | ) | (59,163 | ) | |||
Net amounts after netting adjustments and cash collateral | |||||||
Uncleared derivatives | 2,945 | 6,802 | |||||
Cleared derivatives | — | 18,687 | |||||
Total net amounts after netting adjustments and cash collateral | 2,945 | 25,489 | |||||
Derivative instruments not meeting netting requirements: (1) | |||||||
Uncleared derivatives | 79 | 22 | |||||
Cleared derivatives | — | — | |||||
Total derivative instruments not meeting netting requirements: | 79 | 22 | |||||
Total derivative liabilities: | |||||||
Uncleared derivatives | 3,024 | 6,824 | |||||
Cleared derivatives | — | 18,687 | |||||
Total derivative liabilities as reported in the Statement of Condition | 3,024 | 25,511 | |||||
Net unsecured amount | |||||||
Uncleared derivatives | 3,024 | 6,824 | |||||
Cleared derivatives | — | 18,687 | |||||
Total net unsecured amount | $ | 3,024 | $ | 25,511 | |||
Note:
(1) Represents derivatives that are not subject to an enforceable netting agreement (e.g., mortgage delivery commitments).
Note 12 – Deposits
The Bank offers demand and overnight deposits to both members and to qualifying nonmembers and term deposits to members. Noninterest-bearing demand and overnight deposits are generally comprised of funds collected by members pending disbursement to the mortgage loan holders, as well as member funds deposited at the FRB.
The following table details interest-bearing and noninterest-bearing deposits as of December 31, 2019 and 2018.
December 31, | ||||||
(in thousands) | 2019 | 2018 | ||||
Interest-bearing: | ||||||
Demand and overnight | $ | 520,320 | $ | 363,853 | ||
Noninterest-bearing: | ||||||
Demand and overnight | 53,062 | 23,232 | ||||
Total deposits | $ | 573,382 | $ | 387,085 | ||
124
Notes to Financial Statements (continued)
Note 13 – Consolidated Obligations
Consolidated obligations consist of consolidated bonds and consolidated discount notes. The FHLBanks issue consolidated obligations through the OF as their agent. In connection with each debt issuance, each FHLBank specifies the amount of debt it wants to have issued on its behalf. The OF tracks the amount of debt issued on behalf of each FHLBank. The Bank records as a liability its specific portion of consolidated obligations for which it is the primary obligor.
The Finance Agency and the U.S. Secretary of the Treasury oversee the issuance of FHLBank debt through the OF. Consolidated bonds may be issued to raise short-, intermediate-, and long-term funds for the FHLBanks and are not subject to any statutory or regulatory limits on their maturity. Consolidated discount notes are issued primarily to raise short-term funds. These notes generally sell at less than their face amount and are redeemed at par value when they mature.
Although the Bank is primarily liable for its portion of consolidated obligations, the Bank is also jointly and severally liable with the other ten FHLBanks for the payment of principal and interest on all consolidated obligations of each of the FHLBanks. The Finance Agency, at its discretion, may require any FHLBank to make principal or interest payments due on any consolidated obligations whether or not the consolidated obligation represents a primary liability of such FHLBank.
Although an FHLBank has never paid the principal or interest payments due on a consolidated obligation on behalf of another FHLBank, if one FHLBank is required to make such payments, Finance Agency regulations provide that the paying FHLBank is entitled to reimbursement from the non-complying FHLBank for any payments made on its behalf and other associated costs, including interest, to be determined by the Finance Agency. If the Finance Agency determines that the non-complying FHLBank is unable to satisfy its repayment obligations, then the Finance Agency may allocate the outstanding liabilities of the non-complying FHLBank among the remaining FHLBanks on a pro rata basis in proportion to each FHLBank’s participation in all consolidated obligations outstanding. However, the Finance Agency reserves the right to allocate the outstanding liabilities for the consolidated obligations among the FHLBanks in any other manner it may determine to ensure that the FHLBanks operate in a safe and sound manner. The par amounts of the 11 FHLBanks’ outstanding consolidated obligations were $1,025.9 billion and $1,031.6 billion at December 31, 2019 and December 31, 2018, respectively.
Regulations require the Bank to maintain unpledged qualifying assets equal to its participation of the consolidated obligations outstanding. Qualifying assets are defined as cash; secured advances; obligations of or fully guaranteed by the United States; obligations, participations, or other instruments of or issued by Fannie Mae or Ginnie Mae; mortgages, obligations or other securities which are or ever have been sold by Freddie Mac under the Act; and such securities as fiduciary and trust funds may invest in under the laws of the state in which the Bank is located. Any assets subject to a lien or pledge for the benefit of holders of any issue of consolidated obligations are treated as if they are free from lien or pledge for purposes of compliance with these regulations.
General Terms. Consolidated obligations are issued with either fixed-rate coupon payment terms or variable-rate coupon payment terms that can use a variety of indices for interest rate resets such as, LIBOR, SOFR and others. To meet the expected specific needs of certain investors in consolidated obligations, both fixed-rate bonds and variable-rate bonds may contain features which may result in complex coupon payment terms and call options. When such consolidated obligations are issued, the Bank may enter into derivatives containing offsetting features that effectively convert the terms of the bond to those of a simple variable-rate bond or a fixed-rate bond. The Bank has no outstanding consolidated obligations denominated in currencies other than U.S. dollars.
These consolidated obligations, beyond having fixed-rate or simple variable-rate coupon payment terms, may also have the following broad terms regarding either principal repayment or coupon payment terms:
Indexed Principal Redemption Bonds (index amortizing notes) repay principal according to predetermined amortization schedules that are linked to the level of a certain index. Usually, as market interest rates rise (fall), the average life of the index amortizing notes extends (contracts).
Optional Principal Redemption Bonds (callable bonds) that the Bank may redeem in whole or in part at its discretion on predetermined call dates according to the terms of the bond offerings.
Interest Rate Payment Terms. With respect to interest payments, consolidated obligation bonds may also have the following terms:
Step-up Bonds generally pay interest at increasing fixed rates at specified intervals over the life of the bond. These bonds generally contain provisions enabling the Bank to call bonds at its option on the step-up dates; and
125
Notes to Financial Statements (continued)
Conversion Bonds have coupons that the Bank may convert from fixed to floating, or floating to fixed, or from one U.S. or other currency index to another, at its discretion on predetermined dates according to the terms of the bond offerings.
The following table details interest rate payment terms for the Bank’s consolidated obligation bonds as of December 31, 2019 and December 31, 2018.
December 31, | |||||||
(in thousands) | 2019 | 2018 | |||||
Par value of consolidated bonds: | |||||||
Fixed-rate | $ | 29,292,200 | $ | 30,158,640 | |||
Step-up | 705,000 | 1,902,280 | |||||
Floating-rate | 36,707,000 | 31,917,500 | |||||
Conversion bonds - fixed to floating | — | 390,000 | |||||
Total par value | 66,704,200 | 64,368,420 | |||||
Bond premiums | 85,028 | 71,636 | |||||
Bond discounts | (8,350 | ) | (10,079 | ) | |||
Concession fees | (6,118 | ) | (8,119 | ) | |||
Hedging adjustments | 33,047 | (123,230 | ) | ||||
Total book value | $ | 66,807,807 | $ | 64,298,628 | |||
Maturity Terms. The following table presents a summary of the Bank’s consolidated obligation bonds outstanding by year of contractual maturity as of December 31, 2019 and December 31, 2018.
December 31, 2019 | December 31, 2018 | |||||||||
(dollars in thousands) Year of Contractual Maturity | Amount | Weighted Average Interest Rate | Amount | Weighted Average Interest Rate | ||||||
Due in 1 year or less | $ | 50,306,900 | 1.83 | % | $ | 37,281,455 | 2.15 | % | ||
Due after 1 year through 2 years | 7,268,705 | 2.10 | 14,056,285 | 2.40 | ||||||
Due after 2 years through 3 years | 2,705,420 | 2.36 | 3,929,705 | 2.48 | ||||||
Due after 3 years through 4 years | 1,469,400 | 2.58 | 2,249,320 | 2.38 | ||||||
Due after 4 years through 5 years | 947,375 | 2.69 | 2,287,180 | 2.96 | ||||||
Thereafter | 4,006,400 | 2.73 | 4,564,475 | 2.80 | ||||||
Total par value | $ | 66,704,200 | 1.96 | % | $ | 64,368,420 | 2.30 | % | ||
The following table presents the Bank’s consolidated obligation bonds outstanding between noncallable and callable as of December 31, 2019 and December 31, 2018.
December 31, | ||||||
(in thousands) | 2019 | 2018 | ||||
Noncallable | $ | 61,597,600 | $ | 56,277,140 | ||
Callable | 5,106,600 | 8,091,280 | ||||
Total par value | $ | 66,704,200 | $ | 64,368,420 | ||
126
Notes to Financial Statements (continued)
The following table presents consolidated obligation bonds outstanding by the earlier of contractual maturity or next call date as of December 31, 2019 and December 31, 2018.
(in thousands) | December 31, | |||||
Year of Contractual Maturity or Next Call Date | 2019 | 2018 | ||||
Due in 1 year or less | $ | 54,157,900 | $ | 45,099,735 | ||
Due after 1 year through 2 years | 6,573,705 | 13,149,285 | ||||
Due after 2 years through 3 years | 2,623,420 | 2,662,705 | ||||
Due after 3 years through 4 years | 1,063,400 | 1,604,320 | ||||
Due after 4 years through 5 years | 827,375 | 708,900 | ||||
Thereafter | 1,458,400 | 1,143,475 | ||||
Total par value | $ | 66,704,200 | $ | 64,368,420 | ||
Consolidated Obligation Discount Notes. Consolidated obligation discount notes are issued to raise short-term funds. Discount notes are consolidated obligations with original maturities up to one year. These notes are issued at less than their face amount and redeemed at par value when they mature. The following table details the Bank’s consolidated obligation discount notes as of December 31, 2019 and December 31, 2018.
December 31, | ||||||
(dollars in thousands) | 2019 | 2018 | ||||
Book value | $ | 23,141,362 | $ | 36,896,603 | ||
Par value | 23,211,524 | 36,984,987 | ||||
Weighted average interest rate (1) | 1.61 | % | 2.36 | % | ||
Note:
(1) Represents an implied rate.
Note 14 – Affordable Housing Program (AHP)
In support of the goal of providing funding for housing and economic development in its district’s communities, the Bank administers a number of programs, some mandated and some voluntary, which make funds available through member financial institutions. In all of these programs, Bank funds flow through member financial institutions into areas of need that are served by our members. AHP, mandated by the Act, is the largest and primary public policy program of the FHLBanks. The Act requires the Bank to contribute 10% of its current year net income (as defined by a Finance Agency advisory bulletin as GAAP net income before interest expense related to mandatorily redeemable capital stock and the assessment for AHP) to AHP and make these funds available for use in the subsequent year. Each year, the Bank’s Board adopts an implementation plan that defines the structure of the program pursuant to the AHP regulations.
Each FHLBank provides subsidies in the form of direct grants and/or below-market interest rate advances where the funds are used to assist in the purchase, construction or rehabilitation of housing for very low-, low-, and moderate-income households. Annually, the FHLBanks must collectively set aside for the AHP the greater of $100 million or 10% of income subject to assessment. The Bank accrues this expense monthly based on its net income. The Bank reduces the AHP liability as members use subsidies.
If the Bank experienced a net loss during a quarter, but still had net earnings for the year, the Bank’s obligation to the AHP would be calculated based on the Bank’s year-to-date net income. If the Bank had net income in subsequent quarters, it would be required to contribute additional amounts to meet its calculated annual obligation. If the Bank experienced a net loss for a full year, the Bank would have no obligation to the AHP for the year since each FHLBank’s required annual AHP contribution is limited to its annual net income. If the aggregate 10% calculation described above was less than $100 million for all the FHLBanks, each FHLBank would be required to contribute a prorated sum to ensure that the aggregate contributions by the FHLBanks equal $100 million. The proration would be made on the basis of an FHLBank’s income in relation to the income of all FHLBanks for the previous year. There was no shortfall in assessments below the $100 million minimum amount for the years ended 2019, 2018, or 2017. If an FHLBank finds that its required contributions are contributing to the financial instability of that FHLBank, it may apply to the Finance Agency for a temporary suspension of its contributions. The Bank did not make any such application in 2019, 2018, or 2017. The Bank awards commitments that are disbursed over 24 to 36 months.
127
Notes to Financial Statements (continued)
The Bank has outstanding AHP commitments of $73.3 million, $58.3 million and $50.3 million as of December 31, 2019, 2018 and 2017, respectively.
The following table presents an analysis of the AHP payable for 2019, 2018, and 2017.
(in thousands) | 2019 | 2018 | 2017 | |||||||
Balance, beginning of the year | $ | 99,578 | $ | 91,563 | $ | 76,712 | ||||
Assessments | 37,140 | 38,683 | 37,768 | |||||||
Subsidy usage, net | (24,429 | ) | (30,668 | ) | (22,917 | ) | ||||
Balance, end of the year | $ | 112,289 | $ | 99,578 | $ | 91,563 | ||||
Note 15 – Capital
The Bank is subject to three capital requirements under its current Capital Plan Structure and the Finance Agency rules and regulations. Regulatory capital does not include AOCI, but does include mandatorily redeemable capital stock.
• | Risk-based capital (RBC). Under this capital requirement, the Bank must maintain at all times permanent capital, defined as Class B stock and retained earnings, in an amount at least equal to the sum of its credit risk, market risk, and operations risk capital requirements, all of which are calculated in accordance with the rules and regulations of the Finance Agency. The Finance Agency may require the Bank to maintain a greater amount of minimum capital levels than is required based on the Finance Agency rules and regulations. |
• | Total regulatory capital. Under this capital requirement, the Bank is required to maintain at all times a total capital-to-assets ratio of at least 4.0%. Total regulatory capital is the sum of permanent capital, Class A stock, any general loss allowance, if consistent with GAAP and not established for specific assets, and other amounts from sources determined by the Finance Agency as available to absorb losses; and |
• | Leverage capital. Under this third capital requirement, the Bank is required to maintain at all times a leverage capital-to-assets ratio of at least 5.0%. Leverage capital is defined as the sum of (i) permanent capital weighted 1.5 times and (ii) all other capital without a weighting factor. |
At December 31, 2019, the Bank was in compliance with all regulatory capital requirements.
The Bank has two subclasses of capital stock: B1 membership stock and B2 activity stock. The Bank had $0.3 billion and $2.7 billion in B1 membership stock and B2 activity stock, respectively at December 31, 2019. The Bank had $0.4 billion and $3.7 billion in B1 membership stock and B2 activity stock, respectively at December 31, 2018.
The following table demonstrates the Bank’s compliance with the regulatory capital requirements at December 31, 2019 and 2018.
December 31, 2019 | December 31, 2018 | |||||||||||
(dollars in thousands) | Required | Actual | Required | Actual | ||||||||
Regulatory capital requirements: | ||||||||||||
RBC | $ | 610,573 | $ | 4,724,586 | $ | 1,238,722 | $ | 5,327,247 | ||||
Total capital-to-asset ratio | 4.0 | % | 4.9 | % | 4.0 | % | 5.0 | % | ||||
Total regulatory capital | 3,828,965 | 4,724,586 | 4,301,712 | 5,327,247 | ||||||||
Leverage ratio | 5.0 | % | 7.4 | % | 5.0 | % | 7.4 | % | ||||
Leverage capital | 4,786,206 | 7,086,879 | 5,377,141 | 7,990,870 | ||||||||
The Finance Agency has established four capital classifications for the FHLBanks: adequately capitalized, undercapitalized, significantly undercapitalized, and critically undercapitalized. On December 13, 2019, the Bank received final notification from the Finance Agency that it was considered “adequately capitalized” for the quarter ended September 30, 2019. As of the date of this filing, the Bank has not received final notice from the Finance Agency regarding its capital classification for the quarter ended December 31, 2019.
128
Notes to Financial Statements (continued)
Mandatorily Redeemable Capital Stock. The Bank is a cooperative whose member financial institutions and former members own all of the relevant Bank’s issued and outstanding capital stock. Shares cannot be purchased or sold except between the Bank and its members at the shares’ par value of $100, as mandated by the Bank’s capital plan.
At December 31, 2019 and December 31, 2018, the Bank had $343.6 million and $24.1 million, respectively, in capital stock subject to mandatory redemption with payment subject to a five-year waiting period and the Bank meeting its minimum regulatory capital requirements. The estimated dividends on mandatorily redeemable capital stock recorded as interest expense were $17.3 million during 2019, and were immaterial during 2018 and 2017.
The following table provides the related dollar amounts for activities recorded in mandatorily redeemable capital stock during 2019, 2018, and 2017.
(in thousands) | 2019 | 2018 | 2017 | ||||||
Balance, beginning of the period | $ | 24,099 | $ | 5,113 | $ | 5,216 | |||
Capital stock subject to mandatory redemption reclassified from capital | 361,549 | 42,733 | 6,746 | ||||||
Redemption/repurchase of mandatorily redeemable stock | (42,073 | ) | (23,747 | ) | (6,849 | ) | |||
Balance, end of the period | $ | 343,575 | $ | 24,099 | $ | 5,113 | |||
As of December 31, 2019, the total mandatorily redeemable capital stock reflected the balance for five institutions. Four institutions were merged out of district and are considered to be non-members and one relocated and became a member of another FHLBank at which time the membership with the Bank terminated.
The following table shows the amount of mandatorily redeemable capital stock by contractual year of redemption at December 31, 2019 and December 31, 2018.
December 31, | |||||||
(in thousands) | 2019 | 2018 | |||||
Due in 1 year or less | $ | 3,316 | $ | 290 | |||
Due after 1 year through 2 years | — | 3,787 | |||||
Due after 2 years through 3 years | 21 | — | |||||
Due after 3 years through 4 years | 20,000 | 22 | |||||
Due after 4 years through 5 years | 320,000 | 20,000 | |||||
Past contractual redemption date due to remaining activity | 238 | — | |||||
Total | $ | 343,575 | $ | 24,099 | |||
Under the terms of the Bank’s Capital Plan, membership capital stock is redeemable five years from the date of membership termination or withdrawal notice from the member. If the membership is terminated due to a merger or consolidation, the membership capital stock is deemed to be excess stock and is repurchased. The activity capital stock (i.e., supporting advances, letters of credit and MPF) relating to termination, withdrawal, mergers or consolidation is recalculated based on the underlying activity. Any excess activity capital stock is repurchased on an ongoing basis as part of the Bank’s excess stock repurchase program that is in effect at the time. Therefore, the redemption period could be less than five years if the stock becomes excess stock. However, the redemption period could extend beyond five years if the underlying activity is still outstanding.
Dividends and Retained Earnings. The Bank is required to contribute 20% of its net income each quarter to a RRE account until the balance of that account equals at least 1% of the Bank’s average balance of outstanding consolidated obligations for the previous quarter. These RRE will not be available to pay dividends. At December 31, 2019, retained earnings were $1,326.0 million, including $910.7 million of unrestricted retained earnings and $415.3 million of RRE.
129
Notes to Financial Statements (continued)
Dividends paid by the Bank are subject to Board approval and may be paid in either capital stock or cash; historically, the Bank has paid cash dividends only. These dividends are based on stockholders' average balances for the previous quarter.
Dividends paid in 2019, 2018, and 2017 are presented in the table below.
Dividend - Annual Yield | ||||||
2019 | 2018 | 2017 | ||||
Membership | Activity | Membership | Activity | Membership | Activity | |
February | 4.5% | 7.75% | 3.5% | 6.75% | 2.0% | 5.0% |
April | 4.5% | 7.75% | 3.5% | 6.75% | 2.0% | 5.0% |
July | 4.5% | 7.75% | 3.5% | 6.75% | 2.0% | 5.0% |
October | 4.5% | 7.75% | 3.5% | 6.75% | 2.0% | 5.0% |
In February 2020, the Bank paid a quarterly dividend equal to an annual yield of 7.75% and 4.5% on activity stock and membership stock, respectively.
The following table summarizes the changes in AOCI for 2019, 2018 and 2017.
(in thousands) | Net Unrealized Gains(Losses) on AFS | Non-credit OTTI Gains(Losses) on AFS | Net Unrealized Gains (Losses) on Hedging Activities | Pension and Post-Retirement Plans | Total | ||||||||||
December 31, 2016 | $ | (12,835 | ) | $ | 67,424 | $ | 223 | $ | (2,516 | ) | $ | 52,296 | |||
Other comprehensive income (loss) before reclassification: | |||||||||||||||
Net unrealized gains | 54,045 | 5,222 | — | — | 59,267 | ||||||||||
Net change in fair value of OTTI securities | — | (652 | ) | — | — | (652 | ) | ||||||||
Non-credit OTTI to credit OTTI | — | 959 | — | — | 959 | ||||||||||
Amortization on hedging activities | — | — | (23 | ) | — | (23 | ) | ||||||||
Pension and post-retirement | — | — | — | (883 | ) | (883 | ) | ||||||||
December 31, 2017 | $ | 41,210 | $ | 72,953 | $ | 200 | $ | (3,399 | ) | $ | 110,964 | ||||
December 31, 2017 | $ | 41,210 | $ | 72,953 | $ | 200 | $ | (3,399 | ) | $ | 110,964 | ||||
Other comprehensive income (loss) before reclassification: | |||||||||||||||
Net unrealized (losses) | (31,323 | ) | (8,777 | ) | — | — | (40,100 | ) | |||||||
Non-credit OTTI to credit OTTI | — | 957 | — | — | 957 | ||||||||||
Amortization on hedging activities | — | — | (24 | ) | — | (24 | ) | ||||||||
Pension and post-retirement | — | — | — | 1,349 | 1,349 | ||||||||||
December 31, 2018 | $ | 9,887 | $ | 65,133 | $ | 176 | $ | (2,050 | ) | $ | 73,146 | ||||
December 31, 2018 | $ | 9,887 | $ | 65,133 | $ | 176 | $ | (2,050 | ) | $ | 73,146 | ||||
Other comprehensive income (loss) before reclassification: | |||||||||||||||
Net unrealized gains (losses) | 35,268 | (13,999 | ) | — | — | 21,269 | |||||||||
Non-credit OTTI to credit OTTI | — | 570 | — | — | 570 | ||||||||||
Amortization on hedging activities | — | — | (27 | ) | — | (27 | ) | ||||||||
Pension and post-retirement | — | — | — | (3,132 | ) | (3,132 | ) | ||||||||
December 31, 2019 | $ | 45,155 | $ | 51,704 | $ | 149 | $ | (5,182 | ) | $ | 91,826 | ||||
130
Notes to Financial Statements (continued)
Note 16 – Employee Retirement Plans
Qualified Defined Benefit Multiemployer Plan. The Bank participates in the Pentegra Defined Benefit Plan for Financial Institutions (Defined Benefit Plan), a tax qualified defined benefit pension plan. The Defined Benefit Plan is treated as a multiemployer plan for accounting purposes, but operates as a multiple-employer plan under the Employee Retirement Income Security Act of 1974 (ERISA) and the Internal Revenue Code (IRC). As a result, certain multiemployer plan disclosures are not applicable to the Defined Benefit Plan. Under the Defined Benefit Plan, contributions made by a participating employer may be used to provide benefits to employees of other participating employers because assets contributed by an employer are not segregated in a separate account or restricted to provide benefits only to employees of that employer. Also, in the event a participating employer is unable to meet its contribution requirements, the required contributions for the other participating employers could increase proportionately. The plan covers officers and employees of the Bank that meet certain eligibility requirements and were hired prior to January 1, 2019.
The Defined Benefit Plan operates on a fiscal year from July 1 through June 30. The Defined Benefit Plan files one Form 5500 on behalf of all employers who participate in the plan. The Employer Identification Number 13-5645888, and the three-digit plan number is 333. There are no collective bargaining agreements in place at the Bank.
The Defined Benefit Plan’s annual valuation process includes calculating the plan’s funded status and separately calculating the funded status of each participating employer. The funded status is defined as the market value of the plan’s assets divided by the funding target (100% of the present value of all benefit liabilities accrued at that date). As permitted by ERISA, the Defined Benefit Plan accepts contributions for the prior plan year up to eight and a half months after the asset valuation date. As a result, the market value of assets at the valuation date (July 1) will increase by any subsequent contributions designated for the immediately preceding plan year ended June 30 that the plan’s participants may choose to make.
The most recent Form 5500 available for the Defined Benefit Plan is for the fiscal year ended June 30, 2018. The Bank’s contributions to the Defined Benefit Plan during 2019 were less than 5% of total plan contributions during the plan year ended June 30, 2018. The Bank’s contributions to the Defined Benefit Plan during 2018 were less than 5% of total plan contributions during the plan year ended June 30, 2017.
(dollars in thousands) | 2019 | 2018 | 2017 | |||||||||
Net pension cost charged to compensation and benefit expense for the year ended December 31 | $ | 3,279 | $ | 5,000 | $ | 7,212 | ||||||
Defined Benefit Plan funded status as of July 1 | 108.6 | % | (a) | 109.9 | % | (b) | 111.3 | % | ||||
Bank’s funded status as of July 1 | 144.8 | % | 147.3 | % | 142.4 | % | ||||||
(a) The Defined Benefit Plan’s funded status as of July 1, 2019 is preliminary and may increase because the plan’s participants are permitted to make contributions for the plan year ended June 30, 2019 through March 15, 2020. The final funded status will not be available until the Form 5500 is filed (this Form 5500 is due April 2020).
(b) The funded status disclosed is preliminary as the Form 5500 had not been filed when disclosed.
Included in the net pension costs above are discretionary contributions of $2.7 million, $4.5 million and $7.0 million in 2019, 2018, and 2017, respectively. As the Defined Benefit Plan's year-end is June 30, the Bank's discretionary contributions, which occur during the Bank's calendar year, may be allocated to multiple Defined Benefit Plan years.
Qualified Defined Contribution Plan. The Bank also participates in the Pentegra Defined Contribution Plan for Financial Institutions, a tax qualified defined contribution pension plan. The Bank’s contributions consist of a matching contribution equal to a percentage of voluntary employee contributions, subject to certain limitations. For those employees that meet certain eligibility requirements and were hired on or after January 1, 2019, the Bank will make an additional contribution to the plan equal to a percentage of the eligible employee’s plan salary. The Bank recognized $1.4 million, $1.2 million and $1.1 million in expense related to plan contributions during 2019, 2018 and 2017, respectively.
Nonqualified Supplemental Deferred Compensation Plans. In addition, the Bank maintains nonqualified deferred compensation plans, available to select employees and directors, which are, in substance, unfunded supplemental defined contribution retirement plans. The plans’ liabilities consist of the accumulated compensation deferrals and accrued earnings (losses) on the deferrals. The Bank’s obligation from these plans was $15.6 million and $11.4 million at December 31, 2019 and December 31, 2018, respectively, and the Bank recognized operating expenses (income) of $2.7 million, $(0.5) million, and $1.6 million for 2019, 2018 and 2017, respectively. Although the nonqualified compensation plans are unfunded, the Bank owns mutual funds held in a Rabbi trust to help secure the Bank’s obligation to participants and to partially offset the earnings
131
Notes to Financial Statements (continued)
(losses) of certain deferred compensation agreements. The estimated fair value of the mutual funds was $13.1 million and $9.7 million at December 31, 2019 and December 31, 2018, respectively.
Post-retirement Health Benefit Plan. The Bank sponsors an unfunded retiree benefits program that includes health care and life insurance benefits for eligible retirees. Employees who retired prior to January 1, 1992 receive health care benefits at the Bank’s expense after age 65. Employees retiring after January 1, 1992 participate in a health reimbursement account (HRA). At the discretion of the Bank, the amount can be modified. A limited life insurance benefit is provided at the Bank’s expense for retirees who retired prior to January 1, 2009. Employees who retired after January 1, 1992 but prior to January 1, 2009 were required to meet specific eligibility requirements of age 65 or age 60 with a minimum of 10 years of service at the time of retirement to be eligible for retiree health and life insurance benefits. The Accumulated Post-retirement Benefit Obligation (APBO) was $2.2 million at December 31, 2019 and $1.8 million at December 31, 2018, respectively.
Supplemental Executive Retirement Plan (SERP). The Bank also maintains an unfunded SERP, a nonqualified defined benefit retirement plan, for certain executives hired prior to January 1, 2019. The SERP ensures, among other things, that participants receive the full amount of benefits to which they would have been entitled under the qualified defined benefit pension plan in the absence of limits on benefits levels imposed by the Internal Revenue Service. The accumulated benefit obligation for the SERP was $11.3 million and $8.4 million at December 31, 2019 and December 31, 2018, respectively. As noted above, all nonqualified plans maintained by the Bank are unfunded; however, the Bank owns mutual funds held in a Rabbi trust to help secure the Bank’s obligation to participants. The estimated fair value of the mutual funds was $2.1 million and $2.0 million at December 31, 2019 and December 31, 2018, respectively.
The Post-retirement Health Benefit Plan and SERP are not material to the Bank. However, the following table sets forth their benefit obligations recorded in “Other liabilities” on the Statements of Condition and amounts recognized in AOCI. In addition, the Bank recognized $1.5 million, $1.7 million, and $1.5 million in expense related to these two plans during 2019, 2018 and 2017, respectively, of which the service cost component was recognized in “Compensation and benefits” expense and all other costs were recognized in “Other operating” expense on the Statements of Income.
SERP | Post-retirement Health Benefit Plan | Total | ||||||||||||||||
(in thousands) | 2019 | 2018 | 2019 | 2018 | 2019 | 2018 | ||||||||||||
Benefit obligations | $ | 14,975 | $ | 10,978 | $ | 2,235 | $ | 1,784 | $ | 17,210 | $ | 12,762 | ||||||
Unrealized actuarial gains (losses) in AOCI | $ | (5,433 | ) | $ | (2,725 | ) | $ | 251 | $ | 675 | $ | (5,182 | ) | $ | (2,050 | ) | ||
Note 17 – Transactions with Related Parties
The Bank is a cooperative whose member institutions own the capital stock of the Bank and may receive dividends on their investments. In addition, certain former members that still have outstanding transactions are also required to maintain their investment in Bank capital stock until the transactions mature or are paid off. All loans, including BOB loans and letters of credit, are issued to members and all mortgage loans held for portfolio are purchased from members. The Bank also maintains demand deposit accounts for members primarily to facilitate settlement activities that are directly related to advances and mortgage loan purchases. These transactions with members are entered into in the normal course of business and represent member activity. In the ordinary course of business, the Bank may utilize products and services, provided at normal market rates and terms, from its members to support its operations. In instances where the member also has an officer or a director who is a Director of the Bank, those transactions are subject to the same eligibility and credit criteria, as well as the same terms and conditions, as all other transactions. Related parties are defined as those parties meeting any one of the following criteria: (1) other FHLBanks in the System; (2) members with capital stock outstanding in excess of 10% of total capital stock outstanding; or (3) members and nonmember borrowers that have an officer or director who is a Director of the Bank.
132
Notes to Financial Statements (continued)
The following table includes significant outstanding related party member activity balances.
December 31, | ||||||
(in thousands) | 2019 | 2018 | ||||
Advances | $ | 34,748,867 | $ | 63,112,341 | ||
Letters of credit (1) | 2,418,025 | 4,839,828 | ||||
MPF loans | 455,600 | 570,986 | ||||
Deposits | 17,904 | 8,824 | ||||
Capital stock | 1,574,659 | 2,729,092 | ||||
Note:
(1) Letters of credit are off-balance sheet commitments.
The following table summarizes the effects on the Statement of Income corresponding to the related party member balances above. Amounts related to interest expense on deposits were immaterial for the periods presented.
Year ended December 31, | |||||||||
(in thousands) | 2019 | 2018 | 2017 | ||||||
Interest income on advances | $ | 1,183,730 | $ | 1,151,369 | $ | 751,571 | |||
Interest income on MPF loans | 27,845 | 33,269 | 42,266 | ||||||
Letters of credit fees | 4,146 | 5,911 | 6,797 | ||||||
The following table summarizes the effect of the MPF activities with FHLBank of Chicago.
Year ended December 31, | |||||||||||
(in thousands) | 2019 | 2018 | 2017 | ||||||||
Servicing fee expense | $ | 3,567 | $ | 3,076 | $ | 2,522 | |||||
December 31, | |||||||
(in thousands) | 2019 | 2018 | |||||
Interest-bearing deposits maintained with FHLBank of Chicago | $ | 5,173 | $ | 5,411 | |||
From time to time, the Bank may borrow from or lend to other FHLBanks on a short-term uncollateralized basis. During 2019, the total amount loaned to and repaid from other FHLBanks was $500.0 million. There was no lending activity during 2018 and 2017. During 2019 and 2018, there was no borrowing activity between the Bank and other FHLBanks. During 2017, the total amount borrowed from and repaid to other FHLBanks was $1.0 billion.
Subject to mutually agreed upon terms, on occasion an FHLBank may transfer at fair value its primary debt obligations to another FHLBank. During 2019, 2018 and 2017, there were no transfers of debt between the Bank and another FHLBank.
From time to time, a member of one FHLBank may be acquired by a member of another FHLBank. When such an acquisition occurs, the two FHLBanks may agree to transfer at fair value the loans of the acquired member to the FHLBank of the surviving member. The FHLBanks may also agree to the purchase and sale of any related hedging instrument. The Bank had no such activity during 2019, 2018 and 2017.
133
Notes to Financial Statements (continued)
Note 18 – Estimated Fair Values
Fair value amounts have been determined by the Bank using available market information and appropriate valuation methods. GAAP defines fair value as the price that would be received to sell an asset or paid to transfer a liability in an orderly transaction between market participants at the measurement date (i.e., an exit price). These estimates are based on recent market data and other pertinent information available to the Bank at December 31, 2019 and December 31, 2018. Although the management of the Bank believes that the valuation methods are appropriate and provide a reasonable determination of the fair value of these financial instruments, there are inherent limitations in any valuation technique. Therefore, these fair values are not necessarily equal to the amounts that would be realized in current market transactions, although they do reflect the Bank’s judgment of how a market participant would estimate the fair values.
The carrying value and estimated fair value of the Banks’ financial instruments at December 31, 2019 and December 31, 2018 are presented in the table below.
Fair Value Summary Table | ||||||||||||||||||
December 31, 2019 | ||||||||||||||||||
(in thousands) | Carrying Value | Level 1 | Level 2 | Level 3 | Netting Adjustment and Cash Collateral (1) | Estimated Fair Value | ||||||||||||
Assets: | ||||||||||||||||||
Cash and due from banks | $ | 21,490 | $ | 21,490 | $ | — | $ | — | $ | — | $ | 21,490 | ||||||
Interest-bearing deposits | 1,476,890 | 1,471,717 | 5,173 | — | — | 1,476,890 | ||||||||||||
Federal funds sold | 3,770,000 | — | 3,769,965 | — | — | 3,769,965 | ||||||||||||
Securities purchased under agreement to resell (2) | 2,200,000 | — | 2,199,973 | — | — | 2,199,973 | ||||||||||||
Trading securities | 3,631,650 | — | 3,631,650 | — | — | 3,631,650 | ||||||||||||
AFS securities | 11,097,769 | — | 10,771,623 | 326,146 | — | 11,097,769 | ||||||||||||
HTM securities | 2,395,691 | — | 2,316,109 | 124,179 | — | 2,440,288 | ||||||||||||
Advances | 65,610,075 | — | 65,662,578 | — | — | 65,662,578 | ||||||||||||
Mortgage loans held for portfolio, net | 5,114,625 | — | 5,313,973 | — | — | 5,313,973 | ||||||||||||
BOB loans, net | 19,706 | — | — | 19,706 | — | 19,706 | ||||||||||||
Accrued interest receivable | 193,352 | — | 193,352 | — | — | 193,352 | ||||||||||||
Derivative assets | 140,251 | — | 16,201 | — | 124,050 | 140,251 | ||||||||||||
Liabilities: | ||||||||||||||||||
Deposits | $ | 573,382 | $ | — | $ | 573,382 | $ | — | $ | — | $ | 573,382 | ||||||
Discount notes | 23,141,362 | — | 23,142,588 | — | — | 23,142,588 | ||||||||||||
Bonds | 66,807,807 | — | 66,981,400 | — | — | 66,981,400 | ||||||||||||
Mandatorily redeemable capital stock (3) | 343,575 | 350,287 | — | — | — | 350,287 | ||||||||||||
Accrued interest payable (3) | 205,118 | — | 198,406 | — | — | 198,406 | ||||||||||||
Derivative liabilities | 3,024 | — | 8,869 | — | (5,845 | ) | 3,024 | |||||||||||
134
Notes to Financial Statements (continued)
December 31, 2018 | ||||||||||||||||||
(in thousands) | Carrying Value | Level 1 | Level 2 | Level 3 | Netting Adjustment and Cash Collateral (1) | Estimated Fair Value | ||||||||||||
Assets: | ||||||||||||||||||
Cash and due from banks | $ | 71,320 | $ | 71,320 | $ | — | $ | — | $ | — | $ | 71,320 | ||||||
Interest-bearing deposits | 2,123,240 | 2,117,829 | 5,411 | — | — | 2,123,240 | ||||||||||||
Federal funds sold | 4,740,000 | — | 4,739,984 | — | — | 4,739,984 | ||||||||||||
Securities purchased under agreement to resell (2) | 1,000,000 | — | 1,000,032 | — | — | 1,000,032 | ||||||||||||
Trading securities | 1,281,053 | — | 1,281,053 | — | — | 1,281,053 | ||||||||||||
AFS securities | 7,846,257 | — | 7,436,707 | 409,550 | — | 7,846,257 | ||||||||||||
HTM securities | 3,086,032 | — | 2,894,813 | 206,320 | — | 3,101,133 | ||||||||||||
Advances | 82,475,547 | — | 82,408,752 | — | — | 82,408,752 | ||||||||||||
Mortgage loans held for portfolio, net | 4,461,612 | — | 4,381,484 | — | — | 4,381,484 | ||||||||||||
BOB loans, net | 17,371 | — | — | 17,371 | — | 17,371 | ||||||||||||
Accrued interest receivable | 234,161 | — | 234,161 | — | — | 234,161 | ||||||||||||
Derivative assets (4) | 110,269 | — | 19,855 | — | 90,414 | 110,269 | ||||||||||||
Liabilities: | ||||||||||||||||||
Deposits | $ | 387,085 | $ | — | $ | 387,085 | $ | — | $ | — | $ | 387,085 | ||||||
Discount notes | 36,896,603 | — | 36,891,722 | — | — | 36,891,722 | ||||||||||||
Bonds | 64,298,628 | — | 64,125,928 | — | — | 64,125,928 | ||||||||||||
Mandatorily redeemable capital stock (3) | 24,099 | 24,571 | — | — | — | 24,571 | ||||||||||||
Accrued interest payable (3) | 226,537 | — | 226,065 | — | — | 226,065 | ||||||||||||
Derivative liabilities | 25,511 | — | 84,674 | — | (59,163 | ) | 25,511 | |||||||||||
Notes:
(1) Amounts represent the application of the netting requirements that allow the Bank to settle positive and negative positions and also cash collateral held and related interest accrued or placed by the Bank with the same clearing agent and/or counterparties.
(2) Based on the fair value of the related collateral held, the securities purchased under agreements to resell were fully collateralized for the periods presented. There were no offsetting liabilities related to these securities at December 31, 2019 and December 31, 2018. These instruments’ maturity term is overnight.
(3) The estimated fair value amount for the mandatorily redeemable capital stock line item includes accrued dividend interest; this amount is excluded from the estimated fair value for the accrued interest payable line item.
Fair Value Hierarchy. The fair value hierarchy is used to prioritize the inputs used to measure fair value by maximizing the use of observable inputs. The inputs are evaluated and an overall level for the fair value measurement is determined. This overall level is an indication of the market observability of the fair value measurement for the asset or liability.
The fair value hierarchy prioritizes the inputs used to measure fair value into three broad levels:
Level 1 Inputs - Quoted prices (unadjusted) for identical assets or liabilities in an active market that the reporting entity can access on the measurement date. An active market for the asset or liability is a market in which the transactions for the asset or liability occur with sufficient frequency and volume to provide pricing information on an ongoing basis.
Level 2 Inputs - Inputs other than quoted prices within Level 1 that are observable inputs for the asset or liability, either directly or indirectly. If the asset or liability has a specified (contractual) term, a Level 2 input must be observable for substantially the full term of the asset or liability. Level 2 inputs include the following: (1) quoted prices for similar assets or liabilities in active markets; (2) quoted prices for identical or similar assets or liabilities in markets that are not active or in which little information is released publicly; (3) inputs other than quoted prices that are observable for the asset or liability (e.g., interest rates and yield curves that are observable at commonly quoted intervals, and implied volatilities) and (4) inputs that are derived principally from or corroborated by observable market data by correlation or other means.
Level 3 Inputs - Unobservable inputs for the asset or liability.
135
Notes to Financial Statements (continued)
The Bank reviews its fair value hierarchy classifications on a quarterly basis. Changes in the observability of the valuation inputs may result in a reclassification of certain assets or liabilities. These reclassifications are reported as transfers in/out as of the beginning of the quarter in which the changes occur. There were no such transfers during 2019, 2018 or 2017.
Summary of Valuation Methodologies and Primary Inputs
The valuation methodologies and primary inputs used to develop the measurement of fair value for assets and liabilities that are measured at fair value on a recurring or nonrecurring basis in the Statement of Condition are listed below.
Investment Securities – non-MBS. The Bank uses either the income or market approach to determine the estimated fair value of non-MBS investment securities.
For instruments that use the income approach, the significant inputs include a market-observable interest rate curve and a discount spread, if applicable. The market-observable interest rate curves and the related instrument types are as follows:
•LIBOR Swap curve: certificates of deposit
•CO curve: GSE and other U.S. obligations
The Bank uses a market approach for its state and local agency bonds. The Bank obtains prices from multiple designated third-party vendors when available, and the default price is the average of the prices obtained. Otherwise, the approach is generally consistent with the approach outlined below for Investment Securities - MBS. Beginning in 2019, the Bank also uses a market approach for U.S. Treasury obligations. Prices are obtained from a third-party vendor based on daily trade activity or dealer quotes. However, for certain short-term U.S. Treasury obligations, market prices are not available, and the Bank uses an income approach.
Investment Securities – MBS. To value MBS holdings, the Bank obtains prices from multiple third-party pricing vendors, when available. The pricing vendors use various proprietary models to price MBS. The inputs to those models are derived from various sources including, but not limited to: benchmark yields, reported trades, dealer estimates, issuer spreads, benchmark securities, bids, offers and other market-related data. Since many MBS do not trade on a daily basis, the pricing vendors use available information such as benchmark curves, benchmarking of like securities, sector groupings and matrix pricing to determine the prices for individual securities, as applicable. Each pricing vendor has an established challenge process in place for all MBS valuations, which facilitates resolution of potentially erroneous prices identified by the Bank.
During the year, the Bank conducts reviews of its pricing vendors to enhance its understanding of the vendors' pricing processes, methodologies and control procedures. To the extent available, the Bank also reviews the vendors' independent auditors' reports regarding the internal controls over their valuation processes.
The Bank's valuation technique first requires the establishment of a median price for each security. All prices that are within a specified tolerance threshold of the median price are included in the cluster of prices that are averaged to compute a default price. Prices that are outside the threshold (outliers) are subject to further analysis (including, but not limited to, comparison to prices provided by an additional third-party valuation service, prices for similar securities, and/or non-binding dealer estimates) to determine if an outlier is a better estimate of fair value. If an outlier (or some other price identified in the analysis) is determined to be a better estimate of fair value, then the outlier (or the other price as appropriate) is used as the final price rather than the default price. If, on the other hand, the analysis confirms that an outlier (or outliers) is (are) in fact not representative of fair value and the default price is the best estimate, then the default price is used as the final price. In all cases, the final price is used to determine the fair value of the security. If all prices received for a security are outside the tolerance threshold level of the median price, then there is no default price, and the final price is determined by an evaluation of all outlier prices as described above.
As of December 31, 2019, for substantially all of its MBS, the Bank received a price from all of its vendors and the default price was the final price. In addition, there were minimal outliers to evaluate. Based on the Bank’s reviews of the pricing methods including inputs and controls employed by the third-party pricing vendors and the relative lack of dispersion among the vendor prices (or, in those instances in which there were outliers or significant yield variances, the Bank’s additional analyses), the Bank believes the final prices are representative of the prices that would have been received if the assets had been sold at the measurement date (i.e., exit prices) and further that the fair value measurements are classified appropriately in the fair value hierarchy. There continues to be unobservable inputs and a lack of significant market activity for private label MBS; therefore, as of December 31, 2019, the Bank classified private label MBS as Level 3.
136
Notes to Financial Statements (continued)
Derivative Assets/Liabilities. The Bank bases the fair values of derivatives with similar terms on market prices, when available. However, market prices do not exist for many types of derivative instruments. Consequently, fair values for these instruments are estimated using standard valuation techniques such as discounted cash flow analysis and comparisons to similar instruments. Estimates developed using these methods are highly subjective and require judgment regarding significant matters such as the amount and timing of future cash flows, volatility of interest rates and the selection of discount rates that appropriately reflect market and credit risks. In addition, the fair value estimates for these instruments include accrued interest receivable/payable which approximate their carrying values due to their short-term nature.
The discounted cash flow analysis used to determine the net present value of derivative instruments utilizes market-observable inputs (inputs that are actively quoted and can be validated to external sources). Inputs by class of derivative are as follows:
Interest-rate related:
• | Discount rate assumption. OIS curve |
• | Forward interest rate assumption (rates projected in order to calculate cash flows through the designated term of the hedge relationship). LIBOR Swap curve, OIS curve or SOFR curve through contractual term. |
• | Volatility assumption. Market-based expectations of future interest rate volatility implied from current market prices for similar options. |
Mortgage delivery commitments:
• | TBA securities prices. Market-based prices of TBAs are determined by coupon class and expected term until settlement and a pricing adjustment reflective of the secondary mortgage market. |
The Bank is subject to credit risk on uncleared derivatives transactions due to the potential nonperformance by the derivatives counterparties. To mitigate this risk, the Bank has entered into netting arrangements and security agreements that provide for delivery of collateral at specified levels. As a result, uncleared derivatives are recognized as collateralized-to-market and the fair value of uncleared derivatives excludes netting adjustments and collateral. The Bank has evaluated the potential for fair value adjustment due to uncleared counterparty credit risk and has concluded that no adjustments are necessary.
The Bank’s credit risk exposure on cleared derivatives is mitigated through the delivery of initial margin to offset future changes in value and daily delivery of variation margin to offset changes in market value. This is executed through the use of a central counterparty, CME). Variation margin payments are daily settlement payments rather than collateral. Initial margin continues to be treated as collateral and accounted for separately.
The fair values of derivatives are netted by clearing agent and/or by counterparty pursuant to the provisions of each of the Bank’s netting agreements. If these netted amounts are positive, they are classified as an asset and, if negative, as a liability.
Impaired Mortgage Loans Held for Portfolio and REO. The estimated fair values of impaired mortgage loans held for portfolio and real estate owned are determined based on values provided by a third party's retail-based AVM. The Bank adjusts the AVM value based on the amount it has historically received on liquidation.
Subjectivity of Estimates. Estimates of the fair value of financial assets and liabilities using the methods described above are highly subjective and require judgments regarding significant matters such as the amount and timing of future cash flows, prepayment speed assumptions, expected interest rate volatility, possible distributions of future interest rates used to value options, and the selection of discount rates that appropriately reflect market and credit risks. The use of different assumptions could have a material effect on the fair value estimates. These estimates are susceptible to material near term changes because they are made as of a specific point in time.
137
Notes to Financial Statements (continued)
Fair Value Measurements. The following tables present, for each hierarchy level, the Bank’s assets and liabilities that are measured at fair value on a recurring or non-recurring basis on its Statement of Condition at December 31, 2019 and December 31, 2018. The Bank measures certain mortgage loans held for portfolio at fair value when a charge-off is recognized and subsequently when the fair value of collateral less costs to sell is lower than the carrying amount. Real estate owned is measured using fair value when the assets' fair value less costs to sell is lower than the carrying amount.
December 31, 2019 | |||||||||||||||
(in thousands) | Level 1 | Level 2 | Level 3 | Netting Adjustment and Cash Collateral(1) | Total | ||||||||||
Recurring fair value measurements - Assets: | |||||||||||||||
Trading securities: | |||||||||||||||
Non MBS: | |||||||||||||||
U.S. Treasury obligations | $ | — | $ | 3,390,772 | $ | — | $ | — | $ | 3,390,772 | |||||
GSE and TVA obligations | — | 240,878 | — | — | 240,878 | ||||||||||
Total trading securities | $ | — | $ | 3,631,650 | $ | — | $ | — | $ | 3,631,650 | |||||
AFS securities: | |||||||||||||||
Non-MBS: | |||||||||||||||
GSE and TVA obligations | $ | — | $ | 1,550,699 | $ | — | $ | — | $ | 1,550,699 | |||||
State or local agency obligations | — | 247,894 | — | — | 247,894 | ||||||||||
MBS: | |||||||||||||||
U.S. obligations single-family MBS | — | 807,586 | — | — | 807,586 | ||||||||||
GSE single-family MBS | — | 4,055,859 | — | — | 4,055,859 | ||||||||||
GSE multifamily MBS | — | 4,109,585 | — | — | 4,109,585 | ||||||||||
Private label MBS | — | — | 326,146 | — | 326,146 | ||||||||||
Total AFS securities | $ | — | $ | 10,771,623 | $ | 326,146 | $ | — | $ | 11,097,769 | |||||
Derivative assets: | |||||||||||||||
Interest rate related | $ | — | $ | 16,172 | $ | — | $ | 124,050 | $ | 140,222 | |||||
Mortgage delivery commitments | — | 29 | — | — | 29 | ||||||||||
Total derivative assets | $ | — | $ | 16,201 | $ | — | $ | 124,050 | $ | 140,251 | |||||
Total recurring assets at fair value | $ | — | $ | 14,419,474 | $ | 326,146 | $ | 124,050 | $ | 14,869,670 | |||||
Recurring fair value measurements - Liabilities | |||||||||||||||
Derivative liabilities: | |||||||||||||||
Interest rate related | $ | — | $ | 8,790 | $ | — | $ | (5,845 | ) | $ | 2,945 | ||||
Mortgage delivery commitments | — | 79 | — | — | 79 | ||||||||||
Total recurring liabilities at fair value (2) | $ | — | $ | 8,869 | $ | — | $ | (5,845 | ) | $ | 3,024 | ||||
Non-recurring fair value measurements - Assets | |||||||||||||||
Impaired mortgage loans held for portfolio | $ | — | $ | — | $ | 7,850 | $ | — | $ | 7,850 | |||||
REO | — | — | 2,449 | — | 2,449 | ||||||||||
Total non-recurring assets at fair value | $ | — | $ | — | $ | 10,299 | $ | — | $ | 10,299 | |||||
138
Notes to Financial Statements (continued)
December 31, 2018 | |||||||||||||||
(in thousands) | Level 1 | Level 2 | Level 3 | Netting Adjustment and Cash Collateral(1) | Total | ||||||||||
Recurring fair value measurements - Assets: | |||||||||||||||
Trading securities: | |||||||||||||||
Non MBS: | |||||||||||||||
U.S. Treasury obligations | $ | — | $ | 997,061 | $ | — | $ | — | $ | 997,061 | |||||
GSE and TVA obligations | — | 283,992 | — | — | 283,992 | ||||||||||
Total trading securities | $ | — | $ | 1,281,053 | $ | — | $ | — | $ | 1,281,053 | |||||
AFS securities: | |||||||||||||||
Non MBS: | |||||||||||||||
GSE and TVA obligations | $ | — | $ | 1,785,317 | $ | — | $ | — | $ | 1,785,317 | |||||
State or local agency obligations | — | 245,939 | — | — | 245,939 | ||||||||||
MBS: | |||||||||||||||
U.S. obligations single-family MBS | — | 218,494 | — | — | 218,494 | ||||||||||
GSE single-family MBS | — | 2,581,503 | — | — | 2,581,503 | ||||||||||
GSE multifamily MBS | — | 2,605,454 | — | — | 2,605,454 | ||||||||||
Private label MBS | — | — | 409,550 | — | 409,550 | ||||||||||
Total AFS securities | $ | — | $ | 7,436,707 | $ | 409,550 | $ | — | $ | 7,846,257 | |||||
Derivative assets: | |||||||||||||||
Interest rate related | $ | — | $ | 19,826 | $ | — | $ | 90,414 | $ | 110,240 | |||||
Mortgage delivery commitments | — | 29 | — | — | 29 | ||||||||||
Total derivative assets | $ | — | $ | 19,855 | $ | — | $ | 90,414 | $ | 110,269 | |||||
Total recurring assets at fair value | $ | — | $ | 8,737,615 | $ | 409,550 | $ | 90,414 | $ | 9,237,579 | |||||
Recurring fair value measurements - Liabilities | |||||||||||||||
Derivative liabilities: | |||||||||||||||
Interest rate related | $ | — | $ | 84,652 | $ | — | $ | (59,163 | ) | $ | 25,489 | ||||
Mortgage delivery commitments | — | 22 | — | — | 22 | ||||||||||
Total recurring liabilities at fair value (2) | $ | — | $ | 84,674 | $ | — | $ | (59,163 | ) | $ | 25,511 | ||||
Non-recurring fair value measurements - Assets | |||||||||||||||
Impaired mortgage loans held for portfolio | $ | — | $ | — | $ | 8,965 | $ | — | $ | 8,965 | |||||
REO | — | — | 6,621 | — | 6,621 | ||||||||||
Total non-recurring assets at fair value | $ | — | $ | — | $ | 15,586 | $ | — | $ | 15,586 | |||||
Notes:
(1)Amounts represent the application of the netting requirements that allow the Bank to settle positive and negative positions and also cash collateral and related accrued interest held or placed by the Bank with the same clearing agent and/or counterparties.
(2) Derivative liabilities represent the total liabilities at fair value.
There were no transfers between Levels 1 or 2 during 2019, 2018 or 2017.
139
Notes to Financial Statements (continued)
Level 3 Disclosures for all Assets and Liabilities That Are Measured at Fair Value on a Recurring Basis. The following table presents a reconciliation of all assets and liabilities that are measured at fair value on the Statement of Condition using significant unobservable inputs (Level 3) for the years ended December 31, 2019, 2018 or 2017. For instruments carried at fair value, the Bank reviews the fair value hierarchy classifications each quarter. Changes in the observability of the valuation attributes may result in a reclassification of certain financial assets or liabilities. Such reclassifications are reported as transfers in/out at fair value in the quarter in which the changes occur. Transfers are reported as of the beginning of the period. There were no Level 3 transfers during 2019, 2018 or 2017.
AFS Private Label MBS Year Ended December 31, 2019 | AFS Private Label MBS Year Ended December 31, 2018 | AFS Private Label MBS Year Ended December 31, 2017 | |||||||
Balance, beginning of period | $ | 409,550 | $ | 524,543 | $ | 673,976 | |||
Total gains (losses) (realized/unrealized) included in: | |||||||||
Accretion of credit losses in interest income | 14,385 | 15,419 | 20,636 | ||||||
Net OTTI losses, credit portion | (570 | ) | (957 | ) | (959 | ) | |||
Net unrealized gains (losses) on AFS in OCI | 33 | (67 | ) | 159 | |||||
Reclassification of non-credit portion included in net income | 570 | 957 | 959 | ||||||
Net change in fair value on OTTI AFS in OCI | — | — | (652 | ) | |||||
Unrealized gains (losses) on OTTI AFS in OCI | (13,999 | ) | (8,777 | ) | 5,222 | ||||
Purchases, issuances, sales, and settlements: | |||||||||
Settlements | (83,823 | ) | (121,568 | ) | (174,798 | ) | |||
Balance at December 31 | $ | 326,146 | $ | 409,550 | $ | 524,543 | |||
Total amount of gains for the periods presented included in earnings attributable to the change in unrealized gains or (losses) relating to assets and liabilities still held at December 31 | $ | 11,443 | $ | 14,462 | $ | 17,210 | |||
140
Notes to Financial Statements (continued)
Note 19 – Commitments and Contingencies
The following table presents the Bank’s various off-balance sheet commitments which are described in detail below.
(in thousands) | December 31, 2019 | December 31, 2018 | ||||||||||
Notional amount | Expiration Date Within One Year | Expiration Date After One Year | Total | Total | ||||||||
Standby letters of credit outstanding (1) (2) | $ | 17,370,617 | $ | — | $ | 17,370,617 | $ | 20,250,625 | ||||
Commitments to fund additional advances and BOB loans | 19,796 | — | 19,796 | 10,987 | ||||||||
Commitments to purchase mortgage loans | 73,574 | — | 73,574 | 17,391 | ||||||||
Unsettled consolidated obligation bonds, at par | 62,000 | — | 62,000 | 196,500 | ||||||||
Unsettled consolidated obligation discount notes, at par | 1,083,406 | — | 1,083,406 | 583,940 | ||||||||
Notes:
(1) Excludes approved requests to issue future standby letters of credit of $23.9 million and $75.3 million at December 31, 2019 and December 31, 2018 respectively.
(2) Letters of credit in the amount of $4.3 billion and $3.9 billion at December 31, 2019 and December 31, 2018 respectively, have renewal language that permits the letter of credit to be renewed for an additional period with a maximum renewal period of approximately 5 years.
Commitments to Extend Credit on Standby Letters of Credit, Additional Advances and BOB Loans. Standby letters of credit are issued on behalf of members for a fee. A standby letter of credit is a financing arrangement between the Bank and its member. If the Bank is required to make payment for a beneficiary’s draw, these amounts are withdrawn from the member’s Demand Deposit Account (DDA). Any remaining amounts not covered by the withdrawal from the member’s DDA are converted into a collateralized overnight advance.
Unearned fees related to standby letters of credit are recorded in other liabilities and had a balance of $3.5 million and $3.9 million as of December 31, 2019 and December 31, 2018, respectively. The Bank monitors the creditworthiness of its standby letters of credit based on an evaluation of the member. The Bank has established parameters for the review, assessment, monitoring and measurement of credit risk related to these standby letters of credit.
Based on management’s credit analyses, collateral requirements, and adherence to the requirements set forth in Bank policy and Finance Agency regulations, the Bank has not recorded any additional liability on these commitments and standby letters of credit. Refer to Note 10 - Allowance for Credit Losses in this Form 10-K. Excluding BOB, commitments and standby letters of credit are collateralized at the time of issuance. The Bank records a liability with respect to BOB commitments, which is reflected in Other liabilities on the Statement of Condition.
The Bank does not have any legally binding or unconditional unused lines of credit for advances at December 31, 2019 or December 31, 2018. However, within the Bank’s Open RepoPlus advance product, there were conditional lines of credit outstanding of $9.8 billion and $8.7 billion at December 31, 2019 and December 31, 2018, and respectively.
Commitments to Purchase Mortgage Loans. The Bank may enter into commitments that unconditionally obligate the Bank to purchase mortgage loans under the MPF Program. These delivery commitments are generally for periods not to exceed 60 days. Such commitments are recorded as derivatives.
Pledged Collateral. The Bank may pledge cash and securities, as collateral, related to derivatives. Refer to Note 11 - Derivatives and Hedging Activities in this Form 10-K for additional information about the Bank's pledged collateral and other credit-risk-related contingent features.
Legal Proceedings. The Bank is subject to legal proceedings arising in the normal course of business. The Bank would record an accrual for a loss contingency when it is probable that a loss has been incurred and the amount can be reasonably estimated. After consultation with legal counsel, management does not anticipate that the ultimate liability, if any, arising out of these matters will have a material effect on the Bank’s financial condition, results of operations, or cash flows.
Notes 1, 8, 11, 13, 14, 15 and 17 also discuss other commitments and contingencies.
141
Item 9: Changes in and Disagreements with Accountants on Accounting and Financial Disclosure
None
Item 9A: Controls and Procedures
Disclosure Controls and Procedures
Under the supervision and with the participation of the Bank’s management, including the chief executive officer, chief operating officer (principal financial officer), and chief accounting officer, the Bank conducted an evaluation of its disclosure controls and procedures, as such term is defined under Rule 13a-15(e) promulgated under the Securities Exchange Act of 1934, as amended (the 1934 Act). Based on this evaluation, the Bank’s chief executive officer, chief operating officer (principal financial officer), and chief accounting officer concluded that the Bank’s disclosure controls and procedures were effective as of December 31, 2019.
Management’s Report on Internal Control Over Financial Reporting
See Item 8. Financial Statements and Supplementary Financial Data — Management’s Annual Report on Internal Control over Financial Reporting in this Form 10-K.
Changes in Internal Control Over Financial Reporting
There have been no changes in internal control over financial reporting that occurred during the fourth quarter of 2019 that have materially affected, or are reasonably likely to materially affect, the Bank’s internal control over financial reporting.
Item 9B: Other Information
None
PART III
Item 10: Directors, Executive Officers and Corporate Governance
As required by the Housing Act, the Bank’s Board is comprised of a combination of industry directors elected by the Bank’s member institutions (Member Directors) on a state-by-state basis and independent directors elected by a plurality of the Bank’s members (Independent Directors). No member of the Bank’s management may serve as a director of an FHLBank. The Bank’s Board currently includes nine Member Directors and seven Independent Directors. This is a reduction in the number of the 17 Director seats in 2019 which resulted from the Finance Agency’s annual adjustment of Director seats and elimination of one Delaware Member Director seat. The Housing Act requires that all of the Bank's Directors be elected by the Bank's members.
Nomination of Member Directors
Member Directors are required by statute and regulation to meet certain specific criteria in order to be eligible to be elected and serve as Bank Directors. To be eligible, an individual must: (1) be an officer or director of a Bank member institution located in the state in which there is an open Bank Director position; (2) the member institution must be in compliance with the minimum capital requirements established by its regulator; and (3) the individual must be a U.S. citizen. See 12 U.S.C. § 1427 and 12 C.F.R. §§1261 et. seq. These criteria are the only permissible eligibility criteria that Member Directors must meet. The FHLBanks are not permitted to establish additional eligibility criteria or qualifications for Member Directors or nominees. For Member Directors, each eligible institution may nominate representatives from member institutions in its respective state to serve four-year terms on the Board of the Bank.
As a matter of statute and regulation, only FHLBank stockholders may nominate and elect Member Directors. FHLBank Boards are not permitted to nominate or elect Member Directors. Specifically, institutions, which are members required to hold stock in the Bank as of the record date (i.e., December 31 of the year prior to the year in which the election is held), are entitled
142
to participate in the election process. With respect to Member Directors, under Finance Agency regulations, no director, officer, employee, attorney, or agent of the Bank (except in his/her personal capacity) may, directly or indirectly, support the nomination or election of a particular individual for a Member Directorship.
Because of the laws and regulations governing FHLBank Member Director nominations and elections, an FHLBank does not know what factors a Bank’s member institutions consider in selecting Member Director nominees or electing Member Directors. Under 12 C.F.R. §1261.9, if an FHLBank’s Board has performed a self-assessment, then, in publishing the nomination or election announcement, that FHLBank can include a statement indicating to the FHLBank’s members participating in the election what skills or experience the Board believes would enhance the FHLBank’s Board. In 2019, 2018 and 2017, the Bank included a statement in its nomination announcement that candidate diversity should be considered by members when nominating candidates for Member Directorships.
Mr. Madhukar Dayal resigned from the Board effective September 15, 2019 as a Delaware Member Director.
Mr. James R. Biery resigned from the Board effective November 30, 2019 as a Pennsylvania Member Director. Pursuant to Finance Agency Regulation 12 C.F.R. § 1261.14, the Board was required to elect an individual to fill the vacant seat for the remainder of the term. The Board elected Mr. Andrew W. Hasley, President of Standard Bank, PaSB, effective January 23, 2020.
Nomination of Independent Directors
For the remainder of directors (referred to as Independent Directors), the members elect these individuals on a district-wide basis to four-year terms. Independent Directors cannot be officers or directors of a Bank member. Independent Director nominees must meet certain statutory and regulatory eligibility criteria and must have experience in, or knowledge of, one or more of the following areas: auditing and accounting, derivatives, financial management, organizational management, project development, and risk management practices. In the case of a public interest Independent Director nominee, such nominee must have four years’ experience representing consumer or community interests in banking services, credit needs, housing, or consumer financial protection. See 12 C.F.R. §1261.7.
Finance Agency regulations permit a Bank Director, officer, attorney, employee, or agent and the Bank’s Board and Advisory Council to support the candidacy of any person nominated by the Board for election to an Independent Directorship. Under the Finance Agency regulation governing Independent Directors, members are permitted to recommend candidates to be considered by the Bank to be included on the nominee slate and the Bank maintains a standing notice soliciting nominations for Independent Director positions on its public website.
Mr. John K. Darr resigned his position as an Independent Director effective December 31, 2018. Pursuant to Finance Agency Regulation 12 C.F.R. § 1261.14, the Board elected Ms. Angel L. Helm, effective April 1, 2019, to fill the remainder of Mr. Darr’s term ending December 31, 2019.
Ms. Teresa Bazemore resigned her position as an Independent Director effective February 28, 2019. Pursuant to Finance Agency Regulation 12 C.F.R. § 1261.14, the Board elected Ms. Cheryl Johnson, effective April 1, 2019, to fill the remainder of Ms. Bazemore’s term ending December 31, 2020.
Ms. Cheryl Johnson resigned her position as an Independent Director effective July 15, 2019. Pursuant to Finance Agency Regulation 12 C.F.R. § 1261.14, the Board elected Dr. Howard B. Slaughter, Jr., effective January 1, 2020, to fill the remainder of Ms. Johnson’s term ending December 31, 2020. In addition, Dr. Slaughter also met the qualifications to serve as a public interest director and was designated as a public interest director as well.
In 2019, 2018, and 2017, the Bank’s Independent Director nomination notice included a statement encouraging members to consider diversity. Prior to finalizing the Independent Director nominee slate, the Board (or representatives thereof) is required to consult with the Bank’s Affordable Housing Advisory Council and the slate must be sent to the Finance Agency for its review.
In 2019, the Board selected incumbent directors Ms. Angel L. Helm and Ms. Louise M. Herrle as independent director nominees based on a determination that each met the required regulatory qualifications. Ms. Helm and Ms. Herrle were each elected to the Board by the Bank’s members in 2019 (for a term beginning January 2020).
143
In 2018, the Bank’s Board selected incumbent director Mr. Glenn R. Brooks as an independent director nominee based on a determination that he met the required regulatory qualifications. Mr. Brooks was elected to the Bank’s Board in 2018 (for a term beginning January 2019).
In 2017, the Bank’s Board selected incumbent directors Rev. Luis A. Cortés and Mr. Thomas H. Murphy as independent director nominees based on a determination that they met the required regulatory qualifications. In the case of Mr. Murphy, he also had information technology expertise which the Board had previously identified as a skill need on the Board. In addition, Rev. Cortés also met the qualifications to serve as a public interest director and was designated as a public interest director as well.
In 2016, the Bank’s Board selected incumbent director Mr. Patrick A. Bond as an independent director nominee based on a determination that he met the required regulatory qualifications. Mr. Bond also met the qualifications to serve as a public interest director and was designated as a public interest director as well.
2019 Member and Independent Director Elections
Voting rights and process with regard to the election of Member and Independent Directors are set forth in 12 U.S.C. § 1427 and 12 C.F.R. § 1261. For the election of both Member Directors and Independent Directors, each eligible institution is entitled to cast one vote for each share of stock that it was required to hold as of the record date (December 31 of the preceding year); however, the number of votes that each institution may cast for each directorship cannot exceed the average number of shares of stock that were required to be held by all member institutions located in that state on the record date. The only matter submitted to a vote of shareholders in 2019 was the election of vacant Member and Independent Directors, which occurred in the fourth quarter of 2019 as described below. The Bank conducted these elections to fill the open Member and Independent Directorships for 2019 designated by the Finance Agency.
In 2019, the nomination and election of Member Directors and Independent Directors was conducted electronically. No meeting of the members was held in regard to the election. The Board of the Bank does not solicit proxies, nor are eligible institutions permitted to solicit or use proxies to cast their votes in an election for Member or Independent Directors. The election was conducted in accordance with 12 C.F.R. Part 1261. Following the determination of the Finance Agency, there were two Member Director seats up for election in 2019, one in Pennsylvania and one in Delaware. The Pennsylvania Member Director re-elected was Mr. William C. Marsh. The Delaware Member Director re-elected was Ms. Pamela C. Asbury. The Independent Directors re-elected were Ms. Angel L. Helm and Ms. Louise M. Herrle. Information about the results of the 2019 Member and Independent Director elections, including the votes cast, was reported in the Form 8-K filed on November 15, 2019.
144
Information Regarding Current FHLBank Directors
The following table sets forth certain information (ages as of February 29, 2020) regarding each of the Directors currently serving on the Bank’s Board. No Director of the Bank is related to any other Director or executive officer of the Bank by blood, marriage, or adoption.
Name | Age | Director Since | Term Expires | Board Committees |
Bradford E. Ritchie (Member)1 | 52 | 2011 | 2022 | (a)(b)(c)(d)(e)(f)(g)(h) |
Louise M. Herrle (Independent)2 | 62 | 2018 | 2023 | (a)(b)(c)(d)(e)(f)(g)(h) |
Pamela C. Asbury (Member)3 | 55 | 2015 | 2023 | (c)(e)(g)(h) |
Patrick A. Bond (Independent) | 70 | 2007 | 2020 | (b)(f)(h) |
Glenn R. Brooks (Independent) | 56 | 2015 | 2022 | (d)(e)(h) |
Rev. Luis A. Cortés, Jr. (Independent)4 | 62 | 2007 | 2021 | (d)(f)(g)(h) |
Andrew W. Hasley (Member)5 | 55 | 2020 | 2020 | (a)(d)(h) |
Angel L. Helm (Independent)6 | 57 | 2019 | 2023 | (a)(b)(h) |
William C. Marsh (Member) | 53 | 2012 | 2023 | (a)(c)(g)(h) |
Brendan J. McGill (Member) | 51 | 2017 | 2020 | (d)(f)(g)(h) |
Lynda A. Messick (Member)7 | 67 | 2011 | 2022 | (a)(d)(h) |
Glenn E. Moyer (Member) | 68 | 2018 | 2021 | (a)(c)(g)(h) |
Thomas H. Murphy (Independent)8 | 57 | 2016 | 2021 | (c)(e)(g)(h) |
Charles J. Nugent (Member) | 71 | 2010 | 2021 | (b)(f)(g)(h) |
Dr. Howard B. Slaughter, Jr. (Independent)9 | 62 | 2020 | 2020 | (c)(e)(h) |
Jeane M. Vidoni (Member) | 59 | 2019 | 2022 | (b)(f)(h) |
(a) Member of Audit Committee
(b) Member of Finance Committee
(c) Member of Governance and Public Policy Committee
(d) Member of Affordable Housing, Products and Services Committee
(e) Member of Operational Risk Committee
(f) Member of Human Resources and Diversity & Inclusion Committee
(g) Member of Executive Committee
(h) Member of Enterprise Risk Management (ERM) Committee. This is a committee of the whole Board.
1 Serves on the Executive and ERM Committees and as a non-voting ex-officio member of each other standing Board committee.
2 Serves on the Executive, ERM, Operational Risk and Finance Committees and as a non-voting ex-officio member of other committees. Pursuant to Finance Agency Regulation, Ms. Herrle was originally elected by the Board, effective September 10, 2018, to fill a seat vacated for a term ending December 31, 2019. See Form 8-K filed by the Bank on September 14, 2018.
3 Ms. Asbury was originally elected in 2015 by the Board to fill a seat vacated by a Delaware Member Director for a term ending December 31, 2015.
4 Rev. Cortés served a previous term from 2002 to 2004 as an appointed director.
5 Pursuant to Finance Agency Regulation, Mr. Hasley was elected by the Board to fill a seat, effective January 23, 2020, vacated by Mr. Biery for a term ending December 31, 2020.
6 Pursuant to Finance Agency Regulation, Ms. Helm was originally elected by the Board to fill a seat, effective April 1, 2019, vacated by Mr. Darr for a term ending December 31, 2019.
7 Ms. Messick was elected by the Board in 2011 to fill a seat vacated by a Delaware Member Director for a term that ended December 31, 2011. She was again elected in June 2012 to fill a seat vacated by another Delaware Member Director for a term that ended December 31, 2014.
8 Pursuant to Finance Agency Regulation, Mr. Murphy was originally elected by the Board effective November 14, 2016 to fill a seat vacated for a term ending December 31, 2017.
9 Pursuant to Finance Agency Regulation, Dr. Slaughter was elected by the Board, effective January 1, 2020, to fill a seat vacated by Ms. Johnson for a term ending December 31, 2020.
Bradford E. Ritchie (Chair). Bradford Ritchie joined the Board of Directors of the Bank in January 2011. Mr. Ritchie is President of Summit Community Bank. Prior to joining Summit Community Bank, he served as the President of Charleston Market of United Bank Inc. until July 2008. Before then, Mr. Ritchie spent seven years at Arnett & Foster, a West Virginia CPA firm. Mr. Ritchie is a graduate of West Virginia University with a degree in Business Administration/Accounting. He is a CPA, a past president of the West Virginia Society of Certified Public Accountants, and a current board member of the Community
145
Bankers of West Virginia. Mr. Ritchie served on the Board of Trustees of the University of Charleston for 12 years and is a past director of the United Way of Central West Virginia and the Community Council of Charleston.
Louise M. Herrle (Vice Chair). Louise Herrle joined the Board of Directors of the Bank in September 2018. Ms. Herrle is a senior corporate finance executive with extensive experience in developing and leading innovative global debt finance programs and in capital market risk management. In addition, she has provided financial advisory services to Fortune 100 companies and was the leading architect of a financing platform for social impact investments. Ms. Herrle has received multiple awards for excellence in corporate financing and was a featured speaker for industry events and conferences throughout her career. She is the former Executive Board Chair of Strong Women, Strong Girls, Inc. and continues to serve on both the Executive and Pittsburgh Boards in addition to serving on the Advisory Board of Power Forward Inc. Ms. Herrle received her BSBA degree from Robert Morris College, holds a Series 79 and Series 66 license, and in 2019 became a National Association of Corporate Directors (NACD) Governance Fellow.
Pamela C. Asbury. Pamela Asbury joined the Board of Directors of the Bank in January 2015. Ms. Asbury is Vice President of the U.S. life insurance companies of Genworth Financial, Inc., including Genworth Life Insurance Company and has over 30 years of experience in the insurance industry. She currently serves as Senior Director, Long Term Care Inforce Products with previous leadership roles in Institutional Markets and Closed Block management. Ms. Asbury received her undergraduate degree from Virginia Commonwealth University’s School of Business and is a certified Six Sigma Black Belt under the GE Capital Project Management Program.
Patrick A. Bond. Patrick Bond joined the Board of Directors of the Bank in May 2007. He is a Founding General Partner of Mountaineer Capital, LP in Charleston, West Virginia. He graduated with a BS in Industrial Engineering and an MS in Industrial Engineering from West Virginia University. He is Chairman of the Board of Directors of Mid-Atlantic Holdings and serves on the Boards of Troy, LLC and Core10, Inc. Mr. Bond also serves as a Trustee of the West Virginia Investment Board and is a Board Member of the West Virginia Symphony Orchestra. He is a former member of the Bank’s Affordable Housing Advisory Council.
Glenn R. Brooks. Glenn Brooks joined the Board of Directors of the Bank in January 2015 and was reelected to the Board of Directors in 2018 for a term beginning January 2019. He is President of Leon N. Weiner & Associates, Inc., a Wilmington, Delaware based homebuilding, development and property management firm. The Weiner organization and its affiliated companies have developed and constructed more than 4,500 homes and 9,000 apartments as well as several hotels, office and retail properties. He is responsible for promoting, directing, and overseeing the expansion and growth of the Weiner organization’s development activities and is a member of the firm’s Board of Directors. He has been employed by the firm since 1986. Mr. Brooks served on the Bank’s Affordable Housing Advisory Council between 2004 and 2012. He served as Vice Chairman of the Council in 2006 and 2007 and as Chairman from 2008 to 2010. Mr. Brooks served as the Chairman of the Building Committee of Grove United Methodist Church in West Chester, Pennsylvania from 2009 through 2010. He also served as the President of the Board of Trustees for five years and served on the church’s Finance and Steering Team from 2015 through 2018. Mr. Brooks sits on the Multifamily Board of Trustees and served as Chairman of the Housing Credit Group Committee of the National Association of Homebuilders in 2015 and 2016. He holds a Bachelor of Business Degree from the College of William & Mary in Virginia. Mr. Brooks is a NACD Board Leadership Fellow.
Rev. Luis A. Cortés, Jr. Luis Cortés joined the Board of Directors of the Bank in April 2007. Reverend Cortés has served as the President and CEO of Esperanza since its inception in 1986. Esperanza is the largest Hispanic faith-based organization in the country. The not-for-profit corporation has over 500 employees and manages a $52 million budget. The organization is networked with over twelve thousand Latino congregations in the United States. He is also President Emeritus of Hispanic Clergy of Philadelphia, a religious organization. He has served as a Board member of the Bank from 2002 through 2004, which included his serving as Vice Chairman of the Board. He also serves on the Board of The Cancer Treatment Centers of America, a privately held cancer hospital as well as on the Board of the Kimmel Center in Philadelphia. He developed housing and commercial real estate in the millions of dollars in inner city communities and has published several books, two of which are focused on financial literacy.
Andrew W. Hasley. Andrew W. Hasley, CPA, MBA, joined the Board of Directors of the Bank in January 2020. Mr. Hasley has been President and a director of Standard AVB and Standard Bank since 2017. He was formerly the President, Chief Executive Officer and a director of Allegheny Valley Bancorp and Allegheny Valley Bank from 2006 through 2017. Prior to his work with Allegheny Valley, Mr. Hasley was President of NorthSide Bank and its holding company, NSD Bancorp, Inc. He has also served as President of Pennsylvania Capital Bank. Mr. Hasley’s banking experience dates back to December 1985. He audited financial institutions while employed at Ernst & Whinney and earned the Federal Thrift Regulator designation while employed by the Office of Thrift Supervision. Through his years of experience in this industry, Mr. Hasley has gained significant knowledge in all areas of executive bank management. He has been elected as Chairman of the Board of Directors
146
of the Pennsylvania Association of Community Bankers and has taught continuing professional education for Pennsylvania State University on various banking-related subjects. Mr. Hasley has been active in local charities and his church, serving as President of the Board of Trustees of the Mt. Lebanon Evangelical Presbyterian Church, and is a board member of the Pittsburgh Zoo and PPG Aquarium, serving on the Zoo’s strategic planning and finance committees. Mr. Hasley is a 1985 graduate of Duquesne University in Pittsburgh, Pennsylvania, and obtained his MBA from Duquesne University in 1991. He currently is a member of the Federal Reserve Bank of Cleveland Community Depository Institutions Advisory Council.
Angel L. Helm. Angel Helm joined the Board of Directors of the Bank in April 2019. Ms. Helm is the former Managing Director of Wells Fargo Securities, from where she retired in 2012. Ms. Helm, effective January 6, 2020, is the Interim Chief Executive Officer of Safe Berks, an agency that provides a safe haven and ongoing support system for victims of domestic violence and sexual assault. She also formerly served as Interim Chief Executive Officer of Olivet Boys and Girls Club of Reading and Berks County. Ms. Helm is a Trustee of Caron Treatment Centers, a leading addiction treatment facility, where she currently serves as Finance Committee Chair and as a member of the Executive and Compensation Committees. She also serves on the Board of Directors of Alvernia University in Pennsylvania, where she is currently co-chair of the University’s $9 million capital campaign and previously served as Enrollment Committee Chair. Ms. Helm earned her MBA from St. Joseph’s University and received her B.A. in Business/Managerial Economics from Gettysburg College.
William C. Marsh. William Marsh joined the Board of Directors of the Bank in January 2012. Since January 2009 he has been Chairman of the Board, President and Chief Executive Officer of Emclaire Financial Corp. and The Farmers National Bank of Emlenton. Prior to that he served as Executive Vice President and Chief Financial Officer of these entities since June 2006. Mr. Marsh has served as the chief financial officer and executive of a number of publicly-traded bank holding companies since 1994. Prior to that he served as an audit manager with the international accounting firm, KPMG. Mr. Marsh is a CPA.
Brendan J. McGill. Brendan McGill joined the Board of Directors of the Bank in January 2017. Mr. McGill is President and Chief Executive Officer of Harleysville Bank. Mr. McGill has served as a Director and President of Harleysville Financial Corporation since September 2014 and as Chief Operating Officer since June 2010. Previously, Mr. McGill served as Executive Vice President and Chief Financial Officer from May 2009 until September 2014. From February 2000 until May 2009, Mr. McGill served as the company’s Senior Vice President, Treasurer and Chief Financial Officer. Mr. McGill joined the Harleysville Bank in September 1999 as Senior Vice President, Chief Financial Officer and Treasurer.
Lynda A. Messick. Lynda Messick joined the Board of Directors of the Bank in June 2012. Ms. Messick is a Director of County Bank Delaware and was formerly the President and CEO of Community Bank Delaware since 2006, and was formerly the President of Delaware National Bank, a community bank she helped found in 1979. Ms. Messick also serves as a Chair of Atlantic Community Bankers Bank. Ms. Messick is former Chair of the Nanticoke Health Services board, a nonprofit health care provider in Sussex County Delaware. She left that board in 2018. She is a director of Micronic Technologies, a privately held water technology company.
Glenn E. Moyer. Glenn Moyer joined the Board of Directors of the Bank in January 2018. Mr. Moyer is a director of Univest Bank and Trust Co. and a director of Univest Financial Corporation, the bank’s holding company. Through his firm, Live Oak Strategies, LLC, he undertakes advisory engagements on a limited basis. Mr. Moyer served as Pennsylvania’s Secretary of Banking and Securities from 2011 to 2015 and as Board Chair of the Pennsylvania Housing Finance Agency and voting member of seven other Pennsylvania commonwealth boards during that same period. For more than 30 years prior to his service to the commonwealth, he held a variety of positions in commercial banking including Division President of Meridian Bancorp, Inc. and President, CEO and Director of The Elverson National Bank and of National Penn Bank and its holding company, National Penn Bancshares, Inc. He holds the degrees of Master of Business Administration from St. Joseph’s University, Master of Education from Eastern New Mexico University and Bachelor of Science from Pennsylvania State University. Following his graduation from Penn State, he served as an officer in the U.S. Air Force.
Thomas H. Murphy. Thomas Murphy joined the Board of Directors of the Bank in November 2016. He is the Chief Information Officer (CIO) at the University of Pennsylvania, where he is responsible for the central IT organization, information systems and computing. He has been the CIO at the University of Pennsylvania since 2013. From 2004 through 2012, Mr. Murphy was the Senior Vice President and Global CIO for AmerisourceBergen, a provider of pharmaceutical and healthcare services. He joined AmerisourceBergen from Royal Caribbean Cruise Lines where he also held the title of Global CIO. Mr. Murphy is the Chairperson of the Chief Information Security Officer (CISO) coalition, co-founder and Board Member of the Technology Business Management Council, and is on the National Leadership Board of the Professional Development Academy.
Charles J. Nugent. Charles Nugent joined the Board of Directors of the Bank in January 2010. Mr. Nugent is Vice President of Fulton Bank, N.A. Through December 2013, he also served as Senior Executive Vice President and Chief
147
Financial Officer of Fulton Financial Corporation. Prior to joining Fulton in 1992, he served for eight years as the Chief Financial Officer of First Peoples Financial Corporation in New Jersey. Earlier in his career, he worked for Philadelphia National Corporation and Price Waterhouse. He has been active in a variety of community activities, having served on the Boards of Directors of St. Joseph’s Hospital of Lancaster, the United Way of Lancaster County, the Susquehanna Association for the Blind and Vision Impaired, the Lancaster Symphony Orchestra, the Hamilton Club of Lancaster and the YMCA of Lampeter Strasburg. Mr. Nugent earned a BS degree in Business Administration from LaSalle University. He is a CPA.
Dr. Howard B. Slaughter, Jr. Dr. Howard B. Slaughter, Jr. joined the Board of Directors of the Bank in January 2020. Dr. Slaughter is President and Chief Executive Officer of Habitat for Humanity of Greater Pittsburgh (Habitat Pittsburgh). Prior to joining Habitat Pittsburgh, he was President and Chief Executive Officer of Christian Management Enterprises, LLC. Dr. Slaughter serves on the boards of the Pennsylvania Economic Development Financing Authority, the Housing Alliance of Pennsylvania, the Howard Hanna Free Care Fund Foundation and the Mount Ararat Community Activity Center. He is also a member of the Operational Committee of the Pennsylvania Community Development Bank. He previously served on the board of the Pittsburgh Foundation, as well as on the Consumer Advisory Board of the Consumer Financial Protection Bureau and the Bank’s Affordable Housing Advisory Council. Dr. Slaughter is a veteran of the U.S. Navy. He also served in the 479th Field Artillery Brigade in the U.S. Army Reserves. He earned his doctorate degree in information systems and communications from Robert Morris University, a master’s degree in public management from Carnegie Mellon University’s H. John Heinz III School of Public Management, an MBA degree from Point Park University, a Bachelor of Arts degree from Carlow University and an Associate in Science degree in Financial Services from the Community College of Allegheny County.
Jeane M. Vidoni. Jeane Vidoni joined the Board of Directors of the Bank in January 2019. As President and CEO of Penn Community Bank, Ms. Vidoni oversees Pennsylvania’s second largest mutual financial institution. She also represents the five-county greater Philadelphia region on the board of directors of the Pennsylvania Bankers Association and serves on the Community Depository Institutions Advisory Council of the Federal Reserve Bank of Philadelphia. Ms. Vidoni’s distinguished career in banking has spanned more than three decades. She has served in senior positions at local, regional and national financial institutions throughout the Philadelphia region over the course of her professional career. Prior to her tenure at Penn Community Bank, she held leadership roles at several financial institutions, including President and CEO of First Federal of Bucks County; Senior Vice President, Retail Distribution and Sales Incentives at Citizens Bank; Senior Vice President, Sales Manager at Harleysville National Bank; and Senior Vice President, Head of Retail Banking at Progress Bank. Ms. Vidoni earned her Masters in Business Administration from St. Joseph’s University and her BS degree in Business Administration from Muhlenberg College.
Audit Committee
The Audit Committee has a written charter adopted by the Bank’s Board of Directors. The Audit Committee is responsible for the appointment, compensation, and oversight of the Bank’s independent Registered Public Accounting Firm (RPAF) and Chief Internal Auditor. The Audit Committee also pre-approves all auditing services and approves all audit engagement fees, as well as any permitted non-audit services to be performed for the Bank by the independent RPAF. The independent RPAF reports directly to the Audit Committee. The Bank’s Chief Internal Auditor also reports directly to the Committee. The Audit Committee assists the Board in fulfilling its responsibilities for general oversight of:
• | The Bank’s financial reporting processes and the audit of the Bank’s financial statements, including the integrity of the Bank’s financial statements; |
• | The Bank’s administrative, operating, and internal accounting controls; |
• | The Bank’s compliance with legal and regulatory requirements; |
• | The independent auditors’ qualifications and independence; and |
• | The performance of the Bank’s internal audit function and independent auditors. |
Currently, the Audit Committee is composed of Messrs. Marsh (Chair), Hasley, and Moyer and Mses. Messick (Vice Chair) and Helm. The Audit Committee regularly holds separate sessions with the Bank’s management, internal auditors, and independent RPAF.
The Board has determined that Messrs. Marsh and Hasley are each an “audit committee financial expert” within the meaning of the SEC rules. The Bank is required for the purposes of SEC rules regarding disclosure to use a definition of independence of a national securities exchange or a national securities association and to disclose whether each “audit committee financial expert” is “independent” under that definition. The Board has elected to use the New York Stock Exchange definition of independence, and under that definition, Messrs. Marsh, Hasley and Moyer and Ms. Messick are not independent. Ms. Helm is independent under that definition. All of the Directors presently serving on the Audit Committee are independent
148
according to the Finance Agency rules applicable to members of the audit committees of the Boards of Directors of the FHLBanks.
Executive Officers
The following table sets forth certain information (ages as of February 29, 2020) regarding the executive officers of the Bank.
Executive Officer | Age | Capacity In Which Serves |
Winthrop Watson | 65 | President and Chief Executive Officer |
David G. Paulson | 55 | Chief Operating Officer |
John P. Cassidy | 56 | Chief Technology and Operations Officer |
Carolyn M. McKinney | 57 | Chief Human Resources Officer |
Michael A. Rizzo | 58 | Chief Risk Officer |
Dana A. Yealy | 60 | General Counsel and Corporate Secretary |
Winthrop Watson was appointed by the Board of Directors as President and Chief Executive Officer effective January 1, 2011. Previously, he was Chief Operating Officer, a position that he assumed in November 2009. Prior to joining the Bank, Mr. Watson worked at J.P. Morgan for 24 years in a variety of capital markets and financial institution roles most recently as Managing Director in its Asia Pacific investment banking business. Earlier, Mr. Watson led the building of the company’s investment and commercial banking franchise for U.S. government-sponsored enterprises. Mr. Watson serves as a director of the Office of Finance of the Federal Home Loan Banks and the Pentegra Defined Benefit Plan. He is involved in the community as a board member of the Pittsburgh Ballet Theater, the Neighborhood Academy, and the Pennsylvania Economy League of Greater Pittsburgh. Mr. Watson holds an MBA from Stanford University and a BA from the University of Virginia.
David G. Paulson, Chief Operating Officer, joined the Bank in March 2010 as Director, Mortgage Finance and Balance Sheet Management. Mr. Paulson became the Managing Director of Capital Markets in 2012, Chief Financial Officer in 2013, and Chief Operating Officer in 2020. Mr. Paulson came to the Bank from National City Corporation, where he worked for 14 years in a number of capacities, including, as Senior Vice President, Interest Rate Risk and Chief Investment Portfolio Manager. Prior to that, Mr. Paulson was a portfolio manager at Integra Financial Corporation. He holds a BS in Finance and an MBA, both from Duquesne University.
John P. Cassidy joined the Bank in 1999. In January 2020, Mr. Cassidy was promoted to Chief Technology and Operations Officer, having previously served as the Bank’s Chief Information Officer since 2012. He previously served as the Director of Information Technology since 2005. As Chief Technology and Operations Officer, Mr. Cassidy leads the Bank’s information technology and cyber security divisions as well as the member services and operations teams. Prior to joining the Bank, Mr. Cassidy held various IT leadership positions at DuPont, GMAC Mortgage, and Electronic Data Systems. In addition to a BS degree in Computer Science, Mr. Cassidy has an MBA with a focus on Information Technology from the Katz Graduate School of Business at the University of Pittsburgh.
Carolyn M. McKinney joined the Bank in December 2015 as Director, Human Resources and became Chief Human Resources Officer in March 2017. In her role, Ms. McKinney is responsible for strategic human resources leadership, including design and implementation of key initiatives in diversity and inclusion, talent management, organizational development and compliance. She advises the Board of Directors on executive performance management, succession planning and total rewards strategy, to name a few. Prior to joining the Bank in 2015, Ms. McKinney was Vice President, Human Resources at Peoples Natural Gas LLC. A certified Senior HR professional, Ms. McKinney holds a Bachelor of Fine Arts degree from Carnegie Mellon University, a Master of Science degree in Human Resource Management from La Roche College and has served on several regional non-profit boards, including Habitat for Humanity of Greater Pittsburgh.
Michael A. Rizzo joined the Bank in March 2010 and is the Bank’s Chief Risk Officer. Mr. Rizzo served as the Chief Risk Officer of Residential Finance Group, the U.S. residential mortgage lending unit of GMAC ResCap. In addition, Mr. Rizzo served as Chief Credit Officer for Ally (GMAC) Bank mortgage operations. Previous experience includes approximately 15 years in risk and portfolio management roles with Provident Bank in Cincinnati, FleetBoston Financial Corporation and BankBoston. During his seven years with the Office of the Comptroller of the Currency (OCC), Mr. Rizzo was a commissioned national bank examiner and a CPA. He holds a BS degree in Accounting from Bucknell University and is a former board member and chair of Habitat for Humanity of Greater Pittsburgh.
149
Dana A. Yealy joined the Bank in 1986, and has served as General Counsel since August 1991. Mr. Yealy is responsible for the legal, government relations, and corporate secretary functions of the Bank. Prior to joining the Bank, he was an attorney with the Federal Home Loan Bank of Dallas. Mr. Yealy earned his Bachelors degree in Economics from Westminster College, his Juris Doctorate from Dickinson School of Law, and his LL.M in Banking Law from the Boston University School of Law. Mr. Yealy is an active member of the Association of Corporate Counsel, the American Society of Corporate Secretaries, and the Society of Corporate Compliance and Ethics. Mr. Yealy is also a member of several committees of the American, Pennsylvania, and Allegheny County Bar Associations. Mr. Yealy chairs the Board of Directors of the Pittsburgh Legal Diversity & Inclusion Coalition. Mr. Yealy is a Board member of the Pittsburgh Civic Light Opera.
Each executive officer serves at the pleasure of the Board of Directors.
Code of Conduct
The Bank has adopted a code of ethics for all of its employees and directors, including its Chief Executive Officer, Chief Operating Officer (principal financial officer), Chief Accounting Officer, Controller, and those individuals who perform similar functions. A copy of the code of ethics, referred to as the Code of Conduct, is on the Bank’s public website, www.fhlb-pgh.com, and will be provided without charge upon written request to the Legal Department of the Bank at 601 Grant Street, Pittsburgh, Pennsylvania 15219, Attention: General Counsel. Any amendments or waivers to the Bank’s Code of Conduct that apply to the Bank's Chief Executive Officer, Chief Operating Officer (principal financial officer), Chief Accounting Officer, Controller, and those individuals who perform similar functions will be posted to the Bank’s public website.
150
Item 11: Executive Compensation
Compensation Discussion and Analysis
Introduction
This Compensation Discussion and Analysis (CD&A) presents information related to the Bank's compensation program for its Principal Executive Officer (the CEO) and other Named Executive Officers (other Executives and/or NEO). The information includes, among other things, the objectives of the Bank's compensation program and the elements of compensation the Bank provides to its CEO and other Executives.
The Bank's Board has determined that it is necessary to consider the nature, level, and cumulative effect of all elements of the Bank's compensation and benefits program to establish each element of the program at the appropriate level.
2019 Compensation Philosophy
The Bank's compensation program is designed to:
• | Attract, motivate, and retain staff critical to the Bank's long-term success and thereby |
• | Enable the Bank to meet its public policy mission while balancing the evolving needs of customers and shareholders. |
For 2019, the Bank's CEO and other Executives were compensated through a mix of base salary, incentive compensation awards, benefits, and perquisites. Base salary was the core component of the total compensation package. The Bank's executive compensation for the CEO and other Executives was benchmarked against three peer groups: (1) commercial banks (using a “Divisional Head” benchmark); (2) other FHLBanks (using an “Overall Functional Heads” benchmark); and (3) named executive officer benchmarks from publicly traded banks/financial institutions with $10 billion to $20 billion in assets (using “Salary Rank” and “Job Specific” matches).
The peer group data was collected and analyzed by the Bank’s compensation consultant, McLagan, an Aon Hewitt company. For certain positions, when considering data from the larger peer group companies, and with input from McLagan, applicable job specific benchmarks for the Bank’s CEO and other Executives were identified, as they were determined to be market comparable and represented realistic employment opportunities. Typically, the identified positions at the larger peer group institutions were at a lower level than the comparative Bank executive officer title (e.g., comparison of the CEO position to a COO or similar position(s) at such larger peer group companies). The Bank targets the median total compensation for the benchmarked positions. See the table below setting forth the peer companies used in benchmarking both base salary and incentive compensation. As the Bank is a cooperative, it does not offer equity-based compensation as is typically offered in publicly traded financial services institutions; however, the Bank’s incentive compensation and enhanced retirement benefits taken together for the CEO and other Executives provide a competitive compensation package.
For 2019, the Bank executive officer incentive compensation plan (in which the CEO and other Executives participated) continued to be aligned with market practices and provided for deferral of 50% of the incentive award, with payment of such deferred amount contingent on the Bank meeting ongoing performance criteria over the long-term performance period.
As part of an overall review of the Bank's compensation programs, the Bank evaluated the various aspects of these programs, taking into consideration associated risk as it pertains to the expectations and goals of each element of compensation. The Bank does not offer commission or similar bonus compensation programs. The Bank does, however, offer incentive compensation plans with performance goals that are consistent with the risk appetite of the Bank. Additionally, to encourage long term performance, the Bank's incentive compensation plans for its CEO and other Executives require deferred payment of a portion of earned incentive compensation and condition the payment of these deferred amounts upon future Bank performance. Details regarding the 2019 incentive compensation goals are discussed below.
151
As discussed above, for 2019, the Bank engaged McLagan to perform a base salary and incentive compensation benchmarking review for the CEO and other Executives which, along with consideration of the CEO’s and other Executives’ performance, is used to establish their annual base salaries. The following is a list of peers used in the benchmarking.
AIB | DBS Bank | Nordea Bank |
Ally Financial Inc. | DZ Bank | Norinchukin Bank, New York Branch |
Arvest | East West Bancorp | Northern Trust Corporation |
Associated Bank | Eastern Bank | PacWest Bancorp |
Australia & New Zealand Banking Group | Fannie Mae | People's United Bank, National Assoc. |
Banco Bilbao Vizcaya Argentaria | Federal Home Loan Banks (1) | PNC Bank |
Banco Itau Unibanco | Federal Reserve Banks (2) | Popular Community Bank |
Bank Hapoalim | Fifth Third Bank | Rabobank |
Bank of America Merrill Lynch | First Citizens Bank | Regions Financial Corporation |
Bank of Hawaii | First Interstate BancSystem Inc | Royal Bank of Canada |
Bank of New York Mellon | First Midwest Bank | Royal Bank of Scotland Group |
Bank of Nova Scotia | First Republic Bank | Santander Bank, NA |
Bank of the West | First Tennessee Bank/First Horizon | SchoolsFirst Federal Credit Union |
Bayerische Landesbank | FirstBank Holding Company | Signature Bank - NY |
BBVA Compass | Flagstar Bank | Simmons First National Corporation |
Berkshire Bank | FNB Omaha | Societe Generale |
BMO Financial Group | Freddie Mac | South State Bank |
BNP Paribas | GE Capital | Standard Chartered Bank |
Boeing Employees Credit Union | Golden 1 Credit Union | State Street Corporation |
BOK Financial Corporation | Great Western Bank | Sterling National Bank |
Branch Banking & Trust Co. | Hancock Bank | Sumitomo Mitsui Banking Corporation |
Bremer Financial Corporation | HSBC | Sumitomo Mitsui Trust Bank |
Brown Bothers Harriman | Huntington Bancshares, Inc. | SunTrust Banks |
Capital One | ICBC Financial Services | SVB Financial Group |
Cathay General Bancorp | ING | Synchrony Financial |
Charles Schwab & Co. | Intesa Sanpaolo | Synovus |
Chemical Financial Corporation | Investors Bancorp, Inc | TD Ameritrade |
China Construction Bank | JP Morgan Chase | TD Securities |
CIBC World Markets | KBC Bank | Texas Capital Bank |
CIT Group | KeyCorp | The PrivateBank |
Citigroup | Landesbank Baden-Wuerttemberg | Trustmark Corporation |
Citizens Financial Group | Lloyds Banking Group | U.S. Bancorp |
City National Bank | M&T Bank Corporation | UMB Financial Corporation |
City National Bank of Florida | Macquarie Bank | Umpqua Holding Corporation |
Comerica | MB Financial Inc. | UniCredit Bank AG |
Commerce Bank | MidFirst Bank | United Bank - VA |
Commerzbank | MUFG Bank, Ltd. | United Community Banks, Inc |
Commonwealth Bank of Australia | MUFG Securities | Valley National Bank |
Community Bank System Inc. | National Australia Bank | Webster Bank |
Crédit Agricole CIB | Natixis | Wells Fargo Bank |
Credit Industriel et Commercial - N.Y. | New York Community Bank | Westpac Banking Corporation |
Cullen Frost Bankers, Inc. | Nord/LB | Zions Bancorporation |
Notes:
(1) The Federal Home Loan Bank group includes all of the other Federal Home Loan Banks.
(2) Includes Federal Reserve Banks in Atlanta, Boston, Cleveland, Kansas City, Minneapolis, New York, Richmond, San Francisco and St. Louis.
152
Human Resources and Diversity & Inclusion Committee's Role and Responsibilities
The Human Resources and Diversity & Inclusion Committee of the Board (formerly known as the Human Resources and Office of Minority and Women Inclusion Committee) is responsible for the establishment and oversight of the CEO's compensation and oversight of other Executives' compensation. This includes setting the objectives of and reviewing performance under the Bank's compensation, benefits, and perquisites programs for the CEO and other Executives.
Additionally, the Human Resources and Diversity & Inclusion Committee has adopted the practice of periodically retaining compensation and benefit consultants and other advisors, as well as reviewing analysis from the Bank's Human Resources Department (HR Department), to assist in performing its duties regarding the CEO's and other Executives' compensation.
Role of the Federal Housing Finance Agency
The FHLBank’s regulator, the Finance Agency, has been granted certain authority over executive compensation. Specifically under the Housing Act: (1) the Director of the Finance Agency is authorized to prohibit executive compensation that is not reasonable and comparable with compensation in similar businesses; (2) if a FHLBank is undercapitalized, the Director of the Finance Agency may also restrict executive compensation; and (3) if a FHLBank is determined to be in a troubled condition, the Finance Agency may reduce or prohibit certain golden parachute payments in the event that an FHLBank is subject to a triggering event (for example, insolvency, subject to appointment of a conservator or receiver). Under the Finance Agency Executive Compensation Regulation, additional advance notice and approval requirements are imposed in regard to an FHLBank entering into or adopting: (1) employment agreements; (2) severance policy/agreements; (3) incentive compensation award payouts; (4) material modifications to nonqualified plans; and (5) any ad hoc termination payments. The Finance Agency has implemented this authority by requiring the FHLBanks to submit to the Agency for non-objection salary, incentive compensation and benefits changes which affect an FHLBank’s NEOs.
The Finance Agency has established the following standards against which it will evaluate the compensation of each FHLBank executive: (1) each individual executive's compensation should be reasonable and comparable to that offered to executives in similar positions at comparable financial institutions; (2) such compensation should be consistent with sound risk management and preservation of the par value of FHLBank stock; (3) a significant percentage of incentive-based compensation should be tied to longer-term performance indicators; and (4) the Board should promote accountability and transparency with respect to the process of setting compensation.
Determining the CEO's Cash Compensation
For 2019, the Human Resources and Diversity & Inclusion Committee used the analysis from McLagan for benchmarking the CEO's cash compensation. In determining Mr. Watson's cash compensation (including both base salary and incentive compensation), it was compared to the median for all of the peer groups as listed in the tables above. After consideration of this analysis, the Board established Mr. Watson’s 2019 base salary at $881,007.
Determining Other Executives' Cash Compensation
In 2019, other Executives' base salaries and incentive compensation levels were determined by the CEO and validated using the results of the McLagan study and were reviewed and approved by the Human Resources and Diversity & Inclusion Committee. The annual review of the McLagan study and corresponding Board review of these findings validated the appropriateness of compensation levels for the CEO and other Executives. Effective January 1, 2019, base salary increases were provided to the other Executives and are reflected in the Summary Compensation Table presented in this Item 11. Executive Compensation.
Executive Officer Incentive Plans
2019 Executive Officer Incentive Compensation Plan (2019 Plan). The 2019 Plan is designed to retain and motivate the CEO and other Executives and reward (1) achievement of key annual goals and (2) maintenance of satisfactory financial condition and member value over the longer term. The 2019 Plan established the following award opportunity levels (expressed as a percentage of base salary):
153
Participant Level | Threshold | Target | Maximum |
CEO | 60% | 75% | 100% |
COO | 55% | 70% | 85% |
CFO | 50% | 65% | 80% |
Other NEOs | 40% | 55% | 70% |
The Board has evaluated the performance of the CEO and other Executives against the incentive goals for 2019 set forth in the Non-Equity Incentive Plan Compensation section following the Summary Compensation Table below and determined the total incentive award (if any) based on that performance. The total incentive award was divided into two parts: (1) a current incentive award; and (2) a deferred incentive award, payable in installments. The following table illustrates how the 2019 current awards and deferred incentive award installments would be paid under the 2019 Plan:
Payment | Description | Payment Year* |
Current Incentive Award | 50% of total award | 2020 |
Deferred Incentive Award installment | Up to 33 1/3% of deferred incentive award | 2021 |
Deferred Incentive Award installment | Up to 33 1/3% of deferred incentive award | 2022 |
Deferred Incentive Award installment | Up to 33 1/3% of deferred incentive award | 2023 |
* Payment will be made no later than March 15 in the year indicated.
Payment of each deferred incentive award installment under the 2019 Plan is contingent on the Bank continuing to meet certain Bank performance criteria and the participant meeting his or her requirements described below. The amount of the deferred incentive award payout opportunity is set forth in the Grants of Plan-Based Awards table. See “Stated Bank Performance Criteria, 2019” under Grants of Plan-Based Awards table for details regarding the Bank performance criteria.
Participant Requirements of Continued Employment and Satisfactory Performance. Participants who terminate employment with the Bank for any reason other than death, disability, involuntary termination without cause or retirement (as defined in the 2019 Plan) prior to the current incentive award payout date will not be eligible for an award. Participants who terminate employment due to retirement or involuntary termination (other than for cause) after the current incentive award payout date but before completion of the payment of all corresponding deferred incentive award installments shall receive such deferred incentive award installment payments at the same time as such payments are made to plan participants who are current Bank employees. Participants who otherwise resign employment before the completion of the payment of all corresponding deferred incentive award installments shall not receive payment of such installments. In the event of a participant’s employment termination due to death or disability, the participant shall receive payout of deferred award installments. Any participant who is terminated by the Bank for cause (as defined in the 2019 Plan) prior to receiving payment of all corresponding deferred incentive award installments shall not receive payment of any remaining unpaid deferred incentive award installments. Finally, the plan provides for vesting of deferred award installments in the event of a Change in Control. See Exhibit 10.15 to the 2018 Form 10-K for the full terms of the 2019 Plan.
2020 Executive Officer Incentive Compensation Plan (2020 Plan). The 2020 Plan is materially the same as the 2019 Plan noted above with the same performance requirements and award eligibility levels. Following December 31, 2020, the Board will evaluate performance against the incentive goals set forth under the Grants of Plan-Based Awards table applicable to awards granted for 2020 and determine the total incentive award (if any) based on that performance. The total incentive award will be divided into two parts: (1) a current incentive award; and (2) a deferred incentive award, payable in installments. The following table illustrates how the 2020 current awards and deferred incentive award installments would be paid under the 2020 Plan:
Payment | Description | Payment Year* |
Current Incentive Award | 50% of total award | 2021 |
Deferred Incentive Award installment | Up to 33 1/3% of deferred incentive award | 2022 |
Deferred Incentive Award installment | Up to 33 1/3% of deferred incentive award | 2023 |
Deferred Incentive Award installment | Up to 33 1/3% of deferred incentive award | 2024 |
* Payment will be made no later than March 15 in the year indicated.
Payment of each deferred incentive award installment under the 2020 Plan is contingent on the Bank continuing to meet certain Bank performance criteria and the participant meeting his or her requirements described below. The amount of the
154
deferred incentive award payout opportunity is set forth in the Grants of Plan-Based Awards table. See “Stated Bank Performance Criteria, 2020” under Grants of Plan-Based Awards table for details regarding the Bank performance criteria.
Participant Requirements of Continued Employment and Satisfactory Performance. These terms in the 2020 Plan are the same as set forth in the 2019 Plan described above. See Exhibit 10.15 to this Form 10-K for the full terms of the 2020 Plan.
Additional Incentives for Other Executives
From time to time, the CEO has recommended for the other Executives, and the Board has approved, additional incentive awards in connection with specific projects or other objectives of a unique, challenging, and time-sensitive nature. No such additional incentive awards were granted for any of the other Executives in 2019.
Perquisites and Other Benefits
The Board views the perquisites afforded to the CEO and other Executives as an element of the total compensation program, provided primarily as a benefit associated with their overall position duties and responsibilities. Examples of perquisites for the CEO and/or other Executives may include the following:
• | Personal use of a Bank-owned/leased automobile; |
• | Financial and tax planning; |
• | Payment of relocation expenses; and |
• | Business club membership. |
The Bank may also provide a tax gross-up for some of the perquisites offered, including relocation benefits. Additionally, for the CEO and other Executives, the Bank provides parking. Perquisites for the CEO and other Executives are detailed on the Summary Compensation Table and accompanying narrative, where an individual’s aggregate perquisites are $10,000 or more.
Employee Benefits
The Board and Bank management are committed to providing competitive, high-quality benefits designed to promote health, well-being, and income protection for all employees. The Bank offers all employees a core level of benefits and the opportunity to choose from a variety of optional benefits. Core and optional benefits offered include, but are not limited to, medical, dental, prescription drug, vision, long-term disability, short-term disability, flexible spending accounts, worker's compensation insurance, and life and accident insurance. The CEO and other Executives participate in these benefits on the same basis as all other full-time employees. In addition, the CEO and other Executives are eligible for individual disability income insurance if the individual’s salary exceeds the monthly long term disability limit.
Qualified and Nonqualified Defined Benefit Plans
The Bank participates in the Pentegra Defined Benefit Plan for Financial Institutions (Pentegra Defined Benefit Plan), a tax-qualified, multi-employer defined-benefit retirement plan. The Pentegra Defined Benefit Plan is a funded, noncontributory plan that covers all eligible employees.
• | For all employees hired prior to January 1, 2008, benefits under the plan are based upon a 2% accrual rate, the employees' years of benefit service and the average annual salary for the three consecutive years of highest salary during benefit service. The regular form of retirement benefits provides a single life annuity, with a guaranteed minimum 12-year payment. A lump-sum payment and other additional payment options are also available. Employees are not vested until they have completed five years of employment. The benefits are not subject to offset for Social Security or any other retirement benefits received. |
• | For all employees hired between January 1, 2008 and December 31, 2018, benefits under the plan are based upon a 1.5% accrual rate, the employees' years of benefit service and the average annual salary for the five consecutive years of highest salary during benefit service. The regular form of retirement benefit payment is guaranteed for the life of the retiree but not less than 120 monthly installments. If a retiree dies before 120 monthly installments have been paid, the beneficiary would be entitled to the commuted value of such unpaid installments paid in a lump sum. Employees are not vested until they have completed five years of employment. The benefits are not subject to offset for Social Security or any other retirement benefits received. |
155
• | Employees hired on or after January 1, 2019 are not eligible to participate in the Pentegra Defined Benefit Plan and will not accrue benefits. For all employees hired prior to January 1, 2019, benefits will continue to accrue. If an employee was terminated prior to January 1, 2019 and then is subsequently re-hired on or after January 1, 2019, he/she is not eligible to re-join the Pentegra Defined Benefit Plan unless the break in service is less than 12 consecutive months. The CEO and other Executives were hired prior to January 1, 2019 and are not impacted by this change in benefits. |
The CEO and other Executives, which were hired prior to January 1, 2019, also participate in a Supplemental Executive Retirement Plan (SERP). The SERP provides the CEO and other Executives with a retirement benefit that the Bank is unable to offer under the Pentegra Defined Benefit Plan due to Internal Revenue Code (IRC) and Pentegra Defined Benefit Plan limitations, including the IRC limitations on qualified pension plan benefits for employees earning cash compensation of at least $280 thousand for 2019.
As a nonqualified plan, the SERP benefits do not receive the same tax treatment and funding protection as the Pentegra Defined Benefit Plan, and the Bank's obligations under the SERP are a general obligation of the Bank. The terms of the SERP provide for distributions from the SERP upon termination of employment with the Bank or in the event of the death or disability of the employee. Payment options under the SERP include annuity options as well as a lump-sum distribution option.
Qualified and Nonqualified Defined Contribution Plans
Eligible employees have the option to participate in the Pentegra Defined Contribution Plan for Financial Institutions (Thrift Plan), a qualified defined contribution plan under the IRC. Subject to IRC and Thrift Plan limitations, employees can contribute up to 50% of their base salary in the Thrift Plan. The Bank matches 100% of employee contributions up to 6% of total eligible earnings. This match contribution is immediately vested.
For all employees hired on or after January 1, 2019, the Bank will also contribute under the Thrift Plan an amount equal to 4% of total eligible earnings annually if the following eligibility requirements are met: (1) employed on December 31; (2) completed 1,000 hours of service during the plan year. This contribution is vested after 3 years of service. The CEO and other Executives were hired prior to January 1, 2019 and are not impacted by this change in benefits.
In addition to the Thrift Plan, the CEO and other Executives are also eligible to participate in the Supplemental Thrift Plan, an unfunded nonqualified defined contribution plan that, in many respects, mirrors the Thrift Plan. The Supplemental Thrift Plan ensures, among other things, that the CEO and other Executives whose benefits under the Thrift Plan would otherwise be restricted by certain provisions of the IRC or limitations in the Thrift Plan are able to make elective pretax deferrals and receive the Bank matching contributions on those deferrals. In addition, the Supplemental Thrift Plan permits deferrals of Bank matching contributions on the current portion of the incentive compensation awards, subject to the limits on deferrals of compensation under the Supplemental Thrift Plan. Effective January 1, 2015, upon amendment of the Supplemental Thrift Plan, participants are permitted to elect to defer a portion of their deferred incentive awards to this Plan as well. Any such awards which are deferred to the Supplemental Thrift Plan are subject to a separate payment election.
The CEO and other Executives may defer up to 80% of their eligible cash compensation, less their contributions to the qualified Thrift Plan. For each deferral period in the Supplemental Thrift Plan, the Bank credits a matching contribution equal to:
• | 200% on employee’s 3% contribution, up to 6% of total eligible earnings; less |
• | The Bank's matching contribution to the qualified Thrift Plan. |
The terms of the Supplemental Thrift Plan generally provide for distributions upon termination of employment with the Bank, in the event of the death of the employee or upon disability, at the discretion of the Human Resources and Diversity & Inclusion Committee, and in accordance with applicable IRC and other applicable requirements. Payment options under the Supplemental Thrift Plan include a lump-sum payment and annual installments for up to 10 years. No loans are permitted from the Supplemental Thrift Plan.
The current incentive award portion of any incentive compensation award for the CEO and other Executives is eligible for a Bank matching contribution under the Supplemental Thrift Plan; any incentive award installments further deferred to the Supplemental Thrift Plan are not eligible for a Bank matching contribution. Effective June 21, 2019 for plan year 2019 and subsequent plan years if a Supplemental Thrift Plan participant has contributed the maximum amount of employee contributions under the qualified Thrift Plan but was credited with matching Bank contributions to the Thrift Plan at a limited level due to IRC or Thrift Plan limitations, the participant shall be credited with an additional Bank contribution to the Supplemental Thrift Plan calculated after taking into account the Bank matching contributions actually credited to the Thrift
156
Plan for the plan year. A description of the Supplemental Thrift Plan is also contained in the Supplemental Thrift Plan filed as Exhibit 10.1 to the Bank’s Second Quarter 2019 Form 10-Q.
Rabbi Trust Arrangements
The Bank has established Rabbi trusts to partially help secure benefits under both the SERP and Supplemental Thrift Plan. See the Pension Benefits Table and Nonqualified Deferred Compensation Table and narratives below for more information.
Additional Retirement Benefits
The Bank offers post-retirement medical benefit dollars in the form of a Health Reimbursement Account (HRA) for eligible retirees and their spouses age 65 and older. HRA dollars can be used to purchase individual healthcare coverage and other eligible out-of-pocket healthcare expenses.
Severance Policy (excluding Change-in-Control)
The Bank provides severance benefits to the CEO and other Executives. These benefits reflect the potential difficulty employees may encounter in their search for comparable employment within a short period of time. The Board determined that such severance arrangements are a common practice in the marketplace.
The Bank's severance policy is designed to help bridge this gap in employment. The policy provides the following for other Executives:
• | Four weeks' base salary continuation per year of service, with a minimum of 26 weeks and a maximum of 52 weeks; |
• | Taxable compensation in the amount equivalent to the amount the Bank pays for medical coverage for its active employees for the length of the salary continuation; and |
• | Individualized outplacement service for a maximum of 12 months. |
The Board provided a separate severance agreement as part of the employment offer for the CEO. It is the same as above except that it provides for severance in the amount of 12 months of salary which is more fully described in the Post-Termination Compensation Table below.
Change-in-Control (CIC) Agreements
The Bank has entered into CIC agreements with the CEO and other Executives. The Board believes that CIC agreements are an important recruitment and retention tool and that such agreements enable the CEO and other Executives to effectively perform and meet their obligations to the Bank if faced with the possibility of consolidation with another FHLBank. These agreements are a common practice in the marketplace.
In the event of a merger of the Bank with another FHLBank, where the merger results in the termination of employment (including resignation for “good reason” as defined under the CIC agreement) for the CEO or any other Executives, each such individual(s) is (are) eligible for severance payments under his/her CIC agreement. Such severance is in lieu of severance under the severance policy discussed above. The severance policy (and in the case of the CEO, his separate severance agreement) continues to apply to employment terminations of the other Executives, other than those resulting from a Bank merger.
Benefits under the CIC agreement for the CEO and other Executives are as follows:
• | 2.99 times base salary (CEO); two times base salary (other Executives); |
• | For the CEO, a payment of 2.99 times target incentive award opportunity in the year of termination, a pro-rated incentive payment in the year of termination and a payment equal to the additional benefit that the CEO would have received under the Bank’s qualified and nonqualified retirement plans calculated as if the CEO had three additional years of both age and service at the time of separation from the Bank; |
• | For the other Executives, a payment of two times target incentive award opportunity in the year of termination, a pro-rated incentive payment in the year of termination and a payment equal to the additional benefit that the other Executives would have received under the Bank’s qualified and nonqualified retirement plans calculated as if the other Executives had two additional years of both age and service at the time of separation from the Bank; |
• | An amount equal to three (CEO) or two (other Executives) times six percent of the Executive’s annual compensation (as defined in the Supplemental Thrift Plan) at the time of separation from the Bank; |
157
• | Taxable compensation equivalent to the Bank’s monthly contribution to its active employees’ medical plan coverage for the benefits continuation period of 18 months; and |
• | Individualized outplacement service for a maximum of 12 months and financial planning. |
See Exhibit 10.9.1 to the Bank’s second quarter 2016 Form 10-Q for details regarding the change-in-control agreements.
Compensation Committee Interlocks and Insider Participation
During 2019, the following directors served on the Bank’s Human Resources and Diversity & Inclusion Committee: Mr. Brendan J. McGill, Chair, Rev. Luis A. Cortés Jr., Vice Chair, Mr. Madhukar (Duke) Dayal, Mr. Charles J. Nugent and Ms. Jeane M. Vidoni. No member of the Bank’s Human Resources and Diversity & Inclusion Committee has at any time been an officer or employee of the Bank. None of the Bank’s executive officers have served, or are serving, on the Board of Directors or the compensation committee of any entity whose executive officers served on the Bank’s Human Resources and Diversity & Inclusion Committee or Board of Directors. With respect to related party transactions, if any, and the independence of the Directors serving on the Human Resources and Diversity & Inclusion Committee during 2019, see Item 13. Certain Relationships and Related Transactions and Director Independence of this Form 10-K.
Compensation Committee Report
The Human Resources and Diversity & Inclusion Committee has reviewed and discussed the CD&A with management. Based on that review and discussion, the Human Resources and Diversity & Inclusion Committee has recommended to the Board that the CD&A be included in the Bank’s 2019 Form 10-K.
The Human Resources and Diversity & Inclusion Committee of the Board of Directors:
Mr. Brendan J. McGill Chair
Ms. Jeane M. Vidoni Vice Chair
Mr. Patrick A. Bond
Rev. Luis A. Cortés, Jr.
Mr. Charles J. Nugent
158
Summary Compensation Table (SCT)
Name and Principal Position | Year | Salary | Bonus | Non-Equity Incentive Plan Compensation | Change in Pension Value and Nonqualified Deferred Compensation Earnings(6) | All Other Compensation | Total | |||||
Winthrop Watson (1) President and CEO | 2019 | $ | 881,007 | $— | $ | 881,007 | $ | 603,000 | $ | 80,254 | $ | 2,445,268 |
2018 | 839,055 | — | 839,055 | 246,000 | 78,233 | 2,002,343 | ||||||
2017 | 806,783 | — | 815,271 | 480,000 | 72,808 | 2,174,862 | ||||||
Kristina K. Williams (2) Chief Operating Officer | 2019 | $ | 566,830 | $— | $ | 490,494 | $ | 899,000 | $ | 53,260 | $ | 2,009,584 |
2018 | 545,029 | — | 472,337 | 97,000 | 37,418 | 1,151,784 | ||||||
2017 | 509,373 | — | 422,452 | 502,000 | 46,697 | 1,480,522 | ||||||
David G. Paulson (3) Chief Financial Officer | 2019 | $ | 449,944 | $— | $ | 364,811 | $ | 329,000 | $ | 40,358 | $ | 1,184,113 |
2018 | 432,639 | — | 348,628 | 72,000 | 38,164 | 891,431 | ||||||
2017 | 404,335 | — | 302,956 | 195,000 | 34,639 | 936,930 | ||||||
Michael A. Rizzo (4) Chief Risk Officer | 2019 | $ | 403,649 | $— | $ | 290,367 | $ | 277,000 | $ | 26,123 | $ | 997,139 |
2018 | 395,734 | — | 283,989 | 58,000 | 23,766 | 761,489 | ||||||
2017 | 380,513 | — | 255,581 | 177,000 | 30,077 | 843,171 | ||||||
Dana A. Yealy (5) General Counsel | 2019 | $ | 386,729 | $— | $ | 276,110 | $ | 1,075,000 | $ | 30,883 | $ | 1,768,722 |
2018 | 371,855 | — | 268,133 | 208,000 | 29,735 | 877,723 | ||||||
2017 | 357,553 | — | 241,627 | 691,000 | 28,337 | 1,318,517 | ||||||
Notes:
(1) | For 2019, Mr. Watson’s non-equity incentive plan compensation was the incentive plan described above and was based on the 2019 performance against goals as set forth below as well as deferred incentive earned in 2019 under the 2016, 2017, and 2018 Executive Officer Incentive Compensation Plans. The actual incentive calculation for 2019 performance resulted in a 100.7% of base salary; per the 2019 Plan, the payment must not exceed 100% of base salary rate so the actual payout was capped at 100% of the 2019 base salary rate. All other compensation included employer contributions to defined contribution plans of $75,196 and the remainder is insurance premium contributions. For 2018, Mr. Watson’s non-equity incentive plan compensation was the incentive plan described in the Bank’s 2018 Form 10-K as well as deferred incentive earned in the 2015, 2016, and 2017 Executive Officer Incentive Compensation Plans. All other compensation included employer contributions to defined contribution plans of $74,144 and the remainder is insurance premium contributions. For 2017, Mr. Watson’s non-equity incentive plan compensation was the incentive plan described in the Bank’s 2017 Form 10-K as well as deferred incentive earned in the 2014, 2015, and 2016 Executive Officer Incentive Compensation Plans. All other compensation included employer contributions to defined contribution plans of $70,080 and the remainder is insurance premium contributions. |
(2) | For 2019, Ms. Williams’ non-equity incentive plan compensation was the incentive plan described above and was based on the 2019 performance against goals as set forth below as well as deferred incentive earned in 2019 under the 2016, 2017, and 2018 Executive Officer Incentive Compensation Plans. All other compensation included employer contributions to defined contribution plans of $47,679 and the remainder is insurance premium contributions. For 2018, Ms. William’s non-equity incentive plan compensation was the incentive plan described in the Bank’s 2018 Form 10-K as well as deferred incentive earned in the 2015, 2016, and 2017 Executive Officer Incentive Compensation Plans. All other compensation included employer contributions to defined contribution plans of $32,669 and the remainder is insurance premium contributions. For 2017, Ms. William’s non-equity incentive plan compensation was the incentive plan described in the Bank’s 2017 Form 10-K as well as deferred incentive earned in the 2014, 2015, and 2016 Executive Officer Incentive Compensation Plans. All other compensation included employer contributions to defined contribution plans of $42,446 and the remainder is insurance premium contributions. Note that Ms. Williams resigned her employment with the Bank, effective January 3, 2020. Ms. Williams is eligible for certain compensation and benefits as a Bank retiree. |
(3) | For 2019, Mr. Paulson’s non-equity incentive plan compensation was the incentive plan described above and was based on the 2019 performance against goals as set forth below as well as deferred incentive earned in 2019 under the 2016, 2017, and 2018 Executive Officer Incentive Compensation Plans. All other compensation included employer contributions to defined contribution plans of $37,201 and the remainder is insurance premium contributions. For 2018, Mr. Paulson’s non-equity incentive plan compensation was the incentive plan described in the Bank’s 2018 Form 10-K as well as deferred incentive earned in the 2015, 2016, and 2017 Executive Officer Incentive Compensation Plans. All other compensation included employer contributions to defined contribution plans of $35,541 and the remainder is insurance premium contributions. For 2017, Mr. Paulson’s non-equity incentive plan compensation was the incentive plan described in the Bank’s 2017 Form 10-K as well as deferred incentive earned in the 2014, 2015, and 2016 Executive Officer Incentive Compensation Plans. All other compensation included employer contributions to defined contribution plans of $33,026 |
159
and the remainder is insurance premium contributions. Effective January 23, 2020, Mr. Paulson became the Chief Operating Officer of the Bank. He no longer holds the title of Chief Financial Officer but continues to function as the Bank’s principal financial officer.
(4) | For 2019, Mr. Rizzo’s non-equity incentive plan compensation was the incentive plan described above and was based on the 2019 performance against goals as set forth below as well as deferred incentive earned in 2019 under the 2016, 2017, and 2018 Executive Officer Incentive Compensation Plans. All other compensation included employer contributions to defined contribution plans of $24,220 and the remainder is insurance premium contributions. For 2018, Mr. Rizzo’s non-equity incentive plan compensation was the incentive plan described in the Bank’s 2018 Form 10-K as well as deferred incentive earned in the 2015, 2016, and 2017 Executive Officer Incentive Compensation Plans. All other compensation included employer contributions to defined contribution plans of $23,744 and the remainder is insurance premium contributions. For 2017, Mr. Rizzo’s non-equity incentive plan compensation was the incentive plan described in the Bank’s 2017 Form 10-K as well as deferred incentive earned in the 2014, 2015, and 2016 Executive Officer Incentive Compensation Plans. All other compensation included employer contributions to defined contribution plans of $30,054 and the remainder is insurance premium contributions. |
(5) | For 2019, Mr. Yealy's non-equity incentive plan compensation was the incentive plan described above and was based on the 2019 performance against goals as set forth below as well as deferred incentive earned in 2019 under the 2016, 2017, and 2018 Executive Officer Incentive Compensation Plans. All other compensation included employer contributions to defined contribution plans of $30,863 and the remainder is insurance premium contributions. For 2018, Mr. Yealy's non-equity incentive plan compensation was the incentive plan described in the Bank’s 2018 Form 10-K as well as deferred incentive earned in the 2015, 2016, and 2017 Executive Officer Incentive Compensation Plans. All other compensation included employer contributions to defined contribution plans of $29,713 and the remainder is insurance premium contributions. For 2017, Mr. Yealy's non-equity incentive plan compensation was the incentive plan described in the Bank’s 2017 Form 10-K as well as deferred incentive earned in the 2014, 2015, and 2016 Executive Officer Incentive Compensation Plans. All other compensation included employer contributions to defined contribution plans of $28,314 and the remainder is insurance premium contributions. |
(6) | The change in pension value is the sum of the change in the Pentegra Defined Benefit Plan and the change in the SERP as described below. No amount of above market earnings on nonqualified deferred compensation is reported because above market rates are not possible under the Supplemental Thrift Plan, the only such plan that the Bank offers. |
CEO Pay Ratio
Consistent with SEC rules, the Bank is providing the following information regarding the relationship of the annual compensation of the Bank’s employees and the annual total compensation of the Bank’s CEO. For the year ended December 31, 2019, the annual total compensation of the CEO, as reported in the SCT above was $2,445,268, and the median of the annual total compensation of all of the Bank’s employees (not including the CEO), calculated as described below, was $183,751. Based on this information, the ratio of the annual total compensation of the CEO to the median of the annual total compensation of all employees (not including the CEO), was 13 to 1.
To identify the median of the annual total compensation of all of the Bank’s employees, as well as to determine the annual total compensation of the Bank’s median employee, the Bank took the following steps. First, the Bank determined that, as of December 1, 2019, the Bank’s employee population consisted of 229 individuals (not including the CEO), all located in the United States. This population consisted of full-time, part-time and temporary employees. The Bank selected December 1, 2019 for purposes of identifying its median employee as such date provided the Bank with adequate time to gather data regarding its employees.
Second, the Bank identified the median employee by comparing the amount of salary or wages, as applicable (including overtime), and cash incentive awards as reflected in the Bank’s payroll records for the entire fiscal year ending December 31, 2019 for each of the employees (not including the CEO) who were employed by the Bank on December 1, 2019, and ranking such compensation for all such employees from lowest to highest. In making this determination, the Bank annualized the salary or wages, as applicable (excluding overtime which was a nominal amount and not readily estimable due to fluctuations), of 18 full-time employees who were hired in 2019 but did not work for the Bank for the entire year. The cash incentive awards forming a part of the calculation to identify the median employee were paid to employees in 2019 for the 2018 performance year in accordance with the Bank’s employee and executive incentive plans. The Bank determined this approach to be an appropriate measure for purposes of identifying its median employee. As a result of a change in the Bank’s employee population during 2019, the Bank performed the above calculation to identify the median employee for the year ending December 31, 2019, rather than use the same median employee identified in the Bank’s 2018 Form 10-K for the year ending December 31, 2018.
For any employee not employed by the Bank on the date that cash incentive awards were paid during 2019 for the 2018 performance year, the Bank estimated the cash incentive award such employee would have received had the employee been employed on such date. The estimated incentive was determined using the newly hired employees’ base salary and their
160
incentive compensation opportunity level based on (1) the Bank’s performance as it relates to the 2018 Bankwide goals (refer to these goals in Exhibit 10.14 in the Bank’s 2018 Form 10-K) and (2) the incentive compensation payouts in 2019 for similar positions in their respective departments.
The above described compensation measure used to identify the median employee was applied consistently to all employees included in the calculation. The Bank determined this compensation measure reasonably reflects the annual compensation of all Bank employees as required by SEC rules.
Finally, after determining the median employee as set forth above, the annual total compensation for the median employee of $183,751 was then calculated in the same manner as shown for the CEO in the SCT. The annual total compensation amount of the median employee includes among other things, amounts attributable to the change in pension value, which varies among employees based upon their tenure at the Bank. All other compensation includes employer contributions to defined contribution plans and insurance premium contributions.
The above is a reasonable estimate, prepared under applicable SEC rules, of the ratio of the annual total compensation of the CEO to the median of the annual total compensation of all of the Bank’s employees.
Non-Equity Incentive Plan Compensation
Under the 2019 Plan, the actual annual award opportunity for January 1, 2019, through December 31, 2019, and payouts are based on a percentage of the executive's base salary as of December 31, 2019. Each goal includes performance measures at threshold, target and maximum. The specific performance goals and total weighting for each goal for the CEO and other Executives are as follows.
A. | Increase member use of core products by year-end 2019. Core products include: Advances, MPF, letters of credit, safekeeping and five community investment products (Affordable Housing Program, Community Lending Program, Banking On Business, First Front Door, and Home4Good) (30% weighting); |
B. | Profitability as measured by adjusted earnings relative to GAAP capital in excess of average three month LIBOR within identified risk parameters (30% weighting); |
C. | Key risk indicator (KRI) performance (10% weighting); |
D. | Peer operating expense scorecard - basket of four metrics (10% weighting); |
E. | Diversity and inclusion strategic plan (10% weighting); and |
F. | Data management plan (10% weighting). |
Adjusted earnings referenced above are quantified in the table below.
(in thousands) | |
2019 GAAP net income | $316,925 |
Adjustments: | |
Advance prepayment fees | $(10,171) |
Mortgage delivery commitments | 1,106 |
Earnings at risk (EaR) and unrealized gain/loss on securities | 20,401 |
Derivative ineffectiveness | 1,077 |
Subtotal - adjustments | $12,413 |
AHP | (1,241) |
Adjusted earnings (non-GAAP) | $328,097 |
161
The table below includes the performance goal, weighting, achievement levels, and payout percentages for the NEOs per the terms of the 2019 Plan.
To Achieve: | Payout % (2) | ||||||||
Goal (1) | Weighting | Threshold Payout | Target Payout | Maximum Payout | 2019 Results | CEO | COO | CFO | Other NEOs |
A | 30% | 720 | 750 | 800 | 794 | 29.10% | 24.96% | 23.46% | 20.46% |
B | 30% | 347 | 417 | 487 | 449 bps | 25.93% | 23.06% | 21.56% | 18.56% |
C | 10% | 8 of 12 | 10 of 12 | 12 of 12 | 1 month interpolated x 50%; 2 months interpolated; 9 months @ Maximum | 9.32% | 7.99% | 7.51% | 6.55% |
D | 10% | Rank 9 | Rank 6 | Rank 3 | Rank 8 | 6.50% | 6.00% | 5.50% | 4.50% |
E | 10% | 1 of 3 | 2 of 3 | 3 of 3 | 3 | 10.00% | 8.50% | 8.00% | 7.00% |
F | 10% | 1 of 3 | 2 of 3 | 3 of 3 | 3 | 10.00% | 8.50% | 8.00% | 7.00% |
Total Payout | 90.85% | 79.01% | 74.03% | 64.07% | |||||
Notes:
(1) Refer to the incentive goal scorecard attached to the 2019 Plan which is Exhibit 10.15 to the Bank’s 2018 Form 10-K.
(2) For performance achievement between threshold and target or target and maximum, the 2019 Plan provides for interpolation to determine the incentive compensation payout. To calculate payout for achievement between target and maximum, linear interpolation was used.
Named Executive Officer | Salary on which incentive is based (1) | Maximum incentive payout % potential | Maximum incentive payout potential $(2) | 2019 actual incentive payout (A) | 2018 deferred incentive $ (B) | 2017 deferred incentive $ (C) | 2016 deferred incentive $ (D) | Total incentive payout (3) | |||||||
Winthrop Watson (4) | $ | 881,007 | 100% | $ | 881,007 | $ | 394,230 | $ | 170,992 | $ | 165,279 | $ | 150,506 | $ | 881,007 |
Kristina K. Williams | $ | 566,830 | 85% | $ | 481,806 | $ | 223,918 | $ | 94,912 | $ | 89,140 | $ | 82,524 | $ | 490,494 |
David G. Paulson | $ | 449,944 | 80% | $ | 359,955 | $ | 166,541 | $ | 70,852 | $ | 66,547 | $ | 60,871 | $ | 364,811 |
Michael A. Rizzo | $ | 403,649 | 70% | $ | 282,554 | $ | 129,308 | $ | 56,598 | $ | 54,302 | $ | 50,159 | $ | 290,367 |
Dana A. Yealy | $ | 386,729 | 70% | $ | 270,710 | $ | 123,887 | $ | 53,183 | $ | 51,398 | $ | 47,642 | $ | 276,110 |
Notes:
(1) Base salary in effect on December 31, 2019 used to calculate payouts.
(2) NEOs will be paid 50% of the incentive payout for 2019 in 2020 (see column A) and the remaining amount will be deferred and contingently payable in 2021, 2022 and 2023.
(3) Total incentive payout includes the sum of columns (A) (B) (C) and (D). As noted below, if both of the Stated Bank Performance Criteria are met in the preceding year, deferred incentive payments will be at 125% of the deferred amount.
(4) The actual incentive calculation for 2019 performance resulted in a 100.7% of base salary for Mr. Watson; per the 2019 Plan, the payment must not exceed 100% of base salary for the CEO so the actual payout was capped at 100% of the 2019 base salary rate.
162
The following table illustrates for each participant the maximum amount of unpaid deferred installments as of December 31, 2019 distributable under the 2016, 2017, 2018 and 2019 plans.
Name and Principal Position | Amount Distributable in 2020 | Amount Distributable in 2021 | Amount Distributable in 2022 | Amount Distributable in 2023 | Total(1) | |||||
Winthrop Watson President and CEO | $486,776 | $503,022 | $337,744 | $166,752 | $1,494,294 | |||||
Kristina K. Williams Chief Operating Officer | $266,576 | $277,351 | $188,211 | $93,299 | $825,437 | |||||
David G. Paulson Chief Financial Officer | $198,271 | $206,791 | $140,244 | $69,392 | $614,698 | |||||
Michael A. Rizzo Chief Risk Officer | $161,060 | $164,779 | $110,476 | $53,878 | $490,193 | |||||
Dana A. Yealy General Counsel | $152,223 | $156,201 | $104,803 | $51,620 | $464,847 | |||||
Notes:
(1) Based on the provisions of the 2016, 2017, 2018 and 2019 Executive Officer Incentive Compensation Plans, the deferral amount from the 2016, 2017, 2018 and 2019 plan years includes a 25% increase since the deferral criteria were assumed to have been met at the maximum level payout.
Change in Pension Value
The Pentegra Defined Benefit Plan provides a benefit of 2.00% of a participant's highest 3-year average earnings, multiplied by the participant's years of benefit service for employees hired prior to January 1, 2008; or 1.50% of a participant's highest 5-year average earnings, multiplied by the participant's years of benefit service for employees hired on or after January 1, 2008. Prior to 2018, earnings are defined as base salary as of January 1. As of 2018, earnings are defined as base salary as in effect for each month of the year. Earnings are subject to an annual IRS limit of $280 thousand for 2019. Annual benefits provided under the Pentegra Defined Benefit Plan also are subject to IRS limits, which vary by age and benefit payment type. As noted above, employees hired on or after January 1, 2019 are not eligible to participate in the Pentegra Defined Benefit Plan and will not accrue benefits.
The participant's accrued benefits are calculated as of December 31, 2018 and December 31, 2019. The present value is calculated using the accrued benefit at each date multiplied by a present value factor based on an assumed age 65 retirement date. As of December 31, 2018, 55% of the benefit is valued using the RP-2014 mortality table for white collar workers (with mortality improvement scale MP-2018) and 45% of the benefit is valued using the IRS Applicable Mortality table for lump sums projected to 2018. As of December 31, 2019, 55% of the benefit is valued using the PRI-2012 mortality table for white collar workers (with mortality improvement scale MP-2019) and 45% of the benefit is valued using the IRS Applicable Mortality table for lump sums projected to 2019. The interest rates used are 4.22% as of December 31, 2018 and 3.22% as of December 31, 2019. The difference between the present value of the December 31, 2019 accrued benefit and the present value of the December 31, 2018 accrued benefit is the “change in pension value” for the Defined Benefit Plan.
The SERP provides benefits under the same terms and conditions as the Pentegra Defined Benefit Plan, except earnings are defined as base salary plus incentive compensation. Also, the SERP does not limit annual earnings or benefits. Benefits provided under the Pentegra Defined Benefit Plan are an offset to the benefits provided under the SERP. The participants' benefits are calculated as of December 31, 2018 and December 31, 2019. The present value is calculated by multiplying the benefits accrued at each date by a present value factor based on an assumed age 65 retirement date. As of December 31, 2018, the benefit is valued using the RP-2014 mortality table for white collar workers (with mortality improvement scale MP-2018). As of December 31, 2019, the benefit is valued using the PRI-2012 mortality table for white collar workers (with mortality improvement scale MP-2019). As of December 31, 2018, the benefit is valued using an interest rate of 4.22% for the age 65 present value factor and then the age 65 present value factor is discounted back to current age using an interest rate of 3.75%. As of December 31, 2019, the benefit is valued using an interest rate of 3.22% for the age 65 present value factor and then the age 65 present value factor is discounted back to current age using an interest rate of 2.50%. The difference between the present value of the December 31, 2019 accrued benefit and the present value of the December 31, 2018 accrued benefit is the “change in pension value” for the SERP.
The total change in pension value is the sum of the change in the Pentegra Defined Benefit Plan and the change in the SERP.
163
Grants of Plan-Based Awards
The following table is based on salary as of December 31, 2019 and shows the value of non-equity incentive plan awards granted to the CEO and other Executives in 2019 or future periods, as applicable. Note that these amounts are based on the potential awards available under the terms of the 2019 Plan, not actual performance. Actual performance under the 2019 Plan is as reflected in the SCT and in the detailed incentive award tables set forth below the SCT.
2019 Grants
Estimated Future Payouts under Non-Equity Incentive Plan Awards | ||||||
Name and Principal Position | Performance Achieved in 2019 | Amount Payable 2020 | Amount Payable 2021 | Amount Payable 2022 | Amount Payable 2023 | |
Winthrop Watson President and CEO | Threshold Target Maximum | Total Opportunity $528,604 $660,756 $881,007 | 50% Payout $264,302 $330,378 $440,504 | Deferred Amount $110,126 $137,657 $183,543 | Deferred Amount $110,126 $137,657 $183,543 | Deferred Amount $110,126 $137,657 $183,543 |
Kristina K. Williams(1) Chief Operating Officer | Threshold Target Maximum | Total Opportunity $311,757 $396,871 $481,806 | 50% Payout $155,878 $198,391 $240,903 | Deferred Amount $64,949 $82,663 $100,376 | Deferred Amount $64,949 $82,663 $100,376 | Deferred Amount $64,949 $82,663 $100,376 |
David G. Paulson Chief Financial Officer | Threshold Target Maximum | Total Opportunity $224,972 $292,464 $359,955 | 50% Payout $112,486 $146,232 $179,978 | Deferred Amount $46,869 $60,930 $74,991 | Deferred Amount $46,869 $60,930 $74,991 | Deferred Amount $46,869 $60,930 $74,991 |
Michael A. Rizzo Chief Risk Officer | Threshold Target Maximum | Total Opportunity $161,459 $222,007 $282,554 | 50% Payout $80,730 $111,003 $141,277 | Deferred Amount $33,637 $46,251 $58,865 | Deferred Amount $33,637 $46,251 $58,865 | Deferred Amount $33,637 $46,251 $58,865 |
Dana A. Yealy General Counsel | Threshold Target Maximum | Total Opportunity $154,692 $212,701 $270,710 | 50% Payout $77,346 $106,351 $135,355 | Deferred Amount $32,277 $44,313 $56,398 | Deferred Amount $32,277 $44,313 $56,398 | Deferred Amount $32,277 $44,313 $56,398 |
Note: As described above in the 2019 Plan, payment of each deferred incentive award installment is contingent on the participant meeting the required criteria and the Bank meeting the Stated Bank Performance Criteria described below. For the 2019 Plan, the first year payout is 50% of the award amount and then 33 1/3% of the remaining 50% in each deferral installment over the next three years based on whether or not the stated payment criteria were met. The deferred amount shown for each of the years 2021, 2022, and 2023 is 125% of the maximum deferred amount if both MV/CS and retained earnings levels are maintained, which we have assumed are met in each year for purposes of this calculation.
(1) Ms. Williams retired from the Bank, effective January 3, 2020. As Ms. Williams is a retiree under the Bank’s 2020 Plan, she is eligible to receive the above future payments at the same time, and in the same manner, that such payments are made to the CEO and other Executives.
Stated Bank Performance Criteria, 2019. Payment of each deferred incentive award installment in 2021, 2022, and 2023 related to December 31, 2019 incentive is contingent on the Bank continuing to meet the following stated Bank performance criteria as well as being contingent on the participant continuing to meet his/her requirements. In no event shall the aggregate amount of any current incentive award and deferred incentive award installments paid to a participant in any payment year exceed 100% of the participant's base salary.
• | MV/CS - The annual MV/CS must have an average above 105% (the annual average amount will be calculated using the ending amount of each month during the year); and |
• | Retained Earnings Level - Have retained earnings that exceed the Bank's retained earnings target at each year-end of the applicable deferred payment period. |
Each of the two stated criteria above is equal to 50% of the deferred incentive payment amount. At least one of these criteria above must have been met in the preceding year for any installment payment to be made. If both of these criteria are met in the preceding year, the payment will be made at 125% of the deferred amount. The Board will also consider the following criteria and may exercise its discretion to adjust an award:
• | Remediation of Examination Findings. This criterion is defined as the Bank making sufficient progress, as determined by the Finance Agency and communicated to Bank management or the Board, in the timely remediation of examination, monitoring, and other supervisory findings and matters requiring executive management attention; and |
164
• | Timeliness of Finance Agency, SEC, and OF Filings. This criterion is defined as SEC periodic filings, call report filings with the Finance Agency, and FRS filings with the OF that are timely filed and no material restatement by the Bank is required. |
2020 Grants
Estimated Future Payouts under Non-Equity Incentive Plan Awards | ||||||
Name and Principal Position | Performance Achieved in 2020 | Amount Payable 2021 | Amount Payable 2022 | Amount Payable 2023 | Amount Payable 2024 | |
Winthrop Watson President and CEO | Threshold Target Maximum | Total Opportunity $555,035 $693,793 $925,058 | 50% Payout $277,517 $346,897 $462,529 | Deferred Amount $192,720 | Deferred Amount $192,720 | Deferred Amount $192,720 |
Kristina K. Williams(1) Chief Operating Officer | Threshold Target Maximum | Total Opportunity $324,227 $412,653 $501,078 | 50% Payout $162,113 $206,326 $250,539 | Deferred Amount $104,391 | Deferred Amount $104,391 | Deferred Amount $104,391 |
David G. Paulson(2) Chief Financial Officer | Threshold Target Maximum | Total Opportunity $272,250 $346,500 $420,750 | 50% Payout $136,125 $173,250 $210,375 | Deferred Amount $87,656 | Deferred Amount $87,656 | Deferred Amount $87,656 |
Michael A. Rizzo Chief Risk Officer | Threshold Target Maximum | Total Opportunity $163,074 $224,227 $285,380 | 50% Payout $81,537 $112,113 $142,690 | Deferred Amount $59,454 | Deferred Amount $59,454 | Deferred Amount $59,454 |
Dana A. Yealy General Counsel | Threshold Target Maximum | Total Opportunity $159,333 $219,082 $278,832 | 50% Payout $79,666 $109,541 $139,416 | Deferred Amount $58,090 | Deferred Amount $58,090 | Deferred Amount $58,090 |
Notes: As described above in the 2020 Plan, payment of each deferred incentive award installment is contingent on the participant meeting the required criteria and the Bank meeting the Stated Bank Performance Criteria described below. For the 2020 Plan, the first year payout is 50% of the award amount and then 33 1/3% of the remaining 50% in each deferral installment over the next three years based on whether or not the stated payment criteria were met. The deferred amount shown for each of the years 2022, 2023, and 2024 is 125% of the maximum deferred amount if both MV/CS and retained earnings levels are maintained, which we have assumed is met in each year for purposes of this calculation.
(1) Ms. Williams retired from the Bank, effective January 3, 2020. As Ms. Williams is a retiree under the Bank’s 2020 Plan, she is eligible to receive the above future payments, calculated in accordance with the short term length of her service at the Bank during 2020, at the same time and in the same manner, that such payments are made to the CEO and other Executives.
(2) Mr. Paulson became Chief Operating Officer on January 23, 2020. Mr. Paulson’s total opportunity and estimated payouts reflect compensation adjustments made effective January 1, 2020 in connection with his promotion to Chief Operating Officer. The above assumes Finance Agency non-objection which is pending.
Estimated future payouts presented above were calculated based on the executives' base salary as of January 1, 2020. The actual amount of the payout will be based on the executives' base salary at December 31, 2020.
Under the 2020 Plan, the actual annual award opportunity for January 1, 2020, through December 31, 2020, and payouts are based on a percentage of the executive's base salary as of December 31, 2020. Each goal includes performance measures at threshold, target and maximum. The specific performance goals and total weighting for each goal for the CEO and other Executives are as follows.
• | Optimize member use of core products by year-end 2020. Core products include: Advances, MPF, letters of credit, safekeeping and five community investment products (Affordable Housing Program, Community Lending Program, Banking On Business, First Front Door and Home4Good) (30% weighting); |
• | Profitability as measured by adjusted earnings relative to total GAAP capital in excess of full year average Federal funds rate within identified risk parameters (30% weighting); |
• | KRI performance of 12 KRIs over 12 months (10% weighting); |
• | Peer operating expense scorecard - basket of three metrics (10% weighting); |
• | Diversity and inclusion strategic plan (10% weighting); and |
• | LIBOR transition project (10% weighting). |
Adjusted earnings and other measures referenced above are as defined in the 2020 Plan. See Exhibit 10.15 to this Form 10-K.
165
Stated Bank Performance Criteria, 2020. Payment of each deferred incentive award installment in 2022, 2023, and 2024 related to December 31, 2020 is contingent on the Bank continuing to meet the stated Bank performance criteria as well as being contingent on the participant continuing to meet his/her requirements. In no event shall the aggregate amount of any current incentive award and deferred incentive award installments paid to a participant in any payment year exceed 100% of the participant's base salary.
• | MV/CS - The annual MV/CS must have an average above 105% (the annual average amount will be calculated using the ending amount of each month during the year); and |
• | Retained Earnings Level - Have retained earnings that exceed the Bank's retained earnings target at each year-end of the applicable deferred payment period. |
Each of the two stated criteria above is equal to 50% of the deferred incentive payment amount. At least one of these criteria above must have been met in the preceding year for any installment payment to be made. If both of these criteria are met in the preceding year, the payment will be made at 125% of the deferred amount. The Board will also consider the following criteria and may exercise its discretion to adjust an award:
• | Remediation of Examination Findings. This criterion is defined as the Bank making sufficient progress, as determined by the Finance Agency and communicated to Bank management or the Board, in the timely remediation of examination, monitoring, and other supervisory findings and matters requiring executive management attention; and |
• | Timeliness of Finance Agency, SEC, and OF Filings. This criterion is defined as SEC periodic filings, call report filings with the Finance Agency, and FRS filings with the OF that are timely filed and no material restatement by the Bank is required. |
166
Pension Benefits
Name and Principal Position | Plan Name | Number of Years Credited Service | Present Value of Accumulated Benefit | Payments During Last Fiscal Year | |
Winthrop Watson President and CEO | Pentegra Defined Benefit Plan | 9.58 | $ | 586,000 | $— |
SERP | 10.08 | $ | 2,088,000 | $— | |
Kristina K. Williams(1) Chief Operating Officer | Pentegra Defined Benefit Plan | 14.50 | $ | 965,000 | $— |
SERP | 15.00 | $ | 1,950,000 | $— | |
David G. Paulson Chief Financial Officer | Pentegra Defined Benefit Plan | 9.25 | $ | 416,000 | $— |
SERP | 9.75 | $ | 495,000 | $— | |
Michael A. Rizzo Chief Risk Officer | Pentegra Defined Benefit Plan | 9.33 | $ | 468,000 | $— |
SERP | 9.83 | $ | 448,000 | $— | |
Dana A. Yealy General Counsel | Pentegra Defined Benefit Plan | 33.83 | $ | 2,584,000 | $— |
SERP | 34.33 | $ | 2,210,000 | $— | |
Notes:
(1) Ms. Williams retired from the Bank, effective January 3, 2020. As Ms. Williams is a retiree under the SERP, she is eligible to receive payments in accordance with her payment elections, with such payments commencing in 2020.
The description of the Pentegra Defined Benefit Plan contained in the Summary Plan Description for the Financial Institutions Retirement Fund and the description of the SERP contained in the Supplemental Executive Retirement Plan are included as Exhibit 10.5.1 to the 2013 Form 10-K and Exhibit 10.5.2 to the Bank’s First Quarter 2015 Form 10-Q. See “Qualified and Non-Qualified Defined Benefit Plans” under “Compensation Discussion and Analysis” in this Item 11. of this Form 10-K for the different purposes for each plan.
This table represents an estimate of retirement benefits payable at normal retirement age in the form of the actuarial present value of the accumulated benefit. The amounts were computed as of the same plan measurement date that the Bank uses for financial statement reporting purposes. The same assumptions were used that the Bank uses to derive amounts for disclosure for financial reporting, except the above information assumed normal retirement age as defined in the plan. See narrative discussion of the “Change in Pension Value” column under the SCT.
Compensation used in calculating the benefit for the Pentegra Defined Benefit Plan includes base salary only. Compensation used in calculating the benefit for the SERP includes the current incentive award portion of any award under the Bank’s executive compensation plan. Benefits under the SERP vest after completion of 5 years of employment (the vesting requirement under the Pentegra Defined Benefit Plan) subject to the forfeiture for cause provisions of the SERP.
Normal Retirement: Upon termination of employment at or after age 65 where an executive has met the vesting requirement of completing 5 years of employment, an executive hired prior to January 1, 2008 is entitled to a normal retirement benefit under the Pentegra Defined Benefit Plan equal to: 2% of his/her highest three-year average salary multiplied by his/her years' of benefit service. Under the SERP normal retirement benefit, the executive also would receive 2% of his/her highest three-year average incentive payment (as defined in the SERP) for such same three-year period multiplied by his/her years of benefit service. An executive hired on or after January 1, 2008 is entitled to a normal retirement benefit under the Pentegra Defined Benefit Plan equal to: 1.5% of his/her highest five-year average salary multiplied by his/her years of benefit service. Under the SERP normal retirement benefit, the executive also would receive 1.5% of his/her highest five-year average incentive payment (as defined in the SERP) for such same five-year period multiplied by his/her years of benefit service.
Early Retirement: Upon termination of employment prior to age 65, executives meeting the 5 year vesting and age 45 (age 55 if hired on or after January 1, 2008) early retirement eligibility criteria are entitled to an early retirement benefit. The early retirement benefit amount, for those hired prior to January 1, 2008, is calculated by taking the normal retirement benefit amount and reducing it by 3% times the difference between the age of the early retiree and age 65. For example, if an individual retires at age 61, the early retirement benefit amount would be 88% of the normal retirement benefit amount, a total reduction of 12%. The early retirement benefit amount, for those hired after January 1, 2008, is calculated by taking the normal retirement benefit amount and reducing it by 4% (for ages 55 through 59) and 6% (for ages 60 through 64) times the difference between the age of the early retiree and age 65. At December 31, 2019, Mr. Watson, Ms. Williams, Mr. Rizzo, and Mr. Yealy were eligible for early retirement benefits.
167
Non-Qualified Deferred Compensation
Name and Principal Position | Executive Contributions in 2019 | Registrant Contributions in 2019 | Aggregate Earnings (Losses) in 2019 | Aggregate Withdrawals/Distributions | Aggregate Balance at December 31, 2019 |
Winthrop Watson (1) President and CEO | $548,356 | $68,588 | $689,109 | $— | $4,670,731 |
Kristina K. Williams (2) Chief Operating Officer | $28,679 | $30,879 | $219,972 | $— | $1,840,791 |
David G. Paulson Chief Financial Officer | $158,500 | $32,701 | $117,075 | $— | $1,076,618 |
Michael A. Rizzo Chief Risk Officer | $69,806 | $18,165 | $204,363 | $— | $916,701 |
Dana A. Yealy (3) General Counsel | $281,617 | $23,128 | $556,108 | $(92,700) | $3,207,252 |
Notes:
(1) For Mr. Watson, balance as of December 31, 2019 includes further deferral of deferred incentive compensation of $93,365 and applicable investment earnings of $3,471.
(2) Ms. Williams retired from the Bank, effective January 3, 2020. As Ms. Williams is a retiree under the Bank’s Supplemental Thrift Plan, she is eligible to receive payments in accordance with her payment elections, with such payments commencing in 2020.
(3) For Mr. Yealy, balance as of December 31, 2019 includes further deferral of deferred incentive compensation of $140,494 and applicable investment earnings of $7,910.
See descriptions in the Qualified and Nonqualified Defined Contribution Plans section of the CD&A. A description of the Supplemental Thrift Plan is in Exhibit 10.6.2 to the Bank’s First Quarter 2015 Form 10-Q.
Amounts shown as "Executive Contributions in 2019" were deferred and reported as "Salary" and “Non-Equity Incentive Plan Compensation” in the SCT. Amounts shown as "Registrant Contributions in 2019" are reported as "All Other Compensation" in the SCT. Amounts shown as “Aggregate Earnings (Losses) in 2019” have not been reported in the SCT as none of the CEO or other Executives received above-market preferential earnings. All contributions comprising a portion of the “Aggregate Balance at December 31, 2019” were included in the compensation reported in the SCT and in prior years’ Summary Compensation Tables, as applicable.
The CEO and other Executives may defer up to 80% of their total cash compensation (base salary and annual incentive compensation), less their contributions to the qualified thrift plan. All benefits are fully vested at all times and subject to the forfeiture for cause provisions of the Supplemental Thrift Plan.
The investment options available under the nonqualified deferred compensation plan are closely matched to those available under the qualified defined contribution plan. Investment options include stock funds, bond funds, money market funds and target retirement funds.
168
Post-Termination Compensation
The CEO and other Executives would have received the benefits below in accordance with the Bank's severance policy (or in the case of the CEO the terms of his separate agreement, as applicable) if their employment had been severed without cause during 2019.
Post-Termination Compensation - Severance (Excluding Change-In-Control)
Name and Principal Position | Base Salary | Medical Coverage (1) | Executive Outplacement (2) | Total | |||||||
Length | Amount | Length | Amount | Length | Amount | ||||||
Winthrop Watson President and CEO | 52 weeks | $ | 881,007 | 52 weeks | $ | 13,151 | 12 months | $ | 11,000 | $ | 905,158 |
Kristina K. Williams(3) Chief Operating Officer | 52 weeks | $ | 566,830 | 52 weeks | $ | 15,008 | 12 months | $ | 11,000 | $ | 592,838 |
David G. Paulson Chief Financial Officer | 36 weeks | $ | 311,500 | 36 weeks | $ | 9,104 | 12 months | $ | 11,000 | $ | 331,604 |
Michael A. Rizzo Chief Risk Officer | 36 weeks | $ | 279,449 | 36 weeks | $ | 9,104 | 12 months | $ | 11,000 | $ | 299,553 |
Dana A. Yealy General Counsel | 52 weeks | $ | 386,729 | 52 weeks | $ | 13,151 | 12 months | $ | 11,000 | $ | 410,880 |
Notes:
(1) Additional taxable compensation equivalent to the Bank’s share of medical coverage costs for its active employees.
(2) Estimated cost based on one year of individualized outplacement services with a firm of the Bank's choosing.
(3) Ms. Williams resigned her employment with the Bank, effective January 3, 2020.
Under the CIC Agreements, in the event of employment termination other than for cause (including constructive discharge) following a change in control event, in place of the severance benefits above, the CEO and other Executives would instead receive the benefits below.
169
Post-Termination Compensation - Change-In-Control
Name and Principal Position | Base Salary(1) | Potential Incentive Award(2) (7) | Medical Coverage (3) | Outplace- ment Services and Financial Planning(4) | Additional Severance Amount (5)* | Accelerated Deferred Incentive Installment Amount(7) | Severance/ Defined Contribution Match Amount(6)* | Total | |||||||
Winthrop Watson President and CEO | $ | 2,634,212 | $ | 1,975,659 | $ | 19,726 | $ | 26,000 | $1,015,000 | $ | 1,494,294 | $ | 276,592 | $ | 7,441,483 |
Kristina K. Williams Chief Operating Officer(8) | $ | 1,133,661 | $ | 793,563 | $ | 22,511 | $ | 26,000 | $894,000 | $ | 825,438 | $ | 115,633 | $ | 3,810,806 |
David G. Paulson Chief Financial Officer | $ | 899,888 | $ | 584,927 | $ | 19,726 | $ | 26,000 | $348,000 | $ | 614,697 | $ | 89,089 | $ | 2,582,327 |
Michael A. Rizzo Chief Risk Officer | $ | 807,297 | $ | 444,013 | $ | 19,726 | $ | 26,000 | $372,000 | $ | 490,193 | $ | 75,079 | $ | 2,234,308 |
Dana A. Yealy General Counsel | $ | 773,459 | $ | 425,402 | $ | 19,726 | $ | 26,000 | $898,000 | $ | 464,847 | $ | 71,932 | $ | 2,679,366 |
* Includes both qualified and nonqualified plans.
Notes:
(1) CIC agreements stipulate 2.99 times base salary (CEO) and two times base salary (other Executives).
(2) CIC agreements stipulate an amount equal to 2.99 times (CEO) and two times (other Executives) the payout award that could have been received at target payout amount.
(3) CIC agreements stipulate 18 months of additional taxable compensation equivalent to the Bank’s share of medical coverage costs for its active employees.
(4) CIC agreements stipulate 12 months of outplacement services and $15,000 for financial planning for eligible participants.
(5) CIC agreements stipulate additional severance in an amount equivalent to the additional benefit that the CEO and other Executives would receive for three (CEO) and two (other Executives) additional years of both age and service at the same annual compensation at the time of separation from the Bank under the qualified and nonqualified defined benefit plans.
(6) CIC agreements stipulate additional severance in an amount equivalent to three (CEO) and two (other Executives) years of defined contribution match. Note that compensation for the defined contribution match includes base compensation and annual incentive.
(7) The 2016, 2017, and 2018 Executive Officer Incentive Compensation Plans provide for vesting of the remaining unpaid deferred award installments that correspond to each participant’s 2016, 2017, and 2018 current incentive award. The 2019 Executive Officer Incentive Compensation Plan also provides for vesting of deferred award installments in the event of a Change in Control. As a result, the unpaid deferred award installments for each participant that correspond to the 2019 current incentive award would also be paid out upon a CIC event along with the 2016, 2017, and 2018 Plans’ unpaid deferred installments. This payment is in addition to any current incentive award payout reflected in the SCT. The unpaid deferred installments that would vest for each participant are as set forth above in the deferred installments table. See Exhibit 10.12.2 to the Bank’s 2015 Form 10-K for the terms of the 2016 Plan. See Exhibit 10.12.3 to the Bank’s 2016 Form 10-K for the terms of the 2017 Plan. See Exhibit 10.12.3 to the Bank’s 2017 Form 10-K for the terms of the 2018 Plan. See Exhibit 10.15 to the Bank’s 2018 Form 10-K for the terms of the 2019 Plan.
(8) Ms. Williams resigned her employment with the Bank, effective January 3, 2020.
170
DIRECTOR COMPENSATION
The Bank's directors were compensated in accordance with the 2019 Directors’ Compensation Policy (2019 Compensation Policy) as adopted by the Bank's Board. Under the 2019 Compensation Policy, the total annual director fees were paid as a combination of a quarterly retainer fee and per meeting fees. The following table sets forth the maximum fees that Bank directors could earn in 2019.
Retainer Fees | Meeting Fees | Total | ||||
Board Chair | $ | 72,500 | $ | 72,500 | $ | 145,000 |
Board Vice Chair | $ | 61,248 | $ | 61,252 | $ | 122,500 |
Committee Chair | $ | 61,248 | $ | 61,252 | $ | 122,500 |
Director | $ | 54,996 | $ | 55,004 | $ | 110,000 |
The 2019 Compensation Policy fee levels were as set forth in Exhibit 10.4.1 to the Bank's 2018 Form 10-K. The Finance Agency has determined that the payment of director compensation is subject to Finance Agency review. Compensation can exceed the guidelines under the 2019 Compensation Policy based on a director assuming additional responsibilities, such as chairing a Committee or Board meeting. The following table sets forth the compensation of the Bank’s director’s for services rendered in 2019.
Name | Fees Earned or Paid in Cash | All Other Compensation | Total Compensation | |||
Patrick A. Bond (Chair) | $ | 145,000 | $ | 20 | $ | 145,020 |
Lynda A. Messick (Vice Chair) | 122,500 | 20 | 122,520 | |||
Pamela C. Asbury | 110,000 | 20 | 110,020 | |||
Teresa B. Bazemore* | 18,200 | 20 | 18,220 | |||
James R. Biery* | 97,230 | 20 | 97,250 | |||
Glenn R. Brooks | 110,000 | 20 | 110,020 | |||
Luis A. Cortés Jr. | 122,500 | 20 | 122,520 | |||
Madhukar (Duke) Dayal* | 84,300 | 20 | 84,320 | |||
Angel L. Helm* | 77,911 | 20 | 77,931 | |||
Louise M. Herrle | 110,000 | 20 | 110,020 | |||
Cheryl L. Johnson* | 34,300 | 20 | 34,320 | |||
William C. Marsh | 122,500 | 20 | 122,520 | |||
Brendan J. McGill | 122,500 | 20 | 122,520 | |||
Glenn E. Moyer | 110,000 | 20 | 110,020 | |||
Thomas H. Murphy | 122,500 | 20 | 122,520 | |||
Charles J. Nugent | 122,500 | 20 | 122,520 | |||
Bradford E. Ritchie | 122,500 | 20 | 122,520 | |||
Jeane M. Vidoni | 110,000 | 20 | 110,020 | |||
* Served on the Board for only a portion of 2019.
"Total Compensation" does not include previously deferred director fees for prior years' service and earnings on such fees for those directors participating in the Bank's nonqualified deferred compensation deferred fees plan for directors. The plan allows directors to defer their fees for the year in total and receive earnings based on returns available under or comparable to certain publicly available mutual funds, including equity funds and money market funds. No Bank matching contributions are made under the plan. Directors that attended all Board and applicable Committee meetings in 2019 received the maximum total fees. In 2019, the Bank had a total of seven Board meetings and 51 Board Committee meetings (including Executive Committee meetings).
"All Other Compensation" for each includes $20 per director annual premium for director travel and accident insurance.
171
For 2020, the Bank's Board adopted and submitted to the Finance Agency the 2020 Directors' Compensation Policy with the basis for fee payment being a combination of quarterly retainer and per-meeting fees, as was the case under the 2019 Directors’ Compensation Policy. In February 2020, the Bank’s Board approved an Amended 2020 Directors’ Compensation Policy and submitted it to the Finance Agency for non-objection. The Amended 2020 Directors' Compensation Policy provides for total fees for the Chair of $142,500; $122,500 for the Vice Chair and for each of the Committee Chairs; and $112,500 for each of the other Directors. See Exhibit 10.4.2 to the Bank’s 2019 Form 10-K for additional details on the Amended 2020 Directors' Compensation Policy.
172
Item 12: Security Ownership of Certain Beneficial Owners and Management and Related Stockholder Matters
Generally, the Bank may issue capital stock only to members. As a result, the Bank does not offer any compensation plan under which equity securities of the Bank are authorized for issuance.
Institutions Holding 5% or More of Outstanding Capital Stock
as of February 28, 2020
Name | Address | Capital Stock | % of Total Capital Stock | |||
PNC Bank, N.A. (a) | 222 Delaware Avenue Wilmington, Delaware 19899 | $ | 596,600,000 | 19.9 | % | |
Ally Bank (b) | 200 West Civic Centre Drive Sandy, Utah 84070 | 552,249,000 | 18.4 | % | ||
Santander Bank, N.A. | 824 North Market Street, Suite 100 Wilmington, Delaware 19801 | 284,091,600 | 9.5 | % | ||
JP Morgan Chase Bank, N.A. (c) | 1111 Polaris Parkway Columbus, Ohio 43240 | 280,000,000 | 9.3 | % | ||
First National Bank of Pennsylvania | 166 Main Street Greenville, Pennsylvania 16125 | 229,610,000 | 7.7 | % | ||
(a) For Bank membership purposes, principal place of business is Pittsburgh, PA.
(b) For Bank membership purposes, principal place of business is Horsham, PA.
(c) Chase Bank USA, N.A. became a non-member as its charter was merged with and into JP Morgan Chase Bank, N.A,. an entity outside of the Bank’s district.
Additionally, due to the fact that a majority of the Board of the Bank is elected from the membership of the Bank, these elected directors are officers and/or directors of member institutions that own the Bank’s capital stock. These institutions are provided in the following table.
Capital Stock Outstanding to Member Institutions
Whose Officers and/or Directors Served as a Director of the Bank
as of February 28, 2020
Name | Address | Capital Stock | % of Total Capital Stock | |||
Fulton Bank, N.A. | One Penn Square, P.O. Box 4887 Lancaster, Pennsylvania 17604 | $ | 77,037,900 | 2.6 | % | |
Genworth Life Insurance Company | 251 Little Falls Drive Wilmington, Delaware 19808 | 17,745,300 | 0.6 | % | ||
Univest Bank and Trust Company | 10 West Broad Street Souderton, Pennsylvania 18964 | 16,996,900 | 0.6 | % | ||
Penn Community Bank | 3969 Durham Road Doylestown, Pennsylvania 18902 | 15,524,400 | 0.5 | % | ||
Standard Bank, PASB | 2640 Monroeville Boulevard Monroeville, Pennsylvania 15146 | 7,689,600 | 0.3 | % | ||
Summit Community Bank, Inc. | 300 North Main Street Moorefield, West Virginia 26836 | 5,327,200 | 0.2 | % | ||
Harleysville Bank | 271 Main Street Harleysville, Pennsylvania 19438 | 4,824,600 | 0.2 | % | ||
The Farmers National Bank of Emlenton | 612 Main Street Emlenton, Pennsylvania 16373 | 4,677,600 | 0.2 | % | ||
Atlantic Community Bankers Bank | 1400 Market Street Camp Hill, Pennsylvania 17011 | 4,303,800 | 0.1 | % | ||
County Bank | 19927 Shuttle Road Rehoboth Beach, Delaware 19971 | 161,400 | * | |||
*Less than 0.1%.
Note: In accordance with Section 10(c) of the Act and the terms of the Bank’s security agreement with each member, the capital stock held by each member is pledged to the Bank as additional collateral to secure that member’s loans and other indebtedness to the Bank.
173
Item 13: Certain Relationships and Related Transactions, and Director Independence
Corporate Governance Guidelines
The Bank has adopted corporate governance guidelines titled “Corporate Governance Principles” which are available at www.fhlb-pgh.com by first clicking “About Us” and then “Corporate Governance Principles and Standards”. The Corporate Governance Principles are also available in print to any member upon written request to the Bank, 601 Grant Street, Pittsburgh, Pennsylvania 15219, Attention: General Counsel. These principles were adopted by the Board of Directors to best ensure that the Board of Directors is independent from management, that the Board of Directors adequately performs its function as the overseer of management and to help ensure that the interests of the Board of Directors and management align with the interests of the Bank’s members.
On an annual basis, each director and executive officer is obligated to complete a director and officer questionnaire which requires disclosure of any transactions with the Bank in which the director or executive officer, or any member of his or her immediate family, has a direct or indirect material interest. All directors must adhere to the Bank’s Code of Conduct which addresses conflicts of interest. Under the Code of Conduct, only the Board can grant a waiver of the Code’s requirements in regard to a director or executive officer.
Bank’s Cooperative Structure
All members are required by law to purchase capital stock in the Bank. The capital stock of the Bank can be purchased only by members. As a cooperative, the Bank’s products and services are provided almost exclusively to its members. In the ordinary course of business, transactions between the Bank and its members are carried out on terms that are established by the Bank, including pricing and collateralization terms that treat all similarly situated members on a nondiscriminatory basis. Loans included in such transactions did not involve more than the normal risk of collectability or present other unfavorable terms. Currently, nine of the Bank’s sixteen directors are officers or directors of members. In recognition of the Bank’s status as a cooperative, in correspondence from the Office of Chief Counsel of the Division of Corporation Finance of the SEC, dated September 28, 2005, transactions in the ordinary course of the Bank’s business with member institutions are excluded from SEC Related Person Transaction disclosure requirements. No individual director or executive officer of the Bank or any of their immediate family members has been indebted to the Bank at any time.
Related Person Transaction Policy
In addition to the Bank’s Code of Conduct which continues to govern potential director and executive officer conflicts of interest, originally effective January 31, 2007 (most recently updated effective November 1, 2019); the Bank adopted a written Related Person Transaction Policy. The Policy is subject to annual review and approval and was most recently re-approved by the Board in February 2020. In accordance with the terms of the Policy, the Bank will enter into Related Person Transactions that are not in the ordinary course of Bank business only when the Governance and Public Policy Committee of the Board determines that the Related Person Transaction is in the best interests of the Bank and its investors. Ordinary course of Bank business is defined as providing the Bank’s products and services, including affordable housing products, to member institutions on terms no more favorable than the terms of comparable transactions with similarly situated members. A Related Person Transaction subject to disclosure is a transaction, arrangement or relationship (or a series of transactions, arrangements or relationships) in which the Bank was, is or will be a participant, the amount involved exceeds $120,000 and in which a Related Person had, has or will have a direct or indirect material interest. A Related Person is any director or executive officer of the Bank, any member of their immediate families or any holder of 5 percent or more of the Bank’s outstanding capital stock. A transaction with a company with which a Related Person is associated is deemed pre-approved where the Related Person: (1) serves only as a director of such company; (2) is only an employee (and not an executive officer) of such company; or (3) is the beneficial owner of less than 10 percent of such company’s shares.
Related Person Transactions
In December, 2017 under the Related Person Transaction Policy the Governance and Public Policy Committee approved a $392,480 Bank Affordable Housing Program (AHP) grant to an affordable housing project that Esperanza, the non-profit organization for which Rev. Cortés serves as executive director, sponsored; provided that the project scored well enough under the Bank’s AHP competitive requirements and otherwise complies with the terms of applicable Bank policies. Esperanza is likely to submit additional AHP applications in the future. In addition, Esperanza received charitable contributions for the National Hispanic Prayer Breakfast of $10,000 in 2018 and 2015.
174
Habitat for Humanity of Greater Pittsburgh (Habitat), the non-profit organization for which Dr. Slaughter serves as President and Chief Executive Officer, routinely submits AHP projects for funding. While no AHP subsidies have been awarded to Habitat-sponsored projects since Dr. Slaughter became a Bank Director in January 2020, prior to this the Bank approved the following AHP subsidies for projects in which Habitat serves as project sponsor: (a) a $300,000 subsidy in December 2019; and (b) a $225,000 subsidy in December 2018. Both of these projects were awarded AHP subsidies only after meeting the competitive regulatory application scoring requirements. Habitat is likely to submit additional AHP applications in the future. In addition, Habitat has received charitable contributions from the Bank. While no charitable contributions have been made to Habitat since Dr. Slaughter became a Bank Director, Habitat most recently received a $10,000 charitable contribution from the Bank in May 2019.
Light of Life Rescue Mission is a non-profit organization to which Ms. Herrle has provided volunteer assistance and technical support with respect to fundraising, including seeking funding through programs such as FHLBank AHPs. This organization submitted an AHP project for funding in 2019 which met the competitive regulatory application scoring requirements and was approved for a $749,999 AHP grant in December 2019. Ms. Herrle did not participate in the Bank’s review or approval of this AHP project for funding.
On February 19, 2009, the Governance and Public Policy Committee approved the Bank entering into interest bearing deposit, Federal funds, unsecured note purchase (including TLGP investments) and other money market transactions with Bank members, including five (5) percent or greater shareholders of the Bank and Member Directors’ institutions. Beginning in 2011, the Governance and Public Policy Committee continued re-authorization in regard to additional member money market transactions annually. All such transactions must be in accordance with the terms of the Bank’s investment and counterparty policy statements and limits.
In 2019, the Bank engaged in Federal funds transactions with the following related persons:
• | First National Bank of Pennsylvania. The largest principal amount of Federal funds outstanding with First National Bank of Pennsylvania in 2019 was $400 million and the total amount of interest paid on Federal Funds was $8,457,539. |
• | Fulton Bank, N.A. The largest principal amount of Federal funds outstanding with Fulton Bank, N.A. in 2019 was $50 million and the total amount of interest paid on Federal funds was $14,511. |
• | PNC Bank, N.A. The largest principal amount of Federal funds outstanding with PNC Bank, N.A. in 2019 was $800 million and the total amount of interest paid on Federal funds was $133,675. |
Beginning January 1 through February 29, 2020, the Bank had $16 billion of additional Federal funds transactions with related persons and the aggregate amount of interest paid on such transactions was $1,053,472.
In 2019, the Bank had funds on deposit with JP Morgan Chase Bank, N.A. (JP Morgan) (acquired Bank stock via merger of the Bank’s former member Chase Bank USA, N.A.). In 2019, the maximum amount of Bank funds on deposit at JP Morgan was $625,963,622, and JP Morgan paid the Bank $8,285,655 in interest on such deposits. As of February 29, 2020, the Bank had $338,056,958 in funds on deposit with JP Morgan, and from January 1, 2020 through February 29, 2020, JP Morgan paid the Bank $831,612 in interest on its deposits with JP Morgan.
In addition, in 2019 the Bank had a maximum notional amount of $268,099,954 in derivatives transactions outstanding with JP Morgan under an ISDA master agreement executed with JP Morgan in 1995. The Governance and Public Policy Committee has ratified and authorized continued derivative transactions meeting the terms of the Bank’s applicable credit and other policies with JP Morgan. As of February 29, 2020, the notional amount of derivatives transactions outstanding with JP Morgan under the above-referenced ISDA master agreement was $27,651,848.
InCapital, the firm for which Ms. Herrle served as a Managing Director until her retirement in May 2019, is an approved Bank broker dealer for both debt issuance and Bank investment transactions. For 2019, the Governance and Public Policy Committee approved a standing authorization under the Bank’s Related Person Transaction Policy for the Bank to continue to use InCapital as a broker/dealer for additional transactions. A similar standing authorization was neither sought nor required under the Bank’s Related Person Transaction Policy for 2020 since Ms. Herrle is no longer affiliated with InCapital. In 2019, the Bank did not utilize InCapital as a broker dealer to issue debt or to execute any investment transactions.
175
Under the terms of the Bank’s Related Person Transaction Policy as most recently approved, the Governance and Public Policy Committee annually reviews previously approved Related Person Transactions to determine whether to authorize any new Related Person Transactions with each Related Person that the Committee has previously approved. Such re-authorization applies solely to new Related Person Transactions with such entity(ies) and does not affect the authorized status of any existing and outstanding Related Person Transactions. In February 2020, the Committee considered the previously approved member/stockholder money market transactions as described above and derivatives transactions with JP Morgan and determined to continue the authorization of new Related Person Transactions with these entities.
Director Independence
Under the Act, Bank management is not allowed to serve on the Bank’s Board. Consequently, all directors of the Bank are outside directors. As discussed in Item 10. Directors, Executive Officers and Corporate Governance in this Form 10-K, directors are classified under the Act as either being a Member Director or an Independent Director. By statute, the Board cannot expand or reduce the number of directors that serve on the Board. Only the Finance Agency has the authority to determine how many seats exist on the Board, which is currently set at 16. As of February 29, 2020, the Board was comprised of 16 directors: nine Member Directors and seven Independent Directors. Currently, the Board has its full complement of Directors.
The Bank’s Directors are prohibited from personally owning stock in the Bank. In addition, the Bank is required to determine whether its directors are independent under two distinct director independence standards. First, the Act and Finance Agency Regulations establish substantive independence criteria, including independence criteria for directors who serve on the Bank’s Audit Committee. Second, the SEC rules require, for disclosure purposes, that the Bank’s Board apply the independence criteria of a national securities exchange or automated quotation system in assessing the independence of its directors.
The Act and Finance Agency Regulations. Following the enactment of the Housing Act amendments to the Act on July 30, 2008, an individual is not eligible to be an Independent Bank director if the individual serves as an officer, employee, or director of any member of the Bank, or of any recipient of loans from the Bank. During 2019 and through February 29, 2020, none of the Bank’s Independent Directors were an officer, employee or director of any member or of any institution that received advances from the Bank.
Effective on enactment of the Housing Act, the FHLBanks are required to comply with the substantive Audit Committee director independence standards under Section 10A(m) of the Exchange Act. Rule 10A-3(b)(ii)(B) implementing Section 10A(m) provides that in order to be considered to be independent, a member of an audit committee may not: a) accept directly or indirectly a compensatory fee (other than from the issuer for service on the Board) or b) be an affiliated person of the issuer, defined as someone who directly or indirectly controls the issuer. The SEC implementing regulations provide that a person will be deemed not to control an issuer if the person does not own directly or indirectly more than 10% of any class of voting equity securities. The existence of this safe harbor does not create a presumption in any way that a person exceeding the ownership requirement controls or is otherwise an affiliate of a specified person. In regard to the Bank and the other FHLBanks, this provision of the Housing Act raises an issue whether a Member Director whose institution is a 10% or greater Bank shareholder could be viewed as an affiliate of the Bank, rendering such Member Director ineligible to serve on the Bank’s Audit Committee. Because of the cooperative structure of the FHLBanks, the limited items on which FHLBank stockholders may vote and the statutory cap limiting the votes that any one member may cast for a director to the state average, it is not clear that the fact that a Member Director’s institution that is a 10% or greater Bank shareholder is an affiliate of the Bank. Nevertheless, none of the Bank’s current Audit Committee members nor those who served during 2019 were Member Directors from institutions that were 10% or greater Bank shareholders.
In addition, the Finance Agency director independence standards prohibit individuals from serving as members of the Bank’s Audit Committee if they have one or more disqualifying relationships with the Bank or its management that would interfere with the exercise of that individual’s independent judgment. Disqualifying relationships considered by the Board are: employment with the Bank at any time during the last five years; acceptance of compensation from the Bank other than for service as a director; being a consultant, advisor, promoter, underwriter or legal counsel for the Bank at any time within the last five years; and being an immediate family member of an individual who is or who has been within the past five years, a Bank executive officer. As of February 29, 2020 and as of the date of this filing, all members of the Audit Committee were independent under the substantive Act and Finance Agency regulatory criteria.
SEC Rules. Pursuant to the SEC rules applicable to the Bank for disclosure purposes, the Bank’s Board has adopted the independence standards of the New York Stock Exchange (NYSE) to determine which of its directors are independent, which members of its Human Resources and Diversity & Inclusion Committee are not independent, which members of its Audit Committee are not independent and whether the Bank’s Audit Committee financial expert is independent. As the Bank is not a
176
listed company, the NYSE director independence standards are not substantive standards that are applied to determine whether individuals can serve as members of the Bank’s Board or its Human Resources and Diversity & Inclusion, or Audit Committees.
After applying the NYSE independence standards, the Board determined that for purposes of the SEC disclosure rules, as of February 29, 2020, with respect to the Bank’s directors, seven of the Bank’s Independent Directors, Directors Herrle, Bond, Brooks, Cortés, Helm, Murphy, and Slaughter are independent. In determining that Director Cortés was independent, the Board considered that Esperanza, the non-profit organization for which Director Cortés serves as President, has received AHP grants and charitable contributions from the Bank from time to time, including both when Director Cortés was a Bank Director and when he was not a Bank Director. Similarly, in determining that Director Brooks was independent, the Board considered that Leon N. Weiner & Associates, Inc., the organization for which Director Brooks serves as President, has received AHP grants from the Bank from time to time, including both when Director Brooks was a Bank Director and when he was not a Bank Director. For Director Herrle, the Board considered both (1) the Bank's transactions with Ms. Herrle's former firm, InCapital; and (2) the Bank’s AHP grant to Light of Life Rescue Mission, the non-profit organization with which Ms. Herrle volunteers, both discussed above. Finally, in determining that Director Slaughter was independent, the Board considered that Habitat for Humanity of Greater Pittsburgh, the non-profit organization for which Director Slaughter serves as President and Chief Executive Officer, has received AHP grants and charitable contributions from the Bank from time to time, all of which have, to date, occurred prior to Director Slaughter becoming a Bank Director. For Directors Bazemore and Johnson, both of whom served on the Board in 2019 but not in 2020, the Board determined that they were independent.
The Board was unable to affirmatively determine that there are no material relationships (as defined in the NYSE rules) between the Bank and its nine Member Directors, and on February 21, 2020 concluded that none of the Bank’s current Member Directors was independent under the NYSE independence standards. In making this determination, the Board considered the cooperative relationship between the Bank and its Member Directors. Specifically, the Board considered the fact that each of the Bank’s Member Directors are officers or directors of a Bank member institution, and each member institution has access to, and is encouraged to use, the Bank’s products and services. Furthermore, the Board considered the appropriateness of making a determination of independence with respect to the Member Directors based on a member’s given level of business as of a particular date, when the level of each member’s business with the Bank is dynamic and the Bank’s desire as a cooperative is to increase its level of business with each of its members. As the scope and breadth of a member’s business with the Bank changes, such member’s relationship with the Bank might, at any time, constitute a disqualifying transaction or business relationship under the NYSE’s independence standards. For Member Directors Biery and Dayal, both of whom served on the Board in 2019 but not in 2020, the Board determined that they were not independent as well.
The Board’s Human Resources and Diversity & Inclusion Committee has responsibility for overseeing executive compensation. Applying the NYSE independence standards for compensation committee members, the Board determined that the current Member Directors serving on the Human Resources and Diversity & Inclusion Committee McGill, Nugent and Vidoni are not independent. The Board determined that Directors Bond and Cortés are independent. With respect to Member Director Dayal, who served on the Human Resources and Diversity & Inclusion Committee in 2019 but not in 2020, the Board determined that he was not independent under the NYSE standards. With respect to Director Johnson who served on the Committee in 2019 but not in 2020, the Board determined that she was independent.
The Board has a standing Audit Committee. The Board determined that the Member Directors serving as members of the Bank’s Audit Committee, Directors Marsh, Hasley, Messick, and Moyer are not independent under the NYSE standards for Audit Committee members. The Board determined that Director Helm, who is serving as a member of the Bank’s Audit Committee, is independent under the NYSE standards. The Board determined that Director Bazemore who served on the Board, including as a member of the Bank’s Audit Committee, through February 28, 2019 is independent under the NYSE standards. With respect to Member Directors Biery and Ritchie, who served on the Audit Committee in 2019 but not in 2020, the Board determined they were not independent under the NYSE standards. All of the Bank’s Audit Committee members are independent under the Finance Agency independence standards.
177
Item 14: Principal Accountant Fees and Services
The following table sets forth the aggregate fees billed to the Bank for 2019 and 2018 by its independent registered public accounting firm, PricewaterhouseCoopers LLP.
(in thousands) | 2019 | 2018 | ||||
Audit fees | $ | 910 | $ | 841 | ||
Audit-related fees | 60 | 58 | ||||
All other fees | 5 | 5 | ||||
Total fees | $ | 975 | $ | 904 | ||
Audit fees consist of fees billed for professional services rendered for the audits of the financial statements, reviews of interim financial statements, and audits of the Bank’s internal controls over financial reporting for the years ended December 31, 2019 and 2018.
Audit-related fees consist of fees billed during 2019 and 2018 for assurance and related services reasonably related to the performance of the audit or review of the financial statements. Audit-related fees were for assurance and related services primarily for accounting consultations and fees related to participation in, and presentations at, conferences. All other fees were for the annual license of accounting research software and disclosure compliance checklist.
The Bank is exempt from all Federal, state and local income taxation with the exception of real estate property taxes and certain employer payroll taxes. There were no tax fees paid during 2019 and 2018.
The Audit Committee approves the annual engagement letter for the Bank’s audit. All other services provided by the independent accounting firm are pre-approved by the Audit Committee. The Audit Committee delegates to the Chair of the Audit Committee the authority to pre-approve non-audit services not prohibited by law to be performed by the independent auditors, subject to any single request involving a fee of $100,000 or higher being circulated to all Audit Committee members for their information and comment. The Chair shall report any decision to pre-approve such services to the full Audit Committee at its next meeting.
The Bank paid additional fees to PricewaterhouseCoopers LLP in the form of assessments paid to the OF. These fees were approximately $51 thousand and $56 thousand for 2019 and 2018, respectively. These fees were classified as Other Expense - Office of Finance on the Statement of Income and were not included in the totals above.
PART IV
Item 15: Exhibits and Financial Statement Schedules
(a)(1) Financial Statements
The following Financial Statements and related notes, together with the report of PricewaterhouseCoopers LLP, appear in Item 8.
Statements of Income for each of the years ended December 31, 2019, 2018 and 2017
Statements of Comprehensive Income for each of the years ended December 31, 2019, 2018 and 2017
Statements of Condition as of December 31, 2019 and 2018
Statements of Cash Flows for each of the years ended December 31, 2019, 2018 and 2017
Statements of Changes in Capital for each of the years ended December 31, 2019, 2018 and 2017
(2) Financial Statement Schedules
The schedules required by the applicable accounting regulations of the Securities and Exchange Commission that would normally appear in Item 8. Financial Statements and Supplementary Data are included in the Earnings Performance and Financial Condition sections within Item 7. Management’s Discussion and Analysis.
178
(b) Index of Exhibits
The following is a list of the exhibits filed or furnished with the Bank’s 2019 Form 10-K or incorporated herein by reference:
Exhibit No. | Description | Method of Filing + |
Certificate of Organization | Incorporated by reference to the correspondingly numbered Exhibit to the Bank’s registration statement on Form 10 filed with the SEC on June 9, 2006. | |
The Bylaws of the Federal Home Loan Bank of Pittsburgh as amended effective March 10, 2016 | Incorporated by reference to Exhibit 3.2.1 to the Bank's Form 10-K filed with the SEC on March 10, 2016. | |
Bank Capital Plan | Incorporated by reference to the correspondingly numbered Exhibit to the Bank’s registration statement on Form 10 filed with the SEC on June 9, 2006. | |
Amended Bank Capital Plan | Incorporated by reference to the correspondingly numbered Exhibit to the Bank's Form 10-Q filed with the SEC on August 9, 2010. | |
Amended Bank Capital Plan as further amended effective September 5, 2011 | Incorporated by reference to Exhibit 99.2 to the Bank's current report filed on Form 8-K on August 5, 2011. | |
Amended Bank Capital Plan effective October 6, 2014 | Incorporated by reference to Exhibit 99.3 to the Bank’s current report on Form 8-K filed on July 29, 2014. | |
Description of Registered Securities | Filed herewith. | |
Severance Policy* | Incorporated by reference to Exhibit 10.1.1 to the Bank’s Form 10-K filed with the SEC on March 8, 2018. | |
2018 Severance Policy* | Incorporated by reference to Exhibit 10.1.1 to the Bank’s Form 10-K filed with the SEC on March 11, 2019. | |
2019 Severance Policy* | Filed herewith. | |
Services Agreement with FHLBank of Chicago | Incorporated by reference to Exhibit 10.7 to the Bank’s registration statement on Form 10 filed with the SEC on June 9, 2006. | |
Amended and Restated Federal Home Loan Banks P&I Funding and Contingency Plan Agreement | Incorporated by reference to the correspondingly numbered Exhibit to the Bank’s Form 10-Q filed with the SEC on May 9, 2017. | |
2019 Directors’ Compensation Policy* | Incorporated by reference to Exhibit 10.4.1 of the Bank’s Form 10-K filed with the SEC on March 11, 2019. | |
2020 Directors’ Compensation Policy* | Incorporated by reference to Exhibit 10.1 to the Bank’s Form 10-Q filed with the SEC on November 7, 2019. | |
Amended 2020 Directors’ Compensation Policy* | Filed herewith. | |
Supplemental Executive Retirement Plan Amended and Restated Effective June 26, 2007, Revised December 19, 2008, December 18, 2009 and October 26, 2012* | Incorporated by reference to Exhibit 10.5 to the Bank's Form 10-K filed with the SEC on March 14, 2013. | |
Pentegra Defined Benefit Plan for Financial Institutions Summary Plan Description Dated July 1, 2013* | Incorporated by reference to the correspondingly numbered Exhibit to the Bank's Form 10-K filed with the SEC on March 13, 2014. | |
Supplemental Executive Retirement Plan as amended March 26, 2015* | Incorporated by reference to Exhibit 10.5.2 to the Bank's Form 10-Q filed with the SEC on May 7, 2015. | |
Supplemental Thrift Plan Amended and Restated Effective June 26, 2007, Revised September 26, 2007, December 19, 2008, December 18, 2009, October 26, 2012, and June 21, 2019* | Incorporated by reference to Exhibit 10.1 to the Bank’s Form 10-Q filed with the SEC on August 8, 2019. | |
Pentegra Defined Contribution Plan for Financial Institutions Summary Plan Description Dated May 1, 2012* | Incorporated by reference to Exhibit 10.6.1 to the Bank's Form 10-K filed with the SEC on March 14, 2013. | |
Supplemental Thrift Plan as amended March 26, 2015* | Incorporated by reference to Exhibit 10.6.2 to the Bank's Form 10-Q filed with the SEC on May 7, 2015. | |
Pentegra Defined Contribution Plan for Financial Institutions Summary Plan Description dated January 1, 2015* | Incorporated by reference to Exhibit 10.6.3 to the Bank's Form 10-K filed with the SEC on March 10, 2016. | |
Mortgage Partnership Finance® Services Agreement Dated August 31, 2007, with FHLBank of Chicago | Incorporated by reference to Exhibit 10.17 to the Bank's Form 10-Q filed with the SEC on November 7, 2007. | |
Mortgage Partnership Finance® Consolidated Interbank Agreement dated July 22, 2016 | Incorporated by reference to the correspondingly filed Exhibit to the Bank's Form 10-Q filed with the SEC on August 9, 2016. | |
179
Exhibit No. | Description | Method of Filing + |
Form of Change in Control Agreement with Executive Officer Yealy* | Incorporated by reference to Exhibit 10.18 to the Bank's Form 10-K filed with the SEC on March 13, 2008. | |
Change in Control Agreement with Mr. Rizzo* | Incorporated by reference to Exhibit 10.9.1 to the Bank's Form 10-K filed with the SEC on March 18, 2011. | |
Amended and Restated Change in Control Agreement with Mr. Watson effective January 1, 2011* | Incorporated by reference to Exhibit 10.9.4 to the Bank's Form 10-K filed with the SEC on March 18, 2011. | |
Form of Change in Control Agreement with Executive Officer Paulson* | Incorporated by reference to Exhibit 10.8.4 to the Bank’s Form 10-K filed with the SEC on March 13, 2014. | |
Form of Amendment to Change in Control Agreement with Executive Officers Watson, Paulson, Rizzo, and Yealy effective January 1, 2015* | Incorporated by reference to Exhibit 10.9 to the Bank’s Form 10-K filed with the SEC on March 12, 2015. | |
August 2016 Form of Executive Officer Severance (CIC) Agreement* | Incorporated by reference to the correspondingly filed Exhibit to the Bank’s Form 10-Q filed with the SEC on August 9, 2016. | |
2015 Executive Officer Incentive Compensation Plan* | Incorporated by reference to Exhibit 10.12.2 to the Bank’s Form 10-K filed March 12, 2015. | |
2016 Executive Officer Incentive Compensation Plan* | Incorporated by reference to Exhibit 10.12.2 to the Bank’s Form 10-K filed March 10, 2016. | |
2017 Executive Officer Incentive Compensation Plan* | Incorporated by reference to Exhibit 10.12.3 to the Bank’s Form 10-K filed March 9, 2017. | |
2018 Executive Officer Incentive Compensation Plan* | Incorporated by reference to Exhibit 10.12.3 to the Bank’s Form 10-K filed March 8, 2018. | |
2019 Executive Officer Incentive Compensation Plan* | Incorporated by reference to Exhibit 10.15 to the Bank’s Form 10-K filed on March 11, 2019. | |
2020 Executive Officer Incentive Compensation Plan* | Filed herewith. | |
Offer Letter for Winthrop Watson* | Incorporated by reference to Exhibit 10.15 to the Bank's Form 10-Q filed with the SEC on November 12, 2009. | |
Joint Capital Enhancement Agreement dated February 28, 2011 | Incorporated by reference to Exhibit 99.1 of the Bank's Form 8-K filed with the SEC on March 1, 2011. | |
Amended Joint Capital Enhancement Agreement dated August 5, 2011 | Incorporated by reference to Exhibit 99.1 of the Bank's Form 8-K filed with the SEC on August 5, 2011. | |
Form of Director and Officer Indemnification Agreement* | Incorporated by reference to Exhibit 10.1 to the Bank’s Form 10-Q filed with the SEC on May 7, 2019. | |
Power of Attorney | Filed herewith. | |
Certification Pursuant to Section 302 of the Sarbanes-Oxley Act of 2002 for the Chief Executive Officer | Filed herewith. | |
Certification Pursuant to Section 302 of the Sarbanes-Oxley Act of 2002 for the Principal Financial Officer | Filed herewith. | |
Certification Pursuant to Section 302 of the Sarbanes-Oxley Act of 2002 for the Chief Accounting Officer | Filed herewith. | |
Certification Pursuant to 18 U.S.C. Section 1350, as Adopted Pursuant to Section 906 of the Sarbanes-Oxley Act of 2002 for the Chief Executive Officer | Furnished herewith. | |
Certification Pursuant to 18 U.S.C. Section 1350, as Adopted Pursuant to Section 906 of the Sarbanes-Oxley Act of 2002 for the Principal Financial Officer | Furnished herewith. | |
Certification Pursuant to 18 U.S.C. Section 1350, as Adopted Pursuant to Section 906 of the Sarbanes-Oxley Act of 2002 for the Chief Accounting Officer | Furnished herewith. | |
Federal Home Loan Bank of Pittsburgh Board of Directors Audit Committee Charter | Filed herewith. | |
Report of the Audit Committee | Furnished herewith. | |
101 | Interactive Data File (XBRL) | Filed herewith. |
+ Incorporated document references to filings by the registrant are to SEC File No. 000-51395.
* Denotes management contract or compensatory plan.
Item 16: Form 10-K Summary
None
180
GLOSSARY
ABS: Asset-Backed Securities |
AMA: Acquired member assets |
APBO: Accumulated Post-retirement Benefit Obligation |
Accumulated Other Comprehensive Income (Loss) (AOCI): Represents gains and losses of the Bank that have not yet been realized; balance is presented in the Equity section of the Statement of Condition. |
Advance: Secured loan made to a member |
Affordable Housing Program (AHP): Bank program that provides primarily direct grants and/or subsidized loans to assist members in meeting communities’ affordable housing needs. Each FHLBank sets aside 10% of its pre-assessment income to fund the program with a minimum $100 million annual contribution by all 12 FHLBanks. |
Banking On Business (BOB): Bank program that assists eligible small businesses with start-up and expansion. A small business is defined as any firm, proprietorship, partnership or corporation that has less than 50 employees and the lesser of $10 million in annual receipts or the annual receipts limits set by the Small Business Administration’s (SBA) size standards by North American Industry Classification (NAIC). |
Capital stock: The five-year redeemable stock issued by the Bank pursuant to its capital plan. |
Collateral: Property subject to a security interest that secures the discharge of an obligation (e.g., mortgage or debt obligation); a security interest that the Bank is required by statute to obtain and thereafter maintain beginning at the time of origination or renewal of a loan. |
Collateralized mortgage obligation (CMO): Type of bond that divides cash flows from a pool of mortgages into multiple classes with different maturities or risk profiles. |
Committee on Uniform Securities Identification Procedures (CUSIP): CUSIP-based identifiers provide a unique name for a wide range of global financial instruments including equity and debt issues, derivatives and syndicated loans. The CUSIP consists of a combination of nine characters, both letters and numbers, which identify a company or issuer and the type of security. |
Community Development Financial Institution (CDFI): Private institutions that provide financial services dedicated to economic development and community revitalization in underserved markets; include community development loan funds, venture capital funds and state-chartered credit unions without Federal deposit insurance. Effective February 4, 2010, CDFIs were eligible to become Bank members. |
Community Financial Institution (CFI): Bank member that has deposits insured under the FDIC and is exempt from the requirement of having at least 10% of total assets in residential mortgage loans. |
Community Lending Program (CLP): Bank program that funds community and development projects. When loans are repaid, the money is available to be lent to other projects. |
Consolidated Obligation (CO): Bonds and discount notes that are the joint and several liability of all 12 FHLBanks and are issued and serviced through the OF. These instruments are the primary source of funds for the FHLBanks. |
Conventional loan/mortgage: Mortgage that is neither insured nor guaranteed by the FHA, VA or any other agency of the Federal government. |
Cost of funds: Estimated cost of issuing FHLBank System consolidated obligations and discount notes. |
Credit enhancement (CE) fee: Fee payable monthly by an MPF Bank to a PFI in consideration of the PFI’s obligation to fund the realized loss for a Master Commitment; based on fee rate applicable to such Master Commitment and subject to terms of the Master Commitment and applicable MPF mortgage product, which may include performance and risk participation features. |
Delivery commitment: Mandatory commitment of the parties, evidenced by a written, machine- or electronically generated transmission issued by an MPF Bank to a PFI accepting the PFI’s oral mortgage loan delivery commitment offer. |
Demand Deposit Account (DDA): The account each member maintains with the Bank. All incoming and outgoing wires, loan credits and debits, as well as any principal and interest payments from securities and loans are posted into the DDA. |
Duration: A common measure of the price sensitivity of an asset or liability to specified changes in interest rates. |
FFIEC: Federal Financial Institutions Examination Council |
Federal Deposit Insurance Corporation (FDIC): Federal agency established in 1933 that guarantees (with limits) funds on deposit in member banks and performs other functions such as making loans to or buying assets from member banks to facilitate mergers or prevent failures. |
181
Federal Home Loan Bank Act of 1932 (the Act): Enacted by Congress in 1932 creating the FHLBank Board, whose role was to supervise a series of discount banks across the country. The intent was to increase the supply of money available to local institutions that made home loans and to serve them as a reserve credit resource. The FHLBank Board became the Federal Housing Board in 1989, which was replaced by The Federal Housing Finance Agency in 2008. |
Federal Home Loan Bank Office of Finance (OF): FHLBank System’s centralized debt issuance facility that also prepares combined financial statements, selects/evaluates underwriters, develops/maintains the infrastructure needed to meet FHLBank System goals, and administers REFCORP and the Financing Corporation funding programs. |
Federal Home Loan Mortgage Corporation, (Freddie Mac or FHLMC): GSE chartered by Congress in 1970 to keep money flowing to mortgage lenders in support of homeownership and rental housing. |
Federal Housing Administration (FHA): Government agency established in 1934 and insures lenders against loss on residential mortgages. |
Federal Housing Finance Agency (FHFA or Finance Agency): Independent regulatory agency (established on enactment of the Housing Act) of the executive branch ensuring the FHLBanks, Federal National Mortgage Association and Federal Home Loan Mortgage Corporation operate in a safe and sound manner, carry out their statutory missions and remain adequately capitalized and able to raise funds in the capital markets. |
Federal National Mortgage Association (Fannie Mae or FNMA): GSE established in 1938 to expand the flow of mortgage money by creating a secondary market. |
Federal Reserve Bank (FRB): One part of the Federal Reserve System. There are a total of 12 regional privately-owned FRBs located in major cities throughout the U.S., which divide the nation into 12 districts. The FRBs act as fiscal agents for the U.S. Treasury; each have their own nine-member board of directors. The FRBs are located in Boston, New York City, Philadelphia, Cleveland, Richmond, Atlanta, Chicago, St. Louis, Minneapolis, Kansas City, Dallas and San Francisco. |
Federal Reserve Board (Federal Reserve): Governing body over the Federal Reserve System, the Federal Reserve is responsible for: (1) conducting the nation’s monetary policy; (2) supervising and regulating banking institutions; (3) maintaining the stability of the financial system and containing systemic risk; and (4) providing financial services to depository institutions, the U.S. government and foreign official institutions. |
Federal Reserve System: Central banking system of the U.S. |
Financial Accounting Standards Board (FASB): Board created in 1973 responsible for establishing and interpreting generally accepted accounting principles and improving standards of financial accounting and reporting for the guidance and education of the public, including issuers, auditors and users of financial information. |
First Loss Account (FLA): Notational account established by an MPF Bank for each Master Commitment based on and in the amount required under the applicable MPF mortgage product description and Master Commitment. |
Generally Accepted Accounting Principles (GAAP): Accounting term that encompasses the conventions, rules, and procedures necessary to define accepted accounting practice at a particular time. GAAP includes not only broad guidelines of general application, but also detailed practices and procedures. Those conventions, rules, and procedures provide a standard by which to measure financial presentations. |
Government National Mortgage Association (Ginnie Mae or GNMA): GSE established by Congress in 1968 that guarantees securities backed by a pool of mortgages. |
Government-sponsored enterprise (GSE): A private organization with a government charter whose function is to provide liquidity for the residential loan market or another identified government purpose. |
HELOC: Home Equity Line of Credit |
Housing and Economic Recovery Act of 2008 (the Housing Act or HERA): Enacted by Congress in 2008; designed primarily to address the subprime mortgage crisis. Established the Finance Agency, replacing the Federal Housing Finance Board and the Office of Federal Housing Enterprise Oversight. |
Internal Credit Rating (ICR): A scoring system used by the Bank to measure the financial condition of a member or housing associate and is based on quantitative and qualitative factors. |
Joint and several liability: Obligation for which multiple parties are each individually and all collectively liable for payment. |
Loan to Value (LTV): The loan-to-value (LTV) ratio expresses the amount of a first mortgage lien as a percentage of the total appraised value of real property. |
London Interbank Offered Rate (LIBOR): Offer rate that a Euromarket bank demands to place a deposit at (or equivalently, make a loan to) another Euromarket bank in London. LIBOR is frequently used as the reference rate for the floating-rate coupon in interest rate swaps and option contracts such as caps and floors. |
Master Commitment: A document executed by a PFI and an MPF Bank, which provides the terms under which the PFI will deliver mortgage loans to the MPF Bank. |
182
Master Servicer: Financial institution that the MPF Provider has engaged to perform various master servicing duties on its behalf in connection with the MPF Program. |
Maximum Borrowing Capacity (MBC): Total possible borrowing limit for an individual member. This is determined based on the type and amount of collateral each member has available to pledge as security for Bank advances. It is computed using specific asset balances (market and/or book values) from qualifying collateral categories, which are discounted by applicable collateral weighting percentages. The MBC is equal to the aggregate collateral value net of any pledged assets. |
Mortgage-Backed securities (MBS): Investment instruments backed by mortgage loans as security. |
Mortgage Partnership Finance® (MPF®) Program: FHLBank of Chicago program offered by select FHLBanks to their members to provide an alternative for funding mortgages through the creation of a secondary market. |
National Credit Union Administration (NCUA): Independent federal agency that charters and supervises federal credit unions, backed by the full faith and credit of the U.S. government. |
Nationally Recognized Statistical Rating Organization (NRSRO): Credit rating agency registered with the SEC. Currently nine firms are registered as NRSROs. |
OIS: Overnight Index Swap rate based on the Federal Funds Effective rate |
ORERC: Other real estate-related collateral. |
Other-than-Temporary Impairment (OTTI): From an accounting standpoint, an “impairment” of a debt or equity security occurs when the fair value of the security is less than its amortized cost basis, i.e., whenever a security has an unrealized loss. |
OTTI Governance Committee: FHLB System OTTI governance committee formed by the FHLBs with the responsibility for reviewing and approving the key modeling assumptions, inputs and methodologies to be used to generate cash flow projections, which are used in analyzing credit losses and determining OTTI for private label MBS. |
PMI: Primary Mortgage Insurance |
Pair-off fee: A fee assessed against a PFI when the aggregate principal balance of mortgages funded or purchased under a delivery commitment falls above or below the tolerance specified. |
Participating Financial Institution (PFI): Bank member participating in the MPF Program, which is legally bound to originate, sell and/or service mortgages in accordance with the PFI Agreement, which it signs with the MPF Bank of which it is a member. |
Permanent capital: Retained earnings plus capital stock; capital stock includes mandatorily redeemable capital stock. |
QCR: Qualifying Collateral Report |
RBC: Risk Based Capital |
ROE: Return on Equity |
RRE: Restricted Retained Earnings |
Real Estate Owned (REO): Mortgaged property acquired by a servicer on behalf of the mortgagee, through foreclosure or deed in lieu of foreclosure. |
Resolution Funding Corporation (REFCORP): Mixed-ownership, government corporation created by Congress in 1989 to issue “bailout” bonds and raise industry funds to finance activities of the Resolution Trust Corporation, and merge or close insolvent institutions inherited from the disbanded Federal Savings and Loan Insurance Corporation. Mixed-ownership corporations are those with capital stock owned by both the United States and borrowers or other private holders. |
SERP: Supplemental Executive Retirement Plan. |
Servicer: Institution approved to service mortgages funded or purchased by an MPF Bank. The term servicer refers to the institution acting in the capacity of a servicer of mortgages for an MPF Bank under a PFI Agreement. |
Secured Overnight Financing Rate (SOFR): A secured interbank overnight interest rate and reference rate established as an alternative to LIBOR. |
Software as a service (SaaS): SaaS is a software distribution model in which a third-party provider hosts applications and makes them available to customers over the Internet. |
Standby letter of credit: Document issued by the FHLBanks on behalf of a member as a guarantee against which funds can be drawn, that is used to facilitate various types of business transactions the member may have with third parties. Standby is defined as the Bank standing by to make good on the obligation made by the member to the beneficiary. |
Supplemental Mortgage Insurance (SMI) policy: Any and all supplemental or pool mortgage guarantee insurance policies applicable to mortgages delivered under the Master Commitment. |
TDR: Troubled Debt Restructure |
TVA: Tennessee Valley Authority |
183
TAP auction debt: Term used to address multiple FHLBank debt issuances within a given quarter which have the same terms. As an FHLBank issues debt with terms similar to other FHLBank debt already issued, the FHLBank ‘taps’ the original issuance and is assigned the same CUSIP; this creates one larger, more liquid issue. |
Total Credit Exposure (TCE): In addition to TCP, it includes accrued interest on all outstanding advances and estimated potential prepayment fee amounts, where applicable, for advances to members in full delivery collateral status. |
Underlying: A specified interest rate, security price, commodity price, foreign exchange rate, index of prices or rates or other variable. An underlying may be the price or rate of an asset or liability, but is not the asset or liability itself. |
Variable Interest Entities (VIEs): An entity (the investee) in which the investor holds a controlling interest that is not based on the majority of voting rights. It is closely related to the concept of a special purpose entity. The importance of identifying a VIE is that a company needs to consolidate such entities if it is the primary beneficiary of the VIE. |
Veterans Affairs, Department of (VA): Federal agency with oversight for programs created for veterans of the U.S. armed forces. Mortgage loans granted by a lending institution to qualified veterans or to their surviving spouses may be guaranteed by the VA. |
Weighted average coupon (WAC): Weighted average of the interest rates of loans within a pool or portfolio. |
Weighted average life (WAL): The average amount of time that will elapse from the date of a security’s issuance until each dollar of principal is repaid. The WAL of mortgage loans or MBS is only an assumption. The average amount of time that each dollar of principal is actually outstanding is influenced by, among other factors, the rate at which principal, both scheduled and unscheduled, is paid on the mortgage loans. |
184
SIGNATURE
Pursuant to the requirements of Section 13 or 15(d) of the Securities Exchange Act of 1934, the registrant has duly caused this report to be signed on its behalf by the undersigned, thereunto duly authorized.
Federal Home Loan Bank of Pittsburgh
(Registrant)
By: /s/Winthrop Watson
Winthrop Watson
President and Chief Executive Officer
Date: March 10, 2020
Pursuant to the requirements of the Securities Exchange Act of 1934, this report has been signed below by the following persons on behalf of the registrant and in the capacities and on the dates indicated.
Signature | Capacity | Date |
/s/ Winthrop Watson Winthrop Watson | President and Chief Executive Officer (Principal Executive Officer) | March 10, 2020 |
/s/ David G. Paulson David G. Paulson | Chief Operating Officer (Principal Financial Officer) | March 10, 2020 |
/s/ Edward V. Weller Edward V. Weller | Chief Accounting Officer (Principal Accounting Officer) | March 10, 2020 |
*/s/ Bradford E. Ritchie Bradford E. Ritchie | Chairman of the Board of Directors | March 10, 2020 |
*/s/ Louise M. Herrle Louise M. Herrle | Vice Chairman of the Board of Directors | March 10, 2020 |
*/s/ Pamela C. Asbury Pamela C. Asbury | Director | March 10, 2020 |
*/s/ Patrick A. Bond Patrick A. Bond | Director | March 10, 2020 |
*/s/ Glenn R. Brooks Glenn R. Brooks | Director | March 10, 2020 |
*/s/ Rev. Luis A. Cortés, Jr. Rev. Luis A. Cortés, Jr. | Director | March 10, 2020 |
185
Signature | Capacity | Date |
*/s/ Andrew W. Hasley Andrew W. Hasley | Director | March 10, 2020 |
*/s/ Angel L. Helm Angel L. Helm | Director | March 10, 2020 |
*/s/ William C. Marsh William C. Marsh | Director | March 10, 2020 |
*/s/ Brendan J. McGill Brendan J. McGill | Director | March 10, 2020 |
*/s/ Lynda A. Messick Lynda A. Messick | Director | March 10, 2020 |
*/s/ Glenn E. Moyer Glenn E. Moyer | Director | March 10, 2020 |
*/s/ Thomas H. Murphy Thomas H. Murphy | Director | March 10, 2020 |
*/s/ Charles J. Nugent Charles J. Nugent | Director | March 10, 2020 |
*/s/ Dr. Howard B. Slaughter Jr. Dr. Howard B. Slaughter Jr. | Director | March 10, 2020 |
*/s/ Jeane M. Vidoni Jeane M. Vidoni | Director | March 10, 2020 |
*By: /s/ Dana A. Yealy Dana A. Yealy, Attorney-in-fact, pursuant to Power of Attorney filed herewith | ||
186