Attached files
| file | filename |
|---|---|
| EX-99.1 - EX-99.1 - Portman Ridge Finance Corp | d836586dex991.htm |
| 8-K - FORM 8-K - Portman Ridge Finance Corp | d836586d8k.htm |

2019 Q4 Earnings Presentation March 9, 2020 Exhibit 99.2
Important Information Cautionary Statement Regarding Forward-Looking Statements This presentation contains forward-looking statements within the meaning of Section 27A of the Securities Act of 1933, as amended, and Section 21E of the Securities Exchange Act of 1934, as amended. The matters discussed in this presentation, as well as in future oral and written statements by management of Portman Ridge Finance Corporation (“PTMN”, “Portman Ridge” or the “Company”), that are forward-looking statements are based on current management expectations that involve substantial risks and uncertainties which could cause actual results to differ materially from the results expressed in, or implied by, these forward-looking statements. Forward-looking statements relate to future events or our future financial performance and include, but are not limited to, projected financial performance, expected development of the business, plans and expectations about future investments and the future liquidity of the Company. We generally identify forward-looking statements by terminology such as "may," "will," "should," "expects," "plans," "anticipates," "could," "intends," "target," "projects," “outlook”, "contemplates," "believes," "estimates," "predicts," "potential" or "continue" or the negative of these terms or other similar words. Forward-looking statements are based upon current plans, estimates and expectations that are subject to risks, uncertainties and assumptions. Should one or more of these risks or uncertainties materialize, or should underlying assumptions prove to be incorrect, actual results may vary materially from those indicated or anticipated by such forward-looking statements. Important assumptions include our ability to originate new investments, and achieve certain margins and levels of profitability, the availability of additional capital, and the ability to maintain certain debt to asset ratios. In light of these and other uncertainties, the inclusion of a projection or forward-looking statement in this press release should not be regarded as a representation that such plans, estimates, expectations or objectives will be achieved. Important factors that could cause actual results to differ materially from such plans, estimates or expectations include, among others, (1) uncertainty of the expected financial performance of the Company, including following completion of the Externalization; (2) failure to realize the anticipated benefits of the Externalization; (3) the ability of the Company and/or BC Partners to implement its business strategy; (4) the risk that stockholder litigation in connection with the Externalization may result in significant costs of defense, indemnification and liability; (5) evolving legal, regulatory and tax regimes; (6) changes in general economic and/or industry specific conditions; (7) the impact of increased competition; (8) business prospects and the prospects of the Company’s portfolio companies; (9) contractual arrangements with third parties; (10) any future financings by the Company; (11) the ability of the Advisor to attract and retain highly talented professionals; and (12) the Company’s ability to fund any unfunded commitments; (13) any future distributions by the Company; and (14) any future repurchases by the Company. Further information about factors that could affect our financial and other results is included in our filings with the Securities and Exchange Commission (the “SEC”). We do not undertake to publicly update or revise any forward-looking statements, whether as a result of new information, future events or otherwise, except as required to be reported under the rules and regulations of the SEC.
Earnings Summary Earnings Highlights As of December 31st, 2019, our NAV stood at $152.2 million or $3.40 per share NAV increased by $19.5 million over the course of the quarter, driven mainly by the merger, which closed on December 18th, 2019, with OHA Investment Corporation (“OHAI”) and the associated gains on investments (42% of which have been realized before quarter end). The merger was completed at NAV and Portman Ridge issued 7.4 million shares as part of the transaction Net investment income for the quarter was $0.06 / share - in line with Portman Ridge’s current quarterly distribution Concurrently with the merger, Portman Ridge refinanced its existing revolving credit facility with a rate of Libor+325bps with a new revolving credit facility with a rate of L+285bps. The refinancing will directly impact net investment income, as Portman Ridge’s cost of debt decreased by $4k per $1mm of borrowings, which is expected to 100% flow through to the bottom line The focus remains on rotating the portfolio into high-quality, BC originated assets with an attractive risk-adjusted return profile – since the externalization of the management contract on March 31, 2019, BC Partners has been able to increase yields on NAV by 166 basis points in spite of a declining LIBOR headwind Over the last three quarters, 32% of the legacy book has been rotated into BC Partners originated assets, and we continue to look for opportunities to cautiously redeploy capital in opportunities with asymmetric payoffs On March 5, 2020, the Portman Ridge Board of Directors approved a $10 million stock repurchase program to opportunistically repurchase Portman Ridge shares in the open market
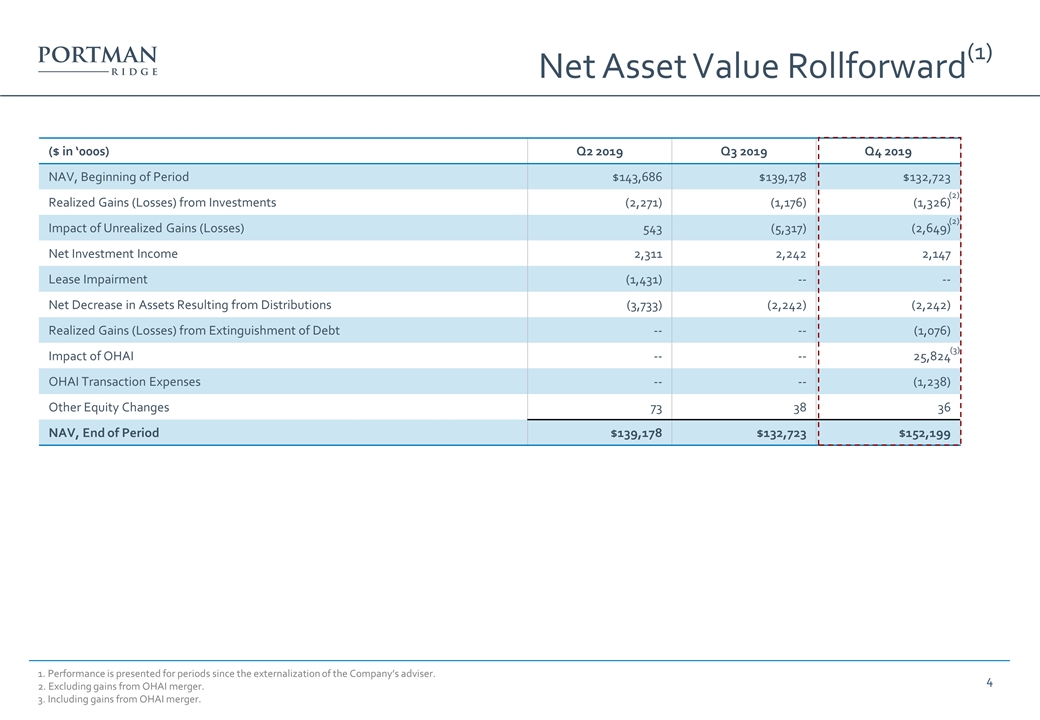
($ in ‘000s) Q2 2019 Q3 2019 Q4 2019 NAV, Beginning of Period $143,686 $139,178 $132,723 Realized Gains (Losses) from Investments (2,271) (1,176) (1,326) Impact of Unrealized Gains (Losses) 543 (5,317) (2,649) Net Investment Income 2,311 2,242 2,147 Lease Impairment (1,431) -- -- Net Decrease in Assets Resulting from Distributions (3,733) (2,242) (2,242) Realized Gains (Losses) from Extinguishment of Debt -- -- (1,076) Impact of OHAI -- -- 25,824 OHAI Transaction Expenses -- -- (1,238) Other Equity Changes 73 38 36 NAV, End of Period $139,178 $132,723 $152,199 1. Performance is presented for periods since the externalization of the Company’s adviser. 2. Excluding gains from OHAI merger. 3. Including gains from OHAI merger. Net Asset Value Rollforward(1) (2) (2) (3)
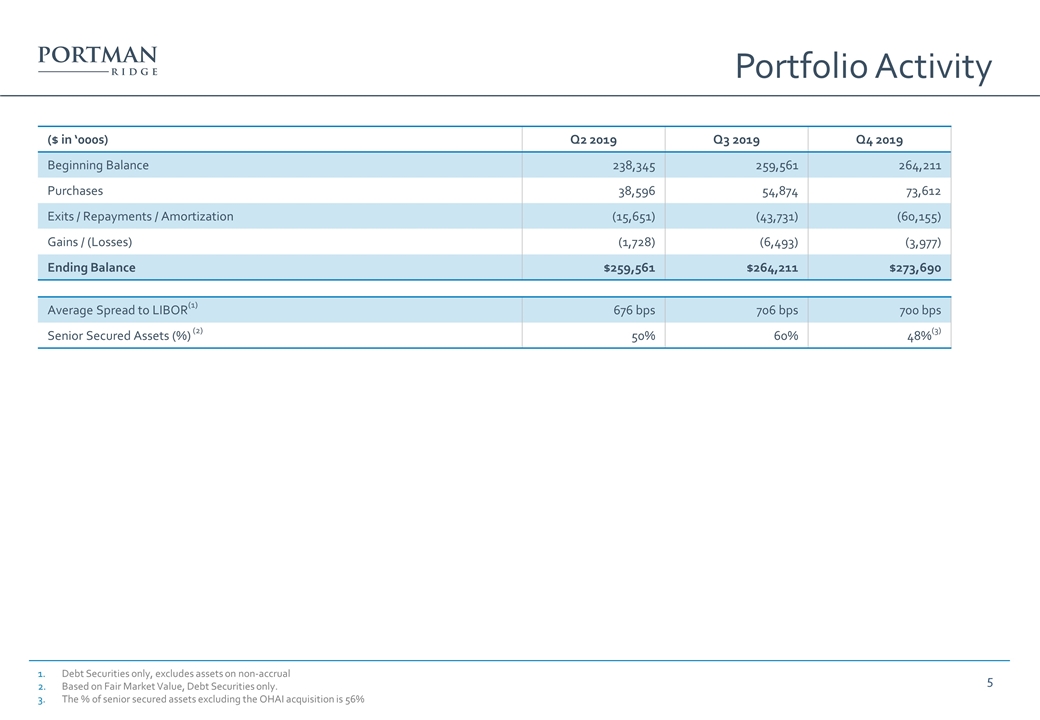
Debt Securities only, excludes assets on non-accrual Based on Fair Market Value, Debt Securities only. The % of senior secured assets excluding the OHAI acquisition is 56% Portfolio Activity ($ in ‘000s) Q2 2019 Q3 2019 Q4 2019 Beginning Balance 238,345 259,561 264,211 Purchases 38,596 54,874 73,612 Exits / Repayments / Amortization (15,651) (43,731) (60,155) Gains / (Losses) (1,728) (6,493) (3,977) Ending Balance $259,561 $264,211 $273,690 Average Spread to LIBOR(1) 676 bps 706 bps 700 bps Senior Secured Assets (%) (2) 50% 60% 48%(3)
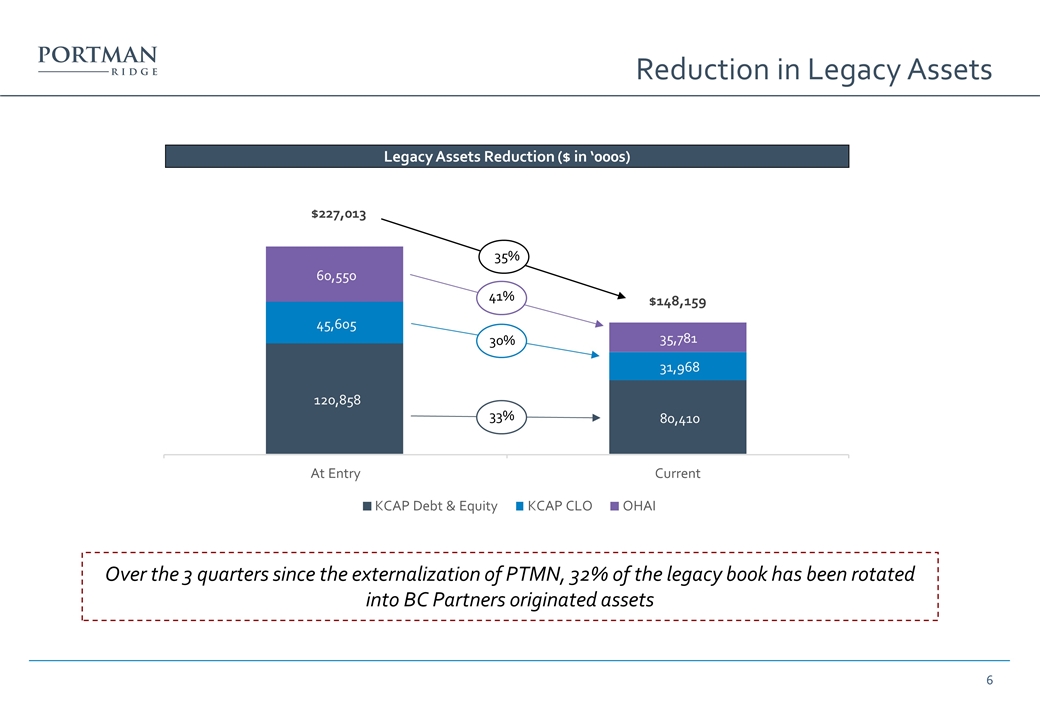
Reduction in Legacy Assets Legacy Assets Reduction ($ in ‘000s) 33% 30% 41% 35% Over the 3 quarters since the externalization of PTMN, 32% of the legacy book has been rotated into BC Partners originated assets 120,858 80,410 45,605 31,968 60,550 35,781 $227,013 $148,159 At Entry Current KCAP Debt & Equity KCAP CLO OHAI
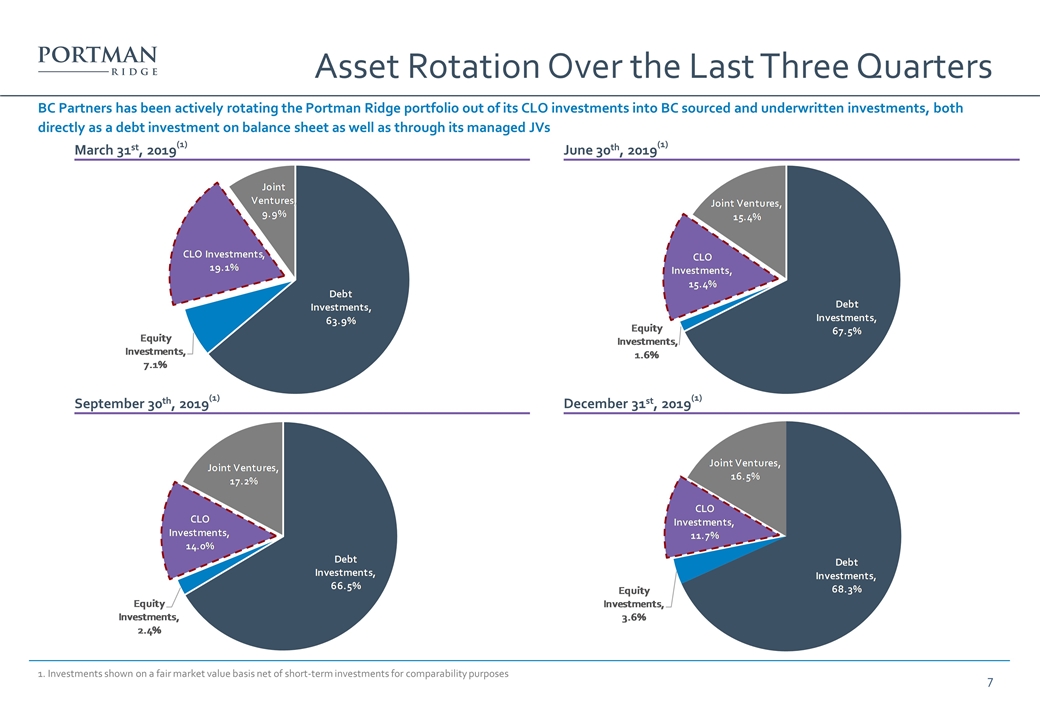
1. Investments shown on a fair market value basis net of short-term investments for comparability purposes Asset Rotation Over the Last Three Quarters March 31st, 2019(1) June 30th, 2019(1) September 30th, 2019(1) December 31st, 2019(1) BC Partners has been actively rotating the Portman Ridge portfolio out of its CLO investments into BC sourced and underwritten investments, both directly as a debt investment on balance sheet as well as through its managed JVs
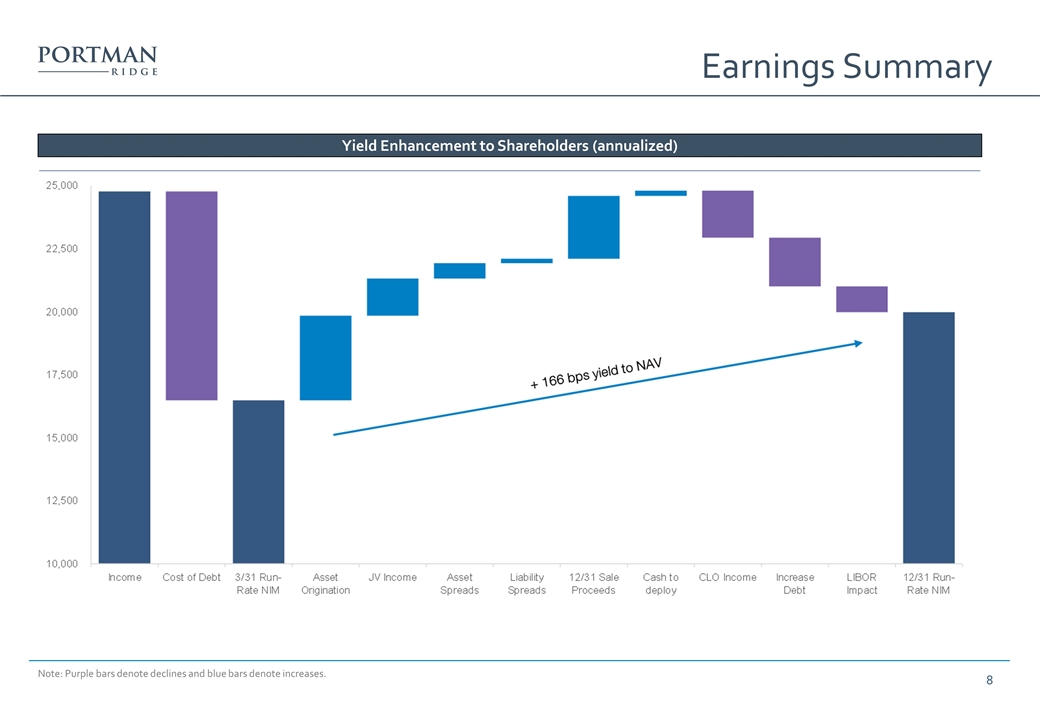
Note: Purple bars denote declines and blue bars denote increases. Earnings Summary Yield Enhancement to Shareholders (annualized)
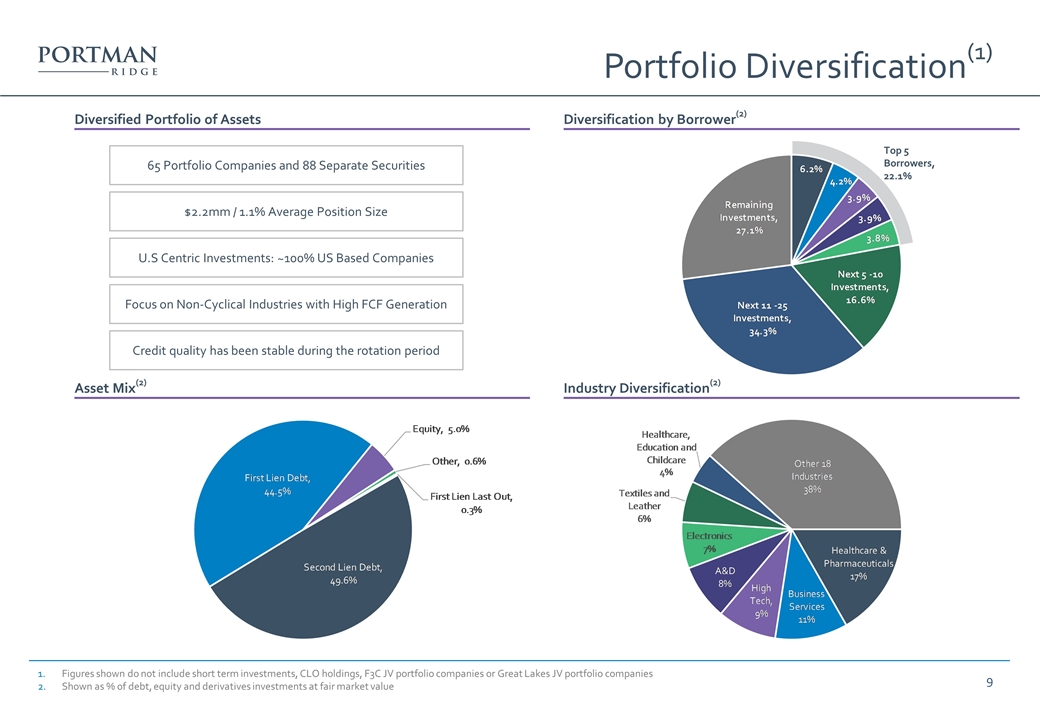
Figures shown do not include short term investments, CLO holdings, F3C JV portfolio companies or Great Lakes JV portfolio companies Shown as % of debt, equity and derivatives investments at fair market value Portfolio Diversification(1) Diversified Portfolio of Assets Diversification by Borrower(2) Asset Mix(2) Industry Diversification(2) 65 Portfolio Companies and 88 Separate Securities $2.2mm / 1.1% Average Position Size U.S Centric Investments: ~100% US Based Companies Focus on Non-Cyclical Industries with High FCF Generation Credit quality has been stable during the rotation period Top 5 Borrowers, 22.1%
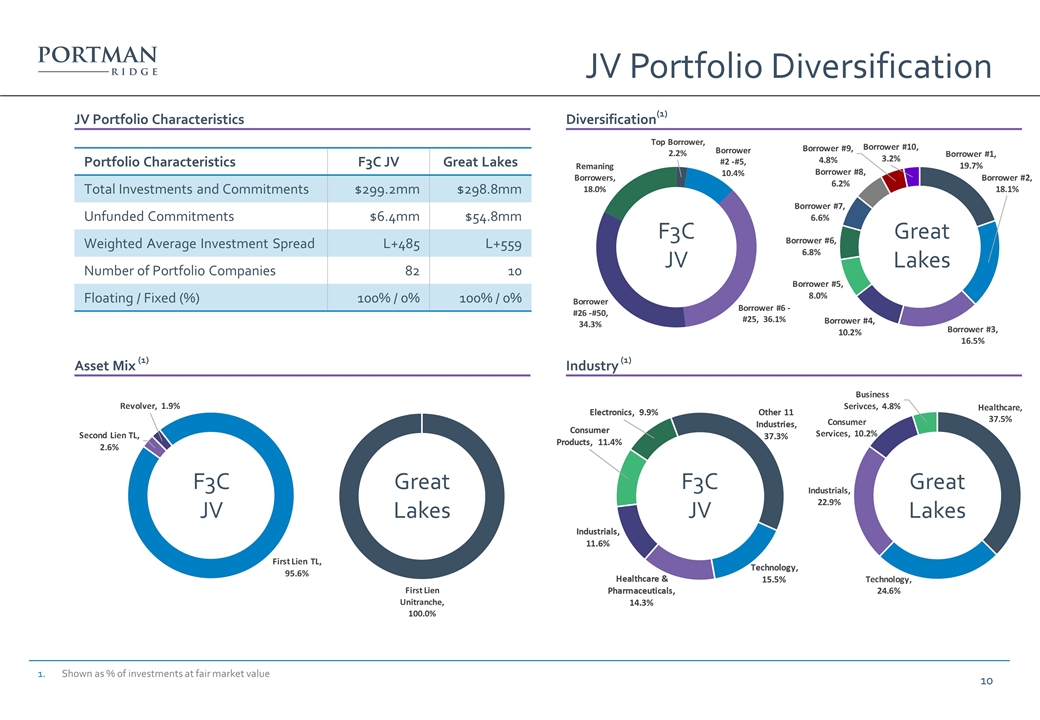
Shown as % of investments at fair market value JV Portfolio Diversification JV Portfolio Characteristics Diversification(1) Asset Mix (1) Industry (1) Portfolio Characteristics F3C JV Great Lakes Total Investments and Commitments $299.2mm $298.8mm Unfunded Commitments $6.4mm $54.8mm Weighted Average Investment Spread L+485 L+559 Number of Portfolio Companies 82 10 Floating / Fixed (%) 100% / 0% 100% / 0% F3C JV Great Lakes F3C JV Great Lakes F3C JV Great Lakes

Appendix
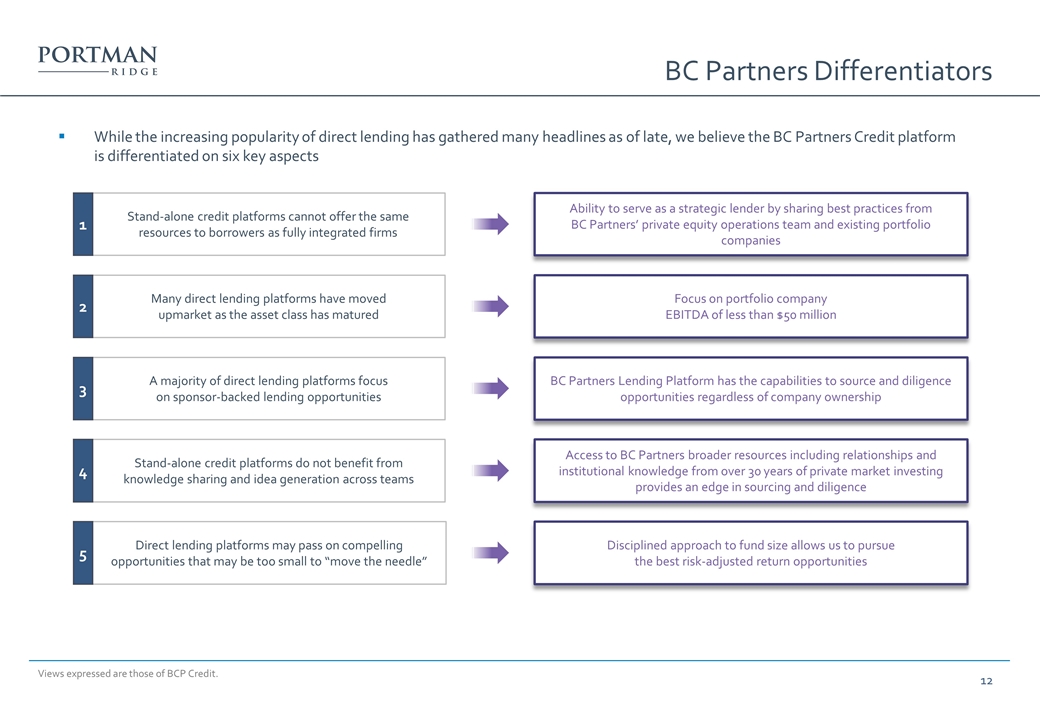
Views expressed are those of BCP Credit. BC Partners Differentiators While the increasing popularity of direct lending has gathered many headlines as of late, we believe the BC Partners Credit platform is differentiated on six key aspects Disciplined approach to fund size allows us to pursue the best risk-adjusted return opportunities Direct lending platforms may pass on compelling opportunities that may be too small to “move the needle” 5 Ability to serve as a strategic lender by sharing best practices from BC Partners’ private equity operations team and existing portfolio companies Stand-alone credit platforms cannot offer the same resources to borrowers as fully integrated firms 1 BC Partners Lending Platform has the capabilities to source and diligence opportunities regardless of company ownership A majority of direct lending platforms focus on sponsor-backed lending opportunities 3 Access to BC Partners broader resources including relationships and institutional knowledge from over 30 years of private market investing provides an edge in sourcing and diligence Stand-alone credit platforms do not benefit from knowledge sharing and idea generation across teams 4 Focus on portfolio company EBITDA of less than $50 million Many direct lending platforms have moved upmarket as the asset class has matured 2
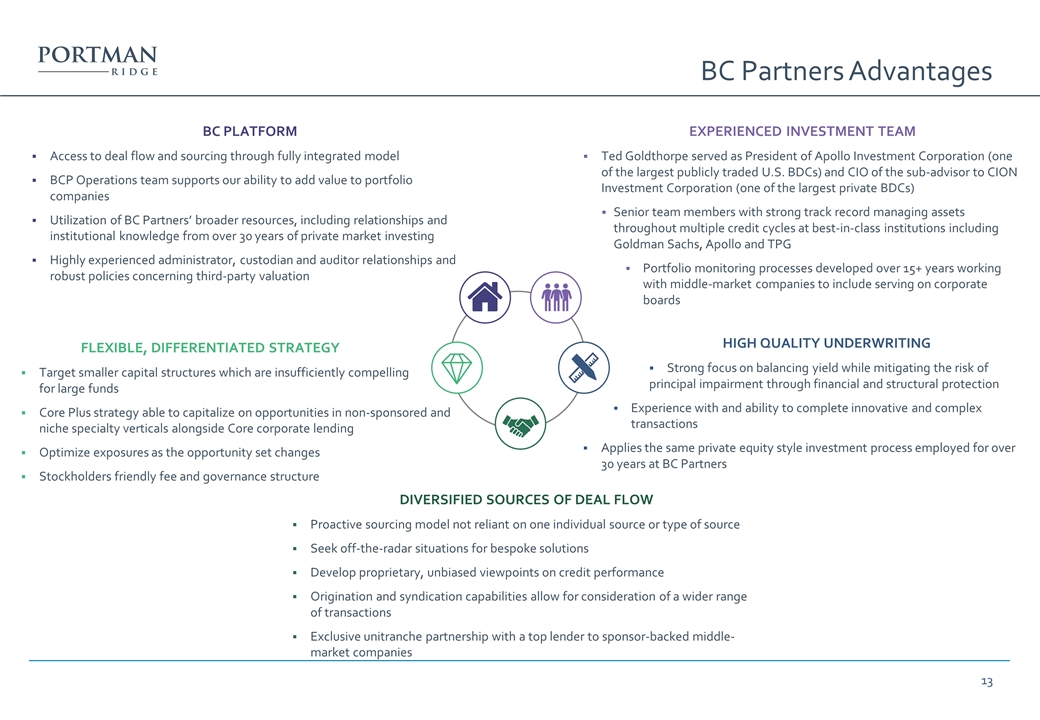
BC PLATFORM Access to deal flow and sourcing through fully integrated model BCP Operations team supports our ability to add value to portfolio companies Utilization of BC Partners’ broader resources, including relationships and institutional knowledge from over 30 years of private market investing Highly experienced administrator, custodian and auditor relationships and robust policies concerning third-party valuation FLEXIBLE, DIFFERENTIATED STRATEGY Target smaller capital structures which are insufficiently compelling for large funds Core Plus strategy able to capitalize on opportunities in non-sponsored and niche specialty verticals alongside Core corporate lending Optimize exposures as the opportunity set changes Stockholders friendly fee and governance structure HIGH QUALITY UNDERWRITING Strong focus on balancing yield while mitigating the risk of principal impairment through financial and structural protection Experience with and ability to complete innovative and complex transactions Applies the same private equity style investment process employed for over 30 years at BC Partners DIVERSIFIED SOURCES OF DEAL FLOW Proactive sourcing model not reliant on one individual source or type of source Seek off-the-radar situations for bespoke solutions Develop proprietary, unbiased viewpoints on credit performance Origination and syndication capabilities allow for consideration of a wider range of transactions Exclusive unitranche partnership with a top lender to sponsor-backed middle-market companies EXPERIENCED INVESTMENT TEAM Ted Goldthorpe served as President of Apollo Investment Corporation (one of the largest publicly traded U.S. BDCs) and CIO of the sub-advisor to CION Investment Corporation (one of the largest private BDCs) Senior team members with strong track record managing assets throughout multiple credit cycles at best-in-class institutions including Goldman Sachs, Apollo and TPG Portfolio monitoring processes developed over 15+ years working with middle-market companies to include serving on corporate boards BC Partners Advantages
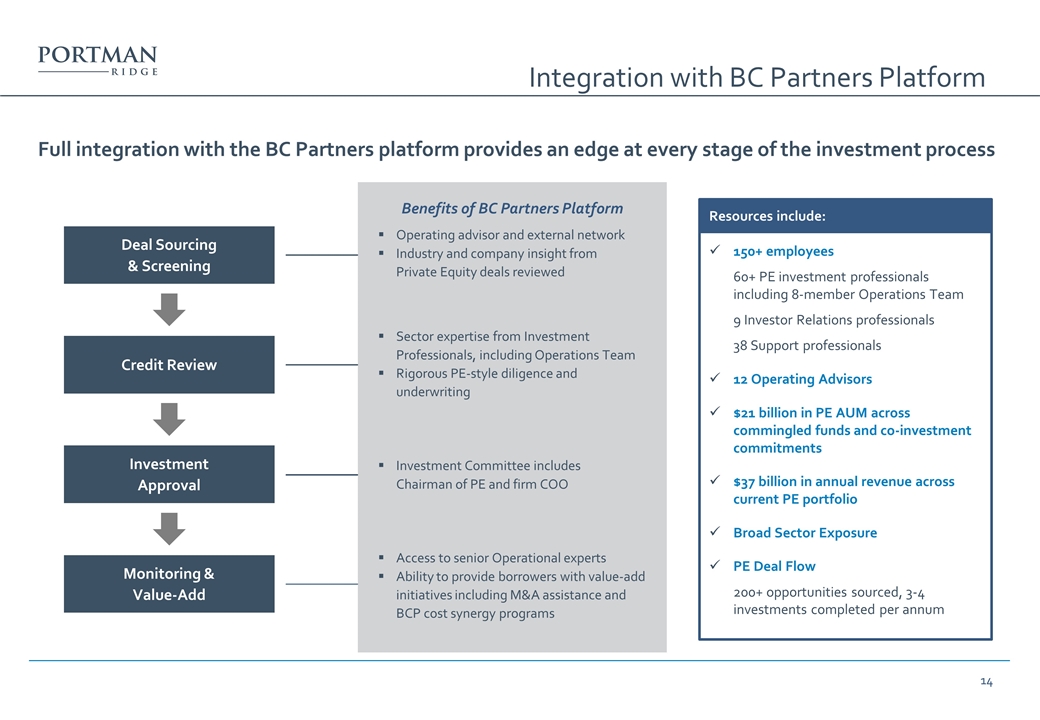
Full integration with the BC Partners platform provides an edge at every stage of the investment process 150+ employees 60+ PE investment professionals including 8-member Operations Team 9 Investor Relations professionals 38 Support professionals 12 Operating Advisors $21 billion in PE AUM across commingled funds and co-investment commitments $37 billion in annual revenue across current PE portfolio Broad Sector Exposure PE Deal Flow 200+ opportunities sourced, 3-4 investments completed per annum Resources include: Access to senior Operational experts Ability to provide borrowers with value-add initiatives including M&A assistance and BCP cost synergy programs Investment Committee includes Chairman of PE and firm COO Sector expertise from Investment Professionals, including Operations Team Rigorous PE-style diligence and underwriting Operating advisor and external network Industry and company insight from Private Equity deals reviewed Deal Sourcing & Screening Credit Review Investment Approval Monitoring & Value-Add Benefits of BC Partners Platform Integration with BC Partners Platform
