Attached files
| file | filename |
|---|---|
| 8-K - 8-K - Atlantic Capital Bancshares, Inc. | f8-k.htm |
Exhibit 99.1
| Investor Presentation | Q4 2019 atlanticcapitalbank.com NASDAQ TICKER: ACBI |

| 2 This presentation contains forward-looking statements within the meaning of section 27A of the Securities Act of 1933, as amended, and section 21E of the Securities Exchange Act of 1934, as amended. These forward-looking statements reflect our current views with respect to, among other things, future events and our financial performance. These statements are often, but not always, made through the use of words or phrases such as “may,” “should,” “could,” “predict,” “potential,” “believe,” “will likely result,” “expect,” “continue,” “will,” “anticipate,” “seek,” “estimate,” “target,” “intend,” “plan,” “projection,” “would” and “outlook,” or the negative version of those words or other comparable of a future or forward-looking nature. These forward-looking statements are not historical facts, and are based on current expectations, estimates and projections about our industry, management’s beliefs and certain assumptions made by management, many of which, by their nature, are inherently uncertain and beyond our control. Accordingly, we caution you that any such forward-looking statements are not guarantees of future performance and are subject to risks, assumptions and uncertainties that are difficult to predict. Although we believe that the expectations reflected in these forward-looking statements are reasonable as of the date made, actual results may prove to be materially different from the results expressed or implied by the forward-looking statements. The following risks, among others, could cause actual results to differ materially from the anticipated results or other expectations expressed in the forward-looking statements: our strategic decision to focus on the greater Atlanta market may not positively impact our financial condition in the expected timeframe, or at all; costs associated with our growth and hiring initiatives in the Atlanta market area; risks associated with increased geographic concentration, borrower concentration and concentration in commercial real estate and commercial and industrial loans resulting from our exit of the Tennessee and northwest Georgia markets and our strategic realignment; our strategic decision to increase our focus on SBA and franchise lending may expose us to additional risks associated with these types of lending, including industry concentration risks, our ability to sell the guaranteed portion of SBA loans, the impact of negative economic conditions on small businesses’ ability to repay the non-guaranteed portions of SBA loans, and changes to applicable federal regulations; risks associated with our ability to manage the planned growth of our payment processing business, including evolving regulations, security risks, and unforeseen increases in transaction volume resulting from changes in our customers’ businesses and changes in the competitive landscape for payment processing; changes in asset quality and credit risk; cost and availability of capital; customer acceptance of our products and services; customer borrowing, repayment, investment and deposit practices; the introduction, withdrawal, success and timing of business initiatives; the impact, extent, and timing of technological changes; severe catastrophic events in our geographic area; a weakening of the economies in which we conduct operations may adversely affect our operating results; the U.S. legal and regulatory framework could adversely affect the operating results of the Company; the interest rate environment may compress margins and adversely affect net interest income; our ability to anticipate or respond to interest rate changes correctly and manage interest rate risk presented through unanticipated changes in our interest rate risk position and/or short- and long-term interest rates; changes in trade, monetary and fiscal policies of various governmental bodies and central banks could affect the economic environment in which we operate; our ability to determine accurate values of certain assets and liabilities; adverse developments in securities, public debt, and capital markets, including changes in market liquidity and volatility; unanticipated changes in our liquidity position, including but not limited to our ability to enter the financial markets to manage and respond to any changes to our liquidity position; the impact of the transition from LIBOR and our ability to adequately manage such transition; adequacy of our risk management program; increased competitive pressure due to consolidation in the financial services industry; risks related to security breaches, cybersecurity attacks, and other significant disruptions in our information technology systems; and other risks and factors identified in our most recent annual report on Form 10-K and our other reports filed with, or furnished to, the Securities and Exchange Commission from time to time. Statements included in this presentation include non-GAAP financial measures and should be read along with the accompanying tables, which provide a reconciliation of non-GAAP financial measures to GAAP financial measures. Atlantic Capital management uses non-GAAP financial measures, including:(i) taxable equivalent net interest income, (ii) taxable equivalent net interest margin, and (iii) tangible book value per share. Management believes that non-GAAP financial measures provide a greater understanding of ongoing performance and operations, and enhance comparability with prior periods. Non-GAAP financial measures should not be considered as an alternative to any measure of performance or financial condition as determined in accordance with GAAP, and investors should consider Atlantic Capital’s performance and financial condition as reported under GAAP and all other relevant information when assessing the performance or financial condition of the Company. Non-GAAP financial measures have limitations as analytical tools, and investors should not consider them in isolation or as a substitute for analysis of the results or financial condition as reported under GAAP. Non-GAAP financial measures may not be comparable to non-GAAP financial measures presented by other companies. Forward-Looking Statements Disclaimer and Non-GAAP Financial Information |
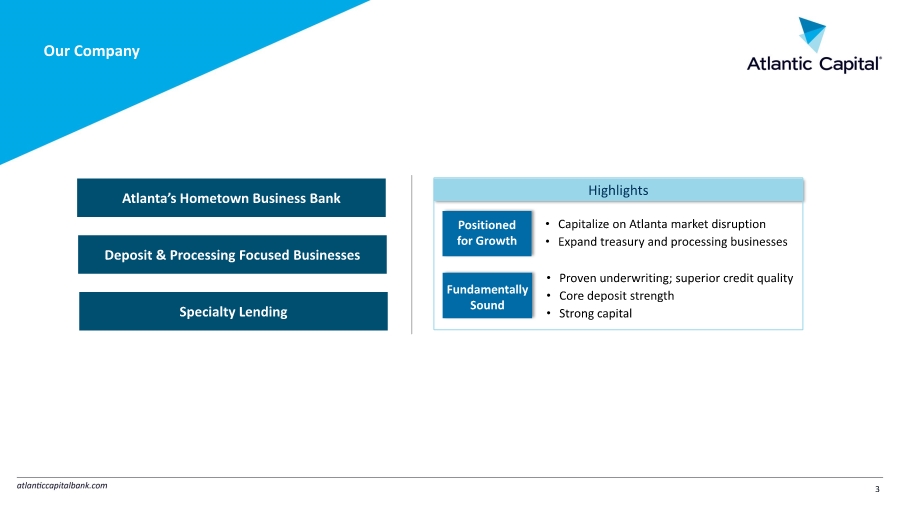
| 3 Our Company Atlanta’s Hometown Business Bank • Proven underwriting; superior credit quality • Core deposit strength • Strong capital • Capitalize on Atlanta market disruption • Expand treasury and processing businesses Highlights Fundamentally Sound Positioned for Growth Specialty Lending Deposit & Processing Focused Businesses |
| We Fuel Prosperity WE ARE A team of talented, experienced, and entrepreneurial bankers WE SERVE Clients who value high-touch relationships and deep expertise WE WIN With creativity, expertise, teamwork, humility, and confidence |

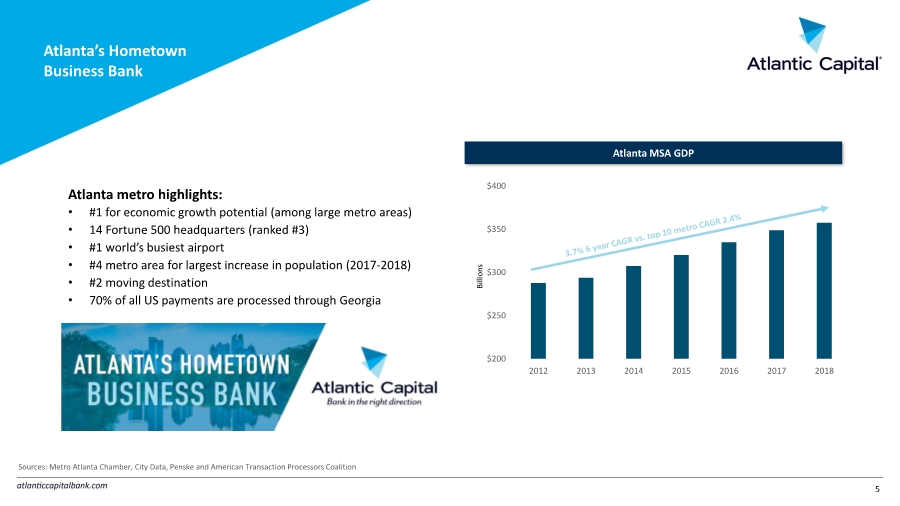
| 5 Atlanta’s Hometown Business Bank Atlanta metro highlights: •#1 for economic growth potential (among large metro areas) • 14 Fortune 500 headquarters (ranked #3) •#1 world’s busiest airport •#4 metro area for largest increase in population (2017-2018) •#2 moving destination • 70% of all US payments are processed through Georgia Sources: Metro Atlanta Chamber, City Data, Penske and American Transaction Processors Coalition $200 $250 $300 $350 $400 2012 2013 2014 2015 2016 2017 2018 Atlanta MSA GDP Billions |
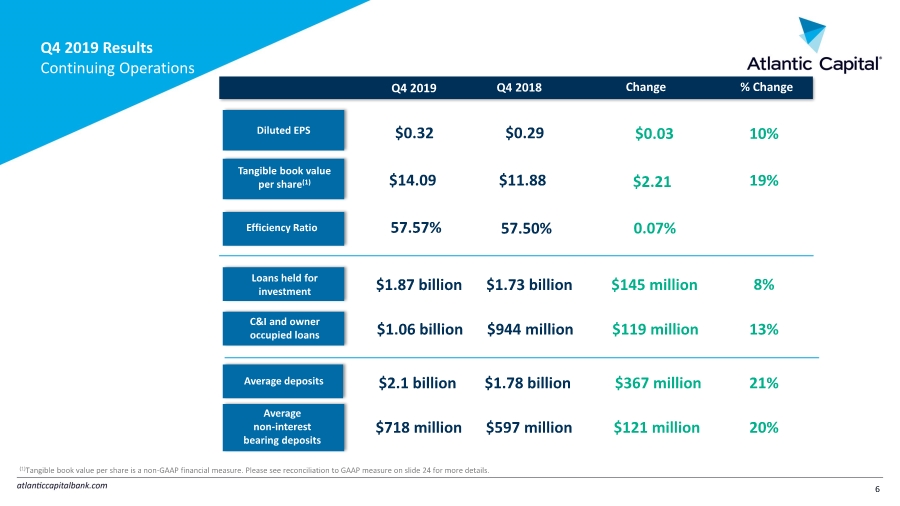
| 6 Q4 2019 Results Continuing Operations Diluted EPS Average non-interest bearing deposits Average deposits Q4 2018 Q4 2019 Change Tangible book value per share(1) $718 million $597 million $121 million $2.1 billion $1.78 billion $367 million $0.32 $0.29 $0.03 $14.09 $11.88 $2.21 Loans held for investment Efficiency Ratio 57.57% 57.50% 0.07% $1.87 billion $1.73 billion $145 million C&I and owner occupied loans $1.06 billion $944 million $119 million (1)Tangible book value per share is a non-GAAP financial measure. Please see reconciliation to GAAP measure on slide 24 for more details. % Change 10% 8% 13% 20% 21% 19% |
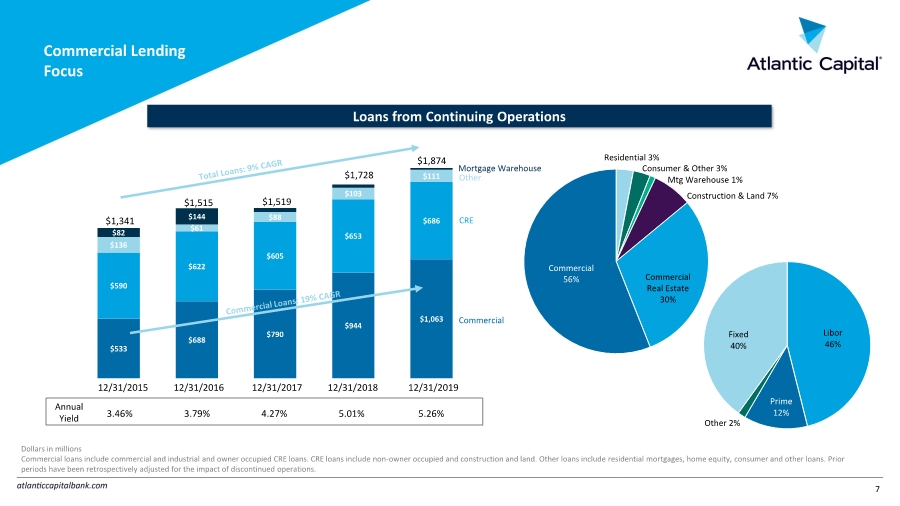
| Commercial Lending Focus Loans from Continuing Operations Annual Yield $533 $688 $790 $944 $1,063 $590 $622 $605 $653 $686 $136 $61 $88 $103 $111 $82 $144 $1,341 $1,519 Commercial 56% Residential 3% Mtg Warehouse 1% Construction & Land 7% Commercial Real Estate 30% Consumer & Other 3% Commercial CRE Other Mortgage Warehouse 3.46% 3.79% 4.27% 5.01% 5.26% $1,515 $1,728 Dollars in millions Commercial loans include commercial and industrial and owner occupied CRE loans. CRE loans include non-owner occupied and construction and land. Other loans include residential mortgages, home equity, consumer and other loans. Prior periods have been retrospectively adjusted for the impact of discontinued operations. $1,874 12/31/2015 12/31/2016 12/31/2017 12/31/2018 12/31/2019 Libor 46% Prime 12% Other 2% Fixed 40% 7 |
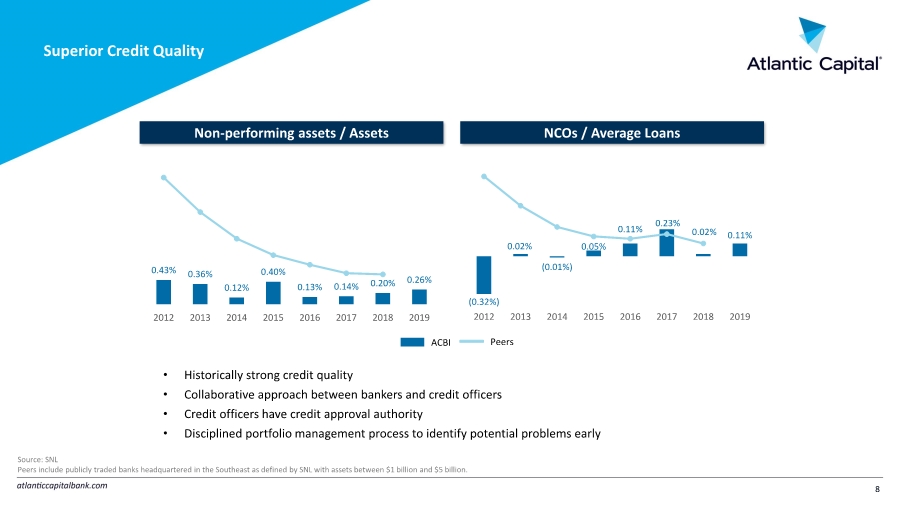
| Superior Credit Quality Non-performing assets / Assets NCOs / Average Loans ACBI Peers • Historically strong credit quality • Collaborative approach between bankers and credit officers • Credit officers have credit approval authority • Disciplined portfolio management process to identify potential problems early Source: SNL Peers include publicly traded banks headquartered in the Southeast as defined by SNL with assets between $1 billion and $5 billion. 0.43% 0.36% 0.12% 0.40% 0.13% 0.14% 0.20% 0.26% 2012 2013 2014 2015 2016 2017 2018 2019 (0.32%) 0.02% (0.01%) 0.05% 0.11% 0.23% 0.02% 0.11% 2012 2013 2014 2015 2016 2017 2018 2019 8 |
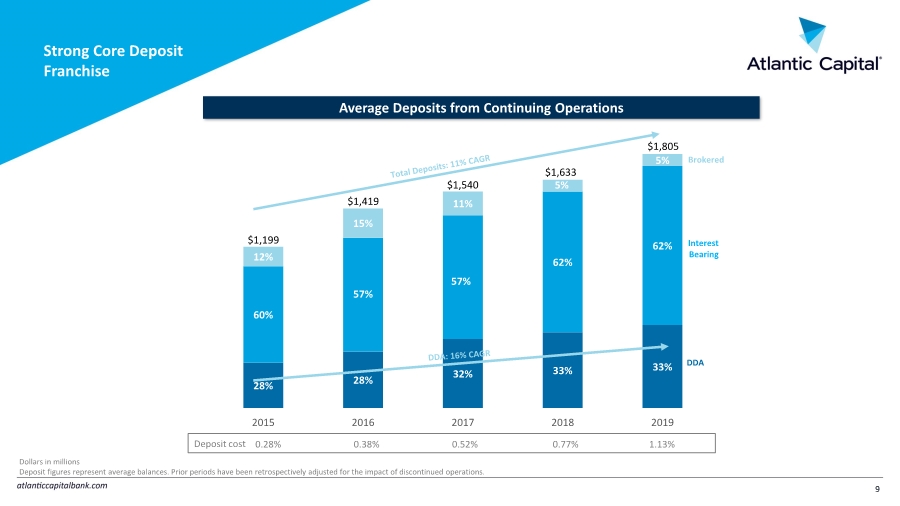
| Strong Core Deposit Franchise Average Deposits from Continuing Operations Dollars in millions Deposit figures represent average balances. Prior periods have been retrospectively adjusted for the impact of discontinued operations. 28% 28% 32% 33% 33% 60% 57% 57% 62% 62% 12% 15% 11% 5% 5% 2015 2016 2017 2018 2019 DDA Interest Bearing Brokered $1,540 $1,633 Deposit cost $1,199 $1,419 $1,805 0.28% 0.38% 0.52% 0.77% 1.13% 9 |
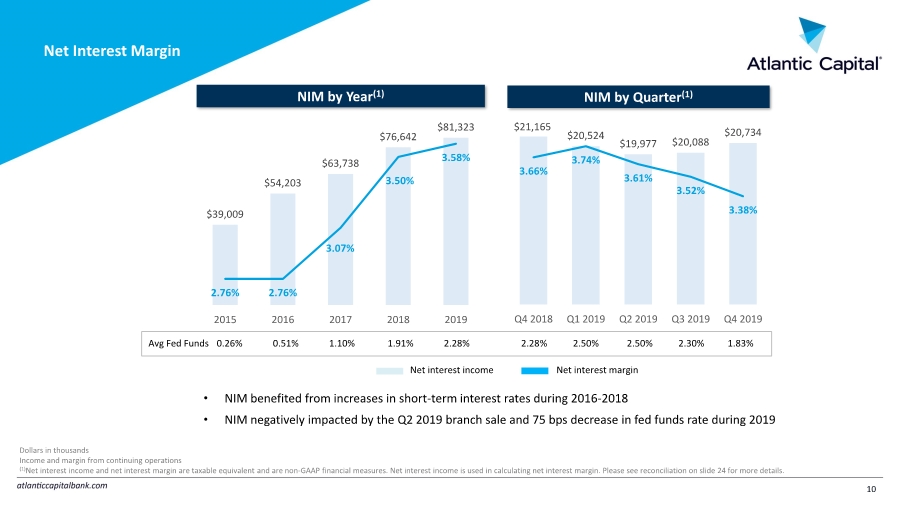
| $21,165 $20,524 $19,977 $20,088 $20,734 3.66% 3.74% 3.61% 3.52% 3.38% Q4 2018 Q1 2019 Q2 2019 Q3 2019 Q4 2019 Net Interest Margin Net interest income NIM by Year(1) NIM by Quarter(1) Net interest margin Dollars in thousands Income and margin from continuing operations (1)Net interest income and net interest margin are taxable equivalent and are non-GAAP financial measures. Net interest income is used in calculating net interest margin. Please see reconciliation on slide 24 for more details. $39,009 $54,203 $63,738 $76,642 $81,323 2.76% 2.76% 3.07% 3.50% 3.58% 2015 2016 2017 2018 2019 Avg Fed Funds 0.26% 0.51% 1.10% 1.91% 2.28% 2.28% 2.50% 2.50% 2.30% 1.83% • NIM benefited from increases in short-term interest rates during 2016-2018 • NIM negatively impacted by the Q2 2019 branch sale and 75 bps decrease in fed funds rate during 2019 10 |
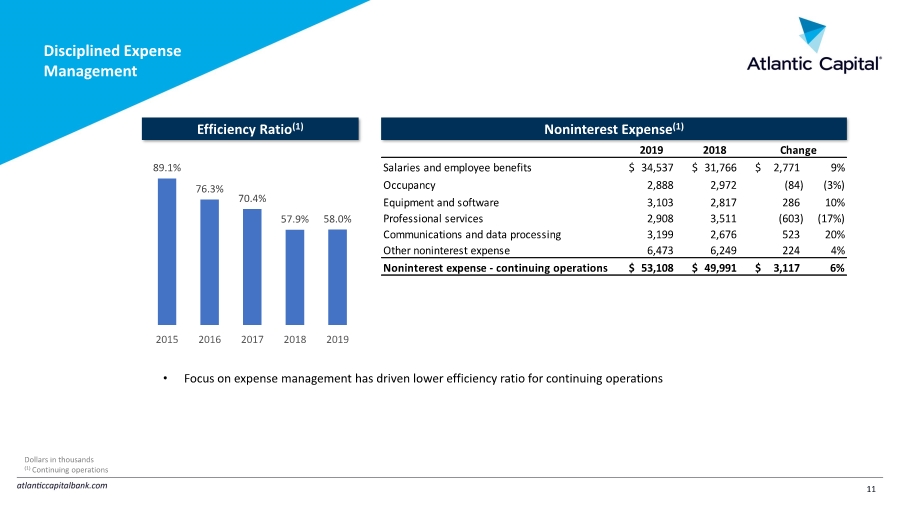
| Disciplined Expense Management Efficiency Ratio(1) Noninterest Expense(1) 89.1% 76.3% 70.4% 57.9% 58.0% 2015 2016 2017 2018 2019 • Focus on expense management has driven lower efficiency ratio for continuing operations Dollars in thousands (1) Continuing operations 2019 2018 Salaries and employee benefits 34,537 $ 31,766 $ 2,771 $ 9% Occupancy 2,888 2,972 (84) (3%) Equipment and software 3,103 2,817 286 10% Professional services 2,908 3,511 (603) (17%) Communications and data processing 3,199 2,676 523 20% Other noninterest expense 6,473 6,249 224 4% Noninterest expense - continuing operations 53,108 $ 49,991 $ 3,117 $ 6% Change 11 |
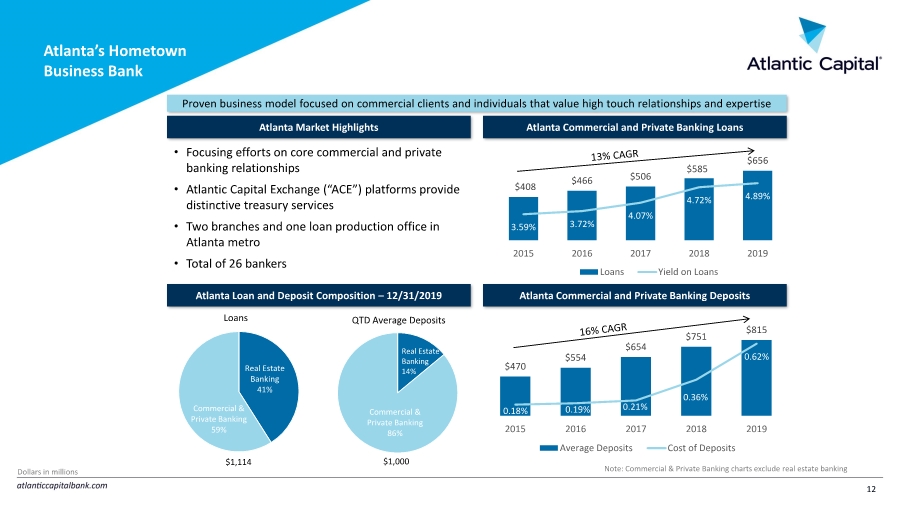
| Atlanta’s Hometown Business Bank • Focusing efforts on core commercial and private banking relationships • Atlantic Capital Exchange (“ACE”) platforms provide distinctive treasury services • Two branches and one loan production office in Atlanta metro • Total of 26 bankers Atlanta Commercial and Private Banking Loans Atlanta Commercial and Private Banking Deposits Atlanta Market Highlights Atlanta Loan and Deposit Composition – 12/31/2019 Loans QTD Average Deposits Commercial & Private Banking 87% Commercial & Private Banking 58% Note: Commercial & Private Banking charts exclude real estate banking $408 $466 $506 $585 $656 3.59% 3.72% 4.07% 4.72% 4.89% 2015 2016 2017 2018 2019 Loans Yield on Loans $470 $554 $654 $751 $815 0.18% 0.19% 0.21% 0.36% 0.62% 2015 2016 2017 2018 2019 Average Deposits Cost of Deposits Real Estate Banking 41% $1,114 $1,000 Commercial & Private Banking 86% Real Estate Banking 14% Commercial & Private Banking 59% Dollars in millions Proven business model focused on commercial clients and individuals that value high touch relationships and expertise 12 |
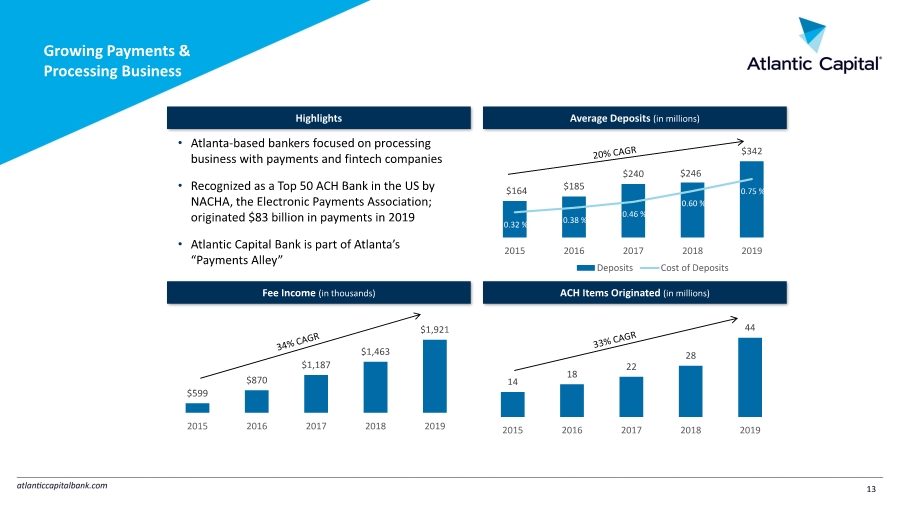
| Growing Payments & Processing Business $599 $870 $1,187 $1,463 $1,921 2015 2016 2017 2018 2019 • Atlanta-based bankers focused on processing business with payments and fintech companies • Recognized as a Top 50 ACH Bank in the US by NACHA, the Electronic Payments Association; originated $83 billion in payments in 2019 • Atlantic Capital Bank is part of Atlanta’s “Payments Alley” $164 $185 $240 $246 $342 0.32 % 0.38 % 0.46 % 0.60 % 0.75 % 2015 2016 2017 2018 2019 Deposits Cost of Deposits Average Deposits (in millions) ACH Items Originated (in millions) Highlights Fee Income (in thousands) 14 18 22 28 44 2015 2016 2017 2018 2019 13 |
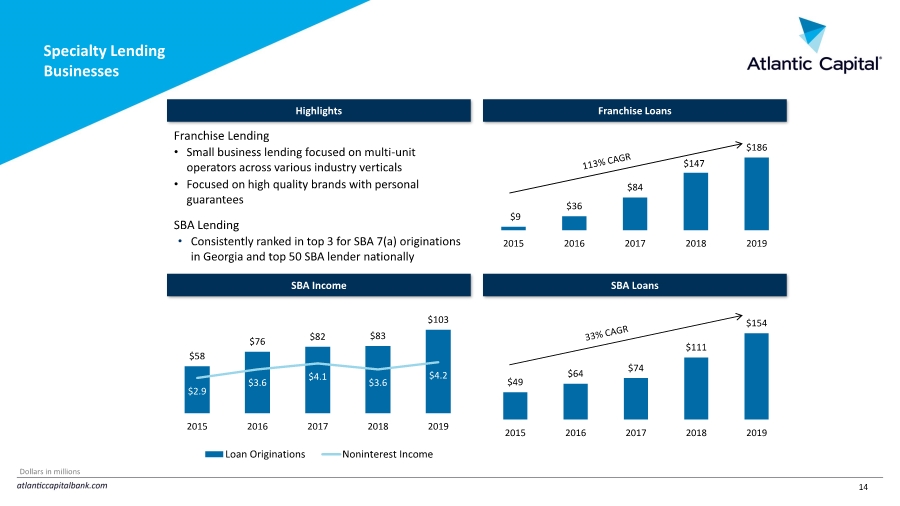
| September 29, 2019 14 Specialty Lending Businesses Franchise Lending • Small business lending focused on multi-unit operators across various industry verticals • Focused on high quality brands with personal guarantees SBA Lending • Consistently ranked in top 3 for SBA 7(a) originations in Georgia and top 50 SBA lender nationally $49 $64 $74 $111 $154 2015 2016 2017 2018 2019 $9 $36 $84 $147 $186 2015 2016 2017 2018 2019 Franchise Loans SBA Loans Highlights SBA Income Commercial & Private Banking 87% CRE 13% Commercial & Private Banking 58% $58 $76 $82 $83 $103 $2.9 $3.6 $4.1 $3.6 $4.2 2015 2016 2017 2018 2019 Loan Originations Noninterest Income Dollars in millions |
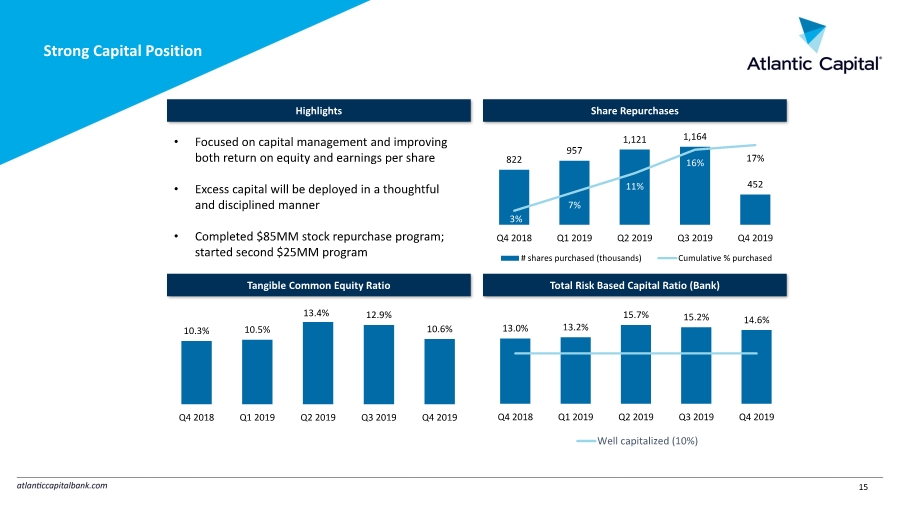
| September 29, 2019 15 822 957 1,121 1,164 452 3% 7% 11% 16% 17% Q4 2018 Q1 2019 Q2 2019 Q3 2019 Q4 2019 # shares purchased (thousands) Cumulative % purchased Strong Capital Position • Focused on capital management and improving both return on equity and earnings per share • Excess capital will be deployed in a thoughtful and disciplined manner • Completed $85MM stock repurchase program; started second $25MM program 13.0% 13.2% 15.7% 15.2% 14.6% Q4 2018 Q1 2019 Q2 2019 Q3 2019 Q4 2019 Well capitalized (10%) 10.3% 10.5% 13.4% 12.9% 10.6% Q4 2018 Q1 2019 Q2 2019 Q3 2019 Q4 2019 Share Repurchases Total Risk Based Capital Ratio (Bank) Highlights Tangible Common Equity Ratio CRE 13% |
| 2020 Priorities 16 2020 Priorities • Active capital management • Focus on operational efficiency • Capitalize on Atlanta market disruption • Expand deposit and processing businesses |
| Appendix |

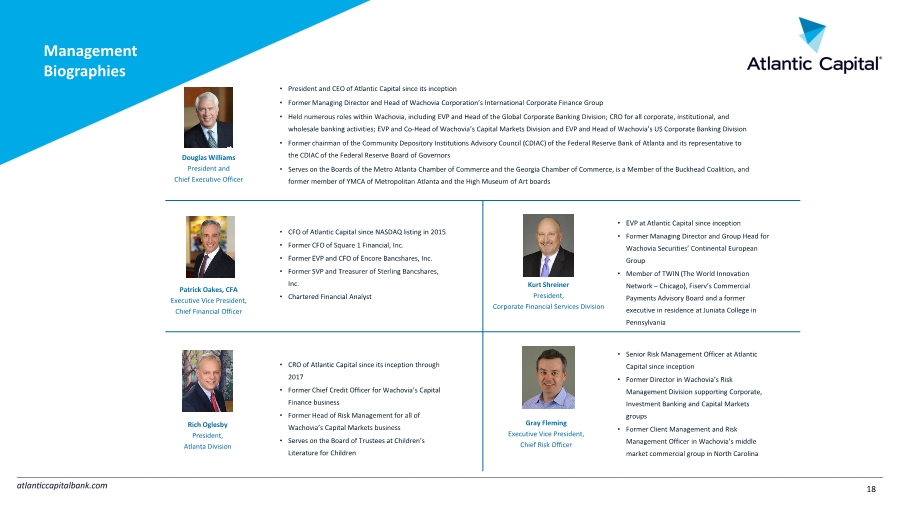
| Management Biographies 18 Douglas Williams President and Chief Executive Officer • President and CEO of Atlantic Capital since its inception • Former Managing Director and Head of Wachovia Corporation’s International Corporate Finance Group • Held numerous roles within Wachovia, including EVP and Head of the Global Corporate Banking Division; CRO for all corporate, institutional, and wholesale banking activities; EVP and Co-Head of Wachovia’s Capital Markets Division and EVP and Head of Wachovia’s US Corporate Banking Division • Former chairman of the Community Depository Institutions Advisory Council (CDIAC) of the Federal Reserve Bank of Atlanta and its representative to the CDIAC of the Federal Reserve Board of Governors • Serves on the Boards of the Metro Atlanta Chamber of Commerce and the Georgia Chamber of Commerce, is a Member of the Buckhead Coalition, and former member of YMCA of Metropolitan Atlanta and the High Museum of Art boards • CRO of Atlantic Capital since its inception through 2017 • Former Chief Credit Officer for Wachovia’s Capital Finance business • Former Head of Risk Management for all of Wachovia’s Capital Markets business • Serves on the Board of Trustees at Children’s Literature for Children • CFO of Atlantic Capital since NASDAQ listing in 2015 • Former CFO of Square 1 Financial, Inc. • Former EVP and CFO of Encore Bancshares, Inc. • Former SVP and Treasurer of Sterling Bancshares, Inc. • Chartered Financial Analyst • Senior Risk Management Officer at Atlantic Capital since inception • Former Director in Wachovia’s Risk Management Division supporting Corporate, Investment Banking and Capital Markets groups • Former Client Management and Risk Management Officer in Wachovia’s middle market commercial group in North Carolina Gray Fleming Executive Vice President, Chief Risk Officer • EVP at Atlantic Capital since inception • Former Managing Director and Group Head for Wachovia Securities’ Continental European Group • Member of TWIN (The World Innovation Network – Chicago), Fiserv’s Commercial Payments Advisory Board and a former executive in residence at Juniata College in Pennsylvania Kurt Shreiner President, Corporate Financial Services Division Patrick Oakes, CFA Executive Vice President, Chief Financial Officer Rich Oglesby President, Atlanta Division |
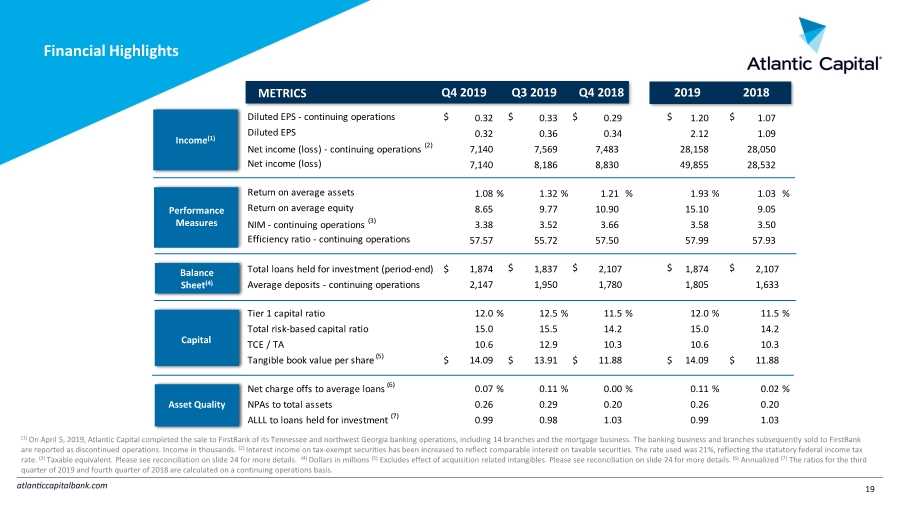
| Financial Highlights 19 Income(1) Balance Sheet(4) Capital Asset Quality METRICS Q3 2019 Q4 2019 Q4 2018 2019 2018 Performance Measures (1) On April 5, 2019, Atlantic Capital completed the sale to FirstBank of its Tennessee and northwest Georgia banking operations, including 14 branches and the mortgage business. The banking business and branches subsequently sold to FirstBank are reported as discontinued operations. Income in thousands. (2) Interest income on tax-exempt securities has been increased to reflect comparable interest on taxable securities. The rate used was 21%, reflecting the statutory federal income tax rate. (3) Taxable equivalent. Please see reconciliation on slide 24 for more details. (4) Dollars in millions (5) Excludes effect of acquisition related intangibles. Please see reconciliation on slide 24 for more details. (6) Annualized (7) The ratios for the third quarter of 2019 and fourth quarter of 2018 are calculated on a continuing operations basis. Diluted EPS - continuing operations $ 0.32 $ 0.33 $ 0.29 $ 1.20 $ 1.07 Diluted EPS 0.32 0.36 0.34 2.12 1.09 Net income (loss) - continuing operations (2) 7,140 7,569 7,483 28,158 28,050 Net income (loss) 7,140 8,186 8,830 49,855 28,532 Return on average assets 1.08 % 1.32 % 1.21 % 1.93 % 1.03 % Return on average equity 8.65 9.77 10.90 15.10 9.05 NIM - continuing operations (3) 3.38 3.52 3.66 3.58 3.50 Efficiency ratio - continuing operations 57.57 55.72 57.50 57.99 57.93 Total loans held for investment (period-end) $ 1,874 $ 1,837 $ 2,107 $ 1,874 $ 2,107 Average deposits - continuing operations 2,147 1,950 1,780 1,805 1,633 Tier 1 capital ratio 12.0 % 12.5 % 11.5 % 12.0 % 11.5 % Total risk-based capital ratio 15.0 15.5 14.2 15.0 14.2 TCE / TA 10.6 12.9 10.3 10.6 10.3 Tangible book value per share (5) $ 14.09 $ 13.91 $ 11.88 $ 14.09 $ 11.88 0.07 % 0.11 % 0.00 % 0.11 % 0.02 % NPAs to total assets 0.26 0.29 0.20 0.26 0.20 ALLL to loans held for investment (7) 0.99 0.98 1.03 0.99 1.03 Net charge offs to average loans (6) |
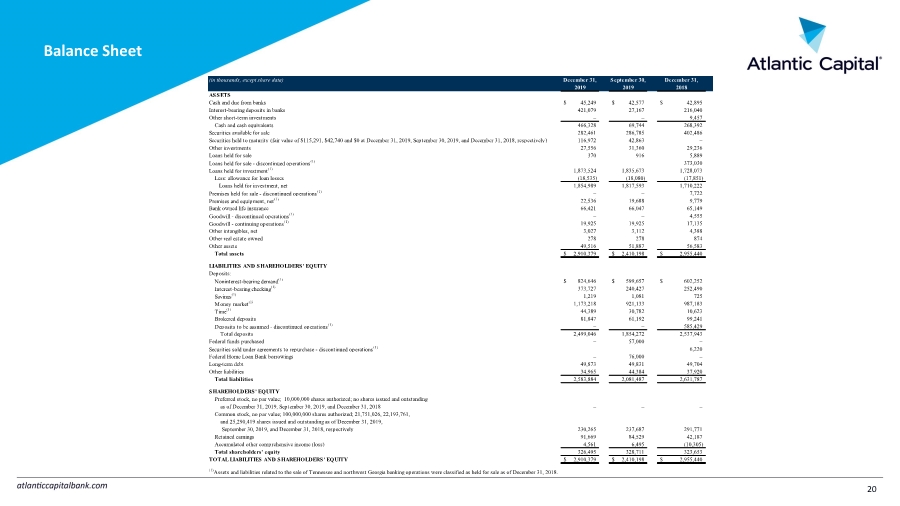
| Balance Sheet 20 (in thousands, except share data) December 31, September 30, December 31, 2019 2019 2018 ASSETS Cash and due from banks $ 45,249 $ 42,577 $ 42,895 Interest-bearing deposits in banks 421,079 27,167 216,040 Other short-term investments – – 9,457 Cash and cash equivalents 466,328 69,744 268,392 Securities available for sale 282,461 286,785 402,486 Securities held to maturity (fair value of $115,291, $42,740 and $0 at December 31, 2019, September 30, 2019, and December 31, 2018, respectively) 116,972 42,863 – Other investments 27,556 31,360 29,236 Loans held for sale 370 916 5,889 Loans held for sale - discontinued operations(1) – – 373,030 Loans held for investment(1) 1,873,524 1,835,673 1,728,073 Less: allowance for loan losses (18,535) (18,080) (17,851) Loans held for investment, net 1,854,989 1,817,593 1,710,222 Premises held for sale - discontinued operations(1) – – 7,722 Premises and equipment, net(1) 22,536 19,688 9,779 Bank owned life insurance 66,421 66,047 65,149 Goodwill - discontinued operations(1) – – 4,555 Goodwill - continuing operations(1) 19,925 19,925 17,135 Other intangibles, net 3,027 3,112 4,388 Other real estate owned 278 278 874 Other assets 49,516 51,887 56,583 Total assets $ 2,910,379 $ 2,410,198 $ 2,955,440 LIABILITIES AND SHAREHOLDERS' EQUITY Deposits: Noninterest-bearing demand(1) $ 824,646 $ 599,657 $ 602,252 Interest-bearing checking(1) 373,727 240,427 252,490 Savings(1) 1,219 1,081 725 Money market(1) 1,173,218 921,133 987,183 Time(1) 44,389 30,782 10,623 Brokered deposits 81,847 61,192 99,241 Deposits to be assumed - discontinued operations(1) – – 585,429 Total deposits 2,499,046 1,854,272 2,537,943 Federal funds purchased – 57,000 – Securities sold under agreements to repurchase - discontinued operations(1) – – 6,220 Federal Home Loan Bank borrowings – 76,000 – Long-term debt 49,873 49,831 49,704 Other liabilities 34,965 44,384 37,920 Total liabilities 2,583,884 2,081,487 2,631,787 SHAREHOLDERS' EQUITY Preferred stock, no par value; 10,000,000 shares authorized; no shares issued and outstanding as of December 31, 2019, September 30, 2019, and December 31, 2018 – – – Common stock, no par value; 100,000,000 shares authorized; 21,751,026, 22,193,761, and 25,290,419 shares issued and outstanding as of December 31, 2019, September 30, 2019, and December 31, 2018, respectively 230,265 237,687 291,771 Retained earnings 91,669 84,529 42,187 Accumulated other comprehensive income (loss) 4,561 6,495 (10,305) Total shareholders’ equity 326,495 328,711 323,653 TOTAL LIABILITIES AND SHAREHOLDERS' EQUITY $ 2,910,379 $ 2,410,198 $ 2,955,440 (1)Assets and liabilities related to the sale of Tennessee and northwest Georgia banking operations were classified as held for sale as of December 31, 2018. |
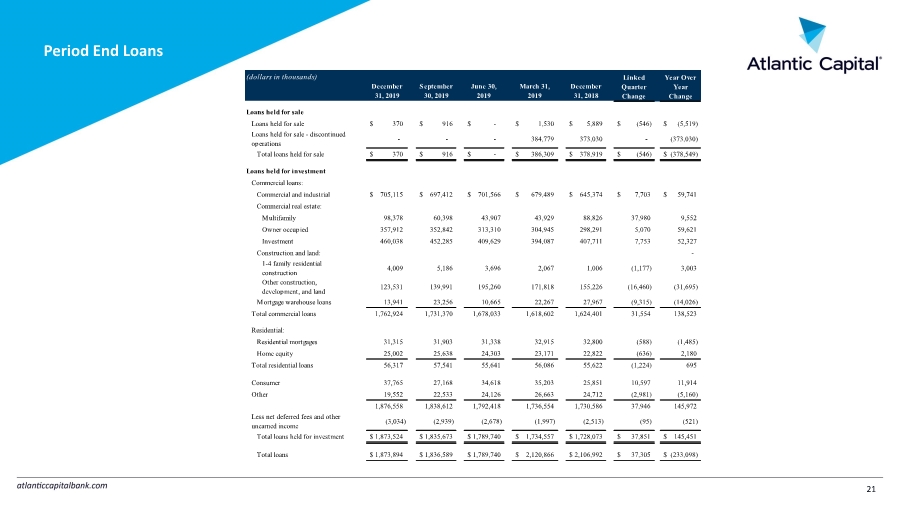
| Period End Loans 21 (dollars in thousands) December 31, 2019 September 30, 2019 June 30, 2019 March 31, 2019 December 31, 2018 Loans held for sale Loans held for sale $ 370 $ 916 $ - $ 1,530 $ 5,889 $ (546) $ (5,519) Loans held for sale - discontinued operations - - - 384,779 373,030 - (373,030) Total loans held for sale $ 370 $ 916 $ - $ 386,309 $ 378,919 $ (546) $ (378,549) Loans held for investment Commercial loans: Commercial and industrial $ 705,115 $ 697,412 $ 701,566 $ 679,489 $ 645,374 $ 7,703 $ 59,741 Commercial real estate: Multifamily 98,378 60,398 43,907 43,929 88,826 37,980 9,552 Owner occupied 357,912 352,842 313,310 304,945 298,291 5,070 59,621 Investment 460,038 452,285 409,629 394,087 407,711 7,753 52,327 Construction and land: - 1-4 family residential construction 4,009 5,186 3,696 2,067 1,006 (1,177) 3,003 Other construction, development, and land 123,531 139,991 195,260 171,818 155,226 (16,460) (31,695) Mortgage warehouse loans 13,941 23,256 10,665 22,267 27,967 (9,315) (14,026) Total commercial loans 1,762,924 1,731,370 1,678,033 1,618,602 1,624,401 31,554 138,523 Residential: Residential mortgages 31,315 31,903 31,338 32,915 32,800 (588) (1,485) Home equity 25,002 25,638 24,303 23,171 22,822 (636) 2,180 Total residential loans 56,317 57,541 55,641 56,086 55,622 (1,224) 695 Consumer 37,765 27,168 34,618 35,203 25,851 10,597 11,914 Other 19,552 22,533 24,126 26,663 24,712 (2,981) (5,160) 1,876,558 1,838,612 1,792,418 1,736,554 1,730,586 37,946 145,972 Less net deferred fees and other unearned income (3,034) (2,939) (2,678) (1,997) (2,513) (95) (521) Total loans held for investment $ 1,873,524 $ 1,835,673 $ 1,789,740 $ 1,734,557 $ 1,728,073 $ 37,851 $ 145,451 Total loans $ 1,873,894 $ 1,836,589 $ 1,789,740 $ 2,120,866 $ 2,106,992 $ 37,305 $ (233,098) Linked Quarter Change Year Over Year Change |
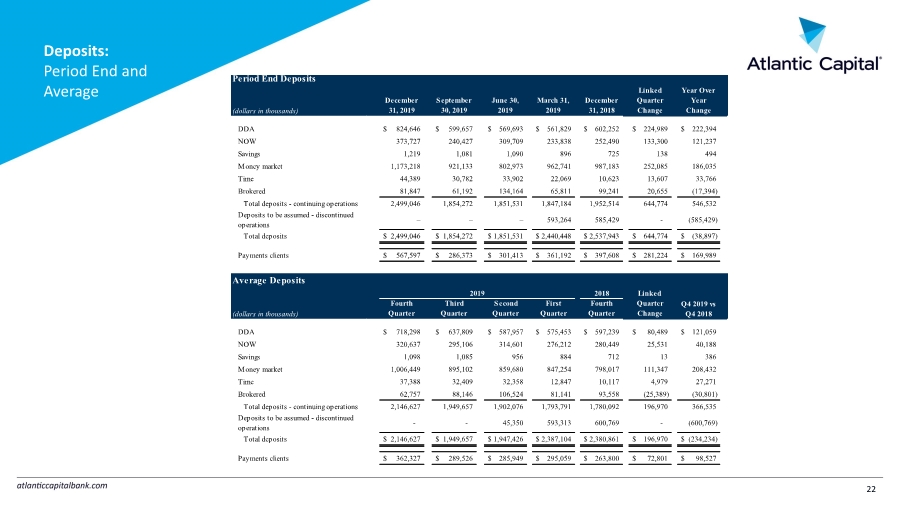
| Deposits: Period End and Average 22 Period End Deposits (dollars in thousands) December 31, 2019 September 30, 2019 June 30, 2019 March 31, 2019 December 31, 2018 Linked Quarter Change Year Over Year Change DDA $ 824,646 $ 599,657 $ 569,693 $ 561,829 $ 602,252 $ 224,989 $ 222,394 NOW 373,727 240,427 309,709 233,838 252,490 133,300 121,237 Savings 1,219 1,081 1,090 896 725 138 494 Money market 1,173,218 921,133 802,973 962,741 987,183 252,085 186,035 Time 44,389 30,782 33,902 22,069 10,623 13,607 33,766 Brokered 81,847 61,192 134,164 65,811 99,241 20,655 (17,394) Total deposits - continuing operations 2,499,046 1,854,272 1,851,531 1,847,184 1,952,514 644,774 546,532 Deposits to be assumed - discontinued operations – – – 593,264 585,429 - (585,429) Total deposits $ 2,499,046 $ 1,854,272 $ 1,851,531 $ 2,440,448 $ 2,537,943 $ 644,774 $ (38,897) Payments clients $ 567,597 $ 286,373 $ 301,413 $ 361,192 $ 397,608 $ 281,224 $ 169,989 Average Deposits Linked (dollars in thousands) Fourth Quarter Third Quarter Second Quarter First Quarter Fourth Quarter Quarter Change DDA $ 718,298 $ 637,809 $ 587,957 $ 575,453 $ 597,239 $ 80,489 $ 121,059 NOW 320,637 295,106 314,601 276,212 280,449 25,531 40,188 Savings 1,098 1,085 956 884 712 13 386 Money market 1,006,449 895,102 859,680 847,254 798,017 111,347 208,432 Time 37,388 32,409 32,358 12,847 10,117 4,979 27,271 Brokered 62,757 88,146 106,524 81,141 93,558 (25,389) (30,801) Total deposits - continuing operations 2,146,627 1,949,657 1,902,076 1,793,791 1,780,092 196,970 366,535 Deposits to be assumed - discontinued operations - - 45,350 593,313 600,769 - (600,769) Total deposits $ 2,146,627 $ 1,949,657 $ 1,947,426 $ 2,387,104 $ 2,380,861 $ 196,970 $ (234,234) Payments clients $ 362,327 $ 289,526 $ 285,949 $ 295,059 $ 263,800 $ 72,801 $ 98,527 2019 Q4 2019 vs Q4 2018 2018 |
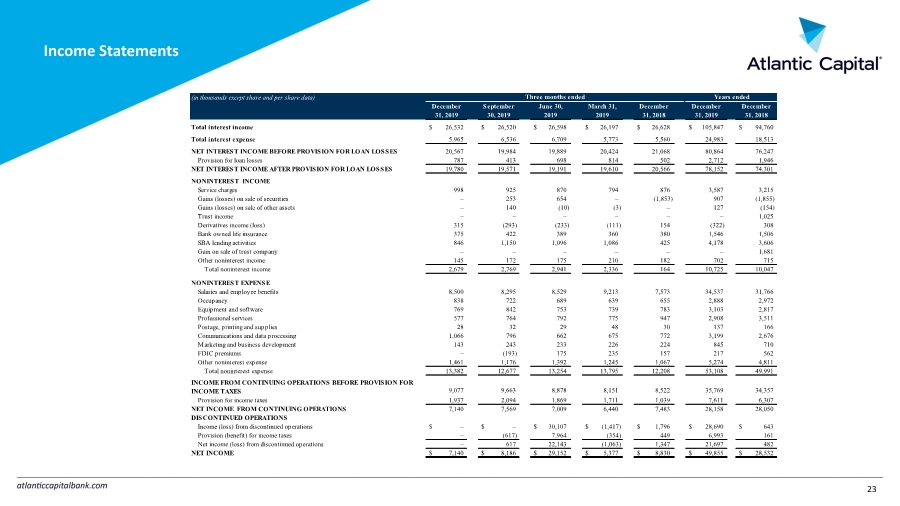
| Income Statements 23 (in thousands except share and per share data) December 31, 2019 September 30, 2019 June 30, 2019 March 31, 2019 December 31, 2018 December 31, 2019 December 31, 2018 Total interest income $ 26,532 $ 26,520 $ 26,598 $ 26,197 $ 26,628 $ 105,847 $ 94,760 Total interest expense 5,965 6,536 6,709 5,773 5,560 24,983 18,513 NET INTEREST INCOME BEFORE PROVISION FOR LOAN LOSSES 20,567 19,984 19,889 20,424 21,068 80,864 76,247 Provision for loan losses 787 413 698 814 502 2,712 1,946 NET INTEREST INCOME AFTER PROVISION FOR LOAN LOSSES 19,780 19,571 19,191 19,610 20,566 78,152 74,301 NONINTEREST INCOME Service charges 998 925 870 794 876 3,587 3,215 Gains (losses) on sale of securities – 253 654 – (1,853) 907 (1,855) Gains (losses) on sale of other assets – 140 (10) (3) – 127 (154) Trust income – – – – – – 1,025 Derivatives income (loss) 315 (293) (233) (111) 154 (322) 308 Bank owned life insurance 375 422 389 360 380 1,546 1,506 SBA lending activities 846 1,150 1,096 1,086 425 4,178 3,606 Gain on sale of trust company – – – – – – 1,681 Other noninterest income 145 172 175 210 182 702 715 Total noninterest income 2,679 2,769 2,941 2,336 164 10,725 10,047 NONINTEREST EXPENSE Salaries and employee benefits 8,500 8,295 8,529 9,213 7,573 34,537 31,766 Occupancy 838 722 689 639 655 2,888 2,972 Equipment and software 769 842 753 739 783 3,103 2,817 Professional services 577 764 792 775 947 2,908 3,511 Postage, printing and supplies 28 32 29 48 30 137 166 Communications and data processing 1,066 796 662 675 772 3,199 2,676 Marketing and business development 143 243 233 226 224 845 710 FDIC premiums – (193) 175 235 157 217 562 Other noninterest expense 1,461 1,176 1,392 1,245 1,067 5,274 4,811 Total noninterest expense 13,382 12,677 13,254 13,795 12,208 53,108 49,991 INCOME FROM CONTINUING OPERATIONS BEFORE PROVISION FOR INCOME TAXES 9,077 9,663 8,878 8,151 8,522 35,769 34,357 Provision for income taxes 1,937 2,094 1,869 1,711 1,039 7,611 6,307 NET INCOME FROM CONTINUING OPERATIONS 7,140 7,569 7,009 6,440 7,483 28,158 28,050 DISCONTINUED OPERATIONS Income (loss) from discontinued operations $ – $ – $ 30,107 $ (1,417) $ 1,796 $ 28,690 $ 643 Provision (benefit) for income taxes – (617) 7,964 (354) 449 6,993 161 Net income (loss) from discontinued operations – 617 22,143 (1,063) 1,347 21,697 482 NET INCOME $ 7,140 $ 8,186 $ 29,152 $ 5,377 $ 8,830 $ 49,855 $ 28,532 Years ended Three months ended |
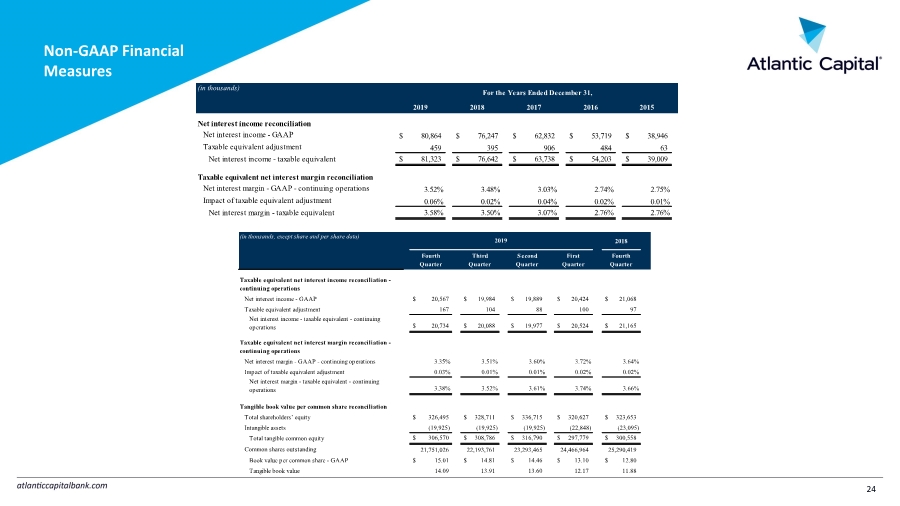
| Non-GAAP Financial Measures 24 (in thousands) 2019 2018 2017 2016 2015 Net interest income reconciliation Net interest income - GAAP $ 80,864 $ 76,247 $ 62,832 $ 53,719 $ 38,946 Taxable equivalent adjustment 459 395 906 484 63 Net interest income - taxable equivalent $ 81,323 $ 76,642 $ 63,738 $ 54,203 $ 39,009 Taxable equivalent net interest margin reconciliation Net interest margin - GAAP - continuing operations 3.52% 3.48% 3.03% 2.74% 2.75% Impact of taxable equivalent adjustment 0.06% 0.02% 0.04% 0.02% 0.01% Net interest margin - taxable equivalent 3.58% 3.50% 3.07% 2.76% 2.76% For the Years Ended December 31, (in thousands, except share and per share data) 2018 Fourth Quarter Third Quarter Second Quarter First Quarter Fourth Quarter Taxable equivalent net interest income reconciliation - continuing operations Net interest income - GAAP $ 20,567 $ 19,984 $ 19,889 $ 20,424 $ 21,068 Taxable equivalent adjustment 167 104 88 100 97 Net interest income - taxable equivalent - continuing operations $ 20,734 $ 20,088 $ 19,977 $ 20,524 $ 21,165 Taxable equivalent net interest margin reconciliation - continuing operations Net interest margin - GAAP - continuing operations 3.35% 3.51% 3.60% 3.72% 3.64% Impact of taxable equivalent adjustment 0.03% 0.01% 0.01% 0.02% 0.02% Net interest margin - taxable equivalent - continuing operations 3.38% 3.52% 3.61% 3.74% 3.66% Tangible book value per common share reconciliation Total shareholders’ equity $ 326,495 $ 328,711 $ 336,715 $ 320,627 $ 323,653 Intangible assets (19,925) (19,925) (19,925) (22,848) (23,095) Total tangible common equity $ 306,570 $ 308,786 $ 316,790 $ 297,779 $ 300,558 Common shares outstanding 21,751,026 22,193,761 23,293,465 24,466,964 25,290,419 Book value per common share - GAAP $ 15.01 $ 14.81 $ 14.46 $ 13.10 $ 12.80 Tangible book value 14.09 13.91 13.60 12.17 11.88 2019 |
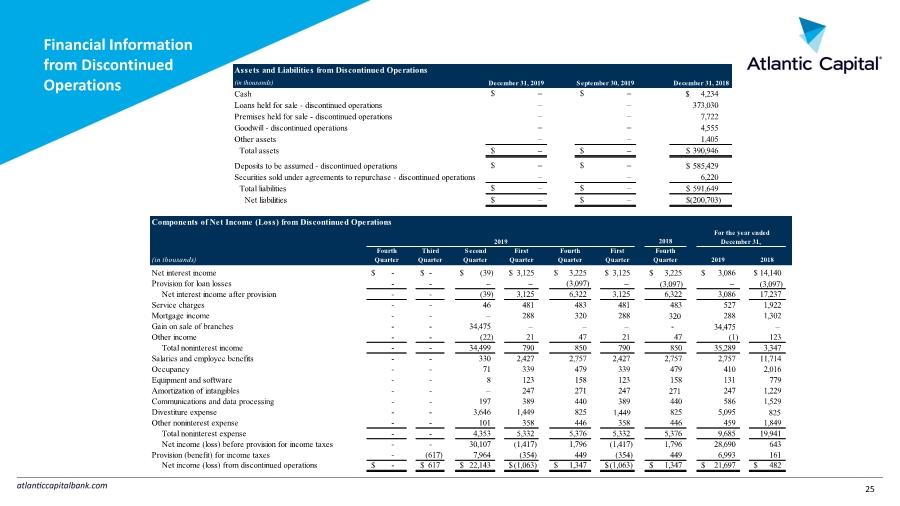
| Financial Information from Discontinued Operations 25 Assets and Liabilities from Discontinued Operations (in thousands) Cash 4,234 $ Loans held for sale - discontinued operations 373,030 Premises held for sale - discontinued operations 7,722 Goodwill - discontinued operations 4,555 Other assets 1,405 Total assets 390,946 $ Deposits to be assumed - discontinued operations 585,429 $ Securities sold under agreements to repurchase - discontinued operations 6,220 Total liabilities 591,649 $ Net liabilities (200,703) $ December 31, 2019 – $ – December 31, 2018 – $ – $ – – September 30, 2019 – – – – $ – $ – – – $ – $ – – $ – – $ – $ Components of Net Income (Loss) from Discontinued Operations 2018 (in thousands) Fourth Quarter Third Quarter Second Quarter First Quarter Fourth Quarter First Quarter Fourth Quarter 2019 2018 Net interest income - $ - $ (39) $ 3,125 $ 3,225 $ 3,125 $ 3,225 $ 3,086 $ 14,140 $ Provision for loan losses - - – – (3,097) – (3,097) – (3,097) Net interest income after provision - - (39) 3,125 6,322 3,125 6,322 3,086 17,237 Service charges - - 46 481 483 481 483 527 1,922 Mortgage income - - – 288 320 288 320 288 1,302 Gain on sale of branches - - 34,475 – – – - 34,475 – Other income - - (22) 21 47 21 47 (1) 123 Total noninterest income - - 34,499 790 850 790 850 35,289 3,347 Salaries and employee benefits - - 330 2,427 2,757 2,427 2,757 2,757 11,714 Occupancy - - 71 339 479 339 479 410 2,016 Equipment and software - - 8 123 158 123 158 131 779 Amortization of intangibles - - – 247 271 247 271 247 1,229 Communications and data processing - - 197 389 440 389 440 586 1,529 Divestiture expense - - 3,646 1,449 825 1,449 825 5,095 825 Other noninterest expense - - 101 358 446 358 446 459 1,849 Total noninterest expense - - 4,353 5,332 5,376 5,332 5,376 9,685 19,941 Net income (loss) before provision for income taxes - - 30,107 (1,417) 1,796 (1,417) 1,796 28,690 643 Provision (benefit) for income taxes - (617) 7,964 (354) 449 (354) 449 6,993 161 Net income (loss) from discontinued operations - $ 617 $ 22,143 $ (1,063) $ 1,347 $ (1,063) $ 1,347 $ 21,697 $ 482 $ For the year ended December 31, 2019 |
| Thank You |