Attached files
| file | filename |
|---|---|
| 8-K - 8-K - UNITIL CORP | d871701d8k.htm |

BofA Securities 2020 Power, Gas and Solar Leaders Conference March 4, 2020 Exhibit 99.1
SAFE HARBOR PROVISION This presentation contains “forward-looking statements” made pursuant to the safe harbor provisions of the Private Securities Litigation Reform Act of 1995. These forward-looking statements include statements regarding Unitil Corporation’s (“Unitil”) financial condition, results of operations, capital expenditures, business strategy, regulatory strategy, market opportunities, and other plans and objectives. In some cases, forward-looking statements can be identified by terminology such as “may,” “will,” “should,” “expects,” “plans,” “anticipates,” “believes,” “estimates,” “predicts,” “potential” or “continue”, the negative of such terms, or other comparable terminology. These forward-looking statements are neither promises nor guarantees, but involve risks and uncertainties that could cause the actual results to differ materially from those set forth in the forward-looking statements. Those risks and uncertainties include: Unitil’s regulatory environment (including regulations relating to climate change, greenhouse gas emissions and other environmental matters); fluctuations in the supply of, demand for, and the prices of energy commodities and transmission capacity and Unitil’s ability to recover energy commodity costs in its rates; customers’ preferred energy sources; severe storms and Unitil’s ability to recover storm costs in its rates; general economic conditions; changes in taxation; variations in weather; long-term global climate change; catastrophic events; numerous hazards and operating risks relating to Unitil’s electric and natural gas distribution activities; Unitil’s ability to retain its existing customers and attract new customers; Unitil’s energy brokering customers’ performance and energy used under multi-year energy brokering contracts; increased competition; integrity and security of operational and information systems; publicity and reputational risks; and other risks detailed in Unitil's filings with the Securities and Exchange Commission, including those appearing under the caption "Risk Factors" in Unitil's Annual Report on Form 10-K for the year ended December 31, 2019. Readers should not place undue reliance on any forward looking statements, which speak only as of the date they are made. Except as may be required by law, Unitil undertakes no obligation to update any forward-looking statements to reflect any change in Unitil’s expectations or in events, conditions, or circumstances on which any such statements may be based, or that may affect the likelihood that actual results will differ from those set forth in the forward-looking statements. PAGE
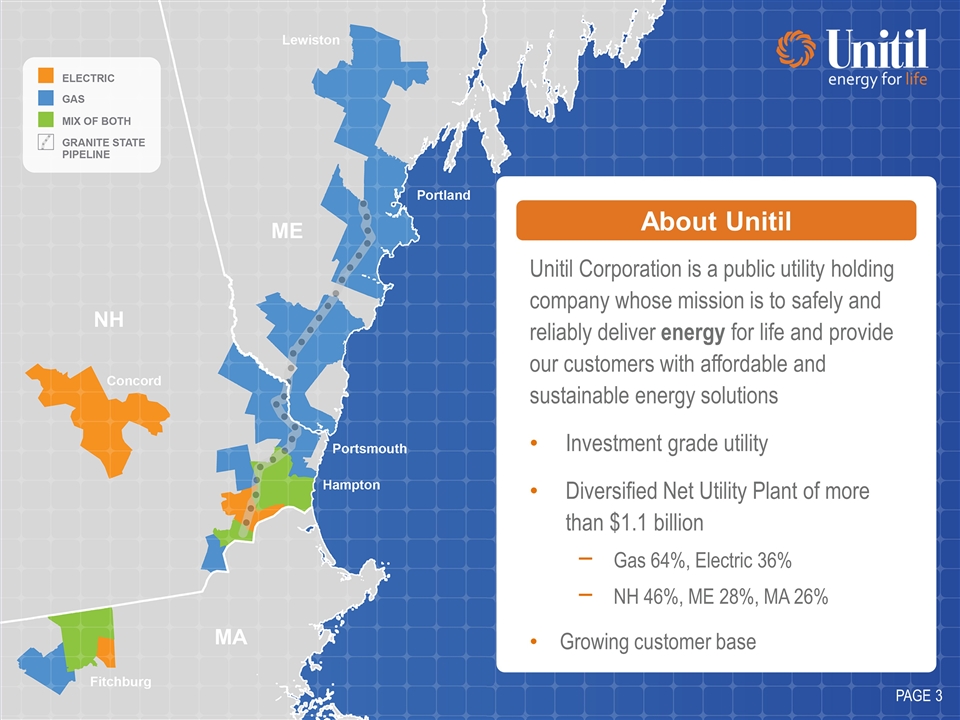
Unitil Corporation is a public utility holding company whose mission is to safely and reliably deliver energy for life and provide our customers with affordable and sustainable energy solutions Investment grade utility Diversified Net Utility Plant of more than $1.1 billion Gas 64%, Electric 36% NH 46%, ME 28%, MA 26% Growing customer base PAGE About Unitil
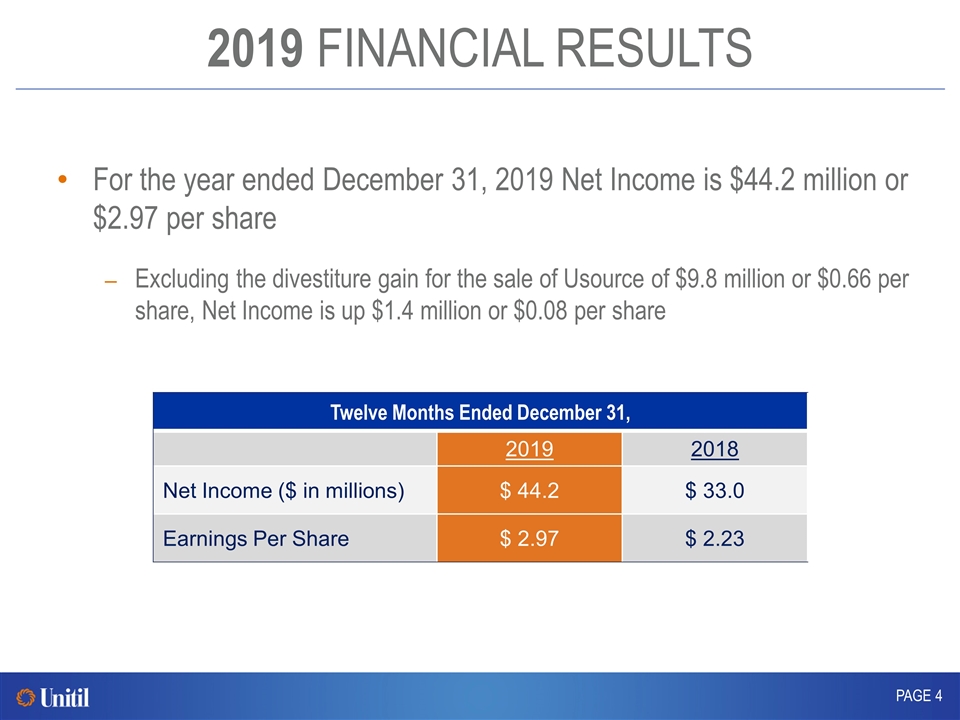
2019 FINANCIAL RESULTS For the year ended December 31, 2019 Net Income is $44.2 million or $2.97 per share Excluding the divestiture gain for the sale of Usource of $9.8 million or $0.66 per share, Net Income is up $1.4 million or $0.08 per share PAGE Twelve Months Ended December 31, 2019 2018 Net Income ($ in millions) $ 44.2 $ 33.0 Earnings Per Share $ 2.97 $ 2.23
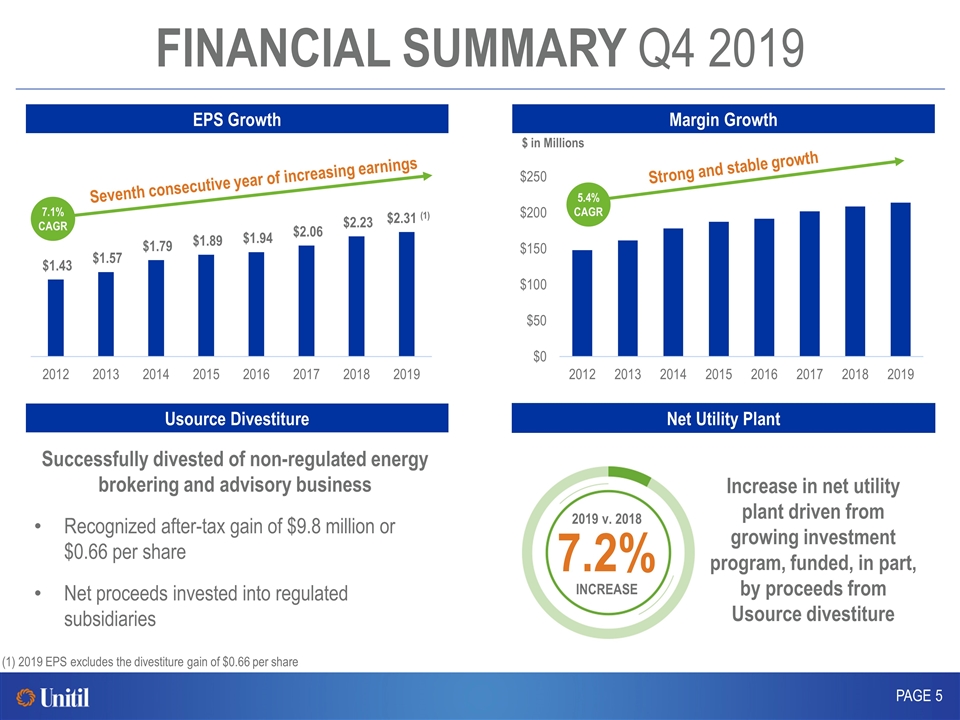
FINANCIAL SUMMARY Q4 2019 EPS Growth PAGE Seventh consecutive year of increasing earnings 7.1% CAGR (1) 2019 EPS excludes the divestiture gain of $0.66 per share Usource Divestiture Successfully divested of non-regulated energy brokering and advisory business Recognized after-tax gain of $9.8 million or $0.66 per share Net proceeds invested into regulated subsidiaries Margin Growth 5.4% CAGR Net Utility Plant 2019 v. 2018 7.2% INCREASE Increase in net utility plant driven from growing investment program, funded, in part, by proceeds from Usource divestiture $ in Millions Strong and stable growth
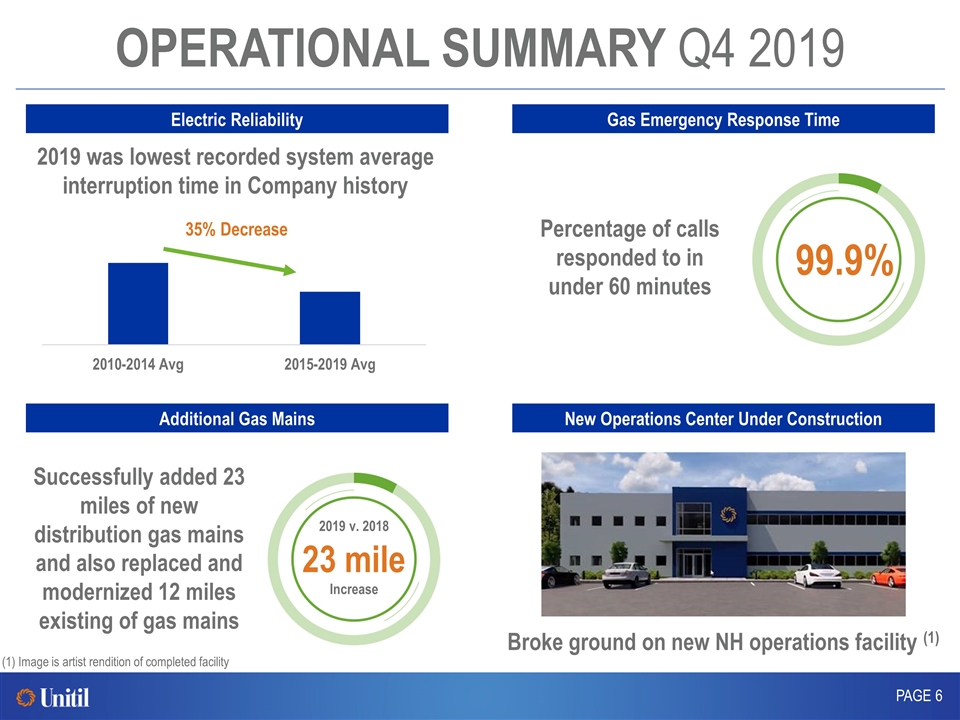
OPERATIONAL SUMMARY Q4 2019 PAGE Electric Reliability 99.9% 2019 was lowest recorded system average interruption time in Company history Percentage of calls responded to in under 60 minutes Gas Emergency Response Time Additional Gas Mains 2019 v. 2018 23 mile Increase Successfully added 23 miles of new distribution gas mains and also replaced and modernized 12 miles existing of gas mains 35% Decrease New Operations Center Under Construction Broke ground on new NH operations facility (1) (1) Image is artist rendition of completed facility
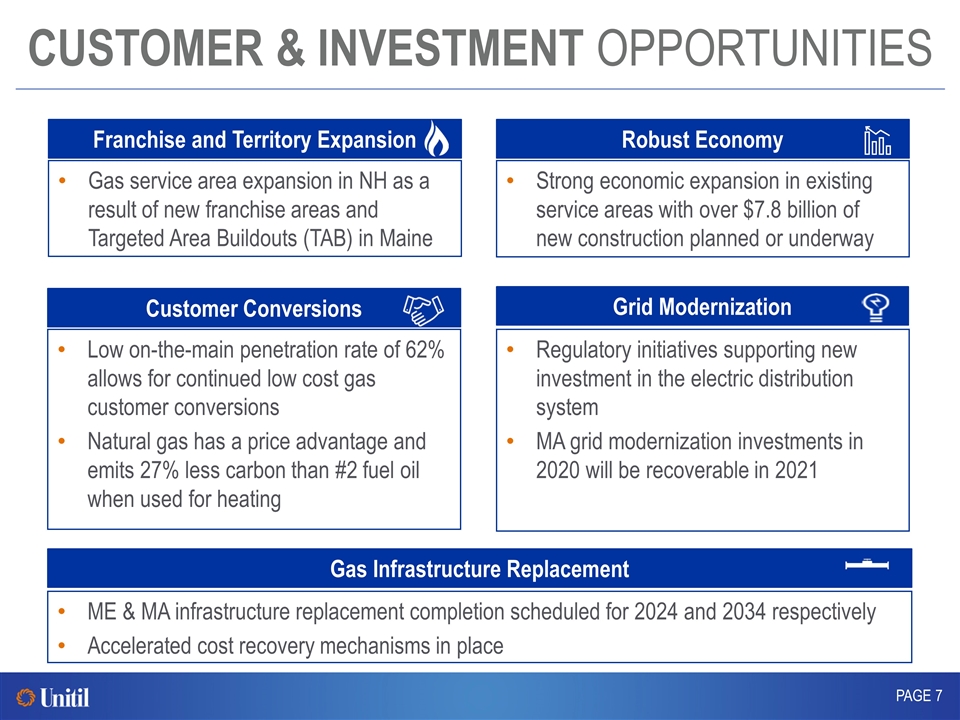
CUSTOMER & INVESTMENT OPPORTUNITIES PAGE Gas service area expansion in NH as a result of new franchise areas and Targeted Area Buildouts (TAB) in Maine Franchise and Territory Expansion Low on-the-main penetration rate of 62% allows for continued low cost gas customer conversions Natural gas has a price advantage and emits 27% less carbon than #2 fuel oil when used for heating Robust Economy Strong economic expansion in existing service areas with over $7.8 billion of new construction planned or underway Customer Conversions Regulatory initiatives supporting new investment in the electric distribution system MA grid modernization investments in 2020 will be recoverable in 2021 Grid Modernization ME & MA infrastructure replacement completion scheduled for 2024 and 2034 respectively Accelerated cost recovery mechanisms in place Gas Infrastructure Replacement
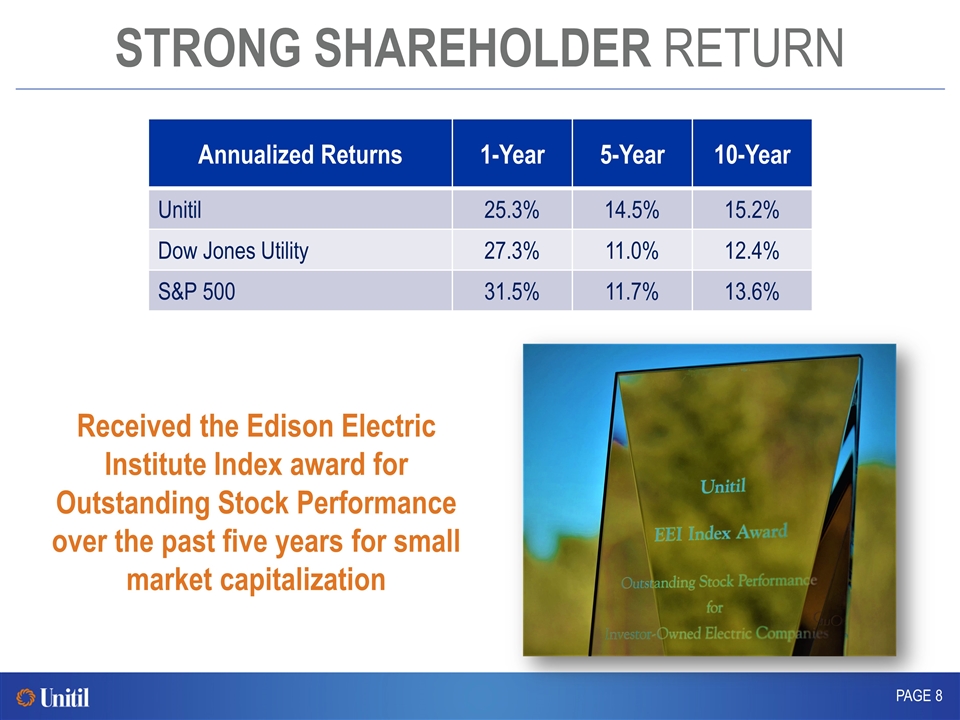
STRONG SHAREHOLDER RETURN PAGE Annualized Returns 1-Year 5-Year 10-Year Unitil 25.3% 14.5% 15.2% Dow Jones Utility 27.3% 11.0% 12.4% S&P 500 31.5% 11.7% 13.6% Received the Edison Electric Institute Index award for Outstanding Stock Performance over the past five years for small market capitalization
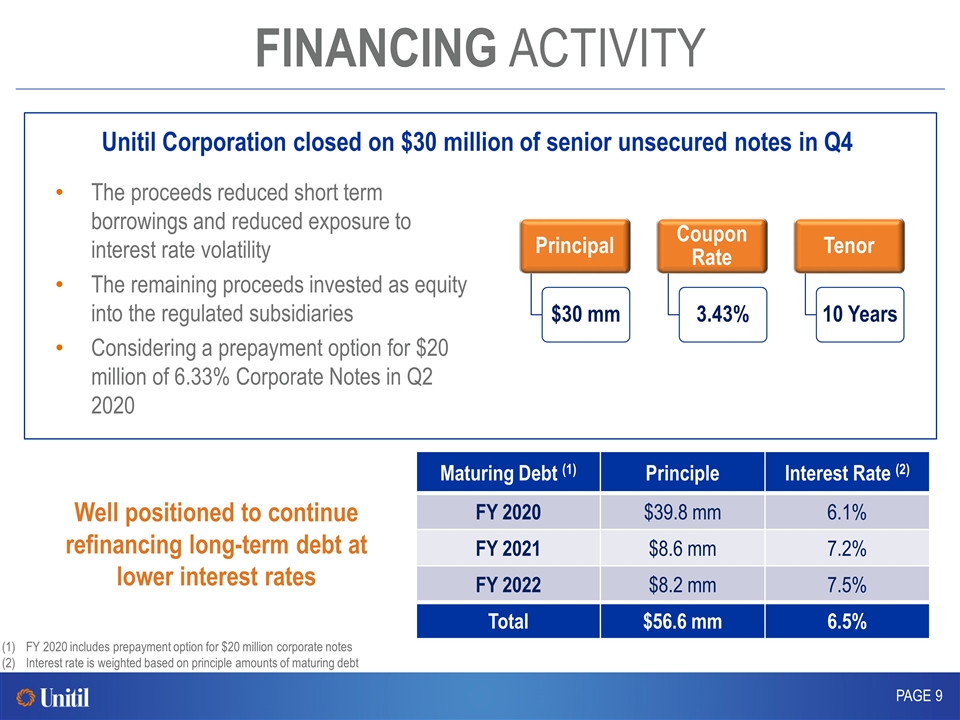
FINANCING ACTIVITY PAGE The proceeds reduced short term borrowings and reduced exposure to interest rate volatility The remaining proceeds invested as equity into the regulated subsidiaries Considering a prepayment option for $20 million of 6.33% Corporate Notes in Q2 2020 Maturing Debt (1) Principle Interest Rate (2) FY 2020 $39.8 mm 6.1% FY 2021 $8.6 mm 7.2% FY 2022 $8.2 mm 7.5% Total $56.6 mm 6.5% FY 2020 includes prepayment option for $20 million corporate notes Interest rate is weighted based on principle amounts of maturing debt Well positioned to continue refinancing long-term debt at lower interest rates Unitil Corporation closed on $30 million of senior unsecured notes in Q4 Principal $30 mm Coupon Rate 3.43% Tenor 10 Years
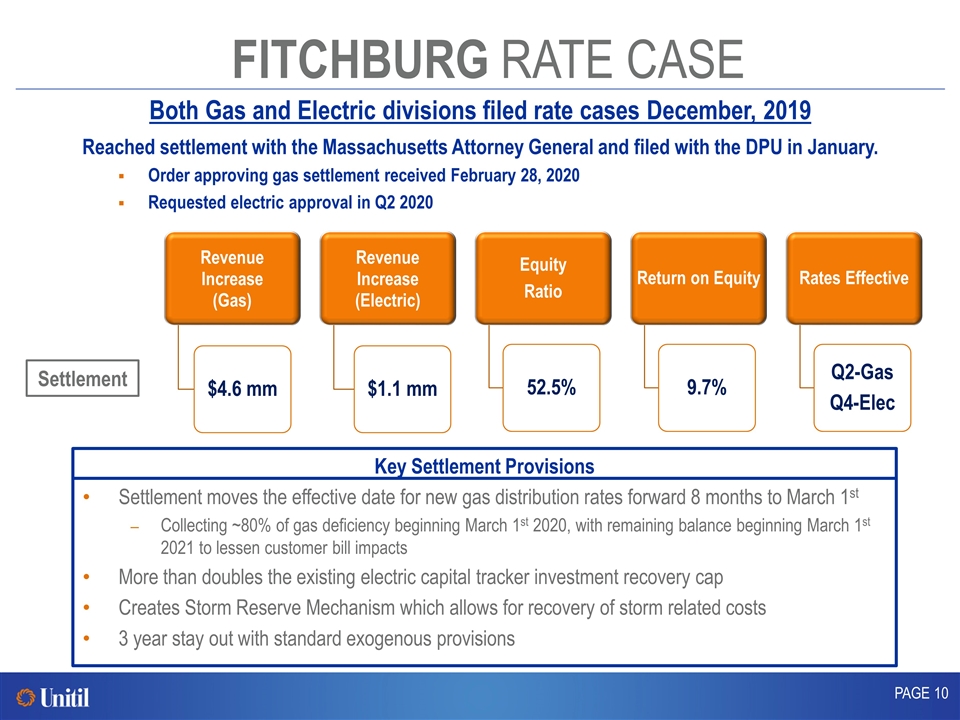
FITCHBURG RATE CASE Both Gas and Electric divisions filed rate cases December, 2019 PAGE Settlement Settlement moves the effective date for new gas distribution rates forward 8 months to March 1st Collecting ~80% of gas deficiency beginning March 1st 2020, with remaining balance beginning March 1st 2021 to lessen customer bill impacts More than doubles the existing electric capital tracker investment recovery cap Creates Storm Reserve Mechanism which allows for recovery of storm related costs 3 year stay out with standard exogenous provisions Key Settlement Provisions Reached settlement with the Massachusetts Attorney General and filed with the DPU in January. Order approving gas settlement received February 28, 2020 Requested electric approval in Q2 2020 Revenue Increase (Gas) Equity Ratio Rates Effective Revenue Increase (Electric) $4.6 mm $1.1 mm 52.5% Q2-Gas Q4-Elec Return on Equity 9.7%
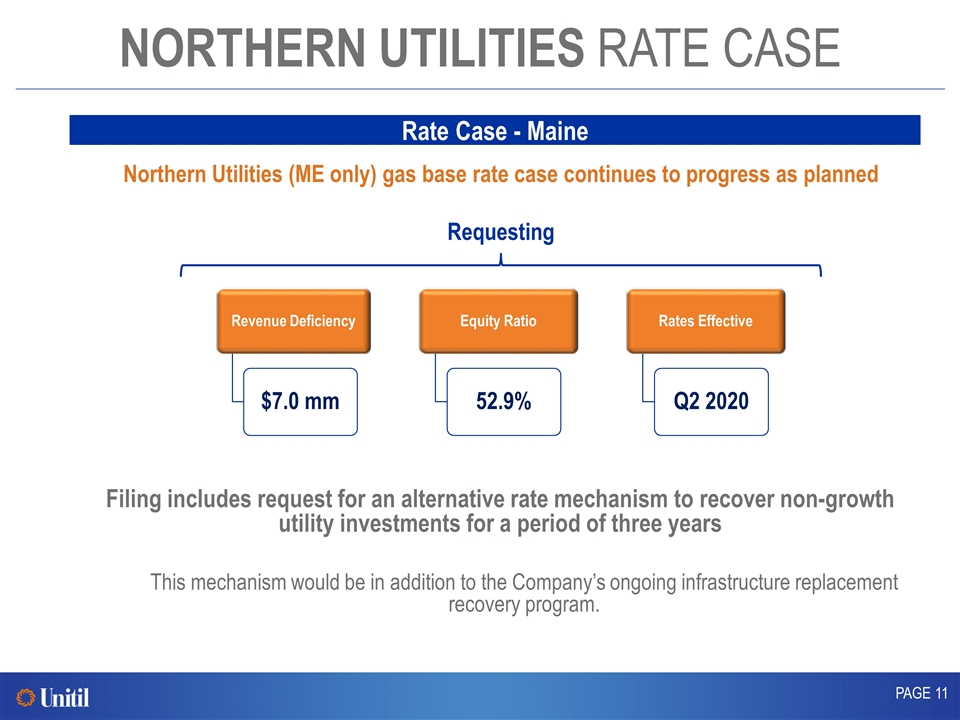
NORTHERN UTILITIES RATE CASE PAGE Rate Case - Maine Northern Utilities (ME only) gas base rate case continues to progress as planned Requesting Filing includes request for an alternative rate mechanism to recover non-growth utility investments for a period of three years This mechanism would be in addition to the Company’s ongoing infrastructure replacement recovery program. Revenue Deficiency $7.0 mm Equity Ratio 52.9% Rates Effective Q2 2020
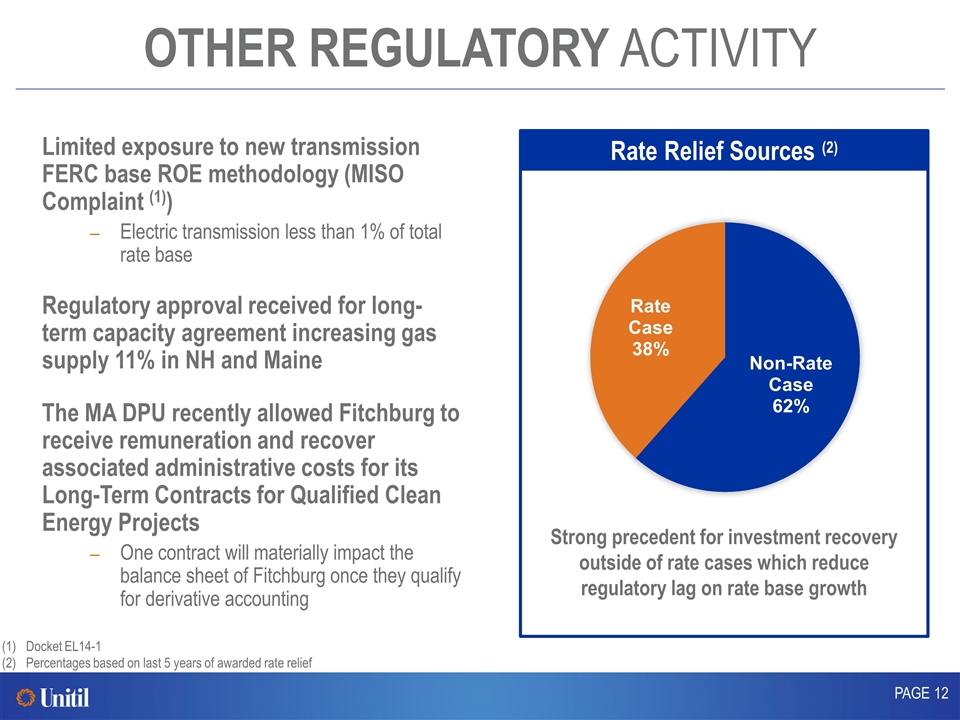
OTHER REGULATORY ACTIVITY PAGE Limited exposure to new transmission FERC base ROE methodology (MISO Complaint (1)) Electric transmission less than 1% of total rate base Regulatory approval received for long-term capacity agreement increasing gas supply 11% in NH and Maine The MA DPU recently allowed Fitchburg to receive remuneration and recover associated administrative costs for its Long-Term Contracts for Qualified Clean Energy Projects One contract will materially impact the balance sheet of Fitchburg once they qualify for derivative accounting Docket EL14-1 Percentages based on last 5 years of awarded rate relief Strong precedent for investment recovery outside of rate cases which reduce regulatory lag on rate base growth Rate Relief Sources (2)
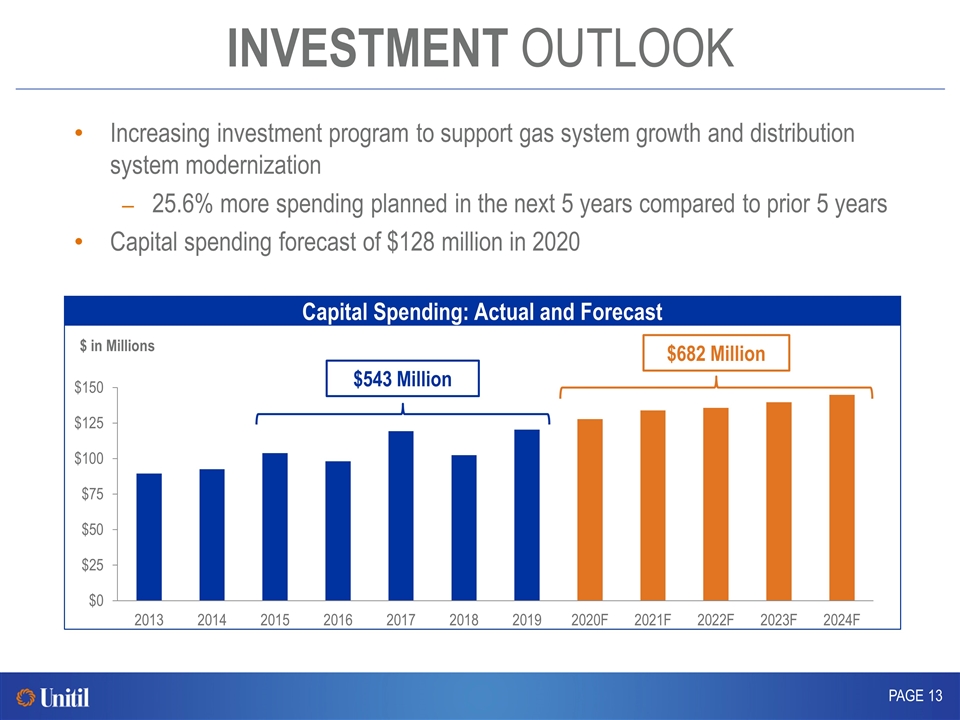
INVESTMENT OUTLOOK Increasing investment program to support gas system growth and distribution system modernization 25.6% more spending planned in the next 5 years compared to prior 5 years Capital spending forecast of $128 million in 2020 PAGE Capital Spending: Actual and Forecast $ in Millions $543 Million $682 Million
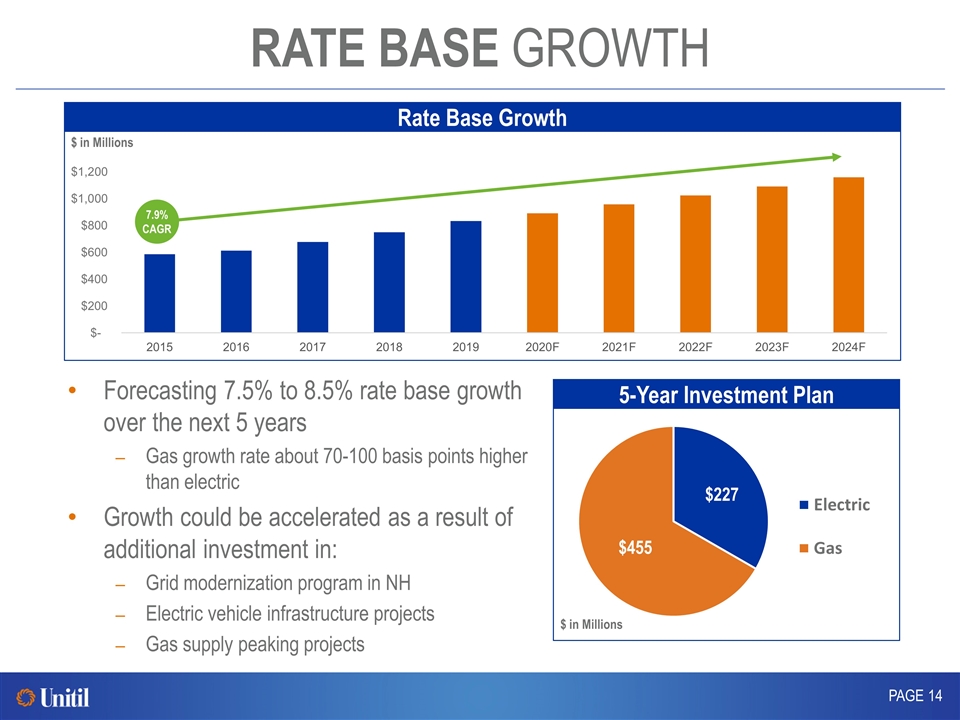
RATE BASE GROWTH PAGE Rate Base Growth $ in Millions 7.9% CAGR Forecasting 7.5% to 8.5% rate base growth over the next 5 years Gas growth rate about 70-100 basis points higher than electric Growth could be accelerated as a result of additional investment in: Grid modernization program in NH Electric vehicle infrastructure projects Gas supply peaking projects 5-Year Investment Plan $ in Millions
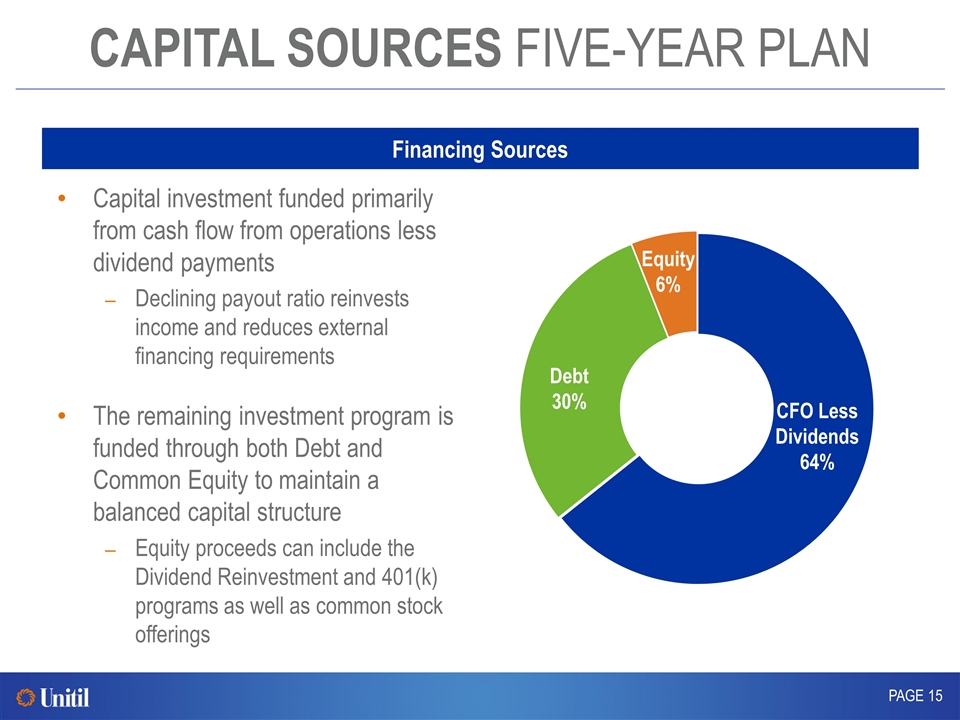
CAPITAL SOURCES FIVE-YEAR PLAN Capital investment funded primarily from cash flow from operations less dividend payments Declining payout ratio reinvests income and reduces external financing requirements The remaining investment program is funded through both Debt and Common Equity to maintain a balanced capital structure Equity proceeds can include the Dividend Reinvestment and 401(k) programs as well as common stock offerings PAGE Financing Sources Equity 6%
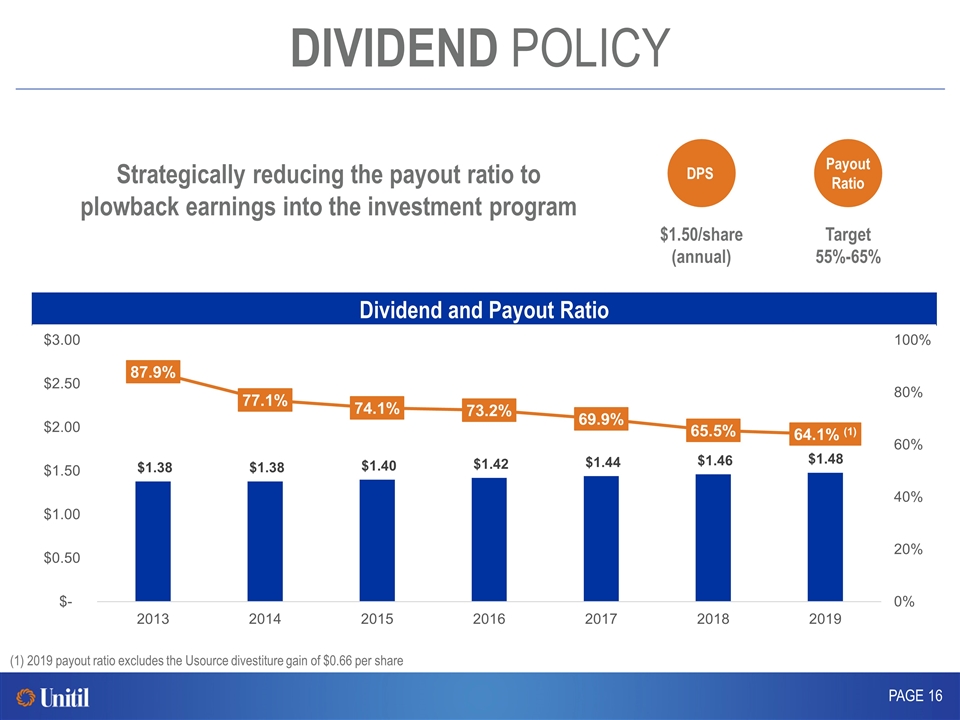
DIVIDEND POLICY Strategically reducing the payout ratio to plowback earnings into the investment program PAGE Dividend and Payout Ratio (1) 2019 payout ratio excludes the Usource divestiture gain of $0.66 per share DPS $1.50/share (annual) Target 55%-65% Payout Ratio
Regulated local distribution utility business model Growing service areas and customer base Diversified natural gas and electric operations Dividend strength Experienced management team Regulated local distribution utility business model Growing service areas and customer base Diversified natural gas and electric operations Dividend strength Experienced management team Regulated local distribution utility business model Growing service areas and customer base Diversified natural gas and electric operations Dividend strength Experienced management team KEY INVESTMENT HIGHLIGHTS PAGE Regulated local distribution utility business model Growing service areas and customer base Diversified natural gas and electric operations Dividend strength Experienced management team
APPENDIX PAGE
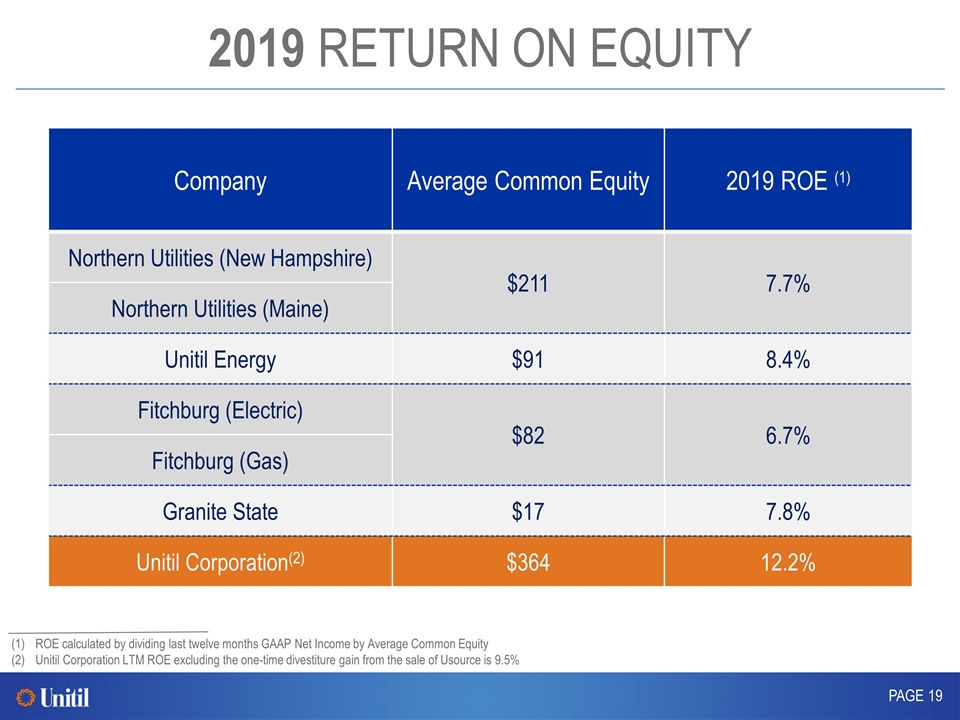
2019 RETURN ON EQUITY Company Average Common Equity 2019 ROE (1) Northern Utilities (New Hampshire) $211 7.7% Northern Utilities (Maine) Unitil Energy $91 8.4% Fitchburg (Electric) $82 6.7% Fitchburg (Gas) Granite State $17 7.8% Unitil Corporation(2) $364 12.2% PAGE ROE calculated by dividing last twelve months GAAP Net Income by Average Common Equity Unitil Corporation LTM ROE excluding the one-time divestiture gain from the sale of Usource is 9.5%
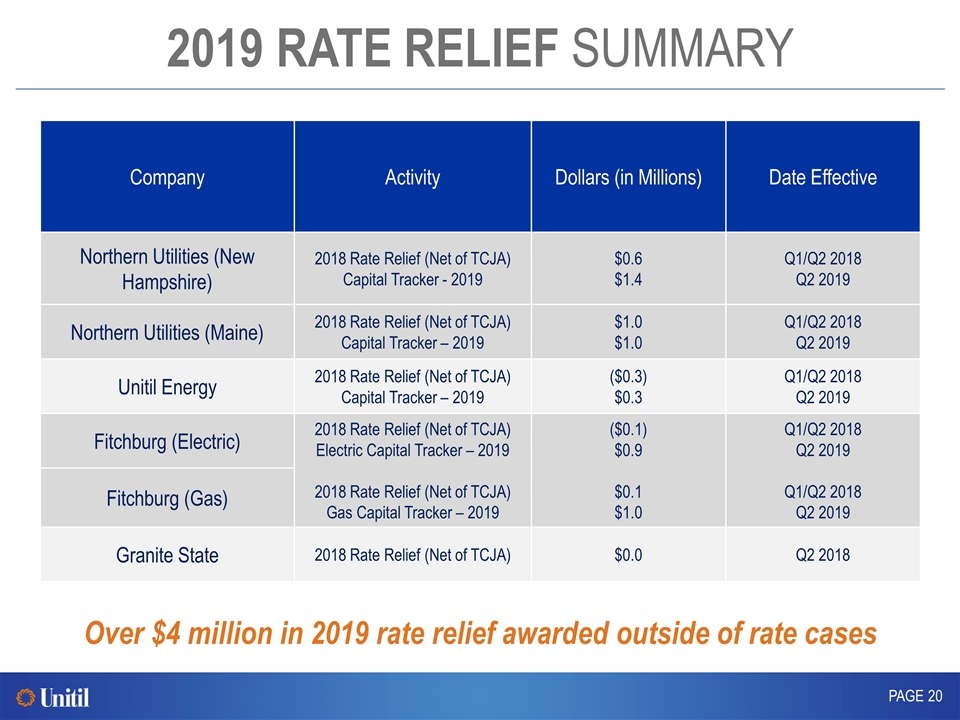
2019 RATE RELIEF SUMMARY Company Activity Dollars (in Millions) Date Effective Northern Utilities (New Hampshire) 2018 Rate Relief (Net of TCJA) Capital Tracker - 2019 $0.6 $1.4 Q1/Q2 2018 Q2 2019 Northern Utilities (Maine) 2018 Rate Relief (Net of TCJA) Capital Tracker – 2019 $1.0 $1.0 Q1/Q2 2018 Q2 2019 Unitil Energy 2018 Rate Relief (Net of TCJA) Capital Tracker – 2019 ($0.3) $0.3 Q1/Q2 2018 Q2 2019 Fitchburg (Electric) 2018 Rate Relief (Net of TCJA) Electric Capital Tracker – 2019 2018 Rate Relief (Net of TCJA) Gas Capital Tracker – 2019 ($0.1) $0.9 $0.1 $1.0 Q1/Q2 2018 Q2 2019 Q1/Q2 2018 Q2 2019 Fitchburg (Gas) Granite State 2018 Rate Relief (Net of TCJA) $0.0 Q2 2018 PAGE Over $4 million in 2019 rate relief awarded outside of rate cases
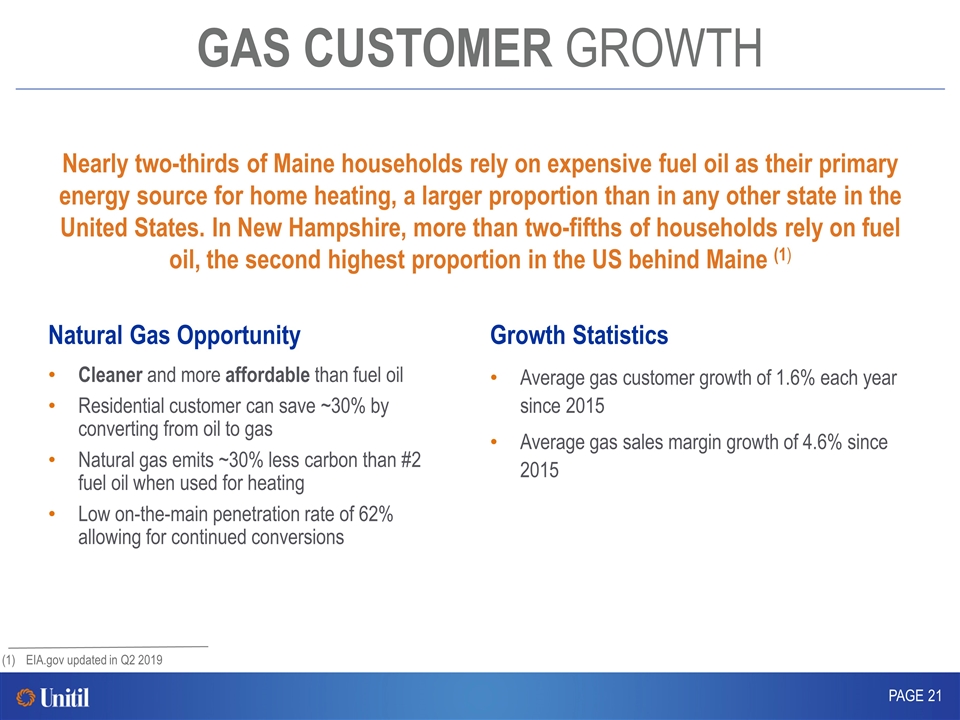
GAS CUSTOMER GROWTH Growth Statistics Average gas customer growth of 1.6% each year since 2015 Average gas sales margin growth of 4.6% since 2015 Natural Gas Opportunity Cleaner and more affordable than fuel oil Residential customer can save ~30% by converting from oil to gas Natural gas emits ~30% less carbon than #2 fuel oil when used for heating Low on-the-main penetration rate of 62% allowing for continued conversions PAGE Nearly two-thirds of Maine households rely on expensive fuel oil as their primary energy source for home heating, a larger proportion than in any other state in the United States. In New Hampshire, more than two-fifths of households rely on fuel oil, the second highest proportion in the US behind Maine (1) EIA.gov updated in Q2 2019
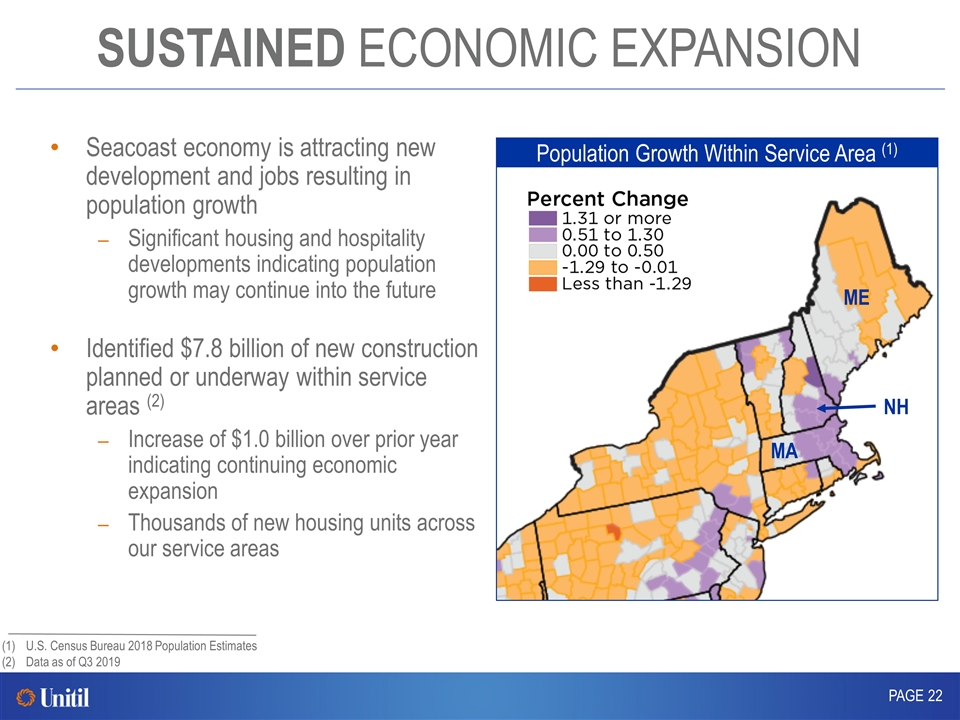
SUSTAINED ECONOMIC EXPANSION Seacoast economy is attracting new development and jobs resulting in population growth Significant housing and hospitality developments indicating population growth may continue into the future Identified $7.8 billion of new construction planned or underway within service areas (2) Increase of $1.0 billion over prior year indicating continuing economic expansion Thousands of new housing units across our service areas Population Growth Within Service Area (1) U.S. Census Bureau 2018 Population Estimates Data as of Q3 2019 ME MA NH PAGE
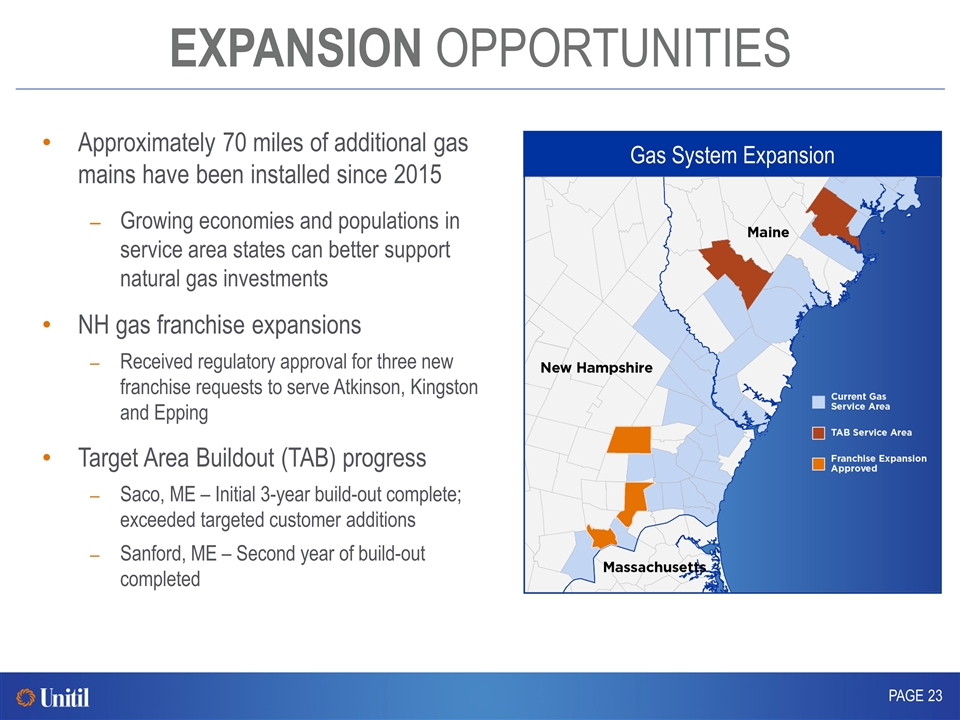
EXPANSION OPPORTUNITIES Approximately 70 miles of additional gas mains have been installed since 2015 Growing economies and populations in service area states can better support natural gas investments NH gas franchise expansions Received regulatory approval for three new franchise requests to serve Atkinson, Kingston and Epping Target Area Buildout (TAB) progress Saco, ME – Initial 3-year build-out complete; exceeded targeted customer additions Sanford, ME – Second year of build-out completed Gas System Expansion PAGE
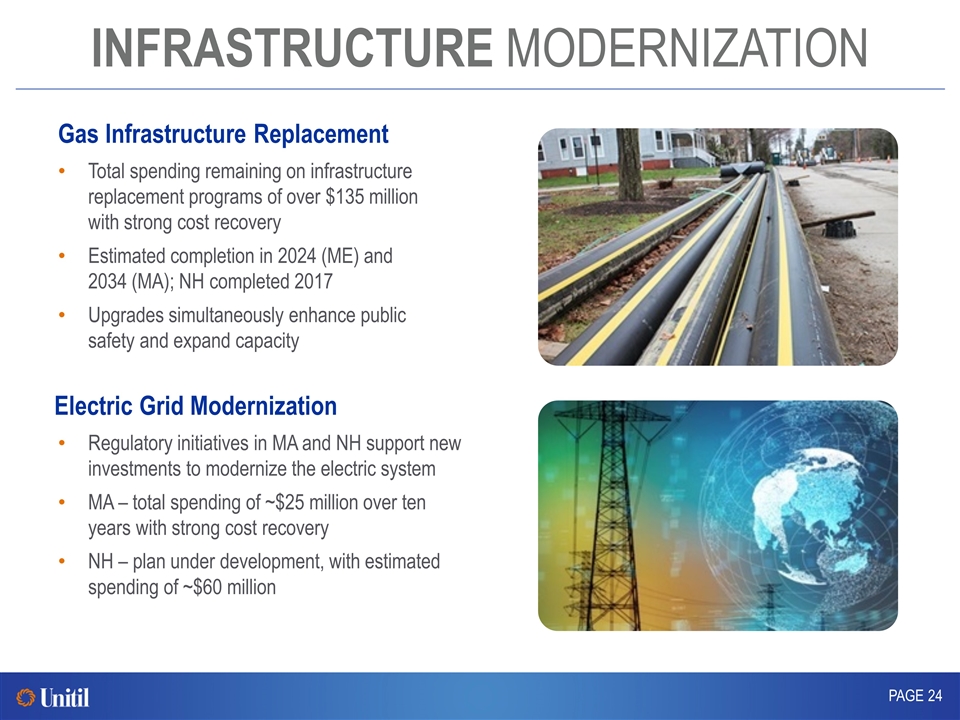
INFRASTRUCTURE MODERNIZATION PAGE Regulatory initiatives in MA and NH support new investments to modernize the electric system MA – total spending of ~$25 million over ten years with strong cost recovery NH – plan under development, with estimated spending of ~$60 million Electric Grid Modernization Total spending remaining on infrastructure replacement programs of over $135 million with strong cost recovery Estimated completion in 2024 (ME) and 2034 (MA); NH completed 2017 Upgrades simultaneously enhance public safety and expand capacity Gas Infrastructure Replacement
