Attached files
UNITED STATES
SECURITIES AND EXCHANGE COMMISSION
Washington, D.C. 20549
SECURITIES AND EXCHANGE COMMISSION
Washington, D.C. 20549
FORM 10-K
þ | ANNUAL REPORT PURSUANT TO SECTION 13 OR 15(d) OF THE SECURITIES EXCHANGE ACT OF 1934 |
For the fiscal year ended December 31, 2019
OR
OR
o | TRANSITION REPORT PURSUANT TO SECTION 13 OR 15(d) OF THE SECURITIES EXCHANGE ACT OF 1934 |
For the transition period from ____________ to ____________
Commission file number: 001-38870
Brigham Minerals, Inc.
(Exact name of registrant as specified in its charter)
Delaware | 83-1106283 | |
(State or other jurisdiction of incorporation or organization) | (I.R.S. Employer Identification No.) | |
5914 W. Courtyard Drive, Suite 150 Austin, Texas | 78730 | |
(Address of principal executive offices) | (Zip code) | |
(Registrant’s telephone number, including area code)
Securities registered pursuant to section 12(b) of the Act: | ||||
Title of each class | Trading symbol(s) | Name of each exchange on which registered | ||
Class A common stock, par value $0.01 | MNRL | New York Stock Exchange | ||
Securities registered pursuant to section 12(g) of the Act: None
Indicate by check mark if the registrant is a well-known seasoned issuer, as defined in Rule 405 of the Securities Act. Yes o No x
Indicate by check mark if the registrant is not required to file reports pursuant to Section 13 or Section 15(d) of the Act. Yes o No x
Indicate by check mark whether the registrant (1) has filed all reports required to be filed by Section 13 or 15(d) of the Securities Exchange Act of 1934 during the preceding 12 months (or for such shorter period that the registrant was required to file such reports), and (2) has been subject to such filing requirements for the past 90 days. Yes x No o
Indicate by check mark whether the registrant has submitted electronically every Interactive Data File required to be submitted pursuant to Rule 405 of Regulation S-T (§232.405 of this chapter) during the preceding 12 months (or for such shorter period that the registrant was required to submit such files). Yes x No o
Indicate by check mark whether the registrant is a large accelerated filer, an accelerated filer, a non-accelerated filer, a smaller reporting company, or an emerging growth company. See the definitions of “large accelerated filer,” “accelerated filer,” “smaller reporting company” and “emerging growth company” in Rule 12b-2 of the Exchange Act.
Large accelerated filer o | Accelerated filer o |
Non-accelerated filer x | Smaller reporting company o |
Emerging growth company x | |
If an emerging growth company, indicate by check mark if the registrant has elected not to use the extended transition period for complying with any new or revised financial accounting standards provided pursuant to Section 13(a) of the Exchange Act. o
Indicate by check mark whether the registrant is a shell company (as defined in Rule 12b-2 of the Exchange Act). Yes o No x
As of June 28, 2019, the last business day of the registrant’s most recently completed second fiscal quarter, the aggregate market value of voting and non-voting common stock held by non-affiliates of the registrant was approximately $431.9 million, determined using the per share closing price on the New York Stock Exchange on that date of $21.46. Shares of common stock held by each director and executive officer (and their respective affiliates) and each person who owns 10% or more of the outstanding common stock or who is otherwise believed by the registrant to be in a control position have been excluded. This determination of affiliate status is not necessarily a conclusive determination for other purposes.
The registrant had 34,181,268 shares of Class A common stock and 22,706,711 shares of Class B common stock outstanding as of February 27, 2020.
Portions of the registrant’s definitive proxy statement for the 2020 Annual Meeting of Stockholders, to be filed no later than 120 days after the end of the fiscal year to which this Annual Report on Form 10-K relates, are incorporated by reference into Part III of this Annual Report on Form 10-K.
BRIGHAM MINERALS, INC.
FORM 10-K
FOR THE FISCAL YEAR ENDED DECEMBER 31, 2019
TABLE OF CONTENTS
FORM 10-K
FOR THE FISCAL YEAR ENDED DECEMBER 31, 2019
TABLE OF CONTENTS
3
GLOSSARY OF OIL AND NATURAL GAS TERMS
The following are abbreviations and definitions of certain terms used in this Annual Report on Form 10-K ("Annual Report"), which are commonly used in the oil and natural gas industry:
Term | Definition | |
Basin | A depression in the Earth's crust formed from plate tectonics providing accommodation space for the accumulation of sedimentary rocks and organic material. Which when subjected to the appropriate depth and duration of burial, hydrocarbon generation can occur creating oil and natural gas bearing strata. | |
Bbl | One stock tank barrel of 42 U.S. gallons liquid volume used herein in reference to crude oil, condensate or NGLs. | |
Boe | One barrel of oil equivalent, calculated by converting natural gas to oil equivalent barrels at a ratio of six Mcf of natural gas to one Bbl of oil. This is an energy content correlation and does not reflect a value or price relationship between the commodities. | |
Boe/d | One Boe per day. | |
British thermal unit or Btu | The quantity of heat required to raise the temperature of a one-pound mass of water from 58.5 to 59.5 degrees Fahrenheit. | |
Completion | The process of treating a drilled well followed by the installation of permanent equipment for the production of oil and natural gas, or in the case of a dry hole, the reporting of abandonment to the appropriate agency. | |
Development well | A well drilled within the proved area of an oil or natural gas reservoir to the depth of a stratigraphic horizon known to be productive. | |
Differential | An adjustment to the price of oil or natural gas from an established spot market price to reflect differences in the quality and/or location of oil or natural gas. | |
Drilled but Uncompleted Well (DUC) | A well that an operator has spud but has not yet begun hydraulic fracturing or completion operations. | |
Gross acres or gross wells | The total acres or wells, as the case may be, in which a mineral or royalty interest is owned. | |
MBbl | One thousand barrels of crude oil, condensate or NGLs. | |
MBoe | One thousand Boe. | |
Mcf | One thousand cubic feet of natural gas. | |
Mcf/d | One Mcf per day. | |
MMBtu | One million British thermal units. | |
MMcf | One million cubic feet of natural gas. | |
Net royalty acre | Mineral ownership standardized to a 12.5%, or 1/8th, royalty interest. | |
Net well | The percentage of net revenue interest an owner has out of a gross well. For example, an owner who has an 25% royalty interest in a single well owns 0.25 net wells. | |
NGLs | Natural gas liquids. Hydrocarbons found in natural gas that may be extracted as liquefied petroleum gas and natural gasoline. | |
NYMEX | The New York Mercantile Exchange. | |
Operator | The individual or company responsible for the development and/or production of an oil or natural gas well or lease. | |
Possible Reserves | Reserves that are less certain to be recovered than probable reserves. | |
Probable reserves | Reserves that are less certain to be recovered than proved reserves but that, together with proved reserves, are as likely as not to be recovered. | |
Prospect | A specific geographic area that, based on supporting geological, geophysical or other data and also preliminary economic analysis using reasonably anticipated prices and costs, is deemed to have potential for the discovery of commercial hydrocarbons. | |
Proved reserves | Those quantities of oil, natural gas and NGLs that, by analysis of geoscience and engineering data, can be estimated with reasonable certainty to be economically producible-from a given date forward, from known reservoirs, and under existing economic conditions, operating methods and government regulations-prior to the time at which contracts providing the right to operate expire, unless evidence indicates that renewal is reasonably certain, regardless of whether deterministic or probabilistic methods are used for the estimation. The project to extract the hydrocarbons must have commenced or the operator must be reasonably certain that it will commence the project within a reasonable time. For a complete definition of proved oil and natural gas reserves, refer to the SEC’s Regulation S-X, Rule 4-10(a)(22). | |
4
Term | Definition | |
Realized price | The cash market price less all applicable deductions such as quality, transportation and demand adjustments. | |
Reserves | Estimated remaining quantities of oil and natural gas and related substances anticipated to be economically producible, as of a given date, by application of development projects to known accumulations. In addition, there must exist, or there must be a reasonable expectation that there will exist, the legal right to produce or a revenue interest in the production, installed means of delivering oil and natural gas or related substances to market and all permits and financing required to implement the project. Reserves should not be assigned to adjacent reservoirs isolated by major, potentially sealing, faults until those reservoirs are penetrated and evaluated as economically producible. Reserves should not be assigned to areas that are clearly separated from a known accumulation by a non-productive reservoir (i.e., absence of reservoir, structurally low reservoir or negative test results). Such areas may contain prospective resources (i.e., potentially recoverable resources from undiscovered accumulations). | |
Reservoir | A porous and permeable underground formation containing a natural accumulation of producible oil and/or natural gas that is confined by impermeable rock or water barriers and is individual and separate from other reservoirs. | |
Royalty | An interest in an oil and natural gas lease that gives the owner the right to receive a portion of the production from the leased acreage (or of the proceeds from the sale thereof), but does not require the owner to pay any portion of the production or development costs on the leased acreage. Royalties may be either landowner’s royalties, which are reserved by the owner of the leased acreage at the time the lease is granted, or overriding royalties, which are usually reserved by an owner of the leasehold in connection with a transfer to a subsequent owner. | |
Spot market price | The cash market price without reduction for expected quality, transportation and demand adjustments. | |
Spud | Commenced drilling operations on an identified location. | |
Undeveloped acreage | Lease acreage on which wells have not been drilled or completed to a point that would permit the production of commercial quantities of oil, natural gas or NGLs regardless of whether such acreage contains proved reserves. | |
5
CAUTIONARY STATEMENT REGARDING FORWARD-LOOKING STATEMENTS
The information in this Annual Report includes “forward-looking statements.” All statements, other than statements of historical fact, included in this Annual Report regarding our strategy, future operations, financial position, estimated revenues and losses, projected costs, prospects, plans and objectives of management are forward-looking statements. When used in this Annual Report, the words “may,” “could,” “believe,” “anticipate,” “intend,” “estimate,” “expect,” “project” and similar expressions and the negative of such words and similar expressions are intended to identify forward-looking statements, although not all forward-looking statements contain such identifying words. These forward-looking statements are based on management’s current expectations and assumptions about future events and are based on currently available information as to the outcome and timing of future events. Such statements may be influenced by factors that could cause actual outcomes and results to differ materially from those projected. When considering forward-looking statements, you should keep in mind the risk factors and other cautionary statements described under the heading “Risk Factors” included in this Annual Report.
The following important factors, in addition to those discussed elsewhere in this Annual Report, could affect the future results of the energy industry in general, and our company in particular, and could cause actual results to differ materially from those expressed in such forward-looking statements:
• | our ability to execute on our business objectives; |
• | the effect of changes in commodity prices; |
• | the level of production on our properties; |
• | risks associated with the drilling and operation of oil and natural gas wells; |
• | the availability or cost of rigs, equipment, raw materials, supplies, oilfield services, or personnel; |
• | legislative or regulatory actions pertaining to hydraulic fracturing, including restrictions on the use of water; |
• | the availability of pipeline capacity and transportation facilities; |
• | the effect of existing and future laws and regulatory actions; |
• | the impact of derivative instruments; |
• | conditions in the capital markets and our ability to obtain capital on favorable terms or at all; |
• | the overall supply and demand for oil, natural gas and NGLs, and regional supply and demand factors, delays, or interruptions of production; |
• | competition from others in the energy industry; |
• | the impact of reduced drilling activity in our focus areas, particularly in the STACK play in Oklahoma, and uncertainty in whether development projects will be pursued; |
• | uncertainty of estimates of oil and natural gas reserves and production; |
• | the cost of developing the oil and natural gas underlying our properties; |
• | our ability to replace our oil and natural gas and NGL reserves; |
• | our ability to identify, complete and integrate acquisitions; |
• | title defects in the properties in which we invest; |
• | the cost of inflation; |
• | technological advances; |
• | weather conditions, natural disasters and health epidemics |
• |
• | general economic, business, political or industry conditions; and |
• | certain factors discussed elsewhere in this Annual Report. |
Should one or more of the risks or uncertainties described in this Annual Report occur, or should underlying assumptions prove incorrect, our actual results and plans could differ materially from those expressed in any forward-looking statements. Moreover, we operate in a very competitive and rapidly changing environment. New risks emerge from time to time. It is not possible for our management to predict all risks, nor can we assess the impact of all factors on our business or the extent to which any factor, or combination of factors, may cause actual results to differ materially from those contained in any forward-
6
looking statements we may make. Although we believe that our plans, intentions and expectations reflected in or suggested by the forward-looking statements we make in this Annual Report are reasonable, we can give no assurance that these plans, intentions or expectations will be achieved or occur, and actual results could differ materially and adversely from those anticipated or implied in the forward-looking statements.
Reserve engineering is a process of estimating underground accumulations of oil and natural gas that cannot be measured in an exact way. The accuracy of any reserve estimate depends on the quality of available data, the interpretation of such data and price and cost assumptions made by reserve engineers. In addition, the results of drilling, testing and production activities may justify revisions of estimates that were made previously. If significant, such revisions would change the schedule of any further production and development drilling. Accordingly, reserve estimates may differ significantly from the quantities of oil, natural gas and NGLs that are ultimately recovered.
All forward-looking statements, expressed or implied, included in this Annual Report are expressly qualified in their entirety by this cautionary statement. This cautionary statement should also be considered in connection with any subsequent written or oral forward-looking statements that we or persons acting on our behalf may issue. Except as otherwise required by applicable law, we disclaim any duty to update any forward-looking statements, all of which are expressly qualified by the statements in this section, to reflect events or circumstances after the date of this Annual Report.
7
PART I
ITEM 1. BUSINESS
Unless the context otherwise requires, references in this annual report on Form 10-K (the “Annual Report”) to “Brigham Minerals,” the “Company,” “we,” “our,” “us” or like terms refer to Brigham Minerals, Inc. and its subsidiaries. References to the “Brigham LLC” refer to Brigham Minerals Holdings, LLC. Brigham Minerals owns an interest in, and acts as the sole managing member of, Brigham LLC. Brigham LLC wholly owns Brigham Resources, LLC (“Brigham Resources”), which wholly owns Brigham Minerals, LLC and Rearden Minerals, LLC (collectively, the “Minerals Subsidiaries”), which are Brigham Resources’ sole material assets.
On April 17, 2019, the Company completed its initial public offering (the “IPO”) of shares of its Class A common stock, par value $0.01 per share (the “Class A common stock”). Unless indicated otherwise or the context otherwise requires, references in this Annual Report to the Company (i) for periods prior to completion of the IPO, refer to the assets and operations (including reserves, production and acreage) of Brigham Resources, excluding the historical results and operations of Brigham Resources Operating, LLC (“Brigham Operating”), which was spun out in connection with the IPO, and (ii) for periods after completion of the IPO, refer to the assets and operations of Brigham Minerals and its subsidiaries, including Brigham LLC, Brigham Resources and the Minerals Subsidiaries.
Overview
We formed our company in 2012 to acquire and actively manage a portfolio of mineral and royalty interests in the core of what we view as the most active, highly economic, liquids-rich resource basins across the continental United States. Our primary business objective is to maximize risk-adjusted total return to our shareholders by both capturing growth in free cash flow from the continued development of our existing portfolio of 12,777 undeveloped horizontal drilling locations, inclusive of 715 gross permits and in addition to 892 gross DUCs, unburdened by development capital expenditures or lease operating expenses, as well as leveraging our highly experienced technical evaluation team to continue to execute upon our scalable business model of sourcing, methodically evaluating and integrating accretive minerals acquisitions in the core of top-tier, liquids-rich resource plays.
Our portfolio is comprised of mineral and royalty interests across four of the most highly economic, liquids-rich resource basins in the continental United States, including the Permian Basin in Texas and New Mexico, the SCOOP and STACK plays in the Anadarko Basin of Oklahoma, the Denver-Julesburg (“DJ”) Basin in Colorado and Wyoming and the Williston Basin in North Dakota. Our highly technical approach towards mineral acquisitions in the geologic core of top-tier resource plays has purposefully led to a concentrated portfolio covering 39 of the most highly active counties for horizontal drilling in the continental United States.
Since inception, we have executed on our technically driven, disciplined acquisition approach and have closed 1,551 transactions with third-party mineral and royalty interest owners as of December 31, 2019. We have increased our mineral and royalty interests from approximately 10,200 net royalty acres as of December 31, 2013, to approximately 82,200 net royalty acres as of December 31, 2019, which represents a 54% compound annual growth rate in our mineral and royalty interests over that period. See “—Overview—Our Mineral and Royalty Interests” for a discussion of how we calculate net royalty acres.
The following table summarizes certain information regarding our net royalty acreage acquisitions during each year of our operations.
2012 | 2013 | 2014 | 2015 | 2016 | 2017 | 2018 | 2019 | Total | |||||||||||||||||||
Net Royalty Acres (NRAs) Acquired | 500 | 9,700 | 17,300 | 7,200 | 9,800 | 9,400 | 14,900 | 13,400 | 82,200 | ||||||||||||||||||
Number of Acquisitions | 15 | 313 | 380 | 152 | 121 | 153 | 201 | 216 | 1,551 | ||||||||||||||||||
Average NRAs per Acquisition | 33 | 31 | 46 | 47 | 81 | 61 | 74 | 62 | 53 | ||||||||||||||||||
NRAs at Period End | 500 | 10,200 | 27,500 | 34,700 | 44,500 | 53,900 | 68,800 | 82,200 | 82,200 | ||||||||||||||||||
YoY% Change | — | 1,940 | % | 170 | % | 26 | % | 28 | % | 21 | % | 28 | % | 19 | % | ||||||||||||
By targeting core, top-tier mineral acreage, our interests have continued to see rapid development with a total of approximately 1,104 gross horizontal wells spud on our mineral and royalty interests during the full year of 2019. This significant activity has similarly translated into rapid production growth with our production volumes growing approximately 91% for the year ended December 31, 2019 as compared to the year ended December 31, 2018. Further, our production volumes are comprised of high-value liquids with 71% of our volumes for the year ended December 31, 2019 composed of
8
crude oil and natural gas liquids (“NGLs”), which represents 90% of our mineral and royalty revenue for the period. The combined growth in our production volumes and the high percentage of liquids production have resulted in a 64% increase in our royalty revenue for the year ended December 31, 2019 as compared to the year ended December 31, 2018. We expect to see near term organic growth in our production, revenue and free cash flow from 892 drilled but uncompleted horizontal wells (“DUCs”) across our interests and approximately 715 horizontal drilling permits as of December 31, 2019, all of which are expected to occur without additional capital expenditure outlays. Development of permits on our acreage is driven by robust and consistent rig activity on meaningful portions of our acreage. During the year ended December 31, 2019, there were an average of 65 horizontal rigs across our acreage, drilling approximately 2,700 net royalty acres. Likewise, over the three months ended December 31, 2019, there were 60 horizontal rigs across our acreage, drilling approximately 2,500 net royalty acres.
Average Quarterly Rigs on Acreage
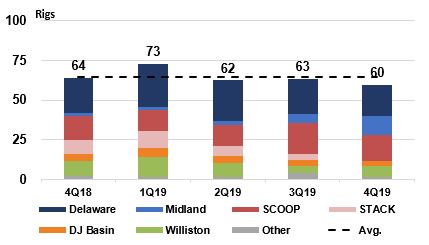
In addition to existing near-term development, our permitted horizontal drilling locations represent only approximately 6% of our horizontal drilling locations, thereby providing us with a substantial long-term drilling inventory on our acreage.
As indicated by the following table, from 2018 to 2019, the gross number of wells spud and wells turned to production on our acreage increased by 5% and 9%, respectively, as our average realized prices for oil, gas and NGLs decreased by 11%, 26% and 42%, respectively. Based solely on the 1,104 horizontal wells spud on our acreage during 2019 and our 12,777 total gross undeveloped horizontal drilling locations as of December 31, 2019, we believe we have 12 years of organic drilling inventory.
2018 | 2019 | |||||||||||||||||
On Our Acreage | Total Across Basins | Our Share of Total | On Our Acreage | Total Across Basins | Our Share of Total | |||||||||||||
Wells spud | 1,049 | 4,885 | 21 | % | 1,104 | 8,599 | 13 | % | ||||||||||
Wells turned to production | 1,036 | 9,634 | 11 | % | 1,127 | 6,446 | 17 | % | ||||||||||
Our Mineral and Royalty Interests
Mineral interests are real-property interests that are typically perpetual and grant both ownership of the oil, natural gas and NGLs under a tract of land and the ability to lease development rights to a third party. When those rights are leased, usually for a three-year primary term, we typically receive an upfront cash payment, known as lease bonus, and we retain a mineral royalty, which entitles us to a percentage of production or revenue. In addition to mineral interests, which represented approximately 95% of our net royalty acres as of December 31, 2019, we also own other types of interests, including nonparticipating royalty interests (“NPRIs”) and overriding royalty interests (“ORRIs”). ORRIs are a contractual arrangement burdening the working interest ownership of a lease and represent the right to receive a fixed percentage of production or revenue from production from a lease. ORRIs remain in effect until the associated lease expires and are therefore not perpetual in nature.
As a mineral and royalty interest owner, we incur the initial cost to acquire our interests, but thereafter do not incur any development capital expenditures or lease operating expenses, which are entirely borne by the operator. Mineral and royalty owners only incur their proportionate share of severance and ad valorem taxes, as well as in some instances, gathering, transportation and marketing costs. As a result, operating margins and therefore free cash flow for a mineral and royalty interest owner are higher as a percentage of revenue than for a traditional exploration and production operating company.
9
As of December 31, 2019, our mineral and royalty interests consisted of approximately 57,800 net mineral acres, which have been leased to operators to explore for and develop our oil and natural gas rights at a weighted average royalty of 17.8%. Typically, within the minerals industry, mineral owners standardize ownership to a 12.5%, or 1/8th, royalty interest, which is referred to as a “net royalty acre.” Our net mineral acres standardized to a 1/8th royalty equate to approximately 82,200 net royalty acres. When standardized on a 100% royalty basis, these approximately 82,200 net royalty acres equate to approximately 10,250 “100% royalty acres.” Our approximately 82,200 net royalty acres are located within 1,584 drilling spacing units (“DSUs”), which are the areas designated in a spacing order or unit designation as a drilling unit and within which operators drill wellbores to develop our oil and natural gas rights. Our DSUs, in aggregate, consist of a total of approximately 1,573,950 gross acres, which we refer to as our “gross DSU acreage.” Within our gross DSU acreage, we expect to have an interest in wells currently producing or that will be drilled in the future. The following table summarizes our mineral and royalty interest position and the conversion of our interests between net mineral acres, net royalty acres and 100% royalty acres as of December 31, 2019.
Net Mineral Acres | Weighted Average Royalty | Net Royalty Acres(1) | 100% Royalty Acres(2) | Gross DSU Acres | Implied Average Net Revenue Interest per Well(3) | |||||||||||
57,800 | 17.8 | % | 82,200 | 10,250 | 1,573,950 | 0.7 | % | |||||||||
(1) Standardized to a 1/8th royalty (i.e., 57,800 net mineral acres * 18.0% / 12.5%).
(2) Standardized to a 100% royalty (i.e., 82,200 net royalty acres * 12.5%).
(3) Calculated as number of 100% royalty acres per gross DSU acre (i.e., 10,250 100% royalty acres / 1,573,950 gross DSU acres).
Our Properties
Focus Areas
Our mineral and royalty interests are primarily located in six resource plays, which we refer to as our focus areas. These include the Delaware and Midland Basins in the Permian Basin, the SCOOP and STACK plays in the Anadarko Basin, the DJ Basin and the Williston Basin. The following chart shows our overall exposure to each of our primary focus areas based on our net royalty acres in each focus area as of December 31, 2019.
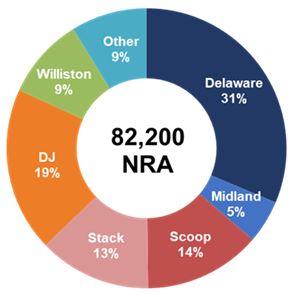
In addition, the following table summarizes certain information regarding our primary focus areas. Our average daily net production for the twelve months ended December 31, 2019 was comprised 56% of oil production, 29% of natural gas production and 15% of NGL production.
10
Acreage as of December 31, 2019 | Gross Horizontal Producing Well Count as of December 31, 2019(4) | Average Daily Net Production for the year ended December 31, 2019(5) (Boe/d) | Average Daily Net Production for the quarter ended December 31, 2019(5) (Boe/d) | ||||||||||||||||||||||||
Basin | Net Mineral Acres | Weighted Average Royalty | Net Royalty Acres(1) | 100% Royalty Acres(2) | Gross DSU Acres | Implied Average Net Revenue Interest per Well(3) | |||||||||||||||||||||
Delaware | 16,200 | 19.9 | % | 25,750 | 3,200 | 301,500 | 1.1 | % | 932 | 3,140 | 4,630 | ||||||||||||||||
Midland | 3,300 | 15.5 | % | 4,100 | 500 | 84,550 | 0.6 | % | 195 | 313 | 424 | ||||||||||||||||
SCOOP | 7,550 | 18.4 | % | 11,100 | 1,400 | 204,600 | 0.7 | % | 457 | 777 | 1,128 | ||||||||||||||||
STACK | 7,600 | 17.6 | % | 10,700 | 1,350 | 179,950 | 0.8 | % | 395 | 1,136 | 1,145 | ||||||||||||||||
DJ | 12,200 | 16.0 | % | 15,600 | 1,950 | 171,950 | 1.1 | % | 1,085 | 1,181 | 1,292 | ||||||||||||||||
Williston | 6,050 | 16.0 | % | 7,750 | 950 | 487,600 | 0.2 | % | 1,656 | 758 | 918 | ||||||||||||||||
Other | 4,900 | 18.4 | % | 7,200 | 900 | 143,800 | 0.6 | % | 188 | 109 | 90 | ||||||||||||||||
Total | 57,800 | 17.8 | % | 82,200 | 10,250 | 1,573,950 | 0.7 | % | 4,908 | 7,414 | 9,627 | ||||||||||||||||
Note: Individual amounts may not add up to totals due to rounding.
(1) Standardized to a 1/8th royalty.
(2) Standardized to a 100% royalty
(3) Calculated as number of 100% royalty acres per gross DSU acre.
(4) Represents number of horizontal producing wells across all DSUs in which we participate.
(5) Represents actual production plus allocated accrued volumes attributable to the period presented.
Permian Basin-Delaware and Midland Basins
The Permian Basin ranges from West Texas into southeastern New Mexico and is currently the most active area for horizontal drilling in the United States. The Permian Basin is further subdivided into the Delaware Basin in the west and the Midland Basin in the east. Based on our geologic and engineering data as well as current delineation efforts by operators, we believe our mineral and royalty interests in the Delaware Basin are prospective for seven or more producing zones of economic horizontal development including the Wolfcamp A, B, C and XY; First, Second and Third Bone Spring; and the Avalon. Our Delaware Basin mineral and royalty interests are located in Reeves, Loving, Ward, Pecos, Culberson and Winkler Counties, Texas with our remaining interests located in Lea County, and Eddy County, New Mexico. Based on our geologic and engineering interpretations as well as current delineation efforts by operators, we believe our mineral and royalty interests in the Midland Basin are prospective for five or more producing zones of economic horizontal development including the Middle Spraberry; Lower Spraberry; and Wolfcamp A, B, C, and "D" / Cline. Our Midland Basin mineral and royalty interests are located in Martin, Midland, Upton, Howard, Glasscock and Reagan Counties, Texas.
Anadarko Basin-SCOOP and STACK Plays
The SCOOP play (South Central Oklahoma Oil Province) is located in central Oklahoma in Grady, Garvin, Stephens and McClain Counties. Based on our geologic and engineering interpretations as well as current delineation efforts by operators, we believe our mineral and royalty interests in the SCOOP play are prospective for two or more producing zones of economic horizontal development including multiple Woodford benches and the Springer Shale. In addition, operators are also currently testing other formations in the area including the Sycamore, Caney and Osage, which is also referred to as SCORE (Sycamore Caney Osage Resource Expansion). The STACK play (derived from Sooner Trend Anadarko Basin Canadian and Kingfisher Counties) is located in central Oklahoma in Kingfisher, Canadian, Caddo and Blaine Counties. Based on our geologic and engineering data as well as current delineation efforts by operators, we believe our mineral and royalty interests in the STACK play are prospective for four or more producing zones of economic horizontal development including multiple benches within both the Meramec and Woodford formations.
DJ Basin
The DJ Basin is located in Northeast Colorado and Southeast Wyoming, with the majority of operator horizontal drilling activity located in Weld and Broomfield Counties, Colorado, and Laramie County, Wyoming. Based on our geologic and engineering interpretations as well as current delineation efforts by operators, we believe our mineral and royalty interests in the DJ Basin are prospective for four or more producing zones of economic horizontal development including the Niobrara A, B and C and Codell formations.
Williston Basin
The Williston Basin stretches from western North Dakota into eastern Montana with the majority of operator horizontal drilling activity located in Mountrail, Williams, and McKenzie Counties, North Dakota. Based on our geologic and engineering
11
interpretations as well as current operator delineation efforts, we believe our mineral and royalty interests are prospective for two or more producing zones of economic horizontal development including the Bakken and multiple Three Forks benches. The majority of our interests are located in Mountrail, Williams and McKenzie Counties with additional interests owned in Divide, Burke, Dunn, Billings and Stark Counties, North Dakota and Richland County, Montana.
Other Counties
Our other interests are comprised of mineral and royalty interests owned in Carter and Love Counties, Oklahoma in what we refer to as the Extended Woodford play in the Marietta and Ardmore Basins and in Bradford, Sullivan and Washington Counties, Pennsylvania in the Marcellus and Utica Shale plays. We also own acreage in the Merge trend in Oklahoma, centered in northern Grady County and southern Canadian Counties. Our interests in Carter and Love Counties are largely being developed by Exxon Mobil Corporation through their operating subsidiary XTO Energy. Our interests in Pennsylvania are largely being developed by Range Resources Corporation and Chief Oil & Gas LLC.
Prospective Undeveloped Horizontal Drilling Locations
We believe our production and free cash flow will grow through the drilling of the substantial undeveloped organic inventory of horizontal drilling locations located on our acreage. As of December 31, 2019, we have identified 12,777 gross drilling locations across our gross DSU acreage as identified in our December 31, 2019 reserve report audited by Cawley, Gillespie & Associates, Inc. ("CG&A"), our independent petroleum engineering firm. Furthermore, we believe additional optionality is possible through the delineation of additional formations as well as incremental wells in existing formations. Approximately 51% of our total net horizontal undeveloped locations are located in the Delaware and Midland Basins, with another 22% located in the SCOOP and STACK plays of the Anadarko Basin in Oklahoma, as shown in the following table.
Gross Horizontal Undeveloped Locations | Percentage of Total Portfolio | Net Horizontal Undeveloped Locations | Percentage of Total Portfolio | |||||||||
Delaware Basin | 4,654 | 36 | % | 50.6 | 45 | % | ||||||
Midland Basin | 1,064 | 8 | % | 7.5 | 6 | % | ||||||
SCOOP | 1,092 | 9 | % | 8.4 | 8 | % | ||||||
STACK | 1,752 | 14 | % | 15.5 | 14 | % | ||||||
DJ Basin | 1,564 | 12 | % | 19.9 | 18 | % | ||||||
Williston | 1,539 | 12 | % | 3 | 3 | % | ||||||
Other | 1,112 | 9 | % | 6.9 | 6 | % | ||||||
Total | 12,777 | 100 | % | 111.8 | 100 | % | ||||||
Note: Individual amounts may not total due to rounding.
Additionally, the following table provides a detailed summary of our inventory of horizontal drilling locations as of December 31, 2019.
12
Productive Horizons | Gross Horizontal Undeveloped Locations(1) | Total Gross Horizontal Locations(2) | DSUs(3)(4) | Gross Horizontal Undeveloped Locations Per DSU(4) | Total Gross Horizontal Locations Per DSU(4) | Net Horizontal Undeveloped Locations(5) | ||||||||||||
Delaware Basin | ||||||||||||||||||
Wolfcamp A | 1,879 | 2,540 | 401 | 4.7 | 6.3 | 22.3 | ||||||||||||
Wolfcamp B | 1,070 | 1,240 | 370 | 2.9 | 3.4 | 12.6 | ||||||||||||
3rd BS/WC XY | 645 | 891 | 281 | 2.3 | 3.2 | 5.7 | ||||||||||||
2nd Bone Spring | 469 | 513 | 172 | 2.7 | 3 | 3.8 | ||||||||||||
Avalon | 151 | 177 | 66 | 2.3 | 2.7 | 0.7 | ||||||||||||
Other | 440 | 480 | 166 | 2.7 | 2.9 | 5.5 | ||||||||||||
Total | 4,654 | 5,841 | 404 | 11.5 | 14.5 | 50.6 | ||||||||||||
Midland Basin | ||||||||||||||||||
Wolfcamp A | 294 | 403 | 92 | 3.2 | 4.4 | 2.1 | ||||||||||||
Wolfcamp B | 292 | 396 | 91 | 3.2 | 4.4 | 2 | ||||||||||||
Lower Spraberry | 360 | 447 | 92 | 3.9 | 4.9 | 2.5 | ||||||||||||
Other | 118 | 149 | 41 | 2.9 | 3.6 | 0.9 | ||||||||||||
Total | 1,064 | 1,395 | 92 | 11.6 | 15.2 | 7.5 | ||||||||||||
SCOOP | ||||||||||||||||||
Woodford | 784 | 1,260 | 184 | 4.3 | 6.8 | 6.1 | ||||||||||||
Springer | 308 | 407 | 101 | 3 | 4 | 2.3 | ||||||||||||
Total | 1,092 | 1,667 | 184 | 5.9 | 9.1 | 8.4 | ||||||||||||
STACK | ||||||||||||||||||
Woodford | 989 | 1,111 | 171 | 5.8 | 6.5 | 8.6 | ||||||||||||
Meramec | 763 | 1,054 | 189 | 4 | 5.6 | 6.9 | ||||||||||||
Total | 1,752 | 2,165 | 189 | 9.3 | 11.5 | 15.5 | ||||||||||||
DJ Basin | ||||||||||||||||||
Niobrara | 1,159 | 2,119 | 186 | 6.2 | 11.4 | 14.8 | ||||||||||||
Codell | 405 | 711 | 142 | 2.9 | 5 | 5.1 | ||||||||||||
Total | 1,564 | 2,830 | 186 | 8.4 | 15.2 | 19.9 | ||||||||||||
Williston Basin | ||||||||||||||||||
Bakken | 699 | 1,737 | 349 | 2 | 5 | 1.3 | ||||||||||||
Three Forks | 840 | 1,613 | 349 | 2.4 | 4.6 | 1.7 | ||||||||||||
Total | 1,539 | 3,350 | 352 | 4.4 | 9.5 | 3 | ||||||||||||
Other | 1,112 | 1,328 | 177 | 6.3 | 7.5 | 6.9 | ||||||||||||
Grand Total | 12,777 | 18,576 | 1,584 | 8.1 | 11.7 | 111.8 | ||||||||||||
(1) Represents gross horizontal drilling locations across our gross DSU acreage
(2) Includes all undeveloped wells in each horizon.
(3) Represents the aggregate number of DSUs covering any of the applicable productive horizons as identified in the reserve report.
(4) The number of DSUs in each horizon and locations per DSU in each horizon do not total due to differing prospectivity of each horizon across each DSU (i.e., not all horizons are booked in all DSUs).
(5) A net well represents 100% net revenue interest in a single gross well.
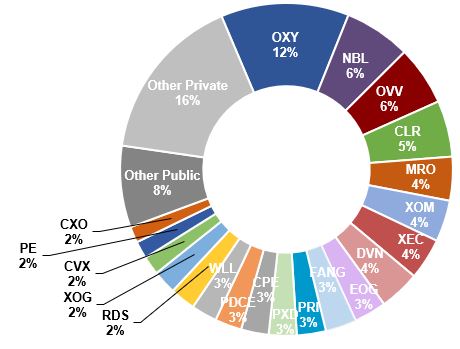
Third-Party Operators
Beyond our technical analysis to identify core, highly economic areas, an additional critical aspect of our evaluation process is to acquire mineral and royalty interests that will be drilled and completed by operators we believe will outperform their peers through the application of the latest drilling and completion technologies in each of our operating basins. The following chart summarizes our exposure to these operators based on the percentage of our net interests in the wells to be drilled by each operator. Net interests per gross location are normalized to 7,500 ft. laterals.
13
In addition, the following table shows our exposure to each of these operators broken down by our primary focus areas based on the percentage of our net interests in the wells to be drilled by each operator as of December 31, 2019.
Percentage as of December 31, 2019 | |||||||||||||||||||||||||
Operator | Total Portfolio | Delaware | Midland | SCOOP | STACK | DJ Basin | Williston | Other | |||||||||||||||||
Occidental Petroleum | 12 | % | 22 | % | 1 | % | — | — | 15 | % | — | — | |||||||||||||
Ovintiv Inc. | 6 | % | — | 3 | % | 26 | % | 19 | % | — | 5 | % | 13 | % | |||||||||||
Noble Energy | 6 | % | 9 | % | — | — | — | 13 | % | — | — | ||||||||||||||
Continental Resources | 5 | % | — | — | 39 | % | 3 | % | — | 19 | % | 19 | % | ||||||||||||
Marathon Oil | 4 | % | 1 | % | — | 19 | % | 16 | % | — | 1 | % | 4 | % | |||||||||||
ExxonMobil Corp. | 4 | % | 7 | % | 4 | % | — | — | — | 5 | % | 9 | % | ||||||||||||
Cimarex Energy | 4 | % | 6 | % | — | — | 10 | % | — | — | 3 | % | |||||||||||||
Devon Energy | 4 | % | 1 | % | — | — | 26 | % | — | — | 2 | % | |||||||||||||
EOG Resources | 3 | % | 1 | % | — | 1 | % | — | 13 | % | 3 | % | — | ||||||||||||
Diamondback Energy | 3 | % | 6 | % | 8 | % | — | — | — | — | — | ||||||||||||||
Patriot | 3 | % | 7 | % | — | — | — | — | — | — | |||||||||||||||
Pioneer Natural Resources | 3 | % | — | 38 | % | — | — | — | — | — | |||||||||||||||
Callon Petroleum | 3 | % | 6 | % | — | — | — | — | — | — | |||||||||||||||
PDC Energy | 3 | % | 1 | % | — | — | — | 11 | % | — | — | ||||||||||||||
Whiting Petroleum | 3 | % | — | — | — | — | 12 | % | 3 | % | — | ||||||||||||||
Royal Dutch Shell | 2 | % | 6 | % | — | — | — | — | — | — | |||||||||||||||
Extraction Oil & Gas | 2 | % | — | — | — | — | 12 | % | — | — | |||||||||||||||
Chevron Corporation | 2 | % | 4 | % | 4 | % | — | — | — | — | — | ||||||||||||||
Parsley Energy | 2 | % | 1 | % | 15 | % | — | — | — | — | — | ||||||||||||||
Concho Resources | 2 | % | 3 | % | 1 | % | — | — | — | — | — | ||||||||||||||
Subtotal | 76 | % | 81 | % | 74 | % | 85 | % | 74 | % | 76 | % | 38 | % | 50 | % | |||||||||
Other Operators | 24 | % | 19 | % | 26 | % | 15 | % | 26 | % | 24 | % | 62 | % | 50 | % | |||||||||
Total | 100 | % | 100 | % | 100 | % | 100 | % | 100 | % | 100 | % | 100 | % | 100 | % | |||||||||
Note: Individual amounts may not add up to totals due to rounding.
14
Business Objectives
Our primary business objective is to deliver an attractive risk-adjusted total return to our shareholders through (i) the growth of our free cash flow generated from our existing portfolio of approximately 82,200 net royalty acres, and (ii) the continued sourcing and execution of accretive mineral acquisitions in the core of highly economic, liquids-rich resource plays.
Our Corporate Structure
Brigham Minerals, Inc. was incorporated as a Delaware corporation in June 2018 for the purpose of completing the IPO and related transactions. On April 23, 2019, in connection with the IPO, Brigham Minerals became a holding company whose sole material asset consists of units in Brigham LLC (the “Brigham LLC Units”). Brigham LLC wholly owns Brigham Resources, which wholly owns the Minerals Subsidiaries, which own all of our operating assets. The remainder of the Brigham LLC Units are held by affiliates of Warburg Pincus LLC (“Warburg Pincus”), Yorktown Partners LLC (“Yorktown”), Pine Brook Road Advisors, LP (“Pine Brook”) and certain of our management members and other prior investors (together with Warburg Pincus, Yorktown and Pine Brook, the “Original Owners”).
As the sole managing member of Brigham LLC, Brigham Minerals operates and controls all of the business and affairs of Brigham LLC, and through Brigham LLC and its subsidiaries, conducts its business. As a result, we consolidate the financial results of Brigham LLC and its subsidiaries and report temporary equity related to the portion of Brigham LLC Units not owned by us, which will reduce net income (loss) attributable to the holders of our Class A common stock. As of February 27, 2020, Brigham Minerals owned 60.1% of Brigham LLC.
Each of the Original Owners holds one share of our Class B common stock, par value $0.01 per share (the "Class B common stock"), for each Brigham LLC Unit such person holds. Each share of Class B common stock has no economic rights but entitles its holder to one vote on all matters to be voted on by shareholders generally. Holders of Class A common stock and Class B common stock vote together as a single class on all matters presented to our shareholders for their vote or approval, except as otherwise required by applicable law or by our amended and restated certificate of incorporation. We do not intend to list Class B common stock on any exchange.
Under the First Amended and Restated Limited Liability Company Agreement of Brigham LLC (the “Brigham LLC Agreement”), each holder of a Brigham LLC Unit (a “Brigham Unit Holder”) has, subject to certain limitations, the right (the “Redemption Right”) to cause Brigham LLC to acquire all or a portion of its Brigham LLC Units for, at Brigham LLC’s election, (i) shares of our Class A common stock at a redemption ratio of one share of Class A common stock for each Brigham LLC Unit redeemed, subject to conversion rate adjustments for stock splits, stock dividends and reclassification and other similar transactions or (ii) an equivalent amount of cash. Our decision to make a cash payment upon a Brigham Unit Holder’s redemption election must be made by our independent directors (within the meaning of the New York Stock Exchange and Section 10A-3 of the Securities Act) who do not own LLC units that are subject to such redemption. We will determine whether to issue shares of Class A common stock or cash based on facts in existence at the time of the decision, which we expect would include the relative value of the Class A common stock (including trading prices for the Class A common stock at the time), the cash purchase price, the availability of other sources of liquidity (such as an issuance of preferred stock) to acquire the Brigham LLC Units and alternative uses for such cash. Alternatively, upon the exercise of the Redemption Right, Brigham Minerals (instead of Brigham LLC) will have the right (the “Call Right”) to, for administrative convenience, acquire each tendered Brigham LLC Unit directly from the redeeming Brigham Unit Holder for, at its election, (x) one share of Class A common stock or (y) an equivalent amount of cash. In connection with any redemption of Brigham LLC Units pursuant to the Redemption Right or acquisition pursuant to our Call Right, the corresponding number of shares of Class B common stock will be cancelled. Under the Registration Rights Agreement we entered into with certain of the Original Owners in connection with the IPO, such Original Owners have the right, under certain circumstances, to cause us to register the offer and resale of their shares of Class A common stock.
The following diagram indicates our simplified ownership structure as of February 27, 2020. This chart is provided for illustrative purposes only and does not represent all legal entities affiliated with us.
15
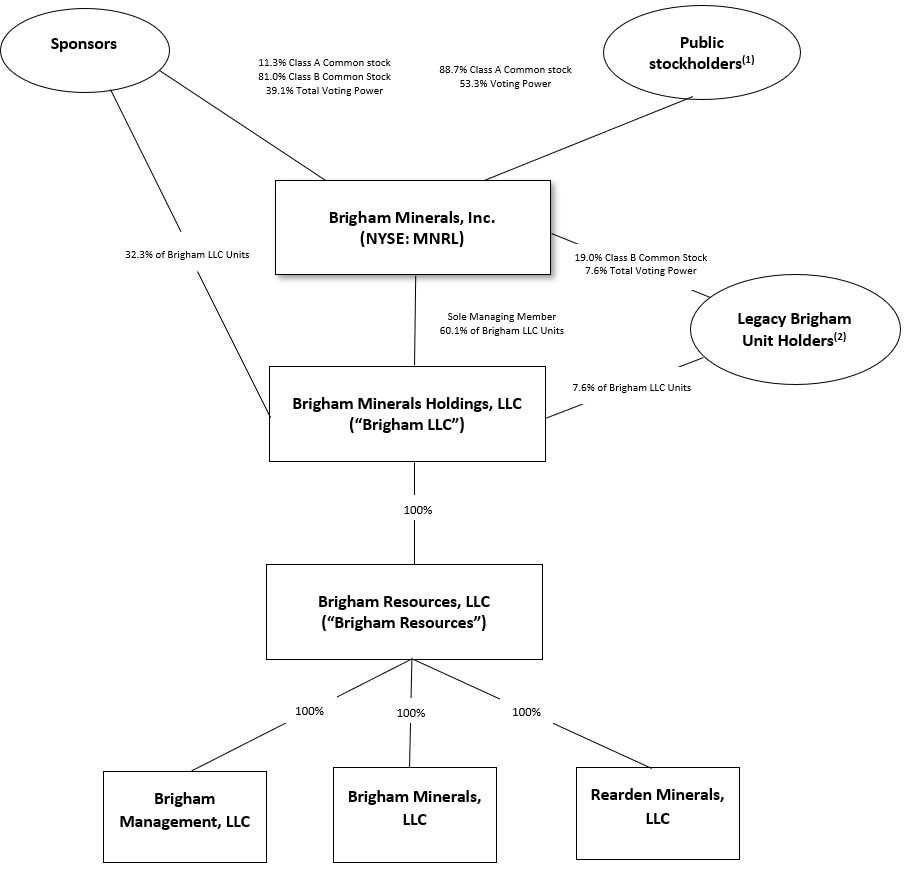
(1) | Public stockholders include shares of Class A common stock sold to the public, issued pursuant to awards granted under our LTIP or issued to Brigham Unit Holders in connection with their exercise of the Redemption Right. |
(2) | Legacy Brigham Unit Holders include members of our management team and investors in our Company prior to our IPO (other than our Sponsors) who continue to hold Brigham LLC Units. Certain of the interests of our management in Brigham LLC are held indirectly through Brigham Equity Holdings, LLC. Brigham Equity Holdings, LLC directly owns 212,733 Brigham LLC Units, representing an approximate 0.8% interest in Brigham LLC. Total voting power does not include any shares of Class A common stock held by such legacy Brigham Unit Holders. |
Our Principal Stockholders
We have valuable relationships with Warburg Pincus, Yorktown and Pine Brook, private investment firms focused on investments in the energy sector. As of February 27, 2020, affiliates of Warburg Pincus, Yorktown and Pine Brook (collectively, our “Sponsors”) own approximately 3,856,823 shares of Class A common stock and 18,384,074 shares of Class B common stock representing approximately 39.1% of the voting power of Brigham Minerals and 18,384,074 Brigham LLC Units.
16
Principal Executive Offices
Our principal executive offices are located at 5914 W. Courtyard Drive, Suite 150, Austin, Texas 78730, and our telephone number at that address is (512) 220-6350.
Our website address is www.brighamminerals.com. We make our periodic reports and other information filed with or furnished to the United States Securities and Exchange Commission (the “SEC”) available free of charge through our website as soon as reasonably practicable after those reports and other information are electronically filed with or furnished to the SEC. Information on our website or any other website is not incorporated by reference into, and does not constitute a part of, this Annual Report.
Oil, Natural Gas and NGLs Data
Proved, Probable and Possible Reserves
Evaluation and Audit of Proved, Probable and Possible Reserves. Our proved, probable and possible reserve estimates as of December 31, 2019, and December 31, 2018 were audited by CG&A, our independent petroleum engineers, and our proved, probable and possible reserve estimates as of December 31, 2017 were prepared by CG&A. Within CG&A, the technical person primarily responsible for preparing the reserve estimates set forth in the reserve reports incorporated herein is Todd Brooker. Prior to joining CG&A, Mr. Brooker worked in Gulf of Mexico drilling and production engineering at Chevron USA. Mr. Brooker has been an employee of CG&A since 1992. His responsibilities include reserve and economic evaluations, fair market valuations, field studies, pipeline resource studies and acquisition/divestiture analysis. His reserve reports are routinely used for public company SEC disclosures. His experience includes significant projects in both conventional and unconventional resources in every major U.S. producing basin and abroad, including oil and gas shale plays, coalbed methane fields, waterfloods and complex, faulted structures. Mr. Brooker graduated with honors from the University of Texas at Austin in 1989 with a Bachelor of Science degree in Petroleum Engineering and is a registered Professional Engineer in the State of Texas. He is also a member of the Society of Petroleum Engineers and the Society of Petroleum Evaluation Engineers (SPEE).
Mr. Brooker meets or exceeds the requirements with regard to qualifications, independence, objectivity and confidentiality set forth in the Standards Pertaining to the Estimating and Auditing of Oil and Gas Reserves Information promulgated by the Society of Petroleum Engineers. CG&A does not own an interest in any of our properties, nor is it employed by us on a contingent basis. Summaries of CG&A’s report with respect to our proved, probable and possible reserve estimates as of December 31, 2019 is included as an exhibit to this Annual Report.
We maintain an internal staff of petroleum engineers and geoscience professionals who worked closely with our independent reserve engineers to ensure the integrity, accuracy and timeliness of the data used to calculate our proved, probable and possible reserves relating to our properties. Our internal technical team members meet with our independent reserve engineers periodically during the period covered by the proved, probable and possible reserve report to discuss the assumptions and methods used in the proved, probable and possible reserve estimation process. We provide historical information to CG&A for our properties, such as ownership interest, oil and natural gas production, well test data, commodity prices and our estimates of our operators’ operating and development costs. Hal Hogsett is primarily responsible for overseeing the preparation of our reserve estimates. Mr. Hogsett has substantial reservoir and operations experience having worked as a petroleum engineer since 2009 and is supported by our engineering and geoscience staff. Prior to joining our Company in 2017, Mr. Hogsett worked at Apache Corporation and Antero Resources Corporation.
The preparation of our proved, probable and possible reserve estimates were completed in accordance with our internal control procedures. These procedures, which are intended to ensure reliability of reserve estimations, include the following:
• | review and verification of historical production data, which data is based on actual production as reported by our operators; |
• | review by Hal Hogsett, our Vice President of Reservoir Engineering, of all of our reported proved, probable and possible reserves, including the review of all significant reserve changes and all new PUDs additions; |
• | verification of property ownership by our land department; |
• | review of reserve estimates by Mr. Hogsett or under his direct supervision; and |
• | direct reporting responsibilities by Mr. Hogsett to our Chief Executive Officer. |
17
Estimation of Proved Reserves. In accordance with rules and regulations of the SEC applicable to companies involved in oil and natural gas producing activities, proved reserves are those quantities of oil and natural gas, which, by analysis of geoscience and engineering data, can be estimated with reasonable certainty to be economically producible from a given date forward, from known reservoirs, and under existing economic conditions, operating methods, and government regulations. The term “reasonable certainty” means deterministically, the quantities of oil and/or natural gas are much more likely to be achieved than not, and probabilistically, there should be at least a 90% probability of recovering volumes equal to or exceeding the estimate. All of our proved reserves as of December 31, 2019, 2018 and 2017 were estimated using a deterministic method. The estimation of reserves involves two distinct determinations. The first determination results in the estimation of the quantities of recoverable oil and natural gas and the second determination results in the estimation of the uncertainty associated with those estimated quantities in accordance with the definitions established under SEC rules. The process of estimating the quantities of recoverable reserves relies on the use of certain generally accepted analytical procedures. These analytical procedures fall into four broad categories or methods: (i) production performance-based methods; (ii) material balance-based methods; (iii) volumetric-based methods; and (iv) analogy. These methods may be used singularly or in combination by the reserve evaluator in the process of estimating the quantities of reserves. Reserves for proved developed producing wells were estimated using production performance methods for the vast majority of properties. Certain new producing properties with very little production history were forecast using a combination of production performance and analogy to similar production, both of which are considered to provide a reasonably high degree of accuracy. Non-producing reserve estimates, for developed and undeveloped properties, were forecast using analogy methods. This method provides a reasonably high degree of accuracy for predicting proved developed non-producing and PUDs for our properties, due to the abundance of analog data.
To estimate economically recoverable proved reserves and related future net cash flows, we considered many factors and assumptions, including the use of reservoir parameters derived from geological and engineering data that cannot be measured directly, economic criteria based on current costs and the SEC pricing requirements and forecasts of future production rates.
Under SEC rules, reasonable certainty can be established using techniques that have been proven effective by actual production from projects in the same reservoir or an analogous reservoir or by other evidence using reliable technology that establishes reasonable certainty. Reliable technology is a grouping of one or more technologies (including computational methods) that have been field tested and have been demonstrated to provide reasonably certain results with consistency and repeatability in the formation being evaluated or in an analogous formation. To establish reasonable certainty with respect to our estimated proved reserves, the technologies and economic data used in the estimation of our proved reserves have been demonstrated to yield results with consistency and repeatability, and include production and well test data, downhole completion information, geologic data, electrical logs, radioactivity logs, core data, and historical well cost and operating expense data.
Estimation of Probable Reserves. Estimates of probable reserves are inherently imprecise. When producing an estimate of the amount of oil, natural gas and NGLs that is recoverable from a particular reservoir, an estimated quantity of probable reserves is an estimate of those additional reserves that are less certain to be recovered than proved reserves but which, together with proved reserves, are as likely as not to be recovered. Estimates of probable reserves are also continually subject to revisions based on production history, results of additional exploration and development, price changes and other factors.
When deterministic methods are used, it is as likely as not that actual remaining quantities recovered will exceed the sum of estimated proved plus probable reserves. When probabilistic methods are used, there should be at least a 50% probability that the actual quantities recovered will equal or exceed the proved plus probable reserves estimates. All of our probable reserves as of December 31, 2019, 2018 and 2017 were estimated using a deterministic method, which involves two distinct determinations: an estimation of the quantities of recoverable oil and natural gas and an estimation of the uncertainty associated with those estimated quantities in accordance with the definitions established under SEC rules. The process of estimating the quantities of recoverable oil and natural gas reserves uses the same generally accepted analytical procedures as are used in estimating proved reserves, namely production performance-based methods, material balance-based methods, volumetric-based methods and analogy. In the case of probable reserves, the recoverable reserves cannot be said to have a “high degree of confidence that the quantities will be recovered” but are “as likely as not to be recovered.” The lower degree of certainty can come from several factors including: (1) direct offset production that does not meet an economic threshold, despite localized averages that do meet that threshold, (2) an increased distance from offset production to the probable location of over one mile but under three miles, (3) a perceived risk of communication or depletion from nearby producers, (4) a perceived risk of attempting new drilling or completion technologies that have not been used in direct offset production or (5) an uncertainty regarding geologic positioning that could affect recoverable reserves. When considering the factors referenced above, the lower degree of certainty of our probable reserves came from a combination of these factors depending upon the applicable basin. Many of the probable locations assigned in our reserve reports had few uncertainties and resemble proved undeveloped locations except for their distance from commercial production. Other probable locations had uncertainties related to not only
18
distance from commercial production, but also related to well spacing and development timing. In general, we did not book probable locations if there was geologic uncertainty or if there was not commercial production to support such locations.
Estimation of Possible Reserves. Estimates of possible reserves are also inherently imprecise. When producing an estimate of the amount of oil, natural gas and NGLs that is recoverable from a particular reservoir, an estimated quantity of possible reserves is an estimate that might be achieved, but only under more favorable circumstances than are likely. Estimates of possible reserves are also continually subject to revisions based on production history, results of additional exploration and development, price changes and other factors.
When deterministic methods are used, the total quantities ultimately recovered from a project have a low probability of exceeding proved plus probable plus possible reserves. When probabilistic methods are used, there should be at least a 10% probability that the total quantities ultimately recovered will equal or exceed the proved plus probable plus possible reserves estimates. All of our possible reserves as of December 31, 2019, 2018 and 2017 were estimated using a deterministic method, which involves two distinct determinations: an estimation of the quantities of recoverable oil and natural gas and an estimation of the uncertainty associated with those estimated quantities in accordance with the definitions established under SEC rules. The process of estimating the quantities of recoverable oil and natural gas reserves uses the same generally accepted analytical procedures as are used in estimating proved reserves, namely production performance-based methods, material balance-based methods, volumetric-based methods and analogy. In the case of possible reserves, the recoverable reserves cannot be said to be “as likely as not to be recovered”, but “might be achieved, but only under more favorable circumstances than are likely.” The lower degree of certainty can come from several factors including: (1) direct offset production that does not meet an economic threshold, despite localized averages that do meet that threshold, (2) an increased distance from offset production to the possible location of over one mile but under five miles, (3) a perceived risk of communication or depletion from nearby producers, (4) a perceived risk of attempting new drilling or completion technologies that have not been used in direct offset production or (5) an uncertainty regarding geologic positioning that could affect recoverable reserves. When considering the factors referenced above, the lower degree of certainty of our possible reserves came from a combination of these factors depending upon the applicable basin. Many of the possible locations assigned in our reserve reports had few uncertainties and resemble proved undeveloped locations except for their distance from commercial production. Other possible locations had uncertainties related to not only distance from commercial production, but also related to well spacing and development timing. In general, we did not book possible locations if there was geologic uncertainty or if there was not commercial production to support such location.
Summary of Reserves. The following table presents our estimated net proved, probable and possible reserves as of December 31, 2019, 2018 and 2017, based on our proved, probable and possible reserve estimates as of such dates, which have been prepared or audited, as applicable, by CG&A, our independent petroleum engineering firm, in accordance with the rules and regulations of the SEC. All of our proved, probable and possible reserves are located in the United States.
19
Years Ended December 31, | ||||||||||||
2019 (1) | 2018 (2) | 2017 (3) | ||||||||||
Estimated proved developed reserves: | ||||||||||||
Oil (MBbls) | 9,924 | 6,067 | 2,804 | |||||||||
Natural gas (MMcf) | 33,232 | 21,735 | 13,028 | |||||||||
NGLs (MBbls) | 2,494 | 1,898 | 1,185 | |||||||||
Total (MBoe) | 17,957 | 11,588 | 6,160 | |||||||||
Estimated proved undeveloped reserves: | ||||||||||||
Oil (MBbls) | 7,037 | 6,924 | 5,920 | |||||||||
Natural gas (MMcf) | 28,498 | 30,061 | 25,373 | |||||||||
NGLs (MBbls) | 3,344 | 3,219 | 2,795 | |||||||||
Total (MBoe) | 15,131 | 15,153 | 12,944 | |||||||||
Estimated total proved reserves: | ||||||||||||
Oil (MBbls) | 16,961 | 12,991 | 8,724 | |||||||||
Natural gas (MMcf) | 61,730 | 51,796 | 38,401 | |||||||||
NGLs (MBbls) | 5,838 | 5,117 | 3,980 | |||||||||
Total (MBoe) | 33,088 | 26,741 | 19,104 | |||||||||
Estimated probable reserves: | ||||||||||||
Oil (MBbls) (4) | 16,948 | 14,854 | 11,882 | |||||||||
Natural gas (MMcf) (4) | 70,627 | 66,682 | 47,659 | |||||||||
NGLs (MBbls) (4) | 8,274 | 7,560 | 5,654 | |||||||||
Total (MBoe) (4) | 36,993 | 33,528 | 25,479 | |||||||||
Estimated possible reserves: | ||||||||||||
Oil (MBbls) (4) | 11,986 | 10,302 | 7,426 | |||||||||
Natural gas (MMcf) (4) | 33,063 | 29,775 | 21,846 | |||||||||
NGLs (MBbls) (4) | 5,024 | 3,545 | 2,738 | |||||||||
Total (MBoe) (4) | 22,521 | 18,810 | 13,805 | |||||||||
Oil and Natural Gas Prices: | ||||||||||||
Oil- WTI posted price per Bbl | $ | 55.65 | $ | 65.66 | $ | 51.34 | ||||||
Natural gas - Henry Hub spot price per Mbtu | $ | 2.60 | $ | 3.12 | $ | 2.99 | ||||||
(1) Our estimated net proved, probable and possible reserves were determined using average first-day-of-the month prices for the prior 12 months in accordance with SEC guidance. For oil and NGL volumes, the average West Texas Intermediate posted price of $55.65 per barrel as of December 31, 2019 was adjusted for quality, transportation fees and a regional price differential. NGL prices varied by basin from 13% to 30% of the WTI posted price. For gas volumes, the average Henry Hub spot price of $2.60 per MMBtu as of December 31, 2019 was adjusted for energy content, transportation fees and a regional price differential. All prices do not give effect to derivative transactions and are held constant throughout the lives of the properties. The average adjusted product prices weighted by production over the remaining lives of the properties are $51.01 per barrel of oil, $14.39 per barrel of NGL and $1.51 per Mcf of gas as of December 31, 2019.
(2) Our estimated net proved, probable and possible reserves were determined using average first-day-of-the month prices for the prior 12 months in accordance with SEC guidance. For oil and NGL volumes, the average West Texas Intermediate posted price of $65.66 per barrel as of December 31, 2018 was adjusted for quality, transportation fees and a regional price differential. NGL prices varied by basin from 22% to 41% of the WTI posted price. For gas volumes, the average Henry Hub spot price of $3.12 per MMBtu as of December 31, 2018 was adjusted for energy content, transportation fees and a regional price differential. All prices do not give effect to derivative transactions and are held constant throughout the lives of the properties. The average adjusted product prices weighted by production over the remaining lives of the properties are $61.31 per barrel of oil, $23.98 per barrel of NGL and $2.51 per Mcf of gas as of December 31, 2018.
(3) Our estimated net proved, probable and possible reserves were determined using average first-day-of-the-month prices for the prior 12 months in accordance with SEC guidance. For oil and NGL volumes, the average WTI posted price of $51.34 per barrel as of December 31, 2017 was adjusted for quality, transportation fees and a regional price differential. NGL prices varied by basin from 19% to 42% of the WTI posted price. For gas volumes, the average Henry Hub spot price of $2.99 per MMBtu as of December 31, 2017 was adjusted for energy content, transportation fees and a regional price differential. All prices do not give effect to derivative transactions and are held constant throughout the lives of the properties. The average adjusted product prices weighted by production over the remaining lives of the properties are $47.80 per barrel of oil, $18.56 per barrel of NGL and $2.74 per Mcf of gas as of December 31, 2017.
20
Reserve engineering is a subjective process of estimating volumes of economically recoverable oil and natural gas that cannot be measured in an exact manner. The accuracy of any reserve estimate is a function of the quality of available data and of engineering and geological interpretation. As a result, the estimates of different engineers often vary. In addition, the results of drilling, testing and production may justify revisions of such estimates. Accordingly, reserve estimates often differ from the quantities of oil and natural gas that are ultimately recovered. Estimates of economically recoverable oil and natural gas and of future net revenues are based on a number of variables and assumptions, all of which may vary from actual results, including geologic interpretation, prices and future production rates and costs. Please read “Item 1A. Risk Factors.”
Additional information regarding our proved, probable and possible reserves can be found in the notes to our financial statements included elsewhere in this Annual Report and the proved, probable and possible reserve reports as of December 31, 2019 and December 31, 2018 and 2017, which are included as exhibits to this Annual Report.
PUDs
As of December 31, 2019, we estimated our PUD reserves to be 7,037 MBbls of oil, 28,498 MMcf of natural gas and 3,344 MBbls of NGLs, for a total of 15,131 MBoe. PUDs will be converted from undeveloped to developed as the applicable wells begin production.
The following tables summarize our changes in PUDs during the year ended December 31, 2019 (in MBoe):
Proved Undeveloped Reserves | |||
Balance, Dec 31, 2018 | 15,153 | ||
Acquisition of reserves | 2,069 | ||
Extensions and discoveries | 1,815 | ||
Revisions of previous estimates | (2,080 | ) | |
Transfer to estimated proved developed | (1,826 | ) | |
Balance, Dec 31, 2019 | 15,131 | ||
Changes in PUDs that occurred during 2019 were primarily due to:
• | the acquisition of additional mineral and royalty interests located in the Permian, Anadarko, Williston and DJ Basins in multiple transactions, which included 2,069 MBoe of additional PUD reserves; |
• | well additions, extensions and discoveries of approximately 1,815 MBoe, as 491 horizontal well locations were converted from probable, possible and contingent resource to PUDs due to continuous activity and delineation of additional zones on our mineral and royalty interests |
• | negative revisions of 439 MBoe attributable to a reduction in SEC pricing; reclassification of 925 MBoe to non-proved due to changes in the development timing, primarily in the Anadarko Basin due to decrease in rig activity; revision of 716 MBoe attributable to 2019 NGL processing assumptions, EUR adjustments and Unit configuration; and |
• | the conversion of approximately 1,826 MBoe in PUD reserves into proved developed reserves as 346 horizontal locations were drilled and/or completed |
As a mineral and royalty interests owner, we do not incur any capital expenditures or lease operating expenses in connection with the development of our PUDs, which costs are borne entirely by the operator. As a result, during the year ended December 31, 2019, we did not have any expenditures to convert PUDs to proved developed reserves.
We identify drilling locations based on our assessment of current geologic, engineering and land data. This includes DSU formation and current well spacing information derived from state agencies and the operations of the exploration and production companies drilling our mineral and royalty interests. We generally do not have evidence of approval of our operators’ development plans, however, we use a deterministic approach to define and allocate locations to proved reserves. While many of our locations qualify as geologic PUDs, we limit our PUDs to the quantities of oil and gas that are reasonably certain to be recovered in the next five years. As of December 31, 2019 and 2018, approximately 46% and 57%, respectively, of our total proved reserves were classified as PUDs.
Oil, Natural Gas and NGL Production Prices and Costs
21
Production and Price History
The following table sets forth information regarding net production of oil, natural gas and NGLs, and certain price and cost information for each of the periods indicated:
Years Ended December 31, | ||||||||||||
2019 | 2018 | 2017 | ||||||||||
Production Data: | ||||||||||||
Oil (MBbls) | 1,515 | 777 | 454 | |||||||||
Natural gas (MMcf) | 4,707 | 2,507 | 1,768 | |||||||||
NGLs (MBbls) | 407 | 222 | 109 | |||||||||
Total (MBoe)(1)(2) | 2,706 | 1,417 | 858 | |||||||||
Average realized prices(3): | ||||||||||||
Oil ($/Bbl) | $ | 54.16 | $ | 60.56 | $ | 48.61 | ||||||
Natural gas ($/Mcf) | 2.07 | 2.80 | 3.11 | |||||||||
NGLs ($/Bbl) | 15.03 | 25.72 | 22.71 | |||||||||
Total ($/Boe)(2) | $ | 36.17 | $ | 42.19 | $ | 35.02 | ||||||
Average costs (per Boe); | ||||||||||||
Gathering, transportation and marketing | $ | 1.84 | $ | 2.78 | $ | 2.04 | ||||||
Severance and ad valorem taxes | 2.37 | 2.50 | 1.87 | |||||||||
Depreciation, depletion, and amortization | 11.43 | 9.82 | 8.10 | |||||||||
General and administrative(4) | 4.40 | 4.69 | 4.59 | |||||||||
Interest expense, net | 2.07 | 5.26 | 0.65 | |||||||||
Loss (gain) on derivative instruments, net | 0.21 | (0.30 | ) | 0.14 | ||||||||
Total | $ | 22.32 | $ | 24.75 | $ | 17.39 | ||||||
(1) May not sum or recalculate due to rounding.
(2) “Btu-equivalent” production volumes are presented on an oil-equivalent basis using a conversion factor of six Mcf of natural gas per barrel of “oil equivalent,” which is based on approximate energy equivalency and does not reflect the price or value relationship between oil and natural gas.
(3) Excludes the effect of commodity derivative instruments.
(4) General and administrative expenses exclude share-based compensation expenses.
Productive Wells
Productive wells consist of producing horizontal wells, wells capable of production and exploratory, development or extension wells that are not dry wells. As of December 31, 2019, we owned mineral and royalty interests in 4,908 gross productive horizontal wells, which consisted of 4,424 oil wells and 484 natural gas wells.
We do not own any working interests in any wells. Accordingly, we do not own any net wells as such term is defined by Item 1208(c)(2) of Regulation S-K.
Acreage
The following table sets forth information relating to our acreage for our mineral and royalty interests as of December 31, 2019:
Basin | Gross DSU Acreage | Net Royalty Acreage | 100% Royalty Acreage | |||||
Delaware | 301,500 | 25,750 | 3,200 | |||||
Midland | 84,550 | 4,100 | 500 | |||||
SCOOP | 204,600 | 11,100 | 1,400 | |||||
STACK | 179,950 | 10,700 | 1,350 | |||||
DJ | 171,950 | 15,600 | 1,950 | |||||
Williston | 487,600 | 7,750 | 950 | |||||
Other | 143,800 | 7,200 | 900 | |||||
Total | 1,573,950 | 82,200 | 10,250 | |||||
22
The vast majority of our mineral and royalty interests are leased to our operators with greater than 85% of our approximately 78,500 leased net royalty acres being held by production as of December 31, 2019. In addition, we had 3,700 net royalty acres that were not leased as of December 31, 2019.
Drilling Results
The following table sets forth information with respect to the number of wells turned to production on our properties during the periods indicated. The information should not be considered indicative of future performance, nor should it be assumed that there is necessarily any correlation among the number of productive wells drilled, the quantities of reserves found and the economic value. Productive wells are those that produce commercial quantities of hydrocarbons, whether or not they produce a reasonable rate of return. As a mineral and royalty interest owner, we generally are not provided information as to whether any wells drilled on the properties underlying our acreage are classified as exploratory.
Years Ended December 31, | |||||||||
2019 | 2018 | 2017 | |||||||
Development wells: | |||||||||
Productive | 906 | 1,036 | 656 | ||||||
Dry(1) | — | — | — | ||||||
Total | 906 | 1,036 | 656 | ||||||
(1) We are not aware of any dry holes drilled on the acreage underlying our mineral and royalty interests during the relevant periods.
Regulation of Environmental and Occupational Safety and Health Matters
Oil, natural gas and NGL exploration, development and production operations are subject to stringent laws and regulations governing the discharge of materials into the environment or otherwise relating to protection of the environment or occupational health and safety. These laws and regulations have the potential to impact production on our properties, including requirements to:
• | obtain permits to conduct regulated activities; |
• | limit or prohibit drilling activities on certain lands lying within wilderness, wetlands and other protected areas; |
• | restrict the types, quantities and concentration of materials that can be released into the environment in the performance of drilling and production activities; |
• | initiate investigatory and remedial measures to mitigate pollution from former or current operations, such as restoration of drilling pits and plugging of abandoned wells; |
• | apply specific health and safety criteria addressing worker protection; and |
• | impose substantial liabilities for pollution resulting from operations. |
Failure to comply with environmental laws and regulations may result in the assessment of administrative, civil and criminal sanctions, including monetary penalties, the imposition of strict, joint and several liability, investigatory and remedial obligations and the issuance of injunctions limiting or prohibiting some or all of the operations on our properties. Moreover, these laws, rules and regulations may restrict the rate of oil, natural gas and NGL production below the rate that would otherwise be possible. The regulatory burden on the oil and natural gas industry increases the cost of doing business in the industry and consequently affects profitability. The trend in environmental regulation has been to place more restrictions and limitations on activities that may affect the environment, and thus, any changes in environmental laws and regulations or re-interpretation of enforcement policies that result in more stringent and costly construction, drilling, water management, completion, emission or discharge limits or waste handling, disposal or remediation obligations could increase the cost to our operators of developing our properties. Moreover, accidental releases or spills may occur in the course of operations on our properties, causing our operators to incur significant costs and liabilities as a result of such releases or spills, including any third-party claims for damage to property, natural resources or persons.
Increased costs or operating restrictions on our properties as a result of compliance with environmental laws could result in reduced exploratory and production activities on our properties and, as a result, our revenues and results of operations. The
23
following is a summary of certain existing environmental, health and safety laws and regulations, each as amended from time to time, to which operations on our properties are subject.
Hazardous Substances and Waste Handling
The Comprehensive Environmental Response, Compensation and Liability Act, or “CERCLA,” also known as the Superfund law, and comparable state laws impose liability without regard to fault or the legality of the original conduct on certain classes of persons who are considered to be responsible for the release of a “hazardous substance” into the environment. Under CERCLA, these “responsible persons” may include the owner or operator of the site where the release occurred, and entities that transport, dispose of or arrange for the transport or disposal of hazardous substances released at the site. These responsible persons may be subject to joint and several strict liability for the costs of cleaning up the hazardous substances that have been released into the environment, for damages to natural resources and for the costs of certain health studies. CERCLA also authorizes the EPA and, in some instances, third parties to act in response to threats to the public health or the environment and to seek to recover from the responsible classes of persons the costs they incur. It is not uncommon for neighboring landowners and other third-parties to file claims for personal injury and property damage allegedly caused by the hazardous substances released into the environment.
The Resource Conservation and Recovery Act (“RCRA”) and comparable state laws control the management and disposal of hazardous and non-hazardous waste. These laws and regulations govern the generation, storage, treatment, transfer and disposal of wastes generated. Drilling fluids, produced waters and most of the other wastes associated with the exploration, development and production of oil, natural gas and NGLs, if properly handled, are currently exempt from regulation as hazardous waste under RCRA and, instead, are regulated under RCRA’s less stringent non-hazardous waste provisions, state laws or other federal laws. However, it is possible that certain oil, natural gas and NGL drilling and production wastes now classified as non-hazardous could be classified as hazardous wastes in the future. Any such change could result in an increase in the costs to manage and dispose of wastes, which could increase the costs of our operators’ operations.
Certain of our properties have been used for oil and natural gas exploration and production for many years. Although the operators may have utilized operating and disposal practices that were standard in the industry at the time, petroleum hydrocarbons and wastes may have been disposed of or released on or under our properties, or on or under other offsite locations where these petroleum hydrocarbons and wastes have been taken for recycling or disposal. Our properties and the petroleum hydrocarbons and wastes disposed or released thereon may be subject to CERCLA, RCRA and analogous state laws. Under such laws, the owner or operator could be required to remove or remediate previously disposed wastes, to clean up contaminated property and to perform remedial operations such as restoration of pits and plugging of abandoned wells to prevent future contamination or to pay some or all of the costs of any such action.
Water Discharges and NORM
The Federal Water Pollution Control Act, also known as the “Clean Water Act,” and analogous state laws impose restrictions and strict controls with respect to the discharge of pollutants, including spills and leaks of oil, into federal and state waters. The discharge of pollutants into regulated waters is prohibited, except in accordance with the terms of a permit issued by the EPA or an analogous state agency. In June 2015, the EPA and the U.S. Army Corps of Engineers (the “Corps”) published a final rule attempting to clarify the federal jurisdictional reach over waters of the United States ("WOTUS"). Following the change in U.S. Presidential Administrations, there have been several attempts to modify or eliminate this rule. Most recently, on January 23, 2020, the EPA and Corps replaced the WOTUS rule adopted in 2015 with the narrower Navigable Waters Protection Rule, and litigation is expected. Therefore, the scope of jurisdiction under the CWA is uncertain at this time, and any increase in scope could result in increased costs or delays with respect to obtaining permits for certain activities for our operators. In addition, federal and state regulatory agencies can impose administrative, civil and criminal penalties for non-compliance with discharge permits or other requirements of the Clean Water Act and analogous state laws and regulations. Spill prevention, control and countermeasure plan requirements imposed under the Clean Water Act require appropriate containment berms and similar structures to help prevent the contamination of navigable waters in the event of a hydrocarbon tank spill, rupture or leak. In addition, the Clean Water Act and analogous state laws require individual permits or coverage under general permits for discharges of storm water runoff from certain types of facilities. The Oil Pollution Act of 1990, as amended, or “OPA,” amends the Clean Water Act and establishes strict liability and natural resource damages liability for unauthorized discharges of oil into waters of the United States. OPA requires owners or operators of certain onshore facilities to prepare Facility Response Plans for responding to a worst case discharge of oil into waters of the United States.
In addition, naturally occurring radioactive material (“NORM”) is brought to the surface in connection with oil and gas production. Concerns have arisen over traditional NORM disposal practices (including discharge through publicly owned treatment works into surface waters), which may increase the costs associated with management of NORM.
24
Air Emissions
The Clean Air Act of 1963 ("CAA") and comparable state laws restrict the emission of air pollutants from many sources through air emissions permitting programs and also impose various monitoring and reporting requirements. These laws and regulations may require our operators to obtain pre-approval for the construction or modification of certain projects or facilities expected to produce or significantly increase air emissions, obtain and strictly comply with stringent air permit requirements or incur development expenses to install and utilize specific equipment or technologies to control emissions. For example, in June 2016 the EPA finalized rules regarding criteria for aggregating multiple small surface sites into a single source for air-quality permitting purposes applicable to the oil and gas industry. This rule could cause small facilities, on an aggregate basis, to be deemed a major source, thereby triggering more stringent air permitting processes and requirements. Separately, in December 2019, the EPA reclassified Colorado’s ozone nonattainment areas under the National Ambient Air Quality Standards from moderate to serious nonattainment; as a result, also in December 2019, the Colorado Air Quality Control Commission approved a set of new rules to reduce emissions from oil and gas operations in the state. These revisions could increase the costs of development and production on our properties, potentially impairing the economic development of our properties. Obtaining permits has the potential to delay the development of oil and natural gas projects. Federal and state regulatory agencies may impose administrative, civil and criminal penalties for non-compliance with air permits or other requirements of the CAA and associated state laws and regulations.
Climate Change
The threat of climate change continues to attract considerable attention in the United States and in foreign countries, numerous proposals have been made and could continue to be made at the international, national, regional, and state levels of government to monitor and limit existing emissions of GHGs as well as to restrict or eliminate such future emissions.
In the United States, no comprehensive climate change legislation has been implemented at the federal level. However, following the U.S. Supreme Court finding that GHG emissions constitute a pollutant under the CAA, the EPA has adopted regulations that, among other things, establish construction and operating permit reviews for GHG emissions from certain large stationary sources, require the monitoring and annual reporting of GHG emissions from certain petroleum and natural gas system sources in the United States, implement New Source Performance Standards directing the reduction of methane from certain new, modified, or reconstructed facilities in the oil and natural gas sector, and together with the DOT, implementing GHG emissions limits on vehicles manufactured for operation in the United States. For example, in June 2016, the EPA finalized rules that establish new air emission controls for methane emissions from certain new, modified, or reconstructed equipment and processes in the oil and natural gas source category, including production, processing, transmission, and storage activities, otherwise known as Subpart OOOOa. Following the change in administration, there have been attempts to modify these regulations, and litigation is ongoing.
Additionally, various states and groups of states have adopted or are considering adopting legislation, regulation or other regulatory initiatives that are focused on such areas GHG cap and trade programs, carbon taxes, reporting and tracking programs, and restriction of emissions. At the international level, there is an agreement, the United Nations- sponsored "Paris Agreement," for nations to limit their GHG emissions through non-binding, individually-determined reduction goals every five years after 2020, although the United States has announced its withdrawal from such agreement, effective November 4, 2020.
Governmental, scientific, and public concern over the threat of climate change arising from GHG emissions has resulted in increasing political risks in the United States, including climate change related pledges made by certain candidates seeking the office of the President of the United States in 2020. Two critical declarations made by one or more candidates running for the Democratic nomination for President include threats to take actions banning hydraulic fracturing of oil and natural gas wells and banning new leases for production of minerals on federal properties, including onshore lands and offshore waters. Other actions that could be pursued by presidential candidates may include the imposition of more restrictive requirements for the establishment of pipeline infrastructure or the permitting of LNG export facilities, as well as, the reversal of the United Sates' withdrawal from the Paris Agreement in November 2020. Litigation risks are also increasing as a number of cities and other local governments have sought to bring suit against the largest oil and natural gas exploration and production companies in state or federal court, alleging among other things, that such companies created public nuisances by producing fuels that contributed to global warming effects, such as rising sea levels, and therefore are responsible for roadway and infrastructure damages as a result, or alleging that the companies have been aware of the adverse effects of climate change for some time but defrauded their investors by failing to adequately disclose those impacts.
There are also increasing financial risks for fossil fuel producers as shareholders currently invested in fossil-fuel energy companies concerned about the potential effects of climate change may elect in the future to shift some or all of their investments into non-energy related sectors. Institutional lenders who provide financing to fossil-fuel energy companies also have become more attentive to sustainable lending practices and some of them may elect not to provide funding for fossil fuel
25
energy companies. Additionally, the lending practices of institutional lenders have been the subject of intensive lobbying efforts in recent years, oftentimes public in nature, by environmental activists, proponents of the international Paris Agreement, and foreign citizenry concerned about climate change not to provide funding for fossil fuel producers. Limitation of investments in and financing for fossil fuel energy companies could result in the restriction, delay or cancellation of drilling programs or development or production activities.
The adoption and implementation of new or more stringent international, federal or state legislation, regulations or other regulatory initiatives that impose more stringent standards for GHG emissions from the oil and natural gas sector or otherwise restrict the areas in which this sector may produce oil and natural gas or generate the GHG emissions could result in increased costs of compliance or costs of consuming, and thereby reduce demand for oil and natural gas, which could reduce the profitability of our interests. Additionally, political, litigation and financial risks may result in our oil and natural gas operators restricting or cancelling production activities, incurring liability for infrastructure damages as a result of climatic changes, or impairing their ability to continue to operate in an economic manner, which also could reduce the profitability of our interests. One or more of these developments could have a material adverse effect on our business, financial condition and results of operation.
Hydraulic Fracturing Activities
A substantial portion of the production on our properties involved the use of hydraulic fracturing techniques. Hydraulic fracturing is an important and common practice that is used to stimulate production of oil, natural gas and NGLs from dense subsurface rock formations. The hydraulic fracturing process involves the injection of water, sand and chemical additives under pressure into the formation to fracture the surrounding rock and stimulate production.
Hydraulic fracturing typically is regulated by state oil and natural gas commissions or similar agencies, but the EPA has asserted federal regulatory authority pursuant to the U.S. Safe Drinking Water Act ("SDWA") over certain hydraulic fracturing activities involving the use of diesel fuel in fracturing fluids and issued permitting guidance that applies to such activities. Additionally, the EPA issued final CAA regulations in 2012 and in June 2016 governing performance standards, including standards for the capture of emissions of methane and VOCs released during hydraulic fracturing and separately published in June 2016 an effluent limit guideline final rule prohibiting the discharge of wastewater from onshore unconventional oil and natural gas extraction facilities to publicly owned wastewater treatment plants. In August 2019, the EPA proposed amendments to the 2016 standards that, among other things, would remove sources in the transmission and storage segment from the oil and natural gas source category and rescind the methane-specific requirements applicable to sources in the production and processing segments of the industry. As an alternative, the EPA also proposed to rescind the methane-specific requirements that apply to all sources in the oil and natural gas industry, without removing the transmission and storage sources from the current source category. Legal challenges to any final rulemaking that rescinds the 2016 standards are expected.
Also, in December 2016, the EPA released its final report on the potential impacts of hydraulic fracturing on drinking water resources. The final report concluded that “water cycle” activities associated with hydraulic fracturing may impact drinking water resources “under some circumstances,” noting that the following hydraulic fracturing water cycle activities and local- or regional-scale factors are more likely than others to result in more frequent or more severe impacts: water withdrawals for fracturing in times or areas of low water availability; surface spills during the management of fracturing fluids, chemicals or produced water; injection of fracturing fluids into wells with inadequate mechanical integrity; injection of fracturing fluids directly into groundwater resources; discharge of inadequately treated fracturing wastewater to surface waters; and disposal or storage of fracturing wastewater in unlined pits.
In addition, various state and local governments have implemented, or are considering, increased regulatory oversight of hydraulic fracturing through additional permit requirements, operational restrictions, disclosure requirements, well construction and temporary or permanent bans on hydraulic fracturing in certain areas. For example, Texas, Colorado and North Dakota, among others, have adopted regulations that impose new or more stringent permitting, disclosure, disposal and well construction requirements on hydraulic fracturing operations. States could also elect to prohibit high volume hydraulic fracturing altogether. Separately, in Texas, there has been increased pressure on the Railroad Commission (“RRC”) to impose more stringent limitations on the flaring of gas from oil wells to prevent waste and because of increased concerns related to the environmental effects of flaring. The RRC continues to approve flaring permits, but at least one lawsuit has been filed by a pipeline operator challenging the RRC’s flaring approval practices. While no regulations have been proposed by the RRC to date, any future requirements limiting flaring could adversely affect exploration and production activities on our properties and result in increased costs to connect wells to pipelines. In addition to state laws, local land use restrictions, such as city ordinances, may restrict drilling in general and/or hydraulic fracturing in particular. For more information on such restrictions in Colorado, see "Item 1A. Risk Factors—Implementation of new Colorado Senate Bill 19-181 may increase costs and limit oil and natural gas exploration and production operations in the state, which could adversely impact future production from our properties and have an adverse effect on our business, financial condition and results of operations." If new federal, state or
26
local laws or regulations that significantly restrict hydraulic fracturing are adopted, such legal requirements could result in delays, eliminate certain drilling and injection activities and make it more difficult or costly to perform hydraulic fracturing. Any such regulations limiting or prohibiting hydraulic fracturing could result in decreased oil, natural gas and NGL exploration and production activities and, therefore, adversely affect the development of our properties.
Endangered Species Act
The Endangered Species Act (the “ESA”) restricts activities that may affect endangered and threatened species or their habitats. The designation of previously unidentified endangered or threatened species could cause our operators to incur additional costs or become subject to operating delays, restrictions or bans in the affected areas. Recently, there have been renewed calls to review protections currently in place for the dunes sagebrush lizard, whose habitat includes the Permian Basin; Lesser Prairie Chicken, which can be found in portions of the Central and Southern Great Plains; and Greater Sage Grouse, which can be found across a large swath of the northwestern United States in oil and gas producing states, and to reconsider listing the species under the ESA. To the extent species are listed under the ESA or similar state laws, or previously unprotected species are designated as threatened or endangered in areas where our properties are located, operations on those properties could incur increased costs arising from species protection measures and face delays or limitations with respect to production activities thereon.
Employee Health and Safety
Operations on our properties are subject to a number of federal and state laws and regulations, including the federal Occupational Safety and Health Act, or “OSHA,” and comparable state statutes, whose purpose is to protect the health and safety of workers. In addition, the OSHA hazard communication standard, the EPA community right-to-know regulations under Title III of the federal Superfund Amendment and Reauthorization Act and comparable state statutes require that information be maintained concerning hazardous materials used or produced in operations and that this information be provided to employees, state and local government authorities and citizens.
Title to Properties
Prior to completing an acquisition of mineral and royalty interests, we perform a title review on each tract to be acquired. Our title review is meant to confirm the quantum of mineral and royalty interest owned by a prospective seller, the property’s lease status and royalty amount as well as encumbrances or other related burdens. For our Texas properties, we obtain a limited title memorandum rendered by an oil and gas law firm. As a result, title examinations have been obtained on a significant portion of our properties.
In addition to our initial title work, operators often will conduct a thorough title examination prior to leasing and/or drilling a well. Should an operator’s title work uncover any further title defects, either we or the operator will perform curative work with respect to such defects. An operator generally will not commence drilling operations on a property until any material title defects on such property have been cured. We believe that the title to our assets is satisfactory in all material respects. Although title to these properties is in some cases subject to encumbrances, such as customary interests generally retained in connection with the acquisition of oil and gas interests, non-participating royalty interests and other burdens, easements, restrictions or minor encumbrances customary in the oil and natural gas industry, we believe that none of these encumbrances will materially detract from the value of these properties or from our interest in these properties.
Competition
The oil and natural gas business is highly competitive in the exploration for and acquisition of reserves, the acquisition of minerals and oil and natural gas leases and personnel required to find and produce reserves. Many of our competitors not only own and acquire mineral and royalty interests but also explore for and produce oil and natural gas and, in some cases, carry on midstream and refining operations and market petroleum and other products on a regional, national or worldwide basis. By engaging in such other activities, our competitors may be able to develop or obtain information that is superior to the information that is available to us. In addition, certain of our competitors may possess financial or other resources substantially larger than we possess. Our ability to acquire additional minerals and properties and to discover reserves in the future will be dependent upon our ability to evaluate and select suitable properties and to consummate transactions in a highly competitive environment.
In addition, oil and natural gas products compete with other forms of energy available to customers, primarily based on price. These alternate forms of energy include electricity, coal, and fuel oils. Changes in the availability or price of oil and natural gas or other forms of energy, as well as business conditions, conservation, legislation, regulations, and the ability to convert to alternate fuels and other forms of energy may affect the demand for oil and natural gas.
27
Seasonality of Business
Weather conditions affect the demand for, and prices of, natural gas and can also delay drilling activities, disrupting our overall business plans. Additionally, some of the areas in which our properties are located are adversely affected by seasonal weather conditions, primarily in the winter and spring. During periods of heavy snow, ice or rain, our operators may be unable to move their equipment between locations, thereby reducing their ability to operate our wells, reducing the amount of oil and natural gas produced from the wells on our properties during such times. Additionally, extended drought conditions in the areas in which our properties are located could impact our operators’ ability to source sufficient water or increase the cost for such water. Furthermore, demand for natural gas is typically higher during the winter, resulting in higher natural gas prices for our natural gas production during our first and fourth quarters. Certain natural gas users utilize natural gas storage facilities and purchase some of their anticipated winter requirements during the summer, which can lessen seasonal demand fluctuations. Seasonal weather conditions can limit drilling and producing activities and other oil and natural gas operations in a portion of our operating areas. Due to these seasonal fluctuations, our results of operations for individual quarterly periods may not be indicative of the results that we may realize on an annual basis.
Employees
As of December 31, 2019, we had 41 full-time employees. We hire independent contractors on an as needed basis. We have no collective bargaining agreements with our employees. We believe that our employee relationships are satisfactory.
Legal Proceedings
We are party to lawsuits arising in the ordinary course of our business. We cannot predict the outcome of any such lawsuits with certainty, but management believes it is remote that pending or threatened legal matters will have a material adverse impact on our financial condition.
Due to the nature of our business, we are, from time to time, involved in other routine litigation or subject to disputes or claims related to our business activities, including workers’ compensation claims and employment related disputes. In the opinion of our management, none of these other pending litigations, disputes or claims against us, if decided adversely, will have a material adverse effect on our financial condition, free cash flow or results of operations.
ITEM 1A. RISK FACTORS
Risk Factors
The following are certain risk factors that affect our business, financial condition, results of operations and cash flows. Many of these risks are beyond our control. These risk factors are not exhaustive and investors are encouraged to perform their own investigation with respect to our business, financial condition and prospects. You should carefully consider the following risk factors in addition to the other information included in this Annual Report, including matters addressed under “Cautionary Statement Regarding Forward-Looking Statements.” If any of the events described below were to actually occur, our business, financial condition, results of operations and cash flows could be adversely affected and our results could differ materially from expected and historical results, any of which may also adversely affect the holders of our Class A common stock.
Risks Related to Our Business
Substantially all of our revenues are derived from royalty payments that are based on the price at which oil, natural gas and NGLs produced from the acreage underlying our interests are sold. Prices of oil, natural gas and NGLs are volatile due to factors beyond our control. A substantial or extended decline in commodity prices may adversely affect our business, financial condition or results of operations.
Our revenues, operating results, free cash flow and the carrying value of our mineral and royalty interests depend significantly upon the prevailing prices for oil, natural gas and NGLs. Historically, oil, natural gas and NGL prices have been volatile and are subject to fluctuations in response to changes in supply and demand, market uncertainty and a variety of additional factors that are beyond our control, including:
• | the domestic and foreign supply of and demand for oil, natural gas and NGLs; |
• | market expectations about future prices of oil, natural gas and NGLs; |
• | the level of global oil, natural gas and NGL exploration and production; |
28
• | the cost of exploring for, developing, producing and delivering oil, natural gas and NGLs; |
• | the price and quantity of foreign imports and U.S. exports of oil, natural gas and NGLs; |
• | the level of U.S. domestic production; |
• | political and economic conditions in oil producing regions, including the Middle East, Africa, South America and Russia; |
• | the ability of members of the Organization of Petroleum Exporting Countries (“OPEC”) to agree to and maintain oil price and production controls; |
• | trading in oil, natural gas and NGL derivative contracts; |
• | the level of consumer product demand; |
• | weather conditions and natural disasters; |
• | technological advances affecting energy consumption, energy storage and energy supply; |
• | domestic and foreign governmental regulations and taxes; |
• | the continued threat of terrorism and the impact of military and other action, including U.S. military operations in the Middle East and economic sanctions such as those imposed by the U.S. on oil and gas exports from Iran; |
• | global or national health concerns, including health epidemics such as the coronavirus outbreak at the beginning of 2020; |
• | the proximity, cost, availability and capacity of oil, natural gas and NGL pipelines and other transportation facilities; |
• | the price and availability of alternative fuels; and |
• | overall domestic and global economic conditions. |
These factors and the volatility of the energy markets make it extremely difficult to predict future oil, natural gas and NGL price movements with any certainty. For example, during the past five years, the posted price for West Texas Intermediary (“WTI”) light sweet crude oil has ranged from a low of $26.19 per barrel in February 2016 to a high of $77.41 per barrel in June 2018, and the Henry Hub spot market price of natural gas has ranged from a low of $1.49 per MMBtu in March 2016 to a high of $6.24 per MMBtu in January 2018.
Any substantial decline in the price of oil, natural gas and NGLs or prolonged period of low commodity prices will materially adversely affect our business, financial condition, results of operations and free cash flow. In addition, lower oil, natural gas and NGL prices may reduce the amount of oil, natural gas and NGLs that can be produced economically by our operators, which may reduce our operators’ willingness to develop our properties. This may result in our having to make substantial downward adjustments to our estimated proved, probable or possible reserves, which could negatively impact our borrowing base and our ability to fund our operations. If this occurs or if production estimates change or exploration or development results deteriorate, the full cost method of accounting principles may require us to write down, as a non-cash charge to earnings, the carrying value of our oil and natural gas properties. Our operators could also determine during periods of low commodity prices to shut in or curtail production from wells on our properties. In addition, they could determine during periods of low commodity prices to plug and abandon marginal wells that otherwise may have been allowed to continue to produce for a longer period under conditions of higher prices. Specifically, they may abandon any well if they reasonably believe that the well can no longer produce oil, natural gas or NGLs in commercially paying quantities.
We depend on various unaffiliated operators for all of the exploration, development and production on the properties underlying our mineral and royalty interests. Substantially all of our revenue is derived from royalty payments made by these operators. A reduction in the expected number of wells to be drilled on our acreage by these operators or the failure of our operators to adequately and efficiently develop and operate our acreage could have an adverse effect on our results of operations. In particular, a number of our operators have announced a reduction in projected capital expenditures for 2020. The number of new wells drilled in certain of our focus areas has recently decreased, particularly in the STACK play in Oklahoma, and such slower development pace may continue in the future.
Our assets consist of mineral and royalty interests. Because we depend on third-party operators for all of the exploration, development and production on our properties, we have little to no control over the operations related to our properties. For the year ended December 31, 2019, we received revenues from over 100 operators with approximately 61% coming from the top ten operators on our properties. The failure of our operators to adequately or efficiently perform operations or an operator’s failure to act in ways that are in our best interests could reduce production and revenues. Furthermore, our operators may reduce capital
29
expenditures devoted to exploration, development and production on our properties, which could negatively impact revenues we receive. In particular, due in part to demand from certain investors for energy companies to exercise capital discipline by reducing capital expenditures, a number of our operators have announced a reduction in projected capital expenditures for 2020. The number of new wells drilled in certain of our focus areas has recently decreased, particularly in the STACK play in Oklahoma, and such slower development pace may continue in the future. Moreover, over the last year, many of our operators have announced that they plan to drill fewer wells per section than previously anticipated, due in part to greater well-interference between parent and child wells than previously anticipated and an increased focus on overall field economics in a low commodity price environment.
If production on our mineral and royalty interests decreases due to decreased development activities, as a result of the low commodity price environment, limited development capital available, production-related difficulties or otherwise, our results of operations may be adversely affected. Our operators are often not obligated to undertake any development activities other than those required to maintain their leases on our acreage. In the absence of a specific contractual obligation, any development and production activities will be subject to their reasonable discretion (subject to certain implied obligations to develop imposed by the laws of some states). Our operators could determine to drill and complete fewer wells on our acreage than is currently expected. The success and timing of drilling and development activities on our properties, and whether the operators elect to drill any additional wells on our acreage, depends on a number of factors that are largely outside of our control, including:
• | the capital costs required for drilling activities by our operators, which could be significantly more than anticipated; |
• | the ability of our operators to access capital; |
• | prevailing commodity prices; |
• | the availability of suitable drilling equipment, production and transportation infrastructure and qualified operating personnel; |
• | the operators’ expertise, operating efficiency and financial resources; |
• | approval of other participants in drilling wells; |
• | the operators’ expected return on investment in wells drilled on our acreage as compared to opportunities in other areas; |
• | the selection of technology; |
• | the selection of counterparties for the marketing and sale of production; and |
• | the rate of production of the reserves. |
The operators may elect not to undertake development activities, or may undertake these activities in an unanticipated fashion, which may result in significant fluctuations in our results of operations and free cash flow. Sustained reductions in production by the operators on our properties may also adversely affect our results of operations and free cash flow. Additionally, if an operator were to experience financial difficulty, the operator might not be able to pay its royalty payments or continue its operations, which could have a material adverse impact on us.
Our failure to successfully identify, complete and integrate acquisitions could adversely affect our growth and results of operations.
We depend partly on acquisitions to grow our reserves, production and free cash flow. Our decision to acquire a property will depend in part on the evaluation of data obtained from production reports and engineering studies, geophysical and geological analyses and seismic data, and other information, the results of which are often inconclusive and subject to various interpretations. The successful acquisition of properties requires an assessment of several factors, including:
• | recoverable reserves; |
• | future oil, natural gas and NGL prices and their applicable differentials; |
• | development plans; |
• | the operating costs our operators would incur to develop and operate the properties; and |
• | potential environmental and other liabilities that operators of the properties may incur. |
The accuracy of these assessments is inherently uncertain and we may not be able to identify attractive acquisition opportunities. In connection with these assessments, we perform a review of the subject properties that we believe to be generally consistent with industry practices, given the nature of our interests. Our review will not reveal all existing or potential problems nor will it permit us to become sufficiently familiar with the properties to assess fully their deficiencies and capabilities. Even if
30
we do identify attractive acquisition opportunities, we may not be able to complete the acquisition or do so on commercially acceptable terms.
There is intense competition for acquisition opportunities in our industry. Competition for acquisitions may increase the cost of, or cause us to refrain from, completing acquisitions. Our ability to complete acquisitions is dependent upon, among other things, our ability to obtain debt and equity financing. In addition, these acquisitions may be in geographic regions in which we do not currently hold properties, which could subject us to additional and unfamiliar legal and regulatory requirements. Further, the success of any completed acquisition will depend on our ability to integrate effectively the acquired assets into our existing operations. The process of integrating acquired assets may involve unforeseen difficulties and may require a disproportionate amount of our managerial and financial resources.
No assurance can be given that we will be able to identify suitable acquisition opportunities, negotiate acceptable terms, obtain financing for acquisitions on acceptable terms or successfully acquire identified targets. Our failure to achieve consolidation savings, to integrate the acquired businesses and assets into our existing operations successfully or to minimize any unforeseen operational difficulties could have a material adverse effect on our financial condition, results of operations and free cash flow. The inability to effectively manage the integration of acquisitions could reduce our focus on subsequent acquisitions and current operations, which, in turn, could negatively impact our growth, results of operations and free cash flow.
Any acquisitions of additional mineral and royalty interests that we complete will be subject to substantial risks.
Even if we do make acquisitions that we believe will increase our cash generated from operations, any acquisition involves potential risks, including, among other things:
• | the validity of our assumptions about estimated proved, probable and possible reserves, future production, prices, revenues, capital expenditures, the operating expenses and costs our operators would incur to develop the minerals; |
• | a decrease in our liquidity by using a significant portion of our cash generated from operations or borrowing capacity to finance acquisitions; |
• | a significant increase in our interest expense or financial leverage if we incur debt to finance acquisitions; |
• | the assumption of unknown liabilities, losses or costs for which we are not indemnified or for which any indemnity we receive is inadequate; |
• | mistaken assumptions about the overall cost of equity or debt; |
• | our ability to obtain satisfactory title to the assets we acquire; |
• | an inability to hire, train or retain qualified personnel to manage and operate our growing business and assets; and |
• | the occurrence of other significant changes, such as impairment of oil and natural gas properties, goodwill or other intangible assets, asset devaluation or restructuring charges. |
Our operators’ identified potential drilling locations are susceptible to uncertainties that could materially alter the occurrence or timing of their drilling.
The ability of our operators to drill and develop identified potential drilling locations depends on a number of uncertainties, including the availability of capital, construction of and limitations on access to infrastructure, inclement weather, regulatory changes and approvals, oil, natural gas and NGL prices, costs, drilling results and the availability of water. Further, our operators’ identified potential drilling locations are in various stages of evaluation, ranging from locations that are ready to drill to locations that will require substantial additional interpretation. The use of technologies and the study of producing fields in the same area will not enable our operators to know conclusively prior to drilling whether oil, natural gas or NGLs will be present or, if present, whether oil, natural gas or NGLs will be present in sufficient quantities to be economically viable. Even if sufficient amounts of oil or natural gas exist, our operators may damage the potentially productive hydrocarbon-bearing formation or experience mechanical difficulties while drilling or completing the well, possibly resulting in a reduction in production from the well or abandonment of the well. If our operators drill additional wells that they identify as dry holes in current and future drilling locations, their drilling success rate may decline and materially harm their business as well as ours.
We cannot assure you that the analogies our operators draw from available data from the wells on our acreage, more fully explored locations or producing fields will be applicable to their drilling locations. Further, initial production rates reported by our or other operators in the areas in which our reserves are located may not be indicative of future or long-term production rates. Additionally, actual production from wells may be less than expected. For example, a number of operators have recently announced that newer wells drilled close in proximity to already producing wells have produced less oil and gas than forecast. Because of
31
these uncertainties, we do not know if the potential drilling locations our operators have identified will ever be drilled or if our operators will be able to produce oil, natural gas or NGLs from these or any other potential drilling locations. As such, the actual drilling activities of our operators may materially differ from those presently identified, which could adversely affect our business, results of operation and free cash flow.
Finally, the potential drilling locations we have identified are based on the geologic and other data available to us and our interpretation of such data. As a result, our operators may have reached different conclusions about the potential drilling locations on our properties, and our operators control the ultimate decision as to where and when a well is drilled.
We may experience delays in the payment of royalties and be unable to replace operators that do not make required royalty payments, and we may not be able to terminate our leases with defaulting lessees if any of the operators on those leases declare bankruptcy.
A failure on the part of the operators to make royalty payments gives us the right to terminate the lease, repossess the property and enforce payment obligations under the lease. If we repossessed any of our properties, we would seek a replacement operator. However, we might not be able to find a replacement operator and, if we did, we might not be able to enter into a new lease on favorable terms within a reasonable period of time. In addition, the outgoing operator could be subject to a proceeding under Title 11 of the United States Code (the “Bankruptcy Code”), in which case our right to enforce or terminate the lease for any defaults, including non-payment, may be substantially delayed or otherwise impaired. In general, in a proceeding under the Bankruptcy Code, the bankrupt operator would have a substantial period of time to decide whether to ultimately reject or assume the lease, which could prevent the execution of a new lease or the assignment of the existing lease to another operator. In the event that the operator rejected the lease, our ability to collect amounts owed would be substantially delayed, and our ultimate recovery may be only a fraction of the amount owed or nothing. In addition, if we are able to enter into a new lease with a new operator, the replacement operator may not achieve the same levels of production or sell oil or natural gas at the same price as the operator it replaced.
Acquisitions and our operators’ development activities of our leases will require substantial capital, and we and our operators may be unable to obtain needed capital or financing on satisfactory terms or at all.
The oil and natural gas industry is capital intensive. We make and expect to continue to make substantial capital expenditures in connection with the acquisition of mineral and royalty interests. To date, we have financed capital expenditures primarily with funding from capital contributions, cash generated by operations, proceeds from our IPO and from the December 2019 Offering and borrowings under our debt arrangements.
In the future, we may need capital in excess of the amounts we retain in our business or borrow under our revolving credit facility. We cannot assure you that we will be able to access external capital on terms favorable to us or at all. If we are unable to fund our capital requirements, we may be unable to complete acquisitions, take advantage of business opportunities or respond to competitive pressures, any of which could have a material adverse effect on our results of operation and free cash flow.
Most of our operators are also dependent on the availability of external debt and equity financing sources to maintain their drilling programs. If those financing sources are not available to the operators on favorable terms or at all, then we expect the development of our properties to be adversely affected. If the development of our properties is adversely affected, then revenues from our mineral and royalty interests may decline.
Our future success depends on replacing reserves through acquisitions and the exploration and development activities of the operators of our properties. Unless we replace the oil, natural gas and NGLs produced from our properties, our results of operations and financial position could be adversely affected.
Producing oil and natural gas wells are characterized by declining production rates that vary depending upon reservoir characteristics and other factors. Our future oil, natural gas and NGL reserves and our operators’ production thereof and our free cash flow are highly dependent on the successful development and exploitation of our current reserves and our ability to successfully acquire additional reserves that are economically recoverable. Moreover, the production decline rates of our properties may be significantly higher than currently estimated if the wells on our properties do not produce as expected. We may also not be able to find, acquire or develop additional reserves to replace the current and future production of our properties at economically acceptable terms. Aside from acquisitions, we have little to no control over the exploration and development of our properties. If we are not able to replace or grow our oil, natural gas and NGL reserves, our business, financial condition and results of operations would be adversely affected.
32
We have little to no control over the timing of future drilling with respect to our mineral and royalty interests.
As of December 31, 2019, only 17,957 MBoe of our total estimated reserves were proved developed reserves. The remaining 15,131 MBoe, 36,993 MBoe and 22,521 MBoe of our total estimated reserves as of December 31, 2019 were PUDs, probable undeveloped reserves and possible undeveloped reserves, respectively, and may not ultimately be developed or produced by the operators of our properties. Recovery of undeveloped reserves requires significant capital expenditures and successful drilling operations, and the decision to pursue development of an undeveloped drilling location will be made by the operator and not by us. We generally do not have access to the estimated costs of development of these reserves or the scheduled development plans of our operators. The reserve data included in the reserve report of CG&A assumes that substantial capital expenditures are required to develop the reserves. We cannot be certain that the estimated costs of the development of these reserves are accurate, that development will occur as scheduled or that the results of the development will be as estimated. Delays in the development of our reserves, increases in costs to drill and develop our reserves or decreases in commodity prices will reduce the future net revenues of our estimated undeveloped reserves and may result in some projects becoming uneconomical. In addition, delays in the development of reserves could force us to reclassify certain of our proved undeveloped reserves as unproved reserves.
Project areas on our properties, which are in various stages of development, may not yield oil, natural gas or NGLs in commercially viable quantities.
Project areas on our properties are in various stages of development, ranging from project areas with current drilling or production activity to project areas that have limited drilling or production history. If the wells in the process of being completed do not produce sufficient revenues or if dry holes are drilled, our financial condition, results of operations and free cash flow may be adversely affected.
The unavailability, high cost or shortages of rigs, equipment, raw materials, supplies or personnel may restrict or result in increased costs for operators related to developing and operating our properties.
The oil and natural gas industry is cyclical, which can result in shortages of drilling rigs, equipment, raw materials (particularly water and sand and other proppants), supplies and personnel. When shortages occur, the costs and delivery times of rigs, equipment and supplies increase and demand for, and wage rates of, qualified drilling rig crews also rise with increases in demand. We cannot predict whether these conditions will exist in the future and, if so, what their timing and duration will be. In accordance with customary industry practice, our operators rely on independent third-party service providers to provide many of the services and equipment necessary to drill new wells. If our operators are unable to secure a sufficient number of drilling rigs at reasonable costs, our financial condition and results of operations could suffer. Shortages of drilling rigs, equipment, raw materials, supplies, personnel, trucking services, tubulars, fracking and completion services and production equipment could delay or restrict our operators’ exploration and development operations, which in turn could have a material adverse effect on our financial condition, results of operations and free cash flow.
The marketability of oil, natural gas and NGL production is dependent upon transportation, pipelines and refining facilities, which neither we nor many of our operators' control. Any limitation in the availability of those facilities could interfere with our or our operators’ ability to market our or our operators’ production and could harm our business.
The marketability of our or our operators’ production depends in part on the availability, proximity and capacity of pipelines, tanker trucks and other transportation methods, and processing and refining facilities owned by third parties. The amount of oil that can be produced and sold is subject to curtailment in certain circumstances, such as pipeline interruptions due to scheduled and unscheduled maintenance, excessive pressure, physical damage or lack of available capacity on these systems, tanker truck availability and extreme weather conditions. Also, production from our wells may be insufficient to support the construction of pipeline facilities, and the shipment of our or our operators’ oil, natural gas and NGLs on third-party pipelines may be curtailed or delayed if it does not meet the quality specifications of the pipeline owners. The curtailments arising from these and similar circumstances may last from a few days to several months. In many cases, we or our operators are provided only with limited, if any, notice as to when these circumstances will arise and their duration. Any significant curtailment in gathering system or transportation, processing or refining-facility capacity could reduce our or our operators’ ability to market the production from our properties and have a material adverse effect on our financial condition, results of operations and free cash flow. Our or our operators’ access to transportation options and the prices we or our operators receive can also be affected by federal and state regulation-including regulation of oil, natural gas and NGL production, transportation and pipeline safety-as well by general economic conditions and changes in supply and demand. In addition, the third parties on whom we or our operators rely for transportation services are subject to complex federal, state, tribal and local laws that could adversely affect the cost, manner or feasibility of conducting our business.
33
Our derivative activities could result in financial losses and reduce earnings.
From time to time in the past we have used, and in the future we may use, derivative instruments for a portion of our future oil, natural gas and NGL production, including fixed price swaps, collars and basis swaps, to mitigate the risk and resulting impact of commodity price volatility. However, these hedging activities may not be as effective as we intend in reducing the volatility of our cash flows and, if entered into, are subject to the risks that the terms of the derivative instruments will be imperfect, a counterparty may not perform its obligations under a derivative contract, there may be a change in the expected differential between the underlying commodity price in the derivative instrument and the actual price received, our hedging policies and procedures may not be properly followed and the steps we take to monitor our derivative financial instruments may not detect and prevent violations of our risk management policies and procedures, particularly if deception or other intentional misconduct is involved. Further, we may be limited in receiving the full benefit of increases in oil, natural gas and NGL prices as a result of these hedging transactions. The occurrence of any of these risks could prevent us from realizing the benefit of a derivative contract. Further, our hedging activities are not likely to mitigate the entire exposure of our operations to commodity price volatility. To the extent we do not hedge against commodity price volatility, or our hedges are not effective, our results of operations and financial position may be diminished.
Our estimated reserves are based on many assumptions that may turn out to be inaccurate. Any material inaccuracies in these reserve estimates or underlying assumptions will materially affect the quantities and present value of our reserves.
Oil, natural gas and NGL reserve engineering is not an exact science and requires subjective estimates of underground accumulations of oil, natural gas and NGLs and assumptions concerning future oil, natural gas and NGL prices, production levels, ultimate recoveries and operating and development costs. As a result, estimated quantities of proved, probable and possible reserves, projections of future production rates and the timing of development expenditures may be incorrect. Our estimates of proved, probable and possible reserves and related valuations as of December 31, 2019 and 2018 were audited by CG&A and our estimates of proved, probable, and possible reserves and related valuations as of December 31, 2017 were prepared by CG&A. CG&A conducted a detailed review of all of our properties for the period covered by its reserve report using information provided by us. Over time, we may make material changes to reserve estimates taking into account the results of actual drilling, testing and production. For example, in connection with the restatement of our unaudited condensed consolidated financial statements for the three and six months ended June 30, 2018, we also elected to revise our previously reported reserves as of June 30, 2018 in order to properly account for our ownership interests in certain of our properties where there were title discrepancies and calculation errors within our internal reserves tracking software. In addition, certain assumptions regarding future oil, natural gas and NGL prices, production levels and operating and development costs may prove incorrect. A substantial portion of our reserve estimates are made without the benefit of a lengthy production history, which are less reliable than estimates based on a lengthy production history. Any significant variance from these assumptions to actual figures could greatly affect our estimates of reserves and future cash generated from operations. Numerous changes over time to the assumptions on which our reserve estimates are based, as described above, often result in the actual quantities of oil, natural gas and NGLs that are ultimately recovered being different from our reserve estimates.
Furthermore, the present value of future net cash flows from our proved reserves is not necessarily the same as the current market value of our estimated reserves. In accordance with rules established by the SEC and the Financial Accounting Standards Board (the “FASB”), we base the estimated discounted future net cash flows from our proved reserves on the twelve- month average oil and gas index prices, calculated as the unweighted arithmetic average for the first-day-of-the-month price for each month, and costs in effect on the date of the estimate, holding the prices and costs constant throughout the life of the properties. Actual future prices and costs may differ materially from those used in the present value estimate, and future net present value estimates using then current prices and costs may be significantly less than the current estimate. In addition, the 10% discount factor we use when calculating discounted future net cash flows may not be the most appropriate discount factor based on interest rates in effect from time to time and risks associated with us or the oil and natural gas industry in general.
SEC rules could limit our ability to book additional proved undeveloped reserves in the future.
SEC rules require that, subject to limited exceptions, proved undeveloped reserves may only be booked if they relate to wells scheduled to be drilled within five years after the date of booking. This requirement has limited and may continue to limit our ability to book additional proved undeveloped reserves as the operators of our properties pursue their drilling programs. Moreover, we may be required to write down our proved undeveloped reserves if those wells are not drilled within the required five-year timeframe. Furthermore, we typically do not have access to the drilling schedules of our operators and make our determinations about their estimated drilling schedules from any development provisions in the relevant lease agreement and the historical drilling activity, rig locations, production data and permit trends, as well as investor presentations and other public statements of our operators. Although we believe that our approach in making such determinations is conservative, the accuracy of any such determination is inherently uncertain and subject to a number of assumptions and factors outside of our control,
34
including but not limited to those described under “-We depend on various unaffiliated operators for all of the exploration, development and production on the properties underlying our mineral and royalty interests. Substantially all of our revenue is derived from royalty payments made by these operators. A reduction in the expected number of wells to be drilled on our acreage by these operators or the failure of our operators to adequately and efficiently develop and operate our acreage could have an adverse effect on our results of operations. In particular, a number of our operators have announced a reduction in projected capital expenditures for 2020. The number of new wells drilled in certain of our focus areas has recently decreased, particularly in the STACK play in Oklahoma, and such slower development pace may continue in the future.” Any significant variance between our estimates and the actual drilling schedules of our operators may require us to write down our proved undeveloped reserves.
If oil, natural gas and NGL prices decline to near or below the low levels experienced in 2015 and 2016, we could be required to record impairments of our proved oil, natural gas and NGL properties that would constitute a charge to earnings and reduce our shareholders’ equity.
Accounting rules require that we review the carrying value of our oil, natural gas and NGL properties for possible impairment at the end of each quarter. Based on specific market factors and circumstances at the time of prospective impairment reviews, and the continuing evaluation of development activities, production data, economics and other factors, we may be required to write down the carrying value of our properties. The net capitalized costs of our proved oil, natural gas and NGL properties are subject to a full cost ceiling limitation for which the costs are not allowed to exceed their related estimated future net revenues discounted at 10%. To the extent capitalized costs of evaluated properties, net of accumulated depreciation, depletion, amortization and impairment, exceed estimated discounted future net revenues of our proved oil, natural gas and NGL reserves, the excess capitalized costs are charged to expense. The risk that we will be required to recognize impairments of our oil, natural gas and NGL properties increases during periods of low commodity prices. In addition, impairments would occur if we were to experience sufficient downward adjustments to our estimated proved reserves or the present value of estimated future net revenues. An impairment recognized in one period may not be reversed in a subsequent period even if higher oil, natural gas and NGL prices increase the cost center ceiling applicable to the subsequent period. If we incur impairment charges in the future, our results of operations for the periods in which such charges are taken may be materially and adversely affected.
Conservation measures, technological advances and general concern about the environmental impact of the production and use of fossil fuels could materially reduce demand for oil, natural gas and NGLs and adversely affect our results of operations and the trading market for shares of our Class A common stock.
Fuel conservation measures, alternative fuel requirements, increasing consumer demand for alternatives to oil, natural gas and NGLs, technological advances in fuel economy and energy-generation devices could reduce demand for oil, natural gas and NGLs. The impact of the changing demand for oil, natural gas and NGL services and products may have a material adverse effect on our business, financial condition, results of operations and free cash flow.
It is also possible that the concerns about the production and use of fossil fuels will reduce the number of investors willing to own shares of our Class A common stock, adversely affecting the market price of our Class A common stock. For example, certain segments of the investor community have developed negative sentiment towards investing in our industry. Recent equity returns in the sector versus other industry sectors have led to lower oil and gas representation in certain key equity market indices. In addition, some investors, including investment advisors and certain sovereign wealth, pension funds, university endowments and family foundations, have stated policies to disinvest in the oil and gas sector based on their social and environmental considerations. Certain other stakeholders have also pressured commercial and investment banks to stop financing oil and gas and related infrastructure projects. Such developments, including environmental activism and initiatives aimed at limiting climate change and reducing air pollution, could result in downward pressure on the stock prices of oil and gas companies, including ours.
We rely on a few key individuals whose absence or loss could adversely affect our business.
Many key responsibilities within our business have been assigned to a small number of individuals. We rely on our founders for their knowledge of the oil and natural gas industry, relationships within the industry and experience in identifying, evaluating and completing acquisitions. The loss of their services could adversely affect our business. In particular, the loss of the services of one or more members of our executive team could disrupt our business. Further, we do not maintain “key person” life insurance policies on any of our executive team or other key personnel. As a result, we are not insured against any losses resulting from the death of these key individuals.
The results of exploratory drilling in shale plays will be subject to risks associated with drilling and completion techniques and drilling results may not meet our expectations for reserves or production.
Our operators use the latest drilling and completion techniques in their operations, and these techniques come with inherent risks. When drilling horizontal wells, operators risk not landing the well bore in the desired drilling zone and straying from the desired drilling zone. When drilling horizontally through a formation, operators risk being unable to run casing through the entire length of the well bore and being unable to run tools and other equipment consistently through the horizontal well bore. Risks that
35
our operators face while completing wells include being unable to fracture stimulate the planned number of stages, to run tools the entire length of the well bore during completion operations and to clean out the well bore after completion of the final fracture stimulation stage. In addition, to the extent our operators engage in horizontal drilling, those activities may adversely affect their ability to successfully drill in identified vertical drilling locations. Furthermore, certain of the new techniques that our operators may adopt, such as infill drilling and multi-well pad drilling, may cause irregularities or interruptions in production due to, in the case of infill drilling, offset wells being shut in and, in the case of multi-well pad drilling, the time required to drill and complete multiple wells before these wells begin producing. The results of drilling in new or emerging formations are more uncertain initially than drilling results in areas that are more developed and have a longer history of established production. Newer or emerging formations and areas often have limited or no production history and consequently our operators will be less able to predict future drilling results in these areas.
Ultimately, the success of these drilling and completion techniques can only be evaluated over time as more wells are drilled and production profiles are established over a sufficiently long time period. If our operators’ drilling results are weaker than anticipated or they are unable to execute their drilling program on our properties, our operating and financial results in these areas may be lower than we anticipate. Further, as a result of any of these developments we could incur material write-downs of our oil and natural gas properties and the value of our undeveloped acreage could decline, and our results of operations and free cash flow could be adversely affected.
Acreage must be drilled before lease expiration, generally within three to five years, in order to hold the acreage by production. Our operators’ failure to drill sufficient wells to hold acreage may result in the deferral of prospective drilling opportunities. In addition, our ORRIs may be lost if the underlying acreage is not drilled before the expiration of the applicable lease or if the lease otherwise terminates.
Leases on oil and natural gas properties typically have a term of three to five years, after which they expire unless, prior to expiration, production is established within the spacing units covering the undeveloped acres. In addition, even if production or drilling is established during such primary term, if production or drilling ceases on the leased property, the lease typically terminates, subject to certain exceptions.
Any reduction in our operators’ drilling programs, either through a reduction in capital expenditures or the unavailability of drilling rigs, could result in the expiration of existing leases. If the lease governing any of our mineral interests expires or terminates, all mineral rights revert back to us and we will have to seek new lessees to explore and develop such mineral interests. If the lease underlying any of our ORRIs expires or terminates, our ORRIs that are derived from such lease will also terminate. Any such expirations or terminations of our leases or our ORRIs could materially and adversely affect the growth of our financial condition, results of operations and free cash flow.
Drilling for and producing oil, natural gas and NGLs are high-risk activities with many uncertainties that may materially adversely affect our business, financial condition and results of operations.
The drilling activities of the operators of our properties will be subject to many risks. For example, we will not be able to assure our shareholders that wells drilled by the operators of our properties will be productive. Drilling for oil, natural gas and NGLs often involves unprofitable efforts, not only from dry wells but also from wells that are productive but do not produce sufficient oil, natural gas or NGLs to return a profit at then realized prices after deducting drilling, operating and other costs. The seismic data and other technologies used do not provide conclusive knowledge prior to drilling a well that oil, natural gas or NGL is present or that it can be produced economically. The costs of exploration, exploitation and development activities are subject to numerous uncertainties beyond our control and increases in those costs can adversely affect the economics of a project. Further, our operators’ drilling and producing operations may be curtailed, delayed, canceled or otherwise negatively impacted as a result of other factors, including:
• | unusual or unexpected geological formations; |
• | loss of drilling fluid circulation; |
• | title problems; |
• | facility or equipment malfunctions; |
• | unexpected operational events; |
• | shortages or delivery delays of equipment and services; |
• | compliance with environmental and other governmental requirements; and |
• | adverse weather conditions. |
36
Any of these risks can cause substantial losses, including personal injury or loss of life, damage to or destruction of property, natural resources and equipment, pollution, environmental contamination or loss of wells and other regulatory penalties. In the event that planned operations, including the drilling of development wells, are delayed or cancelled, or existing wells or development wells have lower than anticipated production due to one or more of the factors above or for any other reason, our financial condition, results of operations and free cash flow may be materially adversely affected.
Oil, natural gas and NGL operations are subject to various governmental laws and regulations. Compliance with these laws and regulations can be burdensome and expensive for our operators, and failure to comply could result in our operators incurring significant liabilities, either of which may impact our operators’ willingness to develop our interests.
Our operators’ operations on the properties in which we hold interests are subject to various federal, state and local governmental regulations that may change from time to time in response to economic and political conditions. Matters subject to regulation include drilling operations, production and distribution activities, discharges or releases of pollutants or wastes, plugging and abandonment of wells, maintenance and decommissioning of other facilities, the spacing of wells, unitization and pooling of properties and taxation. From time to time, regulatory agencies have imposed price controls and limitations on production by restricting the rate of flow of oil and natural gas wells below actual production capacity to conserve supplies of oil, natural gas and NGLs. In addition, the production, handling, storage and transportation of oil, natural gas and NGLs, as well as the remediation, emission and disposal of oil, natural gas and NGL wastes, by-products thereof and other substances and materials produced or used in connection with oil, natural gas and NGL operations are subject to regulation under federal, state and local laws and regulations primarily relating to protection of worker health and safety, natural resources and the environment. Failure to comply with these laws and regulations may result in the assessment of sanctions on our operators, including administrative, civil or criminal penalties, permit revocations, requirements for additional pollution controls and injunctions limiting or prohibiting some or all of our operators’ operations on our properties. Moreover, these laws and regulations have generally imposed increasingly strict requirements related to water use and disposal, air pollution control and waste management.
Laws and regulations governing exploration and production may also affect production levels. Our operators must comply with federal and state laws and regulations governing conservation matters, including, but not limited to:
• | provisions related to the unitization or pooling of the oil and natural gas properties; |
• | the establishment of maximum rates of production from wells; |
• | the spacing of wells; |
• | the plugging and abandonment of wells; and |
• | the removal of related production equipment. |
Additionally, federal and state regulatory authorities may expand or alter applicable pipeline-safety laws and regulations, compliance with which may require increased capital costs for third-party oil, natural gas and NGL transporters. These transporters may attempt to pass on such costs to our operators, which in turn could affect profitability on the properties in which we own mineral and royalty interests.
Our operators must also comply with laws and regulations prohibiting fraud and market manipulations in energy markets. To the extent the operators of our properties are shippers on interstate pipelines, they must comply with the tariffs of those pipelines and with federal policies related to the use of interstate capacity.
Our operators may be required to make significant expenditures to comply with the governmental laws and regulations described above and may be subject to potential fines and penalties if they are found to have violated these laws and regulations. We believe the trend of more expansive and stricter environmental legislation and regulations will continue. Please read “Business-Regulation of Environmental and Occupational Safety and Health Matters” for a description of the laws and regulations that affect our operators and that may affect us. These and other potential regulations could increase the operating costs of our operators and delay production and may ultimately impact our operators’ ability and willingness to develop our properties.
Federal and state legislative and regulatory initiatives relating to hydraulic fracturing could result in our operators incurring increased costs, additional operating restrictions or delays and fewer potential drilling locations.
Our operators engage in hydraulic fracturing. Hydraulic fracturing is a common practice that is used to stimulate production of hydrocarbons from tight formations, including shales. The process involves the injection of water, sand and chemicals under pressure into formations to fracture the surrounding rock and stimulate production. Currently, hydraulic fracturing is generally
37
exempt from regulation under the U.S. Safe Drinking Water Act’s (“SDWA”) Underground Injection Control (“UIC”) program and is typically regulated by state oil and gas commissions or similar agencies.
However, several federal agencies have asserted regulatory authority over certain aspects of the process. For example, the U.S. Environmental Protection Agency (“EPA”) has asserted regulatory authority pursuant to the SDWA’s UIC program over hydraulic fracturing activities involving the use of diesel fuel in fracturing fluids and issued guidance covering such activities. In addition, in June 2016, the EPA published an effluent limit guideline final rule prohibiting the discharge of wastewater from onshore unconventional oil and gas extraction facilities to publicly owned wastewater treatment plants. Also, from time to time, legislation has been introduced, but not enacted, in Congress to provide for federal regulation of hydraulic fracturing and to require disclosure of the chemicals used in the hydraulic fracturing process. In the event that new federal restrictions relating to the hydraulic fracturing process are adopted in areas where we own mineral or royalty interests, our operators may incur additional costs or permitting requirements to comply with such federal requirements that may be significant and that could result in added delays or curtailment in our operators’ pursuit of exploration, development or production activities, which would in turn reduce the oil, natural gas and NGLs produced from our properties.
Moreover, some states and local governments have adopted, and other governmental entities are considering adopting, regulations that could impose more stringent permitting, disclosure and well-construction requirements on hydraulic fracturing operations, including states in which our properties are located. For example, Texas, Colorado and North Dakota, among others, have adopted regulations that impose new or more stringent permitting, disclosure, disposal and well construction requirements on hydraulic fracturing operations. States could also elect to prohibit high volume hydraulic fracturing altogether. In addition to state laws, local land use restrictions, such as city ordinances, may restrict drilling in general and/or hydraulic fracturing in particular.
In December 2016, the EPA released its final report on the potential impacts of hydraulic fracturing on drinking water resources. The final report concluded that “water cycle” activities associated with hydraulic fracturing may impact drinking water resources under certain limited circumstances.
Increased regulation and attention given to the hydraulic fracturing process could lead to greater opposition to, and litigation concerning, oil, natural gas and NGL production activities using hydraulic fracturing techniques. Additional legislation or regulation could also lead to operational delays or increased operating costs for our operators in the production of oil, natural gas and NGLs, including from the developing shale plays, or could make it more difficult for our operators to perform hydraulic fracturing. The adoption of any federal, state or local laws or the implementation of regulations regarding hydraulic fracturing could potentially cause a decrease in our operators’ completion of new oil and natural gas wells on our properties and an associated decrease in the production attributable to our interests, which could have a material adverse effect on our business, financial condition and results of operations.
Implementation of new Colorado Senate Bill 19-181 may increase costs and limit oil and natural gas exploration and production operations in the state, which could adversely impact future production from our properties and have an adverse effect on our business, financial condition and results of operations.
In April 2019, Senate Bill 19-181 was signed into law in Colorado. This bill reforms the composition of the Colorado Oil and Gas Conservation Commission (“COGCC”), directs the commission to impose more stringent environmental regulations with respect to permitting new oil and gas projects and also required that COGCC study the need for stricter air pollution controls for such projects. The legislation also authorizes Colorado cities and counties to take on an increased role in regulating oil and natural gas operations within their jurisdictions, including in a manner that may be more stringent than state-level rules. The COGCC adopted the first rulemaking under Senate Bill 19-181, regarding flowlines, in November 2019, which requires flowlines be abandoned in whatever manner is "least impactful" in balancing a variety of risks. Hearings for rules pursuant to Senate Bill 19-181 are currently planned for the first half of 2020. Proposed regulations regarding wellbore integrity were published in December 2019, and the COGCC is expected to publish final rules sometime during the first quarter of 2020. The COGCC has also stated that it plans to promulgate regulations requiring cumulative impacts and alternative location analyses as part of applications for certain oil and gas facilities, which are expected to be proposed sometime in the first half of 2020. Some local communities have adopted additional restrictions for oil and gas activities, such as requiring greater setbacks, and other groups have sought a cessation of permit issuances entirely until the COGCC publishes new rules in keeping with SB 181. At least one lawsuit has been filed seeking a court order to such effect. Additionally, activist groups have submitted new ballot proposals for the 2020 election year, including proposals for increased drilling setbacks and increased bonding requirements. Any additional restrictions due to implementation of such measures could result in increased operational costs incurred by operators of our properties and limit operations, including due to delays in the state issuing new drilling permits, for exploration and production activities in Colorado, which could significantly impact future exploration and development activities on our properties.
38
Legislation or regulatory initiatives intended to address seismic activity could restrict our operators’ drilling and production activities, which could have a material adverse effect on our business.
State and federal regulatory agencies have recently focused on a possible connection between hydraulic fracturing related activities, particularly the underground injection of wastewater into disposal wells, and the increased occurrence of seismic activity, and regulatory agencies at all levels are continuing to study the possible linkage between oil and gas activity and induced seismicity. For example, in 2015, the United States Geological Study identified eight states, including Oklahoma and Texas, with areas of increased rates of induced seismicity that could be attributed to fluid injection or oil and gas extraction.
In addition, a number of lawsuits have been filed, most recently in Oklahoma, alleging that disposal well operations have caused damage to neighboring properties or otherwise violated state and federal rules regulating waste disposal. In response to these concerns, regulators in some states are seeking to impose additional requirements, including requirements in the permitting of produced water disposal wells or otherwise to assess the relationship between seismicity and the use of such wells. For example, in October 2014, the Texas Railroad Commission published a new rule governing permitting or re-permitting of disposal wells that would require, among other things, the submission of information on seismic events occurring within a specified radius of the disposal well location, as well as logs, geologic cross sections and structure maps relating to the disposal area in question. If the permittee or an applicant of a disposal well permit fails to demonstrate that the produced water or other fluids are confined to the disposal zone or if scientific data indicates such a disposal well is likely to be or determined to be contributing to seismic activity, then the agency may deny, modify, suspend or terminate the permit application or existing operating permit for that well. The Texas Railroad Commission has used this authority to deny permits for waste disposal wells. In some instances, regulators may also order that disposal wells be shut in.
The adoption and implementation of any new laws or regulations that restrict our operators’ ability to use hydraulic fracturing or dispose of produced water gathered from drilling and production activities by limiting volumes, disposal rates, disposal well locations or otherwise, or requiring them to shut down disposal wells, could have a material adverse effect on our business, financial condition and results of operations.
Restrictions on the ability of our operators to obtain water may have an adverse effect on our financial condition, results of operations and free cash flow.
Water is an essential component of deep shale oil, natural gas and NGL production during both the drilling and hydraulic fracturing processes. Over the past several years, parts of the country, and in particular Texas, have experienced extreme drought conditions. As a result of this severe drought, some local water districts have begun restricting the use of water subject to their jurisdiction for hydraulic fracturing to protect local water supply. If our operators are unable to obtain water to use in their operations from local sources, or if our operators are unable to effectively utilize flowback water, they may be unable to economically drill for or produce oil, natural gas and NGLs from our properties, which could have an adverse effect on our financial condition, results of operations and free cash flow.
Our revolving credit facility has substantial restrictions and financial covenants that may restrict our business and financing activities and our ability to declare dividends.
The operating and financial restrictions and covenants in our revolving credit facility restrict, and any future financing agreements likely will restrict, our ability to finance future operations or capital needs, engage, expand or pursue our business activities or pay dividends. Our revolving credit facility restricts, and any future financing agreements likely will restrict, our ability to, among other things:
• | incur indebtedness; |
• | issue certain equity securities, including preferred equity securities; |
• | incur certain liens or permit them to exist; |
• | engage in certain fundamental changes, including mergers or consolidations; |
• | make certain investments, loans, advances, guarantees and acquisitions; |
• | sell or transfer assets; |
• | enter into sale and leaseback transactions; |
• | pay dividends to or redeem or repurchase shares from our shareholders; |
• | make certain payments of junior indebtedness; |
39
• | enter into transactions with our affiliates; |
• | enter into certain restrictive agreements; and |
• | enter into swap agreements and hedging arrangements. |
Our revolving credit facility restricts our ability to pay dividends to our shareholders or to repurchase shares of our Class A common stock. We also are required under our revolving credit facility to comply with, as of the most recently completed fiscal quarter, (i) a ratio of total net funded debt to consolidated EBITDA not to exceed 4.00 to 1.00, and (ii) a current ratio of not less than 1.00 to 1.00. Our ability to comply with these restrictions and covenants in the future is uncertain and will be affected by the levels of free cash flow and events or circumstances beyond our control, such as a downturn in our business or the economy in general or reduced oil, natural gas and NGL prices. If we violate any of the restrictions, covenants, ratios or tests in our revolving credit facility, a significant portion of our indebtedness may become immediately due and payable, our ability to pay dividends to our shareholders will be inhibited and our lenders’ commitment to make further loans to us may terminate. We might not have, or be able to obtain, sufficient funds to make these accelerated payments. In addition, our obligations under our revolving credit facility are secured by substantially all of our assets, and if we are unable to repay our indebtedness under our revolving credit facility, the lenders can seek to foreclose on our assets.
The borrowings under our revolving credit facility expose us to interest rate risk.
We are exposed to interest rate risk associated with borrowings under the our revolving credit facility. Our revolving credit facility bears interest at a rate per annum equal to, at our option, the adjusted base rate or the adjusted LIBOR rate plus an applicable margin. The applicable margin is based on utilization of our revolving credit facility and ranges from (a) in the case of adjusted base rate loans, 0.750% to 1.750% and (b) in the case of adjusted LIBOR rate loans, 1.750% to 2.750%. LIBOR tends to fluctuate based on multiple facts, including general short-term interest rates, rates set by the U.S. Federal Reserve and other central banks, the supply of and demand for credit in the London interbank market and general economic conditions. If interest rates increase, so will our interest costs, which may have a material adverse effect on our business, financial conditions and results of operations.
On July 27, 2017, the U.K. Financial Conduct Authority (the authority that regulates LIBOR) announced that it intends to stop compelling banks to submit rates for the calculation of LIBOR after 2021. It is unclear whether new methods of calculating LIBOR will be established such that it continues to exist after 2021. The U.S. Federal Reserve, in conjunction with the Alternative Reference Rates Committee, is considering replacing U.S. dollar LIBOR with a newly created index. It is not possible to predict the effect of these changes, other reforms or the establishment of alternative reference rates in the United States or elsewhere.
Our debt levels may limit our flexibility to obtain additional financing and pursue other business opportunities.
Our existing and future indebtedness could have important consequences to us, including:
• | our ability to obtain additional financing, if necessary, for working capital, capital expenditures, acquisitions or other purposes may be impaired, or such financing may not be available on terms acceptable to us; |
• | covenants in our existing and future credit and debt arrangements will require us to meet financial tests that may affect our flexibility in planning for and reacting to changes in our business, including possible acquisition opportunities; |
• | our access to the capital markets may be limited; |
• | our borrowing costs may increase; |
• | we will need a substantial portion of our free cash flow to make principal and interest payments on our indebtedness, reducing the funds that would otherwise be available for operations, future business opportunities and payment of dividends to our shareholders; and |
• | our debt level will make us more vulnerable than our competitors with less debt to competitive pressures or a downturn in our business or the economy generally. |
Our ability to service our indebtedness will depend upon, among other things, our future financial and operating performance, which will be affected by prevailing economic conditions and financial, business, regulatory and other factors, some of which are beyond our control. If our operating results are not sufficient to service our current or future indebtedness, we will be forced to take actions such as reducing or delaying business activities, acquisitions, investments and/or capital expenditures, selling assets,
40
restructuring or refinancing our indebtedness, or seeking additional equity capital or bankruptcy protection. We may not be able to effect any of these remedies on satisfactory terms or at all.
A series of risks arising out of the threat of climate change could result in increased operating costs, limit the areas in which oil and natural gas production may occur, and reduce demand for the oil, natural gas and NGLs that our operators produce.
The threat of climate change continues to attract considerable attention in the United States and in foreign countries, numerous proposals have been made and could continue to be made at the international, national, regional, and state levels of government to monitor and limit existing emissions of GHGs as well as to restrict or eliminate such future emissions. As a result, our operations as well as the operations of our oil and natural gas exploration and production customers are subject to a series of regulatory, political, litigation, and financial risks associated with the production and processing of fossil fuels and emission of GHGs.
In the United States, no comprehensive climate change legislation has been implemented at the federal level. However, following the U.S. Supreme Court finding that GHG emissions constitute a pollutant under the CAA, the EPA has adopted regulations that, among other things, establish construction and operating permit reviews for GHG emissions from certain large stationary sources, require the monitoring and annual reporting of GHG emissions from certain petroleum and natural gas system sources in the United States, implement New Source Performance Standards directing the reduction of methane from certain new, modified, or reconstructed facilities in the oil and natural gas sector, and together with the DOT, implementing GHG emissions limits on vehicles manufactured for operation in the United States. For example, in June 2016, the EPA finalized rules that establish new air emission controls for methane emissions from certain new, modified, or reconstructed equipment and processes in the oil and natural gas source category, including production, processing, transmission, and storage activities, otherwise known as Subpart OOOOa. Following the change in administration, there have been attempts to modify these regulations, and litigation is ongoing.
Additionally, various states and groups of states have adopted or are considering adopting legislation, regulation or other regulatory initiatives that are focused on such areas as GHG cap and trade programs, carbon taxes, reporting and tracking programs, and restriction of emissions. At the international level, there is an agreement, the United Nations- sponsored "Paris Agreement," for nations to limit their GHG emissions through non-binding, individually-determined reduction goals every five years after 2020, although the United States has announced its withdrawal from such agreement, effective November 4, 2020.
Governmental, scientific, and public concern over the threat of climate change arising from GHG emissions has resulted in increasing political risks in the United States, including climate change related pledges made by certain candidates seeking the office of the President of the United States in 2020. Two critical declarations made by one or more candidates running for the Democratic nomination for President include threats to take actions banning hydraulic fracturing of oil and natural gas wells and banning new leases for production of minerals on federal properties, including onshore lands and offshore waters. Other actions that could be pursued by presidential candidates may include the imposition of more restrictive requirements for the establishment of pipeline infrastructure or the permitting of LNG export facilities, as well as, the reversal of the United Sates' withdrawal from the Paris Agreement in November 2020. Litigation risks are also increasing as a number of cities and other local governments have sought to bring suit against the largest oil and natural gas exploration and production companies in state or federal court, alleging among other things, that such companies created public nuisances by producing fuels that contributed to global warming effects, such as rising sea levels, and therefore are responsible for roadway and infrastructure damages as a result, or alleging that the companies have been aware of the adverse effects of climate change for some time but defrauded their investors by failing to adequately disclose those impacts.
There are also increasing financial risks for fossil fuel producers as shareholders currently invested in fossil-fuel energy companies concerned about the potential effects of climate change may elect in the future to shift some or all of their investments into non-energy related sectors. Institutional lenders who provide financing to fossil-fuel energy companies also have become more attentive to sustainable lending practices and some of them may elect not to provide funding for fossil fuel energy companies. Additionally, the lending practices of institutional lenders have been the subject of intensive lobbying efforts in recent years, oftentimes public in nature, by environmental activists, proponents of the international Paris Agreement, and foreign citizenry concerned about climate change not to provide funding for fossil fuel producers. Limitation of investments in and financing for fossil fuel energy companies could result in the restriction, delay or cancellation of drilling programs or development or production activities.
The adoption and implementation of new or more stringent international, federal or state legislation, regulations or other regulatory initiatives that impose more stringent standards for GHG emissions from the oil and natural gas sector or otherwise restrict the areas in which this sector may produce oil and natural gas or generate the GHG emissions could result in increased costs of compliance or costs of consuming, and thereby reduce demand for oil and natural gas, which could reduce the profitability of our interests. Additionally, political, litigation and financial risks may result in our oil and natural gas operators restricting or cancelling production activities, incurring liability for infrastructure damages as a result of climatic changes, or impairing their
41
ability to continue to operate in an economic manner, which also could reduce the profitability of our interests. One or more of these developments could have a material adverse effect on our business, financial condition and results of operation.
Additional restrictions on drilling activities intended to protect certain species of wildlife may adversely affect our operators’ ability to conduct drilling activities.
In the United States, the Endangered Species Act (the “ESA”) restricts activities that may affect endangered or threatened species or their habitats. Similar protections are offered to migratory birds under the Migratory Bird Treaty Act (the “MBTA”). To the extent species that are listed under the ESA or similar state laws, or are protected under the MBTA, live in the areas where our operators operate, our operators’ abilities to conduct or expand operations could be limited, or our operators could be forced to incur material additional costs. Moreover, our operators’ drilling activities may be delayed, restricted or precluded in protected habitat areas or during certain seasons, such as breeding and nesting seasons.
In addition, as a result of one or more settlements approved by the U.S. Fish & Wildlife Service (the “FWS”), the agency was required to make a determination on the listing of numerous other species as endangered or threatened under the ESA by the end of the FWS’ 2017 fiscal year. The FWS did not make that deadline; however, review is reportedly ongoing. The designation of previously unidentified endangered or threatened species-such as the dunes sagebrush lizard, lesser prairie chicken or greater sage grouse-could cause our operators’ operations to become subject to operating restrictions or bans, and limit future development activity in affected areas. The FWS and similar state agencies may designate critical or suitable habitat areas that they believe are necessary for the survival of threatened or endangered species. Such a designation could materially restrict use of or access to federal, state and private lands.
Operating hazards and uninsured risks may result in substantial losses to us or our operators, and any losses could adversely affect our results of operations and free cash flow.
The operations of our operators will be subject to all of the hazards and operating risks associated with drilling for and production of oil, natural gas and NGLs, including the risk of fire, explosions, blowouts, surface cratering, uncontrollable flows of oil, natural gas, NGLs and formation water, pipe or pipeline failures, abnormally pressured formations, casing collapses and environmental hazards such as oil and NGL spills, natural gas leaks and ruptures or discharges of toxic gases. In addition, their operations will be subject to risks associated with hydraulic fracturing, including any mishandling, surface spillage or potential underground migration of fracturing fluids, including chemical additives. The occurrence of any of these events could result in substantial losses to our operators due to injury or loss of life, severe damage to or destruction of property, natural resources and equipment, pollution or other environmental damage, clean-up responsibilities, regulatory investigations and penalties, suspension of operations and repairs required to resume operations.
Competition in the oil and natural gas industry is intense, which may adversely affect our and our operators’ ability to succeed.
The oil and natural gas industry is intensely competitive, and the operators of our properties compete with other companies that may have greater resources. Many of these companies explore for and produce oil, natural gas and NGLs, carry on midstream and refining operations, and market petroleum and other products on a regional, national or worldwide basis. In addition, these companies may have a greater ability to continue exploration activities during periods of low oil, natural gas and NGL market prices. Our operators’ larger competitors may be able to absorb the burden of present and future federal, state, local and other laws and regulations more easily than our operators can, which would adversely affect our operators’ competitive position. Our operators may have fewer financial and human resources than many companies in our operators’ industry and may be at a disadvantage in bidding for exploratory prospects and producing oil and natural gas properties. In addition, our ability to acquire additional properties and to discover reserves in the future will be dependent upon our ability to evaluate and select suitable properties and to consummate transaction in a highly competitive environment. Because we have fewer financial and human resources than many companies in our industry, we may be at a disadvantage in bidding for exploratory prospects and producing oil and natural gas properties.
Title to the properties in which we have an interest may be impaired by title defects.
We are not required to, and under certain circumstances we may elect not to, incur the expense of retaining lawyers to examine the title to our royalty and mineral interests. In such cases, we would rely upon the judgment of oil and gas lease brokers or landmen who perform the fieldwork in examining records in the appropriate governmental office before acquiring a specific royalty or mineral interest. The existence of a material title deficiency can render an interest worthless and can materially adversely affect our results of operations, financial condition and free cash flow. No assurance can be given that we will not suffer a monetary
42
loss from title defects or title failure. Additionally, undeveloped acreage has a greater risk of title defects than developed acreage. If there are any title defects in properties in which we hold an interest, we may suffer a financial loss.
Loss of our or our operators’ information and computer systems, including as a result of cyber attacks, could materially and adversely affect our business.
We and our operators rely on electronic systems and networks to control and manage our respective businesses. If any of such programs or systems were to fail for any reason, including as a result of a cyber attacks, or create erroneous information in our or our operators’ hardware or software network infrastructure, possible consequences could be significant, including loss of communication links and inability to automatically process commercial transaction or engage in similar automated or computerized business activities. Although we have multiple layers of security to mitigate risks of cyber attacks, cyber attacks on business have escalated in recent years. Moreover, our operators are becoming increasingly dependent on digital technologies to conduct certain exploration, development, production and processing activities, including interpreting seismic data, managing drilling rigs, production activities and gathering systems, conducting reservoir modeling and estimating reserves. The U.S. government has issued public warnings that indicate that energy assets might be specific targets of cyber security threats. If our operators become the target of cyberattacks of information security breaches, their business operations may be substantially disrupted, which could have an adverse effect on our results of operations. In addition, our efforts to monitor, mitigate and manage these evolving risks may result in increased capital and operating costs, but there can be no assurance that such efforts will be sufficient to prevent attacks or breaches from occurring.
A terrorist attack or armed conflict could harm our business.
Terrorist activities, anti-terrorist efforts and other armed conflicts involving the United States or other countries may adversely affect the United States and global economies and could prevent us from meeting our financial and other obligations. If any of these events occur, the resulting political instability and societal disruption could reduce overall demand for oil, natural gas and NGLs, potentially putting downward pressure on demand for our operators’ services and causing a reduction in our revenues. Oil, natural gas and NGL related facilities could be direct targets of terrorist attacks, and, if infrastructure integral to our operators is destroyed or damaged, they may experience a significant disruption in their operations. Costs for insurance and other security may increase as a result of these threats, and some insurance coverage may become more difficult to obtain, if available at all.
A deterioration in general economic, business or industry conditions would materially adversely affect our results of operations, financial condition and free cash flow.
In recent years, concerns over global economic conditions, energy costs, geopolitical issues, inflation, the availability and cost of credit and slow economic growth in the United States have contributed to economic uncertainty and diminished expectations for the global economy. Meanwhile, continued hostilities in the Middle East and the occurrence or threat of terrorist attacks in the United States or other countries could adversely affect the economies of the United States and other countries. In addition, global or national health concerns, including the outbreak of pandemic or contagious disease, can negatively impact the global economy and demand for oil, natural gas and NGLs. For instance, the recent coronavirus outbreak has adversely affected our business by (i) reducing the demand for oil, NGL and natural gas because of reduced global and national economic activity, leading to lower prices for oil, NGL and natural gas, and (ii) impairing the supply chain of certain of our operators. We cannot accurately predict the duration or magnitude of the effects of the coronavirus outbreak on our business in the future. Concerns about global economic growth have had a significant adverse impact on global financial markets and commodity prices. An oversupply of crude oil in 2015 led to a severe decline in worldwide oil prices. If the economic climate in the United States or abroad deteriorates, worldwide demand for petroleum products could further diminish, which could impact the price at which oil, natural gas and NGLs from our properties are sold, affect the ability of our operators to continue operations and ultimately materially adversely impact our results of operations, financial condition and free cash flow.
Risks Related to Our Class A Common Stock
Brigham Minerals is a holding company. Brigham Minerals’ sole material asset is its equity interest in Brigham LLC and it is accordingly dependent upon distributions from Brigham LLC to pay taxes, cover its corporate and other overhead expenses and pay any dividends on our Class A common stock.
Brigham Minerals is a holding company and has no material assets other than its equity interest in Brigham LLC. Please see “Our Corporate Structure.” Brigham Minerals has no independent means of generating revenue. To the extent Brigham LLC has available cash, Brigham LLC is required to make (i) generally pro rata distributions to all its unitholders, including to Brigham
43
Minerals, in an amount generally intended to allow such holders to satisfy their respective income tax liabilities with respect to their allocable share of the income of Brigham LLC, based on certain assumptions and conventions, provided that the distribution will be sufficient to allow Brigham Minerals to satisfy its actual tax liabilities and (ii) non pro rata payments to Brigham Minerals in an amount sufficient to cover its corporate and other overhead expenses. In addition, as the sole managing member of Brigham LLC, we will cause Brigham LLC to make pro rata distributions to all of its unitholders, including to Brigham Minerals, in an amount sufficient to allow us to fund dividends to our stockholders in accordance with our dividend policy, to the extent our board of directors declares such dividends. Therefore, although we have paid dividends to our stockholders in the past and expect to pay dividends on our Class A common stock in amounts determined from time to time by our board of directors in the future, our ability to do so may be limited to the extent Brigham LLC and its subsidiaries are limited in their ability to make these and other distributions to us, including due to the restrictions under our revolving credit facility. To the extent that we need funds and Brigham LLC or its subsidiaries are restricted from making such distributions under applicable law or regulation or under the terms of their financing arrangements, or are otherwise unable to provide such funds, it could materially adversely affect our liquidity and financial condition.
The requirements of being a public company, including compliance with the reporting requirements of the Exchange Act and the requirements of the Sarbanes-Oxley Act, may strain our resources, increase our costs and distract management, and we may be unable to comply with these requirements in a timely or cost-effective manner.
As a public company, we need to comply with new laws, regulations and requirements, certain corporate governance provisions of the Sarbanes-Oxley Act, related regulations of the SEC and the requirements of the NYSE, with which we were not required to comply as a private company. Complying with these statutes, regulations and requirements will occupy a significant amount of time of our board of directors and management and will significantly increase our costs and expenses. We are required to:
• | institute a more comprehensive compliance function; |
• | comply with rules promulgated by the NYSE; |
• | continue to prepare and distribute periodic public reports in compliance with our obligations under the federal securities laws; |
• | establish new internal policies, such as those relating to insider trading; and |
• | involve and retain to a greater degree outside counsel and accountants in the above activities. |
Furthermore, while we generally must comply with Section 404 of the Sarbanes Oxley Act for our fiscal year ending December 31, 2020, we are not required to have our independent registered public accounting firm attest to the effectiveness of our internal controls until our first annual report subsequent to our ceasing to be an “emerging growth company” within the meaning of Section 2(a)(19) of the Securities Act. Accordingly, we may not be required to have our independent registered public accounting firm attest to the effectiveness of our internal controls until as late as our annual report for the fiscal year ending December 31, 2024. Once it is required to do so, our independent registered public accounting firm may issue a report that is adverse in the event it is not satisfied with the level at which our controls are documented, designed, operated or reviewed. Compliance with these requirements may strain our resources, increase our costs and distract management, and we may be unable to comply with these requirements in a timely or cost-effective manner.
In addition, we expect that being a public company subject to these rules and regulations may make it more difficult and more expensive for us to obtain director and officer liability insurance and we may be required to accept reduced policy limits and coverage or incur substantially higher costs to obtain the same or similar coverage. As a result, it may be more difficult for us to attract and retain qualified individuals to serve on our board of directors or as executive officers. We are currently evaluating these rules, and we cannot predict or estimate the amount of additional costs we may incur or the timing of such costs.
If we fail to develop or maintain an effective system of internal controls, we may not be able to accurately report our financial results or prevent fraud. If one or more material weaknesses emerge related to financial reporting, or if we otherwise fail to establish and maintain effective internal control over financial reporting, our ability to accurately report our financial results could be adversely affected. As a result, current and potential stockholders could lose confidence in our financial reporting, which would harm our business and the trading price of our Class A common stock.
Effective internal controls are necessary for us to provide reliable financial reports, prevent fraud and operate successfully as a public company. If we cannot provide reliable financial reports or prevent fraud, our reputation and operating results would be harmed. We cannot be certain that our efforts to develop and maintain our internal controls will be successful, that we will be able to maintain adequate controls over our financial processes and reporting in the future, that we will be able to comply with
44
our obligations under Section 404 of the Sarbanes-Oxley Act of 2002, or that we will not identify material weaknesses related to our financial reporting. For example, in connection with the preparation and review of our unaudited consolidated financial statements for the nine months ended September 30, 2018, our management identified certain material weaknesses which have since been remediated. If one or more material weaknesses emerge related to financial reporting in the future, or if we otherwise fail to establish and maintain effective internal control over financial reporting, our operating results and ability to meet our reporting obligations may be adversely affected and we may be subject to adverse regulatory consequences. Ineffective internal controls could also cause investors to lose confidence in our reported financial information, which would likely have a negative effect on the trading price of our Class A common stock. See Item 7. “Management’s Discussion and Analysis of Financial Condition and Results of Operations-Internal Control Procedures-Material Weakness and Remediation.”
Our Sponsors have the ability to direct the voting of a substantial portion of the voting power of our common stock, and their interests may conflict with those of our other stockholders.
Holders of shares of our Class A common stock and Class B common stock vote together as a single class on all matters presented to our stockholders for their vote or approval, except as otherwise required by applicable law or our certificate of incorporation. As of February 27, 2020, our Sponsors beneficially own, on a combined basis, approximately 11.3% of our outstanding shares of Class A common stock and 81% of our shares of Class B common stock, representing 39.1% of our combined economic interest and voting power. As a result, on a combined basis, our Sponsors will continue to have significant influence over matters requiring stockholder approval, including the election of directors, changes to our organizational documents and significant corporate transactions. This concentration of ownership makes it unlikely that any other holder or group of holders of our Class A common stock will be able to affect the way we are managed or the direction of our business. The interests of our Sponsors with respect to matters potentially or actually involving or affecting us, such as future acquisitions, financings and other corporate opportunities and attempts to acquire us, may conflict with the interests of our other stockholders.
Given this concentrated ownership, our Sponsors would have to approve any potential acquisition of us. In addition, certain of our directors are currently employees of our Sponsors. These directors’ duties as employees of our Sponsors may conflict with their duties as our directors, and the resolution of these conflicts may not always be in our or your best interest. Furthermore, we are party to a stockholders’ agreement with our Sponsors. The stockholders’ agreement provides each of our Sponsors with the right to designate a certain number of nominees to our board of directors so long as such Sponsor and its affiliates collectively beneficially own a specified percentage of the outstanding shares of our Class A and Class B common stock. In addition, the stockholders’ agreement provides our sponsors the right to approve certain material transactions so long as our Sponsors and their affiliates beneficially own specified percentages of our outstanding shares of Class A and Class B common stock. Finally, the existence of significant stockholders may have the effect of deterring hostile takeovers, delaying or preventing changes in control or changes in management or limiting the ability of our other stockholders to approve transactions that they may deem to be in the best interests of our company. Our Sponsors’ concentration of stock ownership may also adversely affect the trading price of our Class A common stock to the extent investors perceive a disadvantage in owning stock of a company with significant stockholders.
Certain of our directors have significant duties with, and spend significant time serving, entities that may compete with us in seeking acquisitions and business opportunities and, accordingly, may have conflicts of interest in allocating time or pursuing business opportunities.
Certain of our directors, who are responsible for managing the direction of our operations and acquisition activities, hold positions of responsibility with other entities (including Warburg Pincus-, Yorktown- and Pine Brook-affiliated entities) that are in the business of identifying and acquiring oil and natural gas properties. For example, two of our directors (Messrs. Holland and Levy) are senior investment professionals of Warburg Pincus, one of our directors (Mr. Keenan) is a Managing Member of Yorktown and one of our directors (Mr. Stoneburner) is a Managing Director of Pine Brook, all of which are in the business of investing in oil and natural gas companies with independent management teams that also seek to acquire oil and natural gas properties. In addition, Mr. Brigham, our executive chairman, is involved with certain other entities involved in the oil and gas industry, including Brigham Operating, Atlas Permian Water, Atlas Permian Sand, Brigham Development and Anthem Ventures. The existing positions held by these directors may give rise to fiduciary or other duties that are in conflict with the duties they owe to us. These directors may become aware of business opportunities that may be appropriate for presentation to us as well as to the other entities with which they are or may become affiliated. Due to these existing and potential future affiliations, they may present potential business opportunities to other entities prior to presenting them to us, which could cause additional conflicts of interest. They may also decide that certain opportunities are more appropriate for other entities with which they are affiliated, and as a result, they may elect not to present those opportunities to us. These conflicts may not be resolved in our favor. For additional discussion of our management’s business affiliations and the potential conflicts of interest of which our stockholders should be aware, see “Certain Relationships and Related Party Transactions, and Director Independence.”
45
Our Sponsors and their affiliates are not limited in their ability to compete with us, and the corporate opportunity provisions in our amended and restated certificate of incorporation could enable our Sponsors to benefit from corporate opportunities that might otherwise be available to us.
Our governing documents provide that our Sponsors and their affiliates (including portfolio investments of our Sponsors and their affiliates) are not restricted from owning assets or engaging in businesses that compete directly or indirectly with us and that we renounce any interest or expectancy in any business opportunity that may be from time to time presented to our Sponsors or their respective affiliates. In particular, subject to the limitations of applicable law, our amended and restated certificate of incorporation, among other things:
• | permits our Sponsors and their affiliates and our directors to conduct business that competes with us and to make investments in any kind of property in which we may make investments; and |
• | provides that if our Sponsors or their affiliates or any director or officer of one of our affiliates, our Sponsors or their affiliates who is also one of our directors becomes aware of a potential business opportunity, transaction or other matter, they will have no duty to communicate or offer that opportunity to us. |
Our Sponsors or their affiliates may become aware, from time to time, of certain business opportunities (such as acquisition opportunities) and may direct such opportunities to other businesses in which they have invested, in which case we may not become aware of or otherwise have the ability to pursue such opportunity. Further, such businesses may choose to compete with us for these opportunities, possibly causing these opportunities to not be available to us or causing them to be more expensive for us to pursue. In addition, our Sponsors and their affiliates may dispose of oil and natural gas properties or other assets in the future, without any obligation to offer us the opportunity to purchase any of those assets. As a result, our renouncing our interest and expectancy in any business opportunity that may be from time to time presented to our Sponsors and their affiliates could adversely impact our business or prospects if attractive business opportunities are procured by such parties for their own benefit rather than for ours. Please read “Description of Brigham Minerals, Inc.’s Class A common stock.”
Each of our Sponsors is an established participant in the oil and natural gas industry and has resources greater than ours, which may make it more difficult for us to compete with our Sponsors with respect to commercial activities as well as for potential acquisitions. We cannot assure you that any conflicts that may arise between us and our stockholders, on the one hand, and our Sponsors, on the other hand, will be resolved in our favor. As a result, competition from our Sponsors and their affiliates could adversely impact our results of operations.
A significant reduction by our Sponsors of their ownership interests in us could adversely affect us.
We believe that our Sponsor’s ownership interests in us provide them with an economic incentive to assist us to be successful. However, our Sponsors are not subject to any obligation to maintain their ownership interest in us and may elect at any time thereafter to sell all or a substantial portion of or otherwise reduce their ownership interest in us. If our Sponsors sell all or a substantial portion of their respective ownership interests in us, they may have less incentive to assist in our success and their affiliate(s) that are expected to serve as members of our board of directors may resign. Such actions could adversely affect our ability to successfully implement our business strategies, which could adversely affect our business, financial condition and results of operations.
Our amended and restated certificate of incorporation and amended and restated bylaws, as well as Delaware law, contain provisions that could discourage acquisition bids or merger proposals, which may adversely affect the market price of our Class A common stock and could deprive our investors of the opportunity to receive a premium for their shares.
Our amended and restated certificate of incorporation authorizes our board of directors to issue preferred stock without stockholder approval in one or more series, designate the number of shares constituting any series, and fix the rights, preferences, privileges and restrictions thereof, including dividend rights, voting rights, rights and terms of redemption, redemption price or prices and liquidation preferences of such series. If our board of directors elects to issue preferred stock, it could be more difficult for a third party to acquire us. In addition, some provisions of our amended and restated certificate of incorporation and amended and restated bylaws could make it more difficult for a third party to acquire control of us, even if the change of control would be beneficial to our stockholders. Among other things, our amended and restated certificate of incorporation and amended and restated bylaws:
• | establish advance notice procedures with regard to stockholder proposals relating to the nomination of candidates for election as directors or new business to be brought before meetings of our stockholders; |
46
• | provide that the authorized number of directors constituting our board of directors may be changed only by resolution of the board of directors; |
• | provide that all vacancies, including newly created directorships, may, except as otherwise required by law, the terms of the stockholders’ agreement or, if applicable, the rights of holders of a series of our preferred stock, be filled by the affirmative vote of a majority of our directors then in office, even if less than a quorum; |
• | provide that our bylaws can be amended by the board of directors; |
• | provide that any action required or permitted to be taken by our stockholders must be effected at a duly called annual or special meeting of stockholders and may not be effected by any consent in writing in lieu of a meeting of such stockholders, subject to the rights of the holders of any series of our preferred stock with respect to such series; |
• | provide that our certificate of incorporation and bylaws may be amended by the affirmative vote of the holders of not less than 66 2/3% of our then outstanding shares of common stock; |
• | provide that special meetings of our stockholders may only be called by our board of directors pursuant to a resolution adopted by the affirmative vote of a majority of the members of the board of directors serving at the time of such vote; |
• | provide for our board of directors to be divided into three classes of directors, with each class as nearly equal in number as possible, serving staggered three-year terms, other than directors that may be elected by holders of our preferred stock, if any; |
• | provide that the affirmative vote of the holders of not less than 66 2/3% in voting power of all then outstanding shares of common stock entitled to vote generally in the election of directors, voting together as a single class, shall be required to remove any or all of the directors from office, and such removal may only be for “cause”; and |
• | prohibit cumulative voting on all matters. |
Furthermore, the terms of our amended and restated certificate of incorporation and amended and restated bylaws are subject to the terms of the stockholders’ agreement. See “Certain Relationships and Related Transactions, and Director Independence.”
Our amended and restated certificate of incorporation designates the Court of Chancery of the State of Delaware as the sole and exclusive forum for certain types of actions and proceedings that may be initiated by our stockholders, which could limit our stockholders’ ability to obtain a favorable judicial forum for disputes with us or our directors, officers, employees or agents.
Our amended and restated certificate of incorporation provides that, unless we consent in writing to the selection of an alternative forum, the Court of Chancery of the State of Delaware will, to the fullest extent permitted by applicable law, be the sole and exclusive forum for (i) any derivative action or proceeding brought on our behalf, (ii) any action asserting a claim of breach of a fiduciary duty owed by any of our directors, officers, employees or agents to us or our stockholders, (iii) any action asserting a claim arising pursuant to any provision of the DGCL, our amended and restated certificate of incorporation or our amended and restated bylaws or (iv) any action asserting a claim against us that is governed by the internal affairs doctrine, in each such case subject to such Court of Chancery having personal jurisdiction over the indispensable parties named as defendants therein. Any person or entity purchasing or otherwise acquiring any interest in shares of our capital stock will be deemed to have notice of, and consented to, the provisions of our amended and restated certificate of incorporation described in the preceding sentence. This choice of forum provision may limit a stockholder’s ability to bring a claim in a judicial forum that it finds favorable for disputes with us or our directors, officers, employees or agents, which may discourage such lawsuits against us and such persons. Alternatively, if a court were to find these provisions of our amended and restated certificate of incorporation inapplicable to, or unenforceable in respect of, one or more of the specified types of actions or proceedings, we may incur additional costs associated with resolving such matters in other jurisdictions, which could adversely affect our business, financial condition or results of operations.
Our ability to pay dividends to our stockholders may be limited by our holding company structure, contractual restrictions and regulatory requirements.
Brigham Minerals is a holding company and has no material assets other than its ownership of Brigham LLC Units, and Brigham Minerals does not have any independent means of generating revenue. To the extent Brigham LLC has available cash, Brigham LLC is required to make (i) generally pro rata distributions to all its unitholders, including to Brigham Minerals, in an amount generally intended to allow such holders to satisfy their respective income tax liabilities with respect to their allocable share of the income of Brigham LLC, based on certain assumptions and conventions, provided that the distribution will be sufficient to allow Brigham Minerals to satisfy its actual tax liabilities and (ii) non-pro rata payments to Brigham Minerals in an amount
47
sufficient to cover its corporate and other overhead expenses. In addition, as the sole managing member of Brigham LLC, Brigham Minerals will cause Brigham LLC to make pro rata distributions to all of its unitholders, including to Brigham Minerals, in an amount sufficient to allow it to fund dividends to its stockholders in accordance with its dividend policy, to the extent its board of directors declares such dividends. Brigham LLC is a distinct legal entity and may be subject to legal or contractual restrictions that, under certain circumstances, may limit Brigham Minerals ability to obtain cash from it. If Brigham LLC is unable to make distributions, we may not receive adequate distributions, which could materially and adversely affect our free cash flow and financial position and our ability to fund any dividends.
Although we have paid dividends on our Class A common stock and expect to pay dividends on our Class A common stock in the future, our board of directors will take into account general economic and business conditions, including our financial condition and results of operations, capital requirements, contractual restrictions, including restrictions and covenants contained in our debt agreements, business prospects and other factors that our board of directors considers relevant in determining whether, and in what amounts, to pay such dividends. In addition, our revolving credit facility limits the amount of distributions that Brigham LLC can make to us and the purposes for which distributions could be made. Accordingly, we may not be able to pay dividends even if our board of directors would otherwise deem it appropriate. See “Dividend Policy,” “Management’s Discussion and Analysis of Financial Condition and Results of Operations-Capital Requirements and Sources of Liquidity” and “Description of Brigham Minerals, Inc.’s Class A common stock.”
In certain circumstances, Brigham LLC will be required to make tax distributions to the Brigham Unit Holders, including Brigham Minerals, and such tax distributions may be substantial. To the extent Brigham Minerals receives tax distributions in excess of its actual tax liabilities and retains such excess cash, the Original Owners would benefit from such accumulated cash balances if they exercise their Redemption Right.
Pursuant to the Brigham LLC Agreement, to the extent Brigham LLC has available cash (taking into account existing and projected capital expenditures), Brigham LLC is required to make generally pro rata distributions (which we refer to as “tax distributions”), to all its unitholders, including Brigham Minerals, in an amount generally intended to allow the Brigham Unit Holders to satisfy their respective income tax liabilities with respect to their allocable share of the income of Brigham LLC, based on certain assumptions and conventions, provided that tax distributions will be made sufficient to allow Brigham Minerals to satisfy its actual tax liabilities. The amount of such tax distributions will be determined based on certain assumptions, including an assumed individual income tax rate, and will be calculated after taking into account other distributions (including other tax distributions) made by Brigham LLC. Because tax distributions will be made pro rata based on ownership and due to, among other items, differences between the tax rates applicable to Brigham Minerals and the assumed individual income tax rate used in the calculation and requirements under the applicable tax rules that Brigham LLC’s net taxable income be allocated disproportionately to its unitholders in certain circumstances, tax distributions may significantly exceed the actual tax liability for many of the Brigham Unit Holders, including Brigham Minerals. If Brigham Minerals retains the excess cash it receives, the Original Owners would benefit from any value attributable to such accumulated cash balances upon their exercise of the Redemption Right. However, we expect to use such accumulated cash balances to pay dividends in respect of our Class A common stock or to take other steps to eliminate any material cash balances. In addition, the tax distributions Brigham LLC will be required to make may be substantial and may exceed the tax liabilities that would be owed by a similarly situated corporate taxpayer. Funds used by Brigham LLC to satisfy its tax distribution obligations will not be available for reinvestment in our business, except to the extent Brigham Minerals uses the excess cash it receives to reinvest in Brigham LLC for additional units.
The U.S. federal income tax treatment of distributions on our Class A common stock to a holder will depend upon our tax attributes and the holder’s tax basis in our stock, which are not necessarily predictable and can change over time.
Distributions of cash or property on our Class A common stock, if any, will constitute dividends for U.S. federal income tax purposes to the extent paid from our current or accumulated earnings and profits, as determined under U.S. federal income tax principles. To the extent those distributions exceed our current and accumulated earnings and profits, the distributions will be treated as a non-taxable return of capital to the extent of the non-U.S. holder’s tax basis in our Class A common stock and thereafter as capital gain from the sale or exchange of such common stock. Also, if any holder sells our Class A common stock, the holder will recognize a gain or loss equal to the difference between the amount realized and the holder’s tax basis in such Class A common stock.
To the extent that the amount of our distributions is treated as a non-taxable return of capital as described above, such distribution will reduce a holder’s tax basis in the Class A common stock. Consequently, such excess distributions will result in a corresponding increase in the amount of gain, or a corresponding decrease in the amount of loss, recognized by the holder upon the sale of the Class A common stock or subsequent distributions with respect to such stock. Additionally, with regard to U.S. corporate holders of our Class A shares, to the extent that a distribution on our Class A shares exceeds both our current and accumulated earnings and profits and such holder’s tax basis in such shares, such holders would be unable to utilize the corporate
48
dividends-received deduction (to the extent it would otherwise be applicable to such holder) with respect to the gain resulting from such excess distribution.
Investors in our Class A common stock are encouraged to consult their tax advisors as to the tax consequences of receiving distributions on our Class A shares that are not treated as dividends for U.S. federal income tax purposes.
Future sales of shares of our Class A common stock in the public market, or the perception that such sales may occur, could reduce our stock price, and any additional capital raised by us through the sale of equity or convertible securities may dilute your ownership in us.
Certain of our Original Owners own shares of our Class A common stock and, subject to certain limitations and exceptions, the Original Owners that hold Brigham LLC Units may require Brigham LLC to redeem their Brigham LLC Units for shares of Class A common stock (on a one-for-one basis, subject to conversion rate adjustments for stock splits, stock dividends and reclassification and other similar transactions), and our Original Owners may sell any of such shares of Class A common stock. As of February 27, 2020, we had outstanding 34,181,268 shares of Class A common stock and 22,706,711 shares of Class B common stock, representing approximately 39.9% of our total outstanding shares. In addition, our Sponsors continue to hold 3,856,823 shares of our Class A common stock, representing approximately 11.3% of our total shares of Class A common stock outstanding. The Sponsors are party to a registration rights agreement, which requires us to effect the registration of their shares in certain circumstances. See “Our Corporate Structure” and “Certain Relationships and Related Transactions, and Director Independence.”
We have previously filed a registration statement with the SEC on Form S-8 providing for the registration of 5,999,600 shares of our Class A common stock issued or reserved for issuance under our equity incentive plan. Subject to the satisfaction of vesting conditions, shares registered under the registration statement on Form S-8 will be available for resale immediately in the public market without restriction.
We cannot predict the size of future issuances of our Class A common stock or securities convertible into Class A common stock or the effect, if any, that future issuances and sales of shares of our Class A common stock will have on the market price of our Class A common stock. Sales of substantial amounts of our Class A common stock (including shares issued in connection with an acquisition), or the perception that such sales could occur, may adversely affect prevailing market prices of our Class A common stock.
Our organizational structure confers certain benefits upon the Original Owners that will not benefit the holders of our Class A common stock to the same extent as it will benefit the Original Owners.
Our organizational structure confers certain benefits upon the Original Owners that do not benefit the holders of our Class A common stock to the same extent as it will benefit the Original Owners. Brigham Minerals is a holding company and has no material assets other than its ownership of Brigham LLC Units. As a consequence, our ability to declare and pay dividends to the holders of our Class A common stock is subject to the ability of Brigham LLC to provide distributions to us. If Brigham LLC makes such distributions, the Original Owners will be entitled to receive equivalent distributions from Brigham LLC on a pro rata basis. However, because we must pay taxes, amounts ultimately distributed as dividends to holders of our Class A common stock are expected to be less on a per share basis than the amounts distributed by Brigham LLC to the Original Owners on a per unit basis. This and other aspects of our organizational structure may adversely impact the future trading market for our Class A common stock.
We may issue preferred stock whose terms could adversely affect the voting power or value of our Class A common stock.
Our amended and restated certificate of incorporation authorizes our board of directors to issue, without the approval of our stockholders, one or more classes or series of preferred stock having such designations, preferences, limitations and relative rights, including preferences over our Class A common stock respecting dividends and distributions, as our board of directors may determine. The terms of one or more classes or series of our preferred stock could adversely impact the voting power or value of our Class A common stock. For example, we might grant holders of a class or series of our preferred stock the right to elect some number of our directors in all events or on the happening of specified events or the right to veto specified transactions. Similarly, the repurchase or redemption rights or liquidation preferences we might assign to holders of our preferred stock could affect the residual value of our Class A common stock.
49
For as long as we are an emerging growth company, we will not be required to comply with certain reporting requirements, including those relating to accounting standards and disclosure about our executive compensation, that apply to other public companies.
We are classified as an “emerging growth company” under the JOBS Act. For as long as we are an emerging growth company, which may be up to five full fiscal years, unlike other public companies, we will not be required to, among other things: (i) provide an auditor’s attestation report on management’s assessment of the effectiveness of our system of internal control over financial reporting pursuant to Section 404(b) of the Sarbanes-Oxley Act; (ii) comply with any new requirements adopted by the PCAOB requiring mandatory audit firm rotation or a supplement to the auditor’s report in which the auditor would be required to provide additional information about the audit and the financial statements of the issuer; (iii) provide certain disclosure regarding executive compensation required of larger public companies; or (iv) hold nonbinding advisory votes on executive compensation. We may remain an emerging growth company until December 31, 2024, although we will lose that status sooner if we have more than $1.07 billion of revenues in a fiscal year, have more than $700 million in market value of our Class A common stock held by non-affiliates, or issue more than $1 billion of non-convertible debt over a three-year period.
To the extent that we rely on any of the exemptions available to emerging growth companies, you will receive less information about our executive compensation and internal control over financial reporting than issuers that are not emerging growth companies. If some investors find our Class A common stock to be less attractive as a result, there may be a less active trading market for our Class A common stock and our stock price may be more volatile.
If securities or industry analysts adversely change their recommendations regarding our Class A common stock or if our operating results do not meet their expectations, our stock price could decline.
The trading market for our Class A common stock will be influenced by the research and reports that industry or securities analysts publish about us or our business. If one or more of these analysts cease coverage of our company or fail to publish reports on us regularly, we could lose visibility in the financial markets, which in turn could cause our stock price or trading volume to decline. Moreover, if one or more of the analysts who cover our company downgrades our Class A common stock or if our operating results do not meet their expectations, our stock price could decline.
Because we have elected to take advantage of the extended transition period pursuant to Section 107 of the JOBS Act, our financial statements may not be comparable to those of other public companies.
Section 107 of the JOBS Act provides that an emerging growth company can use the extended transition period provided in Section 7(a)(2)(B) of the Securities Act for complying with new or revised accounting standards. This permits an emerging growth company to delay the adoption of certain accounting standards until those standards would otherwise apply to private companies. We are choosing to take advantage of this extended transition period and, as a result, we will comply with new or revised accounting standards on the relevant dates on which adoption of such standards is required for private companies. Accordingly, our financial statements may not be comparable to companies that comply with public company effective dates, and our stockholders and potential investors may have difficulty in analyzing our operating results by comparing us to such companies.
ITEM 1B. UNRESOLVED STAFF COMMENTS
None.
ITEM 2. PROPERTIES
Information regarding our properties is contained in "Item 1.—Business" and is incorporated by reference here.
ITEM 3. LEGAL PROCEEDINGS
Due to the nature of our business, we are, from time to time, involved in routine litigation or subject to disputes or claims related to our business activities. In the opinion of our management, none of the pending litigation, disputes or claims against us, if decided adversely, will have a material adverse effect on our financial condition, cash flows or results of operations.
ITEM 4. MINE SAFETY DISCLOSURES
Not applicable.
50
51
PART II
ITEM 5. MARKET FOR REGISTRANT’S COMMON EQUITY, RELATED UNITHOLDER MATTERS AND ISSUER PURCHASES OF EQUITY SECURITIES
Common Stock
Our Class A common stock began trading on the NYSE under the symbol “MNRL” on April 18, 2019. Prior to that, there was no public market for our Class A common stock.
There is no market for our Class B common stock. As of February 27, 2020, we had 65 holders of record of our Class B common stock. Each share of Class B common stock has no economic rights but entitles its holders to one vote on all matters to be voted on by the shareholders generally. Please see "Item 1. Business—Overview—Our Corporate Structure."
Holders of Record
On February 27, 2020, the closing price of our Class A common stock on the NYSE was $14.43 per share. As of February 27, 2020, we had approximately 45 holders of record of our Class A common stock. This number excludes owners for whom Class A common stock may be held in “street” name.
Dividend Policy
We paid our first quarterly cash dividend of $0.33 per share of our Class A common stock on August 29, 2019 to stockholders of record as of August 5, 2019, and on November 7, 2019, we declared a dividend of $0.33 per share of Class A common stock that was paid on November 27, 2019 to stockholders of record at the close of business on November 20, 2019. We expect to pay future dividends on our Class A common stock in amounts determined from time to time by our board of directors. However, the declaration and payment of any future dividends by us will be at the sole discretion of our board of directors, which may change our dividend policy at any time. Our board of directors will take into account:
• | general economic and business conditions; |
• | our financial condition and operating results; |
• | our free cash flow and current anticipated cash needs; |
• | our capital requirements; |
• | legal, tax, regulatory, and contractual (including under our revolving credit facility) restrictions and implications on the payment of dividends by us to our stockholders or by our subsidiaries (including Brigham LLC) to us; and |
• | such other factors as our board of directors may deem relevant. |
We are a holding company and have no material assets other than our ownership of Brigham LLC Units. As a consequence, our ability to declare and pay dividends to the holders of our Class A common stock is subject to the ability of Brigham LLC to provide distributions to us. If Brigham LLC makes such distributions, the Original Owners will be entitled to receive equivalent distributions from Brigham LLC on a pro rata basis. However, because we must pay taxes, amounts ultimately distributed as dividends to holders of our Class A common stock are expected to be less on a per share basis than the amounts distributed by Brigham LLC to the Original Owners on a per unit basis.
Assuming Brigham LLC makes distributions to us and the Original Owners in any given year, we expect to pay dividends in respect of our Class A common stock out of the portion, if any, of such distributions remaining after our payment of taxes and our expenses (any such portion, an “excess distribution”). However, because our board of directors may determine to pay or not pay dividends in respect of shares of our Class A common stock based on the factors described above, our holders of Class A common stock may not necessarily receive dividend distributions relating to excess distributions, even if Brigham LLC makes such distributions to us.
Securities Authorized for Issuance Under Equity Compensation Plans
52
The information relating to our equity compensation plans required by Item 5 is incorporated by reference to such information as set forth in Item 12. “Security Ownership of Certain Beneficial Owners and Management and Related Stockholder Matters” contained herein.
Performance Graph
The performance graph below compares the cumulative total returns of our Class A common stock over the period from April 18, 2019, the date our Class A common stock began trading on the NYSE, through December 31, 2019 with the cumulative total returns for the same period for the S&P 500 index and S&P Oil and Gas Exploration & Production index. The cumulative stockholder return assumes that $100 was invested, including reinvestment of dividends, if any, in our Class A common stock on April 18, 2019, and in the S&P index and S&P Oil and Gas Exploration & Production index on the same date.
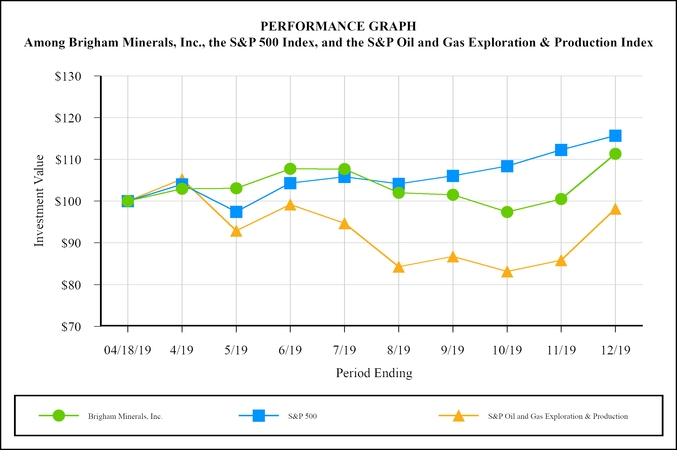
***$100 invested on 4/18/19 in stock or 3/31/19 in index, including reinvestment of dividends. Fiscal year ending December 31.
The preceding performance graph and related information is being furnished pursuant to Item 2.01(e) of Regulation S-K and shall not be deemed to be “soliciting material” or to be “filed” with the SEC or subject to Regulation 14A or 14C, other than as provided in Item 2.01(e) of Regulation S-K, or to the liabilities of Section 18 of the Exchange Act, except to the extent that we specifically request that such information be treated as soliciting material or specifically incorporate it by reference into a filing under the Securities Act or the Exchange Act.
Issuer Purchases of Equity Securities
We did not purchase any of our equity securities during the quarter ended December 31, 2019.
ITEM 6. SELECTED FINANCIAL DATA
Brigham Minerals was formed in June 2018 and had limited historical financial operating results prior to the IPO. Following the IPO, Brigham Minerals became the sole managing member for Brigham LLC. As a result, Brigham Minerals consolidates the financial results of Brigham LLC and its subsidiaries and reports temporary equity related to the portion of
53
the Brigham LLC Units not owned by Brigham Minerals. For periods prior to the completion of the IPO, the accompanying consolidated and combined financial statements include the consolidated and combined historical financial results of Brigham Resources (excluding the historical results of Brigham Operating), our predecessor for accounting purposes, and Brigham Minerals.
The selected historical consolidated and combined financial data as of and for the years ended December 31, 2019, 2018, and 2017 were derived from the audited historical consolidated and combined financial statements included elsewhere in this Annual Report. For a detailed discussion of the selected historical financial data contained in the following table, please read "Item 7.—Management's Discussion and Analysis of Financial Condition and Results of Operations." The following table should also be read in conjunction with our historical financial statements included elsewhere in this Annual Report. Among other things, the historical financial statements include more detailed information regarding the basis of presentation for the information in the following table. Historical results are not necessarily indicative of future results.
Years Ended December 31, | ||||||||||||
(In thousands, except per share data) | 2019 | 2018 | 2017 | |||||||||
STATEMENT OF OPERATIONS DATA: | ||||||||||||
REVENUES | ||||||||||||
Mineral and royalty revenues | $ | 97,886 | $ | 59,758 | $ | 30,066 | ||||||
Lease bonus and other revenues | 3,629 | 7,506 | 10,842 | |||||||||
Total revenues | $ | 101,515 | $ | 67,264 | $ | 40,908 | ||||||
OTHER OPERATING INCOME: | ||||||||||||
Gain on sale of oil and gas properties, net | — | — | 94,551 | |||||||||
OPERATING EXPENSES | ||||||||||||
Gathering, transportation and marketing | 4,985 | 3,944 | 1,754 | |||||||||
Severance and ad valorem taxes | 6,409 | 3,536 | 1,601 | |||||||||
Depreciation, depletion, and amortization | 30,940 | 13,915 | 6,955 | |||||||||
General and administrative | 21,963 | 6,638 | 3,935 | |||||||||
Total operating expenses | $ | 64,297 | $ | 28,033 | $ | 14,245 | ||||||
NET INCOME FROM OPERATIONS | $ | 37,218 | $ | 39,231 | $ | 121,214 | ||||||
Other income (expense): | ||||||||||||
(Loss) gain on derivative instruments, net | (568 | ) | 424 | (121 | ) | |||||||
Interest expense, net | (5,609 | ) | (7,446 | ) | (556 | ) | ||||||
Loss on extinguishment of debt | (6,892 | ) | — | — | ||||||||
Gain (loss) on sale and distribution of equity securities | — | 823 | (4,222 | ) | ||||||||
Other income, net | 169 | 110 | 305 | |||||||||
Income before income taxes | $ | 24,318 | $ | 33,142 | $ | 116,620 | ||||||
Income tax expense | 2,679 | 327 | 1,008 | |||||||||
NET INCOME | $ | 21,639 | $ | 32,815 | $ | 115,612 | ||||||
Less: Net income attributable to Predecessor (1) | (5,092 | ) | (30,976 | ) | (115,612 | ) | ||||||
Less: Net income attributable to temporary equity(1) | (9,646 | ) | — | — | ||||||||
Net income attributable to common shareholders(1) | $ | 6,901 | $ | 1,839 | $ | — | ||||||
Net income per share attributable to common stockholders(1) | ||||||||||||
Basic | 0.26 | — | — | |||||||||
Diluted | 0.26 | — | — | |||||||||
Weighted-average number of shares | ||||||||||||
Basic | 22,870 | — | — | |||||||||
Diluted | 22,870 | — | — | |||||||||
(1) | Brigham Minerals was formed in June 2018 and acquired an interest in our predecessor as part of certain reorganization transactions in July 2018 and increased its interest in our predecessor in April 2019 in connection with our IPO. To that end, we began recording net income attributable to shareholders of Brigham Minerals in addition to net income attributable to our predecessor beginning in July 2018. Upon completion of the IPO, net income attributable to our predecessor was reclassified as net income attributable to temporary equity. |
54
Years Ended December 31, | ||||||||||||
(In thousands) | 2019 | 2018 | 2017 | |||||||||
Other Financial Data: | ||||||||||||
Adjusted EBITDA(2) | $ | 78,207 | $ | 53,146 | $ | 33,618 | ||||||
Adjusted EBITDA ex lease bonus(2) | 74,578 | 45,640 | 22,776 | |||||||||
Balance Sheet Data: | ||||||||||||
Cash and cash equivalents | $ | 51,133 | $ | 31,985 | $ | 6,886 | ||||||
Total assets | 784,162 | 554,026 | 334,477 | |||||||||
Credit facilities | — | 170,705 | 27,000 | |||||||||
Total liabilities | 12,336 | 180,078 | 32,303 | |||||||||
Temporary equity | $ | 454,507 | $ | — | $ | — | ||||||
Permanent equity | $ | 317,319 | $ | 373,948 | $ | 302,174 | ||||||
(2) | Please read “—Non-GAAP Financial Measures” below for the definitions of Adjusted EBITDA and Adjusted EBITDA ex lease bonus and a reconciliation of Adjusted EBITDA and Adjusted EBITDA ex lease bonus to our most directly comparable financial measure, calculated and presented in accordance with GAAP. |
Non-GAAP Financial Measures
Adjusted EBITDA and Adjusted EBITDA ex lease bonus are non-GAAP supplemental financial measures used by our management and by external users of our financial statements such as investors, research analysts and others to assess the financial performance of our assets and their ability to sustain dividends over the long term without regard to financing methods, capital structure or historical cost basis.
We define Adjusted EBITDA as net income (loss) before depreciation, depletion and amortization, share based compensation expense, interest expense, gain or loss on sale and distribution of equity securities, gain or loss on derivative instruments, loss on extinguishment of debt, and income tax expense, less other income and gain or loss on sale of oil and gas properties. We define Adjusted EBITDA ex lease bonus as Adjusted EBITDA further adjusted to eliminate the impacts of lease bonus revenue we receive due to the unpredictability of timing and magnitude of the revenue.
Adjusted EBITDA and Adjusted EBITDA ex lease bonus do not represent and should not be considered alternatives to, or more meaningful than, net income, income from operations, cash flows from operating activities or any other measure of financial performance presented in accordance with GAAP as measures of our financial performance. Adjusted EBITDA and Adjusted EBITDA ex lease bonus have important limitations as analytical tools because they exclude some but not all items that affect net income, the most directly comparable GAAP financial measure. Our computation of Adjusted EBITDA and Adjusted EBITDA ex lease bonus may differ from computations of similarly titled measures of other companies.
55
Years Ended December 31, | ||||||||||||
(In thousands) | 2019 | 2018 | 2017 | |||||||||
Reconciliation of Adjusted EBITDA and Adjusted EBITDA ex lease bonus to net income: | ||||||||||||
Net income | $ | 21,639 | $ | 32,815 | $ | 115,612 | ||||||
Add: | ||||||||||||
Depreciation, depletion, and amortization | 30,940 | 13,915 | 6,955 | |||||||||
Share-based compensation expense | 10,049 | — | — | |||||||||
Interest expense, net | 5,609 | 7,446 | 556 | |||||||||
Loss on extinguishment of debt | 6,892 | — | — | |||||||||
Loss on derivative instruments, net | 568 | — | 121 | |||||||||
Loss on sale and distribution of equity securities | — | — | 4,222 | |||||||||
Income tax expense | 2,679 | 327 | 1,008 | |||||||||
Less: | ||||||||||||
Gain on derivative instruments, net | — | 424 | — | |||||||||
Gain on sale of oil and gas properties | — | — | 94,551 | |||||||||
Other income, net | 169 | 110 | 305 | |||||||||
Gain on sale and distribution of equity securities | — | 823 | — | |||||||||
Adjusted EBITDA | $ | 78,207 | $ | 53,146 | $ | 33,618 | ||||||
Less: | ||||||||||||
Lease bonus revenue | 3,629 | 7,506 | 10,842 | |||||||||
Adjusted EBITDA ex lease bonus | $ | 74,578 | $ | 45,640 | $ | 22,776 | ||||||
56
ITEM 7. MANAGEMENT'S DISCUSSION AND ANALYSIS OF FINANCIAL CONDITION AND RESULTS OF OPERATIONS
The following discussion and analysis should be read in conjunction with “Selected Historical Financial Data” and the accompanying consolidated and combined financial statements and related notes included elsewhere in this Annual Report.
The following discussion contains forward-looking statements that reflect our future plans, estimates, beliefs and expected performance. The forward-looking statements are dependent upon events, risks and uncertainties that may be outside our control. Our actual results could differ materially from those discussed in these forward-looking statements. Factors that could cause or contribute to such differences include, but are not limited to, market prices for oil, natural gas and NGLs, production volumes, estimates of proved, probable and possible reserves, mineral acquisition capital, economic and competitive conditions, regulatory changes and other uncertainties, as well as those factors discussed below and elsewhere in this Annual Report, particularly in “Risk Factors” and “Cautionary Statement Regarding Forward-Looking Statements,” all of which are difficult to predict. In light of these risks, uncertainties and assumptions, the forward-looking events discussed may not occur. We do not undertake any obligation to publicly update any forward-looking statements except as otherwise required by applicable law.
Overview
Brigham Minerals was formed to acquire and actively manage a portfolio of mineral and royalty interests in the core of what we view as the most active, highly economic, liquids-rich resource plays across the continental United States. Our primary business objective is to maximize risk-adjusted total return to our shareholders through (i) the growth of our free cash flow generated from our existing portfolio of approximately 82,200 net royalty acres, and (ii) the continued sourcing and execution of accretive mineral acquisitions in the core of highly economic, liquids-rich resource plays. As of December 31, 2019, we owned 82,200 net royalty acres across 39 counties within the Permian Basin in West Texas and New Mexico, the SCOOP/STACK plays in the Anadarko Basin of Oklahoma, the DJ Basin in Colorado and Wyoming and the Williston Basin in North Dakota.
Operational Update
Mineral and Royalty Interest Ownership Update
During the twelve months ended December 31, 2019, the Company completed 216 transactions acquiring 13,400 net royalty acres (standardized to a 1/8th royalty interest) for $218.1 million, in the Permian, SCOOP/STACK/Merge, Williston and DJ Basins. The Company deployed approximately 71% of its mineral acquisition capital in 2019 to the Permian Basin (62% Delaware and 9% Midland), 23% to the Anadarko Basin, 5% to the Williston Basin and 1% to the DJ Basin. The acquired minerals are expected to deliver near-term production and cash flow growth with the addition of 210 gross DUCs (2.0 net DUCs) and 99 gross permits (0.5 net permits) to its inventory counts. As of December 31, 2019, the Company owned roughly 82,200 net royalty acres, encompassing 12,777 gross (112 net) undeveloped horizontal locations, across 39 counties in what the Company views as the core of the Permian Basin in West Texas and New Mexico, the SCOOP/STACK plays in the Anadarko Basin of Oklahoma, the DJ Basin in Colorado and Wyoming and the Williston Basin in North Dakota.
The table below summarizes the Company’s mineral and royalty interest ownership as of the dates indicated and changes in such ownership on a quarter over quarter (“Q/Q”) and year-to-date (“YTD”) basis.
57
Delaware | Midland | SCOOP | STACK | DJ | Williston | Other | Total | |||||||||||||||||
Net Royalty Acres | ||||||||||||||||||||||||
December 31, 2019 | 25,750 | 4,100 | 11,100 | 10,700 | 15,600 | 7,750 | 7,200 | 82,200 | ||||||||||||||||
September 30, 2019 | 24,900 | 3,800 | 10,600 | 10,250 | 15,450 | 7,100 | 7,100 | 79,200 | ||||||||||||||||
June 30, 2019 | 21,750 | 3,500 | 10,250 | 10,050 | 15,450 | 6,900 | 6,200 | 74,100 | ||||||||||||||||
March 31, 2019 | 20,550 | 3,200 | 9,750 | 9,700 | 15,450 | 6,850 | 6,000 | 71,500 | ||||||||||||||||
Acres Added Q/Q | 850 | 300 | 500 | 450 | 150 | 650 | 100 | 3,000 | ||||||||||||||||
% Added Q/Q | 3 | % | 8 | % | 5 | % | 4 | % | 1 | % | 9 | % | 1 | % | 4 | % | ||||||||
December 31, 2018 | 19,200 | 3,200 | 8,700 | 9,700 | 15,400 | 6,800 | 5,800 | 68,800 | ||||||||||||||||
Acres Added in 2019 | 6,550 | 900 | 2,400 | 1,000 | 200 | 950 | 1,400 | 13,400 | ||||||||||||||||
Acres Sold in 2019 | (100 | ) | — | — | — | — | — | — | (100 | ) | ||||||||||||||
% Added in 2019 | 34 | % | 28 | % | 28 | % | 10 | % | 1 | % | 14 | % | 24 | % | 19 | % | ||||||||
Operating Activity Update
DUC Conversions
The Company saw significant conversion of its DUC inventory during the fourth quarter with over 376 gross (2.6 net) horizontal wells identified that had been converted to production, which represented 38% of its gross DUC inventory as of Q3 2019 (42% of net DUCs). In 2019, the Company converted 697 gross DUCs (5.6 net DUCs) to PDP, 86% of its gross DUC inventory (92% of its net DUCs) as of year-end 2018. 2019 conversions of gross wells by status are summarized in the graph below:
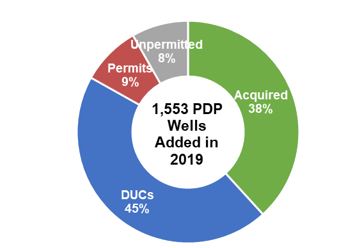
Drilling Activity
During 2019 the Company averaged 65 rigs running on its mineral and royalty interests with approximately 2,700 net royalty acres under development. During the fourth quarter 2019, the Company averaged approximately 60 rigs running on its mineral and royalty interests with approximately 2,500 net royalty acres under development as compared to 57 rigs and 2,900 net royalty acres under development on average over the prior six quarters. During 2019 the Company had an average of 29 rigs operating on its Permian Basin minerals and 16 on its SCOOP minerals. During the fourth quarter 2019 the Company had an average of 32 rigs operating on its Permian Basin minerals and 16 rigs on its SCOOP minerals. Key Operators running rigs on Brigham’s mineral position during 2019 included Continental (14 rigs), ExxonMobil (8 rigs), Occidental Petroleum (4 rigs), Marathon Oil (3 rigs) and Concho Resources (2 rigs). Key Operators running rigs on Brigham’s mineral position during the fourth quarter included Continental (10 rigs), ExxonMobil (9 rigs), Occidental Petroleum (4 rigs), Marathon Oil (3 rigs) and Hess Corporation (3 rigs). Brigham’s rig activity over the past eight quarters is summarized in the graph below:
58
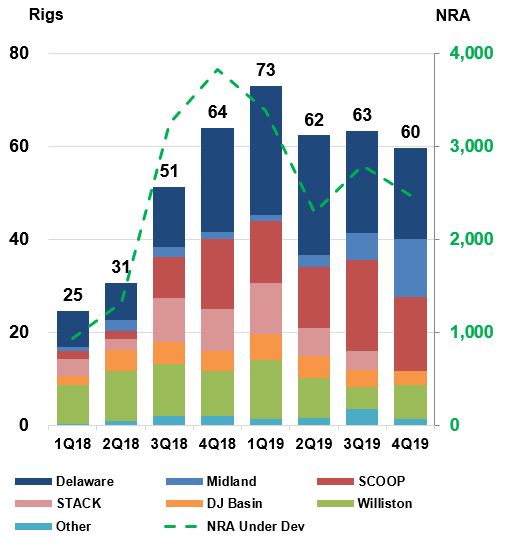
DUC and Permit Inventory
The Company expects near-term production growth will be driven by the continued conversion of its DUC and permit inventory. Brigham’s DUC and permit inventory as of December 31, 2019 by basin is outlined in the table below:
Development Inventory by Basin (1) | ||||||||||||||||||||||||
Delaware | Midland | SCOOP | STACK | DJ | Williston | Other | Total | |||||||||||||||||
Gross Inventory | ||||||||||||||||||||||||
DUCs | 255 | 136 | 118 | 19 | 181 | 155 | 28 | 892 | ||||||||||||||||
Permits | 168 | 119 | 15 | 10 | 201 | 198 | 4 | 715 | ||||||||||||||||
Net Inventory | ||||||||||||||||||||||||
DUCs | 2.4 | 0.8 | 0.7 | 0.1 | 1.4 | 0.5 | 0.1 | 5.9 | ||||||||||||||||
Permits | 1.3 | 0.4 | 0.1 | — | 2.2 | 0.3 | — | 4.4 | ||||||||||||||||
(1) Individual amounts may not total due to rounding.
How We Evaluate Our Operations
We use a variety of operational and financial measures to assess our performance. Among the measures considered by management are the following:
• | volumes of oil, natural gas and NGLs produced; |
• | number of rigs on location, permits, spuds, completions and wells turned-in-line; |
• | commodity prices; and |
• | Adjusted EBITDA and Adjusted EBITDA ex lease bonus. |
59
Volumes of Oil, Natural Gas and NGLs Produced
In order to track and assess the performance of our assets, we monitor and analyze our production volumes from the various resource plays that comprise our portfolio of mineral and royalty interests. We also regularly compare projected volumes to actual reported volumes and investigate unexpected variances.
Number of Rigs on Location, Permits, Spuds, Completions and Wells Turned-In-Line
In order to track and assess the performance of our assets, we monitor and analyze the number of rigs currently drilling our properties. We also constantly monitor the number of permits, spuds, completions and wells on production that are applicable to our mineral and royalty interests in an effort to evaluate near-term production growth from the various basins and resource plays that comprise our asset base.
Commodity Prices
Historically, oil, natural gas and NGL prices have been volatile and may continue to be volatile in the future. During the past five years, the posted price for WTI has ranged from a low of $26.19 per barrel in February 2016 to a high of $77.41 per barrel in June 2018. The Henry Hub spot market price for natural gas has ranged from a low of $1.49 per MMBtu in March 2016 to a high of $6.24 per MMBtu in January 2018. As of December 31, 2019, the posted price for oil was $61.14 per barrel and the Henry Hub spot market price of natural gas was $2.09 per MMBtu. Lower prices may not only decrease our revenues, but also potentially the amount of oil, natural gas and NGLs that our operators can produce economically.
The prices we receive for oil, natural gas and NGLs vary by geographical area. The relative prices of these products are determined by factors affecting global and regional supply and demand dynamics, such as economic and geopolitical conditions, production levels, availability of transportation, weather cycles and other factors. In addition, realized prices are influenced by product quality and proximity to consuming and refining markets. Any differences between realized prices and NYMEX prices are referred to as differentials. All of our production is derived from properties located in the United States.
Oil. The substantial majority of our oil production is sold at prevailing market prices, which fluctuate in response to many factors that are outside of our control. NYMEX light sweet crude oil, commonly referred to as WTI, is the prevailing domestic oil pricing index. The majority of our oil production is priced at the prevailing market price with the final realized price affected by both quality and location differentials.
The chemical composition of crude oil plays an important role in its refining and subsequent sale as petroleum products. As a result, variations in chemical composition relative to the benchmark crude oil, usually WTI, will result in price adjustments, which are often referred to as quality differentials. The characteristics that most significantly affect quality differentials include the density of the oil, as characterized by its API gravity, and the presence and concentration of impurities, such as sulfur.
Location differentials generally result from transportation costs based on the produced oil’s proximity to consuming and refining markets and major trading points.
Natural Gas. The NYMEX price quoted at Henry Hub is a widely used benchmark for the pricing of natural gas in the United States. The actual volumetric prices realized from the sale of natural gas differ from the quoted NYMEX price as a result of quality and location differentials.
Quality differentials result from the heating value of natural gas measured in Btus and the presence of impurities, such as hydrogen sulfide, carbon dioxide and nitrogen. Natural gas containing ethane and heavier hydrocarbons has a higher Btu value and will realize a higher volumetric price than natural gas that is predominantly methane, which has a lower Btu value. Natural gas with a higher concentration of impurities will realize a lower volumetric price due to the presence of the impurities in the natural gas when sold or the cost of treating the natural gas to meet pipeline quality specifications.
Natural gas, which currently has a limited global transportation system, is subject to price variances based on local supply and demand conditions and the cost to transport natural gas to end-user markets.
NGLs. NGL pricing is generally tied to the price of oil, but varies based on differences in liquid components and location.
60
Hedging
We may enter into certain derivative instruments to partially mitigate the impact of commodity price volatility on our cash flow generated from operations. From time to time, such instruments may include variable-to-fixed-price swaps, fixed-price contracts, costless collars and other contractual arrangements. The impact of these derivative instruments could affect the amount of cash flows we ultimately realize. Historically, we have only entered into minimal fixed-price swap contracts. Under fixed-price swap contracts, a counterparty is required to make a payment to us if the settlement price is less than the swap strike price. Conversely, we are required to make a payment to the counterparty if the settlement price is greater than the swap strike price. We may employ contractual arrangements other than fixed-price swap contracts in the future to mitigate the impact of price fluctuations. If commodity prices decline in the future, our hedging contracts may partially mitigate the effect of lower prices on our future revenue.
For the year ended December 31, 2019, 2018 and 2017, we recorded a loss on commodity derivative instruments, net of $0.6 million, a gain of $0.4 million and a loss of $0.1 million, respectively. We had no crude oil swaps and no natural gas derivative contracts in place as of December 31, 2019. Our open oil and natural gas derivative contracts as of December 31, 2018 are detailed in “Note 5.—Derivative Instruments” to the consolidated and combined financial statements of Brigham Minerals as of December 31, 2019 included elsewhere in this Annual Report.
In addition, our revolving credit facility allows us to hedge up to 85% of our reasonably anticipated projected production from our proved reserves of oil and natural gas, calculated separately, for up to 60 months in the future. As of December 31, 2019, we had no crude oil swaps and as of December 31, 2018, we had in place crude oil swaps through December 2019 covering 1% of our projected crude oil production from proved reserves. We had no natural gas derivative contracts in place as of December 31, 2019 and December 31, 2018.
Adjusted EBITDA and Adjusted EBITDA Ex Lease Bonus
Adjusted EBITDA and Adjusted EBITDA ex lease bonus are non-GAAP supplemental financial measures used by our management and by external users of our financial statements such as investors, research analysts and others to assess the financial performance of our assets and their ability to sustain dividends over the long term without regard to financing methods, capital structure or historical cost basis.
We define Adjusted EBITDA as net income (loss) before depreciation, depletion and amortization, share based compensation expense, interest expense, gain or loss on sale and distribution of equity securities, gain or loss on derivative instruments, loss on extinguishment of debt, and income tax expense, less other income and gain or loss on sale of oil and gas properties. We define Adjusted EBITDA ex lease bonus as Adjusted EBITDA further adjusted to eliminate the impacts of lease bonus revenue we receive due to the unpredictability of timing and magnitude of the revenue.
Adjusted EBITDA and Adjusted EBITDA ex lease bonus do not represent and should not be considered alternatives to, or more meaningful than, net income, income from operations, cash flows from operating activities or any other measure of financial performance presented in accordance with GAAP as measures of our financial performance. Adjusted EBITDA and Adjusted EBITDA ex lease bonus have important limitations as analytical tools because they exclude some but not all items that affect net income, the most directly comparable GAAP financial measure. Our computation of Adjusted EBITDA and Adjusted EBITDA ex lease bonus may differ from computations of similarly titled measures of other companies. For further discussion, please read “Item 6.—Selected Financial Data—Non-GAAP Financial Measures.”
Sources of Our Revenues
Our revenues are primarily derived from the mineral and royalty payments we receive from our operators based on the sale of oil, natural gas and NGLs produced from our properties, as well as from lease bonus payments. Mineral and royalty revenues may vary significantly from period to period as a result of changes in volumes of production sold by our operators, production mix and commodity prices. Lease bonus revenues vary from period to period as a result of leasing activity on our mineral interests.
61
The following table presents the breakdown of our revenues for the following periods:
Years Ended December 31, | ||||||||
Revenue | 2019 | 2018 | 2017 | |||||
Mineral and royalty revenues | ||||||||
Oil sales | 81 | % | 70 | % | 54 | % | ||
Natural gas sales | 9 | % | 11 | % | 13 | % | ||
NGL sales | 6 | % | 8 | % | 6 | % | ||
Total mineral and royalty revenue | 96 | % | 89 | % | 73 | % | ||
Lease bonus revenue | 4 | % | 11 | % | 27 | % | ||
Total revenue | 100 | % | 100 | % | 100 | % | ||
Principle Components of Our Cost Structure
The following is a description of the principle components of our cost structure. However, as an owner of mineral and royalty interests, we are not obligated to fund drilling and completion capital expenditures to bring a horizontal well on line, lease operating expenses to produce our oil, natural gas and NGLs nor the plugging and abandonment costs at the end of a well’s economic life. All of the aforementioned costs are borne entirely by the exploration and production companies that have leased our mineral and royalty interests.
Gathering, Transportation and Marketing Expenses
Gathering, transportation and marketing expenses include the costs to process and transport our production to applicable sales points. Generally, the terms of the lease governing the development of our properties permits the operator to pass through these expenses to us by deducting a pro rata portion of such expenses from our production revenues.
Severance and Ad Valorem Taxes
Severance taxes are paid on produced oil, natural gas or NGLs based on either a percentage of revenues from production sold or the number of units of production sold at fixed rates established by federal, state or local taxing authorities. In general, the production taxes we pay correlate to changes in our oil, natural gas and NGL revenues, which is driven by our production volumes and prices received for our oil, natural gas and NGLs. We are also subject to ad valorem taxes in the counties where our production is located. Ad valorem taxes are generally based on the state or local government’s appraisal of the value of our oil, natural gas and NGL properties, which also trend with anticipated production, as well as oil, natural gas and NGL prices. Rates, methods of calculating property values and timing of payments vary across the different counties in which we own mineral and royalty interests.
Depreciation, Depletion and Amortization
Depreciation, depletion and amortization (“DD&A”) is the systematic expensing of the capitalized costs incurred to acquire evaluated oil and natural gas properties. We use the full cost method of accounting, and, as such, all acquisition-related costs to acquire evaluated properties are capitalized and amortized in aggregate based on the estimated economic productive lives of our properties. Depletion is the expense recorded based on the cost basis of our properties and the volume of hydrocarbons extracted during each respective period, calculated on a units-of-production basis. Estimates of proved reserves are a major component of our calculation of depletion. We adjust our depletion rates quarterly based upon the quarter-end internally generated reserve reports unless circumstances indicate that there has been a significant change in reserves or costs. The year-end reserve reports are audited by CG&A.
General and Administrative
General and administrative (“G&A”) expenses are costs incurred for overhead, including payroll and benefits for our staff, share-based compensation expense, costs of maintaining our headquarters, costs of managing our properties, audit and other fees for professional services and legal compliance. As a result of becoming a public company, we incurred incremental G&A expenses including, but not limited to, costs associated with hiring new personnel, implementation of compensation programs that are competitive with our public company peer group including share-based compensation, annual and quarterly reports to stockholders, tax return preparation, independent and internal auditor fees, investor relations activities, registrar and transfer agent fees, incremental director and officer liability insurance costs and independent director compensation. These incremental G&A expenses are not reflected in our historical financial statements before the IPO date.
62
Interest Expense
We finance a portion of our working capital requirements and acquisitions with borrowings under our revolving credit facility. As a result, we incur interest expense that is affected by both fluctuations in interest rates and our financing decisions. We reflect interest paid to the lenders under our debt arrangements (currently, our revolving credit facility) in interest expense. In connection with the closing of our IPO, we fully repaid the outstanding borrowings under our Owl Rock credit facility. Please see “Note 7.—Long-Term Debt” to the consolidated financial statements of Brigham Minerals as of December 31, 2019 included elsewhere in this Annual Report.
Income Tax Expense
Brigham Minerals is subject to U.S. federal and state income taxes as a corporation. Texas imposes a franchise tax (commonly referred to as the Texas margin tax) at a rate of up to 1.00% on gross revenues less certain deductions, as specifically set forth in the Texas margin tax statute. A portion of our mineral and royalty interests are located in Texas basins. Our predecessor was treated as a flow-through entity, and is currently treated as a disregarded entity, for U.S. federal income tax purposes and, as such, is generally not subject to U.S. federal income tax at the entity level.
63
Results of Operations
Year Ended December 31, 2019 Compared to Year Ended December 31, 2018
The following table provides the components of our revenues and expenses for the periods indicated, as well as each period’s respective average prices and production volumes:
Year Ended December 31, | |||||||||||||||
(dollars in thousands, except for realized prices) | 2019 | 2018 | Variance | ||||||||||||
Production | |||||||||||||||
Oil (MBbls) | 1,515 | 777 | 738 | 95 | % | ||||||||||
Natural gas (MMcf) | 4,707 | 2,507 | 2,200 | 88 | % | ||||||||||
NGLs (MBbls) | 407 | 222 | 185 | 83 | % | ||||||||||
Equivalents (MBoe) | 2,706 | 1,417 | 1,289 | 91 | % | ||||||||||
Equivalents per day (Boe/d) | 7,414 | 3,881 | 3,533 | 91 | % | ||||||||||
Revenues | |||||||||||||||
Oil sales | $ | 82,048 | $ | 47,040 | $ | 35,008 | 74 | % | |||||||
Natural gas sales | 9,724 | 7,014 | 2,710 | 39 | % | ||||||||||
NGL sales | 6,114 | 5,704 | 410 | 7 | % | ||||||||||
Total mineral and royalty revenue | 97,886 | 59,758 | 38,128 | 64 | % | ||||||||||
Lease bonus and other revenue | 3,629 | 7,506 | (3,877 | ) | (52 | )% | |||||||||
Total revenue | $ | 101,515 | $ | 67,264 | $ | 34,251 | 51 | % | |||||||
Realized prices, without derivatives: | |||||||||||||||
Oil ($/Bbl) | $ | 54.16 | $ | 60.56 | $ | (6.40 | ) | (11 | )% | ||||||
Natural gas ($/Mcf) | 2.07 | 2.80 | (0.73 | ) | (26 | )% | |||||||||
NGLs ($/Bbl) | 15.03 | 25.72 | (10.69 | ) | (42 | )% | |||||||||
Equivalents ($/Boe) | $ | 36.17 | $ | 42.19 | $ | (6.02 | ) | (14 | )% | ||||||
Realized prices, with derivatives(1): | |||||||||||||||
Oil ($/Bbl) | $ | 54.47 | $ | 59.59 | $ | (5.12 | ) | (9 | )% | ||||||
Equivalents ($/Boe) | 36.35 | 41.66 | (5.31 | ) | (13 | )% | |||||||||
Operating expenses | |||||||||||||||
Gathering, transportation and marketing | $ | 4,985 | $ | 3,944 | $ | 1,041 | 26 | % | |||||||
Severance and ad valorem taxes | 6,409 | 3,536 | 2,873 | 81 | % | ||||||||||
Depreciation, depletion, and amortization | 30,940 | 13,915 | 17,025 | 122 | % | ||||||||||
General and administrative (before share-based compensation) | 11,914 | 6,638 | 5,276 | 79 | % | ||||||||||
Total operating expenses (before share-based compensation) | $ | 54,248 | $ | 28,033 | $ | 26,215 | 94 | % | |||||||
Share-based compensation | 10,049 | — | 10,049 | *** | |||||||||||
Total operating expenses | $ | 64,297 | $ | 28,033 | $ | 36,264 | 129 | % | |||||||
Other income (expense) | |||||||||||||||
(Loss) gain on derivative instruments, net | $ | (568 | ) | $ | 424 | $ | (992 | ) | (234 | )% | |||||
Loss on extinguishment of debt | (6,892 | ) | — | (6,892 | ) | *** | |||||||||
Interest expense, net | (5,609 | ) | (7,446 | ) | 1,837 | (25 | )% | ||||||||
Total other income (expense), net | $ | (13,069 | ) | $ | (7,022 | ) | $ | (6,047 | ) | 86 | % | ||||
(1) Hedge prices reflect the effect of our commodity derivative transactions on our average sales prices. Our calculation of such effects include realized gains and losses on cash settlements for commodity derivatives, which we do not designate for hedge accounting.
*** A percentage calculation is not meaningful due to change in signs, zero-value denominator or a change greater than 300.
Revenues
Total revenues for the twelve months ended December 31, 2019 increased by 51%, or $34.2 million, compared to the year ended December 31, 2018. The increase was attributable to a $38.1 million increase in mineral and royalty revenue during the period, partially offset by a $3.9 million decrease in lease bonus revenue. The increase in mineral and royalty revenue was primarily the result of increased drilling and completion activity on our mineral and royalty interests, which resulted in a 91%
64
increase in production volumes to 7,414 Boe/d and a corresponding increase in revenue of $54.4 million. Realized commodity prices decreased 14% resulting in a $16.3 million decrease in mineral and royalty revenue.
Oil revenues for the year ended December 31, 2019 increased by 74%, or $35.0 million, compared to the year ended December 31, 2018. Oil production volumes increased 95% to 4,151 barrels per day resulting in a $44.7 million increase in oil revenues. The increase in oil production volumes for the period was primarily attributable to increased drilling and completion activity on our properties in Texas, Oklahoma, North Dakota and New Mexico. Realized oil prices decreased 11% to $54.16 per barrel resulting in a decrease in revenue of $9.7 million.
Natural gas revenues for the year ended December 31, 2019 increased by 39%, or $2.7 million compared to the year ended December 31, 2018. Natural gas production volumes increased 88% to 12,896 Mcf/d resulting in a $6.1 million increase in natural gas sales. The increase in natural gas production volumes for the period was primarily attributable to increased drilling and completion activity on our properties in Oklahoma, Colorado, North Dakota, Texas and New Mexico. Realized natural gas prices decreased by 26% to $2.07 per Mcf resulting in a decrease in revenue of $3.4 million.
NGL revenues for the year ended December 31, 2019 increased by 7%, or $0.4 million compared to the year ended December 31, 2018. NGL production volumes increased by 83% to 1,114 Boe/d resulting in a $4.8 million increase in NGL sales, while realized NGL prices decreased by 42% to $15.03 per barrel resulting in a decrease in revenue of $4.4 million.
Lease bonus revenue for the year ended December 31, 2019 decreased by 52%, or $3.9 million compared to the year ended December 31, 2018. The decrease was primarily attributable to a decrease in leasing activity on our interests in Oklahoma, partially offset by an increase in leasing activity in Texas. Other revenues include payments for right-of-way and surface damages and were not a significant portion of the overall amount.
Operating and other expenses
Gathering, transportation, and marketing expenses for the year ended December 31, 2019 increased by 26%, or $1.0 million, as compared to the year ended December 31, 2018, which was largely driven by the increase in our production volumes, partially offset by lower gathering, transportation and marketing rates.
Severance and ad valorem taxes for the year ended December 31, 2019 increased by 81%, or $2.9 million, as compared to the year ended December 31, 2018, which was primarily due to higher severance taxes associated with oil revenue as a result of higher oil production volumes and higher oil prices, as well as higher ad valorem taxes in Texas.
Depreciation, depletion and amortization (DD&A) expense for the year ended December 31, 2019 increased by 122%, or $17.0 million, compared to the year ended December 31, 2018, which was primarily due to an increase in depletion expense of $17.1 million. Higher production volumes increased our depletion expense by $12.1 million, and a higher depletion rate increased our depletion expense by $5.0 million.
General and administrative expense (before share-based compensation expense) for the year ended December 31, 2019 increased by 79%, or $5.3 million, compared to the year ended December 31, 2018. Increases to G&A expense are a result of: (i) $0.7 million of incremental audit and tax fees, (ii) $0.7 million of additional salaries due to increase in headcount, (iii) $1.1 million of incremental D&O insurance expenses, (iv) $1.1 million of legal and professional fees and (v) $1.7 million of other incremental expenses as a result of becoming a publicly traded company.
Share-based compensation expense for the year ended December 31, 2019 was $10.0 million net of $3.8 million of share-based compensation cost capitalized to unevaluated property. At IPO, we recognized a cumulative effect adjustment of $2.0 million of share-based compensation cost related to the Incentive Units, pertaining to the period from the grant date through the IPO. Additionally, in April of 2019, in connection with the IPO, we adopted the Brigham Minerals, Inc. 2019 LTIP and granted restricted stock awards ("RSAs"), restricted stock units ("RSUs") and performance-based vesting units ("PSUs") to our employees and executives. Certain of the RSAs vested immediately and we recognized $3.2 million of share-based compensation cost related to the RSAs. Also, subsequent to the IPO and prior to December 31, 2019, we recognized an additional $8.6 million of share-based compensation cost related to the Incentive Units and the awards granted under the LTIP. No share-based compensation expenses were recognized prior to the IPO because the IPO was not considered probable. See “Note 10.—Share-Based Compensation” to the consolidated and combined financial statements of Brigham Minerals, Inc. as of December 31, 2019 included elsewhere in this Annual Report for further discussion.
Interest expense for the year ended December 31, 2019 decreased $1.8 million, compared to the year ended December 31, 2018 due to lower average outstanding borrowings and lower average interest rates. For the year ended December 31, 2019, our weighted average debt outstanding on our Owl Rock credit facility and revolving credit facility combined was $55.0 million.
65
For the year ended December 31, 2018, our weighted average debt outstanding on our Owl Rock credit facility and prior revolving credit facility combined was $86.9 million. Our weighted-average interest was 7.29% and 8.10% for the years ended December 31, 2019 and 2018, respectively. In July 2018, proceeds from the Owl Rock credit facility were used to fully repay the outstanding balance of the prior revolving credit facility. In May 2019, a portion of the net proceeds received from the IPO were used to fully repay the outstanding borrowings under the Owl Rock credit facility. In December 2019, a portion of the net proceeds received from the December 2019 Offering were used to fully repay the outstanding borrowings under our revolving credit facility. See “Note 7.—Long-Term Debt” and “Note 1.—Business” to the consolidated and combined financial statements of Brigham Minerals, Inc. as of December 31, 2019 included elsewhere in this Annual Report for further discussion of this transaction.
Loss on extinguishment of debt. As a result of the full repayment of the outstanding balance of the Owl Rock credit facility of $200.0 million in May 2019, we recognized a loss on extinguishment of debt of approximately $6.9 million. The loss on extinguishment of debt consisted of a $4.0 million write-off of capitalized debt issuance costs, a $2.1 million prepayment fee and legal fees of $0.8 million. See “Note 7.—Long-Term Debt” to the consolidated and combined financial statements of Brigham Minerals, Inc. as of December 31, 2019 included elsewhere in this Annual Report for further discussion of these transactions.
For the year ended December 31, 2019, we recognized a loss on derivative instruments, net of $0.6 million, which is attributable to oil derivative instruments. We realized $0.5 million of gains on our settled derivative instruments during the year ended December 31, 2019. For the year ended December 31, 2018, we recognized a net gain on derivative instruments of $0.4 million, which is attributable to derivative instruments based on the price of oil. We realized $0.8 million of losses on our settled derivative instruments during the year ended December 31, 2018.
66
Year Ended December 31, 2018 Compared to Year Ended December 31, 2017
The following table provides the components of our revenues and expenses for the periods indicated, as well as each period’s respective average prices and production volumes:
Year Ended December 31, | |||||||||||||||
(dollars in thousands, except for realized prices) | 2018 | 2017 | Variance | ||||||||||||
Production | |||||||||||||||
Oil (MBbls) | 777 | 454 | 323 | 71 | % | ||||||||||
Natural gas (MMcf) | 2,507 | 1,768 | 739 | 42 | % | ||||||||||
NGLs (MBbls) | 222 | 109 | 113 | 103 | % | ||||||||||
Equivalents (MBoe) | 1,417 | 858 | 559 | 65 | % | ||||||||||
Equivalents per day (Boe/d) | 3,881 | 2,352 | 1,529 | 65 | % | ||||||||||
Revenues | |||||||||||||||
Oil sales | $ | 47,040 | $ | 22,092 | $ | 24,948 | 113 | % | |||||||
Natural gas sales | 7,014 | 5,492 | 1,522 | 28 | % | ||||||||||
NGL sales | 5,704 | 2,482 | 3,222 | 130 | % | ||||||||||
Total mineral and royalty revenue | $ | 59,758 | $ | 30,066 | $ | 29,692 | 99 | % | |||||||
Lease bonus and other revenue | 7,506 | 10,842 | (3,336 | ) | (31 | )% | |||||||||
Total revenue | $ | 67,264 | $ | 40,908 | $ | 26,356 | 64 | % | |||||||
Other operating income: | |||||||||||||||
Gain (loss) on sale of oil and gas properties, net | — | 94,551 | (94,551 | ) | *** | ||||||||||
Realized prices, without derivatives: | |||||||||||||||
Oil ($/Bbl) | $ | 60.56 | $ | 48.61 | $ | 11.95 | 25 | % | |||||||
Natural gas ($/Mcf) | 2.80 | 3.11 | (0.31 | ) | (10 | )% | |||||||||
NGLs ($/Bbl) | 25.72 | 22.71 | 3.01 | 13 | % | ||||||||||
Equivalents ($/Boe) | $ | 42.19 | $ | 35.02 | $ | 7.17 | 20 | % | |||||||
Realized prices, with derivatives(1): | |||||||||||||||
Oil ($/Bbl) | $ | 59.59 | $ | 48.61 | $ | 10.98 | 23 | % | |||||||
Equivalents ($/Boe) | 41.66 | 35.02 | 6.64 | 19 | % | ||||||||||
Operating expenses | |||||||||||||||
Gathering, transportation and marketing | $ | 3,944 | $ | 1,754 | $ | 2,190 | 125 | % | |||||||
Severance and ad valorem taxes | 3,536 | 1,601 | 1,935 | 121 | % | ||||||||||
Depreciation, depletion, and amortization | 13,915 | 6,955 | 6,960 | 100 | % | ||||||||||
General and administrative | 6,638 | 3,935 | 2,703 | 69 | % | ||||||||||
Total operating expenses | $ | 28,033 | $ | 14,245 | $ | 13,788 | 97 | % | |||||||
Other income (expense) | |||||||||||||||
Gain (loss) on derivative instruments, net | $ | 424 | $ | (121 | ) | $ | 545 | (450 | )% | ||||||
Interest expense, net | (7,446 | ) | (556 | ) | (6,890 | ) | 1,239 | % | |||||||
Total other income (expense), net | $ | (7,022 | ) | $ | (677 | ) | $ | (6,345 | ) | 937 | % | ||||
(1) Hedged prices reflect the effect of our commodity derivative transactions on our average sales prices. Our calculation of such effects include realized gains and losses on cash settlements for commodity derivatives, which we do not designate for hedge accounting.
(2) Note: Individual variance amount may not calculate due to rounding.
*** | Calculation is not meaningful. |
Revenues
Total revenues for the twelve months ended December 31, 2018 increased by 64%, or $26.4 million, compared to the year ended December 31, 2017. The increase was attributable to a $29.7 million increase in mineral and royalty revenue during the period, partially offset by a $3.3 million decrease in lease bonus revenue. The increase in mineral and royalty revenue was primarily the result of increased drilling and completion activity on our mineral and royalty interests, which resulted in a 65% increase in production volumes to 3,881 Boe/d and a corresponding increase in revenue of $19.5 million. Realized commodity prices increased 20% resulting in an additional $10.2 million increase in mineral and royalty revenue.
Oil revenue for the year ended December 31, 2018 increased by 113%, or $24.9 million, compared to the year ended December 31, 2017. Oil production volumes increased 71% to 2,128 barrels per day resulting in a $15.7 million increase in oil
67
revenue. The increase in oil production volumes for the period was primarily attributable to increased drilling and completion activity on our properties in Colorado, Texas, North Dakota and Oklahoma. Realized oil prices increased 25% to $60.56 per barrel, resulting in an additional increase in revenue of $9.2 million.
Natural gas revenue for the year ended December 31, 2018 increased by 28%, or $1.5 million, compared to the year ended December 31, 2017. Natural gas production volumes increased 42% to 6,869 Mcf/d resulting in a $2.3 million increase in natural gas sales. The increase in natural gas production volumes for the period was primarily attributable to increased drilling and completion activity on our properties in Texas, Colorado, North Dakota and Oklahoma. Realized natural gas prices decreased by 10% to $2.80 per Mcf resulting in an offsetting decrease in revenue of $0.8 million.
NGL revenue for the year ended December 31, 2018 increased by 130%, or $3.2 million compared to the year ended December 31, 2017. NGL production volumes increased by 103% to 608 Boe/d, resulting in a $2.5 million increase in NGL sales, while realized NGL prices increased by 13% to $25.72 per barrel, resulting in an additional increase in revenue of $0.7 million.
Lease bonus revenue for the year ended December 31, 2018 decreased by 31%, or $3.3 million, compared to the year ended December 31, 2017. The decrease was primarily attributable to a decrease in leasing activity on our interests in Oklahoma, partially offset by an increase in leasing activity in Texas. Other revenues include payments for right-of-way and surface damages and were not a significant portion of the overall amount.
Other operating income
Gain on sale of oil and gas properties, net. On February 28, 2017, Brigham Operating and Brigham Resources Midstream, LLC, wholly owned subsidiaries of Brigham Resources, closed on the sale of substantially all of their Southern Delaware Basin leasehold and related assets, including certain mineral and royalty interests owned by Brigham Resources, to a third-party public entity. The proceeds for mineral and royalty interests represented $156.7 million of the net adjusted sales price and consisted of cash of $111.1 million and shares valued at $45.6 million. The mineral and royalty interests sold represented approximately 12% in aggregate of Brigham Resources’ total proved reserves as of December 31, 2016. As a result of the sale, the relationship between capitalized costs and proved reserves was altered significantly and Brigham Resources recorded a gain of $94.6 million.
Operating and other expenses
Gathering, transportation and marketing expenses for the year ended December 31, 2018 increased by 125%, or $2.2 million, as compared to the year ended December 31, 2017, which was largely driven by the 65% increase in our production volumes.
Severance and ad valorem taxes for the year ended December 31, 2018 increased by 121%, or $1.9 million, as compared to the year ended December 31, 2017, which was primarily due to higher severance taxes associated with oil revenue as a result of higher oil production volumes and higher oil prices.
Depreciation, depletion and amortization (DD&A) expense for the year ended December 31, 2018 increased by 100%, or $7.0 million, compared to the year ended December 31, 2017, which was primarily due to an increase in depletion expense of $7.1 million. Higher production volumes increased our depletion expense by $4.1 million, and a higher depletion rate increased our depletion expense by $3.0 million.
General and administrative expense for the year ended December 31, 2018 increased by 69%, or $2.7 million, compared to the year ended December 31, 2017 as a result of increased headcount and incremental business development expenses.
Interest expense for the year ended December 31, 2018 increased $6.9 million compared to the year ended December 31, 2017 due to greater average outstanding borrowings and higher interest rates under our Owl Rock credit facility. The need for greater borrowings was driven by our increased acquisition pace in 2018 relative to 2017.
For the year ended December 31, 2018, we recognized a gain on derivative instruments, net of $0.4 million, which is attributable to oil derivative instruments. We realized $0.8 million of losses on our settled derivative instruments during the year ended December 31, 2018. For the year ended December 31, 2017, we recognized a net loss on derivative instruments of $0.1 million, which is attributable to derivative instruments based on the price of oil.
68
Factors Affecting the Comparability of Our Results of Operations to Our Historical Results of Operations
Our future results of operations may not be comparable to our historical results of operations for the periods presented, primarily for the reasons described below.
Corporate Reorganization
The historical consolidated and combined financial statements included in this Annual Report for periods on or before April 23, 2019 are based on the financial statements of our predecessor and Brigham Minerals prior to our corporate reorganization consummated in connection with our IPO. As a result, such historical consolidated and combined financial data may not give you an accurate indication of what our actual results would have been if the corporate reorganization had been completed at the beginning of the periods presented or of what our future results of operations are likely to be.
Brigham Minerals acquired an indirect interest in Brigham Resources on July 16, 2018 in a series of restructuring transactions pursuant to which certain entities affiliated with Warburg Pincus contributed all of their respective interests in the entities through which they held interests in Brigham Resources to Brigham Minerals in exchange for all of the outstanding shares of common stock of Brigham Minerals (the “July 2018 restructuring”). As a result of such restructuring transactions, Brigham Minerals became wholly owned by an entity affiliated with Warburg Pincus, and Brigham Minerals indirectly owned a 16.5% membership interest in Brigham Resources. The remaining outstanding membership interests of Brigham Resources remained with the Original Owners.
On November 20, 2018, Brigham Resources underwent a second series of restructuring transactions that are collectively referred to in this Annual Report as the “November 2018 restructuring.” In connection with the November 2018 restructuring, Brigham Resources became a wholly owned subsidiary of Brigham LLC. In April 2019, Brigham Minerals completed the IPO of 16,675,000 shares of Class A common stock at a price to the public of $18.00 per share. As a result of the IPO, Brigham Minerals became a holding company whose sole material asset consisted of a 43.3% interest in Brigham LLC, which wholly owns Brigham Resources. Brigham Resources continues to wholly own the Minerals Subsidiaries, which own all of Brigham Resources’ operating assets. In connection with the IPO, Brigham Minerals became the sole managing member of Brigham LLC and is responsible for all operational, management and administrative decisions relating to Brigham LLC’s business and consolidates the financial results of Brigham LLC and its wholly-owned subsidiary, Brigham Resources.
On December 16, 2019, Brigham Minerals completed an offering of 12,650,000 shares of its Class A common stock (the "December 2019 Offering"), including 6,000,000 shares issued and sold by Brigham Minerals and an aggregate of 6,650,000 shares sold by certain shareholders of the Company, of which 5,496,813 represents shares issued upon redemption of an equivalent number of their Brigham LLC units, at a price to the public of $18.10 per share.
Following the completion of the December 2019 Offering and certain redemptions of shares of Class B common stock and an equivalent number of Brigham LLC units for shares of Class A common stock completed between November 2019 and January 2020, Brigham Minerals owned a 60.1% interest in Brigham LLC and the Sponsors collectively owned 39.1% of the outstanding voting stock of Brigham Minerals as of February 27, 2020.
The corporate reorganization that was completed contemporaneously with the closing of the IPO provided a mechanism by which the Brigham LLC Units to be allocated amongst the Original Owners, including the holders of our management incentive units, was determined. As a result, the satisfaction of all conditions relating to the vesting of certain management incentive units held in Brigham Equity Holdings, LLC (“Brigham Equity Holdings”) by our management and employees became probable. Accordingly, at IPO, we recognized a cumulative effect adjustment to share-based compensation cost of approximately $2.0 million pertaining to the period from the grant date through the IPO date, related to the estimated fair value of the Incentive Units (as defined in “Executive Compensation”) at grant, all of which was non-cash. From the IPO date through December 31, 2019, we recognized an additional $11.9 million in non-cash, share-based compensation cost related to the Incentive Units, RSAs, RSUs, and PSUs. Additionally, from the IPO date through December 31, 2019, we capitalized $3.8 million of the share-based compensation cost to unevaluated oil and gas properties. In addition, as the vesting conditions of the unvested Incentive Units, RSAs, RSUs and PSAs, are satisfied we will recognize additional non-cash charges for share compensation expense of approximately $19.3 million, a portion of which will be capitalized.
69
Public Company Expenses
As a result of the IPO, we incur direct, incremental G&A expenses as a result of being a publicly traded company, including, but not limited to, costs associated with hiring new personnel, implementation of compensation programs that are competitive with our public company peer group, including share-based compensation, preparing annual and quarterly reports to stockholders, tax return preparation, independent and internal auditor fees, investor relations activities, registrar and transfer agent fees, incremental director and officer liability insurance costs and independent director compensation. These direct, incremental G&A expenses are not included in our results of operations prior to the IPO.
Income Taxes
Brigham Minerals is subject to U.S. federal and state income taxes as a corporation. Our predecessor was treated as a flow-through entity, and is currently treated as a disregarded entity, for U.S. federal income tax purposes and, as such, is generally not subject to U.S. federal income tax at the entity level. Rather, the tax liability with respect to its taxable income is passed through to its members, including Brigham Minerals. Accordingly, the financial data of our predecessor contains no provision for U.S. federal income taxes or income taxes in any state or locality (other than franchise tax in the State of Texas).
Capital Requirements and Sources of Liquidity
Historically, our primary sources of liquidity have been capital contributions from our Original Owners, borrowings under our debt arrangements, proceeds from our IPO and the December 2019 Offering (as defined below) and cash flows from operations. Going forward, we expect our primary sources of liquidity to be the net proceeds retained from the December 2019 Offering, cash flows from operations, borrowings under our revolving credit facility that we entered into in May 2019 (as described below) or any other credit facility we enter into in the future and proceeds from any future issuances of debt or equity securities. We expect our primary use of capital will be for the payment of dividends to our stockholders and for investing in our business, specifically the acquisition of additional mineral and royalty interests.
As a mineral and royalty interest owner, we incur the initial cost to acquire our interests, but thereafter do not incur any development capital expenditures or lease operating expenses, which are entirely borne by the operator. As a result, the vast majority of our capital expenditures are related to our acquisition of additional mineral and royalty interests. The amount and allocation of future acquisition-related capital expenditures will depend upon a number of factors, including the number and size of acquisition opportunities, our cash flows from operations, investing and financing activities and our ability to assimilate acquisitions. For the year ended December 31, 2019, we incurred approximately $221.9 million for acquisition-related capital expenditures, inclusive of a $3.8 million capitalized share-based compensation cost. We periodically assess changes in current and projected free cash flows, acquisition and divestiture activities, debt requirements and other factors to determine the effects on our liquidity. Based upon our current oil, natural gas and NGL price expectations for the year ended December 31, 2020, we believe that our cash flow from operations, additional borrowings under our revolving credit facility and the proceeds from the December 2019 Offering will provide us with sufficient liquidity to execute our current strategy. However, our ability to generate cash is subject to a number of factors, many of which are beyond our control, including commodity prices, weather and general economic, financial, competitive, legislative, regulatory and other factors. If we require additional capital for acquisitions or other reasons, we may seek such capital through additional borrowings, joint venture partnerships, asset sales, offerings of equity and debt securities or other means. If we are unable to obtain funds when needed or on acceptable terms, we may not be able to complete acquisitions that may be favorable to us.
As of December 31, 2019, we had $150.0 million available under the borrowing base of our revolving credit facility. We fully repaid our outstanding borrowings under the Owl Rock credit facility and revolving credit facility, which were $200.0 million as of May 7, 2019 and $80.0 million as of December 16, 2019, respectively. As of December 31, 2019, we had liquidity of $201.1 million. On February 25, 2020, the borrowing base on our revolving credit facility was increased to $180.0 million. See "Item 9B.—Other Information and "Note 14.—Subsequent Events" to the consolidated and combined financial statements of Brigham Minerals included elsewhere in this Annual Report for further discussion.
Working Capital
Our working capital, which we define as current assets minus current liabilities, totaled $71.6 million at December 31, 2019, as compared to $53.5 million at December 31, 2018. Our collection of receivables has historically been timely, and losses associated with uncollectible receivables have historically not been significant.
70
When new wells are turned to sales, our collection of receivables has lagged approximately six months from initial production as operators complete the division order process, at which point we are paid in arrears and then kept current. Our cash and cash equivalents balance totaled $51.1 million and $32.0 million at December 31, 2019 and December 31, 2018, respectively. The increase in cash and cash equivalents was primarily due to the IPO and December 2019 Offering partially offset by an increase in acquisitions pace for the year ended December 31, 2019 relative to the year ended December 31, 2018. We expect that the proceeds from the December 2019 Offering, our cash flows from operations and additional borrowings under our revolving credit facility will be sufficient to fund our working capital needs. We expect that the pace of our operators’ drilling of our undeveloped locations, production volumes, commodity prices and differentials to WTI and Henry Hub prices for our oil, natural gas and NGL production will be the largest variables affecting our working capital.
Cash Flows
The following table summarizes our cash flows for the periods indicated:
Year Ended December 31, | ||||||||||||
(In thousands) | 2019 | 2018 | 2017 | |||||||||
Net cash provided by operating activities | $ | 69,025 | $ | 31,444 | $ | 29,401 | ||||||
Net cash provided by/(used in) investing activities | (216,832 | ) | (195,268 | ) | 26,172 | |||||||
Net cash (used in)/provided by financing activities | 166,481 | 189,397 | (82,647 | ) | ||||||||
Analysis of Cash Flow Changes Between the Years Ended December 31, 2019, 2018 and 2017
Net cash provided by operating activities
Net cash provided by operating activities is primarily affected by production volumes, the prices of oil, natural gas and NGLs, lease bonus revenue and changes in working capital. The increase in net cash provided by operating activities for the year ended December 31, 2019 as compared to the year ended December 31, 2018 is primarily due to: (i) 91% increase in production volumes partially offset by the 14% decrease in realized prices during the year ended December 31, 2019 discussed above; (ii) increases in operating expenses and (iii) lower lease bonus revenues.
The increase in net cash provided by operating activities for the year ended December 31, 2018 as compared to the year ended December 31, 2017 is primarily due to: (i) 65% increase in production volumes and the 20% increase in realized prices during the year ended December 31, 2018 discussed above; (ii) increases in operating expenses and (iii) lower lease bonus revenues.
Net cash used in investing activities
Net cash used in investing activities is primarily comprised of acquisitions of mineral and royalty interests, net of dispositions. For the year ended December 31, 2019, our net cash used in investing activities was primarily a result of acquisitions of mineral and royalty interests totaling $219.5 million and other fixed assets totaling $0.4 million, offset by sales of mineral and royalty interests totaling $3.1 million.
For the year ended December 31, 2018, our net cash used in investing activities was primarily a result of acquisitions of mineral and royalty interests totaling $195.6 million and additions to other fixed assets of $0.7 million. Our cash flows from investing activities for the year ended December 31, 2018 also reflects $0.9 million of proceeds from the sale of equity securities.
For the year ended December 31, 2017, our net cash provided by investing activities was primarily a result of divestiture proceeds of $111.0 million from the February 2017 sale of mineral and royalty interests and proceeds of $17.9 million from a sale of equity securities, which was partially offset by the acquisition of mineral and royalty interests totaling $101.4 million.
Net cash provided by financing activities
Net cash provided by financing activities for the year ended December 31, 2019 included the combined net proceeds generated from the IPO and December 2019 Offering of $379.8 million offset by the combined full repayment of the outstanding balances of the Owl Rock credit facility and revolving credit facility of $175.0 million (net of additional borrowings of $105.0 million incurred during the year), dividends paid to holders of our Class A common stock of $14.7
71
million, distributions to holders of temporary equity of $20.1 million, payment of debt extinguishment fees of $2.1 million and payment of loan closing costs of $1.3 million.
Net cash provided by financing activities for the year ended December 31, 2018 included $46.0 million in net capital contributions from the Original Owners and $213.4 million in additional borrowings under our prior revolving credit facility and the Owl Rock credit facility combined, net of $4.6 million in associated loan closing costs. This was partially offset by payment of $70.0 million to pay off and terminate the prior revolving credit facility on July 28, 2018 using funds from the new term loan facility.
Net cash used in financing activities for the year ended December 31, 2017 included $94.5 million in net capital distributions to the Original Owners, partially offset by $11.9 million in net borrowings under our prior revolving credit facility, net of $0.1 million in associated closing costs.
Owl Rock Credit Facility
On July 27, 2018, we entered into a credit agreement with Owl Rock Capital Corporation, as administrative agent and collateral agent (our “Owl Rock credit facility”). Our Owl Rock credit facility was subject to customary fees, guarantees of subsidiaries, restrictions and covenants, including certain restricted payments, and was collateralized by certain of our royalty and mineral properties.
Our Owl Rock credit facility provided for a $125.0 million initial term loan and a $75.0 million delayed draw term loan (“DDTL”). Also, a $10.0 million revolving credit facility was available for general corporate purposes, which was undrawn as of May 7, 2019. In addition, as of May 7, 2019, we had $200.0 million of term loans and DDTL borrowings outstanding under our Owl Rock credit facility. We used a portion of the proceeds from the IPO to repay the outstanding borrowings under the term loan portion and DDTL portion of our Owl Rock credit facility and terminated the Owl Rock credit facility on May 7, 2019. Our Owl Rock credit facility bore interest at a rate per annum equal to, at our option, (a) the base rate plus 4.50%, or (b) the adjusted LIBOR rate for such interest period (subject to a 1.00% floor) plus 5.50%. Our Owl Rock credit facility required us to maintain compliance with customary financial and collateral coverage ratios. See “Note 7.—Long-Term Debt” to the consolidated and combined financial statements of Brigham Minerals as of September 30, 2019 contained elsewhere in this Annual Report for further discussion.
Prior Revolving Credit Facility
Prior to entering into our Owl Rock credit facility (which was terminated in May 2019), we maintained a revolving credit facility (our “prior revolving credit facility”) with Wells Fargo Bank, N.A., as administrative agent, and certain lenders party thereto with commitments of $150.0 million (subject to a borrowing base). We repaid the $70.0 million outstanding balance under our prior revolving credit facility with proceeds from our Owl Rock credit facility and terminated the prior revolving credit facility. The borrowing base at the time of termination was $70.0 million.
Revolving Credit Facility
On May 16, 2019 (the “closing date”), Brigham Resources entered into a credit agreement with Wells Fargo Bank, N.A., as administrative agent for the various lenders from time to time party thereto, providing for a revolving credit facility (our “revolving credit facility”). Our revolving credit facility is guaranteed by Brigham Resources’ domestic subsidiaries and is collateralized by a lien on substantial portion of Brigham Resources and its domestic subsidiaries’ assets, including substantial portion of their respective royalty and mineral properties.
Availability under our revolving credit facility is governed by a borrowing base, which was subject to redetermination on February 1, 2020 and semi-annually thereafter on May 1 and November 1 of each year, commencing with May 1, 2020. In addition, lenders holding two-thirds of the aggregate commitments may request one additional redetermination each year. Brigham Resources can also request one additional redetermination each year, and such other redeterminations as appropriate when significant acquisition opportunities arise. The borrowing base is subject to further adjustments for asset dispositions, material title deficiencies, certain terminations of hedge agreements and issuances of permitted additional indebtedness. Increases to the borrowing base require unanimous approval of the lenders, while decreases only require approval of lenders holding two-thirds of the aggregate commitments at such time. As of December 31, 2019, the borrowing base was $150.0 million and we had no outstanding borrowings. On February 25, 2020, the borrowing base on our revolving credit facility was increased to $180.0 million. See "Item 9B.—Other Information" and "Note 14.—Subsequent Events" to the consolidated and combined financial statements of Brigham Minerals included elsewhere in this Annual Report for further discussion.
72
Our revolving credit facility bears interest at a rate per annum equal to, at our option, the adjusted base rate or the adjusted LIBOR rate plus an applicable margin. The applicable margin is based on utilization of our revolving credit facility and ranges from (a) in the case of adjusted base rate loans, 0.750% to 1.750% and (b) in the case of adjusted LIBOR rate loans, 1.750% to 2.750%. Brigham Resources may elect an interest period of one, two, three, six, or if available to all lenders, twelve months. Interest is payable in arrears at the end of each interest period, but no less frequently than quarterly. A commitment fee is payable quarterly in arrears on the daily undrawn available commitments under our revolving credit facility in an amount ranging from 0.375% to 0.500% based on utilization of our revolving credit facility. Our revolving credit facility is subject to other customary fee, interest and expense reimbursement provisions.
Our revolving credit facility matures on May 16, 2024. Loans drawn under our revolving credit facility may be prepaid at any time without premium or penalty (other than customary LIBOR breakage) and must be prepaid in the event that exposure exceeds the lesser of the borrowing base and the elected availability at such time. The principal amount of loans that are prepaid are required to be accompanied by accrued and unpaid interest and fees on such amounts. Loans that are prepaid may be reborrowed. In addition, Brigham Resources may permanently reduce or terminate in full the commitments under our revolving credit facility prior to maturity. Any excess exposure resulting from such permanent reduction or termination must be prepaid. Upon the occurrence of an event of default under our revolving credit facility, the administrative agent acting at the direction of the lenders holding a majority of the aggregate commitments at such time may accelerate outstanding loans and terminate all commitments under our revolving credit facility, provided that such acceleration and termination occurs automatically upon the occurrence of a bankruptcy or insolvency event of default.
December 2019 Offering
On December 16, 2019, Brigham Minerals completed an offering of 12,650,000 shares of its Class A common stock (the “December 2019 Offering”), including 6,000,000 shares issued and sold by Brigham Minerals and an aggregate of 6,650,000 shares sold by certain shareholders of the Company (the “Selling Shareholders”), at a price to the public of $18.10 per share ($17.376 per share net of underwriting discounts and commissions). After deducting underwriting discounts and commissions and offering expenses, Brigham Minerals received net proceeds of approximately $102.7 million. Brigham Minerals did not receive any proceeds from the sale of shares of Class A common stock by the Selling Shareholders. Following the December 2019 Offering and prior to December 31, 2019, Brigham Minerals (i) fully repaid the $80.0 million outstanding balance under our revolving credit facility on December 16, 2019 and (ii) applied capitalized issuance cost of $1.6 million as a reduction of additional paid-in-capital.
Contractual Obligations
A summary of our contractual obligations as of December 31, 2019 is provided in the following table:
By Year | ||||||||||||||||||||||||||||
(In thousands) | 2020 | 2021 | 2022 | 2023 | 2024 | Thereafter | Total | |||||||||||||||||||||
Office lease | $ | 1,000 | $ | 1,345 | $ | 1,419 | $ | 1,492 | $ | 1,566 | $ | 4,312 | $ | 11,134 | ||||||||||||||
Critical Accounting Policies and Estimates
The discussion and analysis of our financial condition and results of operations are based upon our consolidated and combined financial statements, which have been prepared in accordance with GAAP. The preparation of our consolidated and combined financial statements requires it to make estimates and assumptions that affect the reported amounts of assets, liabilities, revenues and expenses and related disclosure of contingent assets and liabilities. Changes in facts and circumstances or additional information may result in revised estimates, and actual results may differ from these estimates.
A complete list of our significant accounting policies are described in the notes to our audited consolidated and combined financial statements for the year ended December 31, 2019 included elsewhere in this Annual Report.
Use of Estimates
The preparation of consolidated and combined financial statements in conformity with GAAP requires management to make estimates and assumptions that affect the reported amounts of assets, liabilities, revenues and expenses and the disclosure of contingent assets and liabilities in the consolidated and combined financial statements and accompanying notes. Although management believes these estimates are reasonable, actual results could differ from these estimates. Changes in estimates are recorded prospectively.
73
Our consolidated and combined financial statements are based on a number of significant estimates including quantities of oil, natural gas and NGL reserves that are the basis for the calculations of DD&A and impairment of oil and natural gas properties. Reservoir engineering is a subjective process of estimating underground accumulations of oil and natural gas and there are numerous uncertainties inherent in estimating quantities of proved oil and natural gas reserves. The accuracy of any reserve estimate is a function of the quality of available data and of engineering and geological interpretation and judgment. As a result, reserve estimates may differ from the quantities of oil and natural gas that are ultimately recovered. Our reserve estimates are audited by CG&A, an independent petroleum engineering firm. Other items subject to significant estimates and assumptions include the carrying amount of oil and natural gas properties, valuation of derivative instruments and revenue accruals.
Receivables
Receivables consist of mineral and royalty income due from operators for oil and gas sales to purchasers. Those purchasers remit payment for production to the operator of the properties and the operator, in turn, remits payment to us. Receivables from third parties for which we did not receive actual information, either due to timing delays or due to the unavailability of data at the time when revenues are recognized, are estimated. Volume estimates for wells with available historical actual data are based upon (i) the historical actual data for the months the data is available, or (ii) engineering estimates for the months the historical actual data is not available. We do not recognize revenues for wells with no historical actual data because we cannot conclude that it is probable that a significant revenue reversal will not occur in future periods. Pricing estimates are based upon actual prices realized in an area by adjusting the market price for the average basis differential from market on a basin-by-basin basis.
We routinely review outstanding balances, assess the financial strength of our operators and record a reserve for amounts not expected to be fully recovered. We recorded an allowance for doubtful accounts for $0.6 million and $0.4 million for the years ended December 31, 2019 and 2018. We did not record any allowance for doubtful accounts for the year ended December 31, 2017.
Derivative Instruments
In the normal course of business, we are exposed to certain risks, including changes in the prices of oil, natural gas and NGLs and interest rates. We have historically entered into derivative contracts to manage our exposure to these risks. Our risk management activity is generally accomplished through over-the-counter derivative contracts with large financial institutions. We do not enter into derivative instruments for speculative purposes. Derivative instruments are recognized at fair value. If a right of offset exists under master netting arrangements and certain other criteria are met, derivative assets and liabilities with the same counterparty are netted on the consolidated and combined balance sheets. We do not specifically designate derivative instruments as cash flow hedges, even though they reduce our exposure to changes in oil and natural gas prices; therefore, gains and losses arising from changes in the fair value of derivatives are recognized on a net basis in our consolidated and combined statements of operations within (loss) gain on derivative instruments, net.
Oil and Gas Properties
We use the full cost method of accounting for our oil and natural gas properties. Under this method, all acquisition costs incurred for the purpose of acquiring mineral and royalty interests and certain related employee costs are capitalized into a full cost pool. Costs associated with general corporate activities are expensed in the period incurred.
Capitalized costs are amortized using the units-of-production method. Under this method, the provision for depletion is calculated by multiplying total production for the period by a depletion rate. The depletion rate is determined by dividing the total unamortized cost base by the net equivalent proved reserves at the beginning of the period.
Costs associated with unevaluated properties are excluded from the amortizable cost base until a determination has been made as to the existence of proved reserves. Unevaluated properties are reviewed periodically to determine whether the costs incurred should be reclassified to the full cost pool and subjected to amortization. The costs associated with unevaluated properties primarily consist of acquisition and leasehold costs and capitalized interest. Unevaluated properties are assessed for impairment on an individual basis or as a group if properties are individually insignificant. The assessment includes consideration of the following factors, among others: expectation of future drilling activity; past drilling results and activity; geological and geophysical evaluations; the assignment of proved reserves; and the economic viability of development if proved reserves are assigned. During any period in which these factors indicate an impairment, the cumulative acquisition costs incurred to date for such property are transferred to the full cost pool and are then subject to amortization. There was no impairment recorded for unevaluated properties for the years ended December 31, 2019, 2018 and 2017.
74
Sales and abandonments of oil and natural gas properties being amortized are accounted for as adjustments to the full cost pool, with no gain or loss recognized unless the adjustments would significantly alter the relationship between capitalized costs and proved reserves. A significant alteration would not ordinarily be expected to occur upon the sale of reserves involving less than 25% of the reserve quantities of a cost center.
Natural gas volumes are converted to Boe at the rate of six thousand Mcf of natural gas to one Bbl of oil. This convention is not an equivalent price basis and there may be a large difference in value between an equivalent volume of oil versus an equivalent volume of natural gas.
Under the full cost method of accounting, total capitalized costs of oil and natural gas properties, net of accumulated depletion, may not exceed an amount equal to the present value of future net revenues from proved reserves, discounted at 10% per annum, plus the lower of cost or fair value of unevaluated properties (the ceiling limitation). A ceiling limitation is calculated at each reporting period. If total capitalized costs, net of accumulated DD&A, are greater than the ceiling limitation, a write-down or impairment of the full cost pool is required. A write-down of the carrying value of the full cost pool is a noncash charge that reduces earnings and impacts equity in the period of occurrence and typically results in lower depletion expense in future periods. Once incurred, a write-down cannot be reversed at a later date. The ceiling limitation calculation is prepared using the 12-month first day of the month oil and natural gas average prices, as adjusted for basis or location differentials, held constant over the life of the reserves (net wellhead prices). If applicable, these net wellhead prices would be further adjusted to include the effects of any fixed price arrangements for the sale of oil and natural gas.
As of December 31, 2019, 2018 and 2017, the full cost ceiling value of our reserves was calculated based on the unweighted arithmetic average first-day-of-the-month price for the 12 months ended December 31, 2019, 2018 and 2017 of $55.65, $65.66, and $51.34, respectively, per barrel for oil, adjusted by area for energy content, transportation fees and regional price differentials, and the unweighted arithmetic average first-day-of-the-month price for the 12 months ended December 31, 2019, 2018 and 2017 of $2.60, $3.12, and $2.99, respectively, per MMBtu for natural gas, adjusted by area for energy content, transportation fees and regional price differentials. Using these prices, the net book value of oil and natural gas was above the ceiling limitation and no write-off was necessary.
Revenue from Contracts with Customers
On December 31, 2019, we adopted Accounting Standards Codification Topic 606, Revenue from Contracts with Customers, ("ASC 606") using the modified retrospective approach, which only applied to contracts that were in effect as of the date of adoption. The adoption did not require an adjustment to opening retained earnings for the cumulative effect adjustment and did not impact our previously reported results of operations, nor our ongoing consolidated and combined balance sheets, statements of cash flow or statements of changes in shareholders' and members' equity. Overall, there were no material changes in the timing of the satisfaction of our performance obligations or the allocation of the transaction price to our performance obligations in applying the guidance in ASC 606 as compared to legacy U.S. GAAP.
Oil and natural gas sales
Oil, natural gas and NGLs sales revenues are generally recognized when control of the product is transferred to the customer, the performance obligations under the terms of the contracts with customers are satisfied and collectability is reasonably assured. As a non-operator, we have limited visibility into the timing of when new wells start producing and production statements may not be received for 30 to 90 days or more after the date production is delivered. As a result, we are required to estimate the amount of production delivered to the purchaser and the price that we will receive for the sale of the product. The expected sales volumes and prices for these properties are estimated and recorded within the Accounts receivable line item in the accompanying consolidated and combined balance sheets. The difference between our estimates and the actual amounts received for oil and natural gas sales is recorded in the month that payment is received from the third party.
Lease bonus and other income
We earn revenue from lease bonuses, delay rentals, and right-of-way payments. We generate lease bonus revenue by leasing our mineral interests to exploration and production companies. A lease agreement represents our contract with a customer and generally transfers the rights to any oil or natural gas discovered, grants us a right to a specified royalty interest, and requires that drilling and completion operations commence within a specified time period. We recognizes lease bonus revenues when the lease agreement has been executed, payment has been received, and we have no further obligation to refund the payment. At the time we execute the lease agreement, we expect to receive the lease bonus payment within a reasonable time, though in no case more than one year, such that we have not adjusted the expected amount of consideration for the effects of any significant financing component per the practical expedient in ASC 606.
75
Share-Based Compensation
Brigham Minerals accounts for its share-based compensation, including grants of the Incentive Units, restricted stock awards, time-based restricted stock units and performance-based stock units, in the condensed consolidated and combined statements of operations based on their estimated fair values at grant date. Brigham Minerals uses a Monte Carlo simulation to determine the fair value of performance-based stock units. Brigham Minerals recognizes expense on a straight-line basis over the vesting period of the respective grant, which is generally the requisite service period. Brigham Minerals capitalizes a portion of the share-based compensation cost to oil and gas properties on the consolidated and combined balance sheets. Share-based compensation expense is included in general and administrative expenses in Brigham Minerals’ consolidated and combined statements of operations included within this Annual Report. There was approximately $19.3 million of unamortized compensation expense relating to outstanding awards at December 31, 2019, a portion of which will be capitalized. The unrecognized compensation expense will be recognized on a straight-line basis over the remaining vesting periods of the awards. Brigham Minerals accounts for forfeitures as they occur.
Income Taxes
Brigham Minerals accounts for income taxes using the asset and liability method. Deferred tax assets and liabilities are recognized for the future tax consequences attributable to differences between the financial statement carrying amounts of existing assets and liabilities and their respective tax bases. Deferred tax assets and liabilities are calculated by applying existing tax laws and the rates expected to apply to taxable income in the years in which those temporary differences are expected to be recovered or settled. The effect of a change in tax rates on deferred tax assets and liabilities is recognized in income in the period that includes the enactment date.
We periodically assess whether it is more likely than not that we will generate sufficient taxable income to realize our deferred income tax assets, including net operating losses. In making this determination, we consider all available positive and negative evidence and make certain assumptions. We consider, among other things, our deferred tax liabilities, the overall business environment, our historical earnings and losses, current industry trends and our outlook for future years.
Temporary Equity
Brigham Minerals accounts for the Original Owners’ 40.2% interest in Brigham LLC (as of December 31, 2019) as temporary equity as a result of certain redemption rights held by the Original Owners as discussed in “Note 9.—Temporary Equity” to the condensed, consolidated and combined financial statements as of December 31, 2019 contained elsewhere in this Annual Report. As such, Brigham Minerals adjusts temporary equity to its maximum redemption amount at the balance sheet date, if higher than the carrying amount. The redemption amount is based on the 10-day volume-weighted average closing price (“VWAP”) of Class A shares at the end of the reporting period. Changes in the redemption value are recognized immediately as they occur, as if the end of the reporting period was also the redemption date for the instrument, with an offsetting entry to additional paid-in capital.
Recently Issued Accounting Pronouncements
See “Note 2.—Significant Accounting Policies—Recently Issued Accounting Standards” in our consolidated and combined financial statements as of December 31, 2019 included elsewhere in this Annual Report, for a discussion of recent accounting pronouncements.
We are an “emerging growth company,” under the JOBs Act, which allows us to take advantage of an extended transition period for complying with new or revised accounting standards pursuant to Section 107(b) of the JOBS Act.
Internal Controls and Procedures
Upon becoming a public company, we were required to comply with the SEC’s rules implementing Section 302 and Section 404 of the Sarbanes-Oxley Act, which requires our management to certify financial and other information in our quarterly and annual reports, and, beginning with the year following the first fiscal year for which we are required to file an annual report with the SEC, provide an annual management report on the effectiveness of our internal control over financial reporting. In addition, we will be required to have our independent registered public accounting firm attest to the effectiveness of our internal control over financial reporting under Section 404 beginning with our first annual report subsequent to our ceasing to be an “emerging growth company” within the meaning of Section 2(a)(19) of the Securities Act.
76
Material Weaknesses and Remediation
Prior to the completion of the IPO, Brigham Resources had been a private company that had required fewer accounting personnel to execute its accounting processes and supervisory resources to address its internal control over financial reporting, which we believed were adequate for a private company of its size and industry. In preparation for ongoing operations of a public company, we engaged third-party consultants to assist with the documentation, implementation and testing of enhanced accounting processes and control procedures required to meet the financial reporting requirements of a public company. Nevertheless, the design and execution of our controls had not been sufficiently tested by individuals with financial reporting oversight roles or by our third party consultants. In connection with the preparation and review of our unaudited consolidated and combined financial statements for the nine months ended September 30, 2018, our management identified certain material weaknesses related to our risk assessment processes and certain controls related to revenues and certain recent transactions. A material weakness is a deficiency, or a combination of deficiencies, in internal control over financial reporting such that there is a reasonable possibility that a material misstatement of our annual or interim financial statements will not be prevented or detected on a timely basis. After identifying such material weaknesses, which resulted in errors in our unaudited condensed consolidated financial statements for the three and six months ended June 30, 2018, we reviewed our audited financial statements for the years ended December 31, 2017 for additional potential accrual and presentation errors, which resulted in an immaterial correction of the presentation of gains and losses on sales of assets to include such gains and losses in other operating income for all periods presented.
Management has taken steps to remediate the material weaknesses in our internal control over financial reporting described above. These steps include engaging a third-party consultant to develop a plan for remediation and ongoing monitoring of the previously identified material weaknesses, implementing additional review procedures, employing additional finance and accounting personnel and reevaluating our internal reporting procedures with respect to revenue recognition. Due to the material weaknesses described above, management performed additional analysis and procedures in order to conclude that our consolidated and combined financial statements for the years ended December 31, 2018 and 2019, respectively, are fairly presented, in all material respects, in accordance with GAAP. Additionally, the third-party consultants tested multiple occurrences of the operating effectiveness of the newly implemented controls. As a result of the remediation efforts discussed above, management believes that all previously identified material weaknesses have been remediated.
Inflation
Inflation in the United States has been relatively low in recent years and did not have a material impact on our results of operations for the years ended December 31, 2019, 2018 and 2017. Although the impact of inflation has been insignificant in recent years, it is still a factor in the United States economy and our operators tend to experience inflationary pressure on the cost of oilfield services and equipment as increasing oil and natural gas prices increase drilling activity in the areas in which our properties are located.
Off-Balance Sheet Arrangements
As of December 31, 2019, we did not have any material off-balance sheet arrangements.
ITEM 7A. QUANTITATIVE AND QUALITATIVE DISCLOSURES ABOUT MARKET RISK
Quantitative and Qualitative Disclosure About Market Risk
We are exposed to market risk, including the effects of adverse changes in commodity prices and interest rates as described below. The primary objective of the following information is to provide quantitative and qualitative information about our potential exposure to market risks. The term “market risk” refers to the risk of loss arising from adverse changes in oil, natural gas and NGL prices and interest rates. The disclosures are not meant to be precise indicators of expected future losses, but rather indicators of reasonably possible losses. This forward-looking information provides indicators of how we view and manage our ongoing market risk exposures. All of our market risk sensitive instruments were entered into for purposes other than speculative trading.
Commodity Price Risk
Our major market risk exposure is in the pricing that our operators receive for the oil, natural gas and NGLs produced from our properties. Realized prices are primarily driven by the prevailing global prices for oil and prices for natural gas and
77
NGLs in the United States. Pricing for oil, natural gas and NGLs has been volatile and unpredictable for several years, and we expect this volatility to continue in the future. During the past five years, the posted price for WTI has ranged from a low of $26.19 per barrel in February 2016 to a high of $77.41 per barrel in June 2018, and as of December 31, 2019, the posted price for oil was $61.14 per barrel. NGL prices generally correlate to the price of oil, and accordingly prices for these products have likewise declined and are likely to continue following that market. Prices for domestic natural gas have also fluctuated significantly over the last several years. During the past five years, the Henry Hub spot market price for natural gas has ranged from a low of $1.49 per MMBtu in March 2016 to a high of $6.24 per MMBtu in January 2018, and as of December 31, 2019, 2019, the Henry Hub spot market price of natural gas was $2.09 per MMBtu. The prices our operators receive for the oil, natural gas and NGLs produced from our properties depend on numerous factors beyond their and our control, some of which are discussed in “Item 1A.—Risk Factors—Risks Related to Our Business. Substantially all of our revenues are derived from royalty payments that are based on the price at which oil, natural gas and NGLs produced from the acreage underlying our interests is sold. Prices of oil, natural gas and NGLs are volatile due to factors beyond our control. A substantial or extended decline in commodity prices may adversely affect our business, financial condition or results of operations.”
A $1.00 per barrel change in our realized oil price would have resulted in a $1.5 million change in our oil revenues for the year ended December 31, 2019. A $0.10 per Mcf change in our realized natural gas price would have resulted in a $0.5 million change in our natural gas revenues for the year ended December 31, 2019. A $1.00 per barrel change in NGL prices would have resulted in a $0.4 million change in our NGL revenues for the year months ended December 31, 2019. Royalty revenue from oil sales contributed 81% of our total revenues for the year ended December 31, 2019. Royalty revenue from natural gas sales contributed 9% and royalty revenue from NGL sales contributed 6% of our total revenues for the year ended December 31, 2019.
We may enter into derivative instruments, such as collars, swaps and basis swaps, to partially mitigate the impact of commodity price volatility. These hedging instruments allow us to reduce, but not eliminate, the potential effects of the variability in cash flow from operations due to fluctuations in oil, natural gas and NGL prices and provide increased certainty of cash flows for our debt service requirements. However, these instruments provide only partial price protection against declines in oil, natural gas and NGL prices and may partially limit our potential gains from future increases in prices. Our revolving credit facility allows us to hedge up to 85% of our reasonably anticipated projected production from our proved reserves of oil and natural gas, calculated separately, for up to 60 months in the future. As of December 31, 2018, we had in place crude oil swaps through December 2019 covering 1% of our projected crude oil production from proved reserves. We had no oil derivative contracts in place as of December 31, 2019. We had no natural gas derivative contracts in place as of December 31, 2019 and 2018.
Counterparty and Customer Credit Risk
Our derivative contracts expose us to credit risk in the event of nonperformance by counterparties. While we do not require counterparties to our derivative contracts to post collateral, we do evaluate the credit standing of such counterparties as we deem appropriate. The counterparties to our derivative contracts currently in place have investment grade ratings.
Our principal exposures to credit risk are through receivables generated by the production activities of our operators. The inability or failure of our significant operators to meet their obligations to us or their insolvency or liquidation may adversely affect our financial results. However, we believe the credit risk associated with our operators and customers is acceptable.
Interest Rate Risk
Our revolving credit facility bears interest at a rate per annum equal to, at our option, the adjusted base rate or the adjusted LIBOR rate plus an applicable margin. The applicable margin is based on utilization of our revolving credit facility and ranges from (a) in the case of adjusted base rate loans, 0.750% to 1.750% and (b) in the case of adjusted LIBOR rate loans, 1.750% to 2.750%. Brigham Resources may elect an interest period of one, two, three, six, or if available to all lenders, twelve months. Interest is payable in arrears at the end of each interest period, but no less frequently than quarterly. A commitment fee is payable quarterly in arrears on the daily undrawn available commitments under our revolving credit facility in an amount ranging from 0.375% to 0.500% based on utilization of our revolving credit facility. Our revolving credit facility is subject to other customary fee, interest and expense reimbursement provisions. As of December 31, 2019, we had no outstanding balance on our revolving credit facility.
ITEM 8. FINANCIAL STATEMENTS AND SUPPLEMENTARY DATA
The Company's consolidated and combined financial statements required by this item are included in this Annual Report beginning on page F-1.
78
ITEM 9. CHANGES IN AND DISAGREEMENTS WITH ACCOUNTANTS ON ACCOUNTING AND FINANCIAL DISCLOSURE
None.
ITEM 9A. CONTROLS AND PROCEDURES
Internal Controls and Procedures
Upon becoming a public company, we were required to comply with the SEC’s rules implementing Section 302 of Sarbanes-Oxley, which will require our management to certify financial and other information in our quarterly and annual reports and provide an annual management report on the effectiveness of our internal control over financial reporting. We will not be required to make our first assessment of our internal control over financial reporting under Section 404 until the year following the first fiscal year for which we are required to file an annual report with the SEC. We will not be required to have our independent registered public accounting firm attest to the effectiveness of our internal control over financial reporting under Section 404 until our first annual report subsequent to our ceasing to be an “emerging growth company” within the meaning of Section 2(a)(19) of the Securities Act. To comply with the requirements of being a public company, we will need to implement additional financial and management controls, reporting systems and procedures and hire additional accounting, finance and legal staff.
Accordingly, for the reasons discussed above, this Annual Report does not include a report of management’s assessment regarding internal control over financial reporting or an attestation report of the company’s registered public accounting firm due to a transition period established by rules of the Securities and Exchange Commission for newly public companies.
ITEM 9B. OTHER INFORMATION
Item 1.01 Entry into a Material Definitive Agreement
On February 27, 2020, Brigham Resources, as borrower, entered into the Second Amendment (the “Second Amendment”) to the Credit Agreement among Brigham Resources, Wells Fargo Bank, N.A., as administrative agent, and the lenders and other parties thereto (the “Credit Agreement”). The Second Amendment, among other things, evidenced an increase of the borrowing base and elected commitments under the Credit Agreement from $150.0 million to $180.0 million.
The foregoing description of the Second Amendment is a summary only and is qualified in its entirety by reference to the Second Amendment, a copy of which is attached as Exhibit 10.15 to this Annual Report on Form 10-K and is incorporated herein by reference.
79
PART III
ITEM 10. DIRECTORS, EXECUTIVE OFFICERS AND CORPORATE GOVERNANCE MANAGEMENT
Information as to Item 10 is incorporated by reference from the information in our definitive proxy statement for the 2020 Annual Meeting of Stockholders, which we will file pursuant to Regulation 14A with the SEC within 120 days after the close of the year ended December 31, 2019.
ITEM 11. EXECUTIVE COMPENSATION
Information as to Item 11 is incorporated by reference from the information in our definitive proxy statement for the 2020 Annual Meeting of Stockholders, which we file pursuant to Regulation 14A with the SEC within 120 days after the close of the year ended December 31, 2019.
ITEM 12. SECURITY OWNERSHIP OF CERTAIN BENEFICIAL OWNERS AND MANAGEMENT AND RELATED UNITHOLDER MATTERS
Information as to Item 12 is incorporated by reference from the information in our definitive proxy statement for the 2020 Annual Meeting of Stockholders, which we file pursuant to Regulation 14A with the SEC within 120 days after the close of the year ended December 31, 2019.
ITEM 13. CERTAIN RELATIONSHIPS AND RELATED TRANSACTIONS, AND DIRECTOR INDEPENDENCE
Information as to Item 13 is incorporated by reference from the information in our definitive proxy statement for the 2020 Annual Meeting of Stockholders, which we file pursuant to Regulation 14A with the SEC within 120 days after the close of the year ended December 31, 2019.
ITEM 14. PRINCIPAL ACCOUNTING FEES AND SERVICES
Information as to Item 14 is incorporated by reference from the information in our definitive proxy statement for the 2020 Annual Meeting of Stockholders, which we file pursuant to Regulation 14A with the SEC within 120 days after the close of the year ended December 31, 2019.
80
US 5989852v.1
PART IV
ITEM 15. EXHIBITS, FINANCIAL STATEMENT SCHEDULES
(1) Financial Statements
The consolidated and combined financial statements of Brigham Minerals, Inc. and the Report of Independent Registered Public Accounting Firm are included in Part II, "Item 8.— Financial Statements and Supplementary Data” of this Annual Report. Reference is made to the accompanying Index to Financial Statements.
(2) Financial Statement Schedules
All financial statement schedules have been omitted because they are not applicable or the required information is presented in the financial statements or notes thereto.
(3) Index to Exhibits
The exhibits required to be filed or furnished pursuant to Item 601 of Regulation S-K are set forth below.
Exhibit Number | Description | |
81
US 5989852v.1
* | Filed herewith |
† | Compensatory plan or arrangement. |
82
US 5989852v.1
ITEM 16. FORM 10-K SUMMARY
None.
SIGNATURES
Pursuant to the requirements of the Securities Exchange Act of 1934, the registrant has duly caused this registration statement to be signed on its behalf by the undersigned, thereunto duly authorized, in the City of Austin, State of Texas.
BRIGHAM MINERALS, INC.
By:
Name: /s/ Robert M. Roosa
Robert M. Roosa
Chief Executive Officer and Director
Date: February 27, 2020
Pursuant to the requirements of the Securities Exchange Act of 1934, this report has been signed below by the following persons on behalf of the registrant and in the capacities indicated on February 27, 2020.
Name | Title | |
/s/ Ben M. Brigham | Executive Chairman | |
Ben M. Brigham | ||
/s/ Robert M. Roosa | Chief Executive Officer and Director | |
Robert M. Roosa | (Principal Executive Officer) | |
/s/ Blake C. Williams | Chief Financial Officer | |
Blake C. Williams | (Principal Financial Officer and Principal Accounting Officer) | |
/s/ Harold D. Carter | Director | |
Harold D. Carter | ||
/s/ John A. Holland | Director | |
John A. Holland | ||
/s/ W. Howard Keenan, Jr. | Director | |
W. Howard Keenan, Jr. | ||
/s/ James R. Levy | Director | |
James R. Levy | ||
/s/ Richard Stoneburner | Director | |
Richard Stoneburner | ||
/s/ John R. Sult | Director | |
John R. Sult | ||
83
US 5989852v.1
INDEX TO FINANCIAL STATEMENTS
F - 1
Report of Independent Registered Public Accounting Firm
To the Shareholders and Board of Directors
Brigham Minerals, Inc.:
Opinion on the Consolidated and Combined Financial Statements
We have audited the accompanying consolidated and combined balance sheets of Brigham Minerals, Inc. and subsidiaries (the Company) as of December 31, 2019 and 2018, the related consolidated and combined statements of operations, comprehensive income, changes in shareholders’ and members’ equity, and cash flows for each of the years in the three‑year period ended December 31, 2019, and the related notes (collectively, the consolidated and combined financial statements). In our opinion, the consolidated and combined financial statements present fairly, in all material respects, the financial position of the Company as of December 31, 2019 and 2018, and the results of its operations and its cash flows for each of the years in the three-year period ended December 31, 2019, in conformity with U.S. generally accepted accounting principles.
Basis for Opinion
These consolidated and combined financial statements are the responsibility of the Company’s management. Our responsibility is to express an opinion on these consolidated and combined financial statements based on our audits. We are a public accounting firm registered with the Public Company Accounting Oversight Board (United States) (PCAOB) and are required to be independent with respect to the Company in accordance with the U.S. federal securities laws and the applicable rules and regulations of the Securities and Exchange Commission and the PCAOB.
We conducted our audits in accordance with the standards of the PCAOB. Those standards require that we plan and perform the audit to obtain reasonable assurance about whether the consolidated and combined financial statements are free of material misstatement, whether due to error or fraud. Our audits included performing procedures to assess the risks of material misstatement of the consolidated and combined financial statements, whether due to error or fraud, and performing procedures that respond to those risks. Such procedures included examining, on a test basis, evidence regarding the amounts and disclosures in the consolidated and combined financial statements. Our audits also included evaluating the accounting principles used and significant estimates made by management, as well as evaluating the overall presentation of the consolidated and combined financial statements. We believe that our audits provide a reasonable basis for our opinion.

We have served as the Company’s auditor since 2013.
Dallas, Texas
February 27, 2020
F - 2
BRIGHAM MINERALS, INC.
CONSOLIDATED AND COMBINED BALANCE SHEETS
December 31, | ||||||||
(In thousands, except share data) | 2019 | 2018 | ||||||
ASSETS | ||||||||
Current assets: | ||||||||
Cash and cash equivalents | $ | 51,133 | $ | 31,985 | ||||
Restricted cash | — | 474 | ||||||
Accounts receivable | 30,291 | 20,695 | ||||||
Prepaid expenses and other | 1,688 | 7,103 | ||||||
Short-term derivative assets | — | 1,057 | ||||||
Total current assets | 83,112 | 61,314 | ||||||
Oil and gas properties, at cost, using the full cost method of accounting: | ||||||||
Unevaluated property | 291,664 | 228,151 | ||||||
Evaluated property | 449,061 | 289,851 | ||||||
Less accumulated depreciation, depletion, and amortization | (61,103 | ) | (27,628 | ) | ||||
Oil and gas properties - net | 679,622 | 490,374 | ||||||
Other property and equipment | 5,095 | 5,408 | ||||||
Less accumulated depreciation | (3,703 | ) | (3,115 | ) | ||||
Other property and equipment - net | 1,392 | 2,293 | ||||||
Deferred tax asset | 18,823 | — | ||||||
Other assets, net | 1,213 | 45 | ||||||
Total assets | $ | 784,162 | $ | 554,026 | ||||
LIABILITIES AND SHAREHOLDERS'/MEMBERS' EQUITY | ||||||||
Current liabilities: | ||||||||
Accounts payable and accrued liabilities | $ | 11,533 | $ | 5,662 | ||||
Current portion of debt | — | 2,188 | ||||||
Total current liabilities | 11,533 | 7,850 | ||||||
Long-term debt | — | 168,517 | ||||||
Deferred tax liability | — | 3,684 | ||||||
Other non-current liabilities | 803 | 27 | ||||||
Temporary equity | 454,507 | — | ||||||
Shareholders' and members' equity: | ||||||||
Members' contributed capital | — | 208,728 | ||||||
Preferred stock, $0.01 par value; 50,000,000 authorized; no shares issued and outstanding | — | — | ||||||
Class A common stock, $0.01 par value; 400,000,000 authorized, 34,040,934 shares issued and outstanding at December 31, 2019 | 340 | — | ||||||
Class B common stock, $0.01 par value; 150,000,000 authorized, 22,847,045 shares issued and outstanding at December 31, 2019 | — | — | ||||||
Additional paid-in capital | 323,578 | (3,057 | ) | |||||
Accumulated (deficit) earnings | (6,599 | ) | 168,277 | |||||
Total shareholders' equity attributable to Brigham Minerals, Inc. and members' equity | 317,319 | 373,948 | ||||||
Total liabilities and shareholders' and members' equity | $ | 784,162 | $ | 554,026 | ||||
The accompanying notes are an integral part of these consolidated and combined financial statements.
F - 3
BRIGHAM MINERALS, INC.
CONSOLIDATED AND COMBINED STATEMENTS OF OPERATIONS
Years Ended December 31, | ||||||||||||
(In thousands, except per share data) | 2019 | 2018 | 2017 | |||||||||
REVENUES | ||||||||||||
Mineral and royalty revenues | $ | 97,886 | $ | 59,758 | $ | 30,066 | ||||||
Lease bonus and other revenues | 3,629 | 7,506 | 10,842 | |||||||||
Total revenues | $ | 101,515 | $ | 67,264 | $ | 40,908 | ||||||
OTHER OPERATING INCOME: | ||||||||||||
Gain on sale of oil and gas properties, net | — | — | 94,551 | |||||||||
OPERATING EXPENSES | ||||||||||||
Gathering, transportation and marketing | 4,985 | 3,944 | 1,754 | |||||||||
Severance and ad valorem taxes | 6,409 | 3,536 | 1,601 | |||||||||
Depreciation, depletion, and amortization | 30,940 | 13,915 | 6,955 | |||||||||
General and administrative | 21,963 | 6,638 | 3,935 | |||||||||
Total operating expenses | $ | 64,297 | $ | 28,033 | $ | 14,245 | ||||||
NET INCOME FROM OPERATIONS | $ | 37,218 | $ | 39,231 | $ | 121,214 | ||||||
(Loss) gain on derivative instruments, net | (568 | ) | 424 | (121 | ) | |||||||
Interest expense, net | (5,609 | ) | (7,446 | ) | (556 | ) | ||||||
Loss on extinguishment of debt | (6,892 | ) | — | — | ||||||||
Gain (loss) on sale and distribution of equity securities | — | 823 | (4,222 | ) | ||||||||
Other income, net | 169 | 110 | 305 | |||||||||
Income before income taxes | $ | 24,318 | $ | 33,142 | $ | 116,620 | ||||||
Income tax expense | 2,679 | 327 | 1,008 | |||||||||
NET INCOME | $ | 21,639 | $ | 32,815 | $ | 115,612 | ||||||
Less: Net income attributable to Predecessor | (5,092 | ) | (30,976 | ) | (115,612 | ) | ||||||
Less: Net income attributable to temporary equity | (9,646 | ) | — | — | ||||||||
Net income attributable to common shareholders | $ | 6,901 | $ | 1,839 | $ | — | ||||||
NET INCOME PER COMMON SHARE | ||||||||||||
Basic | $ | 0.26 | $ | — | $ | — | ||||||
Diluted | $ | 0.26 | $ | — | $ | — | ||||||
WEIGHTED AVERAGE COMMON SHARES OUTSTANDING | ||||||||||||
Basic | 22,870 | — | — | |||||||||
Diluted | 22,870 | — | — | |||||||||
The accompanying notes are an integral part of these consolidated and combined financial statements.
F - 4
BRIGHAM MINERALS, INC.
CONSOLIDATED AND COMBINED STATEMENT OF COMPREHENSIVE INCOME
Years Ended December 31, | ||||||||||||
(In thousands) | 2019 | 2018 | 2017 | |||||||||
NET INCOME | $ | 21,639 | $ | 32,815 | $ | 115,612 | ||||||
Other comprehensive income | ||||||||||||
Unrealized gains (losses) on available for sale equity securities, net | — | 141 | (3,540 | ) | ||||||||
Reclassification of (gains) losses on sale and distribution of available for sale equity securities | — | (823 | ) | 4,222 | ||||||||
Other comprehensive income | — | (682 | ) | 682 | ||||||||
COMPREHENSIVE INCOME | $ | 21,639 | $ | 32,133 | $ | 116,294 | ||||||
Comprehensive income attributable to Predecessor | $ | (5,092 | ) | $ | (30,294 | ) | $ | (116,294 | ) | |||
Comprehensive income attributable to temporary equity | $ | (9,646 | ) | $ | — | $ | — | |||||
Comprehensive income attributable to shareholders | $ | 6,901 | $ | 1,839 | $ | — | ||||||
The accompanying notes are an integral part of these consolidated and combined financial statements.
F - 5
BRIGHAM MINERALS, INC.
CONSOLIDATED AND COMBINED STATEMENT OF CHANGES IN SHAREHOLDERS' AND MEMBERS’ EQUITY
Members' Contributed Capital | Class A Common Stock | Class B Common Stock | Additional Paid-In Capital | AOCI(1) | Retained Earnings | Total Shareholders' and Members' Equity | ||||||||||||||||||||||||||||
(In thousands) | Shares | Amount | Shares | Amount | ||||||||||||||||||||||||||||||
Balance - December 31, 2016 | $ | 280,648 | — | $ | — | — | $ | — | $ | — | $ | — | $ | 19,850 | $ | 300,498 | ||||||||||||||||||
Contributions | 37,600 | — | — | — | — | — | — | — | 37,600 | |||||||||||||||||||||||||
Distributions | (152,218 | ) | — | — | — | — | — | — | — | (152,218 | ) | |||||||||||||||||||||||
Other comprehensive income | — | — | — | — | — | — | 682 | 682 | ||||||||||||||||||||||||||
Net income | — | — | — | — | — | — | — | 115,612 | 115,612 | |||||||||||||||||||||||||
Balance - December 31, 2017 | $ | 166,030 | — | $ | — | — | $ | — | $ | — | $ | 682 | $ | 135,462 | $ | 302,174 | ||||||||||||||||||
Contributions | 45,078 | — | — | — | — | — | — | — | 45,078 | |||||||||||||||||||||||||
Distributions | (3,313 | ) | — | — | — | — | — | — | — | (3,313 | ) | |||||||||||||||||||||||
Other comprehensive income | $ | — | — | $ | — | — | $ | — | $ | — | $ | (682 | ) | $ | — | $ | (682 | ) | ||||||||||||||||
Deferred tax liability arising from corporate reorganization | — | — | — | — | — | (3,057 | ) | — | — | (3,057 | ) | |||||||||||||||||||||||
Proceeds from sale of equity securities | 933 | — | — | — | — | — | — | — | 933 | |||||||||||||||||||||||||
Net income attributable to shareholders | — | — | — | — | — | — | — | 1,839 | 1,839 | |||||||||||||||||||||||||
Net income attributable to predecessor | — | — | — | — | — | — | — | 30,976 | 30,976 | |||||||||||||||||||||||||
Balance - December 31, 2018 | $ | 208,728 | — | $ | — | — | $ | — | $ | (3,057 | ) | $ | — | $ | 168,277 | $ | 373,948 | |||||||||||||||||
Net income attributable to shareholders | — | — | — | — | — | — | — | 848 | 848 | |||||||||||||||||||||||||
Net income attributable to Predecessor | — | — | — | — | — | — | — | 5,092 | 5,092 | |||||||||||||||||||||||||
Balance prior to corp reorganization and IPO | $ | 208,728 | — | $ | — | — | $ | — | $ | (3,057 | ) | $ | — | $ | 174,217 | $ | 379,888 | |||||||||||||||||
Conversion of PE Units for Class A Common Stock and Class B Common Stock | (208,728 | ) | 5,322 | 53 | 28,778 | — | 380,205 | — | (171,530 | ) | — | |||||||||||||||||||||||
Issuance of common stock in IPO, net of offering cost | — | 16,675 | 167 | — | — | 273,281 | — | — | 273,448 | |||||||||||||||||||||||||
Deferred tax asset arising from the IPO | — | — | — | — | — | 13,664 | — | — | 13,664 | |||||||||||||||||||||||||
Reclassification of noncontrolling interests to temporary equity | — | — | — | — | — | (518,000 | ) | — | — | (518,000 | ) | |||||||||||||||||||||||
Share-based compensation expense | — | 124 | 1 | — | — | 12,632 | — | — | 12,633 | |||||||||||||||||||||||||
Dividends paid | — | — | — | — | — | — | — | (14,663 | ) | (14,663 | ) | |||||||||||||||||||||||
Dividend equivalent rights | — | — | — | — | — | — | — | (676 | ) | (676 | ) | |||||||||||||||||||||||
Net income attributable to shareholders | — | — | — | — | — | — | — | 6,053 | 6,053 | |||||||||||||||||||||||||
Adjustment of temporary equity to redemption amount | — | — | — | — | — | (51,572 | ) | — | — | (51,572 | ) | |||||||||||||||||||||||
Issuance of common stock in the December 2019 Offering, net of offering costs | — | 6,000 | 60 | — | — | 102,620 | — | — | 102,680 | |||||||||||||||||||||||||
Deferred tax asset arising from issuance of common stock in the December 2019 Offering | — | — | — | — | — | 9,508 | — | — | 9,508 | |||||||||||||||||||||||||
Conversion of Class B shares to Class A shares | — | 5,931 | 59 | (5,931 | ) | — | 104,331 | — | — | 104,390 | ||||||||||||||||||||||||
Restricted stock forfeited | — | (11 | ) | — | — | — | (34 | ) | — | — | (34 | ) | ||||||||||||||||||||||
Balance - December 31, 2019 | $ | — | 34,041 | $ | 340 | 22,847 | $ | — | $ | 323,578 | $ | — | $ | (6,599 | ) | $ | 317,319 | |||||||||||||||||
(1) - AOCI - Accumulated other comprehensive income
The accompanying notes are an integral part of these consolidated and combined financial statements.
F - 6
BRIGHAM MINERALS, INC.
CONSOLIDATED AND COMBINED STATEMENT OF CASH FLOWS
Years Ended December 31, | ||||||||||||
(In thousands) | 2019 | 2018 | 2017 | |||||||||
CASH FLOWS FROM OPERATING ACTIVITIES | ||||||||||||
Net income | $ | 21,639 | $ | 32,815 | $ | 115,612 | ||||||
Adjustments to reconcile net earnings to net cash provided by operating activities: | ||||||||||||
Depreciation and amortization | 30,940 | 13,915 | 6,955 | |||||||||
Share-based compensation expense | 10,049 | — | — | |||||||||
Loss on extinguishment of debt | 6,892 | — | — | |||||||||
Amortization of debt issue costs | 433 | 690 | 121 | |||||||||
Deferred income taxes | 665 | 237 | 295 | |||||||||
Loss (gain) on derivative instruments, net | 568 | (424 | ) | 121 | ||||||||
Net cash received (paid) for derivative settlements | 470 | (754 | ) | — | ||||||||
(Gain) loss on sale and distribution of equity securities | — | (823 | ) | 4,222 | ||||||||
Bad debt expense | 669 | 382 | — | |||||||||
(Gain) on sale of oil and gas properties | — | — | (94,551 | ) | ||||||||
Changes in operating assets and liabilities: | ||||||||||||
(Increase)/Decrease in accounts receivable | (10,246 | ) | (8,022 | ) | (6,787 | ) | ||||||
(Increase)/Decrease in other current assets | 1,787 | (6,116 | ) | (44 | ) | |||||||
Increase/(Decrease) in accounts payable and accrued liabilities | 5,112 | (484 | ) | 3,956 | ||||||||
Increase/(Decrease) in other long-term liabilities | 47 | 28 | — | |||||||||
Other operating | — | — | (499 | ) | ||||||||
Net cash provided by (used in) operating activities | $ | 69,025 | $ | 31,444 | $ | 29,401 | ||||||
CASH FLOWS FROM INVESTING ACTIVITIES | ||||||||||||
Additions to oil and gas properties | (219,481 | ) | (195,603 | ) | (101,437 | ) | ||||||
Additions to other fixed assets | (474 | ) | (723 | ) | (1,311 | ) | ||||||
Proceeds from sale of oil and gas properties, net | 3,123 | 125 | 111,024 | |||||||||
Proceeds from sale of equity securities | — | 933 | 17,896 | |||||||||
Net cash provided by (used in) investing activities | $ | (216,832 | ) | $ | (195,268 | ) | $ | 26,172 | ||||
CASH FLOWS FROM FINANCING ACTIVITIES | ||||||||||||
Payments of short-term related party loan | — | (7,000 | ) | — | ||||||||
Borrowing of short-term related party loan | — | 7,000 | — | |||||||||
Payments of short-term debt | (4,596 | ) | — | — | ||||||||
Payments of long-term debt | (275,404 | ) | (70,000 | ) | (15,000 | ) | ||||||
Borrowing of long-term debt | 105,000 | 218,000 | 27,000 | |||||||||
Payment of debt extinguishment fees | (2,091 | ) | — | — | ||||||||
Proceeds from issuance of Class A common stock sold in initial public offering, net of offering costs | 277,075 | — | — | |||||||||
Proceeds from issuance of Class A common stock, net of offering costs | 102,680 | — | — | |||||||||
Capital contributions | — | 46,011 | 37,000 | |||||||||
Capital distributions | (441 | ) | — | (131,544 | ) | |||||||
Dividends paid | (14,663 | ) | — | — | ||||||||
Distributions to holders of temporary equity | (19,731 | ) | — | — | ||||||||
Loan closing costs | (1,348 | ) | (4,614 | ) | (103 | ) | ||||||
Net cash provided by (used in) financing activities | $ | 166,481 | $ | 189,397 | $ | (82,647 | ) | |||||
Increase/Decrease in cash, cash equivalents and restricted cash | 18,674 | 25,573 | (27,074 | ) | ||||||||
Cash, cash equivalents and restricted cash, beginning of period | 32,459 | 6,886 | 33,960 | |||||||||
Cash, cash equivalents and restricted cash end of period | $ | 51,133 | $ | 32,459 | $ | 6,886 | ||||||
The accompanying notes are an integral part of these consolidated and combined financial statements.
F - 7
BRIGHAM MINERALS, INC.
CONSOLIDATED STATEMENT OF CASH FLOWS
(CONTINUED)
Years Ended December 31, | ||||||||||||
(In thousands) | 2019 | 2018 | 2017 | |||||||||
Supplemental disclosure of non-cash activity: | ||||||||||||
Equity securities received | $ | — | $ | — | $ | 45,633 | ||||||
Equity securities distributed | — | 3,313 | (20,092 | ) | ||||||||
Accrued capital expenditures | 63 | 1,426 | 73 | |||||||||
Vesting of A-M units | — | — | 600 | |||||||||
Capitalized share-based compensation cost | 3,818 | — | — | |||||||||
Temporary equity cumulative adjustment to fair value | 51,572 | — | — | |||||||||
Supplemental cash flow information: | ||||||||||||
Cash paid for interest | $ | 6,192 | $ | 6,123 | $ | 458 | ||||||
Cash paid for taxes | 832 | 604 | 2 | |||||||||
The accompanying notes are an integral part of these consolidated and combined financial statements.
F - 8
1. Business and Basis of Presentation
Description of the Business
Brigham Minerals, Inc. (together with its wholly owned subsidiaries, “Brigham Minerals” or the “Company”) is a Delaware corporation formed in June 2018 to become a holding company. Brigham Minerals acquired an indirect interest in Brigham Resources, LLC (“Brigham Resources”), our predecessor, on July 16, 2018 in a series of restructuring transactions pursuant to which certain entities affiliated with Warburg Pincus LLC (“Warburg Pincus”) contributed all of their respective interests in the entities through which they held interests in Brigham Resources to Brigham Minerals in exchange for all of the outstanding shares of common stock of Brigham Minerals (the “July 2018 restructuring”). As a result of such restructuring transactions, Brigham Minerals became wholly owned by an entity affiliated with Warburg Pincus, and Brigham Minerals indirectly owned a 16.5% membership interest in Brigham Resources. The remaining outstanding membership interests of Brigham Resources remained with certain other entities affiliated with Warburg Pincus, Yorktown Partners LLC and Pine Brook Road Advisors, LP, Brigham Minerals’ management and its other investors (collectively, the “Original Owners”).
On November 20, 2018, Brigham Resources underwent a second series of restructuring transactions (the “November 2018 restructuring”). In the November 2018 restructuring, Brigham Resources became a wholly owned subsidiary of Brigham Minerals Holdings, LLC (“Brigham LLC”), which was a wholly owned subsidiary of Brigham Equity Holdings, LLC (“Brigham Equity Holdings”), and Brigham Equity Holdings became wholly owned by the owners of Brigham Resources immediately prior to such restructuring, directly or indirectly, through Brigham Minerals. As a result of the foregoing transactions, there was no change in the control or economic interests of the Original Owners and Brigham Minerals in Brigham Resources, although their ownership became indirect through Brigham Equity Holdings and its wholly owned subsidiary, Brigham LLC. The July 2018 restructuring and the November 2018 restructuring are collectively referred to herein as, the “2018 corporate reorganizations.”
Brigham Resources wholly owns Brigham Minerals, LLC and Rearden Minerals, LLC (collectively, the “Minerals Subsidiaries”), which acquire and actively manage a portfolio of mineral and royalty interests. The Minerals Subsidiaries are Brigham Resources’ sole material assets.
Initial Public Offering
In April 2019, Brigham Minerals completed an initial public offering of 16,675,000 shares of Class A common stock at a price to the public of $18.00 per share (the “IPO”). This resulted in net proceeds of approximately $273.4 million, after deducting underwriting commissions and discounts and offering expenses. As a result of the IPO and the corporate restructuring described below, Brigham Minerals became a holding company whose sole material asset consisted of a 43.3% interest in Brigham LLC, which wholly owns Brigham Resources. Brigham Resources continues to wholly own the Minerals Subsidiaries, which own all of Brigham Resources' operating assets. In connection with the IPO, Brigham Minerals became the sole managing member of Brigham LLC and is responsible for all operational, management and administrative decisions relating to Brigham LLC’s business and consolidates the financial results of Brigham LLC and its wholly-owned subsidiary, Brigham Resources.
In connection with the IPO,
• | all of the outstanding membership interests in Brigham LLC were converted into a single class of common units in Brigham LLC (the “Brigham LLC Units”); |
• | Brigham Minerals issued shares of Class A common stock to certain of our Original Owners in exchange for incentive units in Brigham Equity Holdings; |
• | Brigham Equity Holdings distributed all of its equity interests in Brigham LLC, other than its interests in Brigham LLC attributable to certain unvested incentive units in Brigham Equity Holdings, to the Original Owners and Brigham Minerals (which resulted in the ownership in Brigham LLC of our Original Owners with respect to unvested incentive units remaining consolidated in Brigham Equity Holdings); |
• | Brigham Minerals issued 16,675,000 shares of Class A common stock, including the Underwriters' overallotment, to purchasers in the IPO in exchange for the cash proceeds of the IPO; |
F - 9
• | each holder of Brigham LLC Units following the restructuring (a “Brigham Unit Holder”), other than Brigham Minerals and its subsidiaries, received a number of shares of Class B common stock equal to the number of Brigham LLC Units held by such Brigham Unit Holder following the IPO; and |
• | Brigham Minerals contributed, directly or indirectly, the net proceeds of the IPO to Brigham LLC in exchange for an additional number of Brigham LLC Units such that Brigham Minerals holds, directly or indirectly, a total number of Brigham LLC Units equal to the number of shares of Class A common stock outstanding following the IPO. |
After the transactions discussed above and after the IPO,
• | the Original Owners own all of Brigham Minerals' Class B common stock, representing 56.7% of Brigham Minerals' capital stock; |
• | the Original Owners own 5,322,197, or 24.2%, of Brigham Minerals' Class A common stock, representing 10.5% of Brigham Minerals' capital stock; |
• | investors in the IPO own 16,675,000 shares, or 75.8%, of Brigham Minerals' Class A common stock, representing 32.8% of Brigham Minerals' capital stock; |
• | Brigham Minerals owns an approximate 43.3% interest in Brigham LLC; and |
• | the Original Owners own directly an approximate 56.7% interest in Brigham LLC (in addition to the 10.5% interest in Brigham LLC the Original Owners own indirectly through their ownership of shares of Brigham Minerals' Class A common stock). |
Following the IPO, and prior to December 31, 2019, Brigham Resources:
• | fully repaid the $200.0 million outstanding balance under the Owl Rock credit facility (as defined below) on May 7, 2019; |
• | wrote-off $4.0 million of capitalized debt issuance cost and incurred $2.1 million in prepayment fees and $0.8 million in accrued legal fees resulting in a loss on extinguishment of debt of approximately $6.9 million in its statement of operations; |
• | applied capitalized issuance cost of $8.7 million as a reduction of additional paid-in-capital of which $3.6 million was incurred in 2018 and $5.1 million was incurred in 2019; |
• | recognized a cumulative effect adjustment of $2.0 million of share-based compensation cost related to the Incentive Units (as defined below), pertaining to the period from the grant date through the IPO; |
• | recognized an additional charge for share-based compensation cost of approximately $11.9 million related to the estimated fair value of the restricted stock awards (“RSAs”), restricted stock units subject to time-based vesting (“RSUs”) and restricted stock units subject to performance based vesting (“PSUs”), net of $3.8 million of capitalized share-based compensation expense, all of which was non-cash. In addition, as the vesting conditions of the Incentive Units, RSAs, RSUs and PSUs are satisfied, Brigham Minerals will recognize additional non-cash charges for share-based compensation cost of approximately $19.3 million, a portion of which will be capitalized; |
• | entered into a credit agreement on May 16, 2019 with a banking syndicate, including Wells Fargo Bank, N.A., as administrative agent for a new revolving credit facility (as defined below) with a borrowing base of $135.0 million and subsequently increased to $150.0 million as of December 31, 2019; and |
• | received a full refund of the cash collateral related to the existing WTI fixed price swap contracts, which was $1.6 million as of May 2019, upon entering into the new revolving credit facility. |
December 2019 Offering
On December 16, 2019, Brigham Minerals completed an offering of 12,650,000 shares of its Class A common stock (the "December 2019 Offering"), including 6,000,000 shares issued and sold by Brigham Minerals and an aggregate of 6,650,000 shares sold by certain shareholders of the Company (the "Selling Shareholders"), of which 5,496,813 represents shares issued upon redemption of an equivalent number of their Brigham LLC units, at a price to the public of $18.10 per share ($17.376 per share net of underwriting discounts and commissions). After deducting underwriting discounts, commissions and offering expenses, Brigham Minerals received net proceeds of approximately $102.7 million which were used to repay $80.0 million of existing indebtedness under our revolving credit agreement and will be used to fund future mineral and royalty acquisitions. Brigham Minerals did not receive any proceeds from the sale of shares of Class A common stock by the Selling Shareholders.
Following the completion of the December 2019 Offering and certain redemptions of Class B shares and an equivalent number of Brigham LLC units to Class A shares completed during November and December 2019, Brigham Minerals owned a
F - 10
59.8% interest in Brigham LLC and the Sponsors collectively owned 39.1% of the outstanding voting stock of Brigham Minerals as of December 31, 2019.
Basis of Presentation
Subsequent to the July 2018 restructuring and prior to the IPO, Brigham Minerals used the equity method of accounting for its investment in Brigham Resources, its predecessor, because its 16.5% ownership in Brigham Resources provided Brigham Minerals with significant influence, but not with a controlling financial interest or the ability to direct the most significant activities of Brigham Resources. Upon the completion of the IPO, Brigham Minerals indirectly owned an approximate 43.3% interest of Brigham Resources and 100% of the voting rights and consolidates the results of operations of Brigham Resources. In order to furnish comparative financial information, the accompanying consolidated and combined financial statements and related notes of Brigham Minerals for periods prior to the IPO have been retrospectively recast to include the combined historical financial information of both Brigham Resources (at historical carrying values) and Brigham Minerals, taking into account state and federal income taxes and liabilities associated with Brigham Minerals. All intercompany transactions between Brigham Minerals and Brigham Resources have been eliminated. Because Brigham Minerals acquired an interest in Brigham Resources as part of certain reorganization transactions in 2018, net income is attributable to stockholders of Brigham Minerals in addition to our Predecessor beginning in 2018.
The accompanying consolidated and combined financial statements of Brigham Minerals have been prepared in accordance with accounting principles generally accepted in the United States of America (“GAAP”). The consolidated and combined financial statements reflect all normal recurring adjustments that, in the opinion of management, are necessary for a fair representation. Brigham Minerals operates in one segment: oil and natural gas exploration and production.
Brigham Resources has historically owned and operated two distinct lines of business through its subsidiaries:
• | the Minerals Business through the Minerals Subsidiaries; and |
• | an upstream oil and gas exploration and production business (the “Upstream Business”) in the Southern Delaware Basin of West Texas (including interests in certain related gathering systems) through Brigham Resources Operating, LLC (“Brigham Operating”). |
In February 2017, Brigham Operating completed the sale of substantially all of its oil and natural gas properties to an unrelated third-party purchaser, following which Brigham Operating’s only material assets consisted of an ownership interest in Oryx Southern Delaware Holdings, LLC (“Oryx”), an entity that operates a crude oil gathering system located in the southern Delaware Basin. Immediately prior to the IPO, Brigham Resources distributed to its members or their affiliates 100% of the equity interests in Brigham Operating. Subsequent to such distribution Brigham Resources no longer had any direct or indirect ownership interest in Brigham Operating. Accordingly, the accompanying consolidated financial statements of Brigham Minerals exclude the assets, liabilities and results of operations of Brigham Operating.
Subsequent to the issuance of our December 31, 2017 consolidated financial statements, we corrected the amount of equity securities distributed, included in the supplemental disclosure of non-cash activity, from $37,988 to $20,092 (in thousands) for the year ended December 31, 2017. Additionally, we corrected the presentation of gains and losses on sales of assets, and we included these gains and losses in other operating income for all periods presented. This resulted in a $94.6 million increase to previously reported operating expenses and a corresponding increase to previously reported operating income for the year ended December 31, 2017. These corrections did not impact the previously reported consolidated balance sheet as of December 31, 2017 or statements of comprehensive income, members’ equity or cash flows and have been accounted for as immaterial corrections of errors.
2. Significant Accounting Policies
Emerging Growth Company Status
As a company with less than $1.07 billion in revenues during its last fiscal year, Brigham Minerals qualifies as an “emerging growth company” as defined in the Jumpstart Our Business Startups Act of 2012 (the “JOBS Act”). An emerging growth company may take advantage of specified reduced reporting and other regulatory requirements.
Brigham Minerals will remain an “emerging growth company” until as late as the last day of Brigham Minerals’ 2023 fiscal year, or until the earliest of (i) the last day of the fiscal year in which Brigham Minerals has $1.07 billion or more in
F - 11
annual revenues; (ii) the date on which Brigham Minerals becomes a “large accelerated filer” (the fiscal year-end on which the total market value of Brigham Minerals’ common equity securities held by non-affiliates is $700 million or more as of June 30); (iii) the date on which Brigham Minerals issues more than $1.0 billion of non-convertible debt over a three-year period.
As a result of Brigham Minerals’ election to avail itself of certain provisions of the JOBS Act, the information that Brigham Minerals provides may be different than the information provided by other public companies.
Use of Estimates
The preparation of consolidated and combined financial statements in conformity with GAAP requires management to make estimates and assumptions that affect the reported amounts of assets, liabilities, revenues and expenses and the disclosure of contingent assets and liabilities in the consolidated and combined financial statements and accompanying notes. Although management believes these estimates are reasonable, actual results could differ from these estimates. Changes in estimates are recorded prospectively.
The accompanying consolidated and combined financial statements are based on a number of significant estimates including quantities of oil, natural gas and NGLs reserves that are the basis for the calculations of depreciation, depletion, amortization (“DD&A”) and impairment of oil and natural gas properties. Reservoir engineering is a subjective process of estimating underground accumulations of oil and natural gas and there are numerous uncertainties inherent in estimating quantities of proved oil and natural gas reserves. The accuracy of any reserve estimate is a function of the quality of available data and of engineering and geological interpretation and judgment. As a result, reserve estimates may differ from the quantities of oil and natural gas that are ultimately recovered. Brigham Minerals’ reserve estimates are audited by Cawley, Gillespie & Associates, Inc. (“CG&A”), an independent petroleum engineering firm. Other items subject to significant estimates and assumptions include the carrying amount of oil and natural gas properties, valuation of derivative instruments, share-based compensation and revenue accruals.
Cash and Cash Equivalents
Brigham Minerals considers all highly liquid investments with an original maturity of three months or less to be cash equivalents.
Restricted Cash
Restricted cash includes cash that is contractually restricted for its use through an agreement with a non-related party.
In 2019, the Company adopted ASU 2016-18, Statement of Cash Flows, which amends ASC 230 to add or clarify guidance on the classification and presentation of restricted cash in the statement of cash flows. The ASU requires entities to show the changes in the total of cash, cash equivalents, restricted cash and restricted cash equivalents in the statement of cash flows. As a result, entities will no longer present transfers between cash and cash equivalents and restricted cash and restricted cash equivalents in the statement of cash flows.
The adoption resulted in an increase in reported investing cash flow of $0.5 million for the year ended December 31, 2018 with a corresponding increase to the reported end of period cash balances. The December 31, 2018 accompanying statement of cash flow that was adjusted as a result of adoption of ASU 2016-18 is summarized below:
Years Ended December 31, | ||||||||
2018 | 2018 | |||||||
(In thousands) | As reported | As adjusted | ||||||
Changes in restricted cash held in escrow for acquisitions | $ | (474 | ) | $ | — | |||
Net cash provided by (used in) investing activities | (195,742 | ) | (195,268 | ) | ||||
Increase in cash, cash equivalents and restricted cash | $ | 25,099 | $ | 25,573 | ||||
Cash, cash equivalents and restricted cash, beginning of period | 6,886 | 6,886 | ||||||
Cash, cash equivalents and restricted cash end of period | 31,985 | 32,459 | ||||||
F - 12
Accounts Receivables
Receivables consist of royalty income due from operators for oil and gas sales to purchasers. Those purchasers remit payment for production to the operator of our properties and the operator, in turn, remits payment to us. Receivables from third parties for which we did not receive actual information, either due to timing delays or due to the unavailability of data at the time when revenues are recognized, are estimated. Volume estimates for wells with available historical actual data are based upon (i) the historical actual data for the months the data is available, or (ii) engineering estimates for the months the historical actual data is not available. We do not recognize revenues for wells with no historical actual data because we cannot conclude that it is probable that a significant revenue reversal will not occur in future periods. Pricing estimates are based upon actual prices realized in an area by adjusting the market price for the average basis differential from market on a basin-by-basin basis.
Brigham Minerals routinely reviews outstanding balances, assesses the financial strength of its customers and records a reserve for amounts not expected to be fully recovered. We recorded an allowance for doubtful accounts of $0.6 million and $0.4 million for the year ended December 31, 2019 and December 31, 2018, which was included in general and administrative expenses.
At December 31, 2019 and 2018, accounts receivable was comprised of the following:
December 31, | ||||||||
(In thousands) | 2019 | 2018 | ||||||
Oil and gas sales | $ | 27,888 | $ | 19,769 | ||||
Allowance for doubtful accounts | (556 | ) | (382 | ) | ||||
Other | 2,959 | 1,308 | ||||||
Total accounts receivables | $ | 30,291 | $ | 20,695 | ||||
Concentration of Credit Risk and Significant Customers
Financial instruments that potentially subject Brigham Minerals to concentrations of credit risk consist of cash, accounts receivable, commodity derivative financial instruments and its prior revolving credit facility. Cash and cash equivalents are held in a few financial institutions in amounts that may, at times, exceed federally insured limits. However, no losses have been incurred and management believes that counterparty risks are minimal based on the reputation and history of the institutions selected. Accounts receivable are concentrated among operators and purchasers engaged in the energy industry within the United States. Management periodically assesses the financial condition of these entities and institutions and considers any possible credit risk to be minimal. Concentrations of oil and gas sales to significant customers (operators) are presented in the table below.
For the year ended December 31, | |||||||||
2019 | 2018 | 2017 | |||||||
Occidental Petroleum Corp. | 16 | % | 15 | % | — | ||||
Continental Resources, Inc. | 12 | % | 10 | % | 10 | % | |||
XTO Energy, Inc. | 10 | % | — | — | |||||
Noble Energy, Inc. | 5 | % | 9 | % | 13 | % | |||
Management does not believe that the loss of any customer would have a long-term material adverse effect on our financial position or the results of operations.
Investments in Equity Securities
In January 2019, the Company adopted ASU 2016-01, Financial Instruments-Overall: Recognition and Measurement of Financial Assets and Financial Liabilities. The ASU changes to the current GAAP model primarily affects the accounting for equity investments, financial liabilities under the fair value option and the presentation and disclosure requirements for financial instruments. Under the new standard, all equity investments in unconsolidated entities (other than those accounted for using the equity method of accounting) will generally be measured at fair value through earnings. There will no longer be an available-for-sale classification (changes in fair value reported in other comprehensive income) for equity securities with readily determinable fair values.
Prior to January 2019, Brigham Minerals classified its equity securities as available-for-sale, and as such, they were carried at fair value. Changes in fair value of available-for-sale securities were reported as a component of other comprehensive income. Losses were recognized within the consolidated and combined statement of operations when a decline in value is
F - 13
determined to be other-than-temporary. Brigham Minerals used the average cost method to determine the realized gain or loss for each sale or distribution of available-for-sale securities.
Financial Instruments
Brigham Minerals’ financial instruments consist of cash and cash equivalents, receivables, payables, derivative assets and liabilities, investments in equity securities and long-term debt. The carrying amounts of cash and cash equivalents, receivables and payables approximate fair value due to the highly liquid or short-term nature of these instruments. The equity securities are publicly traded and are valued using quoted market prices.
The fair values of Brigham Minerals’ derivative assets and liabilities are based on a third-party industry-standard pricing model using contract terms and prices and assumptions and inputs that are substantially observable in active markets throughout the full term of the instruments, including forward oil and gas price curves, discount rates, volatility factors and credit risk adjustments.
The carrying amount of long-term debt associated with borrowings outstanding under Brigham Minerals’ revolving credit facility approximates fair value as borrowings bear interest at variable market rates. See “Note 5.—Derivative Instruments,” “Note 6.—Fair Value Measurements” and “Note 7.—Long-Term Debt.”
Derivative Instruments
In the normal course of business, Brigham Minerals is exposed to certain risks, including changes in the prices of oil, natural gas and NGLs and interest rates. Brigham Minerals has occasionally entered into derivative contracts to manage its exposure to these risks. Brigham Minerals’ risk management activity is generally accomplished through over-the-counter derivative contracts with large financial institutions. Brigham Minerals does not enter into derivative instruments for speculative purposes. Derivative instruments are recognized at fair value. If a right of offset exists under master netting arrangements and certain other criteria are met, derivative assets and liabilities with the same counterparty are netted on the consolidated and combined balance sheets. Brigham Minerals does not specifically designate derivative instruments as cash flow hedges, even though they reduce its exposure to changes in oil and natural gas prices; therefore, gains and losses arising from changes in the fair value of derivatives are recognized on a net basis in the accompanying consolidated and combined statements of operations within (loss) gain on derivative instruments, net.
Oil and Gas Properties
Brigham Minerals uses the full cost method of accounting for its oil and natural gas properties. Under this method, all acquisition costs incurred for the purpose of acquiring mineral and royalty interests and certain related employee costs are capitalized into a full cost pool. Costs associated with general corporate activities are expensed in the period incurred.
Capitalized costs are amortized using the units-of-production method. Under this method, the provision for depletion is calculated by multiplying total production for the period by a depletion rate. The depletion rate is determined by dividing the total unamortized cost base by net equivalent proved reserves at the beginning of the period.
Costs associated with unevaluated properties are excluded from the amortizable cost base until a determination has been made as to the existence of proved reserves. Unevaluated properties are reviewed periodically to determine whether the costs incurred should be reclassified to the full cost pool and subjected to amortization. The costs associated with unevaluated properties primarily consist of acquisition costs and capitalized general and administrative costs. Unevaluated properties are assessed for impairment on an individual basis or as a group if properties are individually insignificant. The assessment includes consideration of the following factors, among others: expectation of future drilling activity; past drilling results and activity; geological and geophysical evaluations; the assignment of proved reserves; and the economic viability of development if proved reserves are assigned. During any period in which these factors indicate an impairment, the cumulative acquisition costs incurred to date for such property are transferred to the full cost pool and are then subject to amortization. There was no impairment recorded for unevaluated properties in 2019, 2018 and 2017.
Sales and abandonments of oil and natural gas properties being amortized are accounted for as adjustments to the full cost pool, with no gain or loss recognized unless the adjustments would significantly alter the relationship between capitalized costs and proved reserves. A significant alteration would not ordinarily be expected to occur upon the sale of reserves involving less than 25% of the reserve quantities of a cost center.
Natural gas volumes are converted to barrels of oil equivalent (Boe) at the rate of six thousand cubic feet (Mcf) of natural gas to one barrel (Bbl) of oil. This convention is not an equivalent price basis and there may be a large difference in value between an equivalent volume of oil versus an equivalent volume of natural gas.
F - 14
Under the full cost method of accounting, total capitalized costs of oil and natural gas properties, net of accumulated depletion, may not exceed an amount equal to the present value of future net revenues from proved reserves, discounted at 10% per annum, plus the lower of cost or fair value of unevaluated properties (the ceiling limitation). A ceiling limitation is calculated at each reporting period. If total capitalized costs, net of accumulated DD&A are greater than the ceiling limitation, a write-down or impairment of the full cost pool is required. A write-down of the carrying value of the full cost pool is a noncash charge that reduces earnings and impacts equity in the period of occurrence and typically results in lower depletion expense in future periods. Once incurred, a write-down cannot be reversed at a later date. The ceiling limitation calculation is prepared using the 12-month first day of the month oil and natural gas average prices, as adjusted for basis or location differentials, held constant over the life of the reserves (net wellhead prices). If applicable, these net wellhead prices would be further adjusted to include the effects of any fixed price arrangements for the sale of oil and natural gas.
As of December 31, 2019, 2018 and 2017, the full cost ceiling value of our reserves was calculated based on the unweighted arithmetic average first-day-of-the-month price for the twelve months ended December 31, 2019, 2018 and 2017 of $55.65, $65.66, and $51.34, respectively, per barrel for oil, adjusted by area for energy content, transportation fees and regional price differentials, and the unweighted arithmetic average first-day-of-the-month price for the twelve months ended December 31, 2019, 2018 and 2017 of $2.60, $3.12, and $2.99, respectively, per MMBtu for natural gas, adjusted by area for energy content, transportation fees and regional price differentials. Using these prices, the net book value of oil and natural gas was below the ceiling limitation and no write-off was necessary.
Share-Based Compensation
Brigham Minerals accounts for its share-based compensation including grants of the Incentive Units, restricted stock awards, time-based restricted stock units and performance-based stock units in the consolidated and combined statements of operations based on their estimated fair values at grant date. Brigham Minerals uses a Monte Carlo simulation to determine the fair value of performance-based stock units. Brigham Minerals recognizes expense on a straight-line basis over the vesting period of the respective grant, which is generally the requisite service period. Brigham Minerals capitalizes a portion of the share-based compensation cost to oil and gas properties on the consolidated and combined balance sheets. Share-based compensation expense is included in general and administrative expenses in Brigham Minerals’ consolidated and combined statements of operations included within this Annual Report. There was approximately $19.3 million of unamortized compensation expense relating to outstanding awards at December 31, 2019, a portion of which will be capitalized. The unrecognized share-based compensation expense will be recognized on a straight-line basis over the remaining vesting periods of the awards. Brigham Minerals accounts for forfeitures as they occur.
Earnings Per Share
Brigham Minerals uses the “if-converted” method to determine the potential dilutive effect of its Class B common stock and the treasury stock method to determine the potential dilutive effect of outstanding Incentive Units, RSAs, RSUs, and PSUs.
Employee Benefit Plan
We sponsor a 401(k) tax-deferred savings plan for our employees. We match 100% of each employee’s contributions, up to 6% of the employee’s total compensation. Brigham Resources may also contribute additional amounts at its discretion. Brigham Resources contributed $0.3 million, $0.2 million and $0.1 million, to the 401(k) plan for each of the years ended December 31, 2019, 2018, and 2017.
Income Taxes
Brigham Minerals accounts for income taxes using the asset and liability method. Deferred tax assets and liabilities are recognized for the future tax consequences attributable to differences between the financial statement carrying amounts of existing assets and liabilities and their respective tax bases. Deferred tax assets and liabilities are calculated by applying existing tax laws and the rates expected to apply to taxable income in the years in which those temporary differences are expected to be recovered or settled. The effect of a change in tax rates on deferred tax assets and liabilities is recognized in income in the period that includes the enactment date.
Brigham Minerals periodically assesses whether it is more likely than not that it will generate sufficient taxable income to realize its deferred income tax assets, including net operating losses. In making this determination, Brigham Minerals considers all available positive and negative evidence and makes certain assumptions. Brigham Minerals considers, among other things,
F - 15
its deferred tax liabilities, the overall business environment, its historical earnings and losses, current industry trends and its outlook for future years.
Temporary Equity
Brigham Minerals accounts for the Original Owners’ 40.2% interest in Brigham LLC as temporary equity as a result of certain redemption rights held by the Original Owners as discussed in “Note 9.—Temporary Equity.” As such, the Company adjusts temporary equity to its maximum redemption amount at the balance sheet date, if higher than the carrying amount. The redemption amount is based on the 10-day volume-weighted average closing price (“VWAP”) of Class A shares at the end of the reporting period. Changes in the redemption value are recognized immediately as they occur, as if the end of the reporting period was also the redemption date for the instrument, with an offsetting entry to additional paid-in capital.
Revenue from Contracts with Customers
On December 31, 2019, the Company adopted Accounting Standards Codification Topic 606, Revenue from Contracts with Customers, ("ASC 606") using the modified retrospective approach, which only applied to contracts that were in effect as of the date of adoption. The adoption did not require an adjustment to opening retained earnings for the cumulative effect adjustment and did not impact the Company’s previously reported results of operations, nor its ongoing consolidated and combined balance sheets, statements of cash flow or statements of changes in shareholders' and members' equity. Overall, there were no material changes in the timing of the satisfaction of the Company’s performance obligations or the allocation of the transaction price to its performance obligations in applying the guidance in ASC 606 as compared to legacy U.S. GAAP.
Oil and natural gas sales
Oil, natural gas and NGLs sales revenues are generally recognized when control of the product is transferred to the customer, the performance obligations under the terms of the contracts with customers are satisfied and collectability is reasonably assured. All of the Company’s oil, natural gas and NGL sales are made under contracts with customers (operators). The performance obligations for the Company’s contracts with customers are satisfied at a point in time through the delivery of oil and natural gas to its customers. Accordingly, the Company’s contracts do not give rise to contract assets or liabilities. The Company typically receives payment for oil, natural gas and NGL sales within 60 days of the month of delivery, which can extend up to 9 months after initial production from the well. The Company’s contracts for oil, natural gas and NGL sales are standard industry contracts that include variable consideration based on the monthly index price and adjustments that may include counterparty-specific provisions related to volumes, price differentials, discounts and other adjustments and deductions. As each unit of product represents a separate performance obligation and the consideration is variable as it relates to oil and natural gas prices, Brigham Minerals recognizes revenue from oil and natural gas sales using the allocation exception for variable consideration in ASC 606.
Lease bonus and other income
Brigham Minerals also earns revenue from lease bonuses, delay rentals, and right-of-way payments. We generate lease bonus revenue by leasing our mineral interests to exploration and production companies. A lease agreement represents our contract with a customer and generally transfers the rights to any oil or natural gas discovered, grants us a right to a specified royalty interest, and requires that drilling and completion operations commence within a specified time period. The Company recognizes lease bonus revenues when the lease agreement has been executed, payment has been received, and the Company has no further obligation to refund the payment. At the time Brigham Minerals executes the lease agreement, Brigham Minerals expects to receive the lease bonus payment within a reasonable time, though in no case more than one year, such that Brigham Minerals has not adjusted the expected amount of consideration for the effects of any significant financing component per the practical expedient in ASC 606. Brigham Minerals also recognizes revenue from delay rentals to the extent drilling has not started within the specified period, payment has been received, and we have no further obligation to refund the payment. Right-of-way payments are recorded by the Company when the agreement has been executed, payment is determined to be collectable, and the Company has no further obligation to refund the payment.
Allocation of transaction price to remaining performance obligations
Oil and natural gas sales
Brigham Minerals’ right to royalty income does not originate until production occurs and, therefore, is not considered to exist beyond each day’s production. Therefore, there are no remaining performance obligation under any of our royalty income contracts.
Lease bonus and other income
F - 16
Given that Brigham Minerals does not recognize lease bonus or other income until a lease agreement has been executed, at which point its performance obligation has been satisfied, and payment is received, Brigham Minerals does not record revenue for unsatisfied or partially unsatisfied performance obligations as of the end of the reporting period.
Prior-period performance obligations
Brigham Minerals records revenue in the month production is delivered to the purchaser. As a non-operator, Brigham Minerals has limited visibility into the timing of when new wells start producing and production statements may not be received for 30 to 90 days or more after the date production is delivered. As a result, Brigham Minerals is required to estimate the amount of production delivered to the purchaser and the price that will be received for the sale of the product. The expected sales volumes and prices for these properties are estimated and recorded within the Accounts receivable line item in the accompanying consolidated and combined balance sheets. The difference between the Company’s estimates and the actual amounts received for oil and natural gas sales is recorded in the month that payment is received from the third party. For the years ended December 31, 2019, 2018 and 2017, revenue recognized in the reporting periods related to performance obligations satisfied in prior reporting periods was immaterial.
Debt Issuance Cost
Other assets include capitalized debt issuance costs of $1.2 million, net of accumulated amortization of $0.2 million as of December 31, 2019. As of December 31, 2018, capitalized debt issuance costs of $4.3 million, net of accumulated amortization of $0.3 million, was included in long-term debt on the consolidated and combined balance sheets. Debt issuance costs were incurred in connection with establishing and amending credit facilities for Brigham Resources and are amortized over the term of the credit facilities using the straight-line method, which approximates the effective interest rate method. Amortization expense for debt issue costs was $0.4 million, $0.7 million and $0.1 million for the years ended December 31, 2019, 2018, and 2017. On July 27, 2018, the prior revolving credit facility was terminated and replaced with a new term loan facility. See further discussion in "Note 7.—Long-Term Debt" in our consolidated and combined financial statements.
Recently Issued Accounting Standards Not Yet Adopted
Brigham Minerals’ status as an emerging growth company under Section 107 of the JOBS Act permits it to delay the adoption of certain accounting standards until those standards would otherwise apply to private companies. Brigham Minerals is choosing to take advantage of this extended transition period and, as a result, it will comply with new or revised accounting standards on the relevant dates on which adoption of such standards is required for private companies.
In February 2016, the FASB issued ASU 2016-02, Leases, which requires all leasing arrangements to be presented in the balance sheet as liabilities along with a corresponding asset. ASU 2016-02 does not apply to leases of mineral rights to explore for or use crude oil and natural gas. The ASU will replace most existing lease guidance in GAAP when it becomes effective. In January 2018, the FASB issued ASU 2018-01, Land Easement Practical Expedient for Transition to Topic 842, to provide an optional practical expedient to not evaluate existing or expired land easements that were not previously accounted for as leases under Topic 840. In July 2018, the FASB issued ASU 2018-11 Leases (Topic 842): Targeted Improvements, which provides for another transition method, in addition to the existing transition method, by allowing entities to initially apply the new leases standard at the adoption date and recognize a cumulative-effect adjustment to the opening balance of retained earnings in the period of adoption (i.e. comparative periods presented in the financial statements will continue to be in accordance with current GAAP (Topic 840, Leases)). The new standard becomes effective for us during the fiscal year ending December 31, 2021 and interim periods within the fiscal year ending December 31, 2022 and early adoption is permitted. We are currently evaluating the impact that the adoption of this update will have on our consolidated and combined financial statements and related disclosures.
F - 17
3. Oil and Gas Properties
Brigham Minerals uses the full cost method of accounting for its oil and natural gas properties. Under this method, all acquisition costs incurred for the purpose of acquiring mineral and royalty interests, including certain internal costs, are capitalized into a full cost pool. Costs associated with general corporate activities are expensed in the period incurred. Oil and gas properties consisted of the following:
December 31, | ||||||||
(In thousands) | 2019 | 2018 | ||||||
Oil and gas properties, at cost, using the full cost method of accounting: | ||||||||
Not subject to depletion | $ | 291,664 | $ | 228,151 | ||||
Subject to depletion | 449,061 | 289,851 | ||||||
Total oil and gas properties, at cost | 740,725 | 518,002 | ||||||
Less accumulated depreciation, depletion, and amortization | (61,103 | ) | (27,628 | ) | ||||
Total oil and gas properties, net | $ | 679,622 | $ | 490,374 | ||||
Costs not subject to depletion are as follows, by the year in which such costs were incurred:
By Year: | Total | 2019 | 2018 | 2017 | 2016 | Prior | ||||||||||||||||||
(In thousands) | ||||||||||||||||||||||||
Property Acquisition costs | $ | 291,664 | $ | 80,964 | $ | 73,002 | $ | 66,139 | $ | 10,745 | $ | 60,814 | ||||||||||||
Capitalized costs are depleted on a unit of production basis based on proved oil and natural gas reserves. Depletion expense was $30.4 million, $13.3 million and $6.2 million for the years ended December 31, 2019, 2018 and 2017, respectively. Average depletion of proved properties was $11.22, $9.38 and $7.25 per Boe for the years ended December 31, 2019, 2018 and 2017, respectively.
The costs associated with unevaluated properties primarily consist of acquisition costs and capitalized general and administrative costs. Brigham Minerals capitalizes certain overhead expenses and other internal costs attributable to the acquisition of mineral and royalty interests as part of its investment in oil and gas properties over the periods benefitted by these activities. Capitalized costs do not include any costs related to general corporate overhead or similar activities. Capitalized costs were $7.4 million, $2.7 million and $2.1 million for the years ended December 31, 2019, 2018 and 2017, respectively.
4. Acquisitions and Divestitures
In 2019, Brigham Minerals adopted ASU 2017-01, Clarifying the Definition of a Business, using a prospective approach. This guidance assists in determining whether a transaction should be accounted for as an acquisition of assets or as a business. This ASU provides a screen that when substantially all of the fair value of the gross assets acquired, or disposed of, are concentrated in a single identifiable asset, or a group of similar identifiable assets, the set will not be considered a business. If the screen is not met, a set must include an input and a substantive process that together significantly contribute to the ability to create an output to be considered a business. The adoption of the new standard did not have a material impact on the consolidated and combined financial statements.
During the years ended December 31, 2019 and 2018, Brigham Minerals entered into a number of individually insignificant acquisitions of mineral and royalty interests from various sellers in Texas, Oklahoma, Colorado, New Mexico, and North Dakota, as reflected in the table below. The change in the oil and natural gas property balance is comprised of payments for acquisitions of minerals, land brokerage costs and capitalized general and administrative expenses that were funded with borrowings under its Owl Rock credit facility, our revolving credit facility and proceeds from the IPO.
Assets Acquired | Cash Consideration Paid | |||||||||||
(In thousands) | Evaluated | Unevaluated | ||||||||||
Twelve months ended December 31, 2019 | $ | 140,025 | $ | 78,093 | $ | 218,118 | ||||||
Twelve months ended December 31, 2018 | $ | 115,589 | $ | 81,367 | $ | 196,956 | ||||||
In August 2017, Brigham Minerals acquired certain mineral and royalty interests in the Delaware Basin for $29.2 million. Brigham Minerals funded the acquisition with capital contributions. The allocation of the purchase price was $20.5 million to unevaluated properties and $8.7 million to evaluated properties.
F - 18
In addition, during 2017, Brigham Minerals entered into a number of individually insignificant acquisitions. The change in the oil and natural gas property balance is comprised of individually insignificant payments for acquisitions of minerals, land brokerage costs and capitalized general and administrative capital expenditures.
On February 28, 2017, Brigham Operating and Brigham Resources Midstream, LLC, wholly owned subsidiaries of Brigham Resources, closed on the sale of substantially all of their Southern Delaware Basin leasehold and related assets, including certain mineral and royalty interests owned by Brigham Resources, to a third-party public entity. The proceeds for mineral and royalty interests represented $156.7 million of the net adjusted sales price and consisted of cash of $111.1 million and shares valued at $45.6 million The mineral and royalty interests sold represented approximately 12% in aggregate of Brigham Minerals’ total proved reserves as of December 31, 2016. As a result of the sale, the relationship between capitalized costs and proved reserves was altered significantly and Brigham Minerals recorded a gain of $94.6 million.
5. Derivative Instruments
Brigham Minerals periodically uses commodity derivative instruments to reduce its exposure to commodity price volatility for a portion of its forecasted crude oil and natural gas sales and thereby achieve a more predictable level of cash flows. None of the derivative instruments are designated as hedges. Brigham Minerals does not enter into derivative instruments for speculative or trading purposes.
Because the counterparties to Brigham Minerals derivative instruments have investment grade credit ratings, Brigham Minerals believes it does not have significant credit risk and does not anticipate nonperformance from its counterparties. Brigham Minerals continually monitors the credit ratings of its counterparties.
Concurrent with the termination of its prior revolving credit facility in July 2018, Brigham Resources posted cash collateral of $1.4 million for its existing WTI fixed price swap contracts. The cash collateral was $1.6 million in May 2019 prior to the termination of the Owl Rock credit facility and was returned to Brigham Resources upon entering into our revolving credit facility, as discussed in “Note 1.—Business and Basis of Presentation.”
Brigham Minerals no longer has oil derivative contracts in place as of December 31, 2019. Prior to December 31, 2019, we had certain oil swap contracts based on the New York Mercantile Exchange ("NYMEX") futures index.
Our derivative instruments were subject to master netting arrangements and are presented on a net basis in our consolidated and combined balance sheets. The following table summarizes the location and fair value of our derivative instruments as of December 31, 2018 (in thousands):
Derivative Instruments | Balance Sheet Classification | Gross Amount Recognized | Less Group Amount of Offset | Net Amount Recognized | ||||||||||
(In thousands) | ||||||||||||||
As of December 31, 2018 | ||||||||||||||
Derivative assets: | ||||||||||||||
Commodity swaps | Current derivative assets | $ | 1,057 | $ | — | $ | 1,057 | |||||||
The following table summarizes Brigham Minerals' (loss) gain on derivative instruments, net on its consolidated and combined statement of operations for the years ended December 31, 2019, 2018 and 2017 (in thousands):
Years Ended December 31, | ||||||||||||
(In thousands) | 2019 | 2018 | 2017 | |||||||||
Realized gain (loss) | $ | 470 | $ | (754 | ) | $ | — | |||||
Unrealized gain (loss) | (1,038 | ) | 1,178 | (121 | ) | |||||||
(Loss) gain on derivative instruments, net | $ | (568 | ) | $ | 424 | $ | (121 | ) | ||||
6. Fair Value Measurements
We classify financial assets and liabilities that are measured and reported at fair value on a recurring basis using a hierarchy based on the inputs used in measuring fair value. GAAP defines fair value as the price that would be received to sell an asset or paid to transfer a liability in an orderly transaction between market participants at the measurement date (exit price). We classify the inputs used to measure fair value into the following hierarchy:
F - 19
• | Level 1: Inputs based on quoted market prices in active markets for identical assets or liabilities at the measurement date. |
• | Level 2: Inputs based on quoted prices for similar assets or liabilities in active markets, quoted prices for identical or similar assets and liabilities in markets that are not active or other inputs that are observable and can be corroborated by observable market data. |
• | Level 3: Inputs that reflect management’s best estimates and assumptions of what market participants would use in pricing the asset or liability at the measurement date. The inputs are unobservable in the market and significant to the valuation of the instruments. |
Changes in economic conditions or model-based valuation techniques may require the transfer of financial instruments from one fair value level to another. In such instances, the transfer would be reported at the beginning of the period in which the change occurs.
Assets and Liabilities Measured at Fair Value on a Recurring Basis
Brigham Minerals had no financial assets or liabilities that were accounted for at fair value on a recurring basis at December 31, 2019.
Brigham Minerals' financial assets and liabilities that were accounted for at fair value on a recurring basis at December 31, 2018 are as follows (in thousands):
December 31, 2018 | |||||||||||||||
Level 1 | Level 2 | Level 3 | Total | ||||||||||||
Assets-commodity derivative instruments | $ | — | $ | 1,057 | $ | — | $ | 1,057 | |||||||
Level 1 equity securities represent publicly traded securities valued using quoted market prices. During 2017, Brigham Minerals received shares of publicly traded securities as partial proceeds from the sale of oil and gas properties discussed in "Note 4 - Acquisitions and Divestitures" and classified them as available for sale. As of December 31, 2017, Brigham Minerals had remaining available for sale securities with aggregate cost basis of $3.4 million and unrealized gains of $0.7 million, which is included in accumulated other comprehensive income (“AOCI”). The fair value of available for sale securities held by Brigham Minerals as of December 31, 2017 was $4.1 million and is included in investment in equity securities on the accompanying consolidated and combined balance sheets. During the twelve months ended December 31, 2018, Brigham Resources had unrealized gains on available for sale securities of $0.1 million. In addition, during the twelve months ended December 31, 2018, Brigham Resources distributed securities valued at $3.3 million and sold the remaining securities for $0.9 million restricted for payment of tax liabilities resulting from the sale of oil and gas properties. As a result of the distribution and sale of securities, gains of $0.8 million were reclassified out of AOCI and included in gain on sale of equity investments on the accompanying consolidated and combined statement of operations.
Our derivative instruments consist of oil swaps carried at fair value. Commodity derivative instruments are valued using a third-party industry-standard pricing model using contract terms and prices and assumptions and inputs that are substantially observable in active markets throughout the full term of the instruments, including forward oil and gas price curves, discount rates and volatility factors. The fair values are also compared to the values provided by the counterparties for reasonableness and are adjusted for the counterparties’ credit quality for derivative assets and our credit quality for derivative liabilities. As such, these derivative contracts are classified within Level 2.
Brigham Resources had no transfers into or out of Level 1 and no transfers into or out of Level 2 for the twelve months ended December 31, 2019, 2018 and 2017.
Assets and Liabilities Measured at Fair Value on a Non-Recurring Basis
Certain nonfinancial assets and liabilities, such as assets and liabilities acquired in a business combination, are measured at fair value on a nonrecurring basis on the acquisition date and are subject to fair value adjustments under certain circumstances. The inputs used to determine such fair value are primarily based upon internally developed cash flow models and include factors such as estimates of economic reserves, future operating and development costs, future commodity prices and a risk-adjusted discount rates, and are classified within Level 3.
Fair Value of Other Financial Instruments
F - 20
The carrying value of cash, trade and other receivables and trade payables are considered to be representative of their respective fair values due to the short-term nature of these instruments. The carrying amount of debt outstanding pursuant to our term loan and our prior revolving credit facility approximates fair value as interest rates on these instruments approximate current market rates. We categorized our long-term debt within Level 2 of the fair value hierarchy.
7. Long-Term Debt
Prior Revolving Credit Facility
Prior to its termination on July 27, 2018, the Minerals Subsidiaries maintained a secured revolving credit facility with a syndicate of financial institutions (the “prior revolving credit facility”), which had been amended periodically. The prior revolving credit facility had a commitment of $150 million, and a borrowing base and outstanding borrowings of $70 million each as of July 27, 2018. Brigham Minerals terminated the prior revolving credit facility on July 27, 2018 with proceeds from the Owl Rock credit facility (as defined below). Additionally, during the third quarter of 2018, Brigham Resources wrote off approximately $0.3 million of unamortized debt issuance costs that were related to the prior revolving credit facility.
Owl Rock Credit Facility
On July 27, 2018, the prior revolving credit facility was terminated in conjunction with the entry into a new credit facility (the “Owl Rock credit facility”) with Owl Rock Capital Corporation as administrative agent and collateral agent. Brigham Resources used the proceeds from the Owl Rock credit facility to repay the outstanding $70 million of principal under the prior revolving credit facility and to fund mineral and royalty acquisitions. The Owl Rock credit facility was subject to customary fees, guarantees of subsidiaries, restrictions and covenants, including certain restricted payments, and was collateralized by certain oil and natural gas properties of Brigham Resources. The Owl Rock credit facility provided for a $125 million initial term loan, a $75 million delayed draw term loan (“DDTL”) and a $10 million revolving credit facility, bore interest at a rate per annum equal to, at Brigham Resources’ option, (a) the base rate plus 4.50%, or (b) the adjusted LIBOR rate for such interest period (subject to a 1.00% floor) plus 5.50%, matured on July 27, 2024 and required Brigham Resources to maintain compliance with certain financial and collateral coverage ratios.
On May 7, 2019, the Owl Rock credit facility was terminated and paid off using a portion of the net proceeds generated from the IPO. As a result of the debt repayment, Brigham Minerals recognized a loss on extinguishment of debt of $6.9 million, which consisted of a $4.0 million write-off of capitalized debt issuance costs, a $2.1 million prepayment fee and legal fees of $0.8 million.
Revolving Credit Facility
On May 16, 2019 (the “closing date”) Brigham Resources entered into a credit agreement with Wells Fargo Bank, N.A., as administrative agent for the various lenders from time to time party thereto, providing for a new revolving credit facility (our "revolving credit facility”). Our revolving credit facility is guaranteed by Brigham Resources’ domestic subsidiaries and is collateralized by a lien on substantially all of Brigham Resources and its domestic subsidiaries’ assets, including substantially all of their respective royalty and mineral properties.
Availability under our revolving credit facility is governed by a borrowing base, which was subject to redetermination on February 1, 2020, and semi-annually thereafter on May 1 and November 1 of each year, commencing with May 1, 2020. In addition, lenders holding two-thirds of the aggregate commitments may request one additional redetermination each year. Brigham Resources can also request one additional redetermination each year, and such other redeterminations as appropriate when significant acquisition opportunities arise. The borrowing base is subject to further adjustments for asset dispositions, material title deficiencies, certain terminations of hedge agreements and issuances of permitted additional indebtedness. Increases to the borrowing base require unanimous approval of the lenders, while decreases only require approval of lenders holding two-thirds of the aggregate commitments at such time. As of December 31, 2019, the borrowing base was $150.0 million and we had no outstanding borrowings under our revolving credit facility. On February 25, 2020, the borrowing base on our revolving credit facility was increased to $180.0 million. See "Note.14—Subsequent Events" to the consolidated and combined financial statements of Brigham Minerals included elsewhere in this Annual Report for further discussion.
Our revolving credit facility bears interest at a rate per annum equal to, at our option, the adjusted base rate or the adjusted LIBOR rate plus an applicable margin. The applicable margin is based on utilization of our revolving credit facility and ranges from (a) in the case of adjusted base rate loans, 0.750% to 1.750% and (b) in the case of adjusted LIBOR rate loans, 1.750% to 2.750%. Brigham Resources may elect an interest period of one, two, three, six, or if available to all lenders, twelve months. Interest is payable in arrears at the end of each interest period, but no less frequently than quarterly. A commitment fee
F - 21
is payable quarterly in arrears on the daily undrawn available commitments under our revolving credit facility in an amount ranging from 0.375% to 0.500% based on utilization of our revolving credit facility. Our revolving credit facility is subject to other customary fee, interest and expense reimbursement provisions.
Our revolving credit facility matures on May 16, 2024. Loans drawn under our revolving credit facility may be prepaid at any time without premium or penalty (other than customary LIBOR breakage) and must be prepaid in the event that exposure exceeds the lesser of the borrowing base and the elected availability at such time. The principal amount of loans that are prepaid are required to be accompanied by accrued and unpaid interest and fees on such amounts. Loans that are prepaid may be reborrowed. In addition, Brigham Resources may permanently reduce or terminate in full the commitments under our revolving credit facility prior to maturity. Any excess exposure resulting from such permanent reduction or termination must be prepaid. Upon the occurrence of an event of default under our revolving credit facility, the administrative agent acting at the direction of the lenders holding a majority of the aggregate commitments at such time may accelerate outstanding loans and terminate all commitments under our revolving credit facility, provided that such acceleration and termination occurs automatically upon the occurrence of a bankruptcy or insolvency event of default.
Our revolving credit facility contains customary affirmative and negative covenants, including, without limitation, reporting obligations, restrictions on asset sales, restrictions on additional debt and lien incurrence and restrictions on making distributions (subject only to no default or borrowing base deficiency) and investments. In addition, our revolving credit facility requires us to maintain (a) a current ratio of not less than 1.00 to 1.00 and (b) a ratio of total net funded debt to consolidated EBITDA of not more than 4.00 to 1.00. As of December 31, 2019, we were in compliance with all covenants in accordance with our revolving credit facility.
8. Shareholders' and Members' Equity
Shareholders' Equity
Class A Common Stock
Brigham Minerals has approximately 34.0 million shares of its Class A common stock outstanding as of December 31, 2019. Holders of Class A common stock are entitled to one vote per share on all matters to be voted upon by the stockholders and are entitled to ratably receive dividends when and if declared by the Company’s board of directors. Upon liquidation, dissolution, distribution of assets or other winding up, the holders of Class A common stock are entitled to receive ratably the assets available for distribution to the stockholders after payment of liabilities.
Class B Common Stock
Brigham Minerals has approximately 22.8 million shares of its Class B common stock outstanding as of December 31, 2019. Holders of the Class B common stock are entitled to one vote per share on all matters to be voted upon by the stockholders. Holders of Class A common stock and Class B common stock generally vote together as a single class on all matters presented to Brigham Minerals’ stockholders for their vote or approval. Holders of Class B common stock generally do not have any right to receive dividends or distributions upon a liquidation or winding up of Brigham Minerals.
Earnings per Share
Basic earnings per share (“EPS”) measures the performance of an entity over the reporting period. Diluted earnings per share measures the performance of an entity over the reporting period while giving effect to all potentially dilutive common shares that were outstanding during the period. Brigham Minerals uses the “if-converted” method to determine the potential dilutive effect of exchanges of outstanding shares of Class B common stock (and corresponding Brigham LLC Units), and the treasury stock method to determine the potential dilutive effect of vesting of its outstanding RSAs, RSUs, PSUs and unvested Incentive Units. Brigham Minerals does not use the two-class method because the Class B common stock and the unvested share-based awards are nonparticipating securities. For the year ended December 31, 2019, the Class B common stock, the Incentive Units, RSAs and RSUs were not recognized in dilutive EPS calculations as the effect would have been antidilutive. There were no shares of Class A or Class B common stock outstanding for the years ended December 31, 2018 and 2017, therefore no earnings per share information has been presented for those periods.
For the year ended December 31, 2019, Brigham Minerals’ EPS calculation includes only its share of net income for the period subsequent to the IPO, and omits income or loss prior to the IPO. In addition, the basic weighted average shares outstanding calculation is based on the actual days in which the shares were outstanding from the IPO through December 31,
F - 22
2019. The following table reflects the allocation of net income (loss) to common stockholders and EPS computations for the period indicated based on a weighted average number of common stock outstanding for the period:
Years Ended December 31, | ||||||||||||
(In thousands, except per share data) | 2019 | 2018 | 2017 | |||||||||
Basic EPS | ||||||||||||
Numerator: | ||||||||||||
Basic net income attributable to Brigham Minerals, Inc. shareholders | $ | 6,901 | $ | — | $ | — | ||||||
Less: net income attributable to Brigham Minerals, Inc. shareholders pre-IPO | (848 | ) | — | — | ||||||||
Basic net income attributable to Brigham Minerals, Inc. shareholders post-IPO (1) | 6,053 | — | — | |||||||||
Denominator: | ||||||||||||
Basic weighted average shares outstanding (1) | 22,870 | — | — | |||||||||
Basic EPS attributable to Brigham Minerals, Inc. shareholders | $ | 0.26 | $ | — | $ | — | ||||||
Diluted EPS | ||||||||||||
Numerator: | ||||||||||||
Basic net income attributable to Brigham Minerals, Inc. shareholders post-IPO (1) | 6,053 | — | — | |||||||||
Diluted net income attributable to Brigham Minerals, Inc. shareholders | 6,053 | — | — | |||||||||
Denominator: | ||||||||||||
Basic weighted average shares outstanding (1) | 22,870 | — | — | |||||||||
Effect of dilutive securities: | ||||||||||||
Diluted weighted average shares outstanding | 22,870 | — | — | |||||||||
Diluted EPS attributable to Brigham Minerals, Inc. shareholders | $ | 0.26 | $ | — | $ | — | ||||||
(1) - Represents earnings per share of Class A common stock and weighted average shares of Class A common stock for the period from April 17, 2019 through December 31, 2019, the period following the IPO.
As of December 31, 2019, there were 753,546 shares related to PSUs (based on target), that could vest in the future dependent on predetermined performance goals. These units were not included in the computation of EPS for the year ended December 31, 2019, because the performance goals had not been met, assuming the end of the reporting period was the end of the contingency period.
Members' Equity
Series A Units
On April 5, 2013, Brigham Resources received subscriptions to purchase 64,840,000 Series A Units at a price of $10 per unit. The Series A Units may be purchased within a five-year period from April 5, 2013 to April 5, 2018. Brigham Resources’ management had the right, subject to the approval of its Board of Directors and certain of its investors, to send notice to the Series A Unit holders specifying the need for additional capital. All outstanding Series A Units were sold prior to December 31, 2015. Series A Unit holders are entitled to one vote per share on voting matters and have certain rights with respect to distributions declared by Brigham Resources’ Board of Directors pursuant to a distribution waterfall set forth in the Brigham Resources LLC Agreement. The Series A Units have a liquidation preference equal to total invested capital, plus a 7% cumulative return, compounded daily.
Series A-M Units
Brigham Resources has authorized 460,000 Series A-M Units for issuance at a price of $10 per unit. On April 5, 2013, 160,000 Series A-M Units were issued in connection with the formation of Brigham Resources. The remaining 300,000 Series A-M Units were available for issuance to a related party if certain capital call funding thresholds were met (the “Contingent A-M Units”) and subject to achievement of certain time-based vesting conditions. During 2014, all 300,000 Contingent A-M Units
F - 23
were issued, and as of December 31, 2017, 100% of the Series A-M Units were vested. Series A-M Unit holders have no voting rights and have certain rights with respect to distributions declared by Brigham Resources’ Board of Directors pursuant to a distribution waterfall set forth in the Brigham Resources LLC Agreement. The Series A-M Units have a liquidation preference equal to the total invested capital, plus a 7% cumulative return, compounded daily.
Series A-Z Units
On May 8, 2015, Brigham Resources received subscriptions to purchase 41,176,471 Series A-Z Units at a price of $8.50 per unit. The Series A-Z Units were available to be issued at any time between May 8, 2015 and April 5, 2018. Brigham Resources’ management had the right, subject to the approval of its Board of Directors and certain of its investors, to send notice to the Series A-Z Unit holders specifying the need for additional capital (a “Series A-Z Capital Call”). During the years ended December 31, 2018 and 2017, Brigham Resources issued Series A-Z Capital Calls for gross proceeds of $45,999,995, representing the sale of 5,411,764 Series A-Z Units, and of $37,000,002, representing the sale of 4,352,941 Series A-Z Units, respectively. Series A-Z Unit holders are entitled to one vote per share on voting matters and have certain rights with respect to distributions declared by Brigham Resources’ Board of Directors pursuant to a distribution waterfall set forth in the Brigham Resources LLC Agreement. The Series A-Z Units have a liquidation preference equal to the total invested capital, plus a 7% cumulative return, compounded daily.
In connection with the IPO, all of the outstanding membership interests in Brigham Resources were converted into a single class of common units in Brigham Resources and Brigham Resources became a wholly-owned subsidiary.
Restricted Units
Brigham Resources has authorized 120,000 restricted incentive units (“Restricted Units”) for issuance to management, independent directors, employees and consultants. The Restricted Units vest 20% upon issuance and 20% on each of the four anniversary dates following the date of issuance. The Restricted Units participate in certain distribution events following the sale, merger or other transaction involving Brigham Resources or its assets only after certain return thresholds are met by the holders of Series A Units, Series A-Z Units and Series A-M Units. There are eight classes of Restricted Units, including Series M-1, Series M-2, Series M-3 and Series M-4 (collectively, “Series M Units”) and Series Z-1, Series Z-2, Series Z-3 and Series Z-4 (collectively, “Series Z Units”). Brigham Resources is authorized to issue 10,000 units of each class of Series M Units and Series Z Units. A summary of the Restricted Units issued and outstanding is as follows:
F - 24
Series M Units | |||||||||||||||
M-1 | M-2 | M-3 | M-4 | Total | |||||||||||
Beginning balance | 7,520 | 7,520 | 7,520 | 7,520 | 30,080 | ||||||||||
2017 issuances | — | — | — | — | — | ||||||||||
2017 forfeitures | — | — | — | — | — | ||||||||||
Outstanding at December 31, 2017 | 7,520 | 7,520 | 7,520 | 7,520 | 30,080 | ||||||||||
2018 issuances | 1,030 | 1,030 | 1,030 | 1,030 | 4,120 | ||||||||||
2018 forfeitures | — | — | — | — | — | ||||||||||
Outstanding at December 31, 2018 | 8,550 | 8,550 | 8,550 | 8,550 | 34,200 | ||||||||||
Series Z Units | |||||||||||||||
Z-1 | Z-2 | Z-3 | Z-4 | Total | |||||||||||
Beginning balance | 4,328 | 4,328 | 4,328 | 4,328 | 17,312 | ||||||||||
2017 issuances | — | — | — | — | — | ||||||||||
2017 forfeitures | (15 | ) | (15 | ) | (15 | ) | (15 | ) | (60 | ) | |||||
Outstanding at December 31, 2017 | 4,313 | 4,313 | 4,313 | 4,313 | 17,252 | ||||||||||
2018 issuances | 485 | 485 | 485 | 485 | 1,940 | ||||||||||
2018 forfeitures | (105 | ) | (105 | ) | (105 | ) | (105 | ) | (420 | ) | |||||
Outstanding at December 31, 2018 | 4,693 | 4,693 | 4,693 | 4,693 | 18,772 | ||||||||||
As of December 31, 2018, 7,726 of each class of Series M Units (30,904 total) and 3,808 of each class of Series Z Units (15,232 total) had vested. As of December 31, 2017, 7,520 of each class of Series M Units (30,080 total) and 2,596 of each class of Series Z Units (10,386 total) had vested. The Series M-1 Units were issued with a threshold value of $0.00; the Series M-2 Units were issued with a threshold value of $2.25; the Series M-3 Units were issued with a threshold value of $6.50; and the Series M-4 Units were issued with a threshold value of $14.00. The Series Z-1 Units were issued with a threshold value of $0.00; the Series Z-2 Units were issued with a threshold value of $1.91; the Series Z-3 Units were issued with a threshold value of $5.53; and the Series Z-4 Units were issued with a threshold value of $11.90.
In connection with the 2018 corporate reorganizations and the corporate reorganization consummated in connection with Brigham Minerals’ IPO, these Restricted Units were converted into Incentive Units. See "Note 10.—Share-Based Compensation—LLC Incentive Units" for further discussion of this transaction.
9. Temporary Equity
Temporary equity represents the Original Owners’ 40.2% ownership of Brigham LLC, as of December 31, 2019. In addition, the Original Owners own all of our Class B common stock. Each share of Class B common stock does not have any economic rights but entitles its holder to one vote on all matters to be voted on by our stockholders, generally and a redemption right into Class A shares. As discussed in “Note 1.— Business and Basis of Presentation,” following the IPO:
• | Each holder of Brigham LLC Units following the restructuring, other than Brigham Minerals and its subsidiaries, received a number of shares of Class B common stock equal to the number of Brigham LLC Units held by such Brigham Unit Holder following the IPO; |
• | Brigham Minerals contributed, directly or indirectly, the net proceeds of the IPO to Brigham LLC in exchange for an additional number of Brigham LLC Units such that Brigham Minerals holds, directly or indirectly, a total number of Brigham LLC Units equal to the number of shares of Class A common stock outstanding following the IPO; and |
• | Under the Amended and Restated Limited Liability Company Agreement of Brigham LLC (the “Brigham LLC Agreement”), each Brigham Unit Holder, subject to certain limitations, has a right (the “Redemption Right”) to |
F - 25
cause Brigham LLC to acquire all or a portion of its Brigham LLC Units for, at Brigham LLC’s election, (i) shares of our Class A common stock at a redemption ratio of one share of Class A common stock for each Brigham LLC Unit redeemed, subject to conversion rate adjustments for stock splits, stock dividends and reclassification and other similar transactions or (ii) an equivalent amount of cash. We will determine whether to issue shares of Class A common stock or cash based on facts in existence at the time of the decision, which we expect would include the relative value of the Class A common stock (including trading prices for the Class A common stock at the time), the cash purchase price, the availability of other sources of liquidity (such as an issuance of preferred stock) to acquire the Brigham LLC Units and alternative uses for such cash. Alternatively, upon the exercise of the Redemption Right, Brigham Minerals (instead of Brigham LLC) will have a call right to, for administrative convenience, acquire each tendered Brigham LLC Unit directly from the redeeming Brigham Unit Holder for, at its election, (x) one share of Class A common stock or (y) an equivalent amount of cash (the “Call Right”). The decision to make a cash payment upon a Brigham Unit Holder’s exercise of its Redemption Right is required to be made by the Company’s directors who are independent under Section 10A-3 of the Securities Act and do not hold any Brigham LLC Units subject to such redemption. In connection with any redemption of Brigham LLC Units pursuant to the Redemption Right or acquisition pursuant to our Call Right, the corresponding number of shares of Class B common stock will be cancelled.
Class B common stock is classified as temporary equity in the consolidated and combined balance sheet as, pursuant to the Brigham LLC Agreement, the Redemption Rights of each Brigham Unit Holder for either shares of Class A common stock or an equivalent amount of cash is not solely within Brigham Minerals’ control. This is due to the majority of the members of the board of directors are holders of the Class B common stock, which allows the holders of Class B common stock to elect the members of the board of directors of the Company, including those directors that determine whether to make a cash payment upon a Brigham Unit Holder’s exercise of its Redemption Right. Temporary equity is recorded at the greater of the book value or redemption amount. From the date of the IPO through December 31, 2019, the Company recorded adjustments to the value of temporary equity as presented in the table below:
(In thousands) | Temporary Equity Adjustments | |||
Balance - April 17, 2019 (1) | $ | 518,000 | ||
Conversion of Class B shares to Class A shares | (104,390 | ) | ||
Net income attribution | 9,646 | |||
Distribution to holders of temporary equity | (20,321 | ) | ||
Adjustment of temporary equity to redemption amount (2) | 51,572 | |||
Balance - December 31, 2019 | $ | 454,507 | ||
(1) | Based on 28,777,802 shares of Class B common stock outstanding and Class A share price of $18.00. |
(2) | Based on 22,847,045 shares of Class B common stock outstanding and Class A share 10-day VWAP of $19.89 at December 31, 2019. |
10. Share-Based Compensation
LLC Incentive Units
As part of the Second Amended and Restated Limited Liability Company Agreement of Brigham Resources, LLC dated May 8, 2015, Brigham Resources authorized 120,000 restricted incentive units for issuance to management, independent directors, employees, and consultants (such incentive units, as converted as described below, the “Incentive Units”). Brigham Resources granted Incentive Units in April 2013 and September 2015 and 2018. In connection with the 2018 corporate reorganizations and the corporate reorganization consummated in connection with Brigham Minerals’ IPO (collectively with the 2018 corporate reorganizations, the “corporate reorganization”), these Incentive Units were converted into units in Brigham Equity Holdings, LLC (“Brigham Equity Holdings”) with equivalent rights, responsibilities, and preferences. The Incentive Units are subject to vesting as follows: 20% of the Incentive Units were vested on the date of grant and 20% of the Incentive Units vest on each anniversary of the date of grant if the holder remains continuously employed by Brigham Resources or its affiliates through the applicable vesting date. Upon vesting of the Incentive Units, holders of the Incentive Units receive one share of Brigham Minerals’ Class B common stock and one Brigham LLC Unit for each vested Incentive Unit.
F - 26
In connection with the completion of the IPO, Brigham LLC and Brigham Equity Holdings discontinued granting new Incentive Units; however Brigham Equity Holdings will continue to administer the existing awards that remain outstanding. As discussed in “Note 9.—Temporary Equity,” participants may receive one share of Brigham Minerals’ Class A common stock in exchange for one share of Class B common stock and one Brigham LLC Unit, or cash at the option of Brigham Minerals. Brigham Minerals accounts for the Incentive Units as compensation cost measured at the fair value of the award on the date of grant. No compensation expense was recognized prior to the IPO because the IPO was not considered probable.
A summary of the Incentive Unit activity for the year ended December 31, 2019 is as follows:
Incentive Units | |||||||
(In thousands) | Number of Incentive Units | Grant-date Fair Value | |||||
Outstanding—January 1, 2019 | 3,272 | $ | 1.49 | ||||
Vested | (3,060 | ) | $ | 0.89 | |||
Outstanding—December 31, 2019 | 212 | $ | 10.04 | ||||
A summary of the Incentive Unit activity for the year ended December 31, 2018 is as follows:
Incentive Units | |||||||
(In thousands) | Number of Incentive Units | Grant-date Fair Value | |||||
Outstanding—January 1, 2018 | 2,918 | $ | 0.45 | ||||
Granted | 354 | 10.04 | |||||
Vested | — | — | |||||
Outstanding—December 31, 2018 | 3,272 | $ | 1.49 | ||||
Brigham LLC used a third-party valuation specialist to assist management in its estimation of the grant-date fair value of the Incentive Units on the respective grant dates during 2013, 2015 and 2018. Brigham LLC used the Black-Scholes option pricing valuation model with the following weighted-average assumptions
Incentive Units | |||||||||
2018 Awards | 2015 Awards | 2013 Awards | |||||||
Expected volatility | 28 | % | 33 | % | 40 | % | |||
Expected dividend yield | — | — | — | ||||||
Expected term (in years) | 0.7 | 3.7 | 6.2 | ||||||
Risk-free interest rates | 2.45 | % | 1.07 | % | 0.94 | % | |||
Weighted-average grant date fair value per Incentive Unit | $10.04 | $0.03 | $1.51 | ||||||
Long Term Incentive Plan
In connection with the IPO, Brigham Minerals adopted the Brigham Minerals, Inc. 2019 Long Term Incentive Plan (“LTIP”) for employees, consultants and directors who perform services for Brigham Minerals. The LTIP provides for issuance of awards based on shares of Class A common stock. Brigham Minerals has issued restricted stock awards ("RSAs"), restricted stock units ("RSUs") and performance-based vesting units ("PSUs") under the LTIP. The shares to be delivered under the LTIP shall be made available from (i) authorized but unissued shares, (ii) shares held as treasury stock or (iii) previously issued shares reacquired by Brigham Minerals including shares purchased on the open market. A total of 5,999,600 shares of Class A common stock have been authorized for issuance under the LTIP. At December 31, 2019, 4,416,069 shares of Class A common stock remained available for future grants. Currently, all outstanding RSAs, RSUs and PSUs granted under the LTIP are entitled to receive dividends (in the case of RSAs) or have dividend equivalent rights (“DERs”), which entitle holders of RSUs and PSUs to the same dividend value per share as holders of the Company’s Class A common stock. Such dividends and DERs are subject to the same vesting and other terms and conditions as the corresponding unvested RSAs, RSUs, and PSUs. Dividends and DERs are accumulated and paid when the underlying shares vest. The fair value of the RSA awards granted with the right to receive dividends and RSU awards granted with the right to receive DERs are generally based on the trading price of the
F - 27
Company’s Class A common stock as of the date of grant. Brigham Minerals accounts for the awards granted under the LTIP as compensation cost measured at the fair value of the award on the date of grant.
RSAs are grants of shares of Class A common stock subject to a risk of forfeiture and restrictions on transferability. The share-based compensation expense of such RSAs was determined using the closing price of Class A common stock on April 23, 2019, the date of grant, of $21.25. On April 23, 2019, 312,189 RSAs were granted and 152,742 RSAs vested immediately. The remaining unvested RSAs generally vest in one-third increments on each of April 23, 2020, 2021 and 2022 and are subject to restrictions on transfer and are generally subject to a risk of forfeiture if the award recipient ceases providing services to Brigham Minerals prior to the lapse of such restrictions. During the year ended December 31, 2019, 10,991 RSAs were forfeited. Brigham Minerals accounts for forfeitures as they occur.
RSUs represent the right to receive shares of Class A common stock at the end of the vesting period in an amount equal to the number of RSUs that vest. The RSUs that have been granted generally vest in one-third increments on each of the first three anniversaries of the grant date and are subject to restrictions on transfer and are generally subject to a risk of forfeiture if the award recipient ceases providing services to Brigham Minerals prior to the date the award vests. The share-based compensation expense of such RSUs was determined using the closing price on April 23, 2019, the date of grant, of $21.25 applied to the total number of 598,891 RSUs granted. Brigham Minerals accounts for forfeitures as they occur. During the year ended December 31, 2019, 183,082 RSUs vested and no RSUs were forfeited. Brigham Minerals withheld 59,111 RSUs to satisfy employee tax withholding obligations related to the RSUs that vested in 2019.
PSUs represent the right to receive shares of Class A common stock on at the end of a specified performance period. 753,546 PSUs (based on target) were granted on April 23, 2019, with a performance period that ends on December 31, 2021. The terms and conditions of the PSUs allow for vesting of the awards ranging between 0% (or forfeiture) and 200% of target. The vesting level is calculated based on the actual total stockholder return achieved during the performance period including projected dividends. The fair value of such PSUs was determined using a Monte Carlo simulation and will be recognized over the applicable performance period. The Monte Carlo simulation model utilizes multiple input variables that determine the probability of satisfying the market condition stipulated in the award to calculate the fair value of the award. Expected volatilities in the model were estimated using a historical period consistent with the performance period of approximately three years. The risk-free interest rate was based on the United States Treasury rate for a term commensurate with the expected life of the grant. Using the assumptions in the table below, Brigham Minerals estimated the fair value of PSUs at the date of grant to be $20.36.
Performance-Based Restricted Stock Units | |||
Expected dividend yield | 8.1 | % | |
Risk-free interest rate | 2.3 | % | |
Volatility | 30 | % | |
The number of PSUs that will be earned is estimated quarterly and as of December 31, 2019, we estimated that 451,933 PSUs will be earned. No PSUs were forfeited or vested during the year ended December 31, 2019.
Share-Based Compensation Expense
Share-based compensation expense is included in general and administrative expense in the Company’s consolidated and combined statement of operations included within this Annual Report. Share-based compensation cost recorded for each type of share-based compensation award, was as follows for the periods indicated:
Years Ended December 31, | ||||||||||||
(In thousands) | 2019 | 2018 | 2017 | |||||||||
Incentive Units (1) (3) | $ | 2,904 | $ | — | $ | — | ||||||
RSAs (2) (3) | 3,972 | — | — | |||||||||
RSUs (3) | 4,630 | — | — | |||||||||
PSUs (4) | 2,361 | — | — | |||||||||
Capitalized share-based compensation (5) | (3,818 | ) | — | — | ||||||||
Total share-based compensation expense | $ | 10,049 | $ | — | $ | — | ||||||
F - 28
(1) | Includes a cumulative effect adjustment to share-based compensation cost of $2.0 million pertaining to the period from the grant date through the IPO date. No compensation expense was recorded prior to the IPO because the IPO was not considered probable. |
(2) | Includes $3.2 million recorded at grant date of April 23, 2019, associated with 152,742 RSAs, which vested immediately. |
(3) | Share-based compensation expense relating to Incentive Units, restricted stock awards and time-based restricted stock units with ratable vesting is recognized on a straight-line basis over the requisite service period for the entire award. |
(4) | Share-based compensation expense relating to PSUs with cliff-vesting is recognized on a straight-line basis over the performance period for the entire award. |
(5) | During the year ended December 31, 2019, Brigham Minerals capitalized $3.8 million of the share-based compensation to unevaluated property on its balance sheet. |
In addition to the time-based vesting conditions described above, the Incentive Units could be earned upon the completion of an initial public offering or another liquidity event, considered a performance condition, which was not deemed probable and therefore no compensation expense was recognized prior to December 31, 2018.
Future Share-Based Compensation Expense
The following table reflects the future share-based compensation expense to be recorded for the share-based compensation awards that were outstanding at December 31, 2019, a portion of which will be capitalized:
(In thousands) | Incentive Units | RSAs | RSUs | PSUs | Total | |||||||||||||||
2020 | $ | 712 | $ | 1,052 | $ | 4,217 | $ | 3,419 | $ | 9,400 | ||||||||||
2021 | 712 | 1,052 | 3,890 | 3,419 | 9,073 | |||||||||||||||
2022 | 534 | 326 | — | — | 860 | |||||||||||||||
Total | $ | 1,958 | $ | 2,430 | $ | 8,107 | $ | 6,838 | $ | 19,333 | ||||||||||
11. Income Taxes
The Company accounts for income taxes using the asset and liability method. Deferred tax assets and liabilities are recognized for the future tax consequences attributable to differences between the financial statement carrying amounts of existing assets and liabilities and their respective tax bases. Deferred tax assets and liabilities are calculated by applying existing tax laws and the rates expected to apply to taxable income in the years in which those temporary differences are expected to be recovered or settled. The effect of a change in tax rates on deferred tax assets and liabilities is recognized in income in the period that includes the enactment date.
Brigham Minerals periodically assesses whether it is more likely than not that it will generate sufficient taxable income to realize its deferred income tax assets, including net operating losses. In making this determination, Brigham Minerals considers all available positive and negative evidence and makes certain assumptions. Brigham Minerals considers, among other things, its deferred tax liabilities, the overall business environment, its historical earnings and losses, current industry trends and its outlook for future years. Brigham Minerals did not record a valuation allowance at December 31, 2019 and 2018.
Brigham Minerals has evaluated all tax positions for which the statute of limitations remains open and believes that the material positions taken would more likely than not be sustained by examination. Therefore, at December 31, 2019, Brigham Minerals had not established any reserves for, nor recorded any unrecognized benefits related to, uncertain tax positions.
Brigham Resources, the Company’s predecessor, is a limited liability company that is not subject to U.S. federal income tax, but is subject to the Texas Margin Tax and state income taxes in Oklahoma, North Dakota, and Colorado. As part of the corporate reorganization, certain entities affiliated with Warburg Pincus contributed all of their respective interests in certain wholly owned “blocker” entities through which they held interests in Brigham Resources to Brigham Minerals in exchange for all of the outstanding shares of common stock of Brigham Minerals. On the date of the corporate reorganization, a corresponding “first day” tax charge of approximately $3.1 million was recorded to establish a net deferred tax liability for differences between the tax and book basis of the investment in Brigham Resources. The offset of the deferred tax liability was recorded to additional paid-in-capital.
Brigham Minerals is a corporation and is subject to U.S. federal income tax. In April 2019, Brigham Minerals completed the IPO of 16,675,000 shares of Class A common stock at a price to the public of $18.00 per share. The tax implications of the July 2018 restructuring, initial public IPO and the tax impact of the Company’s status as a taxable corporation subject to U.S. federal income tax have been reflected in the accompanying consolidated and combined financial statements. On IPO date, a corresponding tax benefit of approximately $13.7 million was recorded associated with the differences between the tax and
F - 29
book basis of the investment in Brigham Resources, LLC. The offset of the deferred tax asset was recorded to additional paid-in capital.
Brigham Minerals completed the December 2019 Offering of 12,650,000 shares of its Class A common stock, including 6,000,000 shares issued and sold by Brigham Minerals and an aggregate of 6,650,000 shares sold by certain shareholders of the Company, of which 5,496,813 represents shares issued upon redemption of an equivalent number of their Brigham LLC units, at a price to the public of $18.10 per share. After the December 2019 Offering and redemption, a corresponding tax benefit of approximately $9.5 million was recorded associated with the differences between the tax and book basis of the investment in Brigham Resources, LLC. The offset of the deferred tax asset was recorded to additional paid-in capital.
The effective combined U.S. federal and state income tax rate for the year ended December 31, 2019 was 11.0%. During the twelve months ended December 31, 2019, 2018 and 2017, the Company recognized income tax expense of $2.7 million, $0.3 million and $1.0 million, respectively. Total income tax expense for the twelve months ended December 31, 2019 and 2018 differed from amounts computed by applying the U.S. federal statutory tax rate of 21% due to the impact of the temporary equity, net income attributable to Predecessor, state taxes (net of the anticipated federal benefit), and percentage depletion in excess of basis.
Years Ended December 31, | ||||||||||||
(In thousands) | 2019 | 2018 | 2017 | |||||||||
State Income Tax | ||||||||||||
Current (benefit)/expense | $ | 692 | $ | (23 | ) | $ | 713 | |||||
Deferred (benefit)/expense | 63 | (138 | ) | 295 | ||||||||
Federal Income Tax | ||||||||||||
Current expense | 1,322 | 114 | — | |||||||||
Deferred expense | 602 | 374 | — | |||||||||
Totals: | $ | 2,679 | $ | 327 | $ | 1,008 | ||||||
Total current income taxes | $ | 2,014 | $ | 91 | $ | 713 | ||||||
Total deferred income taxes | 665 | 236 | 295 | |||||||||
Totals: | $ | 2,679 | $ | 327 | $ | 1,008 | ||||||
The following table reconciles the income tax provision with income tax expense at the federal statutory rate for the periods indicated:
Years Ended December 31, | ||||||||||||
(In thousands) | 2019 | 2018 | 2017 | |||||||||
Income before income taxes | $ | 24,318 | $ | 33,142 | $ | 116,620 | ||||||
Less: income before income taxes attributable to predecessor | (5,118 | ) | (30,805 | ) | (116,620 | ) | ||||||
Less: income before income taxes attributable to temporary equity | (9,858 | ) | — | — | ||||||||
Income before income taxes attributable to shareholders | $ | 9,342 | $ | 2,337 | $ | — | ||||||
Income tax at the federal statutory rate | $ | 1,962 | $ | 491 | $ | — | ||||||
State income taxes, net of federal benefit | 717 | (150 | ) | 1,008 | ||||||||
Percentage depletion in excess of basis | — | (14 | ) | — | ||||||||
Total income tax provision | $ | 2,679 | $ | 327 | $ | 1,008 | ||||||
F - 30
Brigham Minerals had $18.8 million recorded as deferred tax asset as of December 31, 2019, and $3.7 million recorded as deferred tax liability at December 31, 2018. The tax effects of temporary differences that give rise to significant portions of the deferred tax assets and deferred tax liabilities were are follows:
Years Ended December 31, | ||||||||
(In thousands) | 2019 | 2018 | ||||||
Deferred tax assets: | ||||||||
Investment in subsidiary | $ | 19,021 | $ | — | ||||
Total deferred tax assets: | $ | 19,021 | $ | — | ||||
Deferred tax liabilities: | ||||||||
Oil and gas properties | (198 | ) | (208 | ) | ||||
Investment in subsidiary | — | (3,476 | ) | |||||
Total deferred tax liabilities | $ | (198 | ) | $ | (3,684 | ) | ||
12. Commitments and Contingencies
Commitments
Brigham Minerals leases office space under operating leases. Rent expense for the years ended December 31, 2019, 2018, and 2017 was $0.6 million, $0.3 million, and $0.2 million, respectively. Future minimum lease commitments under noncancelable operating leases at December 31, 2019 are presented below (in thousands):
Year | Commitment | |||
2020 | $ | 1,000 | ||
2021 | 1,345 | |||
2022 | 1,419 | |||
2023 | 1,492 | |||
2024 | 1,566 | |||
2025 and Thereafter | $ | 4,312 | ||
Total | $ | 11,134 | ||
Contingencies
Brigham Minerals may, from time to time, be a party to certain lawsuits and claims arising in the ordinary course of business. The outcome of such lawsuits and claims cannot be estimated with certainty and management may not be able to estimate the range of possible losses. Brigham Minerals records reserves for contingencies when information available indicates that a loss is probable and the amount of the loss can be reasonably estimated. Brigham Minerals had no reserves for contingencies at December 31, 2019 and December 31, 2018.
13. Related-Party Transactions
Brigham Land Management (“BLM”) occasionally provides us with land brokerage services. The services are provided at market prices and are periodically verified by third-party quotes. BLM is owned by Vince Brigham, an advisor to us and brother of Ben M. Brigham, founder and Executive Chairman of the Board. For the years ended December 31, 2019, 2018 and 2017, the amounts paid to BLM for land brokerage services were $0.1 million, $0.1 million and $0.6 million, respectively. At December 31, 2019, 2018, and 2017, the liabilities recorded for services performed by BLM during the respective periods were immaterial.
Brigham Exploration Company, partially owned by Ben M. Brigham, on occasion leases some of our acreage at market rates. In connection with such leases, we received $0.4 million and $0.6 million for the year ended December 31, 2019 and 2017. There were no payments for the year ended December 31, 2018.
F - 31
During the year ended December 31, 2018, Brigham Resources borrowed $7.0 million from Brigham Operating, at an interest rate of 7.00% and repaid the loan prior to December 31, 2018.
14. Subsequent Events
On February 27, 2020, Brigham Minerals declared a dividend of $0.38 per Class A common stock payable on March 19, 2020, to unitholders of record at the close of business on March 12, 2020.
On February 25, 2020, the borrowing base on our revolving credit facility was increased to $180.0 million.
15. Quarterly Financial Information-Unaudited
Summarized quarterly financial data for the years ended December 31, 2019 and 2018 are presented in the following tables. During the periods presented below, earnings per share information is not available due to no shares being recognized for accounting purposes for periods prior to the IPO.
Three Months Ended | ||||||||||||||||
(In thousands, except per share amount) | March 31, | June 30, | September 30, | December 31, | ||||||||||||
2019 | ||||||||||||||||
Total revenues | $ | 18,265 | $ | 24,529 | $ | 25,107 | $ | 33,614 | ||||||||
Income from operations | 8,707 | 5,034 | 9,115 | 14,362 | ||||||||||||
Net income | 4,036 | (3,207 | ) | 8,464 | 12,346 | |||||||||||
Net income attributable to Brigham Minerals (2) | 534 | (1,856 | ) | 3,146 | 5,077 | |||||||||||
Basic EPS attributable to Brigham Minerals, Inc. shareholders - (1) | — | (0.12 | ) | 0.14 | 0.20 | |||||||||||
Diluted EPS attributable to Brigham Minerals, Inc. shareholders - (1) | — | (0.12 | ) | 0.14 | 0.20 | |||||||||||
2018 | ||||||||||||||||
Total revenues | $ | 14,083 | $ | 16,889 | $ | 18,701 | $ | 17,591 | ||||||||
Income from operations | 8,219 | 10,564 | 11,716 | 8,732 | ||||||||||||
Net income | 8,197 | 9,351 | 8,153 | 7,114 | ||||||||||||
Net income attributable to Brigham Minerals (2) | — | — | 891 | 948 | ||||||||||||
Basic EPS attributable to Brigham Minerals, Inc. shareholders - (1) | — | — | — | — | ||||||||||||
Diluted EPS attributable to Brigham Minerals, Inc. shareholders - (1) | — | — | — | — | ||||||||||||
(1) - Represents earnings per share of Class A common stock and Class B common stock and weighted average shares of Class A common stock and Class B common stock for the period from April 17, 2019 through December 31, 2019, the period following the IPO. See "Note 8.— Shareholders' and Members' Equity" for further discussion of this transaction.
(2) - Represents net income attributable to Brigham Minerals for the period starting with the completion of the July 2018 restructuring. See "Note 1.—Business and Basis of Presentation" for further discussion of this transaction.
16. Reserve and Related Financial Data (SMOG) -Unaudited
Oil and Natural Gas Reserves
F - 32
Proved reserves represent quantities of oil, natural gas and NGLs which, by analysis of geoscience and engineering data, can be estimated with reasonable certainty to be recoverable in the future from known reservoirs under existing economic conditions, operating methods and government regulations. Proved developed reserves are proved reserves which can be expected to be recovered through existing wells with existing equipment, infrastructure and operating methods. Proved reserves were estimated in accordance with guidelines established by the SEC, which require that reserve estimates be prepared under existing economic and operating conditions based upon the 12-month unweighted average of the first-day-of-the-month prices.
The reserves at December 31, 2019 and December 31, 2018 presented below were audited by CG&A and the reserves at December 31, 2017 presented below were prepared by CG&A. Estimates of proved reserves are inherently imprecise and are continually subject to revision based on production history, results of additional exploration and development, price changes and other factors. The reserves are located in various fields in Texas, New Mexico, Oklahoma, Colorado, Wyoming, North Dakota, Montana and Pennsylvania. All of the proved reserves are located in the continental United States.
Crude Oil (MBbl) | Natural Gas (Mmcf) | NGL (MBbl) | Total (MBoe) | |||||||||
Proved reserve quantities, December 31, 2016 | 7,174 | 22,991 | 2,356 | 13,363 | ||||||||
Sales of minerals-in-place | (1,291 | ) | (815 | ) | (200 | ) | (1,627 | ) | ||||
Extensions and discoveries | 1,548 | 6,012 | 709 | 3,259 | ||||||||
Acquisitions | 2,141 | 9,380 | 1,116 | 4,820 | ||||||||
Revisions of previous estimates | (394 | ) | 2,601 | 108 | 147 | |||||||
Production | (454 | ) | (1,768 | ) | (109 | ) | (858 | ) | ||||
Proved reserve quantities, December 31, 2017 | 8,724 | 38,401 | 3,980 | 19,104 | ||||||||
Sales of minerals-in-place | — | — | — | — | ||||||||
Extensions and discoveries | 1,765 | 5,285 | 562 | 3,208 | ||||||||
Acquisitions | 3,669 | 13,862 | 1,374 | 7,354 | ||||||||
Revisions of previous estimates | (390 | ) | (3,245 | ) | (577 | ) | (1,508 | ) | ||||
Production | (777 | ) | (2,507 | ) | (222 | ) | (1,417 | ) | ||||
Proved reserve quantities, December 31, 2018 | 12,991 | 51,796 | 5,117 | 26,741 | ||||||||
Sales of minerals-in-place | (182 | ) | (697 | ) | (110 | ) | (409 | ) | ||||
Extensions and discoveries | 1,997 | 7,780 | 817 | 4,110 | ||||||||
Acquisitions | 4,256 | 13,053 | 1,218 | 7,651 | ||||||||
Revisions of previous estimates | (586 | ) | (5,495 | ) | (797 | ) | (2,299 | ) | ||||
Production | (1,515 | ) | (4,707 | ) | (407 | ) | (2,706 | ) | ||||
Proved reserve quantities, December 31, 2019 | 16,961 | 61,730 | 5,838 | 33,088 | ||||||||
Proved reserve quantities at December 31, 2019 attributable to temporary equity | 6,812 | 24,792 | 2,345 | 13,289 | ||||||||
Proved developed reserve quantities: | ||||||||||||
December 31, 2017 | 2,804 | 13,028 | 1,185 | 6,160 | ||||||||
December 31, 2018 | 6,067 | 21,735 | 1,898 | 11,588 | ||||||||
December 31, 2019 | 9,924 | 33,232 | 2,494 | 17,957 | ||||||||
Proved developed reserves at December 31, 2019 attributable to temporary equity | 3,986 | 13,346 | 1,002 | 7,212 | ||||||||
Proved undeveloped reserve quantities: | ||||||||||||
December 31, 2017 | 5,920 | 25,373 | 2,795 | 12,944 | ||||||||
December 31, 2018 | 6,924 | 30,061 | 3,219 | 15,153 | ||||||||
December 31, 2019 | 7,037 | 28,498 | 3,344 | 15,131 | ||||||||
Proved undeveloped reserves at December 31, 2019 attributable to temporary equity | 2,826 | 11,445 | 1,343 | 6,077 | ||||||||
F - 33
Changes in proved reserves that occurred during 2019 were primarily due to:
• | the acquisition of additional mineral interests located in the Permian, Anadarko, DJ and Williston Basins in multiple transactions, which included 7,242 MBoe of additional proved reserves which is comprised of 7,651 MBoe of acquired proved reserves and divestiture of 409 MBoe of proved reserves within the year; |
• | well additions extensions and discoveries of approximately 4,110 MBoe, as approximately 900 gross horizontal well locations were converted from probable, possible and contingent resources to proved, due to continuous activity and delineation of additional zones on our mineral and royalty interests; and |
• | net volume revisions of approximately 2,299 MBoe. These revisions were comprised of 902 MBoe of negative revisions attributable to pricing as well as approximately 1,397 MBoe attributable to operator development timing, unit configuration and EUR adjustments to existing proved locations. |
Changes in proved reserves that occurred during 2018 were primarily due to:
• | the acquisition of additional mineral and royalty interests located in the Permian, DJ, Anadarko and Williston Basins in multiple transactions, which included 7,354 MBoe of additional proved reserves; |
• | well additions, extensions and discoveries of approximately 3,208 MBoe, as 555 gross horizontal well locations were converted from probable, possible and contingent resources to proved, due to continuous activity and delineation of additional zones on our mineral and royalty interests; and |
• | net negative volume revisions of approximately 1,508 MBoe. These revisions were comprised of 536 MBoe of positive revisions attributable to pricing and were offset by negative revisions of 1,100 MBoe attributable to operator development timing as well as 944 MBoe of revisions associated with unit configuration and EUR adjustments to existing proved locations. |
Changes in proved reserves that occurred during 2017 were primarily due to:
• | the acquisition of additional mineral and royalty interests located in the Permian, DJ, Anadarko and Williston Basins in multiple transactions, which included 4,820 MBoe of additional proved reserves; |
• | well additions, extensions and discoveries of approximately 3,259 MBoe, as 854 horizontal well locations were converted from probable, possible and contingent resources to proved, due to continuous activity and delineation of additional zones on our mineral and royalty interests; |
• | the divestiture of 1,627 MBoe through one sale of mineral and royalty interests located in the Permian Basin; and |
• | positive volume revisions of approximately 2,581 MBoe attributable primarily to increased recovery in close proximity to our mineral and royalty interests, partially offset by negative revisions of approximately 2,434 MBoe, attributable primarily to operator development timing and revision of existing proved locations. |
Standardized Measure of Discounted Future Net Cash Flows
Guidelines prescribed in FASB’s Accounting Standards Codification (“ASC”) Topic 932 Extractive Industries—Oil and Gas, have been followed for computing a standardized measure of future net cash flows and changes therein relating to estimated proved reserves. Future cash inflows are determined by applying prices and costs, including transportation, quality, and basis differentials, to the year-end estimated quantities of oil, natural gas and NGLs to be produced in the future. The resulting future net cash flows are reduced to present value amounts by applying a ten percent annual discount factor.
The assumptions used to compute the standardized measure are those prescribed by the FASB and the SEC. These assumptions do not necessarily reflect Brigham Resources’ expectations of actual revenues to be derived from those reserves, nor their present value. The limitations inherent in the reserve quantity estimation process, as discussed previously, are equally applicable to the standardized measure computations since these reserve quantity estimates are the basis for the valuation process. Reserve estimates are inherently imprecise and estimates of new discoveries and undeveloped locations are more imprecise than estimates of established proved producing oil and gas properties. Accordingly, these estimates are expected to change as future information becomes available.
The following summary sets forth the future net cash flows relating to proved oil and gas reserves based on
the standardized measure prescribed in ASC Topic 932:
F - 34
For the Year Ended December 31, | ||||||||||||
(In thousands) | 2019 | 2018 | 2017 | |||||||||
Future crude oil, natural gas, and NGL sales | $ | 1,042,118 | $ | 1,049,141 | $ | 595,874 | ||||||
Future severance tax and ad valorem taxes | (73,627 | ) | (70,248 | ) | (40,225 | ) | ||||||
Future income tax expense | (143,599 | ) | (144,421 | ) | (1,151 | ) | ||||||
Future net cash flows | 824,892 | 834,472 | 554,498 | |||||||||
10% annual discount | (359,258 | ) | (391,013 | ) | (238,030 | ) | ||||||
Standardized measure of discounted future net cash flows | $ | 465,634 | $ | 443,459 | $ | 316,468 | ||||||
Standardized measure of discounted future net cash flows attributable to temporary equity | $ | 186,999 | $ | — | $ | — | ||||||
The following prices were used in the determination of standardized measure:
For the Year Ended December 31, | ||||||||||||
2019 | 2018 | 2017 | ||||||||||
Oil (per Bbl) | $ | 51.01 | $ | 61.31 | $ | 47.80 | ||||||
Natural gas (per Mcf) | 1.51 | 2.51 | 2.74 | |||||||||
NGLs (per Bbl) | 14.39 | 23.98 | 18.56 | |||||||||
These prices were based on the 12-month arithmetic average first-of-month West Texas Intermediate (“WTI”) price of oil and Henry Hub price of natural gas. The NGL pricing varied by basin at 13% to 30% of WTI. All prices have been adjusted for transportation, quality, basis differentials and post-production costs.
The principal sources of change in the standardized measure of discounted future net cash flows are:
For the Year Ended December 31, | ||||||||||||
(In thousands) | 2019 | 2018 | 2017 | |||||||||
Standardized measure of discounted future net cash flows, beginning of the year | $ | 443,459 | $ | 316,468 | $ | 185,752 | ||||||
Changes in the year resulting from: | ||||||||||||
Sales, less production costs | (86,492 | ) | (52,278 | ) | (26,711 | ) | ||||||
Revisions of previous quantity estimates | (41,539 | ) | (22,942 | ) | 4,894 | |||||||
Extensions, discoveries, and other additions | 69,057 | 71,668 | 56,511 | |||||||||
Net change in prices and production costs | (99,660 | ) | 71,770 | 30,565 | ||||||||
Accretion of discount | 51,949 | 31,713 | 18,612 | |||||||||
Purchase of reserves in place | 137,819 | 148,580 | 79,190 | |||||||||
Divestitures of reserves in place | (5,783 | ) | — | (26,742 | ) | |||||||
Net change in taxes | (5,739 | ) | (75,369 | ) | (298 | ) | ||||||
Timing differences and other | 2,563 | (46,151 | ) | (5,305 | ) | |||||||
Standardized measure of discounted future net cash flows, end of the year | $ | 465,634 | $ | 443,459 | $ | 316,468 | ||||||
Capitalized oil and natural gas costs
The aggregate amounts of costs capitalized for oil and natural gas producing activities and related aggregate amounts of accumulated depletion follow:
F - 35
For the Year Ended December 31, | ||||||||||||
(In thousands) | 2019 | 2018 | 2017 | |||||||||
Oil and gas properties, at cost, using full cost method of accounting: | ||||||||||||
Not subject to depletion | $ | 291,664 | $ | 228,151 | $ | 168,691 | ||||||
Subject to depletion | 449,061 | 289,851 | 152,354 | |||||||||
Total oil and gas properties, at cost | 740,725 | 518,002 | 321,045 | |||||||||
Less accumulated depreciation, depletion, and amortization | (61,103 | ) | (27,628 | ) | (14,210 | ) | ||||||
Total oil and gas properties, net | $ | 679,622 | $ | 490,374 | $ | 306,835 | ||||||
Costs incurred in oil and natural gas activities
The following costs were incurred in oil and natural gas producing activities:
For the Year Ended December 31, | ||||||||||||
(In thousands) | 2019 | 2018 | 2017 | |||||||||
Acquisition of properties | ||||||||||||
Unevaluated | $ | 78,093 | $ | 59,460 | $ | 50,224 | ||||||
Evaluated | 140,025 | 137,496 | 51,862 | |||||||||
Total | $ | 218,118 | $ | 196,956 | $ | 102,086 | ||||||
F - 36