Attached files
| file | filename |
|---|---|
| 8-K - 8-K - AES CORP | q42019earningsrelease-.htm |

Press Release
Investor Contact: Ahmed Pasha 703-682-6451
Media Contact: Amy Ackerman 703-682-6399
AES Achieves 2019 Strategic and Financial Goals by Accelerating a Greener Energy Future
Reaffirms 7% to 9% average annual growth target through 2022
Announces a target to reduce coal-fired generation to below 30% by year-end 2020 and to less than 10% by year-end 2030
2019 Strategic Accomplishments
• | Upgraded to an investment grade credit rating by Fitch |
• | Signed 2.8 GW of new PPAs for renewables in 2019, bringing backlog to 6.1 GW |
• | Maintained global leadership in energy storage, with Fluence reaching 1.1 GW of projects delivered or awarded in 2019 |
• | Signed contracts to expand LNG import terminal in the Dominican Republic by 50 TBTU |
• | Received approval to develop a 2.2 GW combined cycle plant, co-located with 480 TBTU of LNG storage in Vietnam |
2019 Financial Results and Outlook
• | 2019 Diluted EPS of $0.45, compared to $1.48 in 2018 |
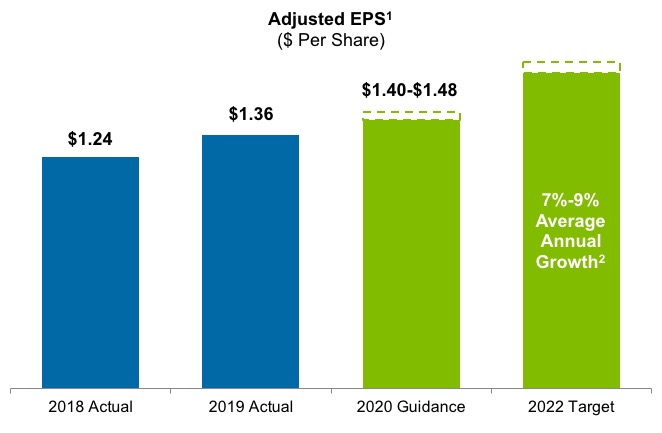
• | 2019 Adjusted EPS of $1.36, compared to $1.24 in 2018 and 2019 guidance of $1.30 to $1.38 |
• | Initiating 2020 guidance for Adjusted EPS of $1.40 to $1.48; reaffirming 7% to 9% average annual growth rate target in Adjusted EPS and Parent Free Cash Flow through 20221 |
ARLINGTON, Va., February 28, 2020 – The AES Corporation (NYSE: AES) today reported financial results for the year ended December 31, 2019.
"In 2019, we achieved our strategic and financial goals, laying the foundation for strong growth in the coming decade," said Andrés Gluski, AES President and Chief Executive Officer. "We are leading the global energy transition by completing 2.2 GW of new projects, adding 2.8 GW to our backlog, and expanding our LNG infrastructure in the Dominican Republic, Panama and Vietnam. At the same time, we are delivering innovative energy solutions through Fluence, Uplight, and a strategic partnership with Google. As a result, today we are announcing that we are accelerating our decarbonization goals for the Company and will aim to reduce our coal-fired generation to below 30% of total MWh by year-end 2020 and to less than 10% by 2030."
"I am very pleased with our strong financial performance in 2019: delivering once again on all key metrics, while attaining an investment grade rating for the first time in our history," said Gustavo Pimenta, AES Executive Vice President and Chief Financial Officer. "With our 2019 results, we are confident in reaffirming our expected 7% to 9% average annual growth in Adjusted EPS and Parent Free Cash Flow through 2022."
Key Full Year 2019 Financial Results
Full year 2019 Diluted Earnings Per Share from Continuing Operations (Diluted EPS) was $0.45, a decrease of $1.03 compared to full year 2018, primarily reflecting lower net gains on asset sales of $1.15, particularly at Masinloc in the Philippines, partially offset by lower tax expense related to the impact of the 2018 Tax Cuts and Jobs Act.
Full year 2019 Adjusted Earnings Per Share (Adjusted EPS, a non-GAAP financial measure) was $1.36, an increase of $0.12, or 10%, primarily reflecting contributions from new businesses, including US renewables and AES Colon in Panama, and a lower effective tax rate, which was partially offset by the impact of asset sales.
Detailed Strategic Highlights
AES is leading the industry's transition to clean energy by investing in sustainable growth and innovative solutions, while delivering superior results. The Company is taking advantage of favorable trends in clean power generation, transmission and distribution, and LNG infrastructure to grow the profitability of its business.
Sustainable Growth: Through its presence in key growth markets, AES is well-positioned to benefit from the global transition toward a more sustainable power generation mix.
• | In 2019, the Company signed 2,798 MW of renewables under long-term Power Purchase Agreements (PPA): |
◦ | 1,130 MW of solar and solar plus storage in the U.S., including: |
▪ | 665 MW at sPower |
▪ | 365 MW at AES Distributed Energy |
◦ | 884 MW of wind and solar at AES Gener in Chile and Colombia |
◦ | 434 MW of wind and solar in Mexico, the Dominican Republic and Panama |
◦ | 331 MW of wind and solar at AES Tiete in Brazil |
• | As of December 31, 2019, the Company's backlog of 6,144 MW includes: |
◦ | 3,008 MW under construction and expected on-line through 2021 |
◦ | 3,136 MW of renewables signed under long-term PPAs |
• | In 2019, the Company completed construction of 2,181 MW of new projects, including: |
◦ | 1,320 MW OPGC 2 plant in India |
◦ | 555 MW of solar and energy storage globally |
◦ | 306 MW Mesa La Paz wind project in Mexico |
• | In the third quarter of 2019, the Company finalized a joint venture in the Dominican Republic to increase its LNG storage capacity by 50 TBTU, in order to meet the demand from new take-or-pay contracts |
• | In the third quarter of 2019, the Company received approval from the Government of Vietnam to develop the 2.2 GW Son My 2 combined cycle gas turbine (CCGT) power plant, which will be co-located with 480 TBTU of previously approved LNG storage |
• | Today, the Company is announcing that it will participate in the proposed $500 million equity raise at AES Gener, by investing $335 million |
◦ | AES Gener has signed contracts for 2.5 GW of renewables under its Green Blend and Extend strategy, which will diversify its portfolio and largely offset the roll-off of legacy contracts through 2024 |
◦ | AES Gener will utilize the equity raised to fund the1.6 GW of new capacity needed to meet the demand under these Green Blend and Extend contracts |
Innovative Solutions: The Company is developing and deploying innovative solutions such as battery-based energy storage, digital customer interfaces and energy management.
• | The Company's joint venture with Siemens, Fluence, is the global leader in the fast-growing energy storage market, which is expected to increase by 15 to 20 GW annually |
◦ | Fluence has been awarded or delivered 1.7 GW of projects, including 961 MW awarded in 2019 |
• | In the third quarter of 2019, the Company announced the merger of Simple Energy into Uplight, which is the market leader in providing cloud-based digital solutions to 100 million households in the U.S. |
• | In the fourth quarter of 2019, the Company formed a 10-year strategic alliance with Google to develop and implement solutions to enable broad adoption of clean energy |
Superior Results: By investing in sustainable growth and offering innovative solutions to customers, the Company is transforming its business mix to deliver superior results.
• | In the fourth quarter of 2019, following the Company's efforts to strengthen its balance sheet, its credit rating was upgraded to investment grade (BBB-) by Fitch and its BB+ credit rating was raised to Positive outlook by S&P |
• | The Company is executing on $100 million in annual run rate cost savings from digital initiatives, including utilizing data and technology for maintenance, outage prevention, inspection and procurement, to be fully realized by 2022 |
• | The Company announced a target to reduce its coal-fired generation below 30% of total generation volume by year-end 2020 and to less than 10% by year-end 2030 |
Guidance and Expectations1
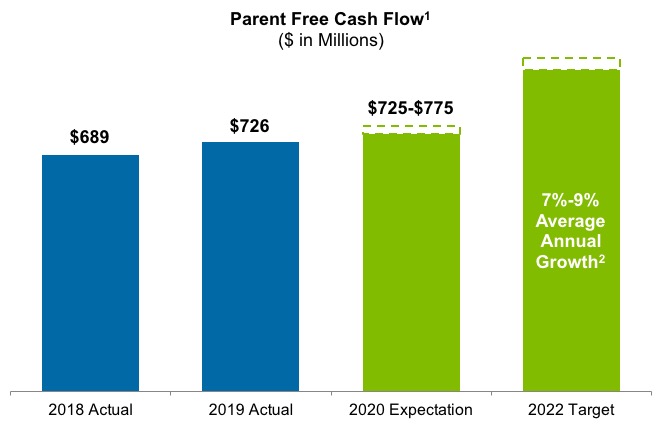
The Company is initiating 2020 guidance for Adjusted EPS of $1.40 to $1.48, compared to 2019 Adjusted EPS of $1.36. The Company also expects 2020 Parent Free Cash Flow of $725 to $775 million, compared to 2019 Parent Free Cash Flow of $726 million. The Company is also reaffirming its average annual growth rate target of 7% to 9% through 2022 for both Adjusted EPS and Parent Free Cash Flow, from a 2018 base.
1 | Adjusted EPS and Parent Free Cash Flow are non-GAAP financial measures. See attached "Non-GAAP Measures" for definition of Adjusted EPS and Parent Free Cash Flow. The Company is not able to provide a corresponding GAAP equivalent or reconciliation for its Adjusted EPS guidance or its Parent Free Cash Flow expectation without unreasonable effort. See "Non-GAAP measures" for description of the adjustments to reconcile Adjusted EPS to Diluted EPS for 2019. |
2 | From a base of 2018 Adjusted EPS of $1.24 and 2018 Parent Free Cash Flow of $689 million. |
The Company's 2020 guidance, expectations and growth rate target through 2022 are based on foreign currency and commodity forward curves as of December 31, 2019.
Non-GAAP Financial Measures
See Non-GAAP Measures for definitions of Adjusted Earnings Per Share, Adjusted Pre-Tax Contributions and Parent Free Cash Flow, as well as reconciliations to the most comparable GAAP financial measures.
Attachments
Condensed Consolidated Statements of Operations, Segment Information, Condensed Consolidated Balance Sheets, Condensed Consolidated Statements of Cash Flows, Non-GAAP Financial Measures and Parent Financial Information.
Conference Call Information
AES will host a conference call on Friday, February 28, 2020 at 9:00 a.m. Eastern Standard Time (EST). Interested parties may listen to the teleconference by dialing 1-888-317-6003 at least ten minutes before the start of the call. International callers should dial +1-412-317-6061. The Conference ID for this call is 7940709. Internet access to the conference call and presentation materials will be available on the AES website at www.aes.com by selecting “Investors” and then “Presentations and Webcasts.”
A webcast replay, as well as a replay in downloadable MP3 format, will be accessible at www.aes.com beginning shortly after the completion of the call.
About AES
The AES Corporation (NYSE: AES) is a Fortune 500 global power company. We provide affordable, sustainable energy to 14 countries through our diverse portfolio of distribution businesses as well as thermal and renewable generation facilities. Our workforce is committed to operational excellence and meeting the world’s changing power needs. Our 2019 revenues were $10 billion and we own and manage $34 billion in total assets. To learn more, please visit www.aes.com. Follow AES on Twitter @TheAESCorp.
Safe Harbor Disclosure
This news release contains forward-looking statements within the meaning of the Securities Act of 1933 and of the Securities Exchange Act of 1934. Such forward-looking statements include, but are not limited to, those related to future earnings, growth and financial and operating performance. Forward-looking statements are not intended to be a guarantee of future results, but instead constitute AES’ current
expectations based on reasonable assumptions. Forecasted financial information is based on certain material assumptions. These assumptions include, but are not limited to, our accurate projections of future interest rates, commodity price and foreign currency pricing, continued normal levels of operating performance and electricity volume at our distribution companies and operational performance at our generation businesses consistent with historical levels, as well as the execution of PPAs, conversion of our backlog and growth investments at normalized investment levels and rates of return consistent with prior experience.
Actual results could differ materially from those projected in our forward-looking statements due to risks, uncertainties and other factors. Important factors that could affect actual results are discussed in AES’ filings with the Securities and Exchange Commission (the “SEC”), including, but not limited to, the risks discussed under Item 1A: “Risk Factors” and Item 7: Management’s Discussion & Analysis in AES’ 2019 Annual Report on Form 10-K and in subsequent reports filed with the SEC. Readers are encouraged to read AES’ filings to learn more about the risk factors associated with AES’ business. AES undertakes no obligation to update or revise any forward-looking statements, whether as a result of new information, future events or otherwise.
Any Stockholder who desires a copy of the Company’s 2019 Annual Report on Form 10-K filed February 28, 2020 with the SEC may obtain a copy (excluding Exhibits) without charge by addressing a request to the Office of the Corporate Secretary, The AES Corporation, 4300 Wilson Boulevard, Arlington, Virginia 22203. Exhibits also may be requested, but a charge equal to the reproduction cost thereof will be made. A copy of the Form 10-K may be obtained by visiting the Company’s website at www.aes.com.
#
THE AES CORPORATION
Consolidated Statements of Operations
Year Ended December 31, | |||||||||||
2019 | 2018 | 2017 | |||||||||
(in millions, except per share amounts) | |||||||||||
Revenue: | |||||||||||
Regulated | $ | 3,028 | $ | 2,939 | $ | 3,109 | |||||
Non-Regulated | 7,161 | 7,797 | 7,421 | ||||||||
Total revenue | 10,189 | 10,736 | 10,530 | ||||||||
Cost of Sales: | |||||||||||
Regulated | (2,484 | ) | (2,473 | ) | (2,650 | ) | |||||
Non-Regulated | (5,356 | ) | (5,690 | ) | (5,415 | ) | |||||
Total cost of sales | (7,840 | ) | (8,163 | ) | (8,065 | ) | |||||
Operating margin | 2,349 | 2,573 | 2,465 | ||||||||
General and administrative expenses | (196 | ) | (192 | ) | (215 | ) | |||||
Interest expense | (1,050 | ) | (1,056 | ) | (1,170 | ) | |||||
Interest income | 318 | 310 | 244 | ||||||||
Loss on extinguishment of debt | (169 | ) | (188 | ) | (68 | ) | |||||
Other expense | (80 | ) | (58 | ) | (58 | ) | |||||
Other income | 145 | 72 | 120 | ||||||||
Gain (loss) on disposal and sale of business interests | 28 | 984 | (52 | ) | |||||||
Asset impairment expense | (185 | ) | (208 | ) | (537 | ) | |||||
Foreign currency transaction gains (losses) | (67 | ) | (72 | ) | 42 | ||||||
Other non-operating expense | (92 | ) | (147 | ) | — | ||||||
INCOME FROM CONTINUING OPERATIONS BEFORE TAXES AND EQUITY IN EARNINGS OF AFFILIATES | 1,001 | 2,018 | 771 | ||||||||
Income tax expense | (352 | ) | (708 | ) | (990 | ) | |||||
Net equity in earnings (losses) of affiliates | (172 | ) | 39 | 71 | |||||||
INCOME (LOSS) FROM CONTINUING OPERATIONS | 477 | 1,349 | (148 | ) | |||||||
Loss from operations of discontinued businesses, net of income tax expense of $0, $2, and $21, respectively | — | (9 | ) | (18 | ) | ||||||
Gain (loss) from disposal of discontinued businesses, net of income tax expense of $0, $44, and $0, respectively | 1 | 225 | (611 | ) | |||||||
NET INCOME (LOSS) | 478 | 1,565 | (777 | ) | |||||||
Less: Income from continuing operations attributable to noncontrolling interests and redeemable stock of subsidiaries | (175 | ) | (364 | ) | (359 | ) | |||||
Less: Loss (income) from discontinued operations attributable to noncontrolling interests | — | 2 | (25 | ) | |||||||
NET INCOME (LOSS) ATTRIBUTABLE TO THE AES CORPORATION | $ | 303 | $ | 1,203 | $ | (1,161 | ) | ||||
AMOUNTS ATTRIBUTABLE TO THE AES CORPORATION COMMON STOCKHOLDERS: | |||||||||||
Income (loss) from continuing operations, net of tax | $ | 302 | $ | 985 | $ | (507 | ) | ||||
Income (loss) from discontinued operations, net of tax | 1 | 218 | (654 | ) | |||||||
NET INCOME (LOSS) ATTRIBUTABLE TO THE AES CORPORATION | $ | 303 | $ | 1,203 | $ | (1,161 | ) | ||||
BASIC EARNINGS PER SHARE: | |||||||||||
Income (loss) from continuing operations attributable to The AES Corporation common stockholders, net of tax | $ | 0.46 | $ | 1.49 | $ | (0.77 | ) | ||||
Income (loss) from discontinued operations attributable to The AES Corporation common stockholders, net of tax | — | 0.33 | (0.99 | ) | |||||||
NET INCOME (LOSS) ATTRIBUTABLE TO THE AES CORPORATION COMMON STOCKHOLDERS | $ | 0.46 | $ | 1.82 | $ | (1.76 | ) | ||||
DILUTED EARNINGS PER SHARE: | |||||||||||
Income (loss) from continuing operations attributable to The AES Corporation common stockholders, net of tax | $ | 0.45 | $ | 1.48 | $ | (0.77 | ) | ||||
Income (loss) from discontinued operations attributable to The AES Corporation common stockholders, net of tax | — | 0.33 | (0.99 | ) | |||||||
NET INCOME (LOSS) ATTRIBUTABLE TO THE AES CORPORATION COMMON STOCKHOLDERS | $ | 0.45 | $ | 1.81 | $ | (1.76 | ) | ||||
DILUTED SHARES OUTSTANDING | 667 | 665 | 660 | ||||||||
THE AES CORPORATION
Consolidated Statements of Operations (Unaudited)
Three Months Ended December 31, | ||||||||
2019 | 2018 | |||||||
(in millions, except per share amounts) | ||||||||
Revenue: | ||||||||
Regulated | $ | 720 | $ | 724 | ||||
Non-Regulated | 1,711 | 1,898 | ||||||
Total revenue | 2,431 | 2,622 | ||||||
Cost of Sales: | ||||||||
Regulated | (611 | ) | (617 | ) | ||||
Non-Regulated | (1,260 | ) | (1,359 | ) | ||||
Total cost of sales | (1,871 | ) | (1,976 | ) | ||||
Operating margin | 560 | 646 | ||||||
General and administrative expenses | (60 | ) | (58 | ) | ||||
Interest expense | (262 | ) | (257 | ) | ||||
Interest income | 76 | 79 | ||||||
Loss on extinguishment of debt | (43 | ) | (1 | ) | ||||
Other expense | (45 | ) | (16 | ) | ||||
Other income | 19 | 42 | ||||||
Gain on disposal and sale of business interests | 19 | 128 | ||||||
Asset impairment expense | (69 | ) | (42 | ) | ||||
Foreign currency transaction gains (losses) | 2 | (28 | ) | |||||
Other non-operating expense | (92 | ) | (147 | ) | ||||
INCOME FROM CONTINUING OPERATIONS BEFORE TAXES AND EQUITY IN EARNINGS OF AFFILIATES | 105 | 346 | ||||||
Income tax expense | (50 | ) | (199 | ) | ||||
Net equity in earnings (losses) of affiliates | (175 | ) | 8 | |||||
INCOME (LOSS) FROM CONTINUING OPERATIONS | (120 | ) | 155 | |||||
Gain (loss) from disposal and impairments of discontinued businesses | — | 26 | ||||||
NET INCOME (LOSS) | (120 | ) | 181 | |||||
Less: Income from continuing operations attributable to noncontrolling interests and redeemable stock of subsidiaries | 42 | (53 | ) | |||||
NET INCOME (LOSS) ATTRIBUTABLE TO THE AES CORPORATION | $ | (78 | ) | $ | 128 | |||
AMOUNTS ATTRIBUTABLE TO THE AES CORPORATION COMMON STOCKHOLDERS: | ||||||||
Income (loss) from continuing operations, net of tax | $ | (78 | ) | $ | 102 | |||
Income from discontinued operations, net of tax | — | 26 | ||||||
NET INCOME (LOSS) ATTRIBUTABLE TO THE AES CORPORATION | $ | (78 | ) | $ | 128 | |||
BASIC EARNINGS PER SHARE: | ||||||||
Income (loss) from continuing operations attributable to The AES Corporation common stockholders, net of tax | $ | (0.12 | ) | $ | 0.15 | |||
Income from discontinued operations attributable to The AES Corporation common stockholders, net of tax | — | 0.04 | ||||||
NET INCOME (LOSS) ATTRIBUTABLE TO THE AES CORPORATION COMMON STOCKHOLDERS | $ | (0.12 | ) | $ | 0.19 | |||
DILUTED EARNINGS PER SHARE: | ||||||||
Income (loss) from continuing operations attributable to The AES Corporation common stockholders, net of tax | $ | (0.12 | ) | $ | 0.15 | |||
Income from discontinued operations attributable to The AES Corporation common stockholders, net of tax | — | 0.04 | ||||||
NET INCOME (LOSS) ATTRIBUTABLE TO THE AES CORPORATION COMMON STOCKHOLDERS | $ | (0.12 | ) | $ | 0.19 | |||
DILUTED SHARES OUTSTANDING | 664 | 665 | ||||||
THE AES CORPORATION | |||||||||||||||
Strategic Business Unit (SBU) Information | |||||||||||||||
(Unaudited) | |||||||||||||||
Three Months Ended December 31, | Year Ended December 31, | ||||||||||||||
(in millions) | 2019 | 2018 | 2019 | 2018 | |||||||||||
REVENUE | |||||||||||||||
US and Utilities SBU | $ | 933 | $ | 978 | $ | 4,058 | $ | 4,230 | |||||||
South America SBU | 770 | 869 | 3,208 | 3,533 | |||||||||||
MCAC SBU | 484 | 452 | 1,882 | 1,728 | |||||||||||
Eurasia SBU | 246 | 320 | 1,047 | 1,255 | |||||||||||
Corporate and Other | 7 | 20 | 46 | 41 | |||||||||||
Eliminations | (9 | ) | (17 | ) | (52 | ) | (51 | ) | |||||||
Total Revenue | $ | 2,431 | $ | 2,622 | $ | 10,189 | $ | 10,736 | |||||||
THE AES CORPORATION
Consolidated Balance Sheets
December 31, 2019 | December 31, 2018 | ||||||
(in millions, except share and per share data) | |||||||
ASSETS | |||||||
CURRENT ASSETS | |||||||
Cash and cash equivalents | $ | 1,029 | $ | 1,166 | |||
Restricted cash | 336 | 370 | |||||
Short-term investments | 400 | 313 | |||||
Accounts receivable, net of allowance for doubtful accounts of $20 and $23, respectively | 1,479 | 1,595 | |||||
Inventory | 487 | 577 | |||||
Prepaid expenses | 80 | 130 | |||||
Other current assets | 802 | 807 | |||||
Current held-for-sale assets | 618 | 57 | |||||
Total current assets | 5,231 | 5,015 | |||||
NONCURRENT ASSETS | |||||||
Property, Plant and Equipment: | |||||||
Land | 447 | 449 | |||||
Electric generation, distribution assets and other | 25,383 | 25,242 | |||||
Accumulated depreciation | (8,505 | ) | (8,227 | ) | |||
Construction in progress | 5,249 | 3,932 | |||||
Property, plant and equipment, net | 22,574 | 21,396 | |||||
Other Assets: | |||||||
Investments in and advances to affiliates | 966 | 1,114 | |||||
Debt service reserves and other deposits | 207 | 467 | |||||
Goodwill | 1,059 | 1,059 | |||||
Other intangible assets, net of accumulated amortization of $307 and $457, respectively | 469 | 436 | |||||
Deferred income taxes | 156 | 97 | |||||
Loan receivable | 1,351 | 1,423 | |||||
Other noncurrent assets | 1,635 | 1,514 | |||||
Total other assets | 5,843 | 6,110 | |||||
TOTAL ASSETS | $ | 33,648 | $ | 32,521 | |||
LIABILITIES AND EQUITY | |||||||
CURRENT LIABILITIES | |||||||
Accounts payable | $ | 1,311 | $ | 1,329 | |||
Accrued interest | 201 | 191 | |||||
Accrued non-income taxes | 253 | 250 | |||||
Accrued and other liabilities | 1,021 | 962 | |||||
Non-recourse debt, including $337 and $479, respectively, related to variable interest entities | 1,868 | 1,659 | |||||
Current held-for-sale liabilities | 442 | 8 | |||||
Total current liabilities | 5,096 | 4,399 | |||||
NONCURRENT LIABILITIES | |||||||
Recourse debt | 3,391 | 3,650 | |||||
Non-recourse debt, including $3,872 and $2,922 respectively, related to variable interest entities | 14,914 | 13,986 | |||||
Deferred income taxes | 1,213 | 1,280 | |||||
Other noncurrent liabilities | 2,917 | 2,723 | |||||
Total noncurrent liabilities | 22,435 | 21,639 | |||||
Commitments and Contingencies | |||||||
Redeemable stock of subsidiaries | 888 | 879 | |||||
EQUITY | |||||||
THE AES CORPORATION STOCKHOLDERS’ EQUITY | |||||||
Common stock ($0.01 par value, 1,200,000,000 shares authorized; 817,843,916 issued and 663,952,656 outstanding at December 31, 2019 and 817,203,691 issued and 662,298,096 outstanding at December 31, 2018) | 8 | 8 | |||||
Additional paid-in capital | 7,776 | 8,154 | |||||
Accumulated deficit | (692 | ) | (1,005 | ) | |||
Accumulated other comprehensive loss | (2,229 | ) | (2,071 | ) | |||
Treasury stock, at cost (153,891,260 and 154,905,595 shares at December 31, 2019 and December 31, 2018, respectively) | (1,867 | ) | (1,878 | ) | |||
Total AES Corporation stockholders’ equity | 2,996 | 3,208 | |||||
NONCONTROLLING INTERESTS | 2,233 | 2,396 | |||||
Total equity | 5,229 | 5,604 | |||||
TOTAL LIABILITIES AND EQUITY | $ | 33,648 | $ | 32,521 | |||
THE AES CORPORATION
Consolidated Statements of Cash Flows
(Unaudited)
Three Months Ended December 31, | Year Ended December 31, | ||||||||||||||
2019 | 2018 | 2019 | 2018 | ||||||||||||
OPERATING ACTIVITIES: | (in millions) | (in millions) | |||||||||||||
Net income (loss) | $ | (120 | ) | $ | 181 | $ | 478 | $ | 1,565 | ||||||
Adjustments to net income (loss): | |||||||||||||||
Depreciation and amortization | 271 | 233 | 1,045 | 1,003 | |||||||||||
Loss (gain) on disposal and sale of business interests | (19 | ) | (128 | ) | (28 | ) | (984 | ) | |||||||
Impairment expenses | 161 | 183 | 277 | 355 | |||||||||||
Deferred income taxes | (12 | ) | 92 | (8 | ) | 313 | |||||||||
Loss on extinguishment of debt | 43 | 1 | 169 | 188 | |||||||||||
Loss on sale and disposal of assets | 33 | 4 | 54 | 27 | |||||||||||
Net loss (gain) from disposal and impairments of discontinued businesses | — | (26 | ) | — | (269 | ) | |||||||||
Loss of affiliates, net of dividends | 176 | 5 | 194 | 48 | |||||||||||
Other | 64 | 119 | 324 | 283 | |||||||||||
Changes in operating assets and liabilities: | |||||||||||||||
(Increase) decrease in accounts receivable | 46 | (81 | ) | 73 | (206 | ) | |||||||||
(Increase) decrease in inventory | 31 | (23 | ) | 28 | (36 | ) | |||||||||
(Increase) decrease in prepaid expenses and other current assets | 59 | (37 | ) | 42 | (22 | ) | |||||||||
(Increase) decrease in other assets | (21 | ) | (10 | ) | (20 | ) | (32 | ) | |||||||
Increase (decrease) in accounts payable and other current liabilities | 6 | 91 | (6 | ) | 62 | ||||||||||
Increase (decrease) in income tax payables, net and other tax payables | 41 | 54 | (83 | ) | (7 | ) | |||||||||
Increase (decrease) in other liabilities | (68 | ) | 4 | (73 | ) | 55 | |||||||||
Net cash provided by operating activities | 691 | 662 | 2,466 | 2,343 | |||||||||||
INVESTING ACTIVITIES: | |||||||||||||||
Capital expenditures | (777 | ) | (529 | ) | (2,405 | ) | (2,121 | ) | |||||||
Acquisitions of business interests, net of cash and restricted cash acquired | (136 | ) | — | (192 | ) | (66 | ) | ||||||||
Proceeds from the sale of business interests, net of cash and restricted cash sold | (48 | ) | 224 | 178 | 2,020 | ||||||||||
Sale of short-term investments | 142 | 292 | 666 | 1,302 | |||||||||||
Purchase of short-term investments | (198 | ) | (196 | ) | (770 | ) | (1,411 | ) | |||||||
Contributions and loans to equity affiliates | (66 | ) | (44 | ) | (324 | ) | (145 | ) | |||||||
Insurance proceeds | 71 | 9 | 150 | 17 | |||||||||||
Other investing | 2 | (71 | ) | (24 | ) | (101 | ) | ||||||||
Net cash used in investing activities | (1,010 | ) | (315 | ) | (2,721 | ) | (505 | ) | |||||||
FINANCING ACTIVITIES: | |||||||||||||||
Borrowings under the revolving credit facilities | 557 | 431 | 2,026 | 1,865 | |||||||||||
Repayments under the revolving credit facilities | (694 | ) | (643 | ) | (1,735 | ) | (2,238 | ) | |||||||
Issuance of recourse debt | — | — | — | 1,000 | |||||||||||
Repayments of recourse debt | (1 | ) | (152 | ) | (450 | ) | (1,933 | ) | |||||||
Issuance of non-recourse debt | 2,248 | 419 | 5,828 | 1,928 | |||||||||||
Repayments of non-recourse debt | (1,853 | ) | (272 | ) | (4,831 | ) | (1,411 | ) | |||||||
Payments for financing fees | (57 | ) | (7 | ) | (126 | ) | (39 | ) | |||||||
Distributions to noncontrolling interests | (172 | ) | (141 | ) | (427 | ) | (340 | ) | |||||||
Contributions from noncontrolling interests and redeemable security holders | 2 | 3 | 17 | 43 | |||||||||||
Dividends paid on AES common stock | (90 | ) | (86 | ) | (362 | ) | (344 | ) | |||||||
Payments for financed capital expenditures | (20 | ) | (89 | ) | (146 | ) | (275 | ) | |||||||
Other financing | 127 | 57 | 120 | 101 | |||||||||||
Net cash provided by (used in) financing activities | 47 | (480 | ) | (86 | ) | (1,643 | ) | ||||||||
Effect of exchange rate changes on cash, cash equivalents and restricted cash | 10 | (4 | ) | (18 | ) | (54 | ) | ||||||||
(Increase) decrease in cash, cash equivalents and restricted cash of discontinued operations and held-for-sale businesses | (7 | ) | 18 | (72 | ) | 74 | |||||||||
Total increase (decrease) in cash, cash equivalents and restricted cash | (269 | ) | (119 | ) | (431 | ) | 215 | ||||||||
Cash, cash equivalents and restricted cash, beginning | 1,841 | 2,122 | 2,003 | 1,788 | |||||||||||
Cash, cash equivalents and restricted cash, ending | $ | 1,572 | $ | 2,003 | $ | 1,572 | $ | 2,003 | |||||||
SUPPLEMENTAL DISCLOSURES: | |||||||||||||||
Cash payments for interest, net of amounts capitalized | $ | 265 | $ | 320 | $ | 946 | $ | 1,003 | |||||||
Cash payments for income taxes, net of refunds | 67 | 57 | 363 | 370 | |||||||||||
SCHEDULE OF NONCASH INVESTING AND FINANCING ACTIVITIES: | |||||||||||||||
Refinancing of non-recourse debt at Mong Duong | $ | — | $ | — | $ | 1,081 | $ | — | |||||||
Partial reinvestment of consideration from the sPower transaction | — | — | 58 | — | |||||||||||
Acquisition of intangible assets | — | 2 | — | 16 | |||||||||||
Contributions to equity affiliates | (1 | ) | — | 61 | 20 | ||||||||||
Exchange of debentures for the acquisition of the Guaimbê Solar Complex | — | — | — | 119 | |||||||||||
Acquisition of the remaining interest in a Distributed Energy equity affiliate | — | 23 | — | 23 | |||||||||||
Dividends declared but not yet paid | 95 | 90 | 95 | 90 | |||||||||||
THE AES CORPORATION
NON-GAAP FINANCIAL MEASURES
(Unaudited)
RECONCILIATION OF ADJUSTED PRE-TAX CONTRIBUTION (PTC) AND ADJUSTED EPS
Adjusted PTC is defined as pre-tax income from continuing operations attributable to The AES Corporation excluding gains or losses of the consolidated entity due to (a) unrealized gains or losses related to derivative transactions and equity securities; (b) unrealized foreign currency gains or losses; (c) gains, losses, benefits and costs associated with dispositions and acquisitions of business interests, including early plant closures, and gains and losses recognized at commencement of sales-type leases; (d) losses due to impairments; (e) gains, losses and costs due to the early retirement of debt; and (f) costs directly associated with a major restructuring program, including, but not limited to, workforce reduction efforts, relocations and office consolidation. Adjusted PTC also includes net equity in earnings of affiliates on an after-tax basis adjusted for the same gains or losses excluded from consolidated entities.
Adjusted EPS is defined as diluted earnings per share from continuing operations excluding gains or losses of both consolidated entities and entities accounted for under the equity method due to (a) unrealized gains or losses related to derivative transactions and equity securities; (b) unrealized foreign currency gains or losses; (c) gains, losses, benefits and costs associated with dispositions and acquisitions of business interests, including early plant closures, the tax impact from the repatriation of sales proceeds, and gains and losses recognized at commencement of sales-type leases; (d) losses due to impairments; (e) gains, losses and costs due to the early retirement of debt; (f) costs directly associated with a major restructuring program, including, but not limited to, workforce reduction efforts, relocations and office consolidation; and (g) tax benefit or expense related to the enactment effects of 2017 U.S. tax law reform and related regulations and any subsequent period adjustments related to enactment effects.
The GAAP measure most comparable to Adjusted PTC is income from continuing operations attributable to The AES Corporation. The GAAP measure most comparable to Adjusted EPS is diluted earnings per share from continuing operations. We believe that Adjusted PTC and Adjusted EPS better reflect the underlying business performance of the Company and are considered in the Company’s internal evaluation of financial performance. Factors in this determination include the variability due to unrealized gains or losses related to derivative transactions or equity securities remeasurement, unrealized foreign currency gains or losses, losses due to impairments and strategic decisions to dispose of or acquire business interests, retire debt or implement restructuring activities, which affect results in a given period or periods. In addition, for Adjusted PTC, earnings before tax represents the business performance of the Company before the application of statutory income tax rates and tax adjustments, including the effects of tax planning, corresponding to the various jurisdictions in which the Company operates. Adjusted PTC and Adjusted EPS should not be construed as alternatives to income from continuing operations attributable to The AES Corporation and diluted earnings per share from continuing operations, which are determined in accordance with GAAP.
For the year ended December 31, 2019, the Company changed the definitions of Adjusted PTC and Adjusted EPS to exclude gains and losses recognized at commencement of sales-type leases. We believe these transactions are economically similar to sales of business interests and excluding these gains or losses better reflects the underlying business performance of the Company.
THE AES CORPORATION
NON-GAAP FINANCIAL MEASURES
(Unaudited)
RECONCILIATION OF ADJUSTED PRE-TAX CONTRIBUTION (PTC) AND ADJUSTED EPS
Three Months Ended December 31, 2019 | Three Months Ended December 31, 2018 | Twelve Months Ended December 31, 2019 | Twelve Months Ended December 31, 2018 | |||||||||||||||||||||||||||||
Net of NCI (1) | Per Share (Diluted) Net of NCI (1) | Net of NCI (1) | Per Share (Diluted) Net of NCI (1) | Net of NCI (1) | Per Share (Diluted) Net of NCI (1) | Net of NCI (1) | Per Share (Diluted) Net of NCI (1) | |||||||||||||||||||||||||
(in millions, except per share amounts) | ||||||||||||||||||||||||||||||||
Income (loss) from continuing operations, net of tax, attributable to AES and Diluted EPS | $ | (78 | ) | $ | (0.12 | ) | $ | 102 | $ | 0.15 | $ | 302 | $ | 0.45 | $ | 985 | $ | 1.48 | ||||||||||||||
Add: Income tax expense from continuing operations attributable to AES | 35 | 152 | 250 | 563 | ||||||||||||||||||||||||||||
Pre-tax contribution | $ | (43 | ) | $ | 254 | $ | 552 | $ | 1,548 | |||||||||||||||||||||||
Adjustments | ||||||||||||||||||||||||||||||||
Unrealized derivative and equity securities losses | $ | 35 | $ | 0.05 | $ | 29 | $ | 0.05 | $ | 113 | $ | 0.17 | (2) | $ | 33 | $ | 0.05 | |||||||||||||||
Unrealized foreign currency losses (gains) | (13 | ) | (0.01 | ) | 9 | 0.02 | 36 | 0.05 | (3) | 51 | 0.09 | (4) | ||||||||||||||||||||
Disposition/acquisition losses (gains) | 15 | 0.02 | (5) | (112 | ) | (0.17 | ) | (6) | 12 | 0.02 | (7) | (934 | ) | (1.41 | ) | (8) | ||||||||||||||||
Impairment expense | 282 | 0.42 | (9) | 135 | 0.20 | (10) | 406 | 0.61 | (11) | 307 | 0.46 | (12) | ||||||||||||||||||||
Loss on extinguishment of debt | 26 | 0.04 | (13) | 3 | — | 121 | 0.18 | (14) | 180 | 0.27 | (15) | |||||||||||||||||||||
Restructuring costs | — | — | (3 | ) | — | — | — | — | — | |||||||||||||||||||||||
U.S. Tax Law Reform Impact | (0.02 | ) | 0.13 | (16) | (0.01 | ) | 0.18 | (17) | ||||||||||||||||||||||||
Less: Net income tax expense (benefit) | (0.03 | ) | (18) | (0.02 | ) | (0.11 | ) | (19) | 0.12 | (20) | ||||||||||||||||||||||
Adjusted PTC and Adjusted EPS | $ | 302 | $ | 0.35 | $ | 315 | $ | 0.36 | $ | 1,240 | $ | 1.36 | $ | 1,185 | $ | 1.24 | ||||||||||||||||
_____________________________
(1) | NCI is defined as Noncontrolling Interests. |
(2) | Amount primarily relates to unrealized derivative losses in Argentina of $89 million, or $0.13 per share, mainly associated with foreign currency derivatives on government receivables. |
(3) | Amount primarily relates to unrealized FX losses in Argentina of $25 million, or $0.04 per share, mainly associated with the devaluation of long-term receivables denominated in Argentine pesos, and unrealized FX losses at the Parent Company of $12 million, or $0.02 per share, mainly associated with intercompany receivables denominated in Euro. |
(4) | Amount primarily relates to unrealized FX losses of $22 million, or $0.03 per share, associated with the devaluation of long-term receivables denominated in Argentine pesos, and unrealized FX losses of $14 million, or $0.02 per share, on intercompany receivables denominated in Euro and British pounds at the Parent Company. |
(5) | Amount primarily relates to losses recognized at commencement of sales-type leases at Distributed Energy of $36 million, or $0.05 per share, partially offset by gain on disposal of Stuart and Killen at DPL of $20 million, or $0.03 per share. |
(6) | Amount primarily relates to gain on sale of CTNG of $86 million, or $0.13 per share, and gain on remeasurement of contingent consideration at AES Oahu of $32 million, or $0.05 per share. |
(7) | Amount primarily relates to losses recognized at commencement of sales-type leases at Distributed Energy of $36 million, or $0.05 per share, and loss on sale of Kilroot and Ballylumford of $31 million, or $0.05 per share; partially offset by gain on sale of a portion of our interest in sPower’s operating assets of $28 million, or $0.04 per share, gain on disposal of Stuart and Killen at DPL of $20 million, or $0.03 per share, and gain on sale of ownership interest in Simple Energy as part of the Uplight merger of $12 million, or $0.02 per share. |
(8) | Amount primarily relates to gain on sale of Masinloc of $772 million, or $1.16 per share, gain on sale of CTNG of $86 million, or $0.13 per share, gain on sale of Electrica Santiago of $36 million, or $0.05 per share, gain on remeasurement of contingent consideration at AES Oahu of $32 million, or $0.05 per share, gain on sale related to the Company's contribution of AES Advancion energy storage to the Fluence joint venture of $23 million, or $0.03 per share, and realized derivative gains associated with the sale of Eletropaulo of $21 million, or $0.03 per share; partially offset by loss on disposal of the Beckjord facility and additional shutdown costs related to Stuart and Killen at DPL of $21 million, or $0.03 per share. |
(9) | Amount primarily relates to asset impairment at Hawaii of $60 million, or $0.09 per share; impairments at our Guacolda and sPower equity affiliates, impacting equity earnings by $105 million, or $0.16 per share, and $15 million, or $0.02 per share, respectively; and other-than-temporary impairment of OPGC of $92 million, or $0.14 per share. |
(10) | Amount primarily relates to asset impairment at Nejapa of $37 million, or $0.06 per share, and other-than-temporary impairment of Guacolda of $96 million, or $0.14 per share. |
(11) | Amount primarily relates to asset impairments at Kilroot and Ballylumford of $115 million, or $0.17 per share, and Hawaii of $60 million, or $0.09 per share; impairments at our Guacolda and sPower equity affiliates, impacting equity earnings by $105 million, or $0.16 per share, and $21 million, or $0.03 per share, respectively; and other-than-temporary impairment of OPGC of $92 million, or $0.14 per share. |
(12) | Amount primarily relates to asset impairments at Shady Point of $157 million, or $0.24 per share, and Nejapa of $37 million, or $0.06 per share, and other-than-temporary impairment of Guacolda of $96 million, or $0.14 per share. |
(13) | Amount primarily relates to losses on early retirement of debt at AES Gener of $22 million, or $0.03 per share. |
(14) | Amount primarily relates to losses on early retirement of debt at DPL of $45 million, or $0.07 per share, AES Gener of $35 million, or $0.05 per share, Mong Duong of $17 million, or $0.03 per share, and Colon of $14 million, or $0.02 per share. |
THE AES CORPORATION
NON-GAAP FINANCIAL MEASURES
(Unaudited)
RECONCILIATION OF ADJUSTED PRE-TAX CONTRIBUTION (PTC) AND ADJUSTED EPS
(15) | Amount primarily relates to loss on early retirement of debt at the Parent Company of $171 million, or $0.26 per share. |
(16) | Amount relates to a SAB 118 charge to finalize the provisional estimate of one-time transition tax on foreign earnings of $161 million, or $0.24 per share, partially offset by a SAB 118 income tax benefit to finalize the provisional estimate of remeasurement of deferred tax assets and liabilities to the lower corporate tax rate of $77 million, or $0.11 per share. |
(17) | Amount relates to a SAB 118 charge to finalize the provisional estimate of one-time transition tax on foreign earnings of $194 million, or $0.29 per share, partially offset by a SAB 118 income tax benefit to finalize the provisional estimate of remeasurement of deferred tax assets and liabilities to the lower corporate tax rate of $77 million, or $0.11 per share. |
(18) | Amount primarily relates to income tax benefits associated with the impairments at OPGC of $23 million, or $0.03 per share, Guacolda of $13 million, or $0.02 per share, and Hawaii of $13 million, or $0.02 per share; partially offset by an adjustment to income tax expense related to 2018 gains on sales of business interests, primarily Masinloc, of $25 million, or $0.04 per share. |
(19) | Amount primarily relates to the income tax benefits associated with the impairments at OPGC of $23 million, or $0.03 per share, Guacolda of $13 million, or $0.02 per share, Hawaii of $13 million, or $0.02 per share, and Kilroot and Ballylumford of $11 million, or $0.02 per share, and income tax benefits associated with losses on early retirement of debt of $24 million, or $0.04 per share; partially offset by an adjustment to income tax expense related to 2018 gains on sales of business interests, primarily Masinloc, of $25 million, or $0.04 per share. |
(20) | Amount primarily relates to the income tax expense under the GILTI provision associated with the gains on sales of business interests, primarily Masinloc, of $97 million, or $0.15 per share, and income tax expense associated with gains on sale of CTNG of $36 million, or $0.05 per share, and Electrica Santiago of $13 million, or $0.02 per share; partially offset by income tax benefits associated with the loss on early retirement of debt at the Parent Company of $36 million, or $0.05 per share, and income tax benefits associated with the impairment at Shady Point of $33 million, or $0.05 per share. |
Reconciliation of Parent Free Cash Flow1
$ in Millions | 2019 | 2018 | ||||
Net Cash Provided by Operating Activities at the Parent Company 2 | $ | 583 | $ | 409 | ||
Subsidiary Distributions to QHCs Excluded from Schedule 1 3 | $ | 183 | $ | 117 | ||
Subsidiary Distributions Classified in Investing Activities 4 | $ | 60 | $ | 267 | ||
Parent-Funded SBU Overhead and Other Expenses Classified in Investing Activities 5 | $ | (97 | ) | $ | (84 | ) |
Other | $ | (3 | ) | $ | (20 | ) |
Parent Free Cash Flow 1 | $ | 726 | $ | 689 | ||
1 | Parent Free Cash Flow (a non-GAAP financial measure) should not be construed as an alternative to Net Cash Provided by Operating Activities which is determined in accordance with GAAP. Parent Free Cash Flow is equal to Subsidiary Distributions less cash used for interest costs, development, general and administrative activities, and tax payments by the Parent Company. Parent Free Cash Flow is used for dividends, share repurchases, growth investments, recourse debt repayments, and other uses by the Parent Company. |
2 | Refer to Part IV—Item 15—Schedule I—Condensed Financial Information of Registrant of the Company's 2019 10-K filed with the SEC on February 27, 2020. |
3 | Subsidiary distributions received by Qualified Holding Companies ("QHCs") excluded from Schedule 1. Subsidiary Distributions should not be construed as an alternative to Net Cash Provided by Operating Activities which is determined in accordance with GAAP. Subsidiary Distributions are important to the Parent Company because the Parent Company is a holding company that does not derive any significant direct revenues from its own activities but instead relies on its subsidiaries’ business activities and the resultant distributions to fund the debt service, investment and other cash needs of the holding company. The reconciliation of the difference between the Subsidiary Distributions and Net Cash Provided by Operating Activities consists of cash generated from operating activities that is retained at the subsidiaries for a variety of reasons which are both discretionary and non-discretionary in nature. These factors include, but are not limited to, retention of cash to fund capital expenditures at the subsidiary, cash retention associated with non-recourse debt covenant restrictions and related debt service requirements at the subsidiaries, retention of cash related to sufficiency of local GAAP statutory retained earnings at the subsidiaries, retention of cash for working capital needs at the subsidiaries, and other similar timing differences between when the cash is generated at the subsidiaries and when it reaches the Parent Company and related holding companies. |
4 | Subsidiary distributions that originated from the results of operations of an underlying investee but were classified as investing activities when received by the relevant holding company included in Schedule 1. |
5 | Net cash payments for parent-funded SBU overhead, business development, taxes, transaction costs, and capitalized interest that are classified as investing activities or excluded from Schedule 1. |
The AES Corporation | ||||||||||||
Parent Financial Information | ||||||||||||
Parent only data: last four quarters | ||||||||||||
(in millions) | 4 Quarters Ended | |||||||||||
Total subsidiary distributions & returns of capital to Parent | December 31, 2019 | September 30, 2019 | June 30, 2019 | March 31, 2019 | ||||||||
Actual | Actual | Actual | Actual | |||||||||
Subsidiary distributions1 to Parent & QHCs | $ | 1,191 | $ | 1,185 | $ | 1,034 | $ | 1,035 | ||||
Returns of capital distributions to Parent & QHCs | 217 | 197 | — | — | ||||||||
Total subsidiary distributions & returns of capital to Parent | $ | 1,408 | $ | 1,382 | $ | 1,034 | $ | 1,035 | ||||
Parent only data: quarterly | ||||||||||||
(in millions) | Quarter Ended | |||||||||||
Total subsidiary distributions & returns of capital to Parent | December 31, 2019 | September 30, 2019 | June 30, 2019 | March 31, 2019 | ||||||||
Actual | Actual | Actual | Actual | |||||||||
Subsidiary distributions1 to Parent & QHCs | $ | 396 | $ | 326 | $ | 269 | $ | 200 | ||||
Returns of capital distributions to Parent & QHCs | 19 | 198 | — | — | ||||||||
Total subsidiary distributions & returns of capital to Parent | $ | 415 | $ | 524 | $ | 269 | $ | 200 | ||||
(in millions) | Balance at | |||||||||||
December 31, 2019 | September 30, 2019 | June 30, 2019 | March 31, 2019 | |||||||||
Parent Company Liquidity2 | Actual | Actual | Actual | Actual | ||||||||
Cash at Parent & Cash at QHCs3 | $ | 13 | $ | 28 | $ | 169 | $ | 34 | ||||
Availability under credit facilities | 801 | 723 | 719 | 775 | ||||||||
Ending liquidity | $ | 814 | $ | 751 | $ | 888 | $ | 809 | ||||
1 | See definition on "Reconciliation of Parent Free Cash Flow". |
2 | Parent Company Liquidity is defined as cash available to the Parent Company plus available borrowings under existing credit facility plus cash at qualified holding companies (QHCs). AES believes that unconsolidated Parent Company liquidity is important to the liquidity position of AES as a Parent Company because of the non-recourse nature of most of AES’ indebtedness. |
3 | The cash held at QHCs represents cash sent to subsidiaries of the company domiciled outside of the US. Such subsidiaries had no contractual restrictions on their ability to send cash to AES, the Parent Company. Cash at those subsidiaries was used for investment and related activities outside of the US. These investments included equity investments and loans to other foreign subsidiaries as well as development and general costs and expenses incurred outside the US. Since the cash held by these QHCs is available to the Parent, AES uses the combined measure of subsidiary distributions to Parent and QHCs as a useful measure of cash available to the Parent to meet its international liquidity needs. |