Attached files
| file | filename |
|---|---|
| 8-K - 8-K - Verso Corp | vrs-8k_20200227.htm |
| EX-99.1 - EX-99.1 - Verso Corp | d893188dex991.htm |

Earnings Conference Call and Webcast – February 27, 2020 Verso Fourth Quarter and Full Year 2019 Results Exhibit 99.2
Forward Looking Statements & Non-GAAP Financial Information In this presentation, all statements that are not purely historical facts are forward-looking statements within the meaning of Section 27A of the Securities Act of 1933 and Section 21E of the Securities Exchange Act of 1934. Forward-looking statements may be identified by the words "believe," "expect," "anticipate," "project," "plan," "estimate," "intend," “potential,” “will,” “may” and other similar expressions. Forward-looking statements are based on currently available business, economic, financial, and other information and reflect management's current beliefs, expectations, and views with respect to future developments and their potential effects on Verso. Actual results could vary materially depending on risks and uncertainties that may affect Verso and its business. Verso’s actual actions and results may differ materially from what is expressed or implied by these statements due to a variety of factors, including, without limitation, the long-term structural decline and general softening of demand facing the paper industry; adverse developments in general business and economic conditions; developments in alternative media, which are expected to adversely affect the demand for some of Verso's key products, and the effectiveness of Verso's responses to these developments; intense competition in the paper manufacturing industry; Verso's ability to compete with respect to certain specialty paper products for a period of two years after the closing of the sale of Verso's Androscoggin and Stevens Point mills and related assets (the "Pixelle Sale"); Verso's business being less diversified following the sale of two mills after the closing of the Pixelle Sale; Verso's dependence on a small number of customers for a significant portion of its business; Verso's limited ability to control the pricing of its products or pass through increases in its costs to its customers; changes in the costs of raw materials and purchased energy; negative publicity, even if unjustified; any failure to comply with environmental or other laws or regulations, even if inadvertent; legal proceedings or disputes; any labor disputes, and those risks and uncertainties listed under the caption “Risk Factors” in Verso’s Annual Report on Form 10-K for the fiscal year ended December 31, 2018, Verso’s Quarterly Report on Form 10-Q for the nine months ended September 30, 2019, and from time to time in Verso’s other filings with the Securities and Exchange Commission (the “SEC”). Verso assumes no obligation to update any forward-looking statement made in this presentation to reflect subsequent events or circumstances or actual outcomes. Non-GAAP Financial Information This presentation contains certain non-GAAP financial information relating to Verso, including EBITDA, Adjusted EBITDA and Adjusted EBITDA Margin. Definitions and reconciliations of these non-GAAP measures are included in this presentation. Because EBITDA, Adjusted EBITDA and Adjusted EBITDA Margin are not measurements determined in accordance with GAAP and are susceptible to varying calculations, EBITDA, Adjusted EBITDA and Adjusted EBITDA Margin as presented may not be comparable to similarly titled measures of other companies. You should consider our EBITDA, Adjusted EBITDA and Adjusted EBITDA Margin in addition to, and not as a substitute for or superior to, our operating or net income, which are determined in accordance with GAAP. See the Appendix in this presentation for additional information on EBITDA, Adjusted EBITDA and Adjusted EBITDA Margin.

ADAM ST. JOHN|CEO BUSINESS UPDATE
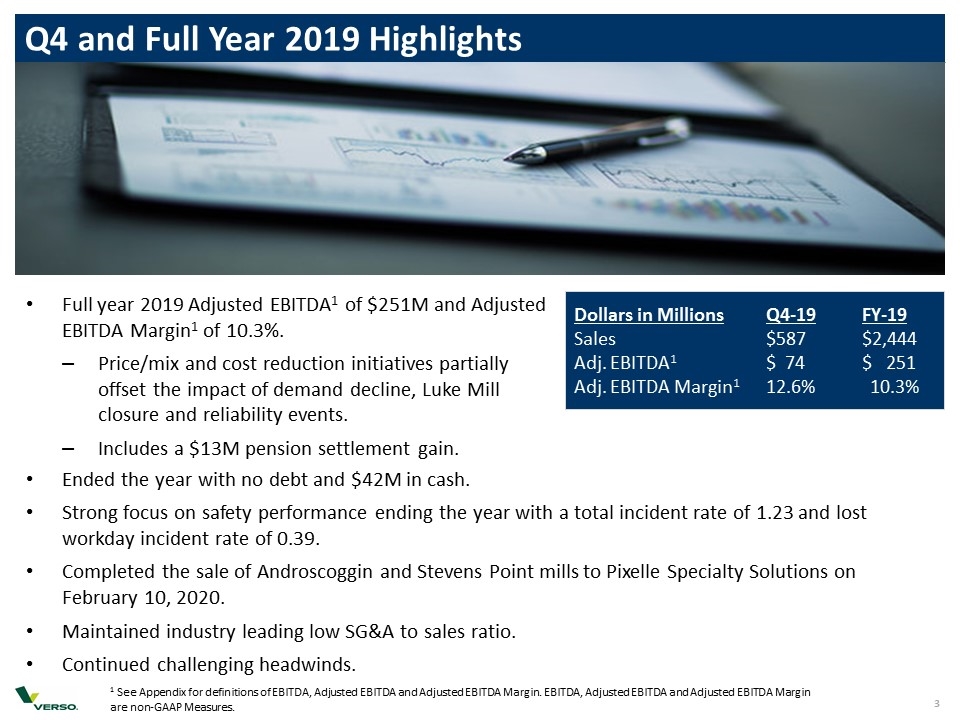
Q4 and Full Year 2019 Highlights 1 See Appendix for definitions of EBITDA, Adjusted EBITDA and Adjusted EBITDA Margin. EBITDA, Adjusted EBITDA and Adjusted EBITDA Margin are non-GAAP Measures. Ended the year with no debt and $42M in cash. Strong focus on safety performance ending the year with a total incident rate of 1.23 and lost workday incident rate of 0.39. Completed the sale of Androscoggin and Stevens Point mills to Pixelle Specialty Solutions on February 10, 2020. Maintained industry leading low SG&A to sales ratio. Continued challenging headwinds. Dollars in MillionsQ4-19FY-19 Sales$587$2,444 Adj. EBITDA1$ 74 $ 251 Adj. EBITDA Margin1 12.6% 10.3% Full year 2019 Adjusted EBITDA1 of $251M and Adjusted EBITDA Margin1 of 10.3%. Price/mix and cost reduction initiatives partially offset the impact of demand decline, Luke Mill closure and reliability events. Includes a $13M pension settlement gain.
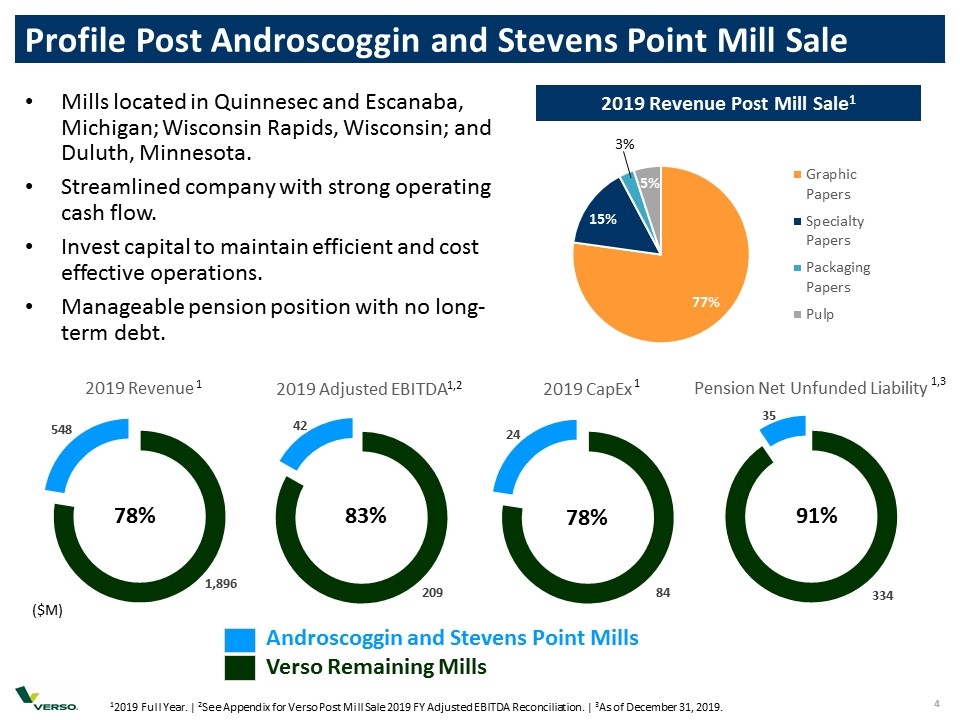
Androscoggin and Stevens Point Mills Verso Remaining Mills Mills located in Quinnesec and Escanaba, Michigan; Wisconsin Rapids, Wisconsin; and Duluth, Minnesota. Streamlined company with strong operating cash flow. Invest capital to maintain efficient and cost effective operations. Manageable pension position with no long- term debt. 1 1,3 1,2 ($M) Profile Post Androscoggin and Stevens Point Mill Sale 12019 Full Year. | 2See Appendix for Verso Post Mill Sale 2019 FY Adjusted EBITDA Reconciliation. | 3As of December 31, 2019. 2019 Revenue Post Mill Sale1 3% 1
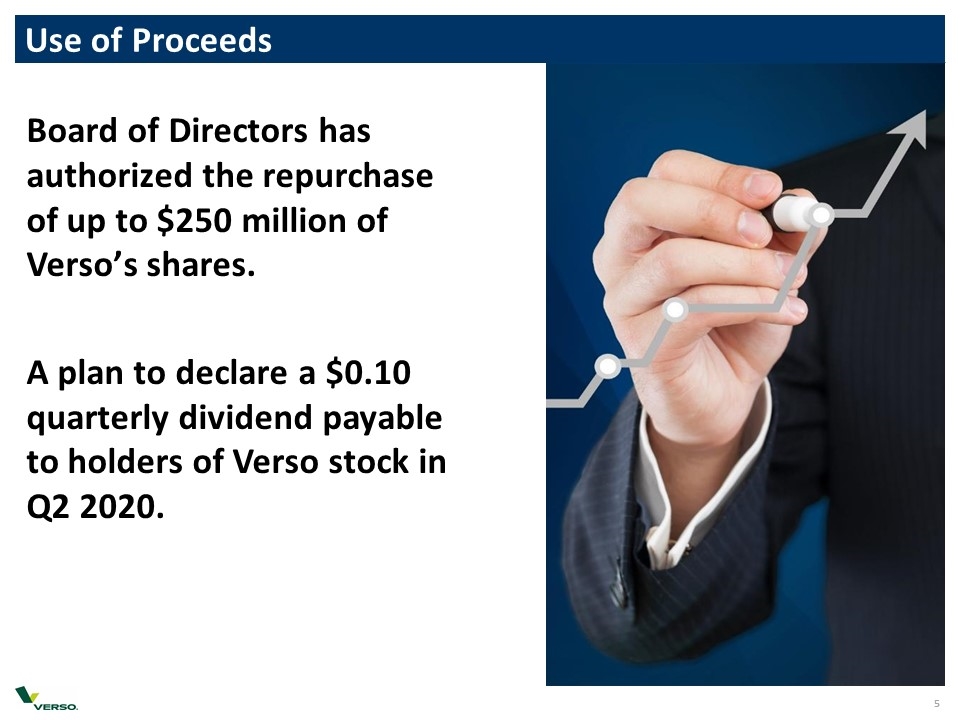
Use of Proceeds Board of Directors has authorized the repurchase of up to $250 million of Verso’s shares. A plan to declare a $0.10 quarterly dividend payable to holders of Verso stock in Q2 2020.

ALLEN CAMPBELL | CFO FINANCIAL UPDATE
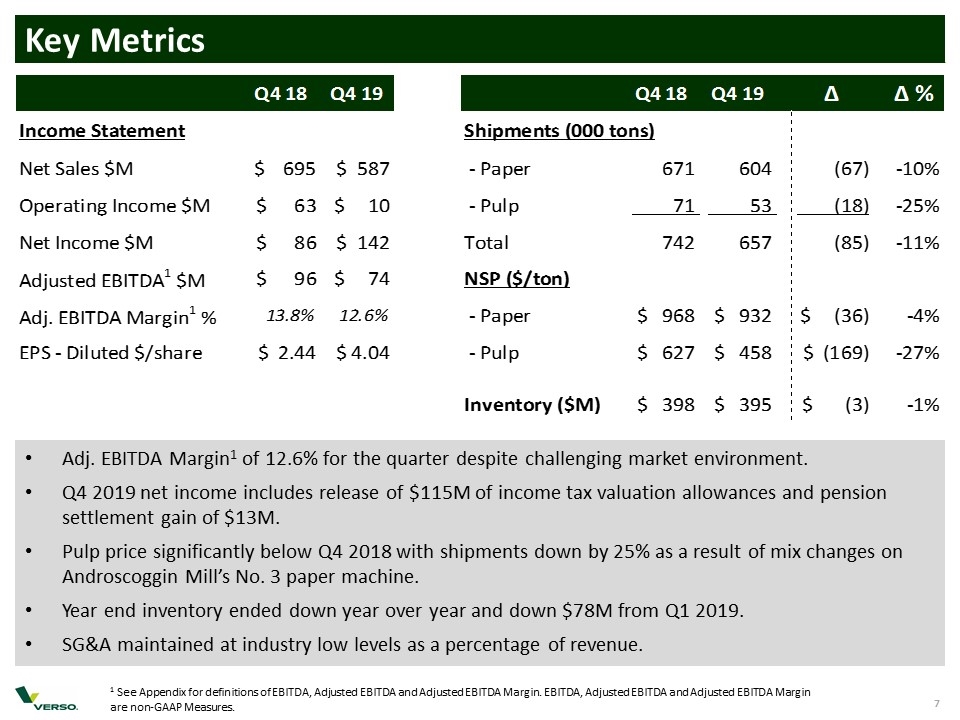
Key Metrics Adj. EBITDA Margin1 of 12.6% for the quarter despite challenging market environment. Q4 2019 net income includes release of $115M of income tax valuation allowances and pension settlement gain of $13M. Pulp price significantly below Q4 2018 with shipments down by 25% as a result of mix changes on Androscoggin Mill’s No. 3 paper machine. Year end inventory ended down year over year and down $78M from Q1 2019. SG&A maintained at industry low levels as a percentage of revenue. 1 See Appendix for definitions of EBITDA, Adjusted EBITDA and Adjusted EBITDA Margin. EBITDA, Adjusted EBITDA and Adjusted EBITDA Margin are non-GAAP Measures. Q4 18 Q4 19 Q4 18 Q4 19 Δ Δ % Income Statement Shipments (000 tons) Net Sales $M $695 $587 - Paper 671 604 -67 -9.9850968703427717E-2 Operating Income $M $63 $10 - Pulp 71 53 -18 -0.25352112676056338 Net Income $M $86 $142 Total 742 657 -85 -0.11455525606469003 Adjusted EBITDA1 $M $96 $74 NSP ($/ton) Adj. EBITDA Margin1 % 0.13800000000000001 0.126 - Paper $968 $932 $-36 -3.71900826446281E-2 EPS - Diluted $/share $2.44 $4.04 - Pulp $627 $458 $-,169 -0.26953748006379585 Inventory ($M) $398 $395 $-3 -7.537688442211055E-3
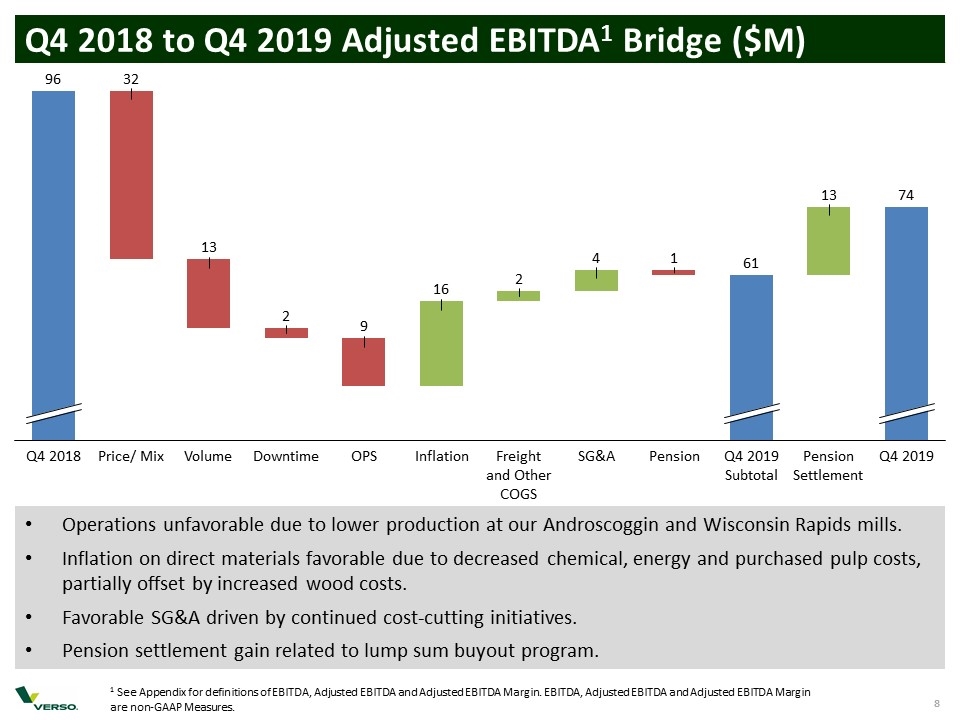
Q4 2018 to Q4 2019 Adjusted EBITDA1 Bridge ($M) Operations unfavorable due to lower production at our Androscoggin and Wisconsin Rapids mills. Inflation on direct materials favorable due to decreased chemical, energy and purchased pulp costs, partially offset by increased wood costs. Favorable SG&A driven by continued cost-cutting initiatives. Pension settlement gain related to lump sum buyout program. 1 See Appendix for definitions of EBITDA, Adjusted EBITDA and Adjusted EBITDA Margin. EBITDA, Adjusted EBITDA and Adjusted EBITDA Margin are non-GAAP Measures.
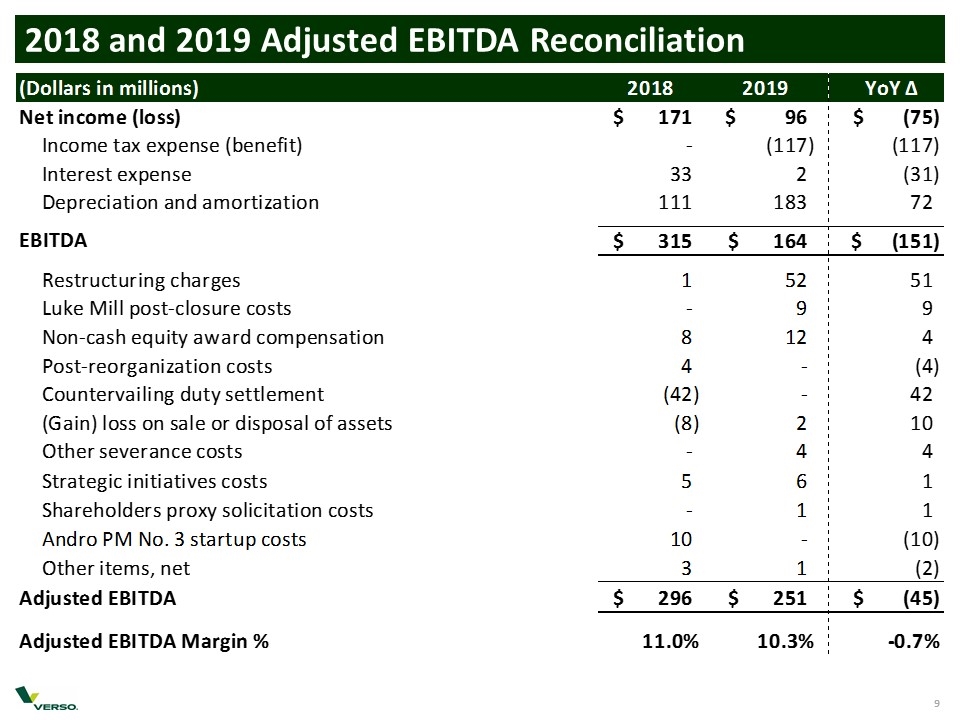
2018 and 2019 Adjusted EBITDA Reconciliation
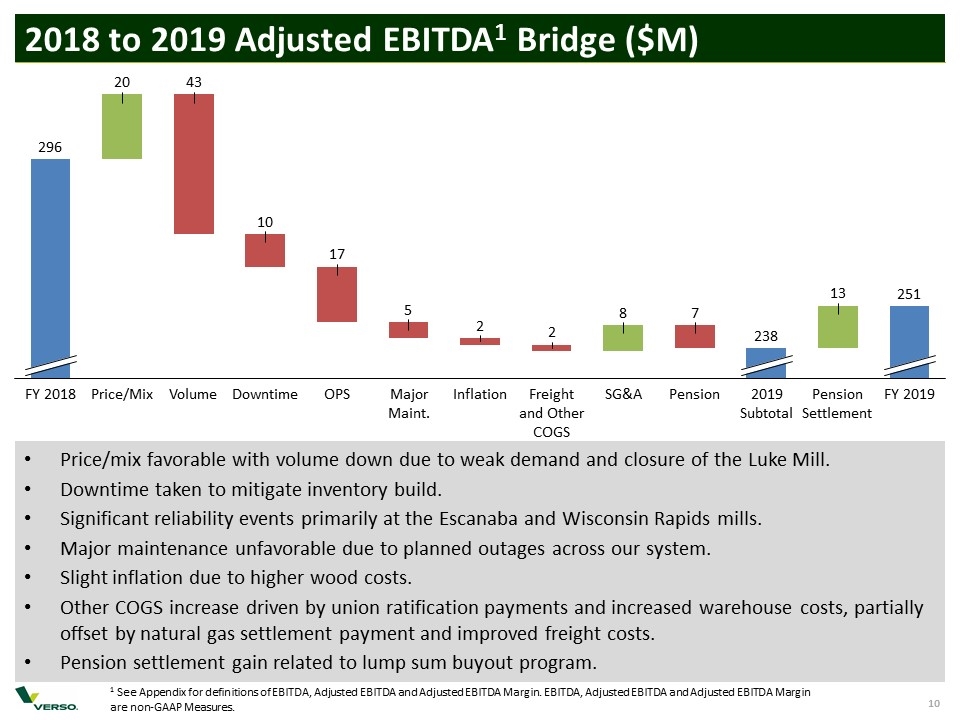
2018 to 2019 Adjusted EBITDA1 Bridge ($M) Price/mix favorable with volume down due to weak demand and closure of the Luke Mill. Downtime taken to mitigate inventory build. Significant reliability events primarily at the Escanaba and Wisconsin Rapids mills. Major maintenance unfavorable due to planned outages across our system. Slight inflation due to higher wood costs. Other COGS increase driven by union ratification payments and increased warehouse costs, partially offset by natural gas settlement payment and improved freight costs. Pension settlement gain related to lump sum buyout program. 1 See Appendix for definitions of EBITDA, Adjusted EBITDA and Adjusted EBITDA Margin. EBITDA, Adjusted EBITDA and Adjusted EBITDA Margin are non-GAAP Measures.
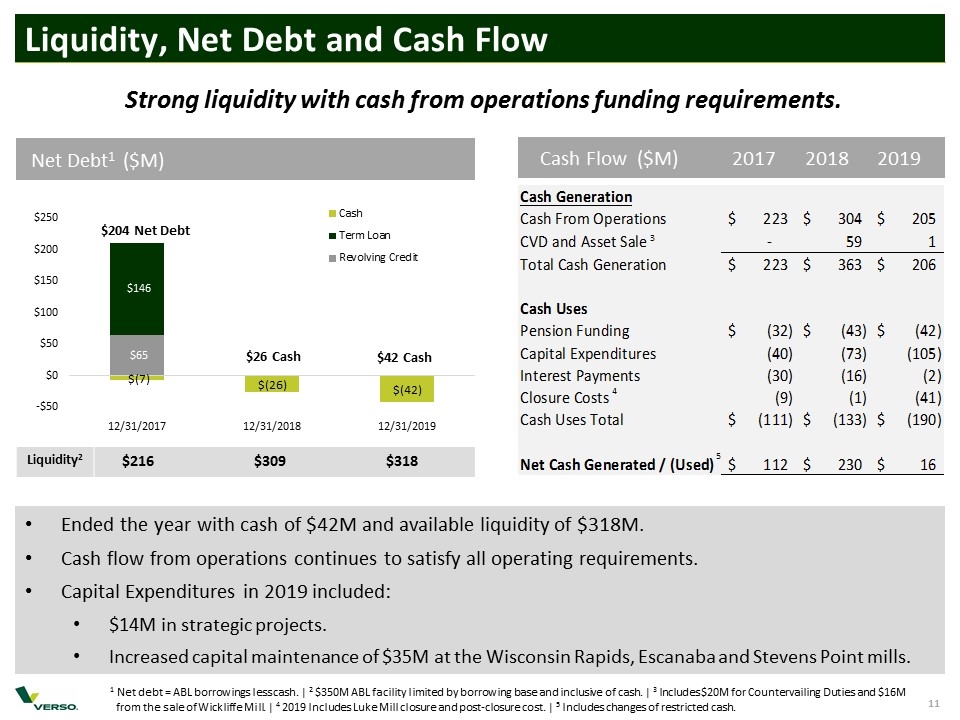
Liquidity, Net Debt and Cash Flow Ended the year with cash of $42M and available liquidity of $318M. Cash flow from operations continues to satisfy all operating requirements. Capital Expenditures in 2019 included: $14M in strategic projects. Increased capital maintenance of $35M at the Wisconsin Rapids, Escanaba and Stevens Point mills. Net Debt1 ($M) Liquidity2 $216 $309 $318 Strong liquidity with cash from operations funding requirements. $204 Net Debt $26 Cash $42 Cash Cash Flow ($M) 2017 2018 2019 1 Net debt = ABL borrowings less cash. | 2 $350M ABL facility limited by borrowing base and inclusive of cash. | 3 Includes $20M for Countervailing Duties and $16M from the sale of Wickliffe Mill. | 4 2019 Includes Luke Mill closure and post-closure cost. | 5 Includes changes of restricted cash. 3 4 5 VERSO CORPORATION UNAUDITED CONDENSED CONSOLIDATED STATEMENTS OF CASH FLOWS Three Months Six Months Nine Months Three Months Twelve Months Twelve Months Twelve Months Ended Ended Ended Ended Ended Ended Ended (Dollars in millions) September 30, 2018 June 30, 2019 September 30, 2019 September 30, 2018 2017 2018 2019 Cash Flows From Operating Activities: Net income (loss) 86 -76 -46 30 -30 171 75 Adjustments to reconcile net income (loss) to net cash provided by (used in) operating activities: Depreciation and amortization 28 132 157 25 115 111 183 Noncash restructuring charges 0 18 20 2 0 0 20 Noncash postretirement Gain -4 0 0 Net periodic pension cost (income) -2 0 -1 -1 6 -7 -1 Pension plan contributions -21 -16 -34 -18 -32 -43 -42 Amortization of debt issuance cost and discount 12 1 1 0 9 19 1 Extinguishment of NMTC obligation -7 0 0 Equity award expense 2 8 10 2 1 8 12 (Gain) loss on sale or disposal of assets -8 1 0 -1 3 -8 2 Deferred Taxes -8 0 -94 Prepayment premium on Term Loan Facility 1 0 0 0 1 1 0 Changes in assets and liabilities: Accounts receivable, net -37 8 -5 -13 -13 11 44 Inventories -4 -69 -27 42 60 -12 -7 Prepaid expenses and other assets 2 2 4 2 6 4 5 Accounts payable -2 -14 -14 0 67 40 -34 Accrued and other liabilities 14 -19 -26 -7 -21 -12 -39 Net cash provided by (used in) operating activities 71 -24 39 63 153 283 125 Cash Flows From Investing Activities: Proceeds from sale of assets 17 0 1 1 0 17 1 Capital expenditures -23 -39 -76 -37 -40 -73 -,105 Grant proceeds from Maine Technology Institute 1 0 0 0 0 4 0 Net cash provided by (used in) investing activities 5 39 75 36 -40 -52 -,104 Cash Flows From Financing Activities: Borrowings on ABL Facility 151 278 389 111 186 442 428 Payments on ABL Facility -,122 -,231 -,368 -,137 -,233 -,507 -,428 Payments on Term Loan Facility -95 0 0 0 -65 -,146 0 Prepayment premium on Term Loan Facility -1 0 0 0 -1 -1 0 Principal payment on finance lease obligations 0 0 -1 -1 0 0 -1 Acquisition of treasury stock 0 -3 -3 0 0 0 -3 Debt issuance costs 0 -1 -1 0 0 0 -1 Net cash provided by (used in) financing activities -67 43 16 -27 -,113 -,212 -5 Change in Cash and cash equivalents and restricted cash -1 -19 -20 -1 0 19 16 Cash and cash equivalents and restricted cash at beginning of period 0 28 28 0 9 9 28 Cash and cash equivalents and restricted cash at end of period -1 9 8 -1 9 28 44 Supplementary cash flow disclosures: Total interest paid 30 16 2 Total income taxes paid (received) Noncash investing and financing activities: Right-of-use assets recorded upon adoption of ASC 842 24 24 0 0 24 Right-of-use assets obtained in exchange for new finance lease liabilities 7 7 0 0 8 Right-of-use assets obtained in exchange for new capitalized operating lease liabilities 2 2 0 0 2 Cash Flow ($M) FY 2017 FY 2018 FY 2019 Cash Generation Cash From Operations $113 $81 $223 $304 $205 CVD and Asset Sale 0 59 1 Total Cash Generation $113 $81 $223 $363 $206 Cash Uses Pension Funding $-21 $-18 $-32 $-43 $-42 Capital Expenditures -23 -37 -40 -73 -,105 Interest Payments -4 0 -30 -16 -2 Closure Costs -9 -1 -41 Cash Uses Total -48 -55 $-,111 $-,133 $-,190 Net Cash Generated / (Used) $65 $26 $112 $230 $16 0 19 16 Computed Countervailing Duties 42 Asset Sale 0 17 1 Total 0 59 1 Cash Restructuring Total Restructuring 9 1 52 Non cash 0 0 -20 Luke Post Closure cost 0 0 7 Total 9 1 39 186 442 428 Borrowings on ther ABL -233 -507 -428 Payments against the ABL -65 -146 0 Payments Against the term loan -112 -211 0
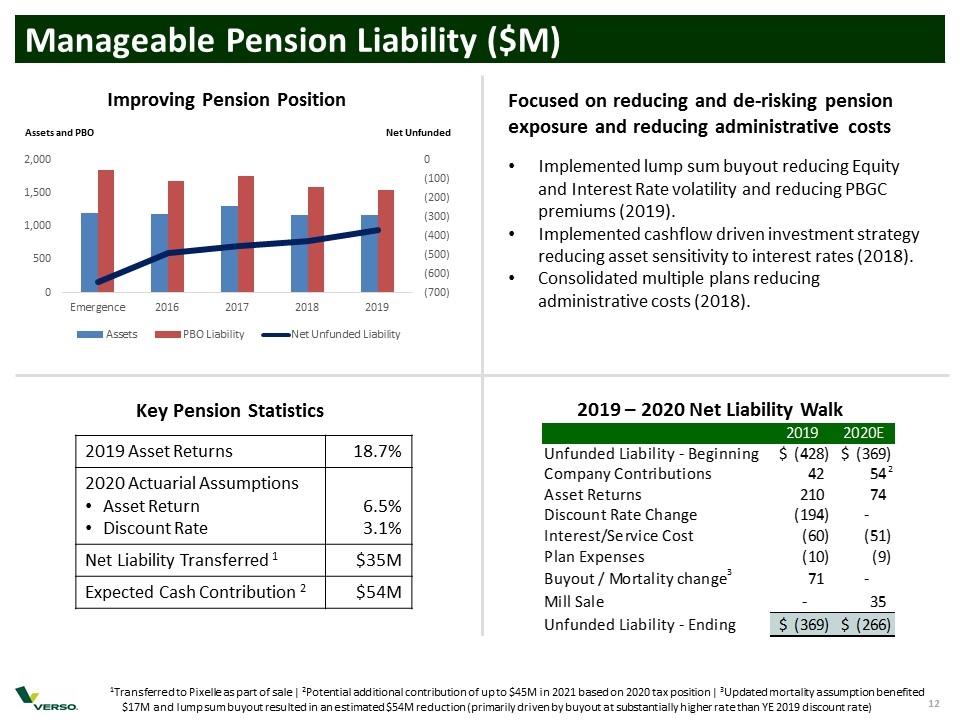
Manageable Pension Liability ($M) 1Transferred to Pixelle as part of sale | 2Potential additional contribution of up to $45M in 2021 based on 2020 tax position | 3Updated mortality assumption benefited $17M and lump sum buyout resulted in an estimated $54M reduction (primarily driven by buyout at substantially higher rate than YE 2019 discount rate) Improving Pension Position Assets and PBO Net Unfunded Focused on reducing and de-risking pension exposure and reducing administrative costs Implemented lump sum buyout reducing Equity and Interest Rate volatility and reducing PBGC premiums (2019). Implemented cashflow driven investment strategy reducing asset sensitivity to interest rates (2018). Consolidated multiple plans reducing administrative costs (2018). Key Pension Statistics 2019 Asset Returns 18.7% 2020 Actuarial Assumptions Asset Return Discount Rate 0 6.5% 3.1% Net Liability Transferred 1 $35M Expected Cash Contribution 2 $54M 2019 – 2020 Net Liability Walk 2 3 Pension Projections 2020 Plan Actual Variance F'Cast Buyout Mortality Adjusted Liability Voluntary Adj Beg. 2020 Assumptions 2018 F/(UnF) Mar E Apr E May E Jun E Jul E Aug E Sep E Oct E Nov E Dec E 2019 Impact Table 2019 Transfer Contribution 2020 Jan E Feb E Mar E Apr E May E Jun E Jul E Aug E Sep E Oct E Nov E Dec E 2020P 2021P 2022P 2023P 2024P 2025P 2026P 2027P 2028P 2029P 2030P Asset Return (annual) -0.06 9.4% 0.23759999999999998 -0.38880000000000003 0.42599999999999993 7.7% 7.7% 7.7% 7.7% 7.7% 0.37 0.18659999999999999 6.5% 6.5% 6.5% 6.5% 6.5% 6.5% 6.5% 6.5% 6.5% 6.5% 6.5% 6.5% 6.5% 6.5% 6.5% 6.5% 6.5% 6.5% 6.5% 6.5% 6.5% 6.5% 6.5% Discount Rate (annual) 4.1700000000000001E-2 3.7700000000000004E-2 3.8500000000000006E-2 3.620000000000001E-2 3.570000000000001E-2 3.570000000000001E-2 3.570000000000001E-2 3.570000000000001E-2 3.1099999999999999E-2 3.1099999999999999E-2 3.1099999999999999E-2 3.1099999999999999E-2 3.1099999999999999E-2 3.1099999999999999E-2 3.1099999999999999E-2 3.1099999999999999E-2 3.1099999999999999E-2 3.1099999999999999E-2 3.1099999999999999E-2 3.1099999999999999E-2 3.1099999999999999E-2 3.1099999999999999E-2 3.1099999999999999E-2 3.1099999999999999E-2 3.1099999999999999E-2 3.1099999999999999E-2 3.1099999999999999E-2 3.1099999999999999E-2 3.1099999999999999E-2 3.1099999999999999E-2 3.1099999999999999E-2 3.1099999999999999E-2 3.1099999999999999E-2 3.1099999999999999E-2 3.1099999999999999E-2 Duration 11.341193508548447 Years 11.3 Assets F'Cast F/(UnF) Mar E Apr E May E Jun E Jul E Aug E Sep E Oct E Nov E Dec E F'Cast Jan E Feb E Mar E Apr E May E Jun E Jul E Aug E Sep E Oct E Nov E Dec E 2020P 2021P 2022P 2023P 2024P 2025P 2026P 2027P 2028P 2029P 2030P Beginning Balance 1,295.8 -0.20000000000004547 1,246.6949685700802 1,249.2108559915935 1,275.368976068937 1,226.5173687910972 1,262.8504020498478 1,271.3086960618052 1,271.5163301221658 1,281.5251753812117 1,286.168420478785 1,286.3102736264912 1,161.6875487272455 1,161.6875487272455 -50 1,122.7631737299746 1,122.7631737299746 1,128.7531409210119 1,127.2755537676674 1,125.7899630172421 1,132.5963253169189 1,131.1395554123856 1,129.6748946708692 1,136.5023003503363 1,135.666878105674 1,155.2232990362079 1,155.890919059873 1,153.754157820478 1,122.7631737299746 1,152.4119928420059 1,162.1187723767366 1,158.7564925812244 1,147.5756645990041 1,127.2680827979393 1,105.6405081798052 1,082.6071412114925 1,058.766053902396 1,031.9515847406051 1,004.1284377487444 Contributions 42.8 -5.2000000000000028 0 8.3000000000000007 0 0 8.3000000000000007 0 9.8000000000000007 8.3000000000000007 0 0 42.2 42.2 0 September 0 7.5 0 0 8.3000000000000007 0 0 8.3000000000000007 0 21.6 8.3000000000000007 0 0 54 32.4 17.8 9 0 0 0 0 Distributions -94.3 -0.29999999999999716 -7.0666666666666664 -7.0666666666666664 -7.0666666666666664 -7.0666666666666664 -7.0666666666666664 -7.0666666666666664 -7.0666666666666664 -7.0666666666666664 -7.0666666666666664 -7.0666666666666664 -84.799999999999969 -,146 -,230.79999999999995 0 -7.45 -7.45 -7.45 -7.45 -7.45 -7.45 -7.45 -7.45 -7.45 -7.45 -7.45 -7.45 -89.40000000000002 -91 -92 -93 -93 -93 -93 -93 -93 -93 -93 PBGC Prem and Expenses -9.6950000000000038 0.30499999999999616 -0.14166666666666666 -0.14166666666666666 -0.14166666666666666 -0.14166666666666666 -0.14166666666666666 -0.14166666666666666 -0.14166666666666666 -8.7416666666666671 -0.14166666666666666 -0.14166666666666666 -10.300000000000002 -10.300000000000002 0 -0.14166666666666666 -0.14166666666666666 -0.14166666666666666 -0.14166666666666666 -0.14166666666666666 -0.14166666666666666 -0.14166666666666666 -0.14166666666666666 -0.14166666666666666 -7.2416666666666707 -0.14166666666666666 -0.141666666666667 -8.800000000000006 -6.6000000000000005 -4.7 -2.5 -1.9 -1.9 -1.9 -1.9 -1.9 -1.9 -1.9 Asset Return -72.917451272754619 -,158.41745127275462 9.7242207548466251 24.734374948633548 -41.311195482463361 43.541366592083939 7.3666273452907802 7.4159673936938644 7.417178592379301 12 7.5017649119459584 39.661233436816808 209.97562500272866 209.97562500272866 0 6.0816338577040296 6.1140795133221486 6.1060759162415321 6.0980289663433949 6.1348967621333115 6.1270059251504216 6.1190723461338754 6.1560541268976552 6.1482778923072408 6.2574595364461265 6.2567325811574319 6.2495016881942567 73.848819112031435 74.90677953473039 75.537720204487883 75.319172017779593 74.592418198935263 73.272425381866057 71.866633031687343 70.369464178747009 68.77497935036557 67.076853008139338 65.268348453668395 Ending Balance 1,161.6875487272455 -,163.81245127275466 1,249.2108559915935 1,275.368976068937 1,226.5173687910972 1,262.8504020498478 1,271.3086960618052 1,271.5163301221658 1,281.5251753812117 1,286.168420478785 1,286.3102736264912 1,318.7631737299746 1,318.7631737299746 -,146 1,172.7631737299746 -50 0 1,122.7631737299746 1,128.7531409210119 1,127.2755537676674 1,125.7899630172421 1,132.5963253169189 1,131.1395554123856 1,129.6748946708692 1,136.5023003503363 1,135.666878105674 1,155.2232990362079 1,155.890919059873 1,153.754157820478 1,152.4119928420055 1,152.4119928420059 1,162.1187723767366 1,158.7564925812244 1,147.5756645990041 1,127.2680827979393 1,105.6405081798052 1,082.6071412114925 1,058.766053902396 1,031.9515847406051 1,004.1284377487444 974.49678620241286 Liabilities F'Cast F/(UnF) Mar E Apr E May E Jun E Jul E Aug E Sep E Oct E Nov E Dec E F'Cast Adj 2019 Adj Beg 2020 Jan E Feb E Mar E Apr E May E Jun E Jul E Aug E Sep E Oct E Nov E Dec E 2020P 2021P 2022P 2023P 2024P 2025P 2026P 2027P 2028P 2029P 2030P Beginning Balance 1,752.9 9.9999999999909051E-2 1,601.3563655965709 1,653.995123482136 1,637.4161570358156 1,676.5588249327068 1,683.2562536747287 1,680.7712743627442 1,678.2789022373065 1,675.7791153047958 1,759.4004051863451 1,756.4675179031196 1,589.8383430237263 1,589.8383430237263 -85 1,456.767517903121 1,456.767517903121 1,453.503070536865 1,449.3234624328006 1,445.586959072939 1,441.8407719418697 1,438.848759424855 1,434.3192459126362 1,430.5438566249597 1,426.7586827867126 1,422.9636990396014 1,419.1588799596122 1,415.3442000568409 1,456.767517903121 1,418.1196337753224 1,375.623154385735 1,330.3050344871315 1,281.8775210596814 1,231.1439119646375 1,178.8324876267377 1,124.8941779919294 1,069.2783869274786 1,011.9329447609231 952.80405934298778 Distributions -94.3 0.29999999999999716 -8 -8 -8 -8 -8 -8 -8 -8 -8 -7.0666666666666664 -84.799999999999969 -,200 -17 -,301.79999999999995 0 -8 -8 -8 -8 -8 -8 -8 -8 -8 -8 -8 -8 -89.40000000000002 -91 -92 -93 -93 -93 -93 -93 -93 -93 -93 Interest Cost 66.626772434116404 -5.626772434116404 5.0309279152492277 5.3065676878385206 4.9395387403913782 4.9877625041748042 5.0076873546823188 5.0002945412291657 4.9928797341559887 4.3430608738315959 4.5597793834412776 0.3 55.303546655539165 55.303546655539165 0 3.7754558172322548 3.7658220457808045 3.7561633068050084 3.7464795355973668 3.7367706672826788 3.7270366368176084 3.7172773789902487 3.7074928284196873 3.6976829195555632 3.6878475866776337 3.6779867638953281 3.6681003851473126 44.664115872201499 44.103520610412524 42.781880101396361 41.372486572549789 39.866390904956091 38.288575662100222 36.661690365191539 34.984208935549006 33.254557833444579 31.471114582064708 29.63220624556692 Service Cost 6.0880000000000001 -8.8000000000000078E-2 0.5073333333333333 0.5073333333333333 0.5073333333333333 0.5073333333333333 0.5073333333333333 0.5073333333333333 0.5073333333333333 0.5073333333333333 0.5073333333333333 -1.2 4.3806666666666665 4.3806666666666665 0 0.50733333333333297 0.50733333333333297 0.50733333333333297 0.50733333333333297 0.50733333333333297 0.50733333333333297 0.50733333333333297 0.50733333333333297 0.50733333333333297 0.50733333333333297 0.50733333333333297 0.50733333333333297 6.0879999999999974 4.4000000000000004 3.9 3.2 2.4 2.4 2.4 2.4 2.4 2.4 2.4 Rate Change Impact -,141.47642941039021 141.47642941039021 55.100496636982598 -14.392867467492124 41.695795823166691 9.2023329045139235 0 0 0 86.770895674384519 0 0 194.0449615571888 194.0449615571888 0 0 0 0 0 0 0 0 0 0 0 0 0 0 0 0 0 0 0 0 0 0 0 0 Ending Balance 1,589.8383430237263 136.16165697627372 1,653.995123482136 1,637.4161570358156 1,676.5588249327068 1,683.2562536747287 1,680.7712743627442 1,678.2789022373065 1,675.7791153047958 1,759.4004051863451 1,756.4675179031196 1,748.5008512364529 1,758.767517903121 -,200 -17 1,541.767517903121 -85 0 1,456.767517903121 1,453.503070536865 1,449.3234624328006 1,445.586959072939 1,441.8407719418697 1,438.848759424855 1,434.3192459126362 1,430.5438566249597 1,426.7586827867126 1,422.9636990396014 1,419.1588799596122 1,415.3442000568409 1,411.5196337753214 1,418.1196337753224 1,375.623154385735 1,330.3050344871315 1,281.8775210596814 1,231.1439119646375 1,178.8324876267377 1,124.8941779919294 1,069.2783869274786 1,011.9329447609231 952.80405934298778 891.83626558855474 Net Liability (GAAP) 428.15079429648085 -27.150794296480854 404.78426749054256 362.37925942892184 450.04145614160961 420.40585162488082 409.46257830093896 406.76257211514076 394.25393992358408 473.38356313846657 470.15724427662849 429.73767750647835 440.00434417314636 -54 -17 369.00434417314636 -35 0 334.00434417314636 324.29716613267465 322.04790866513326 319.79699605569681 309.2444466249508 306.94532053009993 304.64435124176703 294.04155627462342 291.69199497614522 267.74040000339346 264.06978805362496 261.59004223636293 259.10764093331591 265.7076409333165 213.50438200899839 171.54854190590709 134.3018564606773 103.87582916669817 73.191979446932464 42.287036780436893 11.201781537238958 -20.018639979682007 -51.324378405756647 -82.660520613858125 Percent Funded 0.73069539039914122 -3.6975525012214461E-2 0.75526876606603588 0.77868835734164832 0.73156834735001131 0.75024251316037605 0.75638411689527207 0.75763112342478522 0.76473394594616606 0.73094040347891776 0.73232795967789677 0.75422506817620982 0.74982233882864824 0.76066148761843788 0.77072227375448754 0.77681628464038255 0.77779431782291641 0.77877706073055342 0.78552108343526683 0.7865596630178483 0.78760352542859013 0.79445470691940401 0.79555618024596908 0.81184312700028882 0.81392514130543292 0.81517567088920329 0.8164335552029881 0.81263383243207143 0.84479442547306083 0.87104570947365945 0.8952303521559104 0.91562657447500595 0.93791146730755204 0.96240798680643513 0.98952398021489352 1.0197825755978442 1.0538666663963918 1.0926857583654186 Changes Since Plan Document 2019 2020E 2021P 2022P 2023P 2024P 2025P 2026P 2027P 2028P 2029P 2030P 43846 Change the assumed asset return to 6.5% from 7.0% 2020 forward Unfunded Liability - Beginning $-,428.15079429648085 $-,369.434417314682 $-,265.7076409333169 $-,213.50438200899902 $-,171.54854190590748 $-,134.3018564606777 $-,103.87582916669854 $-73.191979446932706 $-42.2870367804369 $-11.201781537238896 $20.018639979682099 $51.32437840575674 43846 Change the Discount rate from 3.05 to 3.11 YR 2019 forward Company Contributions 42.2 54 32.4 17.8 9 0 0 0 0 0 0 0 Asset Returns 209.97562500272866 73.848819112031435 74.90677953473039 75.537720204487883 75.319172017779593 74.592418198935263 73.272425381866057 71.866633031687343 70.369464178747009 68.77497935036557 67.076853008139338 65.268348453668395 0 Discount Rate Change -,194.449615571888 0 0 0 0 0 0 0 0 0 0 0 Interest/Service Cost -59.684213322205835 -50.7521158722015 -48.503520610412522 -46.681880101396359 -44.572486572549792 -42.26639090495609 -40.68857566210022 -39.061690365191538 -37.384208935549005 -35.654557833444578 -33.871114582064706 -32.032206245566918 Plan Expenses -10.300000000000002 -8.8000000000000025 -6.6000000000000005 -4.7 -2.5 -1.9 -1.9 -1.9 -1.9 -1.9 -1.9 -1.9 Buyout / Mortality change 71 0 0 0 0 0 0 0 0 0 0 0 Mill Sale 0 35 0 0 0 0 0 0 0 0 0 0 Unfunded Liability - Ending $-,369.434417314682 $0 $-,265.7076409333169 $-,213.50438200899902 $-,171.54854190590748 $-,134.3018564606777 $-,103.87582916669854 $-73.191979446932706 $-42.2870367804369 $-11.201781537238896 $20.018639979682099 $51.32437840575674 $82.66052061385821 Assets $1,172.7631737299746 $1,152.4119928420059 Liabilities $1,541.767517903121 $1,418.1196337753224 Original plan Data ($ millions) 2019E 2020P 2021P 2022P 2023P Unfunded Liability - Beginning $-,428.15079429648085 $-,428.94681297739214 $-,278.57992893978513 $-,216.45467285724027 $-,138.3809103901132 Company Contributions 43.2 97.2 36 47 47 Asset Returns 177.46562771582754 77.532745460934166 80.84901453328051 82.007445550610157 84.037966739152864 Discount Rate Change -,205.71873673096457 0 0 0 0 Interest/Service Cost -65.442909665774252 -50.565861423327107 -48.123758450735664 -46.233683083483101 -44.037160417529343 Plan Expenses -10.300000000000002 -8.8000000000000025 -6.6000000000000005 -4.7 -2.5 Buyout / Mortality change 60 0 0 0 0 Mill Sale 0 35 0 0 0 Unfunded Liability - Ending $-,428.94681297739214 $0 $-,278.57992893978513 $-,216.45467285724027 $-,138.3809103901132 $-53.880104068489679
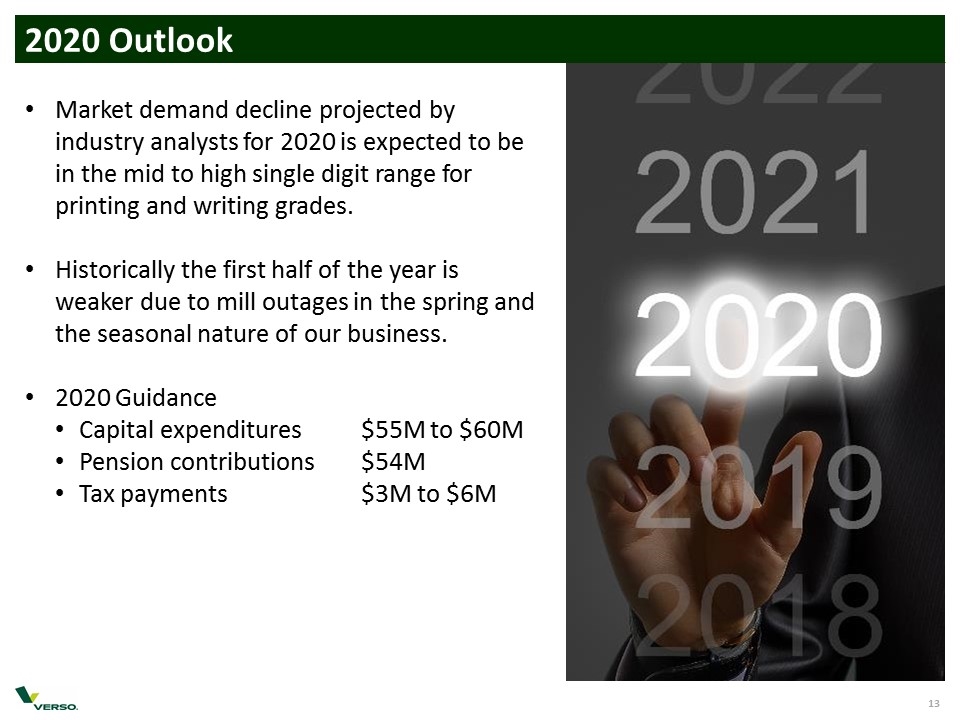
2020 Outlook Market demand decline projected by industry analysts for 2020 is expected to be in the mid to high single digit range for printing and writing grades. Historically the first half of the year is weaker due to mill outages in the spring and the seasonal nature of our business. 2020 Guidance Capital expenditures $55M to $60M Pension contributions $54M Tax payments$3M to $6M
APPENDIX
EBITDA and Adjusted EBITDA Definitions EBITDA consists of earnings before interest, taxes, depreciation and amortization. Adjusted EBITDA reflects adjustments to EBITDA to eliminate the impact of certain items that we do not consider to be indicative of our ongoing performance. We use EBITDA, Adjusted EBITDA and Adjusted EBITDA Margin as a way of evaluating our performance relative to that of our peers and to assess compliance with our credit facilities. We believe that EBITDA, Adjusted EBITDA and Adjusted EBITDA Margin are non-GAAP operating performance measures commonly used in our industry that provide investors and analysts with measures of ongoing operating results, unaffected by differences in capital structures, capital investment cycles and ages of related assets among otherwise comparable companies. We believe that the supplemental adjustments applied in calculating Adjusted EBITDA and Adjusted EBITDA Margin are reasonable and appropriate to provide additional information to investors.
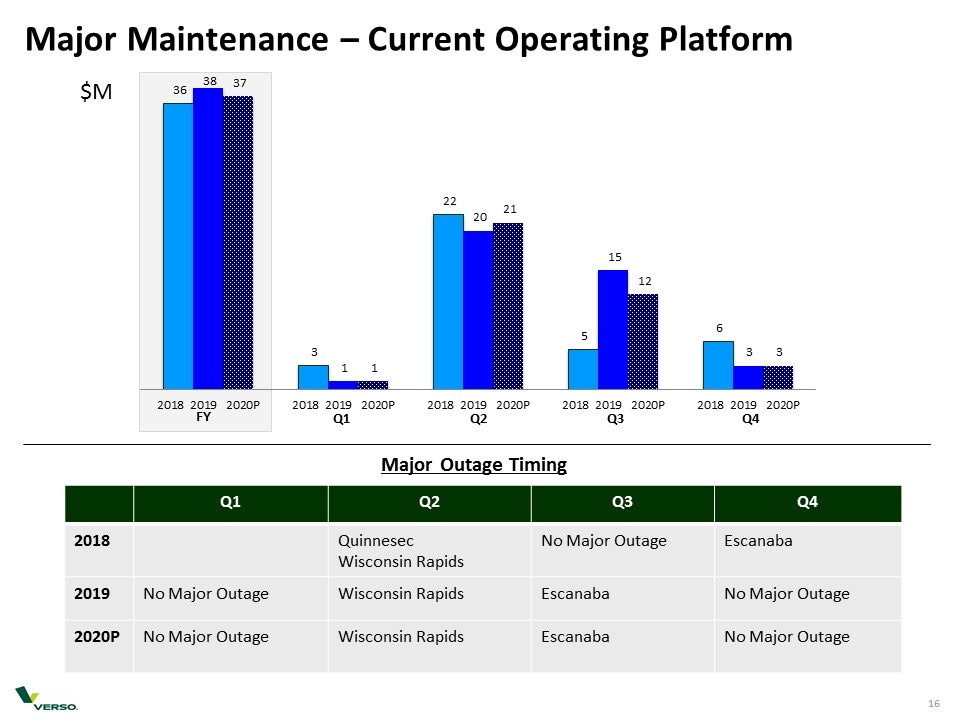
Major Maintenance – Current Operating Platform Major Outage Timing Q1 Q2 Q3 Q4 2018 Quinnesec Wisconsin Rapids No Major Outage Escanaba 2019 No Major Outage Wisconsin Rapids Escanaba No Major Outage 2020P No Major Outage Wisconsin Rapids Escanaba No Major Outage $M
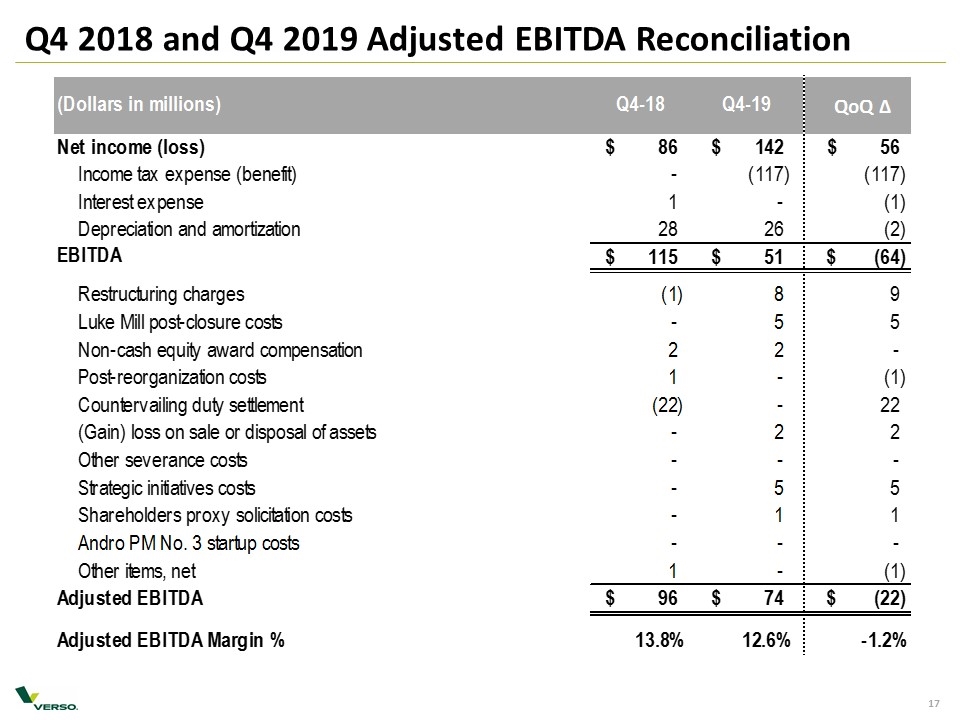
Q4 2018 and Q4 2019 Adjusted EBITDA Reconciliation
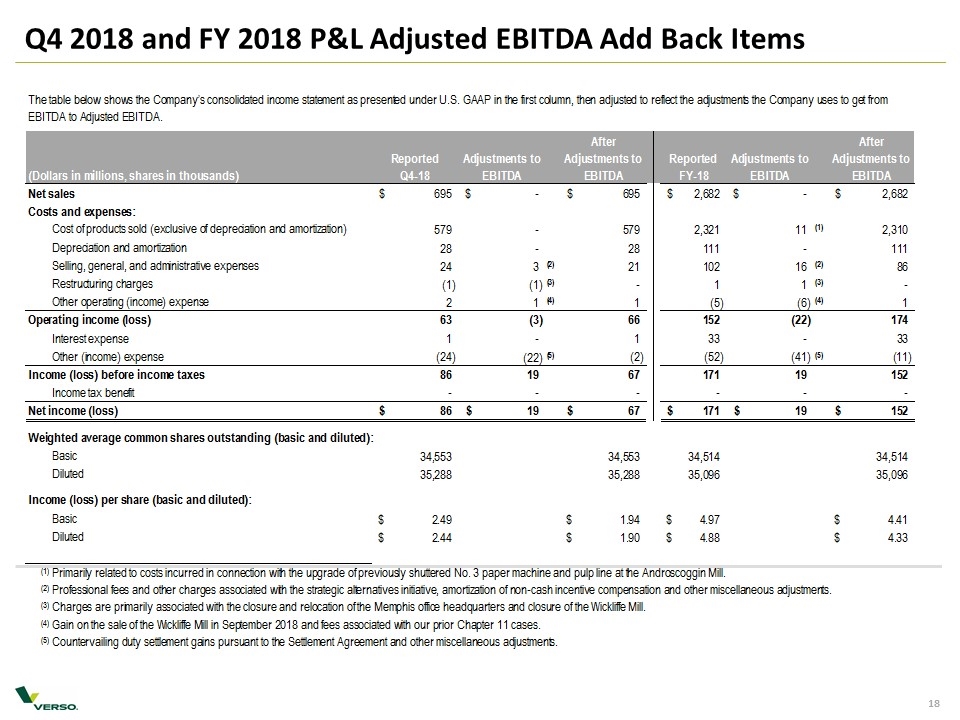
Q4 2018 and FY 2018 P&L Adjusted EBITDA Add Back Items
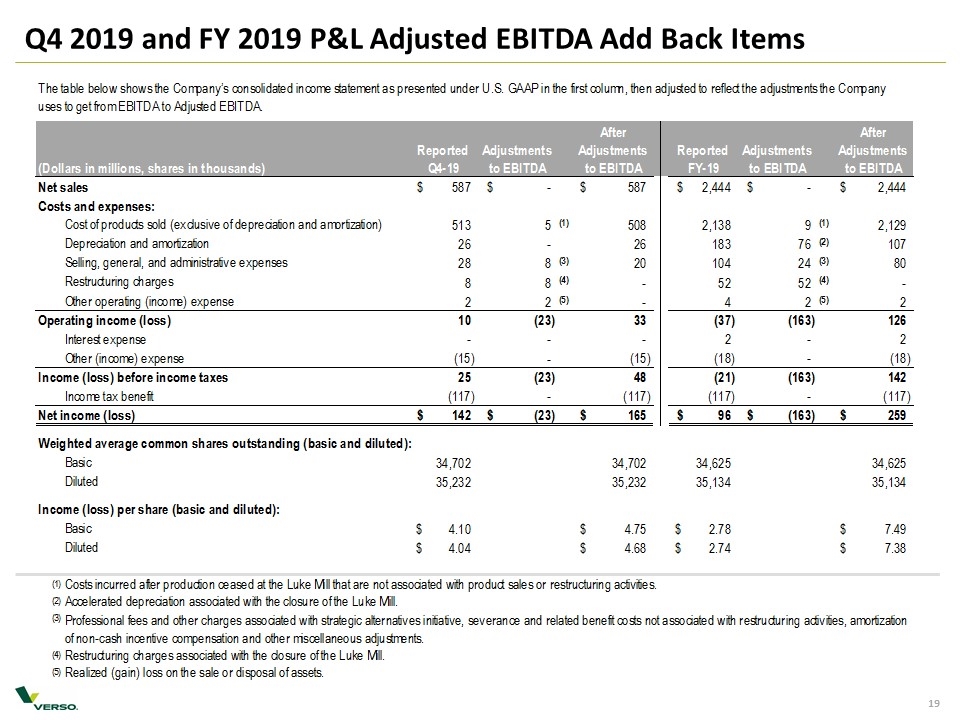
Q4 2019 and FY 2019 P&L Adjusted EBITDA Add Back Items
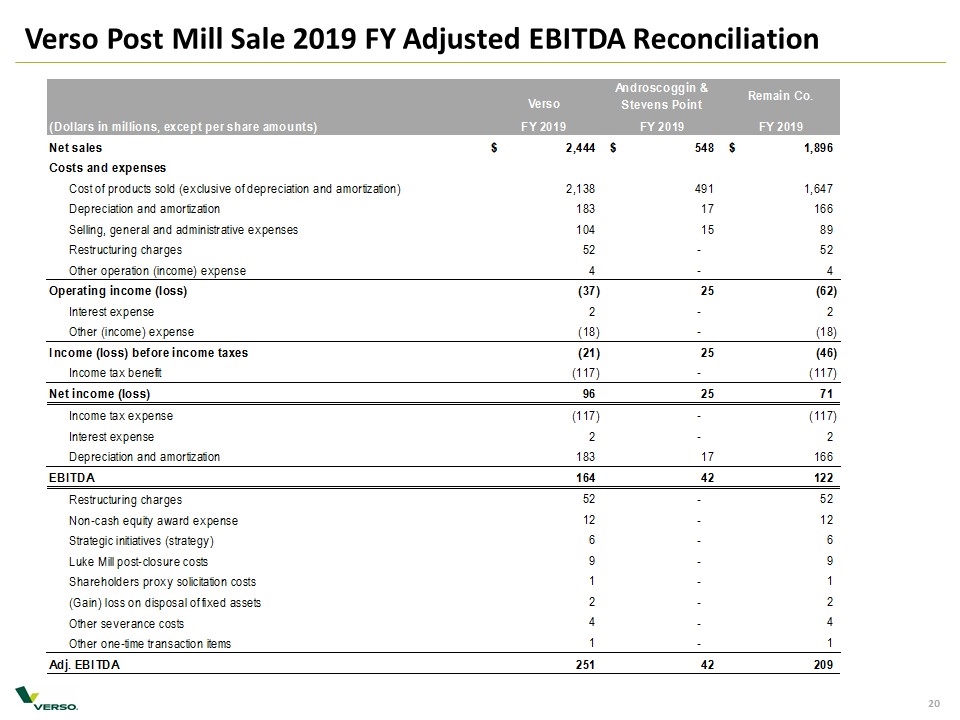
Verso Post Mill Sale 2019 FY Adjusted EBITDA Reconciliation
