Attached files
| file | filename |
|---|---|
| EX-99.3 - EXHIBIT 99.3 - REDWOOD TRUST INC | q12020dividendpr.htm |
| EX-99.1 - EXHIBIT 99.1 - REDWOOD TRUST INC | q42019earningsrelease.htm |
| 8-K - 8-K - REDWOOD TRUST INC | q42019form8-kpr.htm |
Exhibit 99.2

T A B L E O F C O N T E N T S |
Introduction | |
Shareholder Letter | |
Quarterly Results | |
Ñ Fourth Quarter Highlights | |
Ñ New Segment Overview | |
Ñ Quarterly Earnings and Analysis | |
Ñ Book Value and Economic Return | |
Ñ Return Contribution Analysis | |
Ñ Segment Results | |
Quarterly Positions | |
Ñ Capital Allocations | |
Ñ Leverage | |
Ñ Credit | |
Financial Tables | |
Appendix | |
Ñ CoreVest Acquisition | |
Ñ Dividends and Taxable Income | |
Ñ Non-GAAP Measurements | |
Ñ Forward-Looking Statements | |
Endnotes | |
THE REDWOOD REVIEW I 4TH QUARTER 2019 |
1 |
I N T R O D U C T I O N |
Note to Readers:
We file annual reports (on Form 10-K) and quarterly reports (on Form 10-Q) with the Securities and Exchange Commission. These filings and our earnings press releases provide information about Redwood and our financial results in accordance with generally accepted accounting principles (GAAP). These documents, as well as information about our business and a glossary of terms we use in this and other publications, are available through our website, www.redwoodtrust.com. We encourage you to review these documents.
Throughout this document, in addition to our GAAP results, we also present certain non-GAAP measures, including "core earnings" and other measures calculated in a manner consistent with core earnings. The Appendix to this document includes a detailed description of our non-GAAP measures and reconciliations to their equivalent GAAP measures.
References herein to “Redwood,” the “company,” “we,” “us,” and “our” include Redwood Trust, Inc. and its consolidated subsidiaries. Note that because we round numbers in the tables to millions, except per share amounts, some numbers may not foot due to rounding. References to the “fourth quarter” refer to the quarter ended December 31, 2019, and references to the “third quarter” refer to the quarter ended September 30, 2019, unless otherwise specified.
Forward-looking statements:
This Redwood Review contains forward-looking statements within the meaning of the safe harbor provisions of the Private Securities Litigation Reform Act of 1995. Forward-looking statements involve numerous risks and uncertainties. Our actual results may differ from our expectations, estimates, and projections and, consequently, you should not rely on these forward-looking statements as predictions of future events. Forward-looking statements are not historical in nature and can be identified by words such as “anticipate,” “estimate,” “will,” “should,” “expect,” “believe,” “intend,” “seek,” “plan,” and similar expressions or their negative forms, or by references to strategy, plans, goals, or intentions. These forward-looking statements are subject to risks and uncertainties, including, among other things, those described in our Annual Report on Form 10-K under the caption “Risk Factors.” Other risks, uncertainties, and factors that could cause actual results to differ materially from those projected are described below and may be described from time to time in reports we file with the Securities and Exchange Commission, including reports on Forms 10-K, 10-Q, and 8-K. We undertake no obligation to update or revise forward-looking statements, whether as a result of new information, future events, or otherwise.
Statements regarding the following subjects, among others, are forward-looking by their nature: statements we make regarding Redwood’s business strategy and strategic focus, statements related to our financial outlook and expectations for 2020 and future years, statements regarding our available capital and sourcing additional capital both internally and from the capital markets, and other statements regarding pending business activities and expectations and estimates relating to our business and financial results. Additional detail regarding the forward-looking statements in this Redwood Review and the important factors that may affect our actual results in 2020 are described in the Appendix of this Redwood Review under the heading “Forward-Looking Statements.”
See Appendix for details on non-GAAP measures. Detailed endnotes are included at the end of this Redwood Review. |
THE REDWOOD REVIEW I 4TH QUARTER 2019 |
2 |
S H A R E H O L D E R L E T T E R |
Dear Fellow Shareholders:
Redwood ended 2019 on a strong note, with solid earnings and sustained momentum across our business lines. Our GAAP and non-GAAP core earnings were $0.38 and $0.45 per share, respectively, for the fourth quarter. We ended the full year with GAAP earnings of $1.46 per share and core earnings of $1.58 per share, resulting in a core ROE for 2019 of 11.6%. Our earnings for the full year were comprised of a healthy balance of investment returns and income from mortgage banking operations, and we made $1.1 billion of investments through a combination of organic and acquisition activity that we believe will help us deliver increased returns to our shareholders in the coming quarters and years.
In total, we were pleased with our financial results and today we announced a 6.7% increase to our regular quarterly dividend to shareholders to $0.32 per share for the first quarter of 2020. Our ability to raise our dividend despite the market volatility we experienced over the past year is significant in that it demonstrates the stability of our business model driven by diverse revenue streams.
What really set 2019 apart for Redwood was our strategic progress. Fueled in part by two acquisitions, it was a historic year for our business that set a new foundation for profitable growth. We are now a leading participant in several distinct areas of housing credit, and our consolidated portfolio has evolved to incorporate a diverse mix of residential, business purpose, and multifamily investments. We now operate out of four principal locations, and our earnings power is squarely driven by organically created investments and the associated platforms that produce them. Our risk-minded culture and our values, which emphasize passion, integrity, change, relationships, and results, underlie our methodical pursuit to become one of the nation’s most innovative investors in housing credit.
And it would not be Redwood if we didn't continue to move with a quick step, pushing our platform ahead towards the next phase of growth. Our strategic priorities for 2020 are focused on channeling regulatory changes and technological innovations to significantly advance our overall relevance to the housing market. We plan to confront key issues facing housing finance and drive the industry forward with actionable initiatives, which we expand on below.
Put simply, our corporate mission is to help make quality housing accessible to all Americans, whether it's rented or owned. We recognize that the needs of consumers have changed, and that for many the allure of a home has as much to do with comfort, proximity to work, and lifestyle as it does with pride of homeownership.
As we continue with this important work, we recently reorganized our business to create a more scalable infrastructure going forward. This will allow us to better manage the ever-evolving opportunities and risks facing our business and to create better visibility into the earnings power of our operating platforms and the investments they create.
THE REDWOOD REVIEW I 4TH QUARTER 2019 |
3 |
S H A R E H O L D E R L E T T E R |
We now manage our business through four distinct segments or "verticals." Our new structure provides for centralized strategic decision-making that drives the activities of these verticals. In turn, our businesses can operate end-to-end in their respective sectors while benefiting from corporate risk oversight and traditional shared services. Each of our verticals currently operates at a slightly different stage of maturity, creating what we view as a compelling mix of stable earnings generation and future upside. In sum, we believe this profile offers differentiated cash flows and return profiles that will contribute toward a robust earnings stream for our shareholders. As you might expect, accompanying these changes are refocused financial disclosures and analyses throughout this Redwood Review - we look forward to your feedback.
Reflecting on the macro environment in 2019, few expected it to be a record year for residential mortgage refinance activity, but that’s what we got. The Federal Reserve kept rates low after cutting three times in 2019 amid global trade tensions and signs of economic weakness. Inflation, meanwhile, remained low and the U.S. consumer balance sheet remained strong, in part driven by an increased propensity to save that is in turn putting downward pressure on benchmarks. As we head deeper into 2020, the 30-year conforming mortgage rate has fallen once again to three-year lows and is within striking distance of all-time lows. This continues to provide ample fuel for refinance activity, which has boosted volumes year-to-date in 2020. Low rates have also contributed to increased borrower spending power, something that should in theory buoy home purchase demand amongst millennials who are now entering their prime home buying years.
But buying power is a moot point when there is such limited housing stock. While the interest rate environment has contributed to what is now a decade-long run in housing, it also masks some worrisome trends that continue to garner our close attention. Most notably, the supply of quality, affordable homes in the United States badly lags new household formation. While this imbalance has greatly supported rising home prices, it’s made access to desirable housing more challenging for many - especially low to moderate income families, many of whom are would-be first-time home buyers. An expedient solution making the rounds in Washington is to relax underwriting standards and make it easier to offer loans with lower down payments to borrowers with higher debt-to-income ratios. While we support expanding homeownership opportunities for all Americans who desire to own their own homes, lowering underwriting standards had disastrous consequences leading up to the 2008 financial crisis and beyond. Additionally, these solutions ignore the fundamental problem - not enough homes.
At Redwood, our approach to residential underwriting remains unchanged. We emphasize safe, well-structured loans that borrowers can reliably afford. But more importantly, we are championing solutions in our business lines that offer more high quality and accessible housing for consumers. For instance, our business purpose lending initiatives focus not only on stabilized rentals, but also bridge lending - where homes are renovated, upgraded, and brought up to current building codes before getting resold or rented to consumers. We are actively expanding the bridge business to include more robust construction/redevelopment opportunities, including market-leading financing programs for build-to-rent communities, urban infill development, and modular home development, to name a few. These strategies all complement our consumer residential lending business and expand upon our mission.
THE REDWOOD REVIEW I 4TH QUARTER 2019 |
4 |
S H A R E H O L D E R L E T T E R |
As we look ahead into 2020, all eyes are on the U.S. housing regulator (FHFA), where its new director is focused on taking the GSEs out of conservatorship, reducing their footprint across the housing sector, and leveling the playing field for private capital to participate in a larger part of the market. We see this regulatory shift as a major opportunity for our residential lending business, and the catalyst for us to invest in our platform to support higher levels of growth and profitability. We’re now applying recent technological innovations to reimagine the entire non-agency loan production and distribution workstream. We plan to transform our correspondent loan acquisition platform to be more component-based, allowing us to implement the best technologies as they become available rather than through “all-or-none” systems that remain the standard in the industry. We are also working to automate the revalidation of underwriting data to significantly reduce the time it takes us to purchase non-agency loans from originators, allowing them to recycle capital faster and make more loans. At the moment, technology to assist loan sellers in originating conventional loans that can be seamlessly sold exists only in the Agency origination space. We want to make it a reality in the private sector.
An equally compelling runway exists in our business-purpose lending segment. We are now one of the largest originators of business-purpose residential loans, with a platform capable of building on the momentum from a combined platform that originated a cumulative $2.4 billion of loans in 2019. We also have the largest and most highly-regarded SFR securitization platform in the housing market, which will help accelerate our strategy to grow profitably and organically generate assets with attractive risk adjusted returns. We have begun the process of combining the 5 Arches and CoreVest-platforms under a unified leadership structure, taking “best of breed” from both businesses to position for profitable future growth. Once fully integrated, we believe no competing platform will possess the same breadth of financing products and depth of expertise to deliver all-inclusive and customized solutions to residential real estate investors. A unified platform will also allow us to apply our technology advantage to a full suite of products and in the process remove redundant external costs in the day-to-day operation of the business. Importantly, we are still just scratching the surface of how business-purpose lending can leverage the broader Redwood platform. To wit: we have begun the process of offering single-family rental loan programs to our 180 residential loan sellers, secured the ability to pledge single-family rental loans on our FHLB borrowing facility, and lowered our cost of funds through both warehouse lines and securitization. All told, business purpose lending now represents almost 30% of our equity allocation.
Our multifamily initiative continues to grow and expand and is quickly emerging as a strategic and complementary facet of our housing finance strategy. Befittingly, we now designate multifamily investing as a core business at Redwood, with over $475 million of capital invested since 2017. We originate small-balance multifamily loans (both term and bridge) in our business-purpose lending segment - an area of desired growth - however, our capital deployment in traditional multifamily has been almost exclusively in programs offered by Freddie Mac. To date, we remain one of the few investors in newly issued Freddie Mac multifamily B-pieces (first loss credit risk) that is not also a multifamily operator. Given recent changes implemented by the FHFA, we are now exploring ways to expand how we provide liquidity to this rapidly growing market.
THE REDWOOD REVIEW I 4TH QUARTER 2019 |
5 |
S H A R E H O L D E R L E T T E R |
While we anticipate most of our investing activities to be driven from within our residential, business-purpose, and multifamily verticals, we continue to dedicate meaningful resources to other third-party investment activities. For over a quarter century, our role as an active investor and liquidity provider has been, and will remain, highly relevant to the mortgage capital markets. This effort will operate in coordination with our other businesses and actively focus on third-party opportunities that we find attractive, including non-agency RMBS, agency CRT bonds, securities backed by re-performing loans (RPLs), and other investments. Importantly, this vertical also allows us to continue tracking the pertinent markets and manage our capital both opportunistically and for liquidity management purposes.
Over the past two years we’ve made meaningful progress in diversifying revenues, integrating resources, and positioning Redwood to grow profitably in the years ahead. Our business segments now speak for production and earnings generation across a compelling suite of sectors and collaborate toward a unifying vision of being one of the market’s most innovative mortgage investors. As we move forward, we’re committed to serving our mission while generating solid risk-adjusted returns that can sustainably grow our dividends over time for our shareholders.
We appreciate the trust and commitment exhibited by our long-term shareholders who have steadfastly supported Redwood’s evolution. We look forward to sharing a comprehensive overview of our business segments, a deep dive into recent government actions concerning housing finance reform and the role Redwood expects to play at our third annual Investor Day, to be held March 24th in New York City.
Thank you for your continued support.
 |  | |
Christopher J. Abate | Dashiell I. Robinson | |
Chief Executive Officer | President | |
THE REDWOOD REVIEW I 4TH QUARTER 2019 |
6 |
Q U A R T E R L Y R E S U L T S |
Fourth Quarter Highlights
Key Financial Results and Metrics | ||||||||
Three Months Ended | ||||||||
12/31/2019 | 9/30/2019 | |||||||
Earnings per Share | $ | 0.38 | $ | 0.31 | ||||
Core Earnings per Share (non-GAAP) | $ | 0.45 | $ | 0.37 | ||||
Return on Equity | 10.9 | % | 8.6 | % | ||||
Core Return on Equity (non-GAAP) | 13.6 | % | 10.9 | % | ||||
Book Value per Share | $ | 15.98 | $ | 15.92 | ||||
Dividend per Share | $ | 0.30 | $ | 0.30 | ||||
Economic Return on Book Value (1) | 2.3 | % | 1.3 | % | ||||
Recourse Leverage Ratio (2) | 3.1x | 2.7x | ||||||
Ñ | The acquisition of CoreVest in October 2019 contributed to strong overall results for the quarter, as its origination platform helped drive strong mortgage banking income, and capital deployed into business purpose loan ("BPL") investments drove higher net interest income. Our results were also bolstered by strong performance from our residential mortgage banking platform, which saw increased volume and margins during the quarter, as well as improved returns on our investments from portfolio optimization. |
Ñ | Our fourth quarter results contributed to an increase in book value of $0.06 per share and an economic return on book value of 2.3% for the quarter. Excluding acquisition-related items(3), which negatively impacted book value by $0.11 per share, our economic return on book value was 3.0%. |
Ñ | On February 27, 2020, we announced a 6.7% increase to our regular quarterly dividend to shareholders to $0.32 per share for the first quarter of 2020. |
Ñ | We deployed $634 million of capital during the fourth quarter, inclusive of the acquisition of CoreVest's operating platform and related financial assets. Total transaction consideration for CoreVest was $492 million, net of in-place financing (see the Appendix for additional details). |
Ñ | We purchased $1.8 billion and sold $2.2 billion of residential jumbo loans during the fourth quarter, both through whole loans sales and two securitizations. At December 31, 2019, our pipeline of jumbo residential loans identified for purchase was $1.8 billion. |
Ñ | We originated $750 million of business purpose loans across the CoreVest and 5 Arches platforms, including $435 million of single-family rental ("SFR") loans and $315 million of bridge loans. We sold $395 million of SFR loans through one securitization, Redwood's first SFR securitization since the acquisition of CoreVest, and CoreVest's 10th overall. |
Ñ | Leverage increased modestly during the fourth quarter, as we deployed capital into the CoreVest acquisition that we had accumulated through the prior quarter-end. |
See Appendix for details on non-GAAP measures. Detailed endnotes are included at the end of this Redwood Review. |
THE REDWOOD REVIEW I 4TH QUARTER 2019 |
7 |
Q U A R T E R L Y R E S U L T S |
New Segment Overview
In advancing our strategic priorities, over the past two years we have increased our capital deployment across the broader housing credit market, including business purpose lending, through the acquisitions of 5 Arches and CoreVest and through increased investment activity in the multifamily sector. With these new asset classes growing to comprise more significant portions of our capital allocation, in the fourth quarter of 2019 we reorganized our operations into four business segments. These segments represent areas of the housing market we operate in through vertically integrated platforms.
Each new segment includes all revenue and direct expense associated with the origination, acquisition and management of its associated financial assets. Additionally, we allocate corporate long-term debt (previously included in our corporate segment) to each segment, allowing us to evaluate each segment's contribution to our overall return on equity. Our four new segments include:
Residential Lending – Comprised of our residential mortgage banking operations and investments created from these activities, including: residential loans financed with the FHLB and investments retained from our residential loan securitization activities.
Business Purpose Lending – Comprised of our business purpose mortgage banking operations (both 5 Arches and CoreVest), and investments created from these activities, including: SFR securities retained from CoreVest-sponsored securitizations, SFR loans financed with the FHLB, and investments in residential and small-balance multifamily bridge loans.
Multifamily Investments – Comprised of multifamily securities and loans we have acquired, as well as other multifamily investments.
Third-Party Residential Investments – Comprised of other residential investments not sourced through our residential mortgage banking activities, including: re-performing loan securities, third-party RMBS (including CRT securities and legacy securities), and other investments.
Prior Segments | New Segments | |
Mortgage Banking | Residential Lending | |
Residential Mortgage Banking | Residential Mortgage Banking | |
Business Purpose Mortgage Banking | Residential Lending Investments | |
Investment Portfolio | Business Purpose Lending | |
Residential Lending Investments (Redwood Created) | Business Purpose Mortgage Banking | |
Business Purpose Lending Investments | Business Purpose Lending Investments | |
Multifamily Investments | ||
Third-Party Residential Investments | Multifamily Investments | |
Third-Party Residential Investments | ||
Ñ | Refer to the Capital Allocations section later in this document for additional details on the capital allocations and investments within each of our segments. |
See Appendix for details on non-GAAP measures. Detailed endnotes are included at the end of this Redwood Review. |
THE REDWOOD REVIEW I 4TH QUARTER 2019 |
8 |
Q U A R T E R L Y R E S U L T S |
Quarterly Earnings and Analysis
Below we present GAAP net income and non-GAAP core earnings for the fourth and third quarters of 2019.
GAAP Net Income and Non-GAAP Core Earnings | ||||||||||||||||
($ in millions, except per share data) | ||||||||||||||||
Three Months Ended | ||||||||||||||||
12/31/2019 | 9/30/2019 | 12/31/2019 | 9/30/2019 | |||||||||||||
GAAP | GAAP | Core | Core | |||||||||||||
Net interest income | ||||||||||||||||
From investments | $ | 38 | $ | 28 | $ | 28 | $ | 25 | ||||||||
From mortgage banking activities | 7 | 6 | 7 | 6 | ||||||||||||
Total net interest income | 45 | 34 | 35 | 31 | ||||||||||||
Non-interest income | ||||||||||||||||
Residential mortgage banking, net | 17 | 5 | 17 | 5 | ||||||||||||
Business purpose mortgage banking, net | 30 | 4 | 30 | 4 | ||||||||||||
Investment fair value changes, net | 1 | 11 | — | — | ||||||||||||
Other income, net | 5 | 4 | 5 | 4 | ||||||||||||
Realized gains, net | 6 | 5 | 23 | 25 | ||||||||||||
Total non-interest income, net | 58 | 30 | 74 | 38 | ||||||||||||
General and administrative expenses | (42 | ) | (27 | ) | (41 | ) | (25 | ) | ||||||||
Other expenses | (7 | ) | (3 | ) | — | — | ||||||||||
Provision for income taxes | (4 | ) | — | (7 | ) | — | ||||||||||
Earnings | $ | 49 | $ | 34 | $ | 61 | $ | 43 | ||||||||
Earnings per diluted common share | $ | 0.38 | $ | 0.31 | $ | 0.45 | $ | 0.37 | ||||||||
GAAP Net Income and Non-GAAP Core Earnings by Segment | ||||||||||||||||
($ in millions) | ||||||||||||||||
Three Months Ended | ||||||||||||||||
12/31/2019 | 9/30/2019 | 12/31/2019 | 9/30/2019 | |||||||||||||
GAAP | GAAP | Core | Core | |||||||||||||
Residential Lending | $ | 16 | $ | 9 | $ | 20 | $ | 14 | ||||||||
Business Purpose Lending | 19 | (1 | ) | 24 | 2 | |||||||||||
Multifamily Investments | 11 | 10 | 7 | 16 | ||||||||||||
Third-Party Residential Investments | 21 | 29 | 24 | 23 | ||||||||||||
Corporate | (18 | ) | (13 | ) | (15 | ) | (11 | ) | ||||||||
Earnings | $ | 49 | $ | 34 | $ | 61 | $ | 43 | ||||||||
See Appendix for details on non-GAAP measures. Detailed endnotes are included at the end of this Redwood Review. |
THE REDWOOD REVIEW I 4TH QUARTER 2019 |
9 |
Q U A R T E R L Y R E S U L T S |
Analysis of Earnings
Ñ | Business purpose mortgage banking activities improved in the fourth quarter, as new originations from CoreVest increased volume meaningfully in addition to increased volume from 5 Arches. In addition, improvements in single-family rental securitization execution during the fourth quarter helped drive incremental profitability on the inventory of SFR loans we acquired from CoreVest, as well as our subsequent fourth quarter production. |
Ñ | Net interest income improved in the fourth quarter as we redeployed capital out of lower-yielding assets in our residential lending and other portfolios and deployed capital into additional business purpose lending investments, primarily through our CoreVest acquisition. |
Ñ | Residential mortgage banking activities also improved, as loan purchase commitments increased 42% from the third quarter, partly driven by elevated bulk deal activity in the fourth quarter. Gross margins were towards the higher end of our long-term expectations of 75-100 basis points, partly driven by improved securitization execution during the fourth quarter. |
Ñ | Realized gains remained elevated, as continued spread tightening created opportunities for us to sell $225 million of lower-yielding securities, freeing up $150 million of capital for redeployment. |
Ñ | General and administrative expenses increased in the fourth quarter due to the addition of $8 million of GAAP expenses from CoreVest, as well as higher overall variable compensation expense, which rose due to improved GAAP earnings in the fourth quarter. |
Ñ | Other expenses, primarily comprised of acquisition-related intangible amortization expense and contingent consideration expense, increased due to the addition of intangible assets from the acquisition of CoreVest. |
Ñ | Provision for income taxes increased in the fourth quarter due to higher mortgage banking income at our taxable subsidiary, as compared to the third quarter. |
See Appendix for details on non-GAAP measures. Detailed endnotes are included at the end of this Redwood Review. |
THE REDWOOD REVIEW I 4TH QUARTER 2019 |
10 |
Q U A R T E R L Y R E S U L T S |
Book Value and Economic Return
Changes in Book Value per Share | ||||||||
($ in per share) | ||||||||
Three Months Ended | ||||||||
12/31/19 | 9/30/2019 | |||||||
Beginning GAAP book value per share | $ | 15.92 | $ | 16.01 | ||||
GAAP earnings (per basic share) | 0.42 | 0.33 | ||||||
Add back intangible amortization expense (non-GAAP) | 0.03 | 0.01 | ||||||
Dividends | (0.30 | ) | (0.30 | ) | ||||
Non-cash equity award compensation | (0.04 | ) | 0.02 | |||||
Changes in unrealized gains on securities, net | (0.05 | ) | 0.02 | |||||
Change in long-term debt hedge | 0.09 | (0.11 | ) | |||||
Other, net | 0.02 | (0.05 | ) | |||||
Ending book value before acquisition-related items (non-GAAP) | 16.09 | 15.93 | ||||||
Intangible amortization expense | (0.03 | ) | (0.01 | ) | ||||
CoreVest acquisition equity consideration | (0.08 | ) | — | |||||
Ending GAAP book value per share | $ | 15.98 | $ | 15.92 | ||||
Ñ | Our GAAP book value increased $0.06 per share during the fourth quarter of 2019, largely due to GAAP earnings exceeding our dividend. |
Ñ | Included in our change in GAAP book value was $(0.11) per share associated with acquisition related items. These included $(0.08) per share from the one-time impact of equity-based purchase consideration for CoreVest (treated as compensation for GAAP), and $(0.03) per share of expense related to intangible amortization associated with both the CoreVest and 5 Arches acquisitions. |
Ñ | Excluding these acquisition-related items(1), our non-GAAP book value increased $0.17 per share, and our economic return on book value was 3.0% during the fourth quarter. |
Ñ | Our intangible assets related to both acquisitions will be amortized through 2026, and we expect to incur $(0.03) per share of intangible amortization expense per quarter for the next several quarters. |
See Appendix for details on non-GAAP measures. Detailed endnotes are included at the end of this Redwood Review. |
THE REDWOOD REVIEW I 4TH QUARTER 2019 |
11 |
Q U A R T E R L Y R E S U L T S |
Return Contribution Analysis
Below we present non-GAAP core returns for the fourth and third quarters of 2019, by segment.
Non-GAAP Core Return Contribution Summary | |||||||||||||||||||||||
($ in millions) | |||||||||||||||||||||||
Three Months Ended | |||||||||||||||||||||||
12/31/2019 | 9/30/2019 | ||||||||||||||||||||||
Average Allocated Equity | Core Earnings | Core ROE | Average Allocated Equity | Core Earnings | Core ROE | ||||||||||||||||||
Residential Lending | |||||||||||||||||||||||
Mortgage Banking | $ | 130 | $ | 11 | 33.5 | % | $ | 130 | $ | 5 | 15.5 | % | |||||||||||
Investments | 336 | 9 | 11.0 | % | 426 | 9 | 8.1 | % | |||||||||||||||
Total | 466 | 20 | 17.3 | % | 556 | 14 | 9.9 | % | |||||||||||||||
Business Purpose Lending | |||||||||||||||||||||||
Mortgage Banking | 255 | 17 | 27.4 | % | 55 | — | (1.0 | )% | |||||||||||||||
Investments | 172 | 7 | 16.1 | % | 32 | 2 | 23.6 | % | |||||||||||||||
Total | 427 | 24 | 22.9 | % | 87 | 2 | 8.1 | % | |||||||||||||||
Multifamily Investments | 146 | 7 | 20.4 | % | 159 | 16 | 39.4 | % | |||||||||||||||
Third-Party Residential Investments | 294 | 24 | 32.8 | % | 308 | 23 | 29.7 | % | |||||||||||||||
Corporate | 468 | (15 | ) | N/A | 482 | (11 | ) | N/A | |||||||||||||||
Total | $ | 1,800 | $ | 61 | 13.6 | % | $ | 1,592 | $ | 43 | 10.9 | % | |||||||||||
Ñ | Residential Lending — Returns from mortgage banking increased during the fourth quarter, as both volume and margins improved from the third quarter. Returns from investments improved during the fourth quarter, as we sold lower-yielding assets, which resulted in gains and positioned the remaining portfolio with a higher average yield. |
Ñ | Business Purpose Lending — Overall returns improved in the fourth quarter, as we benefited from higher loan originations and higher income from investments resulting from our CoreVest acquisition, as well as increased originations from 5 Arches. |
Ñ | Multifamily Investments — Returns declined during the fourth quarter, as the pace of portfolio optimization in the portfolio slowed relative to the third quarter, resulting in fewer realized gains. |
Ñ | Third-Party Residential Investments — Returns on third-party investments remained elevated, as we recognized gains from sales of primarily CRT and mezzanine securities during the third and fourth quarters of 2019. |
Ñ | Corporate — Average allocated equity for corporate included $350 million of average capital available for investment during the fourth quarter, driven in part by the issuance in September 2019 of $201 million of convertible bonds, and subsequent repayment of $201 million of exchangeable bonds in mid-November. Corporate overhead expenses increased in the fourth quarter, as variable compensation was adjusted to reflect improved full-year financial results. |
See Appendix for details on non-GAAP measures. Detailed endnotes are included at the end of this Redwood Review. |
THE REDWOOD REVIEW I 4TH QUARTER 2019 |
12 |
Q U A R T E R L Y R E S U L T S |
Below we present non-GAAP core returns for our investments organized by segment for the fourth quarter of 2019.
Non-GAAP Core Returns on Investments by Business Segment | ||||||||||||||||||||
($ in millions) | ||||||||||||||||||||
Three Months Ended December 31, 2019 | ||||||||||||||||||||
Residential Lending | Business Purpose Lending | Multifamily Investments | Third-Party Residential Investments | Total | ||||||||||||||||
Net interest income | $ | 5 | $ | 7 | $ | 4 | $ | 10 | $ | 27 | ||||||||||
Other income | 3 | — | 1 | — | 4 | |||||||||||||||
Investment income | 8 | 8 | 5 | 10 | 31 | |||||||||||||||
Realized gains | 3 | — | 3 | 17 | 23 | |||||||||||||||
General and administrative expenses | (2 | ) | (1 | ) | (1 | ) | (1 | ) | (4 | ) | ||||||||||
Provision for income taxes | — | — | — | (2 | ) | (2 | ) | |||||||||||||
Core earnings | $ | 9 | $ | 7 | $ | 7 | $ | 24 | $ | 48 | ||||||||||
Average equity | 336 | 172 | 146 | 294 | 948 | |||||||||||||||
Core investment income yield | 9.5 | % | 18.6 | % | 13.7 | % | 13.6 | % | 13.1 | % | ||||||||||
Core return on equity | 11.0 | % | 16.1 | % | 20.4 | % | 32.8 | % | 20.1 | % | ||||||||||
Ñ | As we deploy our capital available for investment and our pace of portfolio optimization slows, we expect an increasing portion of future quarterly earnings to come from investment income, and less from realized gains. |
See Appendix for details on non-GAAP measures. Detailed endnotes are included at the end of this Redwood Review. |
THE REDWOOD REVIEW I 4TH QUARTER 2019 |
13 |
Q U A R T E R L Y R E S U L T S |
Segment Results
Residential Lending
The following table presents non-GAAP core results from our residential lending segment for the fourth and third quarters of 2019.
Residential Lending: Non-GAAP Core Earnings | |||||||||||||||||||||||||
($ in millions) | |||||||||||||||||||||||||
Three Months Ended | |||||||||||||||||||||||||
12/31/2019 | 9/30/2019 | ||||||||||||||||||||||||
Investments | Mortgage Banking | Total Residential Lending | Investments | Mortgage Banking | Total Residential Lending | ||||||||||||||||||||
Net interest income | $ | 5 | $ | 5 | $ | 10 | $ | 7 | $ | 5 | $ | 12 | |||||||||||||
Non-interest income | |||||||||||||||||||||||||
Mortgage banking activities, net | — | 17 | 17 | — | 5 | 5 | |||||||||||||||||||
Other income, net | 3 | — | 3 | 2 | — | 2 | |||||||||||||||||||
Realized gains, net | 3 | — | 3 | 1 | — | 1 | |||||||||||||||||||
Total non-interest income, net | 6 | 17 | 23 | 3 | 5 | 8 | |||||||||||||||||||
General and administrative expenses | (1 | ) | (9 | ) | (10 | ) | (1 | ) | (5 | ) | (6 | ) | |||||||||||||
Provision for income taxes | — | (2 | ) | (2 | ) | — | — | — | |||||||||||||||||
Core earnings | $ | 9 | $ | 11 | $ | 20 | $ | 9 | $ | 5 | $ | 14 | |||||||||||||
Key performance indicators | |||||||||||||||||||||||||
Average equity | $ | 336 | $ | 130 | $ | 466 | $ | 426 | $ | 130 | $ | 556 | |||||||||||||
Core return on equity | 11.0 | % | 33.5 | % | 17.3 | % | 8.1 | % | 15.5 | % | 9.9 | % | |||||||||||||
Core pre-tax margin (1) | 60 | % | 48 | % | |||||||||||||||||||||
Loan purchase commitments | $ | 2,419 | $ | 1,700 | |||||||||||||||||||||
Ñ | Core net interest income from investments decreased in the fourth quarter, as average equity invested in this segment declined due to proceeds from portfolio optimization activities being redeployed into other asset classes. |
Ñ | Core mortgage banking results for our residential lending segment improved in the fourth quarter, as loan purchase commitments increased to $2.4 billion from $1.7 billion in the third quarter, and gross margins on securitization and whole loan sales improved from the third quarter. We define gross margins for this segment as the sum of mortgage banking net interest income and mortgage banking activities divided by loan purchase commitments. |
Ñ | Core general and administrative expenses increased in the fourth quarter, as variable compensation was adjusted to reflect improved full-year financial performance of this segment. |
Ñ | Core pre-tax margin improved in the fourth quarter, as revenue growth from higher volume and margins outpaced the increase in general and administrative expenses during the quarter. |
See Appendix for details on non-GAAP measures. Detailed endnotes are included at the end of this Redwood Review. |
THE REDWOOD REVIEW I 4TH QUARTER 2019 |
14 |
Q U A R T E R L Y R E S U L T S |
Residential Investments
Ñ | We deployed $6 million of capital into Sequoia RMBS retained from securitizations completed in the fourth quarter. |
Ñ | During the fourth quarter, we sold $26 million of lower-yielding securities in this segment, which freed up approximately $5 million of capital for redeployment. |
Ñ | The decline in average capital in this segment during the fourth quarter was primarily attributable to a reduction in the capital associated with our residential whole loans that are held for investment and financed with the FHLB, as paydowns of residential whole loans were replaced with single-family rental loans originated in our business purpose lending segment. |
Residential Mortgage Banking
Quarterly Jumbo Loan Purchase Volume
($ in billions)
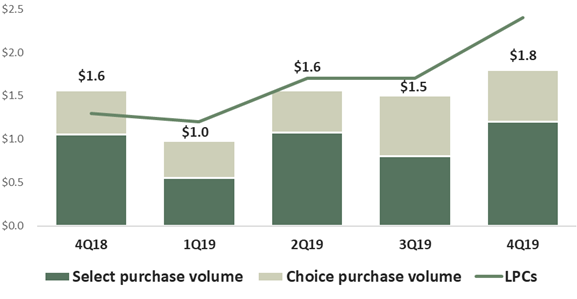
Ñ | The continued lower interest rate environment, as well as an increase in bulk pool acquisitions, helped elevate loan purchase commitments and purchase volumes in the fourth quarter. |
Ñ | At December 31, 2019, our pipeline of jumbo residential loans identified for purchase was $1.8 billion. |
Ñ | During the fourth quarter, we sold $843 million of Select whole loans to third parties, completed two Select securitizations totaling $776 million, and sold $581 million of Choice whole loans to third parties. |
See Appendix for details on non-GAAP measures. Detailed endnotes are included at the end of this Redwood Review. |
THE REDWOOD REVIEW I 4TH QUARTER 2019 |
15 |
Q U A R T E R L Y R E S U L T S |
Business Purpose Lending
The following table presents non-GAAP core results from our business purpose lending segment for the fourth and third quarters of 2019.
Business Purpose Lending: Non-GAAP Core Earnings | |||||||||||||||||||||||||
($ in millions) | |||||||||||||||||||||||||
Three Months Ended | |||||||||||||||||||||||||
12/31/2019 | 9/30/2019 | ||||||||||||||||||||||||
Investments | Mortgage Banking | Total Business Purpose Lending | Investments | Mortgage Banking | Total Business Purpose Lending | ||||||||||||||||||||
Net interest income | $ | 7 | $ | 2 | $ | 9 | $ | 2 | $ | 1 | $ | 3 | |||||||||||||
Non-interest income | |||||||||||||||||||||||||
Mortgage banking activities, net | — | 30 | 30 | — | 4 | 4 | |||||||||||||||||||
Other income, net | — | 1 | 2 | — | 2 | 2 | |||||||||||||||||||
Realized gains, net | — | — | — | — | — | — | |||||||||||||||||||
Total non-interest income, net | — | 31 | 31 | — | 6 | 6 | |||||||||||||||||||
General and administrative expenses | (1 | ) | (14 | ) | (14 | ) | — | (7 | ) | (7 | ) | ||||||||||||||
Provision for income taxes | — | (2 | ) | (2 | ) | — | — | — | |||||||||||||||||
Core earnings | $ | 7 | $ | 17 | $ | 24 | $ | 2 | $ | — | $ | 2 | |||||||||||||
Key performance indicators | |||||||||||||||||||||||||
Average equity | $ | 172 | $ | 255 | $ | 427 | $ | 32 | $ | 55 | $ | 87 | |||||||||||||
Core return on equity | 16.1 | % | 27.4 | % | 22.9 | % | 23.6 | % | (1.0 | )% | 8.1 | % | |||||||||||||
Core pre-tax margin (1) | 59 | % | 4 | % | |||||||||||||||||||||
Loan originations | $ | 750 | $ | 162 | |||||||||||||||||||||
BPL Investments
Ñ | Core investment results improved, as we deployed $289 million of capital into investments, including $227 million into investments from the CoreVest acquisition, $41 million into additional bridge loan investments, and $21 million into SFR securities retained from our fourth quarter securitization. |
Ñ | Additionally, during the fourth quarter, we restructured our BPL warehouse facilities (including those assumed from CoreVest), improving borrowing terms. |
Ñ | During the fourth quarter, we funded $275 million of business purpose bridge loans and received repayments of $108 million. In addition, we transferred $219 million of single-family rental loans into our BPL investments portfolio to be financed with the FHLB. |
See Appendix for details on non-GAAP measures. Detailed endnotes are included at the end of this Redwood Review. |
THE REDWOOD REVIEW I 4TH QUARTER 2019 |
16 |
Q U A R T E R L Y R E S U L T S |
BPL Mortgage Banking
Ñ | Core mortgage banking results for our business purpose lending segment improved, as origination volume from 5 Arches increased and we added significant volume from CoreVest. In addition, improved execution drove incremental profitability on the inventory of SFR loans acquired from CoreVest that we sold through our first CoreVest sponsored securitization completed in November. |
Ñ | BPL loan originations in the fourth quarter included $435 million of single-family rental loans and $315 million of bridge loans. |
Ñ | During the fourth quarter, we securitized $395 million of single-family rental loans, transferred $219 million of single-family rental loans to our FHLB borrowing facility, and sold $20 million of single-family rental loans to third parties. |
See Appendix for details on non-GAAP measures. Detailed endnotes are included at the end of this Redwood Review. |
THE REDWOOD REVIEW I 4TH QUARTER 2019 |
17 |
Q U A R T E R L Y R E S U L T S |
Multifamily Investments
The following table presents non-GAAP core results from our multifamily investments segment for the fourth and third quarters of 2019.
Multifamily Investments: Non-GAAP Core Earnings | ||||||||
($ in millions) | ||||||||
Three Months Ended | ||||||||
12/31/2019 | 9/30/2019 | |||||||
Net interest income | $ | 4 | $ | 5 | ||||
Non-interest income | ||||||||
Other income, net | 1 | 1 | ||||||
Realized gains, net | 3 | 10 | ||||||
Total non-interest income, net | 4 | 11 | ||||||
General and administrative expenses | (1 | ) | — | |||||
Provision for income taxes | — | — | ||||||
Core earnings | $ | 7 | $ | 16 | ||||
Average equity | 146 | 159 | ||||||
Core return on equity | 20.4 | % | 39.4 | % | ||||
Ñ | Core net interest income decreased slightly in the fourth quarter as higher yields on deployed equity were partially offset by lower average equity, as fourth quarter sales outpaced deployment. |
Ñ | During the fourth quarter, we deployed $21 million of capital towards multifamily investments, including $11 million of capital towards multifamily b-pieces and $10 million of capital towards multifamily mezzanine securities. |
Ñ | During the fourth quarter, we sold $88 million of lower-yielding multifamily mezzanine securities, freeing up $46 million of capital after the repayment of associated short-term debt. |
Ñ | Core realized gains declined in the fourth quarter, as we realized fewer gains from the sale of multifamily mezzanine securities relative to the third quarter. |
See Appendix for details on non-GAAP measures. Detailed endnotes are included at the end of this Redwood Review. |
THE REDWOOD REVIEW I 4TH QUARTER 2019 |
18 |
Q U A R T E R L Y R E S U L T S |
Third-Party Residential Investments
The following table presents non-GAAP core results from our third-party residential investments segment for the fourth and third quarters of 2019.
Third-Party Residential Investments: Non-GAAP Core Earnings | ||||||||
($ in millions) | ||||||||
Three Months Ended | ||||||||
12/31/2019 | 9/30/2019 | |||||||
Net interest income | $ | 10 | $ | 10 | ||||
Non-interest income | ||||||||
Other income, net | — | — | ||||||
Realized gains, net | 17 | 14 | ||||||
Total non-interest income, net | 17 | 13 | ||||||
General and administrative expenses | (1 | ) | (1 | ) | ||||
Provision for income taxes | (2 | ) | — | |||||
Core earnings | $ | 24 | $ | 23 | ||||
Average equity | $ | 294 | $ | 308 | ||||
Core return on equity | 32.8 | % | 29.7 | % | ||||
Ñ | Core net interest income was consistent quarter-over-quarter, as higher yields on invested equity was offset by slightly lower average equity invested in this portfolio, as fourth quarter sales outpaced deployment. |
Ñ | During the fourth quarter, we deployed $54 million of capital towards third-party investments, including $37 million of capital towards shared home appreciation options, and $17 million of capital towards other third-party residential credit securities. |
Ñ | Core realized gains increased from the third quarter as we sold $108 million of lower-yielding third-party securities, freeing up $97 million of capital after the repayment of associated short-term debt. |
See Appendix for details on non-GAAP measures. Detailed endnotes are included at the end of this Redwood Review. |
THE REDWOOD REVIEW I 4TH QUARTER 2019 |
19 |
Q U A R T E R L Y P O S I T I O N S |
Capital Allocations
We capitalize our business with a combination of equity and long-term unsecured corporate debt (which we collectively refer to as corporate "capital"). Our total capital of $2.6 billion at December 31, 2019 was comprised of $1.8 billion of equity capital and $0.8 billion of convertible notes and other long-term unsecured corporate debt. We also utilize various forms of collateralized debt to finance certain investments and to warehouse our inventory of certain loans held-for-sale, but do not consider the collateralized debt as "capital".
In order to assess the performance of our business in terms of returns on equity, we allocate our corporate unsecured debt capital among our various investments within each of our segments to determine the amount of equity capital utilized by each business. In addition to the equity allocated to each segment, our remaining capital is held at a corporate level and includes $260 million of undeployed capital available for investment at December 31, 2019, as well as other miscellaneous net assets.
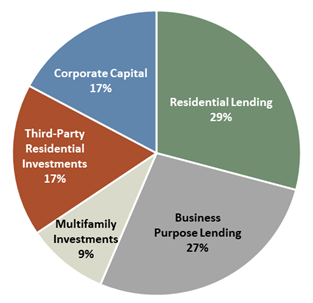
The following table presents a summary view of how our equity is allocated among our four business segments, along with our capital available for investment.
Allocations of Equity
(as of December 31, 2019)
See Appendix for details on non-GAAP measures. Detailed endnotes are included at the end of this Redwood Review. |
THE REDWOOD REVIEW I 4TH QUARTER 2019 |
20 |
Q U A R T E R L Y P O S I T I O N S |
The following table presents our allocations of capital by segment and by investment type as of December 31, 2019.
Capital Allocation Detail | ||||||||||||||||||||||
By Investment Type | ||||||||||||||||||||||
December 31, 2019 | ||||||||||||||||||||||
($ in millions) | ||||||||||||||||||||||
Fair Value of Assets | Collateralized Short-Term Debt | Collateralized Long-Term Debt | Unsecured Corporate Debt | Allocated Equity(1) | % of Total Equity | |||||||||||||||||
Residential Lending | ||||||||||||||||||||||
Residential loans | $ | 2,210 | $ | — | $ | (1,776 | ) | $ | (176 | ) | $ | 257 | 14% | |||||||||
Sequoia securities | 483 | (135 | ) | (185 | ) | (70 | ) | 102 | 6% | |||||||||||||
MSRs/Other | 63 | — | — | (30 | ) | 43 | 2% | |||||||||||||||
Mortgage banking working capital | — | — | — | — | 130 | 7% | ||||||||||||||||
Total Residential Lending | 2,756 | (135 | ) | (1,961 | ) | (276 | ) | 533 | 29% | |||||||||||||
Business Purpose Lending | ||||||||||||||||||||||
SFR securities | 195 | (80 | ) | — | (47 | ) | 68 | 4% | ||||||||||||||
SFR loan investments | 242 | — | (185 | ) | (23 | ) | 34 | 2% | ||||||||||||||
Bridge investments | 764 | (567 | ) | — | (92 | ) | 133 | 7% | ||||||||||||||
Mortgage banking working capital | — | — | — | — | 100 | 5% | ||||||||||||||||
Platform premium | — | — | — | — | 161 | 9% | ||||||||||||||||
Total Business Purpose Lending | 1,201 | (647 | ) | (185 | ) | (162 | ) | 497 | 27% | |||||||||||||
Multifamily Investments | ||||||||||||||||||||||
Multifamily mezzanine | 423 | (334 | ) | — | (52 | ) | 76 | 4% | ||||||||||||||
Multifamily B-pieces | 234 | (171 | ) | — | (38 | ) | 56 | 3% | ||||||||||||||
Other investments | 61 | — | — | (25 | ) | 36 | 2% | |||||||||||||||
Total Multifamily Investments | 717 | (505 | ) | — | (115 | ) | 168 | 9% | ||||||||||||||
Third-Party Residential Investments | ||||||||||||||||||||||
RPL investments | 611 | (315 | ) | (39 | ) | (106 | ) | 154 | 8% | |||||||||||||
CRT & third-party securities | 306 | (142 | ) | — | (70 | ) | 102 | 6% | ||||||||||||||
Other investments | 102 | — | — | (41 | ) | 60 | 3% | |||||||||||||||
Total Third-Party Residential Investments | 1,019 | (457 | ) | (39 | ) | (217 | ) | 316 | 17% | |||||||||||||
Other assets, net | — | — | — | — | 314 | 17% | ||||||||||||||||
Totals | $ | 5,693 | $ | (1,744 | ) | $ | (2,185 | ) | $ | (770 | ) | $ | 1,827 | 100% | ||||||||
Ñ | The equity allocated to each of our segments is determined by the fair value of its investment assets less the short-term and long-term collateralized debt used to finance its investments, less an allocation of our $770 million of long-term unsecured corporate debt. In addition, for investments financed with short-term repurchase debt, we allocate additional equity capital (our liquidity capital cushion) to manage liquidity in the event of an adverse change in market conditions. |
See Appendix for details on non-GAAP measures. Detailed endnotes are included at the end of this Redwood Review. |
THE REDWOOD REVIEW I 4TH QUARTER 2019 |
21 |
Q U A R T E R L Y P O S I T I O N S |
Recourse Leverage
We finance our business with a diversified mix of long-term and short-term recourse debt. The
following charts present the composition of our recourse debt and its characteristics at the end
of the fourth quarter of 2019:
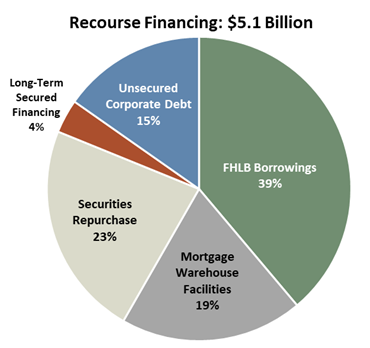 | |||
Borrowing Type | Average Cost of Funds | Average Remaining Term (yrs.) | |
FHLB Borrowings | 2.1% | 6 | |
Unsecured Corporate Debt | 6.1% | 7 | |
Long-Term Secured Financing | 4.2% | 3 | |
Mortgage Warehouse | 4.3% | <1 | |
Securities Repo | 2.9% | <1 | |
Weighted Average Cost of Funds | 3.4% | 3 | |
Our unsecured corporate debt is comprised of $245 million of 4.75% convertible notes due in 2023, $200 million of 5.625% convertible notes due in 2024, $201 million of 5.75% exchangeable notes due in 2025, and $140 million of trust-preferred securities due in 2037 (that we hedge to yield approximately 6.9%). We allocate our corporate debt to the long-term investments in each of our operating segments, along with the associated interest expense.
Our FHLB borrowings, long-term secured financing, and securities repo are used to fund residential loans, single-family rental loans, and securities across our portfolio. This mix of debt changes as we invest our excess capital or optimize our existing investments. We utilize mortgage warehouse facilities to fund loans in inventory at each of our mortgage banking operations.
Our recourse leverage ratio(1) increased to 3.1x at the end of the fourth quarter from 2.7x at the end of the third quarter, primarily as a result of the CoreVest acquisition. As we continue to deploy our capital available for investment, we expect this leverage ratio to increase toward the mid-range of our 3.0x - 4.0x target range.
See Appendix for details on non-GAAP measures. Detailed endnotes are included at the end of this Redwood Review. |
THE REDWOOD REVIEW I 4TH QUARTER 2019 |
22 |
Q U A R T E R L Y P O S I T I O N S |
Below is a summary as of December 31, 2019 of our $5.1 billion of recourse financing by business activity and tenor of debt:
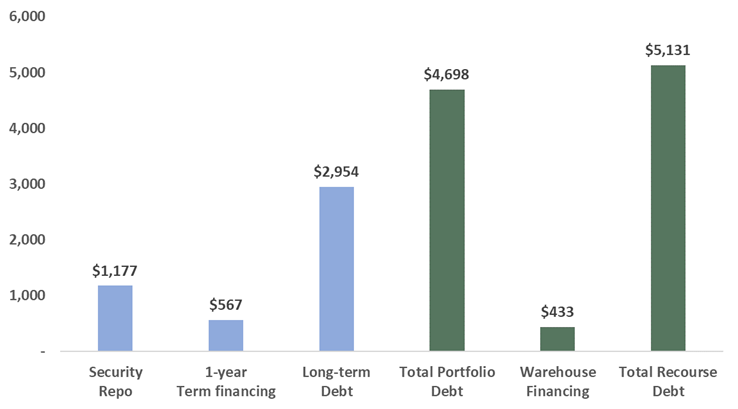
Average remaining term | 3.9 years | <1 year | 3.5 years | |
Average borrowing cost | 3.42% | 4.3% | 3.41% | |
Recourse leverage ratio (1) | 4.2x | 2.0x | 3.1x | |
At December 31, 2019, we had $4.7 billion of recourse debt financing our portfolios of long-term investments. Over 60% of this debt is long-term, with a weighted average remaining term of approximately 4 years. In addition, we had $0.6 billion of term borrowings financing our business purpose residential bridge loans, which are short-term in nature.
At December 31, 2019, we had $0.4 billion of mortgage warehouse debt funding our residential and business purpose residential loans held in inventory for sale. The balance of this debt will vary depending on our loan inventory balance, and we generally finance and accumulate loans in inventory for one to three months prior to sale or securitization.
See Appendix for details on non-GAAP measures. Detailed endnotes are included at the end of this Redwood Review. |
THE REDWOOD REVIEW I 4TH QUARTER 2019 |
23 |
Q U A R T E R L Y P O S I T I O N S |
Credit
This section presents select credit characteristics for our major investment types, with current information as of December 31, 2019.
Residential Investments Credit Characteristics | ||||||||||||||||
($ in millions) | ||||||||||||||||
Sequoia Select Securities | Sequoia Choice Securities | Residential Whole Loans | Re-Performing Loan Securities | |||||||||||||
Market value | $ | 180 | $ | 241 | $ | 2,112 | $ | 610 | ||||||||
Avg. FICO (at origination) | 771 | 744 | 768 | 622 | ||||||||||||
HPI updated LTV(1) | 48 | 66 | 48 | 70 | ||||||||||||
Avg. loan size (in thousands) | $ | 653 | $ | 710 | $ | 698 | $ | 188 | ||||||||
Gross weighted average coupon | 4.1 | % | 5.0 | % | 4.2 | % | 4.5 | % | ||||||||
Current 3-month prepayment rate | 23 | % | 38 | % | 24 | % | 6 | % | ||||||||
Current 90+ days delinquency | 0.1 | % | 0.3 | % | 0.1 | % | 4.5 | % | ||||||||
Current investment thickness | 4 | % | 13 | % | N/A | 20 | % | |||||||||
Sequoia Select Securities — As of December 31, 2019, we had securitized $19.8 billion of Sequoia Select loans since 2010. Our securitized Select portfolio includes fully documented loans to prime borrowers with an average FICO score (at loan origination) of 771, maximum loan-to-value (at origination) of 80%, and a maximum debt-to-income ratio (at origination) of 43%. We retain all first-loss securities from our Sequoia select securitizations, and on average we have exposure up to 4% of credit losses resulting from loans underlying the securities (represented by the thickness of the securities we currently own as investments).
Sequoia Choice Securities — As of December 31, 2019, we had securitized $3.4 billion of Sequoia Choice loans, since 2017. Our securitized Choice portfolio includes fully documented loans to prime borrowers with an average FICO score (at loan origination) of 744, maximum loan-to-value (at origination) of 90%, and a maximum debt-to-income ratio (at origination) of 49.9%. We retain all of the first-loss securities issued as part of our Sequoia Choice program, and on average we have exposure up to the first 13% of credit losses resulting from loans underlying the securities, (represented by the thickness of the securities we currently own as investments).
Residential Whole Loans — As of December 31, 2019, we had $2.1 billion of residential jumbo loans held for investment and financed with FHLB borrowings. These loans were sourced through our residential lending mortgage banking operations. Credit performance for these loans has been consistent with what we have experienced on our Sequoia securitizations.
Re-performing Loan Securities — As of December 31, 2019, we held $610 million of securities collateralized by re-performing loans, and on average we have exposure to up to 20% of the credit losses resulting from loans underlying the securities (represented by the thickness of the securities we currently own as investments). The collateral underlying these securities are seasoned re-
See Appendix for details on non-GAAP measures. Detailed endnotes are included at the end of this Redwood Review. |
THE REDWOOD REVIEW I 4TH QUARTER 2019 |
24 |
Q U A R T E R L Y P O S I T I O N S |
performing, and to a lesser extent non-performing, loans. In most cases, these loans experienced a credit event leading up to the securitization and were modified in order to keep the borrower in their home and current in their payments under recast loan terms. Central to the investment thesis in these securities is the view that a significant percentage of the underlying borrowers will improve upon their delinquency history and continue paying steadily under the modified or recast terms of the loan. To date, the performance of these investments has met or exceeded our original underwriting assumptions. The performance of the first consolidated RPL transaction we invested in late 2018 continues to trend favorably as delinquencies have declined from 50% to 35% in just over one year.
Business Purpose and Multifamily Investments Credit Characteristics | ||||||||||||||||
($ in millions) | ||||||||||||||||
Multifamily B-Pieces | SFR Securities | SFR Loans | BPL Bridge Loans | |||||||||||||
Market value | $ | 234 | $ | 193 | $ | 238 | $ | 745 | ||||||||
Avg. current DSCR(1) | 1.7x | 1.3x | 1.4x | N/A | ||||||||||||
LTV (at origination)(2) | 69 | 68 | 68 | 70 | ||||||||||||
Avg. loan size (in thousands) | $ | 15,035 | $ | 2,650 | $ | 2,161 | $ | 280 | ||||||||
Gross weighted average coupon | 4.1 | % | 5.7 | % | 4.9 | % | 8.1 | % | ||||||||
Current 90+ days delinquency | 0.0 | % | 1.8 | % | 0.0 | % | 1.9 | % | ||||||||
Current investment thickness | 8 | % | 10 | % | N/A | N/A | ||||||||||
Multifamily B-Pieces — As of December 31, 2019, we had $234 million of multifamily b-pieces, which represent first-loss risk on $4.2 billion of underlying multifamily loan collateral across five separate Freddie Mac sponsored securitizations. On average, we have exposure to the first 8% of credit losses resulting from loans underlying the securities (represented by the thickness of the securities we currently own as investments). Credit performance on this collateral to date has been strong, and cumulative losses to date have been zero.
SFR Securities — As of December 31, 2019, we had $193 million of SFR securities, comprised of subordinate and interest only securities retained from the ten CAFL securitizations completed by CoreVest to date. We own and retain the first-loss securities from the CAFL securitizations, and on average have exposure to the first 10% of credit losses (represented by the current thickness of the securities we currently own as investments).
SFR Loans — As of December 31, 2019, we had $238 million of single-family rental loans held for investment, and financed with FHLB borrowings. These loans were sourced through our business purpose mortgage banking operations. The majority of these loans were originated in the past twelve months, and none were delinquent as of December 30, 2019.
BPL Bridge Loans — As of December 31, 2019, we had $745 million of bridge loans held for investment. These loans are collateralized by residential and multifamily properties, many of which are being rehabilitated for either re-sale or rental purposes. The average loan term at origination is approximately 12 months.
See Appendix for details on non-GAAP measures. Detailed endnotes are included at the end of this Redwood Review. |
THE REDWOOD REVIEW I 4TH QUARTER 2019 |
25 |
L E V E R A G E |

See Appendix for details on non-GAAP measures. Detailed endnotes are included at the end of this Redwood Review. |
THE REDWOOD REVIEW I 4TH QUARTER 2019 |
26 |
 | Table 1: GAAP Earnings (in thousands, except per share data) | |||||||||||||||||||||||||
2019 Q4 | 2019 Q3 | 2019 Q2 | 2019 Q1 | 2018 Q4 | Twelve Months 2019 | |||||||||||||||||||||
Net interest income | ||||||||||||||||||||||||||
From investments | $ | 37,639 | $ | 27,679 | $ | 27,565 | $ | 26,952 | $ | 29,749 | $ | 119,835 | ||||||||||||||
From mortgage banking activities | 7,234 | 5,834 | 4,757 | 4,813 | 5,015 | 22,638 | ||||||||||||||||||||
Net interest income | 44,873 | 33,513 | 32,322 | 31,765 | 34,764 | 142,473 | ||||||||||||||||||||
Non-interest income | ||||||||||||||||||||||||||
Residential mortgage banking activities, net | 16,540 | 5,016 | 15,361 | 10,826 | 11,266 | 47,743 | ||||||||||||||||||||
Business purpose mortgage banking activities, net | 29,742 | 4,499 | 3,799 | 1,483 | (96 | ) | 39,523 | |||||||||||||||||||
Investment fair value changes, net | 759 | 11,444 | 3,138 | 20,159 | (38,519 | ) | 35,500 | |||||||||||||||||||
Realized gains, net | 5,594 | 4,714 | 2,827 | 10,686 | 5,689 | 23,821 | ||||||||||||||||||||
Other income | 5,417 | 4,356 | 4,859 | 4,625 | 4,106 | 19,257 | ||||||||||||||||||||
Total non-interest income (loss), net | 58,052 | 30,029 | 29,984 | 47,779 | (17,554 | ) | 165,844 | |||||||||||||||||||
Fixed compensation expense | (12,899 | ) | (9,391 | ) | (9,252 | ) | (8,205 | ) | (6,309 | ) | (39,747 | ) | ||||||||||||||
Variable compensation expense (excluding commissions) | (10,372 | ) | (3,489 | ) | (3,573 | ) | (4,402 | ) | (934 | ) | (21,836 | ) | ||||||||||||||
Equity compensation expense | (3,270 | ) | (3,155 | ) | (4,024 | ) | (2,953 | ) | (2,823 | ) | (13,402 | ) | ||||||||||||||
Acquisition-related equity compensation expense (1) | (1,010 | ) | — | — | — | — | (1,010 | ) | ||||||||||||||||||
Loan acquisition costs (including commissions) | (4,830 | ) | (1,993 | ) | (1,964 | ) | (1,477 | ) | (1,837 | ) | (10,264 | ) | ||||||||||||||
Other general and administrative expense | (10,062 | ) | (8,787 | ) | (7,442 | ) | (6,122 | ) | (7,350 | ) | (32,413 | ) | ||||||||||||||
Total general and administrative expenses | (42,443 | ) | (26,815 | ) | (26,255 | ) | (23,159 | ) | (19,253 | ) | (118,672 | ) | ||||||||||||||
Other expenses | (7,001 | ) | (2,531 | ) | (2,452 | ) | (1,038 | ) | (125 | ) | (13,022 | ) | ||||||||||||||
(Provision for) benefit from income taxes | (4,338 | ) | 114 | (2,333 | ) | (883 | ) | 1,255 | (7,440 | ) | ||||||||||||||||
Net income (loss) | $ | 49,143 | $ | 34,310 | $ | 31,266 | $ | 54,464 | $ | (913 | ) | $ | 169,183 | |||||||||||||
Diluted average shares (2) | 152,983 | 136,523 | 130,697 | 126,278 | 83,217 | 136,781 | ||||||||||||||||||||
Diluted earnings (loss) per common share | $ | 0.38 | $ | 0.31 | $ | 0.30 | $ | 0.49 | $ | (0.02 | ) | $ | 1.46 | |||||||||||||
(1) | Acquisition-related equity compensation expense relates to shares of restricted stock that were issued to members of CoreVest management as a component of the consideration paid to them for our purchase of their interests in CoreVest. |
(2) | Diluted average shares includes shares from the assumed conversion of our convertible and/or exchangeable debt in certain periods, in accordance with GAAP diluted EPS provisions. See Table 2 that follows for details of this calculation for the current and prior quarter and our respective Quarterly Reports on Form 10-Q and Annual Report on Form 10-K. |
THE REDWOOD REVIEW I 4TH QUARTER 2019 | See Appendix for details on non-GAAP measures. | Table 1: GAAP Earnings 27 |
| Table 2: GAAP and Non-GAAP Core Basic and Diluted Earnings (1) per Common Share (in thousands, except per share data) | |||||||||||||
2019 Q4 | 2019 Q3 | Twelve Months 2019 | ||||||||||||
GAAP Earnings per Common Share ("EPS"): | ||||||||||||||
Net income attributable to Redwood | $ | 49,143 | $ | 34,310 | $ | 169,183 | ||||||||
Less: Dividends and undistributed earnings allocated to participating securities | (1,546 | ) | (856 | ) | (4,797 | ) | ||||||||
Net income allocated to common shareholders for GAAP basic EPS | 47,597 | 33,454 | 164,386 | |||||||||||
Incremental adjustment to dividends and undistributed earnings allocated to participating securities | (113 | ) | (180 | ) | (476 | ) | ||||||||
Add back: Interest expense on convertible notes for the period, net of tax (2) | 9,941 | 8,887 | 36,212 | |||||||||||
Net income allocated to common shareholders for GAAP diluted EPS | $ | 57,425 | $ | 42,161 | $ | 200,122 | ||||||||
Basic weighted average common shares outstanding | 112,818 | 101,872 | 101,147 | |||||||||||
Net effect of dilutive equity awards | 221 | 363 | 251 | |||||||||||
Net effect of assumed convertible notes conversion to common shares (2) | 39,943 | 34,288 | 35,382 | |||||||||||
Diluted weighted average common shares outstanding | 152,982 | 136,522 | 136,780 | |||||||||||
GAAP Basic Earnings per Common Share | $ | 0.42 | $ | 0.33 | $ | 1.63 | ||||||||
GAAP Diluted Earnings per Common Share | $ | 0.38 | $ | 0.31 | $ | 1.46 | ||||||||
Non-GAAP Core Earnings per Common Share: | ||||||||||||||
Non-GAAP core earnings | $ | 61,233 | $ | 43,326 | $ | 185,867 | ||||||||
Less: Dividends and undistributed earnings allocated to participating securities | (1,908 | ) | (1,099 | ) | (5,270 | ) | ||||||||
Non-GAAP core earnings allocated to common shareholders for core basic EPS | 59,325 | 42,227 | 180,597 | |||||||||||
Incremental adjustment to dividends and undistributed earnings allocated to participating securities | (19 | ) | (121 | ) | (356 | ) | ||||||||
Add back: Interest expense on convertible notes for the period, net of tax (2) | 9,941 | 8,887 | 36,212 | |||||||||||
Non-GAAP core earnings allocated to common shareholders for core diluted EPS | $ | 69,247 | $ | 50,993 | $ | 216,453 | ||||||||
Basic weighted average common shares outstanding | 112,818 | 101,872 | 101,147 | |||||||||||
Net effect of dilutive equity awards | 221 | 363 | 251 | |||||||||||
Net effect of assumed convertible notes conversion to common shares (2) | 39,943 | 34,288 | 35,382 | |||||||||||
Diluted weighted average common shares outstanding | 152,982 | 136,523 | 136,780 | |||||||||||
Non-GAAP Core Basic Earnings per Common Share | $ | 0.53 | $ | 0.41 | $ | 1.79 | ||||||||
Non-GAAP Core Diluted Earnings per Common Share | $ | 0.45 | $ | 0.37 | $ | 1.58 | ||||||||
(1) | A reconciliation of GAAP net income to non-GAAP core earnings and a definition of core earnings (which we updated during the third quarter of 2019) is included in the Non-GAAP Measurements section of the Appendix. |
(2) | Certain convertible notes were determined to be dilutive in the periods presented and were included in the calculations of diluted EPS under the "if-converted" method. Under this method, the periodic interest expense (net of applicable taxes) for dilutive notes is added back to the numerator and the number of shares that the notes are entitled to (if converted, regardless of whether they are in or out of the money) are included in the denominator. |
THE REDWOOD REVIEW I 4TH QUARTER 2019 | See Appendix for details on non-GAAP measures. | Table 2: GAAP and Non-GAAP Core Earnings per Basic and Diluted Common Share 28 |
| Table 3: Taxable and GAAP Income (1) Differences and Dividends (In thousands, except for per share data) | ||||||||||||||||||||||||||||||||||||
Estimated Twelve Months 2019 (2) | Actual Twelve Months 2018 (2) | Actual Twelve Months 2017 (2) | |||||||||||||||||||||||||||||||||||
Taxable Income | GAAP Income | Differences | Taxable Income | GAAP Income | Differences | Taxable Income | GAAP Income | Differences | |||||||||||||||||||||||||||||
Taxable and GAAP Income Differences | |||||||||||||||||||||||||||||||||||||
Interest income | $ | 320,480 | $ | 622,281 | $ | (301,801 | ) | $ | 265,400 | $ | 378,717 | $ | (113,317 | ) | $ | 225,079 | $ | 248,057 | $ | (22,978 | ) | ||||||||||||||||
Interest expense | (183,550 | ) | (479,808 | ) | 296,258 | (139,147 | ) | (239,039 | ) | 99,892 | (89,662 | ) | (108,816 | ) | 19,154 | ||||||||||||||||||||||
Net interest income | 136,930 | 142,473 | (5,543 | ) | 126,253 | 139,678 | (13,425 | ) | 135,417 | 139,241 | (3,824 | ) | |||||||||||||||||||||||||
Realized credit losses | (534 | ) | — | (534 | ) | (1,738 | ) | — | (1,738 | ) | (3,442 | ) | — | (3,442 | ) | ||||||||||||||||||||||
Mortgage banking activities, net | 80,146 | 87,266 | (7,120 | ) | 57,212 | 59,566 | (2,354 | ) | 44,143 | 53,908 | (9,765 | ) | |||||||||||||||||||||||||
Investment fair value changes, net | 4,307 | 35,500 | (31,193 | ) | 4,927 | (25,689 | ) | 30,616 | (11,191 | ) | 10,374 | (21,565 | ) | ||||||||||||||||||||||||
General and administrative expenses | (109,737 | ) | (118,672 | ) | 8,935 | (78,022 | ) | (82,782 | ) | 4,760 | (73,203 | ) | (77,156 | ) | 3,953 | ||||||||||||||||||||||
Other income | 23,397 | 19,257 | 4,140 | 17,584 | 13,070 | 4,514 | 31,325 | 12,436 | 18,889 | ||||||||||||||||||||||||||||
Realized gains, net | 62,613 | 23,821 | 38,792 | 43,099 | 27,041 | 16,058 | (736 | ) | 13,355 | (14,091 | ) | ||||||||||||||||||||||||||
Other expenses | (3,351 | ) | (13,022 | ) | 9,671 | (65 | ) | (196 | ) | 131 | — | — | — | ||||||||||||||||||||||||
(Provision for) benefit from income taxes | (866 | ) | (7,440 | ) | 6,574 | (538 | ) | (11,088 | ) | 10,550 | (516 | ) | (11,752 | ) | 11,236 | ||||||||||||||||||||||
Income | $ | 192,905 | $ | 169,183 | $ | 23,722 | $ | 168,712 | $ | 119,600 | $ | 49,112 | $ | 121,797 | $ | 140,406 | $ | (18,609 | ) | ||||||||||||||||||
REIT taxable income | $ | 136,255 | $ | 110,161 | $ | 90,122 | |||||||||||||||||||||||||||||||
Taxable income at taxable subsidiaries | 56,650 | 58,551 | 31,675 | ||||||||||||||||||||||||||||||||||
Taxable income | $ | 192,905 | $ | 168,712 | $ | 121,797 | |||||||||||||||||||||||||||||||
Shares used for taxable EPS calculation | 114,353 | 84,884 | 76,600 | ||||||||||||||||||||||||||||||||||
REIT taxable income per share | $ | 1.28 | $ | 1.38 | $ | 1.17 | |||||||||||||||||||||||||||||||
Taxable income per share at taxable subsidiaries | $ | 0.54 | $ | 0.75 | $ | 0.42 | |||||||||||||||||||||||||||||||
Taxable income per share (3) | $ | 1.82 | $ | 2.13 | $ | 1.59 | |||||||||||||||||||||||||||||||
Dividends | |||||||||||||||||||||||||||||||||||||
Dividends declared | $ | 126,139 | $ | 94,134 | $ | 86,271 | |||||||||||||||||||||||||||||||
Dividends per share (4) | $ | 1.20 | $ | 1.18 | $ | 1.12 | |||||||||||||||||||||||||||||||
(1) | Taxable income for 2019 is an estimate until we file our tax returns for 2019. To the extent we expect to pay tax at the corporate level (generally as a result of activity at our taxable REIT subsidiaries), we are required to record a tax provision for GAAP reporting purposes. Any tax provision (or benefit) is not necessarily the actual amount of tax currently due (or receivable as a refund) as a portion of our provision (or benefit) is deferred in nature. It is our intention to retain any excess inclusion income generated in 2019 at our TRS and not pass it through to our shareholders. |
(2) | Reconciliation of GAAP income to taxable income (loss) for prior quarters is provided in the respective Redwood Reviews for those quarters. |
(3) | Taxable income (loss) per share is based on the number of shares outstanding at the end of each quarter. The annual taxable income (loss) per share is the sum of the quarterly per share estimates. |
(4) | Dividends in 2019 are expected to be characterized as 73% ordinary dividend income (or $92 million) and 27% long-term capital gain dividend income (or $34 million). Dividends in 2018 were characterized as 69% ordinary dividend income (or $65 million) and 31% long-term capital gain dividend income (or $29 million). Dividends in 2017 were characterized as 71% ordinary dividend income (or $61 million) and 29% qualified dividend income (or $25 million). |
THE REDWOOD REVIEW I 4TH QUARTER 2019 | See Appendix for details on non-GAAP measures. | Table 3: Taxable and GAAP Income Differences and Dividends 29 |
| Table 4: Financial Ratios and Book Value ($ in thousands, except per share data) | ||||||||||||||||||||||||
2019 Q4 | 2019 Q3 | 2019 Q2 | 2019 Q1 | 2018 Q4 | Twelve Months 2019 | ||||||||||||||||||||
Financial performance ratios | |||||||||||||||||||||||||
Net interest income | $ | 44,873 | $ | 33,513 | $ | 32,322 | $ | 31,765 | $ | 34,764 | $ | 142,473 | |||||||||||||
Corporate general and administrative expenses | $ | (15,436 | ) | $ | (12,727 | ) | $ | (12,448 | ) | $ | (12,394 | ) | $ | (8,188 | ) | $ | (53,005 | ) | |||||||
Total general and administrative expenses | $ | (42,443 | ) | $ | (26,815 | ) | $ | (26,255 | ) | $ | (23,159 | ) | $ | (19,253 | ) | $ | (118,672 | ) | |||||||
GAAP net income (loss) | $ | 49,143 | $ | 34,310 | $ | 31,266 | $ | 54,464 | $ | (913 | ) | $ | 169,183 | ||||||||||||
Average total assets | $ | 17,551,586 | $ | 14,017,627 | $ | 13,596,337 | $ | 11,795,343 | $ | 10,163,283 | $ | 14,255,384 | |||||||||||||
Average total equity | $ | 1,800,390 | $ | 1,591,792 | $ | 1,556,850 | $ | 1,452,282 | $ | 1,342,967 | $ | 1,601,259 | |||||||||||||
Corporate general and administrative expenses / average total equity | 3.43 | % | 3.20 | % | 3.20 | % | 3.41 | % | 2.44 | % | 3.31 | % | |||||||||||||
Total general and administrative expenses / average total equity | 9.43 | % | 6.74 | % | 6.75 | % | 6.38 | % | 5.73 | % | 7.41 | % | |||||||||||||
GAAP net income / average equity (GAAP ROE) | 10.92 | % | 8.62 | % | 8.03 | % | 15.00 | % | (0.27 | )% | 10.57 | % | |||||||||||||
Leverage ratios and book value per share | |||||||||||||||||||||||||
Short-term debt | $ | 2,176,591 | $ | 1,789,827 | $ | 2,227,183 | $ | 1,914,514 | $ | 2,138,686 | |||||||||||||||
Long-term debt | 2,970,415 | 2,971,552 | 2,584,499 | 2,584,499 | 2,584,499 | ||||||||||||||||||||
Total debt at Redwood | $ | 5,147,006 | $ | 4,761,379 | $ | 4,811,682 | $ | 4,499,013 | $ | 4,723,185 | |||||||||||||||
At consolidated securitization entities | |||||||||||||||||||||||||
ABS issued | 10,515,475 | 8,346,051 | 6,913,129 | 5,637,644 | 5,410,073 | ||||||||||||||||||||
Non-recourse short-term debt | 153,696 | 191,556 | 237,363 | 251,875 | 265,637 | ||||||||||||||||||||
Total ABS and non-recourse short-term debt | $ | 10,669,171 | $ | 8,537,607 | $ | 7,150,492 | $ | 5,889,519 | $ | 5,675,710 | |||||||||||||||
Consolidated debt (1) | $ | 15,816,177 | $ | 13,298,986 | $ | 11,962,174 | $ | 10,388,532 | $ | 10,398,895 | |||||||||||||||
Tangible stockholders' equity (2) | $ | 1,665,767 | $ | 1,735,938 | $ | 1,513,033 | $ | 1,497,032 | $ | 1,348,794 | |||||||||||||||
Total stockholders' equity | $ | 1,827,231 | $ | 1,785,059 | $ | 1,564,032 | $ | 1,549,927 | $ | 1,348,794 | |||||||||||||||
Total capital (3) | $ | 2,596,984 | $ | 2,554,118 | $ | 2,337,442 | $ | 2,322,515 | $ | 2,120,572 | |||||||||||||||
Recourse leverage ratio (recourse debt at Redwood to tangible stockholders' equity)(4) | 3.1x | 2.7x | 3.2x | 3.0x | 3.5x | ||||||||||||||||||||
Consolidated debt to tangible stockholders' equity | 9.5x | 7.7x | 7.9x | 6.9x | 7.7x | ||||||||||||||||||||
Shares outstanding at period end (in thousands) | 114,353 | 112,102 | 97,715 | 96,866 | 84,884 | ||||||||||||||||||||
Book value per share | $ | 15.98 | $ | 15.92 | $ | 16.01 | $ | 16.00 | $ | 15.89 | |||||||||||||||
(1) | Amounts presented in Consolidated debt above do not include deferred issuance costs or debt discounts. |
(2) | At December 31, 2019, September 30, 2019, June 30, 2019, March 31, 2019, and December 31, 2018, tangible stockholders' equity excluded $161 million, $49 million, $51 million, $53 million and $0, respectively, of goodwill and intangible assets. |
(3) | Our total capital of $2.6 billion at December 31, 2019 included $1.8 billion of equity capital and $0.8 billion of unsecured corporate debt. |
(4) | Excludes ABS issued and non-recourse debt at consolidated entities. See Table 5 for additional detail on our ABS issued and short-term debt at consolidated entities. |
THE REDWOOD REVIEW I 4TH QUARTER 2019 | See Appendix for details on non-GAAP measures. | Table 4: Financial Ratios and Book Value 30 |
| Table 5: Consolidating Balance Sheet ($ in thousands) | ||||||||||||||||||||||||||||||||||||||||||||||||||||||||
December 31, 2019 | September 30, 2019 | ||||||||||||||||||||||||||||||||||||||||||||||||||||||||
Consolidated VIEs (1) | Consolidated VIEs (1) | ||||||||||||||||||||||||||||||||||||||||||||||||||||||||
At Redwood (1) | Sequoia Choice | Freddie Mac SLST | Freddie Mac K-Series | CAFL | Other (2) | Redwood Consolidated | At Redwood (1) | Sequoia Choice | Freddie Mac SLST | Freddie Mac K-Series | CAFL | Other (2) | Redwood Consolidated | ||||||||||||||||||||||||||||||||||||||||||||
Residential loans | $ | 2,648,282 | $ | 2,291,463 | $ | 2,367,215 | $ | — | $ | — | $ | 407,890 | $ | 7,714,850 | $ | 3,193,105 | $ | 2,618,316 | $ | 2,441,223 | $ | — | $ | — | $ | 429,159 | $ | 8,681,803 | |||||||||||||||||||||||||||||
Business purpose residential loans | 1,314,191 | — | — | — | 2,192,552 | — | 3,506,743 | 336,035 | — | — | — | — | — | 336,035 | |||||||||||||||||||||||||||||||||||||||||||
Multifamily loans | — | — | — | 4,408,524 | — | — | 4,408,524 | — | — | — | 3,791,622 | — | — | 3,791,622 | |||||||||||||||||||||||||||||||||||||||||||
Real estate securities | 1,099,874 | — | — | — | — | — | 1,099,874 | 1,285,426 | — | — | — | — | — | 1,285,426 | |||||||||||||||||||||||||||||||||||||||||||
Other investments | 173,328 | — | — | — | 184,802 | 358,130 | 109,391 | — | — | — | 238,316 | 347,707 | |||||||||||||||||||||||||||||||||||||||||||||
Cash and cash equivalents | 187,951 | — | — | — | — | 9,015 | 196,966 | 373,388 | — | — | — | — | 21,240 | 394,628 | |||||||||||||||||||||||||||||||||||||||||||
Other assets (3) | 639,945 | 9,851 | 7,758 | 13,539 | 11,367 | 27,893 | 710,353 | 582,401 | 10,821 | 7,299 | 11,300 | — | 27,241 | 639,062 | |||||||||||||||||||||||||||||||||||||||||||
Total assets | $ | 6,063,571 | $ | 2,301,314 | $ | 2,374,973 | $ | 4,422,063 | $ | 2,203,919 | $ | 629,600 | $ | 17,995,440 | $ | 5,879,746 | $ | 2,629,137 | $ | 2,448,522 | $ | 3,802,922 | $ | — | $ | 715,956 | $ | 15,476,283 | |||||||||||||||||||||||||||||
Short-term debt | $ | 2,176,591 | $ | — | $ | — | $ | — | $ | — | $ | 152,554 | $ | 2,329,145 | $ | 1,789,614 | $ | — | $ | — | $ | — | $ | — | $ | 191,203 | $ | 1,980,817 | |||||||||||||||||||||||||||||
Other liabilities | 321,274 | 7,759 | 5,374 | 12,887 | 7,485 | 15,538 | 370,317 | 365,293 | 8,964 | 5,498 | 10,805 | — | 20,074 | 410,634 | |||||||||||||||||||||||||||||||||||||||||||
ABS issued | — | 2,037,198 | 1,918,322 | 4,156,239 | 2,001,251 | 402,465 | 10,515,475 | — | 2,361,111 | 1,987,473 | 3,577,577 | — | 419,890 | 8,346,051 | |||||||||||||||||||||||||||||||||||||||||||
Long-term debt, net | 2,953,272 | — | — | — | — | — | 2,953,272 | 2,953,722 | — | — | — | — | — | 2,953,722 | |||||||||||||||||||||||||||||||||||||||||||
Total liabilities | 5,451,137 | 2,044,957 | 1,923,696 | 4,169,126 | 2,008,736 | 570,557 | 16,168,209 | 5,108,629 | 2,370,075 | 1,992,971 | 3,588,382 | — | 631,167 | 13,691,224 | |||||||||||||||||||||||||||||||||||||||||||
Equity | 612,434 | 256,357 | 451,277 | 252,937 | 195,183 | 59,043 | 1,827,231 | 771,117 | 259,062 | 455,551 | 214,540 | — | 84,789 | 1,785,059 | |||||||||||||||||||||||||||||||||||||||||||
Total liabilities and equity | $ | 6,063,571 | $ | 2,301,314 | $ | 2,374,973 | $ | 4,422,063 | $ | 2,203,919 | $ | 629,600 | $ | 17,995,440 | $ | 5,879,746 | $ | 2,629,137 | $ | 2,448,522 | $ | 3,802,922 | $ | — | $ | 715,956 | $ | 15,476,283 | |||||||||||||||||||||||||||||
(1) | The format of this consolidating balance sheet is provided to more clearly delineate between the assets and liabilities belonging to securitization entities (Consolidated VIEs) that we are required to consolidate on our balance sheet in accordance with GAAP, and the assets that are legally ours and the liabilities of ours for which there is recourse to us. Each of these entities is independent of Redwood and of each other and the assets and liabilities of these entities are not owned by and are not legal obligations of ours. Our exposure to these entities is primarily through the financial interests we have retained or acquired in these entities (generally subordinate securities), the fair value of which is represented by our equity in each entity, as presented in this table. |
(2) | Includes our consolidated Legacy Sequoia and Servicing Investment entities. At December 31, 2019, our equity in the Legacy Sequoia and Servicing Investment entities was $6 million and $53 million, respectively. At September 30, 2019, our equity in the Legacy Sequoia and Servicing Investment entities was $10 million and $75 million, respectively. |
(3) | At both December 31, 2019 and September 30, 2019, other assets at Redwood included a total of $33 million of assets held by third-party custodians and pledged as collateral to the GSEs in connection with credit risk-sharing arrangements. These pledged assets can only be used to settle obligations to the GSEs under these risk-sharing arrangements. |
THE REDWOOD REVIEW I 4TH QUARTER 2019 | See Appendix for details on non-GAAP measures. | Table 5: Consolidating Balance Sheet 31 |

C O R E V E S T A C Q U I S I T I O N |
CoreVest Acquisition
On October 15, 2019, we acquired CoreVest American Finance Lender, LLC and several of its affiliates ("CoreVest"). CoreVest is a leading nationwide originator and portfolio manager of business purpose residential loans. The acquisition included the CoreVest operating platform and over $900 million of related financial assets. Total purchase consideration was $492 million and included $482 million of cash and approximately $10 million of Redwood stock issued to the CoreVest management team, subject to a two-year holding period. This stock-based consideration is treated as compensation for GAAP, and therefore not included in the GAAP purchase price.
The following table presents the fair value of the assets acquired and liabilities assumed through our acquisition of CoreVest.
Net Assets Acquired from CoreVest | |||||
($ in thousands) | |||||
Single-family rental loans held-for-sale | $ | 406,550 | |||
Business purpose bridge loans held-for-investment | 374,691 | ||||
Real estate securities (retained from CAFL) | 173,226 | ||||
Cash and cash equivalents | 30,685 | ||||
Other assets | 67,420 | ||||
Goodwill | 59,928 | ||||
Intangible assets | 56,500 | ||||
Deferred tax asset | 2,577 | ||||
Total assets acquired | 1,171,577 | ||||
Short-term debt, net | 663,275 | ||||
Accrued expenses and other liabilities | 25,991 | ||||
Total liabilities assumed | 689,266 | ||||
Total net assets acquired | $ | 482,311 | |||
Ñ | We paid $452 million of cash on a net basis, after adjusting for the $31 million of cash and cash equivalents on balance sheet at acquisition. |
Ñ | In November 2019, we securitized the majority of the $407 million of single-family rental loans that were on balance sheet at acquisition. |
Ñ | Business purpose bridge loans and real estate securities were acquired with in-place financing. Subsequent to the acquisition, we restructured and improved the terms for these borrowing facilities. |
Ñ | The acquired intangible assets of $57 million have useful lives of up to 7 years for accounting purposes and we expect to record $0.02 per share of intangible amortization expense per quarter in 2021, related to these assets. |
See Appendix for details on non-GAAP measures. Detailed endnotes are included at the end of this Redwood Review. |
THE REDWOOD REVIEW I 4TH QUARTER 2019 |
33 |
C O R E V E S T A C Q U I S I T I O N |
The following table presents CoreVest's stand-alone net income and non-GAAP core earnings for the fourth quarter of 2019, which are included in our consolidated financial results.
CoreVest GAAP Net Income and Non-GAAP Core Earnings | |||||||||||||
($ in millions) | |||||||||||||
Three Months Ended December 31, 2019 | |||||||||||||
Investments | Mortgage Banking | Total | |||||||||||
Net interest income | $ | 9 | $ | 1 | $ | 11 | |||||||
Non-interest income | |||||||||||||
Mortgage banking activities, net | — | 23 | 23 | ||||||||||
Investment fair value changes, net | (4 | ) | — | (4 | ) | ||||||||
Realized gains, net | — | — | — | ||||||||||
Total non-interest income, net | (4 | ) | 24 | 19 | |||||||||
General and administrative expenses | — | (8 | ) | (8 | ) | ||||||||
Other expenses | — | (2 | ) | (2 | ) | ||||||||
Provision for income taxes | — | (1 | ) | (1 | ) | ||||||||
Net income | $ | 6 | $ | 14 | $ | 18 | |||||||
Core earnings adjustments | |||||||||||||
Eliminate mark-to-market changes on long-term investments and associated derivatives | 1 | — | 1 | ||||||||||
Eliminate purchase accounting adjustments | — | 2 | 2 | ||||||||||
Eliminate corporate acquisition and related expenses | — | 1 | 1 | ||||||||||
Income tax adjustments associated with core earnings adjustments | — | (1 | ) | (1 | ) | ||||||||
Core earnings | $ | 7 | $ | 16 | $ | 21 | |||||||
Ñ | GAAP net interest income from investments includes cash interest earned from the acquisition date through December 31, 2019, and is comprised of $5 million from SFR securities and $4 million from bridge loans. |
Ñ | Investment fair value changes, net of negative $4 million, represents the change in value of our investments during the fourth quarter, of which $3 million (representing basis changes) is included in core net interest income, with the remainder excluded from core earnings. |
Ñ | Mortgage banking activities, net includes the change in fair value of loans originated post-acquisition as well as a benefit from incremental profitability on the inventory of SFR loans acquired from CoreVest that we sold through our first CoreVest sponsored securitization in November 2019. |
Ñ | GAAP general and administrative expenses include $1.4 million of commission expenses, which vary with loan origination volume and mix, as well as $1 million of acquisition-related compensation expense associated with the portion of the purchase consideration paid in Redwood stock (which is excluded for core earnings). |
See Appendix for details on non-GAAP measures. Detailed endnotes are included at the end of this Redwood Review. |
THE REDWOOD REVIEW I 4TH QUARTER 2019 |
34 |
D I V I D E N D S A N D T A X A B L E I N C O M E |
Dividends and Taxable Income
Summary
As a REIT, Redwood is required to distribute to shareholders at least 90% of its annual REIT taxable income, excluding net capital gains. To the extent Redwood retains REIT taxable income, including net capital gains, it is taxed at corporate tax rates. Redwood also earns taxable income at its taxable REIT subsidiaries (TRS), which it is not required to distribute.
Dividends Overview
In recent years, our Board of Directors has maintained a practice of paying regular quarterly dividends, including when in excess of the amount required to comply with the provisions of the Internal Revenue Code applicable to REITs. In February 2020, the Board of Directors declared a regular dividend of $0.32 per share for the first quarter of 2020, which is payable on March 30, 2020 to shareholders of record on March 16, 2020.
REIT Taxable Income and Dividend Distribution Requirement
Our estimated REIT taxable income was $44 million, or $0.39 per share, for the fourth quarter of 2019 and $39 million, or $0.34 per share, for the third quarter of 2019. Under normal circumstances, our minimum REIT dividend requirement would be 90% of our annual REIT taxable income. However, we currently maintain a $39 million federal net operating loss carry forward (NOL) at the REIT that affords us the option of retaining REIT taxable income up to the NOL amount, tax free, rather than distributing it as dividends. Federal income tax rules require the dividends paid deduction to be applied to reduce REIT taxable income before the applicability of NOLs is considered. Our estimated REIT taxable income exceeded our dividend distributions in 2019; therefore, we expect to utilize $10 million of our NOL in 2019 and the remaining $28 million will carry forward into 2020. See Table 3 in the Financial Tables section of this Redwood Review for additional detail on our REIT and total taxable income.
Income Tax Characterization of Dividend for Shareholders
Our 2019 dividend distributions are expected to be characterized for federal income tax purposes as 73% ordinary dividend income and 27% long-term capital gain dividend income. Under the federal income tax rules applicable to REITs, none of the 2019 dividend distributions are expected to be characterized as a return of capital or qualified dividends.
Beginning in 2018, the Tax Cuts and Jobs Act provides that individual taxpayers may generally deduct 20% of their ordinary REIT dividends from taxable income. This results in a maximum federal effective tax rate of 29.6% on an individual taxpayer's ordinary REIT dividends, compared to the highest marginal rate of 37%. This deduction does not apply to REIT dividends classified as qualified dividend income or long-term capital gain dividends, as those dividends are taxed at a maximum rate of 20% for individuals.
See Appendix for details on non-GAAP measures. Detailed endnotes are included at the end of this Redwood Review. |
THE REDWOOD REVIEW I 4TH QUARTER 2019 |
35 |
N O N - G A A P M E A S U R E M E N T S |
Information about our non-GAAP financial measures is provided in this Appendix, which supplements the descriptions and information about these non-GAAP financial measures that is set forth in previous sections of this Redwood Review. In addition, this Appendix provides reconciliations of non-GAAP financial measures to the most directly comparable GAAP financial measures to the extent those reconciliations are not otherwise set forth in the previous sections of this Redwood Review or in the Financial Tables in the Appendix to this Redwood Review.
What is Core Earnings?
Core earnings is a non-GAAP measure of Redwood’s earnings and results of operations. Specifically, management has defined core earnings as: GAAP net income adjusted to (i) eliminate the impact of quarterly mark-to-market changes on the fair value of long-term investments (and associated derivatives) related to changes in benchmark interest rates and credit spreads, (ii) include the cumulative net gains or losses on long-term investments accounted for as trading securities under GAAP that were sold during the period presented, net of any gains or losses from derivatives associated with the investments sold, and (iii) include the hypothetical income taxes associated with core earnings adjustments.
In addition, management has also excluded from core earnings several items related to our acquisitions of 5 Arches and CoreVest. These items include: the exclusion of a one-time gain associated with the re-measurement of our initial minority investment and purchase option in 5 Arches; ongoing adjustments to exclude amortization of intangible assets acquired in the 5 Arches transaction; changes in fair value of the contingent consideration liability related to the remaining purchase consideration for the 5 Arches platform; and exclusion of certain transaction expenses associated with our acquisition of CoreVest.
What are the Core Earnings adjustments that relate to “eliminating the impact of quarterly mark-to-market changes on the fair value of long-term investments (and associated derivatives) related to changes in benchmark interest rates and credit spreads”?
Under GAAP there are quarterly mark-to-market changes in the value of our long-term investments in loans, trading securities, and other investments accounted for under the fair value option, as well as the associated derivatives, that result from changes in benchmark interest rates and credit spreads and which may not be reflective of the total return management would expect to earn from them over the longer-term. These mark-to-market changes, to the extent they do not reflect a change in basis or net interest paid or received on hedges, are eliminated from GAAP net income when management calculates core earnings.
Beginning with the first quarter of 2019, management updated its calculation of this adjustment for certain investments accounted for under the fair value option that have significant differences between expected cash interest and expected yield-to-maturity. For these assets management does not eliminate mark-to-market changes in value that are attributable to a change in basis from the expected receipt of future cash flows.
THE REDWOOD REVIEW I 4TH QUARTER 2019 |
36 |
N O N - G A A P M E A S U R E M E N T S |
• | Investments impacted by this change include certain multifamily mezzanine securities and B-pieces, residential securities relating to re-performing residential loans, our servicer advance investment and related excess spread investment, and beginning in the second quarter of 2019, we also included certain subordinate securities. |
• | This change was introduced because there is an increasing amount of these types of investments in Redwood’s portfolio and management believes this change represents a more precise method of eliminating mark-to-market changes in the value of these assets which may not be reflective of the total return management would expect to earn from them over the longer-term. |
During the third quarter of 2019, management updated its calculation of the quarterly change in basis for certain investments accounted for under the fair value option. This update results in presenting this aspect of core earnings more consistently with core earnings adjustments related to cumulative net gains and losses on long-term investments accounted for as trading securities – i.e., as measured against original basis consistently across these different types of investments.
What are the Core Earnings adjustments that relate to “including the cumulative net gains or losses on long-term investments accounted for as trading securities under GAAP that were sold during the period presented, net of any gains or losses from derivatives associated with the investments sold”?
The core earnings adjustments to include cumulative net gains or losses from the sale of trading securities is to ensure that core earnings presents consistently the impact of the sales of investments regardless of whether they are accounted for under GAAP as (i) trading securities or (ii) available-for-sale securities, as outlined below.
• | Under GAAP, available-for-sale securities are reported at their fair value with periodic changes in fair value recognized through the balance sheet in Shareholders’ equity. When an available-for-sale security is sold, the cumulative gain or loss since purchase is recognized through the income statement, in Realized gains, net, in the period the sale occurred. As a result, any such cumulative gains or losses are reflected in core earnings in the period the sale occurred. |
• | Under GAAP, trading securities are reported at their fair value with periodic changes in fair value recognized through the income statement in Investment fair value changes, net. Certain of these periodic changes in fair value (as described above) are excluded from core earnings. Core earnings includes an adjustment to include the cumulative net gains or losses (from purchase through the sale of the investment) for sold trading securities in the period they are sold. The result is to consistently present within core earnings the cumulative gains or losses from the sale of long-term investments, regardless of how they are accounted for under GAAP. |
THE REDWOOD REVIEW I 4TH QUARTER 2019 |
37 |
N O N - G A A P M E A S U R E M E N T S |
What are the Core Earnings adjustments that relate to Redwood’s acquisitions of 5 Arches and CoreVest?
The adjustments related to our acquisition of 5 Arches, which was completed during the first quarter 2019, include the elimination of the one-time gain associated with the re-measurement of our initial minority investment and purchase option in 5 Arches and an ongoing adjustment to exclude amortization of intangible assets. Additionally, beginning in the second quarter of 2019, we exclude from our calculation of core earnings changes in the fair value of the contingent consideration liability related to the remaining purchase consideration for the 5 Arches platform.
In addition, for the third quarter of 2019, we have excluded from core earnings certain transaction expenses associated with Redwood's acquisition of CoreVest, which was completed during the fourth quarter of 2019.
What are the Core Earnings adjustments that relate to “including the hypothetical income taxes associated with core earnings adjustments”?
Core earnings also includes adjustments to show the hypothetical tax provision or benefit that would be associated with the core earnings adjustments made to net income. As a REIT, we are subject to income taxes on earnings generated at our taxable REIT subsidiaries (TRS) and generally not subject to income taxes on earnings generated at the REIT (to the extent we distribute our REIT taxable income as dividends). In order to present the hypothetical income taxes associated with core earnings adjustments made to net income, estimated effective tax rates are applied to the core earnings adjustments occurring within our TRS.
Why does management believe that Core Earnings provides useful information to investors in Redwood? How does management use Core Earnings to analyze Redwood’s performance?
Management utilizes this core earnings measure internally as one way of analyzing Redwood’s performance over multiple periods, as management believes it provides useful comparative results absent the impact of certain quarterly mark-to-market changes on investments held through the end of the period presented that may not be reflective of the total return management would expect to earn from them over the longer term, and inclusive of all realized gains and losses from securities sales, regardless of accounting designations.
In addition, management believes that it is useful for core earnings to be a measure of Redwood‘s performance that eliminates the impact of several items related to our acquisitions of 5 Arches and CoreVest that management believes may not be reflective of the underlying performance of Redwood’s ongoing operations (and which, therefore, may not be reflective of their impact over the longer-term).
THE REDWOOD REVIEW I 4TH QUARTER 2019 |
38 |
N O N - G A A P M E A S U R E M E N T S |
Has the definition of Core Earnings changed since Redwood previously published its Core Earnings? If so, has Redwood adjusted its presentation of past period Core Earnings to reflect the updated definition?
As noted above, beginning with the first quarter of 2019, management changed its definition of core earnings to exclude from core earnings several items related to our acquisition of 5 Arches. In addition, and as also noted above, beginning with the first quarter of 2019 management updated its calculation for eliminating the impact of quarterly mark-to-market changes on the fair value of long-term investments (and associated derivatives) related to changes in benchmark interest rates and credit spreads for certain types of investments, including certain investments accounted for under the fair value option that have significant differences between expected cash interest and expected yield-to-maturity.
Beginning with the third quarter of 2019, as noted above, management has excluded from core earnings certain transaction expenses associated with our acquisition of CoreVest. In addition, during the third quarter of 2019, management updated its calculation of the quarterly change in basis for certain investments accounted for under the fair value option.
For consistency of presentation, to the extent core earnings for any prior period is republished or represented, core earnings for that prior period will reflect the updated calculation methodology.
The following table presents a reconciliation of GAAP net income to non-GAAP core earnings for the fourth and third quarters of 2019.
THE REDWOOD REVIEW I 4TH QUARTER 2019 |
39 |
N O N - G A A P M E A S U R E M E N T S |
Reconciliation to Non-GAAP Core Earnings | ||||||||||||
($ in millions) | ||||||||||||
Three Months Ended December 31, 2019 | ||||||||||||
GAAP | Adjustments | Non-GAAP | ||||||||||
Net interest income | ||||||||||||
From portfolio investments | $ | 38 | $ | (10 | ) | $ | 28 | |||||
From mortgage banking activities | 7 | — | 7 | |||||||||
Non-interest income | ||||||||||||
Residential mortgage banking activities, net | 17 | — | 17 | |||||||||
BPL mortgage banking activities, net | 30 | — | 30 | |||||||||
Investment fair value changes, net (1) | 1 | (1 | ) | — | ||||||||
Other income, net (2) | 5 | — | 5 | |||||||||
Realized gains, net (3) | 6 | 17 | 23 | |||||||||
Total non-interest income, net | 58 | 16 | 74 | |||||||||
General and administrative expenses (4) | (42 | ) | 1 | (41 | ) | |||||||
Other expenses | (7 | ) | 7 | — | ||||||||
Provision for income taxes (5) | (4 | ) | (2 | ) | (7 | ) | ||||||
GAAP Net Income/Non-GAAP Core Earnings | $ | 49 | $ | 12 | $ | 61 | ||||||
Earnings per diluted common share | $ | 0.38 | $ | 0.45 | ||||||||
Three Months Ended September 30, 2019 | ||||||||||||
GAAP | Adjustments | Non-GAAP | ||||||||||
Net interest income | ||||||||||||
From portfolio investments | $ | 28 | $ | (3 | ) | $ | 25 | |||||
From mortgage banking activities | 6 | — | 6 | |||||||||
Non-interest income | ||||||||||||
Residential mortgage banking activities, net | 5 | — | 5 | |||||||||
BPL mortgage banking activities, net | 4 | — | 4 | |||||||||
Investment fair value changes, net (1) | 11 | (11 | ) | — | ||||||||
Other income, net (2) | 4 | — | 4 | |||||||||
Realized gains, net (3) | 5 | 20 | 25 | |||||||||
Total non-interest income, net | 30 | 9 | 38 | |||||||||
General and administrative expenses (4) | (27 | ) | 2 | (25 | ) | |||||||
Other expenses | (2 | ) | 2 | — | ||||||||
Provision for income taxes (5) | — | (1 | ) | — | ||||||||
GAAP Net Income/Non-GAAP Core Earnings | $ | 34 | $ | 9 | $ | 43 | ||||||
Earnings per diluted common share | $ | 0.31 | $ | 0.37 | ||||||||
(1) | References in this Redwood Review to core investment fair value changes, net refer to GAAP investment fair value changes, net as adjusted by the amount described in the "Adjustments" column, as further described above under the heading "What is Core Earnings?" |
(2) | References in this Redwood Review to core other income net, refer to GAAP other income, net as adjusted by the amount described in the "Adjustments" column, as further described above under the heading "What is Core Earnings?" |
(3) | References in this Redwood Review to core realized gains, net refer to GAAP realized gains, net as adjusted by the amount described in the "Adjustments" column, as further described above under the heading "What is Core Earnings?" |
(4) | References in this Redwood Review to core general and administrative expenses refer to GAAP general and administrative expenses as adjusted by the amount described in the "Adjustments" column, as further described above under the heading "What is Core Earnings?" |
(5) | References in this Redwood Review to core provision for income taxes refer to GAAP provision for income taxes as adjusted by the amount described in the "Adjustments" column, as further described above under the heading "What is Core Earnings?" |
THE REDWOOD REVIEW I 4TH QUARTER 2019 |
40 |
N O N - G A A P M E A S U R E M E N T S |
What are the following non-GAAP measures and where can I find more information about them?
• | Core other income, net |
• | Core realized gains, net |
• | Core general and administrative expenses |
• | Core provision for income taxes |
All four of these non-GAAP measures correspond with line items in our income statement that are adjusted in connection with calculating core earnings as described above. Each of these four non-GAAP measures is included in the “Reconciliation of Non-GAAP Core Earnings” table above, along with a reconciliation to the most directly comparable GAAP financial measures.
What is Core ROE and Core Return Contribution?
We calculate non-GAAP core return on equity, or core ROE, in a manner consistent with management's definition of core earnings, as described above. Core ROE reflects GAAP ROE adjusted to reflect core earnings adjustments and is shown and reconciled to GAAP ROE in the tables that follow.
For each of our business segments, we calculate non-GAAP core return contribution (or segment core ROE) in a manner consistent with management's definition of core earnings, as described above. Core return contribution for each segment reflects GAAP return contribution for that segment adjusted to reflect the portion of core earnings adjustments allocable to that segment and is shown and reconciled to GAAP return contribution for each segment in the tables that follow.
What are Core Mortgage Banking Results and Core Investment Results?
For each of our residential lending and business purpose lending segments, we calculate core mortgage banking results and core investment results in a manner consistent with management’s definition of core earnings, as described above. Core mortgage banking results and core investment results for these segments reflect GAAP mortgage banking results and GAAP investment results for these segments adjusted to reflect the portion of core earnings adjustments allocable to the respective components of these segments and are shown and reconciled to GAAP mortgage banking results and GAAP investment results for each segment in the tables that follow.
What is Core Pre-Tax Margin?
Core pre-tax margin is a measure of profitability that indicates how much of each dollar of revenue is left over after expenses, other than taxes. For each of our residential lending and business purpose lending segments, we calculate core pre-tax margin on a non-GAAP core basis as the sum of mortgage banking net interest income and mortgage banking activities, less general and administrative expenses, divided by the sum of mortgage banking net interest income and mortgage banking activities, in each case, adjusted in connection with calculating core earnings as described above. Core pre-tax margin is shown and reconciled to GAAP pre-tax margin in the tables that follow.
THE REDWOOD REVIEW I 4TH QUARTER 2019 |
41 |
N O N - G A A P M E A S U R E M E N T S |
Below we present a reconciliation of GAAP net income to non-GAAP core earnings by segment for the fourth and third quarters of 2019.
Reconciliation to Non-GAAP Core Earnings by Business Segment | ||||||||||||||||||||||||
($ in millions) | ||||||||||||||||||||||||
Three Months Ended December 31, 2019 | ||||||||||||||||||||||||
Residential Lending | Business Purpose Lending | Multifamily Investments | Third-Party Residential Investments | Corporate | Total | |||||||||||||||||||
Net interest income | ||||||||||||||||||||||||
From portfolio investments | $ | 14 | $ | 11 | $ | 2 | $ | 9 | $ | 1 | $ | 37 | ||||||||||||
From mortgage banking activities | 5 | 2 | — | — | — | 7 | ||||||||||||||||||
Non-interest income | ||||||||||||||||||||||||
Mortgage banking activities, net | 17 | 30 | — | — | — | 46 | ||||||||||||||||||
Investment fair value changes, net | (11 | ) | (5 | ) | 8 | 9 | (1 | ) | — | |||||||||||||||
Other income, net | 3 | 2 | 1 | — | — | 5 | ||||||||||||||||||
Realized gains, net | 1 | — | — | 5 | — | 6 | ||||||||||||||||||
Total non-interest income, net | 9 | 26 | 9 | 14 | (1 | ) | 58 | |||||||||||||||||
General and administrative expenses | (10 | ) | (15 | ) | (1 | ) | (1 | ) | (15 | ) | (42 | ) | ||||||||||||
Other expenses | — | (4 | ) | — | — | (3 | ) | (7 | ) | |||||||||||||||
Provision for income taxes | (2 | ) | (1 | ) | — | (1 | ) | — | (4 | ) | ||||||||||||||
GAAP Net Income | $ | 16 | $ | 19 | $ | 11 | $ | 21 | $ | (18 | ) | $ | 49 | |||||||||||
Core earnings adjustments: | ||||||||||||||||||||||||
Eliminate mark-to-market changes on long-term investments and associated derivatives | 1 | 1 | (6 | ) | (8 | ) | 1 | (11 | ) | |||||||||||||||
Include cumulative gain on long-term investments sold, net | 3 | — | 3 | 12 | — | 17 | ||||||||||||||||||
Eliminate purchase accounting adjustments | — | 4 | — | — | 3 | 7 | ||||||||||||||||||
Eliminate corporate acquisition and related expenses | — | 1 | — | — | — | 1 | ||||||||||||||||||
Income tax adjustments associated with core earnings adjustments | — | (1 | ) | — | (1 | ) | (1 | ) | (2 | ) | ||||||||||||||
Non-GAAP Core Earnings | $ | 20 | $ | 24 | $ | 7 | $ | 24 | $ | (15 | ) | $ | 61 | |||||||||||
Average allocated equity | $ | 466 | $ | 427 | $ | 146 | $ | 294 | $ | 468 | $ | 1,801 | ||||||||||||
GAAP ROE | 14 | % | 18 | % | 31 | % | 29 | % | N/A | 11 | % | |||||||||||||
Core ROE | 17 | % | 23 | % | 20 | % | 33 | % | N/A | 14 | % | |||||||||||||
THE REDWOOD REVIEW I 4TH QUARTER 2019 |
42 |
N O N - G A A P M E A S U R E M E N T S |
Reconciliation to Non-GAAP Core Earnings by Business Segment | ||||||||||||||||||||||||
($ in millions) | ||||||||||||||||||||||||
Three Months Ended September 30, 2019 | ||||||||||||||||||||||||
Residential Lending | Business Purpose Lending | Multifamily Investments | Third-Party Residential Investments | Corporate | Total | |||||||||||||||||||
Net interest income | ||||||||||||||||||||||||
From portfolio investments | $ | 14 | $ | 2 | $ | 3 | $ | 8 | $ | 1 | $ | 28 | ||||||||||||
From mortgage banking activities | 5 | 1 | — | — | — | 6 | ||||||||||||||||||
Non-interest income | ||||||||||||||||||||||||
Mortgage banking activities, net | 5 | 4 | — | — | — | 10 | ||||||||||||||||||
Investment fair value changes, net | (11 | ) | (1 | ) | 7 | 17 | — | 11 | ||||||||||||||||
Other income, net | 2 | 2 | 1 | — | — | 4 | ||||||||||||||||||
Realized gains, net | — | — | — | 5 | — | 5 | ||||||||||||||||||
Total non-interest income, net | (4 | ) | 5 | 8 | 21 | — | 30 | |||||||||||||||||
General and administrative expenses | (6 | ) | (7 | ) | — | (1 | ) | (13 | ) | (27 | ) | |||||||||||||
Other expenses | — | (2 | ) | — | — | — | (2 | ) | ||||||||||||||||
Provision for income taxes | — | — | — | — | — | — | ||||||||||||||||||
GAAP Net Income | $ | 9 | $ | (1 | ) | $ | 10 | $ | 29 | $ | (13 | ) | $ | 34 | ||||||||||
Core earnings adjustments: | ||||||||||||||||||||||||
Eliminate mark-to-market changes on long-term investments and associated derivatives | 4 | 1 | (4 | ) | (15 | ) | — | (14 | ) | |||||||||||||||
Include cumulative gain on long-term investments sold, net | 1 | — | 10 | 9 | — | 20 | ||||||||||||||||||
Eliminate purchase accounting adjustments | — | — | — | — | — | (1 | ) | |||||||||||||||||
Eliminate corporate acquisition and related expenses | — | 2 | — | — | — | 2 | ||||||||||||||||||
Income tax adjustments associated with core earnings adjustments | — | — | — | — | 2 | 2 | ||||||||||||||||||
Non-GAAP Core Earnings | $ | 14 | $ | 2 | $ | 16 | $ | 23 | $ | (11 | ) | $ | 43 | |||||||||||
Average allocated equity | $ | 556 | $ | 87 | $ | 159 | $ | 308 | $ | 482 | $ | 1,591 | ||||||||||||
GAAP ROE | 6 | % | (3 | )% | 25 | % | 38 | % | N/A | 9 | % | |||||||||||||
Core ROE | 10 | % | 8 | % | 39 | % | 30 | % | N/A | 11 | % | |||||||||||||
THE REDWOOD REVIEW I 4TH QUARTER 2019 |
43 |
N O N - G A A P M E A S U R E M E N T S |
Below we present a reconciliation of the components our residential lending and business purpose lending segments on a GAAP and non-GAAP basis for the fourth and third quarters of 2019.
Residential Lending: Reconciliation to Non-GAAP Core Earnings | |||||||||||||||||||||||||
($ in millions) | |||||||||||||||||||||||||
Three Months Ended | |||||||||||||||||||||||||
12/31/2019 | 9/30/2019 | ||||||||||||||||||||||||
Investments | Mortgage Banking | Total Residential Lending | Investments | Mortgage Banking | Total Residential Lending | ||||||||||||||||||||
Net interest income | $ | 14 | $ | 5 | $ | 20 | $ | 14 | $ | 5 | $ | 19 | |||||||||||||
Non-interest income | |||||||||||||||||||||||||
Mortgage banking activities, net | — | 17 | 17 | — | 5 | 5 | |||||||||||||||||||
Investment fair value changes, net | (11 | ) | — | (11 | ) | (11 | ) | — | (11 | ) | |||||||||||||||
Other income, net | 3 | — | 3 | 2 | — | 2 | |||||||||||||||||||
Realized gains, net | 1 | — | 1 | — | — | — | |||||||||||||||||||
Total non-interest income, net | (8 | ) | 17 | 9 | (9 | ) | 5 | (4 | ) | ||||||||||||||||
General and administrative expenses | (2 | ) | (9 | ) | (10 | ) | (1 | ) | (5 | ) | (6 | ) | |||||||||||||
Provision for income taxes | — | (2 | ) | (2 | ) | — | — | — | |||||||||||||||||
Net income | $ | 5 | $ | 11 | $ | 16 | $ | 4 | $ | 5 | $ | 9 | |||||||||||||
Core earnings adjustments: | |||||||||||||||||||||||||
Eliminate mark-to-market changes on long-term investments and associated derivatives | 1 | — | — | 4 | — | — | |||||||||||||||||||
Include cumulative gain on long-term investments sold, net | 3 | — | — | 1 | — | 1 | |||||||||||||||||||
Eliminate purchase accounting adjustments | — | — | — | — | — | — | |||||||||||||||||||
Eliminate corporate acquisition and related expenses | — | — | — | — | — | — | |||||||||||||||||||
Income tax adjustments associated with core earnings adjustments | — | — | — | — | — | — | |||||||||||||||||||
Non-GAAP Core Earnings | $ | 9 | $ | 11 | $ | 20 | $ | 9 | $ | 5 | $ | 14 | |||||||||||||
Average equity | $ | 336 | $ | 130 | $ | 466 | $ | 426 | $ | 130 | $ | 556 | |||||||||||||
GAAP ROE | 6 | % | 33 | % | 14 | % | 3 | % | 16 | % | 6 | % | |||||||||||||
Core ROE | 11 | % | 33 | % | 17 | % | 8 | % | 16 | % | 10 | % | |||||||||||||
GAAP pre-tax margin | 60 | % | 48 | % | |||||||||||||||||||||
Core pre-tax margin | 60 | % | 48 | % | |||||||||||||||||||||
THE REDWOOD REVIEW I 4TH QUARTER 2019 |
44 |
N O N - G A A P M E A S U R E M E N T S |
Business Purpose Lending: Reconciliation to Non-GAAP Core Earnings | |||||||||||||||||||||||||
($ in millions) | |||||||||||||||||||||||||
Three Months Ended | |||||||||||||||||||||||||
12/31/2019 | 9/30/2019 | ||||||||||||||||||||||||
Investments | Mortgage Banking | Total Business Purpose Lending | Investments | Mortgage Banking | Total Business Purpose Lending | ||||||||||||||||||||
Net interest income | $ | 11 | $ | 2 | $ | 13 | $ | 2 | $ | 1 | $ | 3 | |||||||||||||
Non-interest income | |||||||||||||||||||||||||
Mortgage banking activities, net | — | 30 | 30 | — | 4 | 4 | |||||||||||||||||||
Investment fair value changes, net | (5 | ) | — | (5 | ) | (11 | ) | — | (1 | ) | |||||||||||||||
Other income, net | — | 1 | 2 | — | 2 | 2 | |||||||||||||||||||
Realized gains, net | — | — | — | — | — | — | |||||||||||||||||||
Total non-interest income, net | (5 | ) | 31 | 26 | (1 | ) | 6 | 5 | |||||||||||||||||
General and administrative expenses | (1 | ) | (15 | ) | (15 | ) | — | (7 | ) | (7 | ) | ||||||||||||||
Other expenses | — | (4 | ) | (4 | ) | — | (2 | ) | (2 | ) | |||||||||||||||
Provision for income taxes | — | (1 | ) | (1 | ) | — | — | — | |||||||||||||||||
Net income | $ | 6 | $ | 13 | $ | 19 | $ | 1 | $ | (2 | ) | $ | (1 | ) | |||||||||||
Core earnings adjustments: | |||||||||||||||||||||||||
Eliminate mark-to-market changes on long-term investments and associated derivatives | 1 | — | 1 | 1 | — | 1 | |||||||||||||||||||
Include cumulative gain on long-term investments sold, net | — | — | — | — | — | — | |||||||||||||||||||
Eliminate purchase accounting adjustments | — | 4 | 4 | — | 2 | 2 | |||||||||||||||||||
Eliminate corporate acquisition and related expenses | — | 1 | 1 | — | — | — | |||||||||||||||||||
Income tax adjustments associated with core earnings adjustments | — | (1 | ) | (1 | ) | — | — | — | |||||||||||||||||
Non-GAAP Core Earnings | $ | 7 | $ | 17 | $ | 24 | $ | 2 | $ | — | $ | 2 | |||||||||||||
Average equity | $ | 172 | $ | 255 | $ | 427 | $ | 32 | $ | 55 | $ | 87 | |||||||||||||
GAAP ROE | 13 | % | 21 | % | 18 | % | 13 | % | (12 | )% | (3 | )% | |||||||||||||
Core ROE | 16 | % | 27 | % | 23 | % | 24 | % | (1 | )% | 8 | % | |||||||||||||
GAAP pre-tax margin | 43 | % | (24 | )% | |||||||||||||||||||||
Core pre-tax margin | 56 | % | 4 | % | |||||||||||||||||||||
THE REDWOOD REVIEW I 4TH QUARTER 2019 |
45 |
N O N - G A A P M E A S U R E M E N T S |
How are basic and diluted Core Earnings per share calculated? Where is a reconciliation of basic and diluted Core Earnings per share to basic and diluted earnings per share calculated in accordance with GAAP?
We use core earnings as described above to calculate basic and diluted core earnings per share. To calculate these measures, we follow the same methodology for calculating basic and diluted earnings per share for GAAP, but substitute core earnings for GAAP earnings in the calculation. A detailed presentation of these calculations is presented in Table 2 of the Financial Tables section of the Appendix to this Redwood Review.
What factors should be considered when comparing non-GAAP Core Earnings (and related non-GAAP measures) to GAAP financial measures?
We caution that core earnings, core other income, core realized gains, core general and administrative expenses, core provision for income taxes, core segment contribution, and core earnings per share should not be utilized in isolation, nor should they be considered as alternatives to GAAP net income, GAAP other income, GAAP realized gains, GAAP general and administrative expenses, GAAP provision for income taxes, GAAP segment contribution, GAAP net income per share, or other measurements of results of operations computed in accordance with GAAP.
THE REDWOOD REVIEW I 4TH QUARTER 2019 |
46 |
N O N - G A A P M E A S U R E M E N T S |
What supplemental information about Core Earnings is helpful to understand?
The following table presents the components of investment fair value changes, net, that are included and excluded from core earnings, by investment type, for the fourth and third quarters of 2019.
Components of Investment Portfolio Fair Value Changes, Net by Investment Type | ||||||||
($ in millions) | ||||||||
Three Months Ended | ||||||||
12/31/2019 | 9/30/2019 | |||||||
Market valuation changes on: | ||||||||
Residential loans held-for-investment at fair value | ||||||||
Change in fair value from the reduction in basis (1) | $ | (3 | ) | $ | (2 | ) | ||
Other fair value changes (2) | (10 | ) | 10 | |||||
Total change in fair value of residential loans held-for-investment | (13 | ) | 8 | |||||
Real estate securities classified as trading | ||||||||
Change in fair value from the reduction in basis (1) | (6 | ) | — | |||||
Other fair value changes (2) | 2 | 42 | ||||||
Total change in fair value of real estate securities | (4 | ) | 42 | |||||
Risk management derivatives | ||||||||
Interest component of hedges (3) | (2 | ) | — | |||||
Other fair value changes (4) | 19 | (37 | ) | |||||
Total change in fair value of risk management derivatives | 17 | (37 | ) | |||||
Total investment portfolio fair value changes, net | $ | 1 | $ | 12 | ||||
(1) | Reflects the change in fair value due to principal changes, which is calculated as the change in principal on a given investment during the period, multiplied by the amount that the acquisition price for that investment is above or below par in percentage terms or for certain securities, the change in fair value reflecting the expected receipt of cash flows. During the third quarter of 2019, we updated our calculation of the quarterly change in basis for certain investments accounted for under the fair value option. Prior period amounts presented above have been conformed. |
(2) | Reflects changes in prepayment assumptions and credit spreads on our residential loans, trading securities and conforming risk-sharing investments primarily due to changes in benchmark interest rates. This item is excluded from management's definition of core earnings. |
(3) | Reflects the net interest paid or received on hedges associated with fair value investments. |
(4) | Reflects the change in fair value of our risk management derivatives that are associated with changes in benchmark interest rates during the period. This item is excluded from management's definition of core earnings. |
What is Core Net Interest Income?
Core net interest income is a non-GAAP measure of Redwood’s net interest income. Management has defined core net interest income as GAAP net interest income adjusted to (i) include the change in basis for fair value investments (including loans held-for-investment at fair value and real estate securities classified as trading, among others) and (ii) include net interest received or paid on hedges associated with fair value investments.
THE REDWOOD REVIEW I 4TH QUARTER 2019 |
47 |
N O N - G A A P M E A S U R E M E N T S |
What are the Core Net Interest Income adjustments that relate to “including the change in basis for fair value investments (including loans held-for-investment at fair value and real estate securities classified as trading, among others)”?
For loans or securities that are carried at a fair value above or below their par value, any receipt of principal (or associated change in underlying notional principal) during the period results in a realization of the premium or discount to par (the “change in basis”) that affects yield. We also treat as a “change in basis” the periodic changes in net present value reflecting the expected receipt of cash flows on certain types of investments, including principal-only securities and investments that do not generally receive cash flows until maturity. We include these “change in basis” amounts in core net interest income as we view them similarly to discount accretion or premium amortization on an available-for-sale security, which is incorporated into interest income when calculating an effective yield.
What are the Core Net Interest Income adjustments that relate to “including net interest received or paid on hedges associated with fair value investments”?
Many of our investments pay a fixed rate of interest and are financed with floating rate debt. As interest rates rise, net interest income for these investments decreases. However, if these investments are hedged with swaps or other derivative instruments, there is an offsetting change in the net interest received or paid on the associated hedge. By including the net interest of associated hedges in core net interest income, it allows us to better assess our hedge-adjusted returns for investments we hedge.
Why does management believe that Core Net Interest Income provides useful information to investors in Redwood? How does management use Core Net Interest Income to analyze Redwood’s performance?
Management utilizes core net interest income internally as an additional metric to analyze the performance of its investments, as it believes it presents a more comprehensive view of an investment’s current return, by including the impact of hedges it uses to manage interest rate risk on an investment and also including the change in basis of an investment that factors into its economic yield.
Has the definition of Core Net Interest Income changed since Redwood previously published its Core Net Interest Income? If so, has Redwood adjusted it presentation of past period Core Net Interest Income to reflect the updated definition?
Beginning with the first quarter of 2019, management updated its calculation of the change in basis to include the periodic changes in net present value reflecting the expected receipt of cash flows on certain types of investments, including investments accounted for under the fair value option that have significant differences between expected cash interest and expected yield-to-maturity. (This change is consistent with the updated calculation, described above, of our core earnings adjustment for mark-to-market changes on these types of investments.)
THE REDWOOD REVIEW I 4TH QUARTER 2019 |
48 |
N O N - G A A P M E A S U R E M E N T S |
• | Investments impacted by this change include certain multifamily mezzanine securities and B-pieces, residential securities relating to re-performing residential loans, our servicer advance investment and related excess spread investment, and beginning in the second quarter of 2019, we also included certain subordinate securities accounted for under the fair value option. As noted above, these investments are principal-only securities and investments that do not generally receive cash flows until maturity. |
• | This change has been introduced because there is an increasing amount of these types of investments in Redwood’s portfolio and management believes this change represents a more precise method of determining the impact that this aspect of the change in basis for these fair value investments should have on core net interest income. |
During the third quarter of 2019, management updated its calculation of the quarterly change in basis for certain investments accounted for under the fair value option. This update results in presenting this aspect of core earnings more consistently with core earnings adjustments related to cumulative net gains and losses on long-term investments accounted for as trading securities – i.e., as measured against original basis consistently across these different types of investments.
As noted above with respect to core earnings, for consistency of presentation, to the extent core net interest income for any prior period is republished or represented, core net interest income for that prior period will reflect the updated calculation methodology.
The following table presents a reconciliation of GAAP net interest income to non-GAAP core net interest income for the fourth and third quarters of 2019.
Reconciliation to Non-GAAP Core Net Interest Income | ||||||||
($ in millions) | ||||||||
Three Months Ended | ||||||||
12/31/2019 | 9/30/2019 | |||||||
Net interest income | $ | 45 | $ | 34 | ||||
Adjustments | ||||||||
Change in basis of fair value investments | (8 | ) | (2 | ) | ||||
Interest component of hedges | (2 | ) | — | |||||
Non-GAAP core net interest income | $ | 35 | $ | 31 | ||||
THE REDWOOD REVIEW I 4TH QUARTER 2019 |
49 |
N O N - G A A P M E A S U R E M E N T S |
What factors should be considered when comparing non-GAAP Core Net Interest Income to GAAP net interest income?
We caution that core net interest income should not be utilized in isolation, nor should it be considered as an alternative to GAAP net interest income.
What are non-GAAP Core Investment Fair Value Changes, Net? What are the adjustments made to GAAP Investment Fair Value Changes, Net to calculate this non-GAAP measure?
Core investment fair value changes, net is a non-GAAP measure of Redwood’s investment fair value changes, net. Core investment fair value changes, net represents GAAP investment fair value changes, net, adjusted to exclude mark-to-market changes on long-term investments and associated derivatives, as described above.
Why does management calculate non-GAAP Core Investment Fair Value Changes, Net? How is this non-GAAP measure used by management?
This measure is used in, and results from, the calculation of core net interest income and our segment’s core net interest income. As a result, it is calculated and used for the same reasons, as described above, that management calculates and uses core net interest income.
THE REDWOOD REVIEW I 4TH QUARTER 2019 |
50 |
N O N - G A A P M E A S U R E M E N T S |
The following table presents a reconciliation of GAAP investment fair value changes, net to non-GAAP core investment fair value changes, net, for the fourth and third quarters of 2019.
Reconciliation to Non-GAAP Core Investment Fair Value Changes, Net | ||||||||
($ in millions) | ||||||||
Three Months Ended | ||||||||
12/31/2019 | 9/30/2019 | |||||||
Investment fair value changes, net | $ | 1 | $ | 11 | ||||
Core adjustments | ||||||||
Eliminate mark-to-market changes on long-term investments and associated derivatives | (1 | ) | (11 | ) | ||||
Non-GAAP Core Investment Fair Value Changes, Net | $ | — | $ | — | ||||
What factors should be considered when comparing Non-GAAP Core Investment Fair Value Changes, Net to GAAP investment fair value changes, net?
We caution that non-GAAP core investment fair value changes, net should not be utilized in isolation and should not be considered an alternative to GAAP investment fair value changes, net.
THE REDWOOD REVIEW I 4TH QUARTER 2019 |
51 |
F O R W A R D - L O O K I N G S T A T E M E N T S |
As noted above under the heading “Forward-Looking Statements,” this Redwood Review contains forward-looking statements within the meaning of the safe harbor provisions of the Private Securities Litigation Reform Act of 1995. Forward-looking statements involve numerous risks and uncertainties. Our actual results may differ from our expectations, estimates, and projections and, consequently, you should not rely on these forward-looking statements as predictions of future events. Forward-looking statements are not historical in nature and can be identified by words such as “anticipate,” “estimate,” “will,” “should,” “expect,” “believe,” “intend,” “seek,” “plan,” and similar expressions or their negative forms, or by references to strategy, plans, goals, or intentions. These forward-looking statements are subject to risks and uncertainties, including, among other things, those described in our Annual Report on Form 10-K under the caption “Risk Factors.” Other risks, uncertainties, and factors that could cause actual results to differ materially from those projected are described below and may be described from time to time in reports we file with the Securities and Exchange Commission, including reports on Forms 10-K, 10-Q, and 8-K. We undertake no obligation to update or revise forward-looking statements, whether as a result of new information, future events, or otherwise.
Statements regarding the following subjects, among others, are forward-looking by their nature: (i) statements we make regarding Redwood's business strategy and strategic focus, including statements relating to our overall market position, strategy and long-term prospects (including trends driving the flow of capital in the housing finance market, our strategic initiatives designed to capitalize on those trends, our ability to attract capital to finance those initiatives, our approach to raising capital, our ability to pay dividends in the future, and the prospects for federal housing finance reform); (ii) statements related to our financial outlook and expectations for 2020 and future years; (iii) statements related to our residential and business purpose lending platforms, including our positioning in the market and the expansion of our bridge lending business to include more robust construction/redevelopment opportunities; (iv) statements relating to the potential for regulatory reform and positioning Redwood to capitalize on resulting opportunities, including through the application of technological innovations; (v) statements we make relating to our recourse leverage ratio, including our statement that, as we continue to deploy our capital available for investment, we expect this leverage ratio to increase toward the middle of our 3.0x to 4.0x target range; (vi) statements relating to acquiring residential mortgage loans in the future that we have identified for purchase or plan to purchase, including the amount of such loans that we identified for purchase during the fourth quarter of 2019 and at December 31, 2019, and expected fallout and the corresponding volume of residential mortgage loans expected to be available for purchase; (vii) statements regarding business purpose loan originations, loans funded, and associated funding commitments, (viii) statements relating to our estimate of our available capital (including that we estimate our available capital at December 31, 2019 was approximately $260 million); (ix) statements we make regarding future dividends, including with respect to our regular quarterly dividends in 2020; and (x) statements regarding our expectations and estimates relating to the characterization for income tax purposes of our dividend distributions, our expectations and estimates relating to tax accounting, tax liabilities and tax savings, and GAAP tax provisions, and our estimates of REIT taxable income and TRS taxable income.
See Appendix for details on non-GAAP measures. Detailed endnotes are included at the end of this Redwood Review. |
THE REDWOOD REVIEW I 4TH QUARTER 2019 |
52 |
F O R W A R D - L O O K I N G S T A T E M E N T S |
Important factors, among others, that may affect our actual results include:
• | the pace at which we redeploy our available capital into new investments and initiatives; |
• | our ability to scale our platform and systems, particularly with respect to our new initiatives; |
• | interest rate volatility, changes in credit spreads, and changes in liquidity in the market for real estate securities and loans; |
• | changes in the demand from investors for residential mortgages and investments, and our ability to distribute residential mortgages through our whole-loan distribution channel; |
• | our ability to finance our investments in securities and our acquisition of residential mortgages with short-term debt; |
• | changes in the values of assets we own; |
• | general economic trends, the performance of the housing, real estate, mortgage, credit, and broader financial markets, and their effects on the prices of earning assets and the credit status of borrowers; |
• | federal and state legislative and regulatory developments, and the actions of governmental authorities, including the new U.S. presidential administration, and in particular those affecting the mortgage industry or our business (including, but not limited to, the Federal Housing Finance Agency’s rules relating to FHLB membership requirements and the implications for our captive insurance subsidiary’s membership in the FHLB); |
• | strategic business and capital deployment decisions we make; |
• | developments related to the fixed income and mortgage finance markets and the Federal Reserve’s statements regarding its future open market activity and monetary policy; |
• | our exposure to credit risk and the timing of credit losses within our portfolio; |
• | the concentration of the credit risks we are exposed to, including due to the structure of assets we hold and the geographical concentration of real estate underlying assets we own; |
• | our exposure to adjustable-rate mortgage loans; |
• | the efficacy and expense of our efforts to manage or hedge credit risk, interest rate risk, and other financial and operational risks; |
• | changes in credit ratings on assets we own and changes in the rating agencies’ credit rating methodologies; |
• | changes in interest rates; |
• | changes in mortgage prepayment rates; |
• | changes in liquidity in the market for real estate securities and loans; |
• | our ability to finance the acquisition of real estate-related assets with short-term debt; |
• | the ability of counterparties to satisfy their obligations to us; |
• | our involvement in securitization transactions, the profitability of those transactions, and the risks we are exposed to in engaging in securitization transactions; |
• | exposure to claims and litigation, including litigation arising from our involvement in securitization transactions; |
• | ongoing litigation against various trustees of RMBS transactions; |
• | whether we have sufficient liquid assets to meet short-term needs; |
See Appendix for details on non-GAAP measures. Detailed endnotes are included at the end of this Redwood Review. |
THE REDWOOD REVIEW I 4TH QUARTER 2019 |
53 |
F O R W A R D - L O O K I N G S T A T E M E N T S |
• | our ability to successfully compete and retain or attract key personnel; |
• | our ability to adapt our business model and strategies to changing circumstances; |
• | changes in our investment, financing, and hedging strategies and new risks we may be exposed to if we expand our business activities; |
• | our exposure to a disruption or breach of the security of our technology infrastructure and systems; |
• | exposure to environmental liabilities; |
• | our failure to comply with applicable laws and regulations; |
• | our failure to maintain appropriate internal controls over financial reporting and disclosure controls and procedures; |
• | the impact on our reputation that could result from our actions or omissions or from those of others; changes in accounting principles and tax rules; |
• | our ability to maintain our status as a REIT for tax purposes; |
• | limitations imposed on our business due to our REIT status and our status as exempt from registration under the Investment Company Act of 1940; |
• | decisions about raising, managing, and distributing capital; and |
• | other factors not presently identified. |
See Appendix for details on non-GAAP measures. Detailed endnotes are included at the end of this Redwood Review. |
THE REDWOOD REVIEW I 4TH QUARTER 2019 |
54 |
E N D N O T E S |
Page 7
(1) | Economic return on book value is based on the periodic change in GAAP book value per common share plus dividends declared per common share during the period. |
(2) | Recourse leverage ratio is defined as recourse debt at Redwood divided by tangible stockholders' equity. Recourse debt excludes $10.7 billion and $8.5 billion of consolidated securitization debt (ABS issued and servicer advance financing) that is non-recourse to Redwood at December 31, 2019 and September 30, 2019, respectively. Tangible stockholder's equity excludes $161 million and $49 million of goodwill and intangible assets at December 31, 2019 and September 30, 2019, respectively. |
(3) | Acquisition-related items included $4 million of purchased intangible amortization expense related to the CoreVest and 5 Arches acquisitions, as well as the dilutive impact of $10 million of stock-based purchase consideration for CoreVest that was treated as compensation expense for GAAP purposes. |
Page 11
(1) | Acquisition-related items included $4 million of purchased intangible amortization expense related to the CoreVest and 5 Arches acquisitions, as well as the dilutive impact of $10 million of stock-based purchase consideration for CoreVest that was treated as compensation expense for GAAP purposes. |
Page 14
(1) | Core pre-tax margin is a measure of profitability that indicates how much of each dollar of revenue is left over after expenses, other than taxes. It is calculated on a non-GAAP core basis as the sum of mortgage banking net interest income and mortgage banking activities less general and administrative expenses, divided by the sum of mortgage banking net interest income and mortgage banking activities. |
Page 16
(1) | Core pre-tax margin is a measure of profitability that indicates how much of each dollar of revenue is left over after expenses, other than taxes. It is calculated on a non-GAAP core basis as the sum of mortgage banking net interest income and mortgage banking activities less general and administrative expenses, divided by the sum of mortgage banking net interest income and mortgage banking activities. |
Page 21
(1) | Equity attributable to financial instruments financed with short-term debt includes internal liquidity capital cushion that is not presented within table. Corporate long-term debt is not allocated to mortgage banking working capital or platform premiums. |
Page 22
(1) | Recourse leverage ratio is defined as recourse debt at Redwood divided by tangible stockholders' equity. Recourse debt excludes $10.7 billion and $8.5 billion of consolidated securitization debt (ABS issued and servicer advance financing) that is non-recourse to Redwood at December 31, 2019 and September 30, 2019, respectively. Tangible stockholder's equity excludes $161 million and $49 million of goodwill and intangible assets at December 31, 2019 and September 30, 2019, respectively. |
Page 23
(1) | Recourse leverage ratio is defined as recourse debt at Redwood divided by tangible stockholders' equity. Recourse debt excludes $10.7 billion of consolidated securitization debt (ABS issued and servicer advance financing) that is non-recourse to Redwood and tangible stockholders' equity excludes $161 million of goodwill and intangible assets. |
Page 24
(1) | HPI updated LTV is calculated based on the current loan balance and an updated property value amount that is formulaically adjusted from value at origination based on the FHFA home price index (HPI). |
Page 25
(1) | Debt service coverage ratio (or DSCR) is the ratio by which net operating income of a property exceeds it fixed debt costs. |
(2) | LTV (at origination) is calculated based on the original loan amount and the property value at the time the loan was originated. |
THE REDWOOD REVIEW I 4TH QUARTER 2019 |
55 |