Attached files
| file | filename |
|---|---|
| 8-K - FORM 8-K - Ecovyst Inc. | d894600d8k.htm |
Exhibit 99.1 INVESTOR PRESENTATION February 2020 1Exhibit 99.1 INVESTOR PRESENTATION February 2020 1
LEGAL DISCLAIMER Forward-Looking Statements Some of the information contained in this presentation constitutes “forward-looking statements”. Forward-looking statements can be identified by words such as “anticipates,” “intends,” “plans,” “seeks,” “believes,” “estimates,” “expects,” “projects” and similar references to future periods. Forward-looking statements are based on our current expectations and assumptions regarding our business, the economy and other future conditions. Because forward-looking statements relate to the future, they are subject to inherent uncertainties, risks and changes in circumstances that are difficult to predict. Examples of forward looking statements include, but are not limited to, statements regarding our results of operations, financial condition, liquidity, prospects, growth, strategies, product and service offerings and 2020 outlook. Our actual results may differ materially from those contemplated by the forward-looking statements. We caution you, therefore, against relying on any of these forward-looking statements. They are neither statements of historical fact nor guarantees or assurances of future performance. Important factors that could cause actual results to differ materially from those in the forward-looking statements include, but are not limited to, regional, national or global political, economic, business, competitive, market and regulatory conditions, currency exchange rates and other factors, including those described in the sections titled “Risk Factors” and “Management Discussion & Analysis of Financial Condition and Results of Operations” in our filings with the SEC, which are available on the SEC’s website at www.sec.gov. Any forward-looking statement made by us in this presentation speaks only as of the date on which it is made. Factors or events that could cause our actual results to differ may emerge from time to time, and it is not possible for us to predict all of them. We undertake no obligation to update any forward-looking statement, whether as a result of new information, future developments or otherwise, except as may be required by applicable law. Certain supply share statistics included in this presentation, including our estimated supply share positions, are based on management estimates. Non-GAAP Financial Measures This presentation includes certain non-GAAP financial measures, including adjusted EBITDA, adjusted EBITDA margin, adjusted diluted EPS, adjusted net income and adjusted free cash flow which are provided to assist in an understanding of our business and its performance. These non-GAAP financial measures should be considered only as supplemental to, and not as superior to, financial measures prepared in accordance with GAAP. Non-GAAP financial measures should be read only in conjunction with consolidated financials prepared in accordance with GAAP. Reconciliations of non-GAAP measures to the relevant GAAP measures are provided in the appendix of this presentation. The Company is not able to provide a reconciliation of the Company’s non-GAAP financial guidance to the corresponding GAAP measures without unreasonable effort because of the inherent difficulty in forecasting and quantifying certain amounts necessary for such a reconciliation such as certain non-cash, nonrecurring or other items, including transaction and restructuring related items, that are included in net income and EBITDA as well as the related tax impacts of these items and asset dispositions/acquisitions and changes in foreign currency exchange rates that are included in cash flow, due to the uncertainty and variability of the nature and amount of these future charges and costs. Zeolyst Joint Venture Zeolyst International and Zeolyst C.V. (our 50% owned joint ventures that we refer to collectively as the “Zeolyst Joint venture”) are accounted for as an equity method investment in accordance with GAAP. The presentation of the Zeolyst Joint venture’s sales in this presentation represents 50% of the sales of the Zeolyst Joint venture. We do not record sales by the Zeolyst Joint venture as revenue and such sales are not consolidated within our results of operations. However, our adjusted EBITDA reflects our share of the earnings of the Zeolyst Joint venture that have been recorded as equity in net income from affiliated companies in our consolidated statements of income for such periods and includes Zeolyst Joint venture adjustments on a proportionate basis based on our 50% ownership interest. Accordingly, our adjusted EBITDA margins are calculated including 50% of the sales of the Zeolyst Joint venture for the relevant periods in the denominator. 2LEGAL DISCLAIMER Forward-Looking Statements Some of the information contained in this presentation constitutes “forward-looking statements”. Forward-looking statements can be identified by words such as “anticipates,” “intends,” “plans,” “seeks,” “believes,” “estimates,” “expects,” “projects” and similar references to future periods. Forward-looking statements are based on our current expectations and assumptions regarding our business, the economy and other future conditions. Because forward-looking statements relate to the future, they are subject to inherent uncertainties, risks and changes in circumstances that are difficult to predict. Examples of forward looking statements include, but are not limited to, statements regarding our results of operations, financial condition, liquidity, prospects, growth, strategies, product and service offerings and 2020 outlook. Our actual results may differ materially from those contemplated by the forward-looking statements. We caution you, therefore, against relying on any of these forward-looking statements. They are neither statements of historical fact nor guarantees or assurances of future performance. Important factors that could cause actual results to differ materially from those in the forward-looking statements include, but are not limited to, regional, national or global political, economic, business, competitive, market and regulatory conditions, currency exchange rates and other factors, including those described in the sections titled “Risk Factors” and “Management Discussion & Analysis of Financial Condition and Results of Operations” in our filings with the SEC, which are available on the SEC’s website at www.sec.gov. Any forward-looking statement made by us in this presentation speaks only as of the date on which it is made. Factors or events that could cause our actual results to differ may emerge from time to time, and it is not possible for us to predict all of them. We undertake no obligation to update any forward-looking statement, whether as a result of new information, future developments or otherwise, except as may be required by applicable law. Certain supply share statistics included in this presentation, including our estimated supply share positions, are based on management estimates. Non-GAAP Financial Measures This presentation includes certain non-GAAP financial measures, including adjusted EBITDA, adjusted EBITDA margin, adjusted diluted EPS, adjusted net income and adjusted free cash flow which are provided to assist in an understanding of our business and its performance. These non-GAAP financial measures should be considered only as supplemental to, and not as superior to, financial measures prepared in accordance with GAAP. Non-GAAP financial measures should be read only in conjunction with consolidated financials prepared in accordance with GAAP. Reconciliations of non-GAAP measures to the relevant GAAP measures are provided in the appendix of this presentation. The Company is not able to provide a reconciliation of the Company’s non-GAAP financial guidance to the corresponding GAAP measures without unreasonable effort because of the inherent difficulty in forecasting and quantifying certain amounts necessary for such a reconciliation such as certain non-cash, nonrecurring or other items, including transaction and restructuring related items, that are included in net income and EBITDA as well as the related tax impacts of these items and asset dispositions/acquisitions and changes in foreign currency exchange rates that are included in cash flow, due to the uncertainty and variability of the nature and amount of these future charges and costs. Zeolyst Joint Venture Zeolyst International and Zeolyst C.V. (our 50% owned joint ventures that we refer to collectively as the “Zeolyst Joint venture”) are accounted for as an equity method investment in accordance with GAAP. The presentation of the Zeolyst Joint venture’s sales in this presentation represents 50% of the sales of the Zeolyst Joint venture. We do not record sales by the Zeolyst Joint venture as revenue and such sales are not consolidated within our results of operations. However, our adjusted EBITDA reflects our share of the earnings of the Zeolyst Joint venture that have been recorded as equity in net income from affiliated companies in our consolidated statements of income for such periods and includes Zeolyst Joint venture adjustments on a proportionate basis based on our 50% ownership interest. Accordingly, our adjusted EBITDA margins are calculated including 50% of the sales of the Zeolyst Joint venture for the relevant periods in the denominator. 2
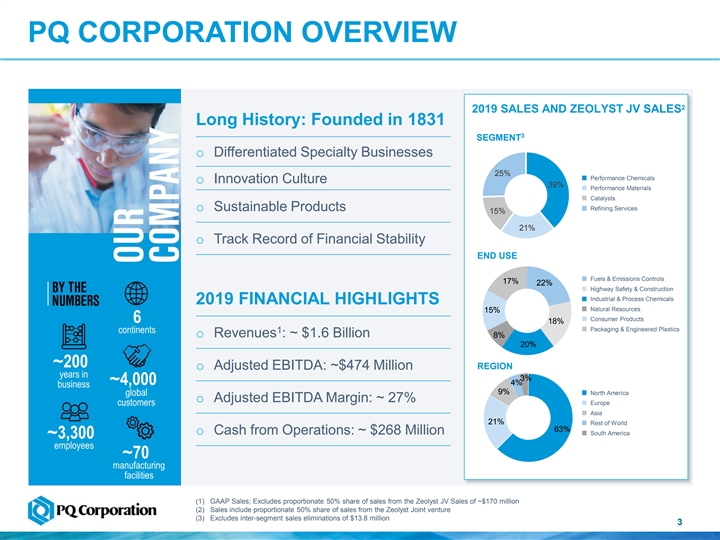
PQ CORPORATION OVERVIEW 2 2019 SALES AND ZEOLYST JV SALES Long History: Founded in 1831 3 SEGMENT SALES o Differentiated Specialty Businesses 25% Performance Chemicals o Innovation Culture 39% Performance Materials Catalysts o Sustainable Products Refining Services 15% 21% o Track Record of Financial Stability END USE Fuels & Emissions Controls 17% 22% Highway Safety & Construction Industrial & Process Chemicals 2019 FINANCIAL HIGHLIGHTS Natural Resources 15% 6 Consumer Products 6 18% continents Packaging & Engineered Plastics continents 1 o Revenues : ~ $1.6 Billion 8% 20% ~200 REGION o Adjusted EBITDA: ~$474 Million years in 3% ~4,000 4% business 9% North America global o Adjusted EBITDA Margin: ~ 27% Europe customers Asia 21% Rest of World 63% o Cash from Operations: ~ $268 Million South America ~3,300 employees ~70 manufacturing facilities (1) GAAP Sales; Excludes proportionate 50% share of sales from the Zeolyst JV Sales of ~$170 million (2) Sales include proportionate 50% share of sales from the Zeolyst Joint venture (3) Excludes inter-segment sales eliminations of $13.8 million 3PQ CORPORATION OVERVIEW 2 2019 SALES AND ZEOLYST JV SALES Long History: Founded in 1831 3 SEGMENT SALES o Differentiated Specialty Businesses 25% Performance Chemicals o Innovation Culture 39% Performance Materials Catalysts o Sustainable Products Refining Services 15% 21% o Track Record of Financial Stability END USE Fuels & Emissions Controls 17% 22% Highway Safety & Construction Industrial & Process Chemicals 2019 FINANCIAL HIGHLIGHTS Natural Resources 15% 6 Consumer Products 6 18% continents Packaging & Engineered Plastics continents 1 o Revenues : ~ $1.6 Billion 8% 20% ~200 REGION o Adjusted EBITDA: ~$474 Million years in 3% ~4,000 4% business 9% North America global o Adjusted EBITDA Margin: ~ 27% Europe customers Asia 21% Rest of World 63% o Cash from Operations: ~ $268 Million South America ~3,300 employees ~70 manufacturing facilities (1) GAAP Sales; Excludes proportionate 50% share of sales from the Zeolyst JV Sales of ~$170 million (2) Sales include proportionate 50% share of sales from the Zeolyst Joint venture (3) Excludes inter-segment sales eliminations of $13.8 million 3
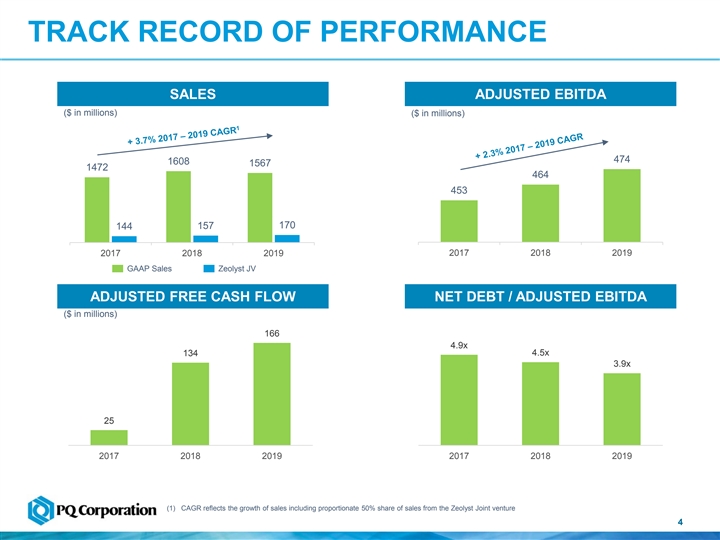
TRACK RECORD OF PERFORMANCE SALES ADJUSTED EBITDA ($ in millions) ($ in millions) 474 1608 1567 1472 464 453 170 157 144 2017 2018 2019 2017 2018 2019 GAAP Sales Zeolyst JV ADJUSTED FREE CASH FLOW NET DEBT / ADJUSTED EBITDA ($ in millions) 166 4.9x 134 4.5x 3.9x 25 2017 2018 2019 2017 2018 2019 (1) CAGR reflects the growth of sales including proportionate 50% share of sales from the Zeolyst Joint venture 4TRACK RECORD OF PERFORMANCE SALES ADJUSTED EBITDA ($ in millions) ($ in millions) 474 1608 1567 1472 464 453 170 157 144 2017 2018 2019 2017 2018 2019 GAAP Sales Zeolyst JV ADJUSTED FREE CASH FLOW NET DEBT / ADJUSTED EBITDA ($ in millions) 166 4.9x 134 4.5x 3.9x 25 2017 2018 2019 2017 2018 2019 (1) CAGR reflects the growth of sales including proportionate 50% share of sales from the Zeolyst Joint venture 4
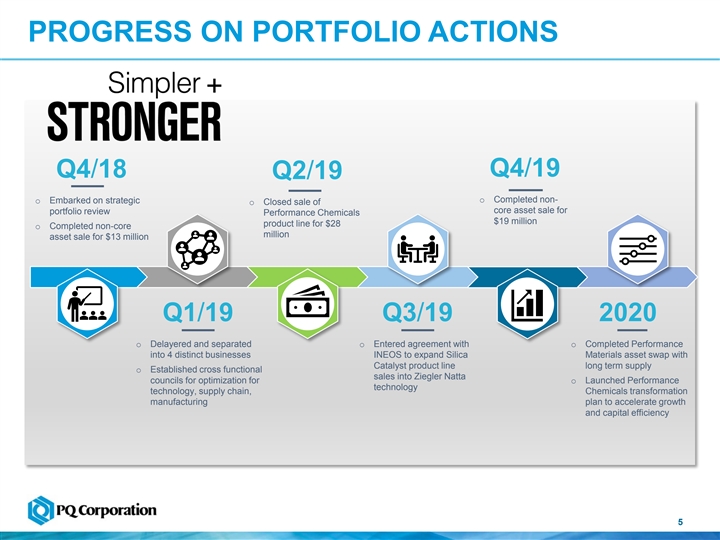
PROGRESS ON PORTFOLIO ACTIONS Q4/19 Q4/18 Q2/19 o Completed non- o Embarked on strategic o Closed sale of core asset sale for portfolio review Performance Chemicals $19 million product line for $28 o Completed non-core million asset sale for $13 million Q1/19 Q3/19 2020 o Delayered and separated o Entered agreement with o Completed Performance into 4 distinct businesses INEOS to expand Silica Materials asset swap with Catalyst product line long term supply o Established cross functional sales into Ziegler Natta councils for optimization for o Launched Performance technology technology, supply chain, Chemicals transformation manufacturing plan to accelerate growth and capital efficiency 5PROGRESS ON PORTFOLIO ACTIONS Q4/19 Q4/18 Q2/19 o Completed non- o Embarked on strategic o Closed sale of core asset sale for portfolio review Performance Chemicals $19 million product line for $28 o Completed non-core million asset sale for $13 million Q1/19 Q3/19 2020 o Delayered and separated o Entered agreement with o Completed Performance into 4 distinct businesses INEOS to expand Silica Materials asset swap with Catalyst product line long term supply o Established cross functional sales into Ziegler Natta councils for optimization for o Launched Performance technology technology, supply chain, Chemicals transformation manufacturing plan to accelerate growth and capital efficiency 5
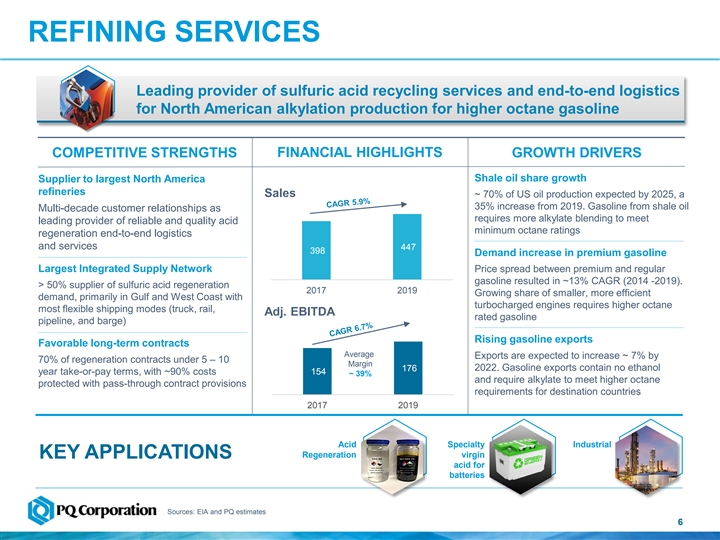
REFINING SERVICES Leading provider of sulfuric acid recycling services and end-to-end logistics for North American alkylation production for higher octane gasoline COMPETITIVE STRENGTHS FINANCIAL HIGHLIGHTS GROWTH DRIVERS Shale oil share growth Supplier to largest North America refineries Sales ~ 70% of US oil production expected by 2025, a 35% increase from 2019. Gasoline from shale oil Multi-decade customer relationships as requires more alkylate blending to meet leading provider of reliable and quality acid minimum octane ratings regeneration end-to-end logistics and services 447 398 Demand increase in premium gasoline Largest Integrated Supply Network Price spread between premium and regular gasoline resulted in ~13% CAGR (2014 -2019). > 50% supplier of sulfuric acid regeneration 2017 2019 Growing share of smaller, more efficient demand, primarily in Gulf and West Coast with turbocharged engines requires higher octane most flexible shipping modes (truck, rail, Adj. EBITDA rated gasoline pipeline, and barge) Rising gasoline exports Favorable long-term contracts Average Exports are expected to increase ~ 7% by 70% of regeneration contracts under 5 – 10 Margin 176 2022. Gasoline exports contain no ethanol year take-or-pay terms, with ~90% costs 154 ~ 39% and require alkylate to meet higher octane protected with pass-through contract provisions requirements for destination countries 2017 2019 Industrial Acid Specialty Regeneration virgin KEY APPLICATIONS acid for batteries Sources: EIA and PQ estimates 6REFINING SERVICES Leading provider of sulfuric acid recycling services and end-to-end logistics for North American alkylation production for higher octane gasoline COMPETITIVE STRENGTHS FINANCIAL HIGHLIGHTS GROWTH DRIVERS Shale oil share growth Supplier to largest North America refineries Sales ~ 70% of US oil production expected by 2025, a 35% increase from 2019. Gasoline from shale oil Multi-decade customer relationships as requires more alkylate blending to meet leading provider of reliable and quality acid minimum octane ratings regeneration end-to-end logistics and services 447 398 Demand increase in premium gasoline Largest Integrated Supply Network Price spread between premium and regular gasoline resulted in ~13% CAGR (2014 -2019). > 50% supplier of sulfuric acid regeneration 2017 2019 Growing share of smaller, more efficient demand, primarily in Gulf and West Coast with turbocharged engines requires higher octane most flexible shipping modes (truck, rail, Adj. EBITDA rated gasoline pipeline, and barge) Rising gasoline exports Favorable long-term contracts Average Exports are expected to increase ~ 7% by 70% of regeneration contracts under 5 – 10 Margin 176 2022. Gasoline exports contain no ethanol year take-or-pay terms, with ~90% costs 154 ~ 39% and require alkylate to meet higher octane protected with pass-through contract provisions requirements for destination countries 2017 2019 Industrial Acid Specialty Regeneration virgin KEY APPLICATIONS acid for batteries Sources: EIA and PQ estimates 6
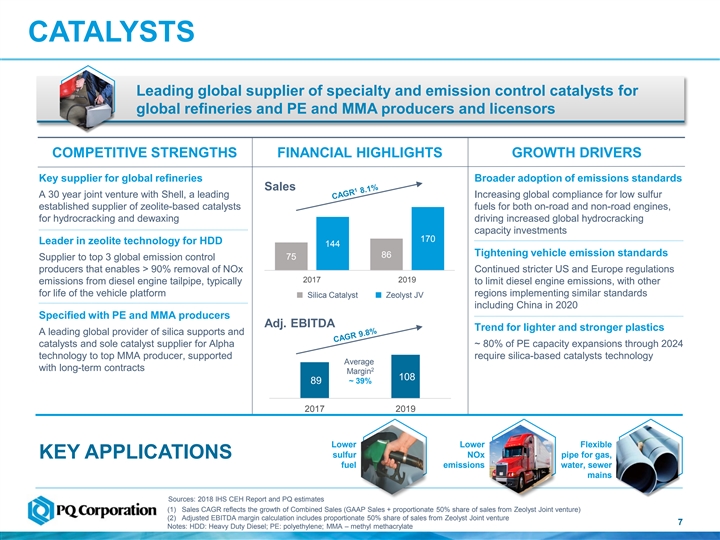
CATALYSTS Leading global supplier of specialty and emission control catalysts for global refineries and PE and MMA producers and licensors COMPETITIVE STRENGTHS FINANCIAL HIGHLIGHTS GROWTH DRIVERS Key supplier for global refineries Broader adoption of emissions standards Sales A 30 year joint venture with Shell, a leading Increasing global compliance for low sulfur established supplier of zeolite-based catalysts fuels for both on-road and non-road engines, for hydrocracking and dewaxing driving increased global hydrocracking capacity investments 170 Leader in zeolite technology for HDD 144 Tightening vehicle emission standards 86 Supplier to top 3 global emission control 75 producers that enables > 90% removal of NOx Continued stricter US and Europe regulations 2017 2019 emissions from diesel engine tailpipe, typically to limit diesel engine emissions, with other for life of the vehicle platform regions implementing similar standards Silica Catalyst Zeolyst JV including China in 2020 Specified with PE and MMA producers Adj. EBITDA Trend for lighter and stronger plastics A leading global provider of silica supports and catalysts and sole catalyst supplier for Alpha ~ 80% of PE capacity expansions through 2024 technology to top MMA producer, supported require silica-based catalysts technology Average with long-term contracts 2 Margin 108 89 ~ 39% 2017 2019 Lower Lower Flexible sulfur NOx pipe for gas, KEY APPLICATIONS fuel emissions water, sewer mains Sources: 2018 IHS CEH Report and PQ estimates (1) Sales CAGR reflects the growth of Combined Sales (GAAP Sales + proportionate 50% share of sales from Zeolyst Joint venture) (2) Adjusted EBITDA margin calculation includes proportionate 50% share of sales from Zeolyst Joint venture 7 Notes: HDD: Heavy Duty Diesel; PE: polyethylene; MMA – methyl methacrylateCATALYSTS Leading global supplier of specialty and emission control catalysts for global refineries and PE and MMA producers and licensors COMPETITIVE STRENGTHS FINANCIAL HIGHLIGHTS GROWTH DRIVERS Key supplier for global refineries Broader adoption of emissions standards Sales A 30 year joint venture with Shell, a leading Increasing global compliance for low sulfur established supplier of zeolite-based catalysts fuels for both on-road and non-road engines, for hydrocracking and dewaxing driving increased global hydrocracking capacity investments 170 Leader in zeolite technology for HDD 144 Tightening vehicle emission standards 86 Supplier to top 3 global emission control 75 producers that enables > 90% removal of NOx Continued stricter US and Europe regulations 2017 2019 emissions from diesel engine tailpipe, typically to limit diesel engine emissions, with other for life of the vehicle platform regions implementing similar standards Silica Catalyst Zeolyst JV including China in 2020 Specified with PE and MMA producers Adj. EBITDA Trend for lighter and stronger plastics A leading global provider of silica supports and catalysts and sole catalyst supplier for Alpha ~ 80% of PE capacity expansions through 2024 technology to top MMA producer, supported require silica-based catalysts technology Average with long-term contracts 2 Margin 108 89 ~ 39% 2017 2019 Lower Lower Flexible sulfur NOx pipe for gas, KEY APPLICATIONS fuel emissions water, sewer mains Sources: 2018 IHS CEH Report and PQ estimates (1) Sales CAGR reflects the growth of Combined Sales (GAAP Sales + proportionate 50% share of sales from Zeolyst Joint venture) (2) Adjusted EBITDA margin calculation includes proportionate 50% share of sales from Zeolyst Joint venture 7 Notes: HDD: Heavy Duty Diesel; PE: polyethylene; MMA – methyl methacrylate
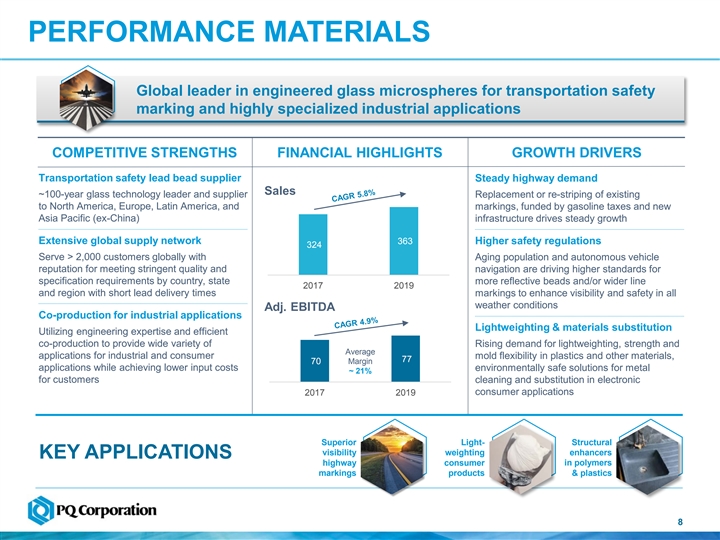
PERFORMANCE MATERIALS Global leader in engineered glass microspheres for transportation safety marking and highly specialized industrial applications COMPETITIVE STRENGTHS FINANCIAL HIGHLIGHTS GROWTH DRIVERS Transportation safety lead bead supplier Steady highway demand Sales ~100-year glass technology leader and supplier Replacement or re-striping of existing to North America, Europe, Latin America, and markings, funded by gasoline taxes and new Asia Pacific (ex-China) infrastructure drives steady growth Extensive global supply network 363 Higher safety regulations 324 Serve > 2,000 customers globally with Aging population and autonomous vehicle reputation for meeting stringent quality and navigation are driving higher standards for specification requirements by country, state more reflective beads and/or wider line 2017 2019 and region with short lead delivery times markings to enhance visibility and safety in all weather conditions Adj. EBITDA Co-production for industrial applications Lightweighting & materials substitution Utilizing engineering expertise and efficient co-production to provide wide variety of Rising demand for lightweighting, strength and Average applications for industrial and consumer mold flexibility in plastics and other materials, 77 70 Margin applications while achieving lower input costs environmentally safe solutions for metal ~ 21% for customers cleaning and substitution in electronic consumer applications 2017 2019 Superior Light- Structural visibility weighting enhancers KEY APPLICATIONS highway consumer in polymers markings products & plastics 8PERFORMANCE MATERIALS Global leader in engineered glass microspheres for transportation safety marking and highly specialized industrial applications COMPETITIVE STRENGTHS FINANCIAL HIGHLIGHTS GROWTH DRIVERS Transportation safety lead bead supplier Steady highway demand Sales ~100-year glass technology leader and supplier Replacement or re-striping of existing to North America, Europe, Latin America, and markings, funded by gasoline taxes and new Asia Pacific (ex-China) infrastructure drives steady growth Extensive global supply network 363 Higher safety regulations 324 Serve > 2,000 customers globally with Aging population and autonomous vehicle reputation for meeting stringent quality and navigation are driving higher standards for specification requirements by country, state more reflective beads and/or wider line 2017 2019 and region with short lead delivery times markings to enhance visibility and safety in all weather conditions Adj. EBITDA Co-production for industrial applications Lightweighting & materials substitution Utilizing engineering expertise and efficient co-production to provide wide variety of Rising demand for lightweighting, strength and Average applications for industrial and consumer mold flexibility in plastics and other materials, 77 70 Margin applications while achieving lower input costs environmentally safe solutions for metal ~ 21% for customers cleaning and substitution in electronic consumer applications 2017 2019 Superior Light- Structural visibility weighting enhancers KEY APPLICATIONS highway consumer in polymers markings products & plastics 8
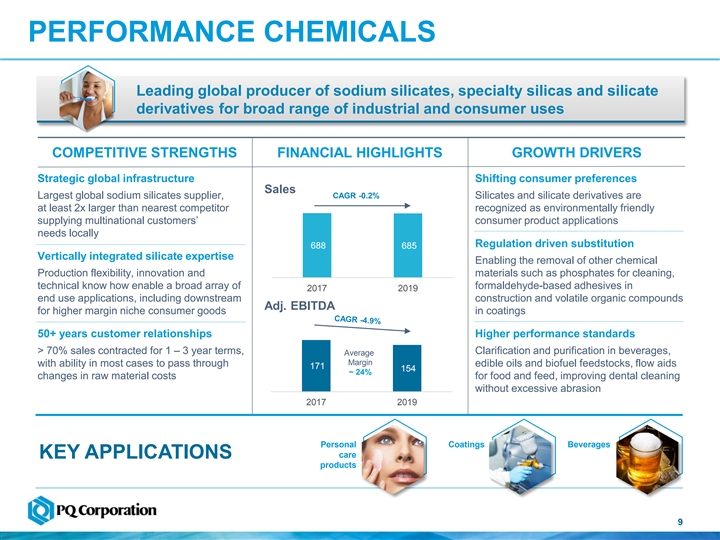
PERFORMANCE CHEMICALS Leading global producer of sodium silicates, specialty silicas and silicate derivatives for broad range of industrial and consumer uses COMPETITIVE STRENGTHS FINANCIAL HIGHLIGHTS GROWTH DRIVERS Strategic global infrastructure Shifting consumer preferences Sales Largest global sodium silicates supplier, CAGR -0.2% Silicates and silicate derivatives are at least 2x larger than nearest competitor recognized as environmentally friendly supplying multinational customers’ consumer product applications needs locally Regulation driven substitution 688 685 Vertically integrated silicate expertise Enabling the removal of other chemical Production flexibility, innovation and materials such as phosphates for cleaning, technical know how enable a broad array of formaldehyde-based adhesives in 2017 2019 end use applications, including downstream construction and volatile organic compounds Adj. EBITDA for higher margin niche consumer goods in coatings 50+ years customer relationships Higher performance standards > 70% sales contracted for 1 – 3 year terms, Clarification and purification in beverages, Average Margin with ability in most cases to pass through edible oils and biofuel feedstocks, flow aids 171 154 ~ 24% changes in raw material costs for food and feed, improving dental cleaning without excessive abrasion 2017 2019 Personal Coatings Beverages care KEY APPLICATIONS products 9PERFORMANCE CHEMICALS Leading global producer of sodium silicates, specialty silicas and silicate derivatives for broad range of industrial and consumer uses COMPETITIVE STRENGTHS FINANCIAL HIGHLIGHTS GROWTH DRIVERS Strategic global infrastructure Shifting consumer preferences Sales Largest global sodium silicates supplier, CAGR -0.2% Silicates and silicate derivatives are at least 2x larger than nearest competitor recognized as environmentally friendly supplying multinational customers’ consumer product applications needs locally Regulation driven substitution 688 685 Vertically integrated silicate expertise Enabling the removal of other chemical Production flexibility, innovation and materials such as phosphates for cleaning, technical know how enable a broad array of formaldehyde-based adhesives in 2017 2019 end use applications, including downstream construction and volatile organic compounds Adj. EBITDA for higher margin niche consumer goods in coatings 50+ years customer relationships Higher performance standards > 70% sales contracted for 1 – 3 year terms, Clarification and purification in beverages, Average Margin with ability in most cases to pass through edible oils and biofuel feedstocks, flow aids 171 154 ~ 24% changes in raw material costs for food and feed, improving dental cleaning without excessive abrasion 2017 2019 Personal Coatings Beverages care KEY APPLICATIONS products 9
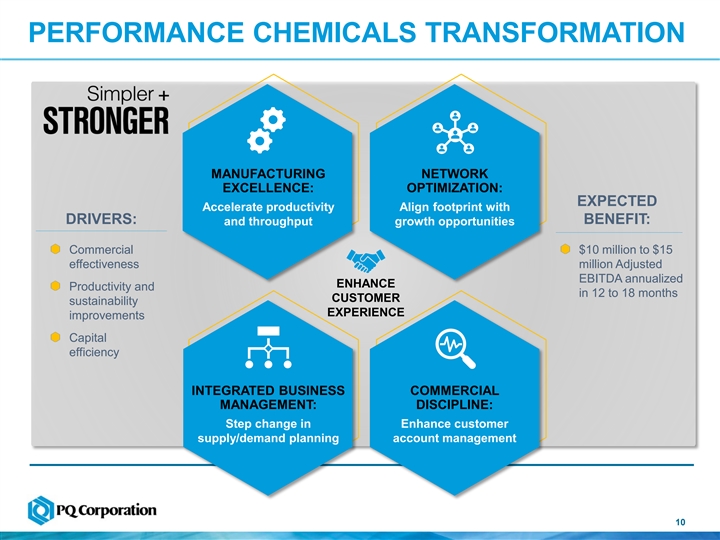
PERFORMANCE CHEMICALS TRANSFORMATION MANUFACTURING NETWORK EXCELLENCE: OPTIMIZATION: EXPECTED Accelerate productivity Align footprint with DRIVERS: BENEFIT: and throughput growth opportunities Commercial $10 million to $15 effectiveness million Adjusted EBITDA annualized ENHANCE Productivity and in 12 to 18 months CUSTOMER sustainability EXPERIENCE improvements Capital efficiency INTEGRATED BUSINESS COMMERCIAL MANAGEMENT: DISCIPLINE: Step change in Enhance customer supply/demand planning account management 10PERFORMANCE CHEMICALS TRANSFORMATION MANUFACTURING NETWORK EXCELLENCE: OPTIMIZATION: EXPECTED Accelerate productivity Align footprint with DRIVERS: BENEFIT: and throughput growth opportunities Commercial $10 million to $15 effectiveness million Adjusted EBITDA annualized ENHANCE Productivity and in 12 to 18 months CUSTOMER sustainability EXPERIENCE improvements Capital efficiency INTEGRATED BUSINESS COMMERCIAL MANAGEMENT: DISCIPLINE: Step change in Enhance customer supply/demand planning account management 10
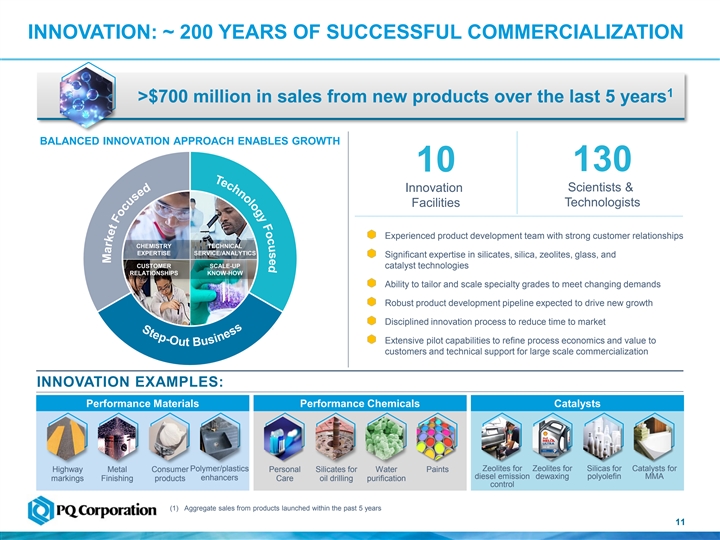
INNOVATION: ~ 200 YEARS OF SUCCESSFUL COMMERCIALIZATION 1 >$700 million in sales from new products over the last 5 years BALANCED INNOVATION APPROACH ENABLES GROWTH 130 10 Innovation Scientists & Facilities Technologists Experienced product development team with strong customer relationships CHEMISTRY TECHNICAL EXPERTISE SERVICE/ANALYTICS Significant expertise in silicates, silica, zeolites, glass, and CUSTOMER SCALE-UP catalyst technologies RELATIONSHIPS KNOW-HOW Ability to tailor and scale specialty grades to meet changing demands Robust product development pipeline expected to drive new growth Disciplined innovation process to reduce time to market Extensive pilot capabilities to refine process economics and value to customers and technical support for large scale commercialization INNOVATION EXAMPLES: Performance Materials Performance Chemicals Catalysts Polymer/plastics Zeolites for Zeolites for Silicas for Catalysts for Highway Metal Consumer Personal Silicates for Water Paints diesel emission dewaxing polyolefin MMA enhancers markings Finishing products Care oil drilling purification control (1) Aggregate sales from products launched within the past 5 years 11INNOVATION: ~ 200 YEARS OF SUCCESSFUL COMMERCIALIZATION 1 >$700 million in sales from new products over the last 5 years BALANCED INNOVATION APPROACH ENABLES GROWTH 130 10 Innovation Scientists & Facilities Technologists Experienced product development team with strong customer relationships CHEMISTRY TECHNICAL EXPERTISE SERVICE/ANALYTICS Significant expertise in silicates, silica, zeolites, glass, and CUSTOMER SCALE-UP catalyst technologies RELATIONSHIPS KNOW-HOW Ability to tailor and scale specialty grades to meet changing demands Robust product development pipeline expected to drive new growth Disciplined innovation process to reduce time to market Extensive pilot capabilities to refine process economics and value to customers and technical support for large scale commercialization INNOVATION EXAMPLES: Performance Materials Performance Chemicals Catalysts Polymer/plastics Zeolites for Zeolites for Silicas for Catalysts for Highway Metal Consumer Personal Silicates for Water Paints diesel emission dewaxing polyolefin MMA enhancers markings Finishing products Care oil drilling purification control (1) Aggregate sales from products launched within the past 5 years 11
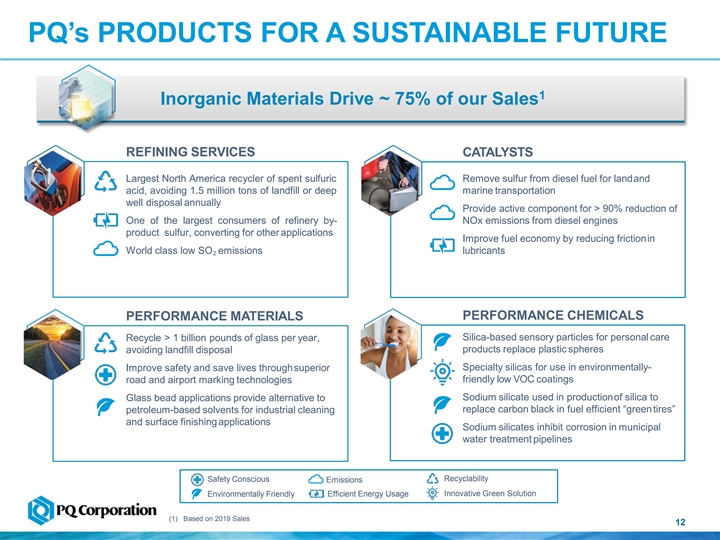
PQ’s PRODUCTS FOR A SUSTAINABLE FUTURE 1 Inorganic Materials Drive ~ 75% of our Sales REFINING SERVICES CATALYSTS Largest North America recycler of spent sulfuric Remove sulfur from diesel fuel for landand acid, avoiding 1.5 million tons of landfill or deep marine transportation well disposal annually Provide active component for > 90% reduction of One of the largest consumers of refinery by- NOx emissions from diesel engines product sulfur, converting for other applications Improve fuel economy by reducing frictionin World class low SO₂ emissions lubricants PERFORMANCE CHEMICALS PERFORMANCE MATERIALS Recycle > 1 billion pounds of glass per year, Silica-based sensory particles for personal care avoiding landfill disposal products replace plastic spheres Improve safety and save lives throughsuperior Specialty silicas for use in environmentally- road and airport marking technologies friendly low VOC coatings Glass bead applications provide alternative to Sodium silicate used in productionof silica to petroleum-based solvents for industrial cleaning replace carbon black in fuel efficient “greentires” and surface finishingapplications Sodium silicates inhibit corrosion in municipal water treatment pipelines Recyclability Safety Conscious Emissions Innovative Green Solution Environmentally Friendly Efficient Energy Usage (1) Based on 2019 Sales 12PQ’s PRODUCTS FOR A SUSTAINABLE FUTURE 1 Inorganic Materials Drive ~ 75% of our Sales REFINING SERVICES CATALYSTS Largest North America recycler of spent sulfuric Remove sulfur from diesel fuel for landand acid, avoiding 1.5 million tons of landfill or deep marine transportation well disposal annually Provide active component for > 90% reduction of One of the largest consumers of refinery by- NOx emissions from diesel engines product sulfur, converting for other applications Improve fuel economy by reducing frictionin World class low SO₂ emissions lubricants PERFORMANCE CHEMICALS PERFORMANCE MATERIALS Recycle > 1 billion pounds of glass per year, Silica-based sensory particles for personal care avoiding landfill disposal products replace plastic spheres Improve safety and save lives throughsuperior Specialty silicas for use in environmentally- road and airport marking technologies friendly low VOC coatings Glass bead applications provide alternative to Sodium silicate used in productionof silica to petroleum-based solvents for industrial cleaning replace carbon black in fuel efficient “greentires” and surface finishingapplications Sodium silicates inhibit corrosion in municipal water treatment pipelines Recyclability Safety Conscious Emissions Innovative Green Solution Environmentally Friendly Efficient Energy Usage (1) Based on 2019 Sales 12
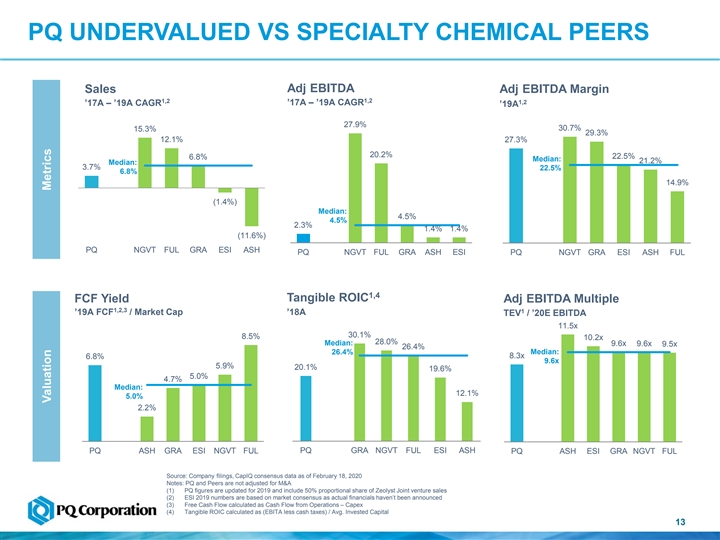
PQ UNDERVALUED VS SPECIALTY CHEMICAL PEERS Adj EBITDA Sales Adj EBITDA Margin 1,2 1,2 1,2 ’17A – ’19A CAGR ’17A – ’19A CAGR ’19A 27.9% 30.7% 15.3% 29.3% 12.1% 27.3% 20.2% 22.5% 6.8% Median: 21.2% Median: 3.7% 22.5% 6.8% 14.9% (1.4%) Median: 4.5% 4.5% 2.3% 1.4% 1.4% (11.6%) PQ NGVT FUL GRA ESI ASH PQ NGVT FUL GRA ASH ESI PQ NGVT GRA ESI ASH FUL 1,4 Tangible ROIC FCF Yield Adj EBITDA Multiple 1,2,3 1 ’19A FCF / Market Cap ’18A TEV / ’20E EBITDA 11.5x 30.1% 8.5% 10.2x 28.0% Median: 9.6x 9.6x 9.5x 26.4% Median: 26.4% 8.3x 6.8% 9.6x 5.9% 20.1% 19.6% 5.0% 4.7% Median: 12.1% 5.0% 2.2% PQ ASH GRA ESI NGVT FUL PQ GRA NGVT FUL ESI ASH PQ ASH ESI GRA NGVT FUL Source: Company filings, CapIQ consensus data as of February 18, 2020 Notes: PQ and Peers are not adjusted for M&A (1) PQ figures are updated for 2019 and include 50% proportional share of Zeolyst Joint venture sales (2) ESI 2019 numbers are based on market consensus as actual financials haven’t been announced (3) Free Cash Flow calculated as Cash Flow from Operations – Capex (4) Tangible ROIC calculated as (EBITA less cash taxes) / Avg. Invested Capital 13 Valuation MetricsPQ UNDERVALUED VS SPECIALTY CHEMICAL PEERS Adj EBITDA Sales Adj EBITDA Margin 1,2 1,2 1,2 ’17A – ’19A CAGR ’17A – ’19A CAGR ’19A 27.9% 30.7% 15.3% 29.3% 12.1% 27.3% 20.2% 22.5% 6.8% Median: 21.2% Median: 3.7% 22.5% 6.8% 14.9% (1.4%) Median: 4.5% 4.5% 2.3% 1.4% 1.4% (11.6%) PQ NGVT FUL GRA ESI ASH PQ NGVT FUL GRA ASH ESI PQ NGVT GRA ESI ASH FUL 1,4 Tangible ROIC FCF Yield Adj EBITDA Multiple 1,2,3 1 ’19A FCF / Market Cap ’18A TEV / ’20E EBITDA 11.5x 30.1% 8.5% 10.2x 28.0% Median: 9.6x 9.6x 9.5x 26.4% Median: 26.4% 8.3x 6.8% 9.6x 5.9% 20.1% 19.6% 5.0% 4.7% Median: 12.1% 5.0% 2.2% PQ ASH GRA ESI NGVT FUL PQ GRA NGVT FUL ESI ASH PQ ASH ESI GRA NGVT FUL Source: Company filings, CapIQ consensus data as of February 18, 2020 Notes: PQ and Peers are not adjusted for M&A (1) PQ figures are updated for 2019 and include 50% proportional share of Zeolyst Joint venture sales (2) ESI 2019 numbers are based on market consensus as actual financials haven’t been announced (3) Free Cash Flow calculated as Cash Flow from Operations – Capex (4) Tangible ROIC calculated as (EBITA less cash taxes) / Avg. Invested Capital 13 Valuation Metrics
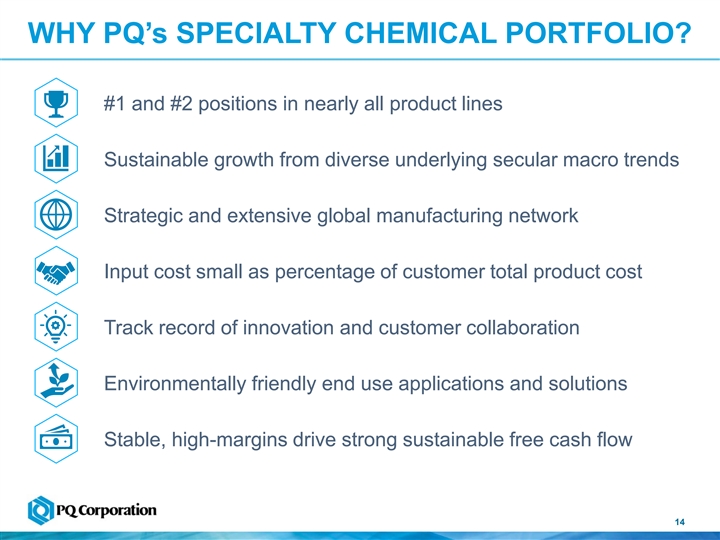
WHY PQ’s SPECIALTY CHEMICAL PORTFOLIO? #1 and #2 positions in nearly all product lines Sustainable growth from diverse underlying secular macro trends Strategic and extensive global manufacturing network Input cost small as percentage of customer total product cost Track record of innovation and customer collaboration Environmentally friendly end use applications and solutions Stable, high-margins drive strong sustainable free cash flow 14WHY PQ’s SPECIALTY CHEMICAL PORTFOLIO? #1 and #2 positions in nearly all product lines Sustainable growth from diverse underlying secular macro trends Strategic and extensive global manufacturing network Input cost small as percentage of customer total product cost Track record of innovation and customer collaboration Environmentally friendly end use applications and solutions Stable, high-margins drive strong sustainable free cash flow 14

SUPPLEMENTAL INFORMATIONSUPPLEMENTAL INFORMATION
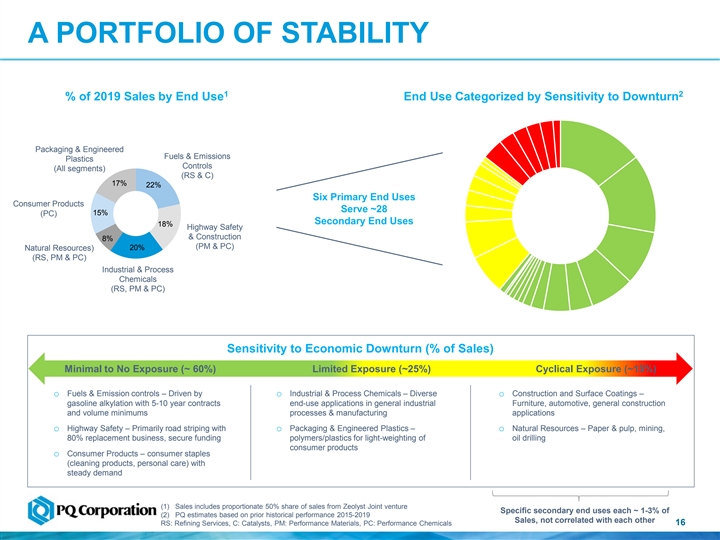
A PORTFOLIO OF STABILITY 1 2 % of 2019 Sales by End Use End Use Categorized by Sensitivity to Downturn Packaging & Engineered Fuels & Emissions Plastics Controls (All segments) (RS & C) 17% 22% Six Primary End Uses Consumer Products Serve ~28 15% (PC) Secondary End Uses 18% Highway Safety & Construction 8% (PM & PC) 20% Natural Resources) (RS, PM & PC) Industrial & Process Chemicals (RS, PM & PC) Sensitivity to Economic Downturn (% of Sales) Minimal to No Exposure (~ 60%) Limited Exposure (~25%) Cyclical Exposure (~15%) o Fuels & Emission controls – Driven by o Industrial & Process Chemicals – Diverse o Construction and Surface Coatings – gasoline alkylation with 5-10 year contracts end-use applications in general industrial Furniture, automotive, general construction and volume minimums processes & manufacturing applications o Highway Safety – Primarily road striping with o Packaging & Engineered Plastics – o Natural Resources – Paper & pulp, mining, 80% replacement business, secure funding polymers/plastics for light-weighting of oil drilling consumer products o Consumer Products – consumer staples (cleaning products, personal care) with steady demand (1) Sales includes proportionate 50% share of sales from Zeolyst Joint venture Specific secondary end uses each ~ 1-3% of (2) PQ estimates based on prior historical performance 2015-2019 Sales, not correlated with each other 16 RS: Refining Services, C: Catalysts, PM: Performance Materials, PC: Performance ChemicalsA PORTFOLIO OF STABILITY 1 2 % of 2019 Sales by End Use End Use Categorized by Sensitivity to Downturn Packaging & Engineered Fuels & Emissions Plastics Controls (All segments) (RS & C) 17% 22% Six Primary End Uses Consumer Products Serve ~28 15% (PC) Secondary End Uses 18% Highway Safety & Construction 8% (PM & PC) 20% Natural Resources) (RS, PM & PC) Industrial & Process Chemicals (RS, PM & PC) Sensitivity to Economic Downturn (% of Sales) Minimal to No Exposure (~ 60%) Limited Exposure (~25%) Cyclical Exposure (~15%) o Fuels & Emission controls – Driven by o Industrial & Process Chemicals – Diverse o Construction and Surface Coatings – gasoline alkylation with 5-10 year contracts end-use applications in general industrial Furniture, automotive, general construction and volume minimums processes & manufacturing applications o Highway Safety – Primarily road striping with o Packaging & Engineered Plastics – o Natural Resources – Paper & pulp, mining, 80% replacement business, secure funding polymers/plastics for light-weighting of oil drilling consumer products o Consumer Products – consumer staples (cleaning products, personal care) with steady demand (1) Sales includes proportionate 50% share of sales from Zeolyst Joint venture Specific secondary end uses each ~ 1-3% of (2) PQ estimates based on prior historical performance 2015-2019 Sales, not correlated with each other 16 RS: Refining Services, C: Catalysts, PM: Performance Materials, PC: Performance Chemicals
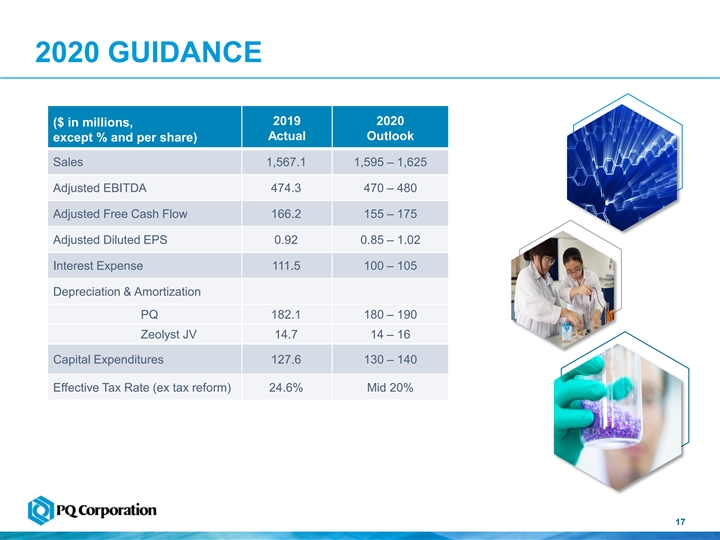
2020 GUIDANCE 2019 2020 ($ in millions, Actual Outlook except % and per share) Sales 1,567.1 1,595 – 1,625 Adjusted EBITDA 474.3 470 – 480 Adjusted Free Cash Flow 166.2 155 – 175 Adjusted Diluted EPS 0.92 0.85 – 1.02 Interest Expense 111.5 100 – 105 Depreciation & Amortization PQ 182.1 180 – 190 Zeolyst JV 14.7 14 – 16 Capital Expenditures 127.6 130 – 140 Effective Tax Rate (ex tax reform) 24.6% Mid 20% 172020 GUIDANCE 2019 2020 ($ in millions, Actual Outlook except % and per share) Sales 1,567.1 1,595 – 1,625 Adjusted EBITDA 474.3 470 – 480 Adjusted Free Cash Flow 166.2 155 – 175 Adjusted Diluted EPS 0.92 0.85 – 1.02 Interest Expense 111.5 100 – 105 Depreciation & Amortization PQ 182.1 180 – 190 Zeolyst JV 14.7 14 – 16 Capital Expenditures 127.6 130 – 140 Effective Tax Rate (ex tax reform) 24.6% Mid 20% 17
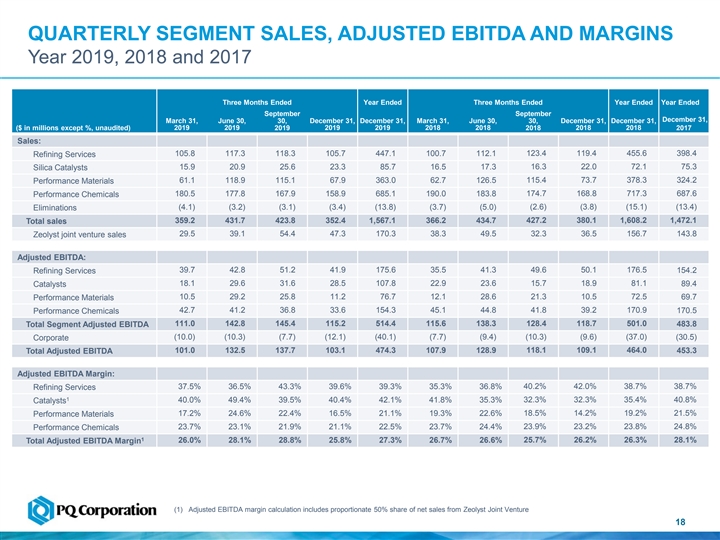
QUARTERLY SEGMENT SALES, ADJUSTED EBITDA AND MARGINS Year 2019, 2018 and 2017 Three Months Ended Year For E n the ded Quarter Ended Three Months Ended Year Ended Year Ended September September December 31, March 31, June 30, 30, December 31, December 31, March 31, June 30, 30, December 31, December 31, ($ in millions except %, unaudited) 2019 2019 2019 2019 2019 2018 2018 2018 2018 2018 2017 Sales: 105.8 117.3 118.3 105.7 447.1 100.7 112.1 123.4 119.4 455.6 398.4 Refining Services 16.3 22.0 72.1 75.3 Silica Catalysts 15.9 20.9 25.6 23.3 85.7 16.5 17.3 61.1 118.9 115.1 67.9 363.0 62.7 126.5 115.4 73.7 378.3 324.2 Performance Materials 180.5 177.8 167.9 158.9 685.1 190.0 183.8 174.7 168.8 717.3 687.6 Performance Chemicals (4.1) (3.2) (3.1) (3.4) (13.8) (3.7) (5.0) (2.6) (3.8) (15.1) (13.4) Eliminations 359.2 431.7 423.8 352.4 1,567.1 366.2 434.7 427.2 380.1 1,608.2 1,472.1 Total sales 29.5 39.1 54.4 47.3 170.3 38.3 49.5 32.3 36.5 156.7 143.8 Zeolyst joint venture sales Adjusted EBITDA: 39.7 42.8 51.2 41.9 175.6 35.5 41.3 49.6 50.1 176.5 154.2 Refining Services 18.1 29.6 31.6 28.5 107.8 22.9 23.6 15.7 18.9 81.1 89.4 Catalysts 10.5 29.2 25.8 11.2 76.7 12.1 28.6 21.3 10.5 72.5 Performance Materials 69.7 42.7 41.2 36.8 33.6 154.3 45.1 44.8 41.8 39.2 170.9 170.5 Performance Chemicals 111.0 142.8 145.4 115.2 514.4 115.6 138.3 128.4 118.7 501.0 Total Segment Adjusted EBITDA 483.8 (10.0) (10.3) (7.7) (12.1) (40.1) (7.7) (9.4) (10.3) (9.6) (37.0) (30.5) Corporate 101.0 132.5 137.7 103.1 474.3 107.9 128.9 118.1 109.1 464.0 453.3 Total Adjusted EBITDA Adjusted EBITDA Margin: 37.5% 36.5% 43.3% 39.6% 39.3% 35.3% 36.8% 40.2% 42.0% 38.7% 38.7% Refining Services 1 32.3% 32.3% 35.4% 40.8% Catalysts 40.0% 49.4% 39.5% 40.4% 42.1% 41.8% 35.3% 17.2% 24.6% 22.4% 16.5% 21.1% 19.3% 22.6% 18.5% 14.2% 19.2% 21.5% Performance Materials 23.7% 23.1% 21.9% 21.1% 22.5% 23.7% 24.4% 23.9% 23.2% 23.8% 24.8% Performance Chemicals 1 26.0% 28.1% 28.8% 25.8% 27.3% 26.7% 26.6% 25.7% 26.2% 26.3% 28.1% Total Adjusted EBITDA Margin (1) Adjusted EBITDA margin calculation includes proportionate 50% share of net sales from Zeolyst Joint Venture 18QUARTERLY SEGMENT SALES, ADJUSTED EBITDA AND MARGINS Year 2019, 2018 and 2017 Three Months Ended Year For E n the ded Quarter Ended Three Months Ended Year Ended Year Ended September September December 31, March 31, June 30, 30, December 31, December 31, March 31, June 30, 30, December 31, December 31, ($ in millions except %, unaudited) 2019 2019 2019 2019 2019 2018 2018 2018 2018 2018 2017 Sales: 105.8 117.3 118.3 105.7 447.1 100.7 112.1 123.4 119.4 455.6 398.4 Refining Services 16.3 22.0 72.1 75.3 Silica Catalysts 15.9 20.9 25.6 23.3 85.7 16.5 17.3 61.1 118.9 115.1 67.9 363.0 62.7 126.5 115.4 73.7 378.3 324.2 Performance Materials 180.5 177.8 167.9 158.9 685.1 190.0 183.8 174.7 168.8 717.3 687.6 Performance Chemicals (4.1) (3.2) (3.1) (3.4) (13.8) (3.7) (5.0) (2.6) (3.8) (15.1) (13.4) Eliminations 359.2 431.7 423.8 352.4 1,567.1 366.2 434.7 427.2 380.1 1,608.2 1,472.1 Total sales 29.5 39.1 54.4 47.3 170.3 38.3 49.5 32.3 36.5 156.7 143.8 Zeolyst joint venture sales Adjusted EBITDA: 39.7 42.8 51.2 41.9 175.6 35.5 41.3 49.6 50.1 176.5 154.2 Refining Services 18.1 29.6 31.6 28.5 107.8 22.9 23.6 15.7 18.9 81.1 89.4 Catalysts 10.5 29.2 25.8 11.2 76.7 12.1 28.6 21.3 10.5 72.5 Performance Materials 69.7 42.7 41.2 36.8 33.6 154.3 45.1 44.8 41.8 39.2 170.9 170.5 Performance Chemicals 111.0 142.8 145.4 115.2 514.4 115.6 138.3 128.4 118.7 501.0 Total Segment Adjusted EBITDA 483.8 (10.0) (10.3) (7.7) (12.1) (40.1) (7.7) (9.4) (10.3) (9.6) (37.0) (30.5) Corporate 101.0 132.5 137.7 103.1 474.3 107.9 128.9 118.1 109.1 464.0 453.3 Total Adjusted EBITDA Adjusted EBITDA Margin: 37.5% 36.5% 43.3% 39.6% 39.3% 35.3% 36.8% 40.2% 42.0% 38.7% 38.7% Refining Services 1 32.3% 32.3% 35.4% 40.8% Catalysts 40.0% 49.4% 39.5% 40.4% 42.1% 41.8% 35.3% 17.2% 24.6% 22.4% 16.5% 21.1% 19.3% 22.6% 18.5% 14.2% 19.2% 21.5% Performance Materials 23.7% 23.1% 21.9% 21.1% 22.5% 23.7% 24.4% 23.9% 23.2% 23.8% 24.8% Performance Chemicals 1 26.0% 28.1% 28.8% 25.8% 27.3% 26.7% 26.6% 25.7% 26.2% 26.3% 28.1% Total Adjusted EBITDA Margin (1) Adjusted EBITDA margin calculation includes proportionate 50% share of net sales from Zeolyst Joint Venture 18
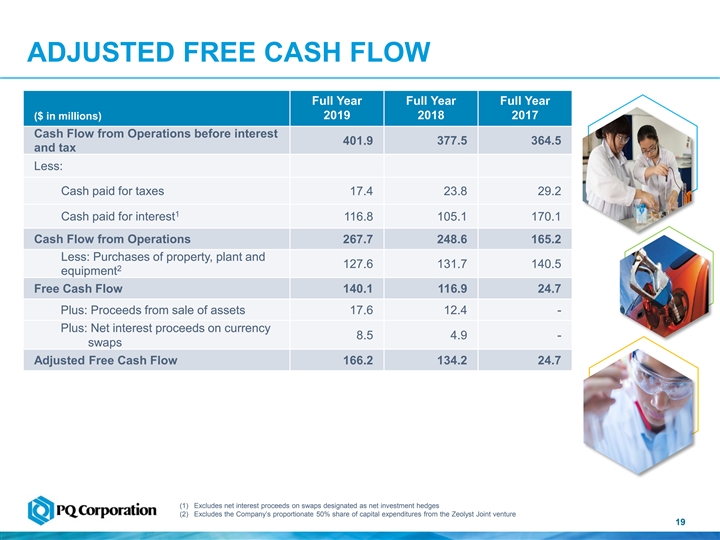
ADJUSTED FREE CASH FLOW Full Year Full Year Full Year 2019 2018 2017 ($ in millions) Cash Flow from Operations before interest 401.9 377.5 364.5 and tax Less: Cash paid for taxes 17.4 23.8 29.2 1 Cash paid for interest 116.8 105.1 170.1 Cash Flow from Operations 267.7 248.6 165.2 Less: Purchases of property, plant and 127.6 131.7 140.5 2 equipment Free Cash Flow 140.1 116.9 24.7 Plus: Proceeds from sale of assets 17.6 12.4 - Plus: Net interest proceeds on currency 8.5 4.9 - swaps Adjusted Free Cash Flow 166.2 134.2 24.7 (1) Excludes net interest proceeds on swaps designated as net investment hedges (2) Excludes the Company’s proportionate 50% share of capital expenditures from the Zeolyst Joint venture 19ADJUSTED FREE CASH FLOW Full Year Full Year Full Year 2019 2018 2017 ($ in millions) Cash Flow from Operations before interest 401.9 377.5 364.5 and tax Less: Cash paid for taxes 17.4 23.8 29.2 1 Cash paid for interest 116.8 105.1 170.1 Cash Flow from Operations 267.7 248.6 165.2 Less: Purchases of property, plant and 127.6 131.7 140.5 2 equipment Free Cash Flow 140.1 116.9 24.7 Plus: Proceeds from sale of assets 17.6 12.4 - Plus: Net interest proceeds on currency 8.5 4.9 - swaps Adjusted Free Cash Flow 166.2 134.2 24.7 (1) Excludes net interest proceeds on swaps designated as net investment hedges (2) Excludes the Company’s proportionate 50% share of capital expenditures from the Zeolyst Joint venture 19
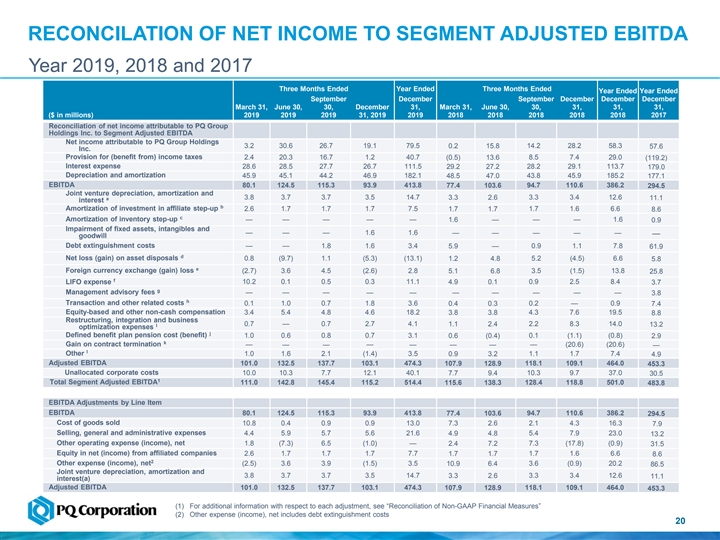
RECONCILATION OF NET INCOME TO SEGMENT ADJUSTED EBITDA Year 2019, 2018 and 2017 Three Months Ended Year Ended Three Months Ended Year Ended Year Ended September December September December December December March 31, June 30, 30, December 31, March 31, June 30, 30, 31, 31, 31, ($ in millions) 31, 2019 2018 2018 2019 2019 2019 2019 2018 2018 2018 2017 Reconciliation of net income attributable to PQ Group Holdings Inc. to Segment Adjusted EBITDA Net income attributable to PQ Group Holdings 3.2 30.6 26.7 19.1 79.5 0.2 15.8 14.2 28.2 58.3 57.6 Inc. Provision for (benefit from) income taxes 2.4 20.3 16.7 1.2 40.7 (0.5) 13.6 8.5 7.4 29.0 (119.2) Interest expense 28.6 28.5 27.7 26.7 111.5 29.2 27.2 28.2 29.1 113.7 179.0 Depreciation and amortization 45.9 45.1 44.2 46.9 182.1 48.5 47.0 43.8 45.9 185.2 177.1 EBITDA 80.1 124.5 115.3 93.9 413.8 77.4 103.6 94.7 110.6 386.2 294.5 Joint venture depreciation, amortization and a 3.8 3.7 3.7 3.5 14.7 3.3 2.6 3.3 3.4 12.6 11.1 interest b Amortization of investment in affiliate step-up 2.6 1.7 1.7 1.7 7.5 1.7 1.7 1.7 1.6 6.6 8.6 c Amortization of inventory step-up — — — — — 1.6 — — — 1.6 0.9 Impairment of fixed assets, intangibles and — — — 1.6 1.6 — — — — — — goodwill Debt extinguishment costs — — 1.8 1.6 3.4 0.9 1.1 7.8 5.9 — 61.9 d Net loss (gain) on asset disposals 0.8 (9.7) 1.1 (5.3) (13.1) 1.2 4.8 5.2 (4.5) 6.6 5.8 e Foreign currency exchange (gain) loss (2.7) 3.6 4.5 (2.6) 2.8 5.1 6.8 3.5 (1.5) 13.8 25.8 f LIFO expense 10.2 0.1 0.5 0.3 11.1 4.9 0.1 0.9 2.5 8.4 3.7 g Management advisory fees — — — — — — — — — — 3.8 h Transaction and other related costs 0.1 1.0 0.7 1.8 3.6 0.4 0.3 0.2 — 0.9 7.4 Equity-based and other non-cash compensation 3.4 5.4 4.8 4.6 18.2 3.8 3.8 4.3 7.6 19.5 8.8 Restructuring, integration and business 0.7 — 0.7 2.7 4.1 1.1 2.4 2.2 8.3 14.0 I 13.2 optimization expenses j Defined benefit plan pension cost (benefit) 1.0 0.6 0.8 0.7 3.1 0.6 (0.4) 0.1 (1.1) (0.8) 2.9 k Gain on contract termination — — — — — — — — (20.6) (20.6) — l Other 1.0 1.6 2.1 (1.4) 3.5 0.9 3.2 1.1 1.7 7.4 4.9 Adjusted EBITDA 101.0 132.5 137.7 103.1 474.3 107.9 128.9 118.1 109.1 464.0 453.3 Unallocated corporate costs 10.0 10.3 7.7 12.1 40.1 7.7 9.4 10.3 9.7 37.0 30.5 1 Total Segment Adjusted EBITDA 111.0 142.8 145.4 115.2 514.4 115.6 138.3 128.4 118.8 501.0 483.8 EBITDA Adjustments by Line Item EBITDA 80.1 124.5 115.3 93.9 413.8 94.7 110.6 386.2 77.4 103.6 294.5 Cost of goods sold 10.8 0.4 0.9 0.9 13.0 7.3 2.6 2.1 4.3 16.3 7.9 Selling, general and administrative expenses 4.4 5.9 5.7 5.6 21.6 4.9 4.8 5.4 7.9 23.0 13.2 Other operating expense (income), net 1.8 (7.3) 6.5 (1.0) — 2.4 7.2 7.3 (17.8) (0.9) 31.5 Equity in net (income) from affiliated companies 2.6 1.7 1.7 1.7 7.7 1.7 1.7 1.7 1.6 6.6 8.6 2 Other expense (income), net (2.5) 3.6 3.9 (1.5) 3.5 10.9 6.4 3.6 (0.9) 20.2 86.5 Joint venture depreciation, amortization and 3.8 3.7 3.7 3.5 14.7 3.3 2.6 3.3 3.4 12.6 11.1 interest(a) Adjusted EBITDA 101.0 132.5 137.7 103.1 474.3 107.9 128.9 118.1 109.1 464.0 453.3 (1) For additional information with respect to each adjustment, see “Reconciliation of Non-GAAP Financial Measures” (2) Other expense (income), net includes debt extinguishment costs 20RECONCILATION OF NET INCOME TO SEGMENT ADJUSTED EBITDA Year 2019, 2018 and 2017 Three Months Ended Year Ended Three Months Ended Year Ended Year Ended September December September December December December March 31, June 30, 30, December 31, March 31, June 30, 30, 31, 31, 31, ($ in millions) 31, 2019 2018 2018 2019 2019 2019 2019 2018 2018 2018 2017 Reconciliation of net income attributable to PQ Group Holdings Inc. to Segment Adjusted EBITDA Net income attributable to PQ Group Holdings 3.2 30.6 26.7 19.1 79.5 0.2 15.8 14.2 28.2 58.3 57.6 Inc. Provision for (benefit from) income taxes 2.4 20.3 16.7 1.2 40.7 (0.5) 13.6 8.5 7.4 29.0 (119.2) Interest expense 28.6 28.5 27.7 26.7 111.5 29.2 27.2 28.2 29.1 113.7 179.0 Depreciation and amortization 45.9 45.1 44.2 46.9 182.1 48.5 47.0 43.8 45.9 185.2 177.1 EBITDA 80.1 124.5 115.3 93.9 413.8 77.4 103.6 94.7 110.6 386.2 294.5 Joint venture depreciation, amortization and a 3.8 3.7 3.7 3.5 14.7 3.3 2.6 3.3 3.4 12.6 11.1 interest b Amortization of investment in affiliate step-up 2.6 1.7 1.7 1.7 7.5 1.7 1.7 1.7 1.6 6.6 8.6 c Amortization of inventory step-up — — — — — 1.6 — — — 1.6 0.9 Impairment of fixed assets, intangibles and — — — 1.6 1.6 — — — — — — goodwill Debt extinguishment costs — — 1.8 1.6 3.4 0.9 1.1 7.8 5.9 — 61.9 d Net loss (gain) on asset disposals 0.8 (9.7) 1.1 (5.3) (13.1) 1.2 4.8 5.2 (4.5) 6.6 5.8 e Foreign currency exchange (gain) loss (2.7) 3.6 4.5 (2.6) 2.8 5.1 6.8 3.5 (1.5) 13.8 25.8 f LIFO expense 10.2 0.1 0.5 0.3 11.1 4.9 0.1 0.9 2.5 8.4 3.7 g Management advisory fees — — — — — — — — — — 3.8 h Transaction and other related costs 0.1 1.0 0.7 1.8 3.6 0.4 0.3 0.2 — 0.9 7.4 Equity-based and other non-cash compensation 3.4 5.4 4.8 4.6 18.2 3.8 3.8 4.3 7.6 19.5 8.8 Restructuring, integration and business 0.7 — 0.7 2.7 4.1 1.1 2.4 2.2 8.3 14.0 I 13.2 optimization expenses j Defined benefit plan pension cost (benefit) 1.0 0.6 0.8 0.7 3.1 0.6 (0.4) 0.1 (1.1) (0.8) 2.9 k Gain on contract termination — — — — — — — — (20.6) (20.6) — l Other 1.0 1.6 2.1 (1.4) 3.5 0.9 3.2 1.1 1.7 7.4 4.9 Adjusted EBITDA 101.0 132.5 137.7 103.1 474.3 107.9 128.9 118.1 109.1 464.0 453.3 Unallocated corporate costs 10.0 10.3 7.7 12.1 40.1 7.7 9.4 10.3 9.7 37.0 30.5 1 Total Segment Adjusted EBITDA 111.0 142.8 145.4 115.2 514.4 115.6 138.3 128.4 118.8 501.0 483.8 EBITDA Adjustments by Line Item EBITDA 80.1 124.5 115.3 93.9 413.8 94.7 110.6 386.2 77.4 103.6 294.5 Cost of goods sold 10.8 0.4 0.9 0.9 13.0 7.3 2.6 2.1 4.3 16.3 7.9 Selling, general and administrative expenses 4.4 5.9 5.7 5.6 21.6 4.9 4.8 5.4 7.9 23.0 13.2 Other operating expense (income), net 1.8 (7.3) 6.5 (1.0) — 2.4 7.2 7.3 (17.8) (0.9) 31.5 Equity in net (income) from affiliated companies 2.6 1.7 1.7 1.7 7.7 1.7 1.7 1.7 1.6 6.6 8.6 2 Other expense (income), net (2.5) 3.6 3.9 (1.5) 3.5 10.9 6.4 3.6 (0.9) 20.2 86.5 Joint venture depreciation, amortization and 3.8 3.7 3.7 3.5 14.7 3.3 2.6 3.3 3.4 12.6 11.1 interest(a) Adjusted EBITDA 101.0 132.5 137.7 103.1 474.3 107.9 128.9 118.1 109.1 464.0 453.3 (1) For additional information with respect to each adjustment, see “Reconciliation of Non-GAAP Financial Measures” (2) Other expense (income), net includes debt extinguishment costs 20
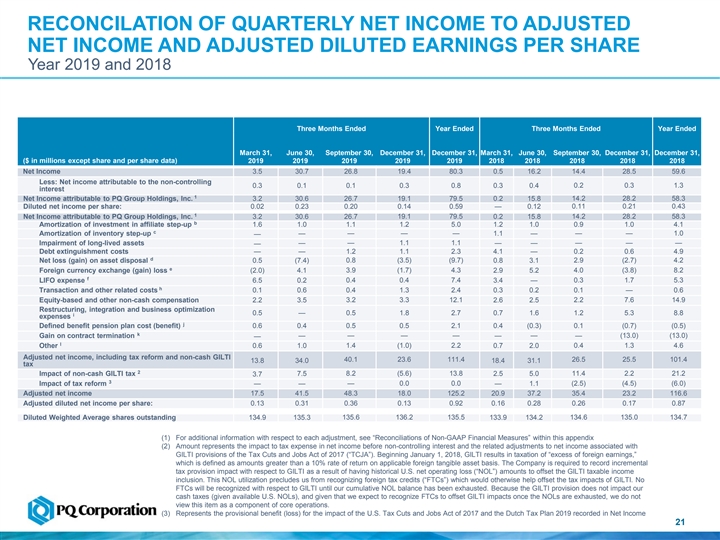
RECONCILATION OF QUARTERLY NET INCOME TO ADJUSTED NET INCOME AND ADJUSTED DILUTED EARNINGS PER SHARE Year 2019 and 2018 Three Months Ended Year Ended Three Months Ended Year Ended March 31, June 30, September 30, December 31, December 31, March 31, June 30, September 30, December 31, December 31, ($ in millions except share and per share data) 2019 2019 2019 2019 2019 2018 2018 2018 2018 2018 Net Income 3.5 30.7 26.8 19.4 80.3 0.5 16.2 14.4 28.5 59.6 Less: Net income attributable to the non-controlling 0.3 0.1 0.1 0.3 0.8 0.3 0.4 0.2 0.3 1.3 interest 1 Net Income attributable to PQ Group Holdings, Inc. 3.2 30.6 26.7 19.1 79.5 0.2 15.8 14.2 28.2 58.3 Diluted net income per share: 0.02 0.23 0.20 0.14 0.59 — 0.12 0.11 0.21 0.43 1 Net Income attributable to PQ Group Holdings, Inc. 3.2 30.6 26.7 19.1 79.5 0.2 15.8 14.2 28.2 58.3 b Amortization of investment in affiliate step-up 1.6 1.0 1.1 1.2 5.0 1.2 1.0 0.9 1.0 4.1 c Amortization of inventory step-up — — — — — 1.1 — — — 1.0 Impairment of long-lived assets — — 1.1 1.1 — — — — — — Debt extinguishment costs — — 1.2 1.1 2.3 4.1 — 0.2 0.6 4.9 d Net loss (gain) on asset disposal 0.5 (7.4) 0.8 (3.5) (9.7) 0.8 3.1 2.9 (2.7) 4.2 e Foreign currency exchange (gain) loss (2.0) 4.1 3.9 (1.7) 4.3 2.9 5.2 4.0 (3.8) 8.2 f LIFO expense 6.5 0.2 0.4 0.4 7.4 3.4 — 0.3 1.7 5.3 h 0.4 1.3 2.4 0.1 — 0.6 Transaction and other related costs 0.1 0.6 0.3 0.2 Equity-based and other non-cash compensation 2.2 3.5 3.2 3.3 12.1 2.6 2.5 2.2 7.6 14.9 Restructuring, integration and business optimization 0.5 — 0.5 1.8 2.7 0.7 1.6 1.2 5.3 8.8 i expenses j Defined benefit pension plan cost (benefit) 0.6 0.4 0.5 0.5 2.1 0.4 (0.3) 0.1 (0.7) (0.5) k Gain on contract termination — — — — — — — (13.0) (13.0) — l Other 0.6 1.0 1.4 (1.0) 2.2 0.7 2.0 0.4 1.3 4.6 Adjusted net income, including tax reform and non-cash GILTI 40.1 23.6 111.4 26.5 25.5 101.4 13.8 34.0 18.4 31.1 tax 2 Impact of non-cash GILTI tax 7.5 8.2 (5.6) 13.8 2.5 5.0 11.4 2.2 21.2 3.7 3 Impact of tax reform — — — 0.0 0.0 — 1.1 (2.5) (4.5) (6.0) Adjusted net income 17.5 41.5 48.3 18.0 125.2 20.9 37.2 35.4 23.2 116.6 Adjusted diluted net income per share: 0.13 0.31 0.36 0.13 0.92 0.16 0.28 0.26 0.17 0.87 Diluted Weighted Average shares outstanding 134.9 135.3 135.6 136.2 135.5 133.9 134.2 134.6 135.0 134.7 (1) For additional information with respect to each adjustment, see “Reconciliations of Non-GAAP Financial Measures” within this appendix (2) Amount represents the impact to tax expense in net income before non-controlling interest and the related adjustments to net income associated with GILTI provisions of the Tax Cuts and Jobs Act of 2017 (“TCJA”). Beginning January 1, 2018, GILTI results in taxation of “excess of foreign earnings,” which is defined as amounts greater than a 10% rate of return on applicable foreign tangible asset basis. The Company is required to record incremental tax provision impact with respect to GILTI as a result of having historical U.S. net operating loss (“NOL”) amounts to offset the GILTI taxable income inclusion. This NOL utilization precludes us from recognizing foreign tax credits (“FTCs”) which would otherwise help offset the tax impacts of GILTI. No FTCs will be recognized with respect to GILTI until our cumulative NOL balance has been exhausted. Because the GILTI provision does not impact our cash taxes (given available U.S. NOLs), and given that we expect to recognize FTCs to offset GILTI impacts once the NOLs are exhausted, we do not view this item as a component of core operations. (3) Represents the provisional benefit (loss) for the impact of the U.S. Tax Cuts and Jobs Act of 2017 and the Dutch Tax Plan 2019 recorded in Net Income 21RECONCILATION OF QUARTERLY NET INCOME TO ADJUSTED NET INCOME AND ADJUSTED DILUTED EARNINGS PER SHARE Year 2019 and 2018 Three Months Ended Year Ended Three Months Ended Year Ended March 31, June 30, September 30, December 31, December 31, March 31, June 30, September 30, December 31, December 31, ($ in millions except share and per share data) 2019 2019 2019 2019 2019 2018 2018 2018 2018 2018 Net Income 3.5 30.7 26.8 19.4 80.3 0.5 16.2 14.4 28.5 59.6 Less: Net income attributable to the non-controlling 0.3 0.1 0.1 0.3 0.8 0.3 0.4 0.2 0.3 1.3 interest 1 Net Income attributable to PQ Group Holdings, Inc. 3.2 30.6 26.7 19.1 79.5 0.2 15.8 14.2 28.2 58.3 Diluted net income per share: 0.02 0.23 0.20 0.14 0.59 — 0.12 0.11 0.21 0.43 1 Net Income attributable to PQ Group Holdings, Inc. 3.2 30.6 26.7 19.1 79.5 0.2 15.8 14.2 28.2 58.3 b Amortization of investment in affiliate step-up 1.6 1.0 1.1 1.2 5.0 1.2 1.0 0.9 1.0 4.1 c Amortization of inventory step-up — — — — — 1.1 — — — 1.0 Impairment of long-lived assets — — 1.1 1.1 — — — — — — Debt extinguishment costs — — 1.2 1.1 2.3 4.1 — 0.2 0.6 4.9 d Net loss (gain) on asset disposal 0.5 (7.4) 0.8 (3.5) (9.7) 0.8 3.1 2.9 (2.7) 4.2 e Foreign currency exchange (gain) loss (2.0) 4.1 3.9 (1.7) 4.3 2.9 5.2 4.0 (3.8) 8.2 f LIFO expense 6.5 0.2 0.4 0.4 7.4 3.4 — 0.3 1.7 5.3 h 0.4 1.3 2.4 0.1 — 0.6 Transaction and other related costs 0.1 0.6 0.3 0.2 Equity-based and other non-cash compensation 2.2 3.5 3.2 3.3 12.1 2.6 2.5 2.2 7.6 14.9 Restructuring, integration and business optimization 0.5 — 0.5 1.8 2.7 0.7 1.6 1.2 5.3 8.8 i expenses j Defined benefit pension plan cost (benefit) 0.6 0.4 0.5 0.5 2.1 0.4 (0.3) 0.1 (0.7) (0.5) k Gain on contract termination — — — — — — — (13.0) (13.0) — l Other 0.6 1.0 1.4 (1.0) 2.2 0.7 2.0 0.4 1.3 4.6 Adjusted net income, including tax reform and non-cash GILTI 40.1 23.6 111.4 26.5 25.5 101.4 13.8 34.0 18.4 31.1 tax 2 Impact of non-cash GILTI tax 7.5 8.2 (5.6) 13.8 2.5 5.0 11.4 2.2 21.2 3.7 3 Impact of tax reform — — — 0.0 0.0 — 1.1 (2.5) (4.5) (6.0) Adjusted net income 17.5 41.5 48.3 18.0 125.2 20.9 37.2 35.4 23.2 116.6 Adjusted diluted net income per share: 0.13 0.31 0.36 0.13 0.92 0.16 0.28 0.26 0.17 0.87 Diluted Weighted Average shares outstanding 134.9 135.3 135.6 136.2 135.5 133.9 134.2 134.6 135.0 134.7 (1) For additional information with respect to each adjustment, see “Reconciliations of Non-GAAP Financial Measures” within this appendix (2) Amount represents the impact to tax expense in net income before non-controlling interest and the related adjustments to net income associated with GILTI provisions of the Tax Cuts and Jobs Act of 2017 (“TCJA”). Beginning January 1, 2018, GILTI results in taxation of “excess of foreign earnings,” which is defined as amounts greater than a 10% rate of return on applicable foreign tangible asset basis. The Company is required to record incremental tax provision impact with respect to GILTI as a result of having historical U.S. net operating loss (“NOL”) amounts to offset the GILTI taxable income inclusion. This NOL utilization precludes us from recognizing foreign tax credits (“FTCs”) which would otherwise help offset the tax impacts of GILTI. No FTCs will be recognized with respect to GILTI until our cumulative NOL balance has been exhausted. Because the GILTI provision does not impact our cash taxes (given available U.S. NOLs), and given that we expect to recognize FTCs to offset GILTI impacts once the NOLs are exhausted, we do not view this item as a component of core operations. (3) Represents the provisional benefit (loss) for the impact of the U.S. Tax Cuts and Jobs Act of 2017 and the Dutch Tax Plan 2019 recorded in Net Income 21
RECONCILIATION OF NON-GAAP FINANCIAL MEASURES Descriptions to PQ Non-GAAP Reconciliations a) We use Adjusted EBITDA as a performance measure to evaluate our financial results. Because our Catalysts segment includes our 50% interest in the Zeolyst Joint venture, we include an adjustment for our 50% proportionate share of depreciation, amortization and interest expense of the Zeolyst Joint venture. b) Represents the amortization of the fair value adjustments associated with the equity affiliate investment in the Zeolyst Joint venture as a result of the combination of the businesses of PQ Holdings Inc. and Eco Services Operations LLC in May 2016 (the “Business Combination”). We determined the fair value of the equity affiliate investment and the fair value step-up was then attributed to the underlying assets of the Zeolyst Joint venture. Amortization is primarily related to the fair value adjustments associated with inventory, fixed assets and intangible assets, including customer relationships and technical know-how. c) As a result of the Sovitec acquisition and the Business Combination, there was a step-up in the fair value of inventory, which is amortized through cost of goods sold in the statements of income. d) When asset disposals occur, we remove the impact of net gain/loss of the disposed asset because such impact primarily reflects the non-cash write-off of long-lived assets no longer in use. During the year ended December 31, 2019, the net gain on asset disposals includes the gains related to the sale of a non-core product line and sale of property. e) Reflects the exclusion of the foreign currency transaction gains and losses in the statements of income primarily related to the non-permanent intercompany debt denominated in local currency translated to U.S. dollars and, during 2018 and 2017, the Euro denominated term loan (which was settled as part of the February 2018 term loan refinancing). f) Represents non-cash adjustments to the Company’s LIFO reserves for certain inventories in the U.S. that are valued using the LIFO method, which we believe provides a means of comparison to other companies that may not use the same basis of accounting for inventories. g) Reflects consulting fees paid to CCMP and affiliates of INEOS for consulting services that include certain financial advisory and management services. These consulting agreements were terminated upon completion of our initial public offering (“IPO”) on October 3, 2017. h) Represents the costs related to several transactions that are completed, pending or abandoned and that we believe are not representative of our ongoing business operations. i) Includes the impact of restructuring, integration and business optimization expenses which are incremental costs that are not representative of our ongoing business operations. j) Represents adjustments for defined benefit pension plan costs in our statements of income. More than two-thirds of our defined benefit pension plan obligations are under defined benefit pension plans that are frozen, and the remaining obligations primarily relate to plans operated in certain of our non-U.S. locations that, pursuant to jurisdictional requirements, cannot be frozen. As such, we do not view such expenses as core to our ongoing business operations. k) Represents a non-cash gain on the write-off of the remaining liability under a contractual supply arrangement. As part of the acquisition by Eco Services Operations LLC of substantially all of the assets of Solvay USA Inc.’s sulfuric acid refining business unit on December 1, 2014, we recognized a liability as part of business combination accounting related to our obligation to serve a customer under a pre-existing unfavorable supply agreement. In December 2018, the customer who was party to the agreement closed its facility, and as a result, we were relieved from our obligation to continue to supply the customer on the below market contract. Because the fair value of the unfavorable contract liability was recognized as part of the application of business combination accounting, and since the write-off of the remaining liability was non-cash in nature, we believe this gain is a special item that is not representative of our ongoing business operations. l) Other costs consist of certain expenses that are not core to our ongoing business operations, including environmental remediation-related costs associated with the legacy operations of our business prior to the Business Combination, capital and franchise taxes, non-cash asset retirement obligation accretion and the initial implementation of procedures to comply with Section 404 of the Sarbanes-Oxley Act. Included in this line-item are rounding discrepancies that may arise from rounding from dollars (in thousands) to dollars (in millions). 22RECONCILIATION OF NON-GAAP FINANCIAL MEASURES Descriptions to PQ Non-GAAP Reconciliations a) We use Adjusted EBITDA as a performance measure to evaluate our financial results. Because our Catalysts segment includes our 50% interest in the Zeolyst Joint venture, we include an adjustment for our 50% proportionate share of depreciation, amortization and interest expense of the Zeolyst Joint venture. b) Represents the amortization of the fair value adjustments associated with the equity affiliate investment in the Zeolyst Joint venture as a result of the combination of the businesses of PQ Holdings Inc. and Eco Services Operations LLC in May 2016 (the “Business Combination”). We determined the fair value of the equity affiliate investment and the fair value step-up was then attributed to the underlying assets of the Zeolyst Joint venture. Amortization is primarily related to the fair value adjustments associated with inventory, fixed assets and intangible assets, including customer relationships and technical know-how. c) As a result of the Sovitec acquisition and the Business Combination, there was a step-up in the fair value of inventory, which is amortized through cost of goods sold in the statements of income. d) When asset disposals occur, we remove the impact of net gain/loss of the disposed asset because such impact primarily reflects the non-cash write-off of long-lived assets no longer in use. During the year ended December 31, 2019, the net gain on asset disposals includes the gains related to the sale of a non-core product line and sale of property. e) Reflects the exclusion of the foreign currency transaction gains and losses in the statements of income primarily related to the non-permanent intercompany debt denominated in local currency translated to U.S. dollars and, during 2018 and 2017, the Euro denominated term loan (which was settled as part of the February 2018 term loan refinancing). f) Represents non-cash adjustments to the Company’s LIFO reserves for certain inventories in the U.S. that are valued using the LIFO method, which we believe provides a means of comparison to other companies that may not use the same basis of accounting for inventories. g) Reflects consulting fees paid to CCMP and affiliates of INEOS for consulting services that include certain financial advisory and management services. These consulting agreements were terminated upon completion of our initial public offering (“IPO”) on October 3, 2017. h) Represents the costs related to several transactions that are completed, pending or abandoned and that we believe are not representative of our ongoing business operations. i) Includes the impact of restructuring, integration and business optimization expenses which are incremental costs that are not representative of our ongoing business operations. j) Represents adjustments for defined benefit pension plan costs in our statements of income. More than two-thirds of our defined benefit pension plan obligations are under defined benefit pension plans that are frozen, and the remaining obligations primarily relate to plans operated in certain of our non-U.S. locations that, pursuant to jurisdictional requirements, cannot be frozen. As such, we do not view such expenses as core to our ongoing business operations. k) Represents a non-cash gain on the write-off of the remaining liability under a contractual supply arrangement. As part of the acquisition by Eco Services Operations LLC of substantially all of the assets of Solvay USA Inc.’s sulfuric acid refining business unit on December 1, 2014, we recognized a liability as part of business combination accounting related to our obligation to serve a customer under a pre-existing unfavorable supply agreement. In December 2018, the customer who was party to the agreement closed its facility, and as a result, we were relieved from our obligation to continue to supply the customer on the below market contract. Because the fair value of the unfavorable contract liability was recognized as part of the application of business combination accounting, and since the write-off of the remaining liability was non-cash in nature, we believe this gain is a special item that is not representative of our ongoing business operations. l) Other costs consist of certain expenses that are not core to our ongoing business operations, including environmental remediation-related costs associated with the legacy operations of our business prior to the Business Combination, capital and franchise taxes, non-cash asset retirement obligation accretion and the initial implementation of procedures to comply with Section 404 of the Sarbanes-Oxley Act. Included in this line-item are rounding discrepancies that may arise from rounding from dollars (in thousands) to dollars (in millions). 22
2323