Attached files
UNITED STATES
SECURITIES AND EXCHANGE COMMISSION
Washington, D.C. 20549
Form 10-K
☒ | ANNUAL REPORT PURSUANT TO SECTION 13 OR 15(d) OF THE SECURITIES EXCHANGE ACT OF 1934 |
For the fiscal year ended December 31, 2019 | |
or | |
☐ | TRANSITION REPORT PURSUANT TO SECTION 13 OR 15(d) OF THE SECURITIES EXCHANGE ACT OF 1934 |
For the transition period from ____ to ____ | |
Commission file number 001-37363 | |
Enviva Partners, LP | ||
(Exact name of registrant as specified in its charter) | ||
Delaware | 46-4097730 | |
(State or other jurisdiction | (I.R.S. Employer | |
of incorporation or organization) | Identification No.) | |
7200 Wisconsin Ave, Suite 1000 | ||
Bethesda, MD | 20814 | |
(Address of principal executive offices) | (Zip code) | |
(301) 657-5560 | ||
(Registrant’s telephone number, including area code) | ||
Securities registered pursuant to Section 12(b) of the Act: | ||
Title of each class | Trading Symbol | Name of each exchange on which registered |
Common Units Representing Limited Partner Interests | EVA | New York Stock Exchange |
Securities registered pursuant to Section 12(g) of the Act: None
Indicate by check mark if the registrant is a well-known seasoned issuer, as defined in Rule 405 of the Securities Act. Yes ☐ No ☒
Indicate by check mark if the registrant is not required to file reports pursuant to Section 13 or 15(d) of the Act. Yes ☐ No ☒
Indicate by check mark whether the registrant (1) has filed all reports required to be filed by Section 13 or 15(d) of the Securities Exchange Act of 1934 during the preceding 12 months (or for such shorter period that the registrant was required to file such reports) and (2) has been subject to such filing requirements for the past 90 days. Yes ☒ No ☐
Indicate by check mark whether the registrant has submitted electronically every Interactive Data File required to be submitted pursuant to Rule 405 of Regulation S-T (§232.405 of this chapter) during the preceding 12 months (or for such shorter period that the registrant was required to submit such files). Yes ☒ No ☐
Indicate by check mark whether the registrant is a large accelerated filer, an accelerated filer, a non-accelerated filer, a smaller reporting company or an emerging growth company. See the definitions of “large accelerated filer,” “accelerated filer,” “smaller reporting company,” and “emerging growth company” in Rule 12b-2 of the Exchange Act.
Large accelerated filer ☐ | Accelerated filer ☒ | |
Non-accelerated filer ☐ | Smaller reporting company ☐ | |
Emerging growth company ☒ | ||
If an emerging growth company, indicate by check mark if the registrant has elected not to use the extended transition period for complying with any new or revised financial accounting standards provided pursuant to Section 13(a) of the Exchange Act. ☒
Indicate by check mark whether the registrant is a shell company (as defined in Rule 12b-2 of the Act). Yes ☐ No ☒
The aggregate market value of the common units held by non-affiliates of the registrant as of June 30, 2019 was approximately $624.3 million, based upon a closing price of $31.42 per common unit as reported on the New York Stock Exchange on such date.
As of February 14, 2020, 33,605,138 common units were outstanding.
Documents Incorporated by Reference: | ||||
None | ||||
ENVIVA PARTNERS, LP
ANNUAL REPORT ON FORM 10‑K
TABLE OF CONTENTS
CAUTIONARY STATEMENT REGARDING FORWARD‑LOOKING STATEMENTS
Certain statements and information in this Annual Report on Form 10‑K (this “Annual Report”) may constitute “forward-looking statements.” The words “believe,” “expect,” “anticipate,” “plan,” “intend,” “foresee,” “should,” “would,” “could” or other similar expressions are intended to identify forward‑looking statements, which are generally not historical in nature. These forward-looking statements are based on our current expectations and beliefs concerning future developments and their potential effect on us. Although management believes that these forward-looking statements are reasonable as and when made, there can be no assurance that future developments affecting us will be those that we anticipate. All comments concerning our expectations for future revenues and operating results are based on our forecasts for our existing operations and do not include the potential impact of any future acquisitions. Our forward-looking statements involve significant risks and uncertainties (some of which are beyond our control) and assumptions that could cause actual results to differ materially from our historical experience and our present expectations or projections. Important factors that could cause actual results to differ materially from those in the forward-looking statements include, but are not limited to, those summarized below:
• | the volume and quality of products that we are able to produce or source and sell, which could be adversely affected by, among other things, operating or technical difficulties at our wood pellet production plants or deep-water marine terminals; |
• | the prices at which we are able to sell our products; |
• | our ability to successfully negotiate, complete and integrate drop-down or third-party acquisitions, including the associated contracts, or to realize the anticipated benefits of such acquisitions; |
• | failure of our customers, vendors and shipping partners to pay or perform their contractual obligations to us; |
• | our inability to successfully execute our project development and construction activities, including the expansion of our Northampton and Southampton plants, on time and within budget; |
• | the creditworthiness of our contract counterparties; |
• | the amount of low-cost wood fiber that we are able to procure and process, which could be adversely affected by, among other things, disruptions in supply or operating or financial difficulties suffered by our suppliers; |
• | changes in the price and availability of natural gas, coal or other sources of energy; |
• | changes in prevailing economic conditions; |
• | unanticipated ground, grade or water conditions; |
• | inclement or hazardous environmental conditions, including extreme precipitation, temperatures and flooding; |
• | fires, explosions or other accidents; |
• | changes in domestic and foreign laws and regulations (or the interpretation thereof) related to renewable or low-carbon energy, the forestry products industry, the international shipping industry or power, heat or combined heat and power generators; |
• | changes in the regulatory treatment of biomass in core and emerging markets; |
• | our inability to acquire or maintain necessary permits or rights for our production, transportation or terminaling operations; |
• | changes in the price and availability of transportation; |
• | changes in foreign currency exchange or interest rates, and the failure of our hedging arrangements to effectively reduce our exposure to the risks related thereto; |
• | risks related to our indebtedness; |
1
• | our failure to maintain effective quality control systems at our production plants and deep-water marine terminals, which could lead to the rejection of our products by our customers; |
• | changes in the quality specifications for our products that are required by our customers; |
• | labor disputes; |
• | our inability to hire, train or retain qualified personnel to manage and operate our business and newly acquired assets; |
• | the effects of the exit of the United Kingdom from the European Union on our and our customers’ businesses; and |
• | our inability to borrow funds and access capital markets. |
All forward-looking statements in this Annual Report are expressly qualified in their entirety by the foregoing cautionary statements.
Please read Part I, Item 1A. “Risk Factors.” Readers are cautioned not to place undue reliance on forward-looking statements and we undertake no obligation to update or revise any such statements after the date they are made, whether as a result of new information, future events or otherwise.
2
GLOSSARY OF TERMS
biomass: any organic biological material derived from living organisms that stores energy from the sun.
co-fire: the combustion of two different types of materials at the same time. For example, biomass is sometimes fired in combination with coal in existing coal plants.
cost pass-through mechanism: a provision in commercial contracts that passes costs through to the purchaser.
dry-bulk: describes dry-bulk commodities that are shipped in large, unpackaged amounts.
metric ton: one metric ton, which is equivalent to 1,000 kilograms and 1.1023 short tons.
net calorific value: the amount of usable heat energy released when a fuel is burned completely and the heat contained in the water vapor generated by the combustion process is not recovered. The European power industry typically uses net calorific value as the means of expressing fuel energy.
off-take contract: an agreement concerning the purchase and sale of a certain volume of future production of a given resource such as wood pellets.
ramp: increasing production for a period of time following the startup of a plant or completion of a project.
Riverstone: Riverstone Holdings LLC.
Riverstone Funds: Riverstone/Carlyle Renewable and Alternative Energy Fund II, L.P. and certain affiliated entities, collectively.
stumpage: the price paid to the underlying timber resource owner for the raw material.
utility-grade wood pellets: wood pellets meeting minimum requirements generally specified by industrial consumers and produced and sold in sufficient quantities to satisfy industrial‑scale consumption.
wood fiber: cellulosic elements that are extracted from trees and used to make various materials, including paper. In North America, wood fiber is primarily extracted from hardwood (deciduous) trees and softwood (coniferous) trees.
wood pellets: energy-dense, low-moisture and uniformly sized units of wood fuel produced from processing various wood resources or byproducts.
3
PART I
ITEM 1. | BUSINESS |
References in this Annual Report to “we,” “us,” “our,” the “Partnership”, or similar expressions refer to Enviva Partners, LP, including its subsidiaries. References to “our sponsor” refer to Enviva Holdings, LP, and, where applicable, its wholly owned subsidiaries Enviva MLP Holdco, LLC and Enviva Development Holdings, LLC. References to “our General Partner” refer to Enviva Partners GP, LLC, a wholly owned subsidiary of Enviva Holdings, LP. References to “Enviva Management” refer to Enviva Management Company, LLC, a wholly owned subsidiary of Enviva Holdings, LP, and references to “our employees” refer to the employees of Enviva Management and its affiliates who provide services to the Partnership. References to the “Sponsor JV” refer to Enviva JV Development Company, LLC, which is a joint venture between our sponsor and John Hancock Life Insurance Company (U.S.A.) and certain of its affiliates. Please read Cautionary Statement Regarding Forward-Looking Statements on page 1 and Item 1A. “Risk Factors” for information regarding certain risks inherent in our business.
Overview
We are a growth-oriented master limited partnership formed in 2013 that is focused on owning, operating and acquiring assets from our sponsor or third parties. We aggregate a natural resource, wood fiber, and process it into a transportable form, wood pellets. We sell a significant majority of our wood pellets through long-term, take-or-pay off-take contracts with creditworthy customers in the United Kingdom (the “U.K.”), Europe and increasingly in Japan. We own and operate seven plants (collectively, “our plants”) with a combined production capacity of approximately 3.5 million metric tons of wood pellets per year (“MTPY”) in Virginia, North Carolina, Mississippi, and Florida, the production of which is fully contracted through 2025. We export wood pellets through our wholly owned dry-bulk, deep-water marine terminal at the Port of Chesapeake, Virginia (the “Chesapeake terminal”) and terminal assets at the Port of Wilmington, North Carolina (the “Wilmington terminal”) and from third-party deep-water marine terminals in Mobile, Alabama (the “Mobile terminal”) and Panama City, Florida (the “Panama City terminal”). All of our facilities are located in geographic regions with low input costs and favorable transportation logistics. Owning these cost-advantaged assets, the output from which is fully contracted, in a rapidly expanding industry provides us with a platform to generate stable and growing cash flows. Our plants are sited in robust fiber baskets providing stable pricing for the low-grade fiber used to produce wood pellets. Our raw materials are byproducts of traditional timber harvesting, principally low-value wood materials, such as trees generally not suited for sawmilling or other manufactured forest products, and tree tops and limbs, understory, brush and slash that are generated in a harvest.
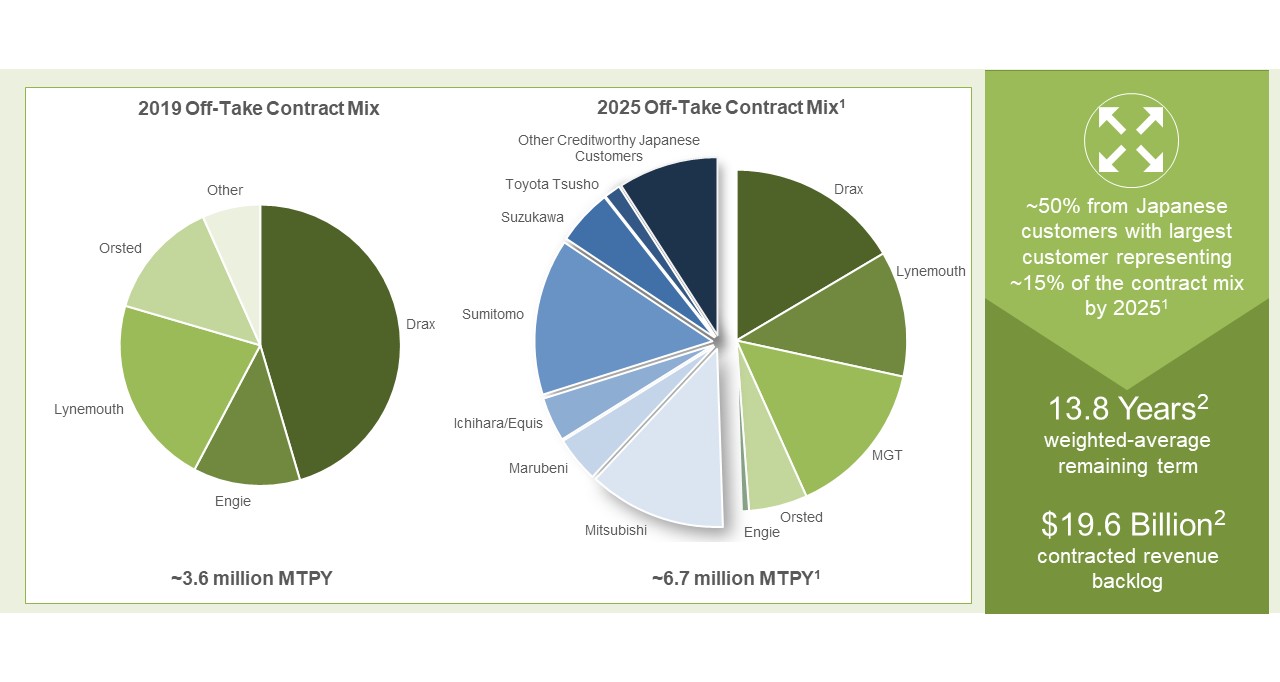
Our strategy is to fully contract the wood pellet production from our plants under long-term, take-or-pay off-take contracts with a diversified and creditworthy customer base. Our long-term off-take contracts typically provide for fixed-price deliveries that may include provisions that escalate the price over time and provide for other margin protection. During 2019, production capacity from our wood pellet production plants and wood pellets sourced from our affiliates and third parties were approximately equal to the contracted volumes under our existing long-term, take-or-pay off-take contracts. Our long-term, take-or-pay off-take contracts provide for a product sales backlog of $10.6 billion and have a total weighted-average remaining term of 11.4 years from February 1, 2020. Under our current product sales backlog, our plants are fully contracted through 2025. Assuming all volumes under the firm and contingent long-term off-take contracts held by our sponsor and the Sponsor JV were included with our product sales backlog for firm and contingent contracted product sales, our product sales backlog would increase to $19.6 billion and the total weighted-average remaining term from February 1, 2020 would increase to 13.8 years.
Our customers use our wood pellets as a substitute fuel for coal in dedicated biomass or co-fired coal power plants. Wood pellets serve as a suitable “drop-in” alternative to coal because of their comparable heat content, density and form. Due to the uninterruptible nature of our customers’ fuel consumption, our customers require a reliable supply of wood pellets that meet stringent product specifications. We have built our operations and assets to deliver and certify the highest levels of product quality and our proven track record of reliable deliveries enables us to charge premium prices for this certainty. In addition to our customers’ focus on the reliability of supply, they are concerned about the combustion efficiency of the wood pellets and their safe handling. Because combustion efficiency is a function of energy density, particle size distribution, ash/inert content and moisture, our customers require that we supply wood pellets meeting minimum criteria for a variety of specifications and, in some cases, provide incentives for exceeding our contract specifications.
Our Production Plants, Logistics and Storage Capabilities
We procure low-grade wood fiber and process it into utility-grade wood pellets and load the finished wood pellets into railcars, trucks and barges for transportation to deep-water marine terminals, where they are received, stored and ultimately loaded onto oceangoing vessels for delivery to our customers.
We own and operate seven industrial-scale wood pellet production plants strategically located in the Mid-Atlantic and Gulf Coast regions of the United States, geographic areas in which wood fiber resources are plentiful and readily available. Our plants are
4
constructed according to a “build and copy” approach, which allows for operating efficiencies. Furthermore, our multi-plant profile and scale provide us with flexibility under our portfolio of off-take contracts that enhances the reliability of our deliveries and provides opportunities for optimization.
Our facilities are designed to operate 24 hours per day, 365 days per year, although we schedule up to 15 days of planned maintenance for our wood pellet production plants during each calendar year. There are no regularly required major turnarounds or overhauls.
Mid-Atlantic Region Plants
The following table describes our wood pellet production plants in the Mid-Atlantic region:
Plant Location | Operations Commenced | Production (MTPY) | ||||
Ahoskie, North Carolina | 2011 | 415,000 | ||||
Northampton, North Carolina (1) | 2013 | 550,000 | ||||
Southampton, Virginia (1) | 2013 | 545,000 | ||||
Sampson, North Carolina (2) | 2016 | 555,000 | ||||
Hamlet, North Carolina (3) | 2019 | 500,000 | ||||
Total | 2,565,000 | |||||
(1) | Production capacities for the Northampton and Southampton plants do not include increased production capacity pursuant to ongoing expansion projects. We expect to commence the production ramp for the Northampton and Southampton plant expansions in the second and third quarters of 2020, respectively. |
(2) | We expect the Sampson plant to increase production capacity to 600,000 MTPY during 2020. |
(3) | The Hamlet plant currently has a production capacity of approximately 500,000 MTPY. We expect the Hamlet plant to reach its nameplate production capacity of approximately 600,000 MTPY by the end of 2020. |
Ahoskie
We acquired the site of our wood pellet production plant in Ahoskie, North Carolina (the “Ahoskie plant”) in December 2010 and constructed the Ahoskie plant there in less than one year, commencing operations in November 2011. Through an expansion completed in June 2012, we increased the plant’s production from 260,000 MTPY to 350,000 MTPY and have made further improvements to increase production to 415,000 MTPY of wood pellets.
Production from the Ahoskie plant is transported by truck to our Chesapeake terminal.
Hamlet
In April 2019, we acquired from our sponsor all of the Class B units of Enviva Wilmington Holdings, LLC (the “Hamlet JV,” and such acquisition, the “Hamlet Drop-Down”). The Hamlet JV owns a wood pellet production plant in Hamlet, North Carolina (the “Hamlet plant”). We are the managing member of the Hamlet JV, which is partially owned by John Hancock Life Insurance Company (U.S.A.) and certain of its affiliates (collectively, where applicable, “John Hancock”). We accounted for the Hamlet JV as a consolidated subsidiary, not as a joint venture, following the Hamlet Drop-Down. For more information regarding our rights and obligations with respect to the Hamlet JV, see Note 17, Partners’ Capital-Noncontrolling Interests—Hamlet JV.
The Hamlet plant currently has a production capacity of approximately 500,000 MTPY. We expect the Hamlet plant to reach its nameplate production capacity of approximately 600,000 MTPY by the end of 2020.
Production from the Hamlet plant is transported by rail to our Wilmington terminal.
Northampton
Our wood pellet production plant in Northampton, North Carolina (the “Northampton plant”) was constructed based on the Ahoskie plant design, utilizing the same major equipment suppliers. The Northampton plant currently produces 550,000 MTPY of wood pellets. We are currently engaged in an expansion project to increase the wood pellet production of the Northampton plant to 750,000 MTPY. We expect to commence the production ramp for the Northampton plant expansion in the second quarter of 2020.
Production from the Northampton plant is transported by truck to our Chesapeake terminal.
5
Sampson
Our wood pellet production plant in Sampson, North Carolina (the “Sampson plant”), which was built based on our templated design and which we acquired from our sponsor’s first development joint venture in December 2016, commenced operations during the fourth quarter of 2016 and currently produces 555,000 MTPY of wood pellets. We expect the production capacity of the Sampson plant to increase to 600,000 MTPY during 2020.
Production from the Sampson plant is transported by truck to our Wilmington terminal.
Southampton
We acquired a wood pellet production plant in Southampton County, Virginia (the “Southampton plant”) from our sponsor’s first development joint venture in December 2015. The Southampton plant is a build-and-copy replica of our Northampton plant and currently produces 545,000 MTPY of wood pellets. We are currently engaged in an expansion project to increase the production capacity of the Southampton plant to 745,000 MTPY of wood pellets. We expect to commence the production ramp for the Southampton plant expansion in the third quarter of 2020.
Production from the Southampton plant is transported by truck to our Chesapeake terminal.
Gulf Coast Region Plants
The following table describes our wood pellet production plants in the Gulf Coast region:
Plant Location | Acquisition Year | Production (MTPY) | |||
Cottondale, Florida | 2015 | 760,000 | |||
Amory, Mississippi | 2010 | 120,000 | |||
Total | 880,000 | ||||
Cottondale
Our sponsor acquired a wood pellet production plant in Cottondale, Florida (the “Cottondale plant”) in January 2015 and contributed it to us in April 2015. Following the acquisition of the Cottondale plant from our sponsor, the Cottondale plant has undergone several expansions and process improvements. Expansion projects since 2016 increased its production capacity from 720,000 MTPY to 760,000 MTPY of wood pellets.
Wood pellets produced by the Cottondale plant are transported approximately 50 miles by short-line rail to a warehouse that currently can store up to 32,000 metric tons (“MT”) of wood pellet inventory at the Panama City terminal.
Amory
We purchased a wood pellet production plant in Amory, Mississippi (the “Amory plant”) in August 2010. The Amory plant initially consisted of three pellet mills producing wood pellets at a rate of 41,500 MTPY. Through operational improvements and installation of a fourth pellet mill, the Amory plant currently produces 120,000 MTPY of wood pellets.
Production from the Amory plant is transported by barge to the Mobile terminal.
Wood Fiber Procurement and Sustainability
Our fleet of production plants is sited in robust fiber baskets in the Southeast United States that sustainably support our growth operations with low-grade fiber. Our sites minimize wood fiber procurement and logistics costs, which provides a structural cost of goods advantage over many other fiber baskets around the world. Although “stumpage,” the industry term for the amount of consideration paid for fiber, constitutes a small portion of our total cost of delivered products, wood fiber procurement is a vital function of our business and cost-effective access to wood fiber is an important factor in our pricing stability.
Wood fiber is a unique energy commodity in that, in resource basins like the Southern United States where we operate, more wood fiber grows each year than is harvested, meaning that the commodity is a negative depletion resource. Over the period from 1953 to 2015, the amount of timberland acreage in the U.S. South remained stable; however, during this same period wood fiber inventory stored in Southern forests increased by 108%. From 2000 to 2016, total wood fiber volume grew by approximately 39.1 billion cubic feet and total wood fiber drain was approximately 29.2 billion cubic feet in the four primary areas from which we source our wood fiber. As a result, net fiber volume grew by approximately 9.9 billion cubic feet, an increase of 24%. Between 2011,
6
the year in which we opened our first wood pellet production plant, and 2018, forest inventory in our overall supply base increased by more than 270 million metric tons, or 14%.
Because wood fiber is approximately 50% water at the time of harvest, it has a limited economically efficient distribution radius of roughly 75 miles. The combination of consistent excess supply over demand for a commodity that is not cost-effective to transport to new demand regions means that this stranded natural resource experiences structurally stable long-term pricing: during the period from 2000 to 2018, the delivered cost of fiber in North Carolina, one of our primary sourcing areas, increased at a modest 1.6% compound annual growth rate with limited annual volatility.
We and our customers are subject to stringent requirements regarding the sustainability of the fuels they procure. In addition to our internal sustainability policies and initiatives like our Responsible Sourcing Policy, our wood fiber procurement is conducted in accordance with leading forest certification standards. Our fiber supply chains are routinely audited by independent third parties. We maintain multiple forest certifications including: Forest Stewardship Council (FSC®) Chain of Custody, FSC® Controlled Wood, Programme for the Endorsement of Forest Certification (PEFC™) Chain of Custody, Sustainable Forestry Initiative (SFI®) Fiber Sourcing and SFI® Chain of Custody. We have obtained independent third-party certification for all of our plants to the applicable Sustainable Biomass Program (SBP) Standards.
Our wood fiber demand is complementary to, rather than in competition with, demand for high-grade wood for use by most other forest-related industries, such as lumber and furniture making. For example, improvements in the U.S. housing construction industry typically increase the demand for construction-quality lumber, which in turn increases the available supply of the low-cost pulpwood and mill residues that we use in wood pellet production. By using commercial thinnings and byproducts as raw materials, wood pellet production also indirectly supports other forest-related industries as well as the sustainable management of commercial forests.
We make wood pellets only with low-grade or leftover wood. On average, we receive approximately 31% of the volume of wood from an individual harvest and we estimate that we contribute approximately 10-15% of the economic value of an individual harvest. Our sponsor has created a first-of-its kind, proprietary Track and Trace® program to track the origin and characteristics of fiber that we use, and we publish this information, providing unprecedented transparency into our fiber sourcing activities.
The wood fiber used for wood pellet production predominantly is comprised of:
• | low-grade wood fiber: trees or wood that are unsuitable for or rejected by the sawmilling and lumber industries because of small size, defects (e.g. crooked or knotty), disease, or pest infestation; |
• | tops and limbs: the parts of trees that cannot be processed into lumber; |
• | commercial thinnings: harvests that promote the growth of higher value timber by removing weaker or deformed trees to reduce competition for water, nutrients, and sunlight; and |
• | mill residues: chips, sawdust and other wood industry byproducts. |
Demand for the non-merchantable fiber, waste products or byproducts that we use is generally low because they have few competing uses, in part because they cannot be transported cost-effectively. The tops, limbs and other low-grade wood fiber we purchase would otherwise generally be left on the forest floor, impeding reforestation, or burned. Wood pellet production provides a profitable use for the residues from sawmill and furniture industries and also for the trees that are thinned to support the growth of higher-value lumber-grade trees. U.S. demand for such low-grade wood fiber historically emerged from the pulp and paper industry. However, due to the decline in demand from paper and pulp, many landowners lack commercial markets for this wood fiber. Wood pellet producers help fill the gap.
As a result of the fragmented nature of tract ownership, we procure raw materials from hundreds of landowners, loggers, and timber industry participants, with no individual landowner representing a material fraction of any of our plants’ needs. Our wood fiber is procured under a variety of arrangements, including (1) logging contracts for the thinnings, pulpwood and other unmerchandised low-grade fiber, (2) in-woods chipping contracts where we may also provide the harvesting equipment and (3) contracts with timber dealers. Via our sponsor’s proprietary Track & Trace® system, we maintain traceability of the primary wood that is delivered to us directly from forests. Any supplier delivering wood to one of our plants must first share the details about the forest characteristics of the tract from which the wood is sourced with our forestry staff so we can verify that it meets our strict sustainability criteria. Our supplier contracts require a certification that the relevant tract information has been entered into our database before wood may be delivered directly from a particular tract. We summarize all such tract information periodically and publish tract-level details on our website. During 2019, we sourced wood fiber from approximately 310 suppliers, including brokers who source from landowners growing both hardwoods and softwoods and other suppliers. The diversity of our supply base and our facilities’ advantaged siting enables us to benefit from more reliable deliveries, at a lower cost, than others in our region or industry.
7
Plant Operations
Our plants receive wood fiber in both stem-length and chip form. When this raw material is delivered by truck from our suppliers, it is scaled for weight, checked for quality, and recorded consistent with our Track & Trace® system and Responsible Sourcing Policy requirements at the scale house at each of our plants. Each truck is then unloaded in a particular location in each respective plant’s woodyard based on the form and species (generally hardwood or softwood) of the raw material. Stem-length wood is stacked by radial or portal cranes and chips are piled, typically through automated conveyors to be reclaimed later for use. Stem-length wood is debarked prior to processing, providing fuel for each plant’s drying systems.
Following debarking, stem-length wood is size-reduced through a disc chipper, the chip product from which is co-mingled with delivered chips. The production process begins by mixing a specific formula of species and form factors of chips and metering them into a set of green hammer mills, which perform primary sizing. At this point, most of the wood fiber is between 45% and 55% moisture. The now-smaller chips are fed into a green chip bin and metered into a rotary kiln drier, where drying heat is provided by a biomass and bark-fueled furnace. The drying operation reduces moisture content to between 15% and 20%. Dried chips are fed from the drier to the secondary sizing process island, which comprises a combination of screening and dry-hammermilling to further size reduce the chips. The secondary sizing operation further reduces wood fiber moisture content to between 6% and 13%. This dry, further size-reduced flour or meal is stored in a dry storage silo and conveyed to ripening bins which further homogenize moisture prior to pelletizing. To the extent sawdust or other residuals are available, it is also size-reduced and combined with the processed wood fiber at this point in the process. The meal is metered into a series of pellet mills where hydraulic pressure extrudes the fiber into wood pellets. The pressure and temperature of the pelleting process activate natural lignin present in the wood which acts as a natural binder and finishes the pellet with a shiny exterior. The pellets are gravity fed into large coolers which utilize counter-current air flow to reduce pellet temperature and moisture. Once cool, the pellets, now approximately 5-7% moisture, are screened to reduce entrained dust and then conveyed to finished goods silos prior to being loaded onto trucks, railcars or barges depending upon the facility.
Our larger plants are staffed by approximately 85-90 employees including operators, maintenance technicians, quality leads and area, shift and operations supervisors. Plants operate two shifts per day, and the employees are spread across four teams alternating three days on, two days off, two days on and three days off with a rotation between day shift and night shift periodically. Plant management consists of a plant manager, operations manager, maintenance manager, quality manager, human capital manager and a safety manager, complemented by wood procurement, sustainability, accounting and engineering personnel.
Maintenance activities at the plant include planned and preventive maintenance as well as refurbishment of tools, dies, screens and hammers for key process equipment. The plants receive power from local utilities, have minimal process water requirements and limited exposure to fossil fuel volatility. The furnace burns wood in the form of bark and fuel chips as the source of heat for the dryer to evaporate moisture. Natural gas or propane is used as the energy source for emissions control equipment onsite like regenerative thermal oxidizers and a small amount of diesel is used in mobile equipment on each site. Very little waste besides office refuse leaves the plant as the by-product ash from the furnace operations is usually desirable as a fertilizer and is land-applied by local farmers.
To-Port Logistics and Port Infrastructure
Each of our plants is located near multiple truck, rail, river and ocean transportation access points. We also have inland waterway access and rail access at the Chesapeake, Wilmington and Panama City terminals. Our multi-year fixed-cost contracts with third-party logistics providers allow for long-term visibility into our to-port logistics cost structure.
The wood pellets produced at our plants are stored, terminaled, and shipped to our customers, principally in the U.K., Europe and increasingly in Japan. Limited deep-water, dry-bulk terminaling assets exist in the Southeastern United States, and very few of them have the appropriate handling and storage infrastructure necessary for receiving, storing and loading wood pellets. In response to such scarcity, we have vertically integrated our Mid-Atlantic operations downstream to encompass finished product logistics and storage. As a largely fixed cost and capital intensive piece of the value chain, we believe our port infrastructure allows us to ship incremental product from our regional plants at a fraction of the cost of our competitors. Management of port terminal infrastructure is also a key element in reducing distribution-related costs as it allows us to manage the arrival and loading of vessels. Additionally, we are able to improve our cost position by maintaining a dedicated berth where pellets from our Mid-Atlantic region plants have priority and equipment with sufficient load-rate capabilities to turn around vessels within the allotted time windows.
In addition to terminaling wood pellets from our production plants, we will, on occasion, provide terminaling services for third- and related-party wood pellet producers as well as for owners of other dry-bulk commodities.
8
Port Operation in the Mid-Atlantic Region
We acquired the Chesapeake terminal in January 2011 and converted it into a dry-bulk terminal. The Chesapeake terminal receives, stores and loads wood pellets for export and serves as the shipment point for products produced at our Ahoskie, Northampton and Southampton plants. The Chesapeake terminal accommodates Handysize, Supramax and Panamax-sized vessels, and has a 200-car rail yard adjacent to a Norfolk Southern track, a loading/unloading system that accommodates deliveries by truck, rail and barge and a highly automated conveying system. In May 2011, we erected a 157-foot tall, 175-foot wide storage dome that receives, stores and loads up to 45,000 MT of wood pellets. In April 2013, we placed into operation a second storage dome at the site to add an additional 45,000 MT of storage.
The Chesapeake terminal’s storage and loading capacity is more than adequate to store and facilitate the loading of the wood pellets produced at our Ahoskie, Northampton and Southampton plants, and its location decreases our customers’ transportation time and costs. Efficiently positioned near our Ahoskie, Northampton and Southampton plants, the Chesapeake terminal delivers up to a three- to four-day European shipping advantage compared to other Southern or Gulf Coast ports. In addition, because we own the Chesapeake terminal, we enjoy preferential berth access and loading, which minimizes costs of shipping and logistics without the need for excess storage. Our ownership and operation of this terminal enable us to control shipment of the production of our Mid-Atlantic region plants that it serves.
Wood pellets produced at our Sampson and Hamlet plants, and the Greenwood plant, are terminaled at our Wilmington terminal. The Wilmington terminal accommodates Handysize, Supramax and Panamax-sized vessels, and has a receiving system that accommodates deliveries by truck and rail, a highly automated conveying system and two wood pellet storage domes with capacities of 45,000 MT each. The Wilmington terminal’s storage and loading capacity is more than adequate to store and facilitate the loading of wood pellets produced at our Sampson and Hamlet plants and the Greenwood plant and its location decreases transportation time and costs through the entire supply chain. We benefit from preferential berth access and loading at our Wilmington terminal, which minimizes costs of shipping and logistics without need for excess storage.
Port Operation in the Gulf Coast Region
Wood pellets from our Cottondale plant are transported via short‑line rail to the Panama City terminal, where we store up to 32,000 MT of wood pellet inventory in a warehouse at Port Panama City. Production from the Cottondale plant is received, stored and loaded under a long‑term terminal services agreement with the Panama City Port Authority and a stevedoring contract, each of which runs through September 2023 and may be extended by us for an additional five-year period.
Wood pellets produced at our Amory plant are transported by barge to the Mobile terminal, where, pursuant to a services agreement with Cooper Marine & Timberlands (“Cooper”), we export from Cooper’s ChipCo terminal. This privately owned and maintained deep-water, multi-berth terminal operates 24 hours per day, seven days per week and is the fleeting and loading point for production from our Amory plant. The Amory plant is sited along a major inland waterway that makes transportation to the Mobile terminal easy and efficient, thereby reducing emissions and costs. Our ability to store our wood pellets in barges provides a capital-light, flexible solution that accommodates the storage needs of the Amory plant.
Please read Part II, Item 7. “Management’s Discussion and Analysis of Financial Condition and Results of Operations—Recent Developments” for more information regarding our plants, terminals and other long‑lived assets.
Our Contracts
We refer to the structure of our long-term sales contracts as “take-or-pay” because they include a firm obligation of the customer to take a fixed quantity of product at a stated price and provisions for us to be compensated in the event of a customer’s failure to accept all or a part of the contracted volumes or for termination of a contract by a customer. Our long-term sales contracts typically provide for annual inflation-based adjustments or price escalators. Certain of our long-term sales contracts also contain provisions that allow us to increase or decrease the volume of product that we deliver by a percentage of the base annual volume, as well as cost pass-through mechanisms related to stumpage, fuel, or transportation costs (including pricing fluctuations in bunker fuel) and price adjustments based on actual product specifications. In addition, many of our long-term sales contracts provide for cost recovery and sharing arrangements in connection with certain changes in law or sustainability requirements as well as payments to us in the case of their termination as a result of such changes. In order to mitigate volatility in our shipping costs, we have entered into fixed-price shipping contracts with reputable shippers to form a shipping portfolio matching the terms and volumes of our sales contracts for which we are responsible for arranging shipping.
We also have entered into several other contracts that have smaller off-take quantities than the contracts described above. We diversified our customer base during 2019; however, our four largest customers accounted for 94% of our product sales in 2019.
9
In some cases, we may purchase shipments of product from third-party suppliers and resell them in back-to-back transactions. We determined that we are the principal in such transactions because we control the pellets prior to transferring them to the customer and therefore we recognize the related revenue on a gross basis in product sales.
In some instances, a customer may request to cancel, defer or accelerate a shipment, in which case we seek to optimize our position by selling or purchasing the subject shipment to or from another party, including in some cases a related party, either within our contracted off‑take portfolio or as an independent transaction on the spot market. In most instances, the original customer pays us a fee, including reimbursement of any incremental costs, which is included in other revenue. Other revenue also includes certain sales and marketing, scheduling, sustainability, consultation, shipping and risk management services (collectively, the “Commercial Services”) that are outside of the scope of an existing take-or-pay off-take contract.
We also provide terminaling services for third- and related-party wood pellet producers as well as for owners of other dry-bulk commodities.
The following chart presents information relating to our, our sponsor’s and the Sponsor JV’s long-term, take-or-pay off-take contracts:
____________________________________________
(1) | Includes base annual delivery quantity and excludes the impact of the Partnership, our sponsor and the Sponsor JV’s option to increase or decrease the annual delivery quantity under the associated off-take contracts. |
(2) | As of February 1, 2020, includes all volumes under the firm and contingent off-take contracts held by the Partnership, our sponsor and the Sponsor JV. Although we expect to have the opportunity to acquire these contracts from our sponsor and the Sponsor JV, there can be no guarantee that we will acquire these, or any, contracts from our sponsor or the Sponsor JV. |
With our existing long-term, take-or-pay off-take contracts, all of the current production capacity of our production plants is fully contracted. As our current off-take contracts expire, we will seek to re-contract our capacity with a combination of renewals with existing customers, the assumption of additional contracts from our sponsor and the entry into contracts with new customers.
Contracted backlog
As of February 1, 2020, we had approximately $10.6 billion of product sales backlog for firm and contingent contracted product sales to our long-term off-take customers with a total weighted-average remaining term of 11.4 years. Contracted backlog represents the revenue to be recognized under existing contracts assuming deliveries occur as specified in the contracts. Contracted future product sales denominated in foreign currencies, excluding revenue hedged with foreign currency forward contracts, are included in
10
U.S. Dollars at February 1, 2020 forward rates. The contracted backlog includes forward prices including inflation, foreign currency and commodity prices. The amount also includes the effects of related foreign currency derivative contracts.
Our expected future product sales revenue under our contracted backlog as of February 1, 2020 is as follows (in millions):
Period from February 1, 2020 to December 31, 2020 | $ | 782 | |
Year ending December 31, 2021 | 1,043 | ||
Year ending December 31, 2022 and thereafter | 8,751 | ||
Total product sales contracted backlog | $ | 10,576 | |
Assuming all volumes under the firm and contingent off-take contracts held by our sponsor and its joint ventures were included with our product sales backlog for firm and contingent contracted product sales, the total weighted-average remaining term as of February 1, 2020 would increase to 13.8 years and product sales contracted backlog would increase to $19.6 billion as follows (in millions):
Period from February 1, 2020 to December 31, 2020 | $ | 782 | |
Year ending December 31, 2021 | 1,086 | ||
Year ending December 31, 2022 and thereafter | 17,699 | ||
Total product sales contracted backlog | $ | 19,567 | |
Included in the product sales contracted backlog above are $1.3 billion and $3.9 billion of contingent contracts held by the Partnership, our sponsor and the Sponsor JV, respectively.
Industry Overview
Our product, utility-grade wood pellets, is used as a substitute for coal in both dedicated and co-fired power generation and combined heat and power plants. It enables major power, heat or combined heat and power generators (“generators”) to profitably generate electricity and heat in a manner that reduces the overall cost of compliance with certain mandatory greenhouse gas (“GHG”) emissions limits and renewable energy targets while also allowing countries to diversify their sources of electricity supply.
Unlike intermittent sources of renewable generation like wind and solar power, wood pellet-fired plants are capable of meeting baseload electricity demand and are dispatchable (that is, power output can be switched on or off or adjusted based on demand). As a result, utilities and major generators in Europe, Asia and other areas have made and continue to make long-term, profitable investments in power plant conversions and new builds of generating assets that either co-fire wood pellets with coal or are fully dedicated wood pellet-fired plants. Such developments help generators maintain and increase baseload generating capacity and comply with binding climate change regulations and other emissions reduction targets.
The capital costs required to convert a coal plant to co-fire biomass, or to burn biomass exclusively, are a fraction of the capital costs associated with implementing offshore wind and most other renewable technologies. Furthermore, the relatively quick process of converting coal-fired plants to biomass-fired generation can be an attractive benefit for generators whose generation assets are no longer viable as coal plants due to the expiration of operating permits, regulatory phase-out of coal-fired power generation, the introduction of taxes or other restrictions on fossil fuel usage or emissions of GHGs and other pollutants.
There also continues to be significant growth in the European and Asian demand for wood pellets as a preferred fuel source and renewable alternative to fossil fuels for district heating loops, for heating homes and commercial buildings and for the production of process heat for industrial sites. Increasingly, wood pellets are also being sought as a raw material input for bio-based substitutes for traditional fossil fuel-based fuels and chemicals. As these markets further develop, we believe we will continue to have opportunities to serve this growing material demand beyond our current product sales backlog.
Competition
We compete with other utility-grade wood pellet producers for long-term, take-or-pay off-take contracts with major power generation customers and trading houses. Competition in our industry is based on the price, quality and consistency of the wood pellets produced, the reliability of wood pellet deliveries and the producer’s ability to verify and document, through customer and third-party audits, that its wood pellets meet the regulatory sustainability obligations of a particular customer.
11
Most of the world’s current wood pellet production plants are owned by small, private companies, with few companies owning or operating multiple plants. Few companies have the scale, technical expertise or commercial infrastructure necessary to supply utility-grade wood pellets under large, long-term off-take contracts with generators.
We are the largest producer by production capacity, and consider other companies with comparable scale, technical expertise or commercial infrastructure to be our competitors, including AS Graanul Invest, Pinnacle Renewable Energy Inc., Drax Biomass Inc., Georgia Biomass, LLC, Fram Renewable Fuels, LLC, Highland Pellets LLC and Pacific BioEnergy Corporation.
Our Relationship with Our Sponsor
The Riverstone Funds became the majority owners of our sponsor in March 2010.
We entered into a purchase rights agreement with our sponsor pursuant to which our sponsor agreed to provide us with a right of first offer to purchase any wood pellet production plant or deep‑water marine terminal that it, its subsidiaries or any other entity that it controls (including its joint venture with John Hancock (the “Sponsor JV”)) owns and proposes to sell (each, a “ROFO Asset”) for a five-year period. Pursuant to an amendment, the term of the purchase rights agreement was extended to May 2021 and will automatically renew on an annual basis unless either party provides notice of termination within 60 days prior to the end of the then-current term.
We will have 30 days following receipt of notice of our sponsor entity’s intention to sell a ROFO Asset to propose an offer for the ROFO Asset. If we submit an offer, our sponsor will negotiate with us exclusively and in good faith to enter into a letter of intent or definitive documentation for the purchase of the ROFO Asset on mutually acceptable terms. If we are unable to agree to terms within 45 days, our sponsor entity will have 150 days to enter into definitive documentation with a third party purchaser on terms that are, in the good faith judgment of our sponsor entity selling such ROFO Assets, superior to the most recent offer proposed by us.
We expect to continue to pursue the acquisition of such assets from our sponsor and the Sponsor JV to the extent they are supported by long-term off-take contracts with creditworthy counterparties and have long useful lives, stable cost positions and advantaged locations.
Our sponsor owns approximately 40% of our common units and 100% of our General Partner. Our General Partner owns all of our incentive distribution rights, which entitle our General Partner to increasing percentages of our cash distributions above certain targets. As a result, our sponsor is incentivized to facilitate our access to accretive acquisition and organic growth opportunities, including those pursuant to the purchase rights agreement.
The Sponsor JV is developing and constructing certain wood pellet production and terminaling assets in the Southeastern United States. Our sponsor is the managing member of the Sponsor JV and Enviva Management is the operator of the Sponsor JV and is responsible for managing its activities, including the development and construction of its development projects.
Although we expect to continue to have the opportunity to acquire assets, including from our sponsor and the Sponsor JV, our sponsor and the Sponsor JV may not complete their development projects, and our sponsor may not decide to sell, or compel the Sponsor JV to sell, assets or completed development projects to us.
Our Sponsor’s Assets and Development Projects
Greenwood Plant
The Sponsor JV acquired the wood pellet production plant located in Greenwood, South Carolina (the “Greenwood plant”) as its first investment. Our sponsor intends to invest incremental capital in the Greenwood plant to significantly expand production capacity to 600,000 MTPY of wood pellets, subject to receiving the necessary permits.
In February 2018, we entered into a contract with Enviva Pellets Greenwood, LLC (“Greenwood”) to purchase wood pellets produced by the Greenwood plant through March 2022 and have a take-or-pay obligation beginning in 2021 with respect to 550,000 MTPY of wood pellets (prorated for partial contract years), subject to Greenwood’s option to increase or decrease the volume by 10% each contract year. Wood pellets produced at the Greenwood plant are exported from our Wilmington terminal.
Other Sponsor Development Projects
The Sponsor JV is also constructing a wood pellet production plant in Lucedale, Mississippi (the “Lucedale plant”) as well as a deep-water marine terminal in Pascagoula, Mississippi (the “Pascagoula terminal”). In addition, our sponsor is developing a wood pellet production plant in Epes, Alabama (the “Epes plant”) along with other sites in Mississippi and Alabama. Our sponsor employs a “build and copy” approach to constructing production plants and terminals, allowing synergies of common processes and
12
operational knowledge. We expect to have the opportunity to acquire assets and off-take contracts from our sponsor and the Sponsor JV.
Environmental Matters
Our operations are subject to stringent and comprehensive federal, state and local laws and regulations governing matters including protection of the environment and natural resources, occupational health and safety and the release or discharge of materials into the environment, including air emissions and wastewater discharges. These laws and regulations may (1) require acquisition, compliance with and maintenance of certain permits or other approvals to conduct regulated activities, (2) impose technology requirements or standards on our operations, (3) restrict the amounts and types of substances that may be discharged or emitted into the environment, (4) limit or prohibit construction or timbering activities in sensitive areas such as wetlands or areas inhabited by endangered or threatened species, (5) govern worker health and safety aspects of operations, (6) require measures to investigate, mitigate or remediate releases of hazardous or other substances from our operations and (7) impose substantial liabilities, including possible fines and penalties, for unpermitted emissions or discharges from our operations. Failure to comply with these laws and regulations may result in the assessment of administrative, civil and criminal penalties, the imposition of investigatory and remedial obligations and the issuance of orders enjoining some or all of our operations in affected areas.
Moreover, the global trend in environmental regulation is towards increasingly broad and stringent requirements for activities that may affect the environment. Any changes in environmental laws and regulations or re‑interpretation of enforcement policies that result in more stringent and costly requirements could have a material adverse effect on our operations and financial position. Although we monitor environmental requirements closely and budget for the expected costs, actual future expenditures may be different from the amounts we currently anticipate spending. Moreover, certain environmental laws impose strict joint and several liability for costs to clean up and restore sites where pollutants have been disposed or otherwise spilled or released. We cannot assure that we will not incur significant costs and liabilities for remediation or damage to property, natural resources or persons as a result of spills or releases from our operations or those of a third party. Although we believe that our competitors face similar environmental requirements, market factors may prevent us from passing on any increased costs to our customers. Additionally, although we believe that continued compliance with existing requirements will not materially adversely affect us, there is no assurance that the current levels of regulation will continue in the future.
The following summarizes some of the more significant existing environmental, health and safety laws and regulations applicable to our operations, the failure to comply with which could have a material adverse impact on our capital expenditures, results of operations and financial position.
Air Emissions
The federal Clean Air Act, as amended (the “CAA”), and state and local laws and regulations that implement and add to CAA requirements, regulate the emission of air pollutants from our facilities. The CAA and state and local laws and regulations impose significant monitoring, testing, recordkeeping and reporting requirements for these emissions. These laws and regulations require us to obtain pre-approval for the construction or modification of certain projects or facilities expected to produce or significantly increase air emissions, obtain and strictly comply with stringent air permit emission limits, and in certain cases utilize specific equipment or technologies to control and measure emissions. Obtaining these permits can be both costly and time intensive and has potential to delay opening of new plants or significant expansion of existing plants; moreover, complying with these permits, including satisfying testing requirements, can also be costly and time-intensive. Failure to comply with these laws, regulations and permit requirements may cause us to face fines, penalties or injunctive orders in connection with air pollutant emissions from our operations.
The CAA requires that we obtain various construction and operating permits, including, in some cases, Title V air permits. In certain cases, the CAA requires us to incur capital expenditures to install air pollution control devices at our facilities. We are also required to control fugitive emissions from our operations and may face fines, penalties or injunctive orders in connection with fugitive emissions from our operations. We have incurred, and expect to continue to incur, substantial administrative, operating and capital expenditures to maintain compliance with CAA requirements that have been promulgated or may be promulgated or revised in the future.
Climate Change and Greenhouse Gases
Our operations are subject to limited direct regulation with respect to emissions of GHGs. For example, at this time, the U.S. Environmental Protection Agency (the “EPA”) requires certain large facilities to undergo CAA pre-construction review and obtain operating permits for their GHG emissions. Our operations are also indirectly affected by regulations regarding the carbon treatment of biomass. While several jurisdictions to which we ship our products treat biomass as a carbon-neutral fuel, certain environmental groups have criticized this determination and are attempting to have it changed. For example, lawsuits have been filed in the European Union (the “EU”) challenging the sufficiency of the Renewable Energy Directive II (“RED II”) in addressing climate
13
concerns, including challenging the treatment of biomass. Similar lawsuits have been brought against the European Investment Bank (the “EIB”) for financing the construction of biomass-fired power plants. A change in the characterization of biomass could negatively impact demand for our products. Finally, scientists have concluded that increasing concentrations of GHGs in the earth’s atmosphere may produce climate changes that have significant physical effects, such as increased frequency and severity of storms, floods and other climatic events, including forest fires. If any such effects were to occur, they could have an adverse effect on our operations.
Water Discharges
The Federal Water Pollution Control Act, as amended (the “Clean Water Act”), as well as state laws and regulations that implement, and may be more stringent than, the Clean Water Act, restrict the discharge of pollutants into waters of the United States. Any such discharge of pollutants must be performed in accordance with the terms of a permit issued by the EPA or the implementing state agency. In addition, the Clean Water Act and implementing state laws and regulations require individual permits or coverage under general permits for discharges of storm water runoff from certain types of facilities. Federal and state regulatory agencies can impose administrative, civil and criminal penalties for non‑compliance with discharge permits or other requirements of the Clean Water Act and analogous state laws and regulations. These permits generally have a term of five years. Certain of our facilities hold such discharge permits. Changes to the terms and conditions of our permits in future renewals or new or modified regulations could require us to incur additional capital or operating expenditures, which may be material.
Pursuant to the Clean Water Act, the EPA has adopted the Discharge of Oil regulation, which requires any person in charge of an onshore facility to report any discharge of a harmful quantity of oil into U.S. navigable waters, adjoining shorelines or the contiguous zone. A harmful quantity is any quantity of discharged oil that violates state water quality standards, causes a film or sheen on the water’s surface or leaves sludge or emulsion beneath the surface. Spills from our production plants that are located along waterways or from our deep-water marine terminal facilities may result in fines, penalties and obligations to respond to and remediate any such spills. We could also be liable for removal and remediation costs, as well as damages to natural resources, in the event of an unauthorized discharge of oil from one of our facilities.
Spill Response and Release Reporting
Certain of our facilities are subject to federal requirements to prepare for and respond to spills or releases from tanks and other equipment located at these facilities and provide training to employees on operation, maintenance and discharge prevention procedures and the applicable pollution control laws. At such facilities, we have developed or will develop Spill Prevention, Control and Countermeasure plans to memorialize our preparation and response plans and will update them on a regular basis. From time to time, these requirements may be made more stringent and may require us to modify our operations or expand our plans accordingly. The costs of implementing any such modifications or expansion may be significant. In addition, in the event of a spill or release, we may incur fines or penalties or incur responsibility for damage to natural resources, private property or personal injury in addition to obligations to respond to and remediate any such spill or release.
Endangered Species Act
The federal Endangered Species Act, as amended (the “ESA”), restricts activities that may affect endangered and threatened species or their habitats. Although some of our facilities may be located in areas that are designated as habitats for endangered or threatened species, this has not so far had a material adverse impact on our business. Some of our suppliers may source materials from locations that provide habitats for species that are protected under the ESA, which may extend the time required to access those areas, or may impose conditions or restrictions on accessing those areas in a way that restricts our ability to obtain raw materials for our wood pellet production plants. Moreover, as a result of a settlement approved by the U.S. District Court for the District of Columbia on September 9, 2011, the U.S. Fish and Wildlife Service is required to make a determination regarding the listing of more than 250 species by the end of the agency’s 2017 fiscal year. While the agency did not complete its review by the deadline, that process reportedly remains underway. The designation of previously unidentified endangered or threatened species could cause us to incur additional costs or become subject to operating restrictions or bans in the affected areas, which could have an adverse impact on the availability or price of raw materials.
Coastal Area Protection and Wetlands and Navigable Waters Activity Regulations
Our terminals are located in areas that are subject to the various federal and state programs that regulate the conservation and development of coastal resources. At the federal level, the Coastal Zone Management Act (the “CZMA”) was enacted to preserve, protect, develop and, where possible, restore or enhance valuable natural coastal resources of the U.S. coastal zone. The CZMA authorizes and provides grants for state management programs to regulate land and water use and coastal development. Requirements under the CZMA may affect the siting of any new terminals and could impact the expansion of modification of existing terminal facilities. The CZMA process may result either in delays in obtaining the required authorizations to construct a new terminal or expand an existing terminal or conditions that may restrict the construction or operation of our terminals.
14
In addition to the CZMA, requirements under the Clean Water Act and related federal laws may result in federal or state regulators imposing conditions or restrictions on our operations or construction activities. For instance, the dredge and fill provisions of the Clean Water Act require a permit to conduct construction activities in protected waters and wetlands and prohibit unpermitted discharges of fill materials. Likewise, the Rivers and Harbors Act requires permits for the construction of certain port structures. Although compliance has not previously had a material adverse impact on our business, any delays in obtaining future permits or renewals, or the inclusion of restrictive conditions in such permits, could adversely affect the cost of, or result in delays to, our operations and the construction of new, or expansion of existing, terminals.
Safety and Maintenance
We are subject to a number of federal and state laws and regulations, including the federal Occupational Safety and Health Act, as amended (“OSHA”), and comparable state statutes, whose purpose is to protect the health and safety of workers. We have a corporate health and safety program that governs the way we conduct our operations at our facilities. Our employees receive OSHA training that is appropriate and tailored to the tasks performed at our facilities and general training on our health and safety plans. Compliance with OSHA and general training is mandatory. We perform preventive and routine maintenance on all of our manufacturing and deep-water marine terminaling systems and make repairs and replacements when necessary or appropriate. We also conduct routine and required inspections of those assets in accordance with applicable regulations. In addition, the OSHA hazard communication standards in the Emergency Planning and Community Right-to-Know Act and comparable state statutes require that information be maintained concerning hazardous materials used or produced in our operations and that this information be provided to employees, state and local governmental authorities and citizens. Our facilities adhere to National Fire Protection Association (NFPA) standards for combustible dust and incorporate pollution control equipment such as cyclones, baghouses and electrostatic precipitators to minimize regulated emissions. Our deep-water marine terminals adhere to Homeland Security/U.S. Coast Guard regulations regarding physical security and emergency response plans. We continually strive to maintain compliance with applicable air, solid waste and wastewater regulations; nevertheless, we cannot guarantee that serious accidents will not occur in the future.
Seasonality
Our business is affected by seasonal fluctuations. The cost of producing wood pellets tends to be higher in the winter months because of increases in the cost of delivered raw materials, primarily due to a reduction in accessibility during cold and wet weather conditions. Our raw materials typically have higher moisture content during this period, resulting in a lower product yield; moreover, the cost of drying wood fiber increases during periods of lower ambient temperatures.
The increase in demand for power and heat during the winter months drives greater customer demand for wood pellets. As some of our wood pellet supply to our customers is sourced from third-party purchases, we may experience higher wood pellet costs and a reduction in our gross margin during the winter months.
Employees
We are party to management services agreements (the “MSAs”) with Enviva Management, pursuant to which Enviva Management provides us with the employees, management and services necessary for the operation of our business. As of December 31, 2019, Enviva Management had 1,039 employees. Please read Part II, Item 13. “Certain Relationships and Related Transactions, and Director Independence—Other Transactions with Related Persons--Management Services Agreement” for more information regarding our MSA with Enviva Management.
Principal Executive Offices
We lease office space for our principal executive offices at 7200 Wisconsin Avenue, Suite 1000, Bethesda, Maryland 20814. The lease expires in June 2024.
Available Information
We file annual, quarterly and current reports and other documents with the SEC under the Securities Exchange Act of 1934, as amended (the “Exchange Act”). The SEC maintains a website at www.sec.gov that contains reports and other information regarding issuers that file electronically with the SEC.
We also make available free of charge our Annual Reports on Form 10‑K, Quarterly Reports on Form 10-Q, Current Reports on Form 8‑K and any amendments to those reports filed or furnished pursuant to Section 13(a) or 15(d) of the Exchange Act, simultaneously with or as soon as reasonably practicable after filing such materials with, or furnishing such materials to, the SEC and on or through our website, www.envivabiomass.com. The information on our website, or information about us on any other website, is not incorporated by reference into this Annual Report.
15
ITEM 1A. | RISK FACTORS |
There are many factors that could have a material adverse effect on our business, financial condition, results of operations and cash available for distribution. New risks may emerge at any time and we cannot predict those risks or estimate the extent to which they may affect financial performance. Each of the risks described below could adversely impact the value of our common units.
Risks Inherent in Our Business
We may not have sufficient cash from operations following the establishment of cash reserves and payment of costs and expenses, including cost reimbursements to our General Partner and its affiliates, to enable us to pay quarterly distributions to our unitholders at our current distribution rate.
We may not have sufficient cash each quarter to enable us to pay quarterly distributions at our current distribution rate. The amount of cash we can distribute on our common units principally depends upon the amount of cash we generate from our operations, which fluctuates from quarter to quarter based on the following factors, some of which are beyond our control:
• | the volume and quality of products that we are able to produce or source and sell, which could be adversely affected by, among other things, operating or technical difficulties at our wood pellet production plants or deep-water marine terminals; |
• | the prices at which we are able to sell our products; |
• | our ability to successfully negotiate, complete and integrate drop-down or third-party acquisitions, including the associated contracts, or to realize the anticipated benefits of such acquisitions; |
• | failure of our customers, vendors and shipping partners to pay or perform their contractual obligations to us; |
• | our inability to successfully execute our project development and construction activities, including the expansion of our Northampton and Southampton plants, on time and within budget; |
• | the creditworthiness of our contract counterparties; |
• | the amount of low‑cost wood fiber that we are able to procure and process, which could be adversely affected by, among other things, disruptions in supply or operating or financial difficulties suffered by our suppliers; |
• | changes in the price and availability of natural gas, coal or other sources of energy; |
• | changes in prevailing economic conditions; |
• | unanticipated ground, grade or water conditions; |
• | inclement or hazardous environmental conditions, including extreme precipitation, temperatures and flooding; |
• | fires, explosions or other accidents; |
• | changes in domestic and foreign laws and regulations (or the interpretation thereof) related to renewable or low‑carbon energy, the forestry products industry, the international shipping industry or power, heat or combined heat and power generators; |
• | changes in the regulatory treatment of biomass in core and emerging markets; |
• | our inability to acquire or maintain necessary permits or rights for our production, transportation or terminaling operations; |
• | changes in the price and availability of transportation; |
• | changes in foreign currency exchange or interest rates, and the failure of our hedging arrangements to effectively reduce our exposure to the risks related thereto; |
• | risks related to our indebtedness; |
16
• | our failure to maintain effective quality control systems at our production plants and deep‑water marine terminals, which could lead to the rejection of our products by our customers; |
• | changes in the quality specifications for our products that are required by our customers; |
• | labor disputes; |
• | our inability to hire, train or retain qualified personnel to manage and operate our business and newly acquired assets; |
• | the effects of the exit of the U.K. from the European Union on our and our customers’ businesses; and |
• | our inability to borrow funds and access capital markets. |
In addition, the actual amount of cash we have available for distribution depends on other factors, some of which are beyond our control, including:
• | the level of capital expenditures we make; |
• | fluctuations in our working capital needs; |
• | our treatment as a pass‑through entity for U.S. federal income tax purposes; |
• | our debt service requirements and other liabilities; |
• | restrictions contained in our existing or future debt agreements; and |
• | the amount of cash reserves established by our General Partner. |
The amount of cash we have available for distribution to holders of our units depends primarily on our cash flow and not solely on profitability, which may prevent us from making cash distributions during periods when we record net income.
The amount of cash we have available for distribution depends primarily upon our cash flow, including cash flow from reserves and working capital or other borrowings, and not solely on profitability, which will be affected by non‑cash items. As a result, we may pay cash distributions during periods when we record net losses for financial accounting purposes and may be unable to pay cash distributions during periods when we record net income.
Substantially all of our revenues currently are generated under contracts with five customers, and the loss of any of them could adversely affect our business, financial condition, results of operations, cash flows and ability to pay distributions to our unitholders. We may not be able to renew or obtain new and favorable contracts with these customers when our existing contracts expire, and we may not be able to obtain contracts with new customers, which could adversely affect our revenues and profitability.
Our contracts with Drax, Lynemouth Power, ENGIE, MGT and Ørsted will represent substantially all of our product sales volumes in 2020; as a result, we face counterparty concentration risk. The ability of each of our customers to perform its obligations under a contract with us will depend on a number of factors that are beyond our control and may include the overall financial condition of the counterparty, the counterparty’s access to capital, the condition of the regional and global power, heat and combined heat and power generation industry, continuing regulatory and economic support for wood pellets as a fuel source, spot market pricing trends and general economic conditions. In addition, in depressed market conditions, our customers may no longer need the amount of our products they have contracted for or may be able to obtain comparable products at a lower price. If our customers experience a significant downturn in their business or financial condition, they may attempt to renegotiate, reject or declare force majeure under our contracts. Should any counterparty fail to honor its obligations under a contract with us, we could sustain losses, which could have a material adverse effect on our business, financial condition, results of operations and cash available for distribution. We may also decide to renegotiate our existing contracts on less favorable terms and/or at reduced volumes in order to preserve our relationships with our customers.
Upon the expiration of our off-take contracts, our customers may decide not to recontract on terms as favorable to us as our current contracts, or at all. For example, our current customers may acquire wood pellets from other providers that offer more competitive pricing or logistics or develop their own sources of wood pellets. Some of our customers could also exit their current business or be acquired by other companies that purchase wood pellets from other providers. The demand for wood
17
pellets or their prevailing prices at the times at which our current off‑take contracts expire may also render entry into new long-term-off-take contracts difficult or impossible.
Any reduction in the amount of wood pellets purchased by our customers, renegotiation of our contracts on less favorable terms or our inability to enter into new contracts on economically acceptable terms upon the expiration of our current contracts could have a material adverse effect on our results of operations, business and financial position, as well as our ability to pay distributions to our unitholders.
Termination penalties within our off-take contracts may not fully compensate us for our total economic losses.
Certain of our off-take contracts provide the customer with a right of termination for various events of convenience or changes in law or policy. Although some of these contracts are subject to certain protective termination payments, the termination payments made by our customers may not fully compensate us for losses. We may be unable to re-contract our production at favorable prices or at all, and our results of operations, business and financial position, and our ability to pay distributions to our unitholders, may be materially adversely affected as a result.
Currently, we derive substantially all of our revenues from customers in Europe. If we fail to continue to diversify our customer base geographically within and outside of Europe in the future, our results of operations, business and financial position and ability to pay distributions to our unitholders could be materially adversely affected.
Substantially all of our revenues currently are derived from customers in Europe, and our revenues have been heavily dependent on developments in the European markets. If economic, political, regulatory or financial market conditions in Europe deteriorate, including as a result of weakness in European economies, our customers may respond by suspending, delaying or reducing their expenditures and may attempt to renegotiate, reject or declare force majeure under our contracts. Our failure to continue to successfully penetrate new markets within and outside of Europe in the future could have a material adverse effect on our results of operations, business and financial position, and our ability to pay distributions to our unitholders.
The actions of certain special interest groups could adversely impact our business.
Certain special interest groups that focus on environmental issues have expressed their opposition to the use of biomass, both publicly and directly to domestic and foreign regulators, policy makers, power, heat or combined heat and power generators (“generators”) and other industrial users of biomass. These groups are also actively lobbying, litigating and undertaking other actions domestically and abroad in an effort to increase the regulation of, reduce or eliminate the incentives and support for, or otherwise delay, interfere with or impede the production and use of biomass for or by generators. Such efforts, if successful, could materially adversely affect our results of operations, business and financial condition, and our ability to pay distributions to our unitholders.
Our exposure to risks associated with foreign currency and interest rate fluctuations, as well as the hedging arrangements we may enter into to mitigate those risks, could have an adverse effect on our financial condition and results of operations.
We may experience foreign currency exchange and interest rate volatility in our business. We began to use hedging transactions in 2016 with respect to certain of our off-take contracts which are, in part or in whole, denominated in foreign currencies, as well as an interest rate swap with respect to a portion of our variable rate debt, in an effort to achieve more predictable cash flow and to reduce our exposure to foreign currency exchange and interest rate fluctuations. We currently do not hedge a significant portion of our overall revenue pursuant to our off‑take contracts.
In addition, there may be instances in which costs and revenue will not be matched with respect to currency denomination. As a result, to the extent that existing and future off-take contracts are not denominated in U.S. Dollars, it is possible that increasing portions of our revenue, costs, assets and liabilities will be subject to fluctuations in foreign currency valuations.
Our hedging transactions involve cost and risk and may not be effective at mitigating our exposure to fluctuations in foreign currency exchange and interest rates. Although the use of hedging transactions limits our downside risk, their use may also limit future revenues. Risks inherent in our hedging transactions include the risk that counterparties to hedging contracts may be unable to perform their obligations and the risk that the terms of such contracts will not be legally enforceable. Likewise, our hedging activities may be ineffective or may not fully offset the financial impact of foreign currency exchange or interest rates fluctuations, which could have an adverse impact on our results of operations, business and financial position, and our ability to pay distributions to our unitholders.
Challenges to or delays in the issuance of air permits, or our failure to comply with our permits, could impair our operations and ability to expand our production.
Our plants are subject to the requirements of the CAA and must either receive minor source permits from the states in which they are located or a major source permit, which is subject to the approval of the EPA. In general, our facilities are
18
eligible for minor source permits following the application of pollution control technologies. However, we could experience substantial delays with respect to obtaining such permits, including as a result of any challenges to the issuance of our permits or other factors, which could impair our ability to operate our wood pellet production plants or expand our production capacity. In addition, any new air permits we receive could require that we incur additional expenses to install emissions control technologies, limit our operations and impede our ability to satisfy emission limitations and/or stringent testing requirements to demonstrate compliance therewith. Failure to meet such requirements could have a material adverse effect on our results of operations, business and financial position, and our ability to pay distributions to our unitholders.
Changes in laws or government policies, incentives and taxes implemented to support increased generation of or otherwise regulate low-carbon and renewable energy may affect customer demand for our products.
Consumers of utility-grade wood pellets currently use our products either as part of a binding obligation to generate a certain percentage of low-carbon energy or because they receive direct or indirect financial support or incentives to do so. Financial support is often necessary to cover the generally higher costs of wood pellets compared to conventional fossil fuels like coal. In most countries, once the government implements a tax (e.g., the U.K.’s carbon price floor tax) or a preferable tariff or specific renewable energy policy either supporting a renewable energy generator or the energy generating sector as a whole, such tax, tariff or policy is guaranteed for a specified period of time, sometimes for the investment lifetime of a generator’s project. However, governmental policies that currently support the use of biomass may adversely modify their tax, tariff or incentive regimes, and the future availability of such taxes, tariffs or incentive regimes, either in current jurisdictions beyond the prescribed timeframes or in new jurisdictions, is uncertain. Demand for wood pellets could be substantially lower than expected if government support is removed, reduced or delayed or, in the future, is insufficient to enable successful deployment of biomass power at the levels currently projected. In addition, regulatory changes such as new requirements to install additional pollution control technology or curtail operations to meet new GHG emission limits may also affect demand for our products.
Although several jurisdictions where we ship our products treat biomass as a carbon-neutral fuel, several environmental groups have criticized this determination and are attempting to have it changed. For example, plaintiffs from several countries filed suit against the EU, challenging the EU’s treatment of forest biomass as a renewable fuel. A change in the characterization of biomass could negatively impact demand for our products.
In Europe, the EU’s Renewable Energy Directive (“RED”) requires that member nations fulfill 20% of their energy demand from renewable sources by 2020. Under the current RED framework, biofuels are subject to a set of sustainability criteria that must be met in order to qualify as renewable fuels. In December 2018, the EU finalized RED II, which increased the renewable energy goal to 32% of energy demand by 2030 in addition to establishing a 2030 goal for energy efficiency improvements of 33%. Under RED II, qualifying biofuels such as biomass are subject to new EU-wide sustainability requirements, including a requirement that feedstocks used to make biomass fuel be harvested from areas with increasing carbon stocks for countries that are not party to the landmark climate accord ratified by 195 countries in Paris, France in December 2015, and individual member states may implement more restrictive requirements than those required by the directive. The implementation of these requirements could cause us to incur additional compliance costs. Furthermore, although carbon stocks are currently increasing in all of our supply regions, there is a risk that such stocks could decline unexpectedly due to factors beyond our control, such as fire, storms or pest infestations, which could adversely impact our ability to meet these requirements.
EU action to regulate biofuels may influence future regulatory actions in other countries where our customers are located. For example, several lawsuits have been filed challenging the sufficiency of RED II in addressing climate concerns, including challenging the treatment of biomass. Similar lawsuits have been brought against the EIB for financing the construction of biomass-fired power plants. In the event that RED II, EIB policy or any modifications thereto limit or otherwise constrain our ability to export our product to the EU or have other adverse consequences, it could have a material adverse effect on our results of operations and financial condition, and our ability to pay distributions to our unitholders.
The international nature of our business subjects us to a number of risks, including foreign exchange risk and unfavorable political, regulatory and tax conditions in foreign countries.
Substantially all of our current product sales are to customers that operate outside of the United States. As a result, we face certain risks inherent in maintaining international operations that include the following:
• | foreign exchange movements, which may make it more difficult for our customers to make payments denominated in U.S. Dollars or exert pricing pressure on new contracts compared to competitors that source from jurisdictions with a weaker currency; |
19
• | restrictions on foreign trade and investment, including currency exchange controls imposed by or in other countries; and |
• | trade barriers such as export requirements, tariffs, taxes and other restrictions and expenses, which could increase the prices of our products and make our products less competitive in some countries. |
Our business in foreign countries requires us to respond to rapid changes in market conditions in these countries. Our overall success as a global business depends, in part, on our ability to succeed under differing legal, regulatory, economic, social and political conditions. There can be no assurance, however, that we will be able to develop, implement and maintain policies and strategies that will be effective in each location where our customers operate. Any of the foregoing factors could have a material adverse effect on our results of operations, business and financial position, and our ability to pay distributions to our unitholders.
Federal, state and local legislative and regulatory initiatives relating to forestry products and the potential for related litigation could result in increased costs, additional operating restrictions and delays, which could cause a decline in the demand for our products and negatively impact our business, financial condition and results of operations.
Our raw materials are byproducts of traditional timber harvesting, principally low-value wood materials such as the tops and limbs of trees that are generated in a harvest and industrial residuals (chips, sawdust and other wood industry byproducts). Commercial forestry is regulated by complex regulatory frameworks at each of the federal, state and local levels. Among other federal laws, the Clean Water Act and the Endangered Species Act have been applied to commercial forestry operations through agency regulations and court decisions, as well as through the delegation to states to implement and monitor compliance with such laws. State forestry laws, as well as land-use regulations and zoning ordinances at the local level, are also used to manage forests in the Southeastern United States, as well as other regions from which we may need to source raw materials in the future. Any new or modified laws or regulations at any of these levels could have the effect of reducing forestry operations in areas where we procure our raw materials and consequently may prevent us from purchasing raw materials in an economic manner, or at all. In addition, future regulation of, or litigation concerning, the use of timberlands, the protection of endangered species, the promotion of forest biodiversity, and the response to and prevention of wildfires, as well as litigation, campaigns or other measures advanced by special interest groups, could also reduce the availability of the raw materials required for our operations.
The enactment of derivatives legislation could have an adverse effect on our ability to use derivative instruments to reduce the effect of foreign currency, interest rate and other risks associated with our business.
The Dodd-Frank Wall Street Reform and Consumer Protection Act (“Dodd‑Frank Act”) enacted on July 21, 2010, established federal oversight and regulation over the derivatives markets and entities, such as us, that participate in such markets. The Dodd‑Frank Act requires the Commodities Futures Trading Commission (“CFTC”) and the SEC to promulgate rules and regulations implementing the Dodd‑Frank Act. Although the CFTC has finalized certain regulations, others remain to be finalized or implemented and it is not possible at this time to predict when this will be accomplished.
The CFTC has designated certain interest rate swaps and credit default swaps for mandatory clearing and the associated rules also require us, in connection with covered derivative activities, to comply with clearing and trade-execution requirements or take steps to qualify for an exemption to such requirements. We do not utilize credit default swaps and we qualify for, and expect to continue to qualify for, the end-user exception from the mandatory clearing requirements for swaps entered to hedge our interest rate risks. Pursuant to the Dodd‑Frank Act, however, the CFTC or federal banking regulators may require the posting of collateral with respect to uncleared interest rate derivative transactions.
Certain banking regulators and the CFTC have recently adopted final rules establishing minimum margin requirements for uncleared swaps. Although we qualify for the end-user exception from such margin requirements for swaps entered into to hedge our commercial risks, the application of such requirements to other market participants, such as swap dealers, may change the cost and availability of the swaps we use for hedging. Moreover, if any of our swaps do not qualify for the commercial end-user exception, we may be required to post additional cash margin or collateral, which could impact our liquidity and reduce our ability to use cash for capital expenditures or other partnership purposes.
The full impact of the Dodd-Frank Act and related regulatory requirements upon our business will not be known until the regulations are implemented and the market for derivatives contracts has adjusted. The Dodd-Frank Act and regulations could significantly increase the cost of derivative contracts, materially alter the terms of derivative contracts, reduce the availability of derivatives to protect against risks we encounter or reduce our ability to monetize or restructure our existing derivative contracts. If we reduce our use of derivatives as a result of the Dodd-Frank Act and regulations implementing the Dodd-Frank Act our results of operations may become more volatile and our cash flows may be less predictable, which could materially adversely affect our ability to plan for and fund capital expenditures.
20
In addition, the EU and other non‑U.S. jurisdictions are implementing regulations with respect to the derivatives market. To the extent we transact with counterparties in foreign jurisdictions, we may become subject to such regulations. At this time, the impact of such regulations on us is uncertain.
We may be unable to complete the planned expansion of our Northampton and Southampton plants or our future construction projects on time, and our construction costs could increase to levels that make the return on our investment less than expected.
Historically, we typically have acquired wood pellet production plants, marine export terminals and other assets that had already commenced commercial operations. In response to the increasing demand for our product, we are undertaking an expansion project to increase the aggregate production capacity at our Northampton and Southampton plants by approximately 400,000 MTPY in the aggregate at a total cost of approximately $130.0 million (the “Mid-Atlantic Expansions”). The Mid-Atlantic Expansions are our first major construction project.
We may face delays or unexpected developments in completing the Mid-Atlantic Expansions or other current or future construction projects, which could cause the costs of these projects to exceed our expectations, including as a result of the factors enumerated below. These circumstances could prevent our construction projects from commencing operations or from meeting our original expectations concerning timing, their production capacity, the capital expenditures necessary for their completion and the returns they will achieve.
Moreover, disputes with project construction providers may arise in the future. While we will attempt to reach a settlement if disputes do arise, no assurances can be given that we would actually reach a settlement or that the amount of any such settlement would be covered by the remaining budgeted project contingencies. If an equitable settlement cannot be reached, arbitration or legal action could be commenced, and any final judgment or decision could result in increased costs, which could make the return on our investment in the project less than expected.
The following factors could contribute to construction-cost overruns and construction delays:
• | failure to timely obtain the equipment necessary for the operation of our projects at budgeted costs; |
• | failure to secure and maintain connections to transportation networks, including road, rail and waterway access or other infrastructure, including local utility services; |
• | failure to maintain all necessary rights to land access and use; |
• | failure to timely receive quality and timely performance of third-party services at budgeted costs; |
• | failure to timely obtain and/or maintain environmental and other permits or approvals or appeals of those permits or approvals, including due to special interest groups opposed to the use of biomass by generators; |
• | inclement weather conditions and adverse environmental and geological conditions; and |
• | force majeure or other events outside of our control. |
Our inability to complete and transition our construction projects, including the Mid-Atlantic Expansions, into financially successful operating projects on time and within budget could have a material adverse effect on our results of operations, business and financial position, and our ability to pay distributions to our unitholders.
The departure of the U.K. from the EU could adversely affect our results of operations, business and financial position and ability to pay distributions to our unitholders.
In March 2017, the Prime Minister of the U.K. formally notified the European Counsel of the commencement of the process by which the U.K. was to exit (“Brexit”) from the EU under Article 50 of the Treaty of the European Union. The U.K. formally withdrew from the EU in January 2020, which is subject to a transition period until the end of 2020 to allow for the negotiation of new trade deals.
We have take-or-pay off-take contracts with utilities and large generators in the U.K. and in other European markets. For the year ended December 31, 2019, approximately 68% of our product sales were derived from contracts with customers in the U.K. and 28% of our product sales were derived from contracts with customers in other European markets.
Brexit may create uncertainty with respect to the legal and regulatory requirements to which we and our customers in the U.K. are subject and lead to divergent national laws and regulations as the U.K. government determines which EU laws to replace or replicate. The absence of precedent for an exit of a European Member State from the EU means that it is unclear how
21
the access of U.K. businesses to the EU Single Market and how the legal and regulatory environments in the U.K. and the EU could be impacted by Brexit, and ultimately how Brexit could impact our business or that of our customers.
The consequences of Brexit, together with what may be protracted negotiations around the terms of Brexit, could also introduce significant uncertainties into global financial markets and adversely impact the markets in which we and our customers operate. For example, prolonged exchange rate volatility or weakness of the local currencies of our customers relative to the U.S. Dollar may impair the purchasing power of our customers and cause them to default on payment or seek modification of the terms of our off‑take contracts. The impacts of Brexit may also adversely affect our ability to re‑negotiate our existing contracts on terms acceptable to us as they expire or enter into new contracts with new or existing customers.
The risks and uncertainties surrounding Brexit could have a material adverse effect on our operations, business and financial position, as well as our ability to pay distributions to our unitholders.
The viability of our customers’ businesses may also affect demand for our products and the results of our business and operations.
The viability of our customers’ businesses is dependent on their ability to compete in their respective markets. Our customers’ competitiveness is a function of, among other things, the market price of electricity, the market price of competing fuels (e.g. coal and natural gas), the relative cost of carbon and the costs of generating power, heat or combined heat and power using other renewable energy technologies. For example, advancements in battery storage technology have the potential to make solar, wind and other intermittent sources of renewable energy more competitive with biomass as a potential source for baseload and peak-demand electricity needs. Changes in the values of the inputs and outputs of our customers’ businesses, or of the businesses of their competitors, could have a material adverse effect on our customers and, as a result, could have a material adverse effect on our results of operations, business and financial position, and our ability to pay distributions to our unitholders.
The growth of our business depends in part upon locating and acquiring interests in additional wood pellet production plants and marine terminals at favorable prices.
Our business strategy includes growing our business through drop‑down and third-party acquisitions that increase our cash generated from operations and cash available for distribution on a per-unit basis. Various factors could affect the availability of attractive projects to grow our business, including:
• | our sponsor’s failure to complete its or the Sponsor JV’s development projects in a timely manner or at all, which could result from, among other things, permitting challenges, failure to procure the requisite financing or equipment, construction difficulties or an inability to obtain off‑take contracts on acceptable terms; |
• | our sponsor’s failure to offer its assets or the assets of the Sponsor JV for sale; |
• | our failure or inability to exercise our right of first offer with respect to any asset that our sponsor offers, or compels the Sponsor JV to offer, to us; and |
• | fewer accretive third‑party acquisition opportunities than we expect, which could result from, among other things, available projects having less desirable economic returns, competition, anti‑trust concerns or higher risk profiles than we believe suitable for our business plan and investment strategy. |
Any of these factors could prevent us from executing our growth strategy or otherwise could have a material adverse effect on our results of operations, business and financial position, and our ability to pay distributions to our unitholders.
Any acquisitions we make may reduce, rather than increase, our cash generated from operations on a per-unit basis.
We may consummate acquisitions we believe will be accretive, but result in a decrease in our cash available for distribution per unit. Any acquisition involves potential risks, some of which are beyond our control, including:
• | mistaken assumptions about revenues and costs, including synergies; |
• | the inability to successfully integrate the businesses we acquire; |
• | the inability to hire, train or retain qualified personnel to manage and operate our business and newly acquired assets; |
• | the assumption of unknown liabilities; |
22
• | limitations on our access to indemnification from the seller; |
• | mistaken assumptions about the overall costs of equity or debt; |
• | the diversion of management’s attention to other business concerns; |
• | unforeseen difficulties in connection with operating newly acquired assets or in new geographic areas; |
• | customer or key employee losses at the acquired businesses; and |
• | the inability to meet the obligations in off‑take or other contracts associated with acquisitions. |
If we consummate any future acquisitions, our capitalization and results of operations may change significantly, and unitholders will not have the opportunity to evaluate the economic, financial and other relevant information that we will consider in determining the application of our funds and other resources to acquisitions.
Significant increases in the cost, or decreases in the availability, of raw materials or sourced wood pellets could result in lower revenue, operating profits and cash flows, or impede our ability to meet commitments to our customers.
We purchase wood fiber from third-party landowners and other suppliers for use at our plants. Our reliance on third parties to secure wood fiber exposes us to potential price volatility and unavailability of such raw materials, and the associated costs may exceed our ability to pass through such price increases under our contracts with our customers. Further, delays or disruptions in obtaining wood fiber may result from a number of factors affecting our suppliers, including extreme weather, production or delivery disruptions, inadequate logging capacity, labor disputes, impaired financial condition of a particular supplier, the inability of suppliers to comply with regulatory or sustainability requirements or decreased availability of raw materials. In addition, other companies, whether or not in our industry, could procure wood fiber within our procurement areas and adversely change regional market dynamics, resulting in insufficient quantities of raw material or higher prices. Any of these events could increase our operating costs or prevent us from meeting our commitments to our customers, and thereby could have a material adverse effect on our results of operations, business and financial position, and our ability to pay distributions to our unitholders.
Any interruption or delay in the supply of wood fiber, or our inability to obtain wood fiber at acceptable prices in a timely manner, could impair our ability to meet the demands of our customers and expand our operations, which could have a material adverse effect on our results of operations, business and financial position, and our ability to pay distributions to our unitholders.
Moreover, we purchase wood pellets produced by other suppliers to fulfill our obligations under our portfolio of long-term off-take contracts or take advantage of market dislocations on an opportunistic basis. Any reliance on other wood pellet producers exposes us to the risk that such suppliers will fail to satisfy their obligations to us pursuant to the associated off-take contracts, including by failing to timely meet quality specifications and volume requirements. Any such failure could increase our costs or prevent us from meeting our commitments to our customers, and thereby could have an adverse effect on our results of operations, business and financial position, and our ability to pay distributions to our unitholders.
We are exposed to the credit risk of our contract counterparties, including the customers for our products, and any material nonpayment or nonperformance by our customers could adversely affect our financial results and cash available for distribution.
We are subject to the risk of loss resulting from nonpayment or nonperformance by our contract counterparties, including our long-term off-take customers, whose operations currently are concentrated in the European power generation industry, and suppliers. Our credit procedures and policies may not be adequate to fully eliminate counterparty credit risk. If we fail to adequately assess the creditworthiness of existing or future customers or suppliers, or if their creditworthiness deteriorates unexpectedly, any resulting nonpayment or nonperformance by them could have an adverse impact on our results of operations, business and financial position, and our ability to pay distributions to our unitholders.
The satisfactory delivery of substantially all of our production is dependent upon continuous access to infrastructure at our owned, leased and third-party-operated terminals. Loss of access to our ports of shipment and destination, including through failure of terminal equipment and port closures, could adversely affect our financial results and cash available for distribution.
A significant portion of our total production is loaded for shipment utilizing automated conveyor and ship loading equipment at the Port of Chesapeake, Port of Wilmington, and Port Panama City, and substantially all of our production is dependent upon infrastructure at our owned, leased and third-party-operated ports. Should we suffer a catastrophic failure of the
23
equipment at these ports or otherwise experience port closures, including for security or weather-related reasons, we could be unable to fulfill off‑take obligations or incur substantial additional transportation costs, which would reduce our cash flow. Moreover, we rely on various ports of destination, as well as third parties who provide stevedoring or other services at our ports of shipment and destination or from whom we charter oceangoing vessels and crews, to transport our product to our customers. Loss of access to these ports for any reason, or failure of such third-party service providers to uphold their contractual obligations, may impact our ability to fulfill our obligations under our off-take contracts, cause interruptions to our shipping schedule and cause us to incur substantial additional transportation or other costs, all of which could have a material adverse effect on our business, financial condition and results of operations.
Fluctuations in transportation costs and the availability or reliability of shipping, rail or truck transportation could reduce revenues by causing us to reduce our production or by impairing our ability to deliver our product to our customers or the ability of our customers to take delivery of our products.
Disruptions of local or regional transportation services due to shortages of vessels, barges, railcars or trucks, weather-related problems, flooding, drought, accidents, mechanical difficulties, bankruptcy, strikes, lockouts, bottlenecks or other events could temporarily impair our ability to deliver products to our customers and might, in certain circumstances, constitute a force majeure event under our customer contracts, permitting our customers to suspend taking delivery of and paying for our products.
In addition, persistent disruptions in our access to infrastructure may force us to halt production as we reach storage capacity at our facilities. Accordingly, if the transportation services we use to transport our products are disrupted, and we are unable to find alternative transportation providers, it could have a material adverse effect on our results of operations, business and financial position, and our ability to pay distributions to our unitholders.
Our long-term off-take contracts with our customers may only partially offset certain increases in our costs or preclude us from taking advantage of relatively high wood pellet prices in the broader markets.
Our long-term off-take contracts typically set base prices subject to annual price escalation and other pricing adjustments for changes in certain of our underlying costs of operations, including, in some cases, for stumpage or shipping fuel. However, such cost pass-through mechanisms may only pass a portion of our total costs through to our customers. If our operating costs increase significantly during the terms of our long-term off-take contracts beyond the levels of pricing and cost protection afforded to us under the terms of such contracts, our results of operations, business and financial position, and ability to pay distributions to our unitholders, could be adversely affected.
Moreover, during periods when the prevailing market price of wood pellets exceeds the prices under our long-term off-take contracts, our revenues could be significantly lower than they otherwise would have been were we not party to such contracts for substantially all our production. In addition, our current and future competitors may be in a better position than we are to take advantage of relatively high prices during such periods.
We may be required to make substantial capital expenditures to maintain and improve our facilities.
Although we currently use a portion of our cash reserves and cash generated from our operations to maintain, develop and improve our assets and facilities, such investment may, over time, be insufficient to preserve the operating profile required for us to meet our planned profitability or meet the evolving quality and product specifications demanded by our customers. Moreover, our current and future construction projects, including the Mid-Atlantic Expansions, may be capital-intensive. Accordingly, if we exceed our budgeted capital expenditures and/or additional capital expenditures become necessary in the future and we are unable to execute our construction, maintenance or improvement programs successfully, within budget, and in a timely manner, our results of operations, business and financial position, and our ability to pay distributions to our unitholders, may be materially adversely affected.
We compete with other wood pellet producers and, if growth in domestic and global demand for wood pellets meets or exceeds management’s expectations, the competition within our industry may grow significantly.
We compete with other wood pellet production companies for the customers to whom we sell our products. Other current producers of utility‑grade wood pellets include AS Graanul Invest, Pinnacle Renewable Energy Inc., Drax Biomass Inc., Georgia Biomass, LLC, Fram Renewable Fuels, LLC, Highland Pellets LLC and Pacific BioEnergy Corporation. Competition in our industry is based on price, consistency and quality of product, site location, distribution and logistics capabilities, customer service, creditworthiness and reliability of supply. Some of our competitors may have greater financial and other resources than we do, may develop technology superior to ours or may have production plants sited in more advantageous locations from a logistics, procurement or other cost perspective.
24
In addition, we expect global demand for solid biomass to increase significantly in the coming years. This demand growth may lead to a significant increase in the production levels of our existing competitors and may incentivize new, well‑capitalized competitors to enter the industry, both of which could reduce the demand and the prices we are able to obtain under future off‑take contracts. Significant price decreases or reduced demand could have a material adverse effect on our results of operations, business and financial position, and our ability to pay distributions to our unitholders.
For our products to be acceptable to our customers, they must comply with stringent sustainability requirements, which may continue to develop and change.
Biomass energy generation requires the use of biomass that is derived from acceptable sources and is demonstrably sustainable. This typically is implemented through biomass sustainability criteria, which either are a mandatory element of eligibility for financial subsidies to biomass energy generators or will become mandatory in the future. As a biomass fuel supplier, the viability of our business is therefore dependent upon our ability to comply with such requirements. This may restrict the types of biomass we can use and the geographic regions from which we source our raw materials, and may require us to reduce the GHG emissions associated with our supply and production processes. Currently, some elements of the criteria with which we will have to comply, including rules relating to forest management practices, are not yet finalized. If more stringent sustainability requirements are adopted in the future, demand for our products could be materially reduced in certain markets, and our results of operations, business and financial position, and our ability to pay distributions to our unitholders, may be materially adversely affected.
Our level of indebtedness may increase, thereby reducing our financial flexibility.
As of December 31, 2019, our total debt was $603.0 million, which primarily consisted of $593.5 million outstanding under our 6.5% senior unsecured notes due 2026. In the future, we may incur additional indebtedness in order to make acquisitions or to develop our properties. Our level of indebtedness could affect our operations in several ways, including the following:
• | a significant portion of our cash flows could be used to service our indebtedness; |
• | the covenants contained in the agreements governing our outstanding indebtedness may limit our ability to borrow additional funds, dispose of assets, pay distributions and make certain investments; |
• | our debt covenants may also affect our flexibility in planning for, and reacting to, changes in the economy and in our industry; |
• | a high level of debt would increase our vulnerability to general adverse economic and industry conditions; |
• | a high level of debt may place us at a competitive disadvantage compared to our competitors that may be less leveraged and therefore may be able to take advantage of opportunities that our indebtedness would prevent us from pursuing; and |
• | a high level of debt may impair our ability to obtain additional financing in the future for working capital, capital expenditures, debt service requirements, acquisitions or general partnership or other purposes. |
In addition, revolving borrowings under our senior secured revolving credit facility bear, and potentially other credit facilities we or our subsidiaries may enter into in the future will bear, interest at variable rates. If market interest rates increase, such variable‑rate debt will create higher debt service requirements, which could adversely affect our cash flow.
In addition to our debt service obligations, our operations require substantial expenditures on a continuing basis. Our ability to make scheduled debt payments, to refinance our obligations with respect to our indebtedness and to fund capital and non‑capital expenditures necessary to maintain the condition of our operating assets and properties, as well as to provide capacity for the growth of our business, depends on our financial and operating performance. General economic conditions and financial, business and other factors affect our operations and our future performance. Many of these factors are beyond our control. We may not be able to generate sufficient cash flows to pay the interest on our debt, and future working capital borrowings or debt or equity financing may not be available to pay or refinance such debt.
An increase in the price or a significant interruption in the supply of electricity could have a material adverse effect on our results of operations.
Our production plants use a substantial amount of electricity. The price and supply of electricity are unpredictable and can fluctuate significantly based on international, political and economic circumstances, as well as other events outside our control, such as changes in supply and demand due to weather conditions, regional production patterns and environmental concerns. In
25
addition, potential climate change regulations or carbon or emissions taxes could result in higher production costs for electricity, which may be passed on to us in whole or in part. A significant increase in the price of electricity or an extended interruption in the supply of electricity to our production plants could have a material adverse effect on our results of operations, cash flows and ability to pay distributions to our unitholders.
Changes in the price of diesel fuel may adversely affect our results of operations.
Diesel fuel costs generally fluctuate with world crude oil prices, and accordingly are subject to political, economic and market factors outside our control. Our operations are dependent on rolling stock and trucks, and diesel fuel costs are a significant component of the operating expense of these vehicles. In addition, diesel fuel is consumed by our wood suppliers in the harvesting and transport of our raw material and is therefore a component of the delivered cost we pay for wood fiber. It is also consumed by the handling equipment at our plants. Some of our long-term off‑take contracts contain mechanisms that are intended to reduce the impact that changes in the price of diesel fuel would have on us, but these mechanisms may not be effective. Accordingly, changes in diesel fuel prices could have an adverse effect on our results of operations, cash flows and ability to pay distributions to our unitholders.
Our business may suffer if we lose, or are unable to attract and retain, key personnel.
We depend to a large extent on the services of our senior management team and other key personnel. Members of our senior management and other key employees collectively have extensive expertise in designing, building and operating wood pellet production plants or marine terminals, negotiating long‑term off-take contracts and managing businesses such as ours. Competition for management and key personnel is intense, and the pool of qualified candidates is limited. The loss of any of these individuals or the failure to attract additional personnel, as needed, could have a material adverse effect on our operations and could lead to higher labor costs or reliance on less qualified personnel. In addition, if any of our executives or other key employees were to join a competitor or form a competing company, we could lose customers, suppliers, know-how and key personnel. Our success is dependent on our ability to continue to attract, employ and retain highly skilled personnel.
Failure to maintain effective quality control systems at our production plants and deep-water marine terminals could have a material adverse effect on our business and operations.
Our customers require a reliable supply of wood pellets that meet stringent product specifications. We have built our operations and assets to consistently deliver and certify the highest levels of product quality and performance, which is critical to the success of our business and depends significantly on the effectiveness of our quality control systems, including the design and efficacy of our quality control systems, the success of our quality training program and our ability to ensure that our employees and contract counterparties adhere to our quality control policies and guidelines. Moreover, any significant failure or deterioration of our quality control systems could impact our ability to deliver product that meets our customers’ specifications and, in turn, could lead to rejection of our product by our customers, which could have a material adverse effect on our business, financial condition and results of operations.
Our business is subject to operating hazards and other operational risks, which may have a material adverse effect on our business and results of operation. We may also not be adequately insured against such events.
Our business could be adversely affected by operating hazards and other risks to our operations. We produce a combustible product that may under certain circumstances present a risk of fires and explosions or other hazards. Severe weather, such as floods, earthquakes, hurricanes or other natural disasters, climatic phenomena, such as drought, and other catastrophic events, such as plant or shipping disasters, could impact our operations by causing damage to our facilities and equipment, affecting our ability to deliver our product to our customers and impacting our customers’ ability to take delivery of our products. Such events may also adversely affect the ability of our suppliers or service providers to provide us with the raw materials or services we require or the ability to load, transport and unload our product.
We maintain insurance policies to mitigate against certain risks related to our business, in types and amounts that we believe are reasonable depending on the circumstances surrounding each identified risk; however, we may not be fully insured against all operating hazards and other operational risks incident to our business. Furthermore, we may be unable to maintain or obtain insurance of the type and amount we desire at reasonable rates, if at all. As a result of market conditions and certain claims we may make under our insurance policies, premiums and deductibles for certain of our insurance policies could escalate. In some instances, insurance could become unavailable or available only for reduced amounts of coverage or at unreasonable rates. If we were to incur a significant liability for which we are not fully insured, it could have a material adverse effect on our financial condition, results of operations and cash available for distribution to our unitholders.
26
Our operations are subject to stringent environmental and occupational health and safety laws and regulations that may expose us to significant costs and liabilities.
Our operations are subject to stringent federal, regional, state and local environmental, health and safety laws and regulations. These laws and regulations govern environmental protection, occupational health and safety, the release or discharge of materials into the environment, air emissions, wastewater discharges, the investigation and remediation of contaminated sites and allocation of liability for cleanup of such sites. These laws and regulations may restrict or impact our business in many ways, including by requiring us to acquire permits or other approvals to conduct regulated activities; limiting our air emissions or wastewater discharges or requiring us to install costly equipment to control, reduce or treat such emissions or discharges; imposing requirements on the handling or disposal of wastes; impacting our ability to modify or expand our operations (for example, by limiting or prohibiting construction and operating activities in environmentally sensitive areas); and imposing health and safety requirements for worker protection. We may be required to make significant capital and operating expenditures to comply with these laws and regulations. Failure to comply with these laws and regulations may result in the assessment of administrative, civil and criminal penalties, imposition of investigatory or remedial obligations, suspension or revocation of permits and the issuance of orders limiting or prohibiting some or all of our operations. Adoption of new or modified environmental laws and regulations may impair the operation of our business, delay or prevent expansion of existing facilities or construction of new facilities and otherwise result in increased costs and liabilities, which may be material.
Our business and operating results are subject to seasonal fluctuations.
Our business is affected by seasonal fluctuations. The cost of producing wood pellets tends to be higher in the winter months because of increases in the cost of delivered raw materials, primarily due to a reduction in accessibility during cold and wet weather conditions. Our raw materials typically have higher moisture content during this period, resulting in a lower product yield; moreover, the cost of drying wood fiber increases during periods of lower ambient temperatures.
The increase in demand for power and heat during the winter months drives greater customer demand for wood pellets. As some of our wood pellet supply to our customers are sourced from third-party purchases, we may experience higher wood pellet costs and a reduction in our gross margin during the winter months. These seasonal fluctuations could have an adverse effect on our business, financial condition and results of operations and cause comparisons of operating measures between consecutive quarters to not be as meaningful as comparisons between longer reporting periods.
A terrorist attack or armed conflict could harm our business.
Terrorist activities and armed conflicts could adversely affect the U.S. and global economies and could prevent us from meeting financial and other obligations or prevent our customers from meeting their obligations to us. We could experience loss of business, delays or defaults in payments from customers or disruptions of fuel supplies and markets, including if domestic and global generators are direct targets or indirect casualties of an act of terror or war. Terrorist activities and the threat of potential terrorist activities and any resulting economic downturn could adversely affect our results of operations, impair our ability to raise capital or otherwise adversely impact our ability to realize certain business strategies.
Our business is subject to cybersecurity risks.
As is typical of modern businesses, we are reliant on the continuous and uninterrupted operation of our information technology (“IT”) systems. User access and security of our sites and IT systems can be critical elements of our operations, as are cloud security and protection against cybersecurity incidents. Any IT failure pertaining to availability, access or system security could potentially result in disruption of our activities and personnel, and could adversely affect our reputation, operations or financial performance.
Potential risks to our IT systems could include unauthorized attempts to extract business-sensitive, confidential or personal information, denial of access, extortion, corruption of information, or disruption of business processes. A cybersecurity incident resulting in a security breach or failure to identify a security threat could disrupt our business and could result in the loss of sensitive, confidential information or other assets, as well as litigation, regulatory enforcement, violation of privacy or securities laws and regulations, and remediation costs, all of which could materially impact our reputation, operations or financial performance.
Uncertainty relating to the London Inter-bank Offered Rate (“LIBOR”) calculation process and potential phasing out of LIBOR after 2021 may adversely affect the market value of our current or future debt obligations, including our senior secured revolving credit facility.
On July 27, 2017, the U.K. Financial Conduct Authority announced that it intends to stop persuading or compelling banks to submit LIBOR rates after 2021. As a result, LIBOR may be discontinued by 2021. Furthermore, in the United States, efforts to identify a set of alternative U.S. dollar reference interest rates that could replace LIBOR include proposals by the Alternative
27
Reference Rates Committee of the Federal Reserve Board and the Federal Reserve Bank of New York. At this time, it is not possible to predict whether any such changes will occur, whether LIBOR will be phased out or any such alternative reference rates or other reforms to LIBOR will be enacted in the U.K., the United States or elsewhere or the effect that any such changes, phase out, alternative reference rates or other reforms, if they occur, would have on the amount of interest paid on, or the market value of, our current or future debt obligations, including our senior secured revolving credit facility. Uncertainty as to the nature of such potential changes, phase out, alternative reference rates or other reforms may materially adversely affect the terms of the credit facility and any interest rate swaps or other derivative agreements to which we are a party. Reform of, or the replacement or phasing out of, LIBOR and proposed regulation of LIBOR and other “benchmarks” may materially adversely affect the market value of, the applicable interest rate on and the amount of interest paid on our current or future debt obligations, including our senior secured revolving credit facility. In addition, even if we have entered into interest rate swaps or other derivative instruments for purposes of managing our interest rate exposure, our hedging strategies may not be effective as a result of the replacement or phasing out of LIBOR and other “benchmarks” and we may incur losses as a result.
Risks Related to Our Partnership Structure
Enviva Holdings, LP owns and controls our General Partner, which has sole responsibility for conducting our business and managing our operations. Our General Partner and its affiliates, including Enviva Holdings, LP, have conflicts of interest with us and limited duties, and they may favor their own interests to our detriment and that of our unitholders.
Enviva Holdings, LP, owns and controls our General Partner and appoints all of the directors of our General Partner. Although our General Partner has a duty to manage us in a manner that it believes is not adverse to our interest, the executive officers and directors of our General Partner have a fiduciary duty to manage our General Partner in a manner beneficial to our sponsor. Therefore, conflicts of interest may arise between our sponsor or any of its affiliates, including our General Partner, on the one hand, and us or any of our unitholders, on the other hand. In resolving these conflicts of interest, our General Partner may favor its own interests and the interests of its affiliates over the interests of our common unitholders. These conflicts may include the following:
• | our General Partner is allowed to take into account the interests of parties other than us, such as our sponsor, in exercising certain rights under our partnership agreement; |
• | neither our partnership agreement nor any other agreement requires our sponsor to pursue a business strategy that favors us; |
• | our partnership agreement eliminates and replaces the fiduciary duties that would otherwise be owed by our General Partner with contractual standards governing its duties, limits our General Partner’s liabilities and restricts the remedies available to our unitholders for actions that, without such eliminations and limitations, might constitute breaches of fiduciary duty; |
• | except in limited circumstances, our General Partner has the power and authority to conduct our business without unitholder approval; |
• | our General Partner determines the amount and timing of asset purchases and sales, borrowings, issuances of additional partnership securities and the level of reserves, each of which can affect the amount of cash that is distributed to our unitholders; |
• | our General Partner determines the amount and timing of any cash expenditure and whether an expenditure is classified as a maintenance capital expenditure, which reduces operating surplus, or an expansion capital expenditure, which does not reduce operating surplus. This determination can affect the amount of cash from operating surplus that is distributed to our common unitholders relative to our General Partner as the holder of our incentive distribution rights; |
• | our General Partner may cause us to borrow funds in order to permit the payment of cash distributions; |
• | our partnership agreement permits us to distribute up to $39.3 million as operating surplus, even if it is generated from asset sales, borrowings other than working capital borrowings or other sources that would otherwise constitute capital surplus. This cash may be used to fund distributions to holders of our incentive distribution rights; |
• | our General Partner determines which costs incurred by it and its affiliates are reimbursable by us; |
28
• | our partnership agreement does not restrict our General Partner from causing us to pay it or its affiliates for any services rendered to us or entering into additional contractual arrangements with its affiliates on our behalf; |
• | our General Partner intends to limit its liability regarding our contractual and other obligations; |
• | our General Partner may exercise its right to call and purchase common units if it and its affiliates own more than 80% of the common units; |
• | our General Partner controls the enforcement of obligations that it and its affiliates owe to us; |
• | our General Partner decides whether to retain separate counsel, accountants or others to perform services for us; and |
• | our General Partner may elect to cause us to issue common units to it in connection with a resetting of the target distribution levels related to our General Partner’s incentive distribution rights without the approval of the conflicts committee of the board of directors of our General Partner or the unitholders. This election may result in lower distributions to the common unitholders in certain situations. |
In addition, we may compete directly with our sponsor and entities in which it has an interest for acquisition opportunities and potentially will compete with these entities for new business or extensions of the existing services provided by us.
The board of directors of our General Partner may modify or revoke our cash distribution policy at any time at its discretion. Our partnership agreement does not require us to pay any distributions at all.
Pursuant to our cash distribution policy, we intend to distribute quarterly at least $0.4125 per unit on all of our units to the extent we have sufficient cash after the establishment of cash reserves and the payment of our expenses, including payments to our General Partner and its affiliates. However, the board may change such policy at any time at its discretion and could elect not to pay distributions for one or more quarters. Please read Part II, Item 5. “Market for Registrant’s Common Equity, Related Stockholder Matters and Issuer Purchases of Equity Securities—Cash Distribution Policy.”
In addition, our partnership agreement does not require us to pay any distributions at all. Accordingly, investors are cautioned not to place undue reliance on the permanence of such a policy in making an investment decision. Any modification or revocation of our cash distribution policy could substantially reduce or eliminate the amounts of distributions to our unitholders. The amount of distributions we make, if any, and the decision to make any distribution at all will be determined by the board of directors of our General Partner, whose interests may differ from those of our common unitholders. Our General Partner has limited duties to our unitholders, which may permit it to favor its own interests or the interests of our sponsor to the detriment of our common unitholders.
Our General Partner limits its liability regarding our obligations.
Our General Partner limits its liability under contractual arrangements between us and third parties so that the counterparties to such arrangements have recourse only against our assets, and not against our General Partner or its assets. Our General Partner may therefore cause us to incur indebtedness or other obligations that are nonrecourse to our General Partner. Our partnership agreement provides that any action taken by our General Partner to limit its liability is not a breach of our General Partner’s duties, even if we could have obtained more favorable terms without the limitation on liability. In addition, we are obligated to reimburse or indemnify our General Partner to the extent that it incurs obligations on our behalf. Any such reimbursement or indemnification payments would reduce the amount of cash otherwise available for distribution to our unitholders.
We intend to distribute a significant portion of our cash available for distribution to our partners, which could limit our ability to grow and make acquisitions.
We intend to distribute most of our cash available for distribution, which may cause our growth to proceed at a slower pace than that of businesses that reinvest their cash to expand ongoing operations. To the extent we issue additional units, whether in connection with acquisitions, expansion capital expenditures or otherwise, the payment of distributions on those additional units may increase the risk that we will be unable to maintain or increase our per unit distribution level. There are no limitations in our partnership agreement on our ability to issue additional units, including units ranking senior to the common units. The incurrence of additional commercial borrowings or other debt to finance our growth strategy would result in increased interest expense, which, in turn, may impact the cash that we have available to distribute to our unitholders.
29
Our partnership agreement eliminates and replaces our General Partner’s fiduciary duties to holders of our units.
Our partnership agreement contains provisions that eliminate and replace the fiduciary standards to which our General Partner would otherwise be held by state fiduciary duty law. For example, our partnership agreement permits our General Partner to make a number of decisions in its individual capacity, as opposed to in its capacity as our General Partner, or otherwise free of fiduciary duties to us and our unitholders. This entitles our General Partner to consider only the interests and factors that it desires and relieves it of any duty or obligation to give any consideration to any interest of, or factors affecting, us, our affiliates or our limited partners. Examples of decisions that our General Partner may make in its individual capacity include:
• | how to allocate business opportunities among us and its affiliates; |
• | whether to exercise its call right; |
• | whether to seek approval of the resolution of a conflict of interest by the conflicts committee of the board of directors of our General Partner; |
• | how to exercise its voting rights with respect to the units it owns; |
• | whether to exercise its registration rights; |
• | whether to elect to reset target distribution levels; and |
• | whether or not to consent to any merger or consolidation of the Partnership or amendment to the partnership agreement. |
Limited partners who own common units are treated as having consented to the provisions in the partnership agreement, including the provisions discussed above.
Our partnership agreement restricts the remedies available to holders of our units for actions taken by our General Partner that might otherwise constitute breaches of fiduciary duty.
Our partnership agreement contains provisions that restrict the remedies available to unitholders for actions taken by our General Partner that might otherwise constitute breaches of fiduciary duty under state fiduciary duty law. For example, our partnership agreement provides that:
• | whenever our General Partner makes a determination or takes, or declines to take, any other action in its capacity as our General Partner, our General Partner is generally required to make such determination, or take or decline to take such other action, in good faith, and will not be subject to any higher standard imposed by our partnership agreement, Delaware law, or any other law, rule or regulation, or at equity; |
• | our General Partner and its officers and directors will not be liable for monetary damages or otherwise to us or our limited partners resulting from any act or omission unless there has been a final and non-appealable judgment entered by a court of competent jurisdiction determining that such losses or liabilities were the result of conduct in which our General Partner or its officers or directors engaged in bad faith, meaning that they believed that the decision was adverse to our interest or, with respect to any criminal conduct, with knowledge that such conduct was unlawful; and |
• | our General Partner will not be in breach of its obligations under the partnership agreement or its duties to us or our limited partners if a transaction with an affiliate or the resolution of a conflict of interest is: |
(1) approved by the conflicts committee of the board of directors of our General Partner, although our General Partner is not obligated to seek such approval; or
(2) approved by the vote of a majority of the outstanding common units, excluding any common units owned by our General Partner and its affiliates.
In connection with a situation involving a transaction with an affiliate or a conflict of interest, other than one where our General Partner is permitted to act in its sole discretion, any determination by our General Partner must be made in good faith. If an affiliate transaction or the resolution of a conflict of interest is not approved by our common unitholders or the conflicts committee then it will be presumed that, in making its decision, taking any action or failing to act, the board of directors acted
30
in good faith, and in any proceeding brought by or on behalf of us or of any limited partner, the person bringing or prosecuting such proceeding will have the burden of overcoming such presumption.
Our sponsor and other affiliates of our General Partner may compete with us.
Our partnership agreement provides that our General Partner is restricted from engaging in any business activities other than acting as our General Partner, engaging in those activities incidental to its ownership interest in us and providing management, advisory and administrative services to its affiliates or to other persons. However, affiliates of our General Partner, including our sponsor, are not prohibited from engaging in other businesses or activities, including those that might be in direct competition with us. In addition, our sponsor may compete with us for investment opportunities and may own an interest in entities that compete with us.
Pursuant to the terms of our partnership agreement, the doctrine of corporate opportunity, or any analogous doctrine, does not apply to our General Partner or any of its affiliates, including its executive officers and directors and our sponsor. Any such person or entity that becomes aware of a potential transaction, agreement, arrangement or other matter that may be an opportunity for us will not have any duty to communicate or offer such opportunity to us. Any such person or entity will not be liable to us or to any limited partner for breach of any fiduciary duty or other duty by reason of the fact that such person or entity pursues or acquires such opportunity for itself, directs such opportunity to another person or entity or does not communicate such opportunity or information to us. This may create actual and potential conflicts of interest between us and affiliates of our General Partner and result in less than favorable treatment of us and our unitholders.
The holder or holders of our incentive distribution rights may elect to cause us to issue common units to it in connection with a resetting of the incentive distribution without the approval of our unitholders. This election may result in lower distributions to our common unitholders in certain situations.
The holder or holders of a majority of our incentive distribution rights (currently our General Partner) have the right, at any time when we have made cash distributions in excess of the then‑applicable third target distribution for each of the prior four consecutive fiscal quarters, to reset the initial target distribution levels at higher levels based on our cash distribution levels at the time of the exercise of the reset election. Following a reset election, a baseline distribution amount will be calculated equal to an amount equal to the prior cash distribution per common unit for the fiscal quarter immediately preceding the reset election (such amount is referred to as the “reset minimum quarterly distribution”), and the target distribution levels will be reset to correspondingly higher levels based on percentage increases above the reset minimum quarterly distribution. In addition, in connection with a reset election, the holders of our incentive distribution rights would receive a number of newly issued common units based on the value of cash distributions paid in respect of the incentive distribution rights in the quarter preceding the reset election.
We anticipate that our General Partner would exercise this reset right in order to facilitate acquisitions or internal growth projects that would not be sufficiently accretive to cash distributions per unit without such conversion. However, our General Partner may transfer the incentive distribution rights at any time. It is possible that our General Partner or a transferee could exercise this reset election at a time when we are experiencing declines in our aggregate cash distributions or at a time when the holders of the incentive distribution rights expect that we will experience declines in our aggregate cash distributions in the foreseeable future. In such situations, the holders of the incentive distribution rights may be experiencing, or may expect to experience, declines in the cash distributions they receive related to the incentive distribution rights and may therefore desire to be issued our common units, which are entitled to specified priorities with respect to our distributions and which therefore may be more advantageous for them to own in lieu of the right to receive incentive distribution payments based on target distribution levels that are less certain to be achieved. As a result, a reset election may cause our common unitholders to experience dilution in the amount of cash distributions that they would have otherwise received had we not issued new common units to the holders of the incentive distribution rights in connection with resetting the target distribution levels.
Our General Partner has certain incentive distribution rights that reduce the amount of our cash available for distribution to our common unitholders.
Our General Partner currently holds incentive distribution rights that entitle it to receive an increasing percentage (15%, 25% and 50%) of the cash that we distribute to our common unitholders from available cash after the minimum quarterly distribution and certain target distribution levels have been achieved. The maximum distribution right for our General Partner to receive 50% of any distributions paid to our common unitholders does not include any distributions that our General Partner or its affiliates may receive on common units that they own. Effective as of our quarterly cash distribution in the fourth quarter of 2017, our General Partner was at the top tier of the incentive distribution rights scale. Given that a higher percentage of our cash flows is allocated to our General Partner due to these incentive distribution rights, it may be more difficult for us to increase the amount of distributions to our unitholders and our cost of capital may be higher, making investments, capital
31
expenditures and acquisitions, and therefore, future growth, by us potentially more costly, and in some cases, potentially prohibitively so.
Holders of our common units have limited voting rights and are not entitled to elect our General Partner or its directors, which could reduce the price at which our common units will trade.
Compared to the holders of common stock in a corporation, unitholders have limited voting rights and, therefore, limited ability to influence management’s decisions regarding our business. Unitholders have no right on an annual or ongoing basis to elect our General Partner or its board of directors. The board of directors of our General Partner, including the independent directors, is chosen entirely by our sponsor, as a result of it owning our General Partner, and not by our unitholders. Unlike publicly traded corporations, we do not hold annual meetings of our unitholders to elect directors or consider other matters routinely addressed at annual meetings of stockholders of corporations. As a result of these limitations, the price at which the common units trade could be diminished because of the absence or reduction of a takeover premium in the trading price.
Even if holders of our common units are dissatisfied, they cannot currently remove our General Partner without our sponsor’s consent.
If our unitholders are dissatisfied with the performance of our General Partner, they have limited ability to remove our General Partner. Unitholders are currently unable to remove our General Partner without our sponsor’s consent because our sponsor and its affiliates own sufficient units to be able to prevent its removal. The vote of the holders of at least 66 2/3% of all outstanding common units is required to remove our General Partner. As of February 14, 2020, our sponsor owned approximately 40% of our common units. This condition would enable our sponsor to prevent the removal of our General Partner.
Our general partner interest or the control of our General Partner may be transferred to a third party without unitholder consent.
Our General Partner may transfer its general partner interest to a third party without the consent of our unitholders. Furthermore, our partnership agreement does not restrict the ability of the owner of our General Partner to transfer its membership interests in our General Partner to a third party. The new owner of our General Partner would then be in a position to replace the board of directors and executive officers of our General Partner with its own designees and thereby exert significant control over the decisions taken by the board of directors and executive officers of our General Partner. This effectively permits a “change of control” without the vote or consent of the unitholders.
The incentive distribution rights may be transferred to a third party without unitholder consent.
Our General Partner may transfer the incentive distribution rights to a third party at any time without the consent of our unitholders. If our General Partner transfers the incentive distribution rights to a third party, our General Partner would not have the same incentive to grow our partnership and increase quarterly distributions to unitholders over time. For example, a transfer of incentive distribution rights by our General Partner could reduce the likelihood of our sponsor accepting offers made by us relating to assets owned by our sponsor, as it would have less of an economic incentive to grow our business, which in turn would impact our ability to grow our asset base.
Our General Partner has a call right that may require unitholders to sell their common units at an undesirable time or price.
If at any time our General Partner and its affiliates own more than 80% of the common units, our General Partner will have the right, which it may assign to any of its affiliates or to us, but not the obligation, to acquire all, but not less than all, of the common units held by unaffiliated persons at a price equal to the greater of (1) the average of the daily closing price of the common units over the 20 trading days preceding the date three days before notice of exercise of the call right is first mailed and (2) the highest per‑unit price paid by our General Partner or any of its affiliates for common units during the 90‑day period preceding the date such notice is first mailed. As a result, unitholders may be required to sell their common units at an undesirable time or price and may not receive any return or a negative return on their investment. Unitholders may also incur a tax liability upon a sale of their units. Our General Partner is not obligated to obtain a fairness opinion regarding the value of the common units to be repurchased by it upon exercise of the call right. There is no restriction in our partnership agreement that prevents our General Partner from causing us to issue additional common units and then exercising its call right. If our General Partner exercised its call right, the effect would be to take us private and, if the units were subsequently deregistered, we would no longer be subject to the reporting requirements of the Exchange Act.
We may issue additional units without unitholder approval, which would dilute existing unitholder ownership interests.
Our partnership agreement does not limit the number of additional limited partner interests we may issue at any time without the approval of our unitholders. The issuance of additional common units or other equity interests of equal or senior rank will have the following effects:
32
• | our existing unitholders’ proportionate ownership interest in us will decrease; |
• | the amount of cash available for distribution on each unit may decrease; |
• | the ratio of taxable income to distributions may increase; |
• | the relative voting strength of each previously outstanding unit may be diminished; and |
• | the market price of the common units may decline. |
There are no limitations in our partnership agreement on our ability to issue units ranking senior to the common units.
In accordance with Delaware law and the provisions of our partnership agreement, we may issue additional partnership interests that are senior to the common units in right of distribution, liquidation and voting. The issuance by us of units of senior rank may (1) reduce or eliminate the amount of cash available for distribution to our common unitholders; (2) diminish the relative voting strength of the total common units outstanding as a class; or (3) subordinate the claims of the common unitholders to our assets in the event of our liquidation.
The market price of our common units could be adversely affected by sales of substantial amounts of our common units in the public or private markets, including sales by our sponsor or other large holders.
Our sponsor has registration rights with respect to the common units it currently holds. Sales by our sponsor or other large holders of a substantial number of our common units in the public markets, or the perception that such sales might occur, could have a material adverse effect on the price of our common units or could impair our ability to obtain capital through an offering of equity securities.
Our partnership agreement restricts the voting rights of unitholders owning 20% or more of our common units.
Our partnership agreement restricts unitholders’ voting rights by providing that any units held by a person or group that owns 20% or more of any class of units then outstanding, other than our General Partner and its affiliates, their transferees and persons who acquired such units with the prior approval of the board of directors of our General Partner, cannot vote on any matter.
Cost reimbursements due to our General Partner and its affiliates for services provided to us or on our behalf will reduce cash available for distribution to our unitholders. The amount and timing of such reimbursements will be determined by our General Partner.
Under the MSAs, we are obligated to reimburse our sponsor for all direct or indirect costs and expenses incurred by, or chargeable to, our sponsor in connection with its provision of services necessary for the operation of our business. If the MSAs were terminated without replacement, or our General Partner or its affiliates provided services outside of the scope of the MSAs, our partnership agreement would require us to reimburse our General Partner and its affiliates for all expenses they incur and payments they make on our behalf. Our partnership agreement does not set a limit on the amount of expenses for which our General Partner and its affiliates may be reimbursed. These expenses include salary, bonus, incentive compensation and other amounts paid to persons who perform services for us or on our behalf and expenses allocated to our General Partner by its affiliates. Our partnership agreement provides that our General Partner determines the expenses that are allocable to us. The reimbursement of expenses and payment of fees, if any, to our General Partner and its affiliates will reduce the amount of cash available for distribution to our unitholders.
The price of our common units may fluctuate significantly and unitholders could lose all or part of their investment.
The market price of our common units may be influenced by many factors, some of which are beyond our control, including:
• | our quarterly distributions; |
• | our quarterly or annual earnings or those of other companies in our industry; |
• | announcements by us or our competitors of significant contracts or acquisitions; |
• | changes in accounting standards, policies, guidance, interpretations or principles; |
• | general economic conditions; |
33
• | the failure of securities analysts to cover our common units or changes in financial estimates by analysts; |
• | future sales of our common units; and |
• | the other factors described in these “Risk Factors.” |
Unitholders may have liability to repay distributions.
Under certain circumstances, unitholders may have to repay amounts wrongfully returned or distributed to them. Under Section 17‑607 of the Delaware Revised Uniform Limited Partnership Act, we may not make a distribution to our unitholders if the distribution would cause our liabilities to exceed the fair value of our assets. Delaware law provides that for a period of three years from the date of the impermissible distribution, limited partners who received the distribution and who knew at the time of the distribution that it violated Delaware law will be liable to us for the distribution amount. Liabilities to partners on account of their partnership interests and liabilities that are non‑recourse to us are not counted for purposes of determining whether a distribution is permitted.
We will no longer qualify as an “emerging growth company” as of December 31, 2020 and will be required to comply with certain provisions of the Sarbanes-Oxley Act and can no longer take advantage of reduced disclosure requirements.
For as long as we remain an emerging growth company, we are able to take advantage of certain exemptions from various reporting requirements that are applicable to other public companies that are not emerging growth companies including not being required to comply with the auditor attestation requirements of Section 404 of the Sarbanes-Oxley Act and reduced disclosure obligations regarding executive compensation in our annual report on Form 10-K. We will no longer qualify for such status as of December 31, 2020 and, as a result, we expect to incur additional expenses and devote substantial management effort toward ensuring compliance with the requirements applicable to companies that are not emerging growth companies.
The New York Stock Exchange (the “NYSE”) does not require a publicly traded partnership like us to comply with certain of its corporate governance requirements.
Our common units are listed on the NYSE. Because we are a publicly traded partnership, the NYSE does not require us to have a majority of independent directors on our General Partner’s board of directors or to establish a compensation committee or a nominating and corporate governance committee. Accordingly, unitholders do not have the same protections afforded to certain corporations that are subject to all of the NYSE corporate governance requirements. Please read Part III, Item 10. “Directors, Executive Officers and Corporate Governance—Director Independence.”
Tax Risks to Common Unitholders
Our tax treatment depends on our status as a partnership for federal income tax purposes and not being subject to a material amount of entity‑level taxation. If the Internal Revenue Service (“IRS”) were to treat us as a corporation for federal income tax purposes, or we become subject to entity‑level taxation for state tax purposes, our cash available for distribution to our unitholders would be substantially reduced.
The anticipated after‑tax economic benefit of an investment in our common units depends largely on our being treated as a partnership for federal income tax purposes.
Despite the fact that we are organized as a limited partnership under Delaware law, we would be treated as a corporation for U.S. federal income tax purposes unless we satisfy a “qualifying income” requirement. Based upon our current operations and current Treasury Regulations, we believe we satisfy the qualifying income requirement. We have requested and obtained a favorable private letter ruling from the IRS to the effect that, based on facts presented in the private letter ruling request, our income from processing timber feedstocks into pellets and transporting, storing, marketing and distributing such timber feedstocks and wood pellets constitute “qualifying income” within the meaning of Section 7704 of the Internal Revenue Code of 1986 (the “Code”). However, no ruling has been, and we expect none will be, requested regarding our treatment as a partnership for U.S. federal income tax purposes. Failing to meet the qualifying income requirement or a change in current law could cause us to be treated as a corporation for U.S. federal income tax purposes or otherwise subject us to taxation as an entity.
If we were treated as a corporation for federal income tax purposes, we would pay U.S. federal income tax on our taxable income at the corporate tax rate. Distributions to our unitholders would generally be taxed again as corporate distributions, and no income, gains, losses or deductions would flow through to our unitholders. Because a tax would be imposed on us as a corporation, our cash available for distribution to our unitholders would be substantially reduced. Therefore, treatment of us as a corporation would result in a material reduction in the anticipated cash flow and after‑tax return to the unitholders, likely causing a substantial reduction in the value of our common units.
34
Our partnership agreement provides that if a law is enacted or existing law is modified or interpreted in a manner that subjects us to taxation as a corporation or otherwise subjects us to entity‑level taxation for U.S. federal, state or local or foreign income tax purposes, the minimum quarterly distribution amount and the target distribution amounts may be adjusted to reflect the impact of that law or interpretation on us. At the state level, several states have been evaluating ways to subject partnerships to entity‑level taxation through the imposition of state income, franchise or other forms of taxation. Specifically, we currently own assets and conduct business in Mississippi, North Carolina, Florida and Virginia, each of which imposes a margin or franchise tax. In the future, we may expand our operations. Imposition of a similar tax on us in other jurisdictions that we may expand to could substantially reduce our cash available for distribution to our unitholders.
The tax treatment of publicly traded partnerships or an investment in our units could be subject to potential legislative, judicial or administrative changes or differing interpretations, possibly applied on a retroactive basis.
The present U.S. federal income tax treatment of publicly traded partnerships, including us, or an investment in our common units may be modified by administrative, legislative or judicial changes or differing interpretations at any time. From time to time, members of Congress propose and consider substantive changes to the existing U.S. federal income tax laws that affect publicly traded partnerships. Although there is no current legislative proposal to eliminate the qualifying income exception upon which we rely for our treatment as a partnership for U.S. federal income tax purposes, current and former legislative proposals would have eliminated the qualifying income exception for publicly traded partnerships relying on qualifying income from fossil fuel activities. In addition, the Treasury Department has issued, and in the future may issue, regulations interpreting those laws that affect publicly traded partnerships. We believe we qualify as a partnership for U.S. federal income tax purposes under current regulations.
However, any modification to the U.S. federal income tax laws may be applied retroactively and could make it more difficult or impossible for us to meet the exception for certain publicly traded partnerships to be treated as partnerships for U.S. federal income tax purposes. We are unable to predict whether any of these changes or other proposals will ultimately be enacted. Any similar or future legislative changes could increase our entity-level tax burden and negatively impact the value of an investment in our common units. You are urged to consult with your own tax advisor with respect to the status of regulatory or administrative developments and proposals and their potential effect on your investment in our common units.
If the IRS were to contest the federal income tax positions we take, it may adversely impact the market for our common units, and the costs of any such contest would reduce cash available for distribution to our unitholders.
We have requested and obtained a favorable private letter ruling from the IRS to the effect that, based on facts presented in the private letter ruling request, our income from processing timber feedstocks into pellets and transporting, storing, marketing and distributing such timber feedstocks and wood pellets will constitute “qualifying income” within the meaning of Section 7704 of the Code. However, no ruling has been, and we expect none will be, requested regarding our treatment as a partnership for U.S. federal income tax purposes. The IRS may adopt positions that differ from the positions we take. It may be necessary to resort to administrative or court proceedings to sustain some or all of the positions we take. A court may not agree with some or all of the positions we take. Any contest with the IRS may materially and adversely impact the market for our common units and the price at which they trade. Moreover, the costs of any contest between us and the IRS will result in a reduction in cash available for distribution to our unitholders and thus will be borne indirectly by our unitholders.
If the IRS makes audit adjustments to our income tax returns for tax years beginning after December 31, 2017, it (and some states) may assess and collect any taxes (including any applicable penalties and interest) resulting from such audit adjustments directly from us, in which case we may require our unitholders and former unitholders to reimburse us for such taxes (including any applicable penalties or interest) or, if we are required to bear such payments, our cash available for distribution to our unitholders might be substantially reduced.
Pursuant to the Bipartisan Budget Act of 2015, for tax years beginning after December 31, 2017, if the IRS makes audit adjustments to our income tax returns, it (and some states) may assess and collect any taxes (including any applicable penalties and interest) resulting from such audit adjustment directly from us. To the extent possible under the new rules, our General Partner may elect to either pay the taxes (including any applicable penalties and interest) directly to the IRS or, if we are eligible, issue a revised information statement to each unitholder and former unitholder with respect to an audited and adjusted return, which statement reports the items adjusted and certain other amounts. Although our General Partner may elect to have our unitholders and former unitholders take such audit adjustment into account and pay any resulting taxes (including applicable penalties and interest) in accordance with their interests in us during the tax year under audit, there can be no assurance that such election will be practical, permissible or effective in all circumstances. As a result, our current unitholders may bear some or all of the tax liability resulting from such audit adjustment, even if such unitholders did not own units in us during the tax year under audit. If, as a result of any such audit adjustment, we are required to make payments of taxes, penalties and interest, we may require our unitholders and former unitholders to reimburse us for such taxes (including any applicable penalties or interest) or, if we are required to bear such payments, our cash available for distribution to our
35
unitholders might be substantially reduced. These rules are not applicable for tax years beginning on or prior to December 31, 2017.
Even if unitholders do not receive any cash distributions from us, unitholders will be required to pay taxes on their share of our taxable income.
Unitholders are required to pay federal income taxes and, in some cases, state and local income taxes, on unitholders’ share of our taxable income, whether or not they receive cash distributions from us. For example, if we sell assets and use the proceeds to repay existing debt or fund capital expenditures, you may be allocated taxable income and gain resulting from the sale, and our cash available for distribution would not increase. Similarly, taking advantage of opportunities to reduce our existing debt, such as debt exchanges, debt repurchases, or modifications of our existing debt could result in “cancellation of indebtedness income” being allocated to our unitholders as taxable income without any increase in our cash available for distribution. Unitholders may not receive cash distributions from us equal to their share of our taxable income or even equal to the actual tax due from them with respect to that income.
A tax gain or loss on the disposition of our common units could be more or less than unitholders expect.
If unitholders sell their common units, they will recognize a gain or loss equal to the difference between the amount realized and their tax basis in those common units. Because distributions in excess of unitholders’ allocable share of our net taxable income decrease their tax basis in their common units, the amount, if any, of such prior excess distributions with respect to the units unitholders sell will, in effect, become taxable income to our unitholders if they sell such units at a price greater than their tax basis in those units, even if the price they receive is less than their original cost. In addition, because the amount realized includes a unitholder’s share of our nonrecourse liabilities, if they sell their units, unitholders may incur a tax liability in excess of the amount of cash they receive from the sale.
Furthermore, a substantial portion of the amount realized, whether or not representing gain, may be taxed as ordinary income due to potential recapture items, including depreciation recapture. Thus, you may recognize both ordinary income and capital loss from the sale of your units if the amount realized on a sale of your units is less than your adjusted basis in the units. Net capital loss may only offset capital gains and, in the case of individuals, up to $3,000 of ordinary income per year. In the taxable period in which you sell your units, you may recognize ordinary income from our allocations of income and gain to you prior to the sale and from recapture items that generally cannot be offset by any capital loss recognized upon the sale of units.
Tax-exempt entities face unique tax issues from owning our common units that may result in adverse tax consequences to them.
Investment in common units by tax-exempt entities, such as employee benefit plans and individual retirement accounts (known as IRAs), raises issues unique to them. For example, virtually all of our income allocated to organizations that are exempt from federal income tax, including IRAs and other retirement plans, will be unrelated business taxable income and will be taxable to them. Further, with respect to taxable years beginning after December 31, 2017, subject to the proposed aggregation rules for certain similarly situated businesses or activities issued by the Treasury Department, a tax-exempt entity with more than one unrelated trade or business (including by attribution from investment in a partnership such as ours that is engaged in one or more unrelated trade or business) is required to compute the unrelated business taxable income of such tax-exempt entity separately with respect to each such trade or business (including for purposes of determining any net operating loss deduction). As a result, for years beginning after December 31, 2017, it may not be possible for tax-exempt entities to utilize losses from an investment in our partnership to offset unrelated business taxable income from another unrelated trade or business and vice versa. Any tax‑exempt entity should consult its tax advisor before investing in our common units.
Unitholders may be subject to limitation on their ability to deduct interest expense incurred by us.
Historically, we have been entitled to a full deduction for interest paid or accrued on indebtedness properly allocable to our trade or business during our taxable year. However, under the Tax Cuts and Jobs Act signed into law in December 2017, for taxable years beginning after December 31, 2017, our deduction for “business interest” is limited to the sum of our business interest income and 30% of our “adjusted taxable income.” For the purposes of this limitation, our adjusted taxable income is computed without regard to any business interest expense or business interest income, and in the case of taxable years beginning before January 1, 2022, any deduction allowable for depreciation, amortization or depletion to the extent such depreciation, amortization or depletion is not capitalized into cost of goods sold with respect to inventory. As a result, we expect that a substantial portion of our business interest deduction may be limited.
36
Non-U.S. Unitholders will be subject to U.S. taxes and withholding with respect to their income and gain from owning our units.
Non-U.S. unitholders are generally taxed and subject to income tax filing requirements by the United States on income effectively connected with a U.S. trade or business (“effectively connected income”). Income allocated to our unitholders and any gain from the sale of our units will generally be considered to be “effectively connected” with a U.S. trade or business. As a result, distributions to a non-U.S. unitholder will be subject to withholding at the highest applicable effective tax rate and a non-U.S. unitholder who sells or otherwise disposes of a unit will also be subject to U.S. federal income tax on the gain realized from the sale or disposition of such unit.
Moreover, the transferee of an interest in a partnership that is engaged in a U.S. trade or business is generally required to withhold 10% of the amount realized by the transferor unless the transferor certifies that it is not a foreign person, and we are required to deduct and withhold from the transferee amounts that should have been withheld by the transferees but were not withheld. Because the “amount realized” includes a partner’s share of our liabilities, 10% of the amount realized could exceed the total cash purchase price for the units. However, pending the issuance of final regulations, the IRS has suspended the application of this withholding rule to transfers of publicly traded interests in publicly traded partnerships. If recently promulgated regulations are finalized as proposed, such regulations would provide, with respect to transfers of publicly traded interests in publicly traded partnerships effected through a broker, that the obligation to withhold is imposed on the transferor’s broker and that a partner’s “amount realized” does not include a partner’s share of a publicly traded partnership’s liabilities for purposes of determining the amount subject to withholding. However, it is not clear when such regulations will be finalized and if they will be finalized in their current form.
We treat each purchaser of our common units as having the same tax benefits without regard to the actual common units purchased. The IRS may challenge this treatment, which could adversely affect the value of the common units.
Because we cannot match transferors and transferees of common units, we have adopted certain methods for allocating depreciation and amortization deductions that may not conform to all aspects of existing Treasury Regulations. A successful IRS challenge to the use of those methods could adversely affect the amount of tax benefits available to our unitholders. It also could affect the timing of these tax benefits or the amount of gain from our unitholders’ sale of common units and could have a negative impact on the value of our common units or result in audit adjustments to their tax returns.
We generally prorate our items of income, gain, loss and deduction between transferors and transferees of our units each month based upon the ownership of our units on the first day of each month, instead of on the basis of the date a particular unit is transferred. The IRS may challenge this treatment, which could change the allocation of items of income, gain, loss and deduction among our unitholders.
We generally prorate our items of income, gain, loss and deduction between transferors and transferees of our units each month based upon the ownership of our units on the first day of each month (the “Allocation Date”), instead of on the basis of the date a particular unit is transferred. Similarly, we generally allocate certain deductions for depreciation of capital additions, gain or loss realized on a sale or other disposition of our assets and, in the discretion of our General Partner, any other extraordinary item of income, gain, loss or deduction based upon ownership on the Allocation Date. Treasury Regulations allow a similar monthly simplifying convention, but such regulations do not specifically authorize all aspects of our proration method. If the IRS were to challenge our proration method, we may be required to change the allocation of items of income, gain, loss and deduction among our unitholders.
A unitholder whose units are the subject of a securities loan (e.g., a loan to a “short seller” to cover a short sale of units) may be considered as having disposed of those units. If so, he would no longer be treated for tax purposes as a partner with respect to those units during the period of the loan and may recognize gain or loss from the disposition.
Because there are no specific rules governing the U.S. federal income tax consequence of loaning a partnership interest, a unitholder whose units are the subject of a securities loan may be considered as having disposed of the loaned units. In that case, the unitholder may no longer be treated for tax purposes as a partner with respect to those units during the period of the loan to the short seller and the unitholder may recognize gain or loss from such disposition. Moreover, during the period of the loan, any of our income, gain, loss or deduction with respect to those units may not be reportable by the unitholder and any cash distributions received by the unitholder as to those units could be fully taxable as ordinary income. Unitholders desiring to assure their status as partners and avoid the risk of gain recognition from a securities loan are urged to consult a tax advisor to determine whether it is advisable to modify any applicable brokerage account agreements to prohibit their brokers from borrowing their units.
37
We have adopted certain valuation methodologies in determining a unitholder’s allocations of income, gain, loss and deduction. The IRS may challenge these methodologies or the resulting allocations, which could adversely affect the value of the common units.
In determining the items of income, gain, loss and deduction allocable to our unitholders, we must routinely determine the fair market value of our assets. Although we may, from time to time, consult with professional appraisers regarding valuation matters, we make many fair market value estimates using a methodology based on the market value of our common units as a means to measure the fair market value of our assets. The IRS may challenge these valuation methods and the resulting allocations of income, gain, loss and deduction.
A successful IRS challenge to these methods or allocations could adversely affect the timing or amount of taxable income or loss being allocated to our unitholders. It also could affect the amount of gain from our unitholders’ sale of common units and could have a negative impact on the value of the common units or result in audit adjustments to our unitholders’ tax returns without the benefit of additional deductions.
Our unitholders will likely be subject to state and local taxes and income tax return filing requirements in jurisdictions where they do not live as a result of investing in our common units.
In addition to U.S. federal income taxes, our unitholders may be subject to other taxes, including foreign, state and local taxes, unincorporated business taxes and estate, inheritance or intangible taxes that are imposed by the various jurisdictions in which we conduct business or own property now or in the future, even if they do not live in any of those jurisdictions. Our unitholders will likely be required to file foreign, state and local income tax returns and pay state and local income taxes in some or all of these various jurisdictions. Further, our unitholders may be subject to penalties for failure to comply with those requirements.
We currently own assets in multiple states. Many of these states currently impose a personal income tax on individuals, corporations and other entities. As we make acquisitions or expand our business, we may own assets or conduct business in additional states that impose a personal income tax. It is our unitholders’ responsibility to file all U.S. federal, foreign, state and local tax returns and pay any resulting taxes due in these jurisdictions. Unitholders should consult with their own tax advisors regarding the filing of such tax returns, the payment of such taxes, and the deductibility of any such taxes paid.
38
ITEM 1B. UNRESOLVED STAFF COMMENTS
None.
ITEM 2. | PROPERTIES |
Information regarding our properties is contained in Part I, Item 1. “Business” and Part II, Item 7. “Management’s Discussion and Analysis of Financial Condition and Results of Operations.”
ITEM 3. | LEGAL PROCEEDINGS |
Although we may, from time to time, be involved in litigation and claims arising out of our operations in the normal course of business, we do not believe that we are a party to any litigation that will have a material adverse impact on our financial condition or results of operations.
ITEM 4. | MINE SAFETY DISCLOSURES |
Not applicable.
39
PART II
ITEM 5. | MARKET FOR REGISTRANT’S COMMON EQUITY, RELATED STOCKHOLDER MATTERS AND ISSUER PURCHASES OF EQUITY SECURITIES |
Market Information
Our common units representing limited partner interests in the Partnership (“common units”) are traded on the New York Stock Exchange (“NYSE”) under the symbol “EVA.”
As of February 14, 2020, there were 33,605,138 common units outstanding held by six unitholders of record. Because many of our common units are held by brokers and other institutions on behalf of unitholders, we are unable to estimate the total number of unitholders represented by these unitholders of record. As of February 14, 2020 our sponsor held approximately 40% of the common units.
Cash Distribution Policy
General
Our partnership agreement provides that our General Partner will make a determination as to whether to make a distribution, but our partnership agreement does not require us to pay distributions at any time or in any amount. Instead, the board of directors of our General Partner adopted a cash distribution policy that sets forth our General Partner’s intention with respect to the distributions to be made to unitholders. Pursuant to our cash distribution policy, within 60 days after the end of each quarter, we intend to distribute to the holders of common units on a quarterly basis at least the minimum quarterly distribution of $0.4125 per unit, or $1.65 on an annualized basis, to the extent we have sufficient cash after establishment of cash reserves and payment of fees and expenses, including payments to our General Partner and its affiliates.
The board of directors of our General Partner may change the foregoing distribution policy at any time and from time to time, and even if our cash distribution policy is not modified or revoked, the amount of distributions paid under our policy and the decision to make any distribution is determined by our General Partner. Our partnership agreement does not contain a requirement for us to pay distributions to our unitholders, and there is no guarantee that we will pay any specific distribution level, or any distribution, on the units in any quarter. However, our partnership agreement does contain provisions intended to motivate our General Partner to make steady, increasing and sustainable distributions over time.
Please read Part II, Item 7. “Management’s Discussion and Analysis of Financial Condition and Results of Operations—Liquidity and Capital Resources—Senior Secured Revolving Credit Facility” for a discussion of the provisions included in our senior secured revolving credit facility that may restrict our ability to pay distributions to our unitholders.
General Partner Interest and Incentive Distribution Rights
Our General Partner owns a non-economic general partner interest in us, which does not entitle it to receive cash distributions. However, our General Partner owns the incentive distribution rights and may in the future own common units or other equity interests in us and will be entitled to receive distributions on any such interests.
Incentive distribution rights represent the right to receive increasing percentages (15.0%, 25.0% and 50.0%) of quarterly distributions from operating surplus after the minimum quarterly distribution and the target distribution levels have been achieved. Our General Partner currently holds all of the incentive distribution rights, but may transfer these rights separately from its general partner interest.
Securities Authorized for Issuance under Equity Compensation Plans
Please read Part III, Item 12. “Security Ownership of Certain Beneficial Owners and Management and Related Stockholder Matters” for information regarding our equity compensation plans.
40
ITEM 6. SELECTED FINANCIAL DATA
The following table presents our selected historical financial data, for the periods and as of the dates indicated, for us and for Enviva, LP and its subsidiaries. The selected statement of operations and statements of cash flow data for the years ended December 31, 2019, 2018 and 2017 and the balance sheet data as of December 31, 2019 and 2018 are derived from our audited consolidated financial statements included in Item 8—Financial Statements and Supplementary Data of this Annual Report. On January 1, 2018, we adopted Accounting Standards Codification Topic 606, Revenue from Contracts with Customers using the modified retrospective method; as such, prior period amounts were not adjusted.
Year Ended December 31, | |||||||||||||||||||
2019 | 2018 | 2017 | 2016 | 2015 | |||||||||||||||
(in thousands, except per metric ton and operating data and per unit data) | |||||||||||||||||||
Statement of Operations Data: | |||||||||||||||||||
Product sales | $ | 674,251 | $ | 564,010 | $ | 522,250 | $ | 444,489 | $ | 450,980 | |||||||||
Other revenue (1) | 10,142 | 9,731 | 20,971 | 19,787 | 6,394 | ||||||||||||||
Net revenue | 684,393 | 573,741 | 543,221 | 464,276 | 457,374 | ||||||||||||||
Costs of goods sold, excluding depreciation and amortization (1) | 549,701 | 461,735 | 419,616 | 357,418 | 365,061 | ||||||||||||||
Loss on disposal of assets | 3,103 | 2,386 | 4,899 | 2,386 | 2,081 | ||||||||||||||
Depreciation and amortization | 50,521 | 40,179 | 39,904 | 27,700 | 30,692 | ||||||||||||||
Total cost of goods sold | 603,325 | 504,300 | 464,419 | 387,504 | 397,834 | ||||||||||||||
Gross margin | 81,068 | 69,441 | 78,802 | 76,772 | 59,540 | ||||||||||||||
General and administrative expenses | 11,897 | 10,545 | 14,975 | 15,862 | 7,335 | ||||||||||||||
Related-party management services agreement fee | 24,492 | 17,096 | 15,132 | 17,236 | 16,587 | ||||||||||||||
Disposal and impairment of assets held for sale | — | — | 827 | 9,991 | — | ||||||||||||||
Total general and administrative expenses | 36,389 | 27,641 | 30,934 | 43,089 | 23,922 | ||||||||||||||
Income from operations | 44,679 | 41,800 | 47,868 | 33,683 | 35,618 | ||||||||||||||
Other income (expense): | |||||||||||||||||||
Interest expense | (39,344 | ) | (36,471 | ) | (31,744 | ) | (15,643 | ) | (10,558 | ) | |||||||||
Related-party interest expense | — | — | — | (578 | ) | (1,154 | ) | ||||||||||||
Early retirement of debt obligation | (9,042 | ) | (751 | ) | — | (4,438 | ) | (4,699 | ) | ||||||||||
Other income (expense) | 764 | 2,374 | (1,751 | ) | 439 | 979 | |||||||||||||
Total other expense, net | (47,622 | ) | (34,848 | ) | (33,495 | ) | (20,220 | ) | (15,432 | ) | |||||||||
(Loss) income before income tax expense | (2,943 | ) | 6,952 | 14,373 | 13,463 | 20,186 | |||||||||||||
Income tax expense | — | — | — | — | 2,623 | ||||||||||||||
Net (loss) income | (2,943 | ) | 6,952 | 14,373 | 13,463 | 17,563 | |||||||||||||
Less net loss attributable to noncontrolling partners’ interests | — | — | 3,140 | 5,804 | 2,859 | ||||||||||||||
Net (loss) income attributable to Enviva Partners, LP | $ | (2,943 | ) | $ | 6,952 | $ | 17,513 | $ | 19,267 | $ | 20,422 | ||||||||
Less: Predecessor loss to May 4, 2015 (prior to IPO) | $ | — | $ | — | $ | — | $ | — | $ | (2,132 | ) | ||||||||
Less: Pre-acquisition income from April 10, 2015 to December 10, 2015 from operations of Enviva Pellets Southampton, LLC Drop-Down allocated to General Partner | — | — | — | — | 6,264 | ||||||||||||||
Less: Pre-acquisition loss from inception to December 13, 2016 from operations of Enviva Pellets Sampson, LLC Drop-Down allocated to General Partner | — | — | — | (3,231 | ) | (1,815 | ) | ||||||||||||
Less: Pre-acquisition loss from inception to October 1, 2017 from operations of Enviva Port of Wilmington, LLC Drop-Down allocated to General Partner | — | — | (3,049 | ) | (2,110 | ) | (937 | ) | |||||||||||
Enviva Partners, LP partners’ interest in net (loss) income | $ | (2,943 | ) | $ | 6,952 | $ | 20,562 | $ | 24,608 | $ | 19,042 | ||||||||
Net (loss) income per limited partner common unit: | |||||||||||||||||||
Basic | $ | (0.54 | ) | $ | 0.04 | $ | 0.65 | $ | 0.95 | $ | 0.80 | ||||||||
Diluted | $ | (0.54 | ) | $ | 0.04 | $ | 0.61 | $ | 0.91 | $ | 0.79 | ||||||||
Net income per limited partner subordinated unit: | |||||||||||||||||||
Basic | $ | — | $ | 0.04 | $ | 0.65 | $ | 0.93 | $ | 0.80 | |||||||||
Diluted | $ | — | $ | 0.04 | $ | 0.65 | $ | 0.93 | $ | 0.79 | |||||||||
(1) See Part II, Item 8. “Financial Statements and Supplementary Data—Note 15, Related-Party Transactions” | |||||||||||||||||||
41
Year Ended December 31, | |||||||||||||||||||
2019 | 2018 | 2017 | 2016 | 2015 | |||||||||||||||
(in thousands, except per metric ton and operating data and per unit data) | |||||||||||||||||||
Statement of Cash Flow Data: | |||||||||||||||||||
Net cash provided by (used in): | |||||||||||||||||||
Operating activities | $ | 53,860 | $ | 84,053 | $ | 87,095 | $ | 55,804 | $ | 65,857 | |||||||||
Investing activities | (177,483 | ) | (26,002 | ) | (28,601 | ) | (111,124 | ) | (103,490 | ) | |||||||||
Financing activities | 130,216 | (56,115 | ) | (58,436 | ) | 53,658 | 39,173 | ||||||||||||
Other Financial Data: | |||||||||||||||||||
Adjusted net income(1) | $ | 33,388 | $ | 22,221 | $ | 14,373 | $ | 17,901 | $ | 22,262 | |||||||||
Adjusted gross margin per metric ton(1) | 42.54 | 38.81 | 45.38 | 45.55 | 38.89 | ||||||||||||||
Adjusted EBITDA(1) | 141,275 | 102,631 | 102,381 | 79,291 | 71,710 | ||||||||||||||
Maintenance capital expenditures(2) | 6,922 | 4,872 | 4,353 | 5,187 | 4,359 | ||||||||||||||
Distributable cash flow(1) | 98,460 | 63,789 | 67,731 | 59,775 | 57,245 | ||||||||||||||
Operating Data: | |||||||||||||||||||
Total metric tons sold | 3,564 | 2,983 | 2,724 | 2,346 | 2,374 | ||||||||||||||
Balance Sheet Data (at period end): | |||||||||||||||||||
Cash and cash equivalents | $ | 9,053 | $ | 2,460 | $ | 524 | $ | 466 | $ | 2,128 | |||||||||
Total assets | 994,818 | 748,770 | 760,111 | 801,376 | 688,209 | ||||||||||||||
Long-term debt and finance lease obligations (including current portion) | 603,020 | 432,655 | 401,017 | 351,080 | 207,632 | ||||||||||||||
Total liabilities | 762,242 | 602,054 | 549,742 | 424,514 | 266,539 | ||||||||||||||
Partners’ capital | 232,576 | 146,716 | 210,369 | 376,862 | 421,670 | ||||||||||||||
(1) | For more information, please read “Limitations of Non-GAAP Financial Measures” below and Part II, Item 7. “Management’s Discussion and Analysis of Financial Condition and Results of Operations—How We Evaluate Our Operations.” |
(2) | Maintenance capital expenditures are cash expenditures incurred to maintain our long-term operating income or operating capacity. |
Limitations of Non-GAAP Financial Measures
Adjusted net income, adjusted gross margin per metric ton, adjusted EBITDA and distributable cash flow are not financial measures presented in accordance with accounting principles generally accepted in the United States (“GAAP”). We believe that the presentation of these non-GAAP financial measures provides useful information to investors in assessing our financial condition and results of operations. Our non-GAAP financial measures should not be considered as alternatives to the most directly comparable GAAP financial measures. Each of these non-GAAP financial measures has important limitations as an analytical tool because they exclude some, but not all, items that affect the most directly comparable GAAP financial measures. You should not consider adjusted net income, adjusted gross margin per metric ton, adjusted EBITDA or distributable cash flow in isolation or as substitutes for analysis of our results as reported under GAAP.
Our definitions of these non-GAAP financial measures may not be comparable to similarly titled measures of other companies, thereby diminishing their utility.
Adjusted Net Income
We define adjusted net income as net income excluding certain expenses incurred related to a fire that occurred at our Chesapeake terminal on February 27, 2018 (the “Chesapeake Incident”) and Hurricanes Florence and Michael (the “Hurricane Events”), which occurred during the second half of 2018, consisting of emergency response expenses, expenses related to the disposal of inventory, and asset disposal and repair costs, offset by insurance recoveries received, as well as employee compensation and other related costs allocated to us in respect of the Chesapeake Incident and Hurricane Events pursuant to our management services agreement with an affiliate of our sponsor for services that could otherwise have been dedicated to our ongoing operations, certain non-cash waivers of fees for management services provided to us by our sponsor (collectively, the “MSA Fee Waivers”), interest expense associated with incremental borrowings related to the Chesapeake Incident and Hurricane Events, and early retirement of debt obligation and including certain sales and marketing, scheduling, sustainability, consultation, shipping and risk management services (collectively, the “Commercial Services”). We believe that adjusted net
42
income enhances investors’ ability to compare the past financial performance of our underlying operations with our current performance separate from certain items of gain or loss that we characterize as unrepresentative of our ongoing operations.
Adjusted Gross Margin per Metric Ton
We define adjusted gross margin per metric ton as gross margin per metric ton excluding asset disposals, depreciation and amortization, changes in unrealized derivative instruments related to hedged items included in gross margin, MSA Fee Waivers, certain items of income or loss that we characterize as unrepresentative of our ongoing operations, including certain expenses incurred related to the Chesapeake Incident and Hurricane Events, consisting of emergency response expenses, expenses related to the disposal of inventory, and asset disposal and repair costs, offset by insurance recoveries received, as well as employee compensation and other related costs allocated to us in respect of the Chesapeake Incident and the Hurricane Events pursuant to our management services agreement with an affiliate of our sponsor for services that could otherwise have been dedicated to our ongoing operations, and acquisition costs and including the Commercial Services. We believe adjusted gross margin per metric ton is a meaningful measure because it compares our revenue-generating activities to our operating costs for a view of profitability and performance on a per metric ton basis. Adjusted gross margin per metric ton will primarily be affected by our ability to meet targeted production volumes and to control direct and indirect costs associated with procurement and delivery of wood fiber to our production plants and the production and distribution of wood pellets.
Adjusted EBITDA
We define adjusted EBITDA as net (loss) income excluding depreciation and amortization, interest expense, income tax expense, early retirement of debt obligations, MSA Fee Waivers, non-cash unit compensation expense, asset impairments and disposals, changes in unrealized derivative instruments related to hedged items included in gross margin and other income and expense, certain items of income or loss that we characterize as unrepresentative of our ongoing operations, including certain expenses incurred related to the Chesapeake Incident and Hurricane Events, consisting of emergency response expenses, expenses related to the disposal of inventory, and asset disposal and repair costs, offset by insurance recoveries received, as well as employee compensation and other related costs allocated to us in respect of the Chesapeake Incident and Hurricane Events pursuant to our management services agreement with an affiliate of our sponsor for services that could otherwise have been dedicated to our ongoing operations, and acquisition costs and including the Commercial Services. Adjusted EBITDA is a supplemental measure used by our management and other users of our financial statements, such as investors, commercial banks and research analysts, to assess the financial performance of our assets without regard to financing methods or capital structure.
Distributable Cash Flow
We define distributable cash flow as adjusted EBITDA less maintenance capital expenditures and interest expense net of amortization of debt issuance costs, debt premium, original issue discounts, interest expense on the redemption of our 8.5% senior unsecured notes due 2021 (the “2021 Notes”) and the impact from incremental borrowings related to the Chesapeake Incident and Hurricane Events. We use distributable cash flow as a performance metric to compare the cash-generating performance of the Partnership from period to period and to compare the cash-generating performance for specific periods to the cash distributions (if any) that are expected to be paid to our unitholders. We do not rely on distributable cash flow as a liquidity measure.
The following tables present a reconciliation of each of adjusted net income, adjusted gross margin per metric ton, adjusted EBITDA and distributable cash flow to the most directly comparable GAAP financial measure for each of the periods indicated.
Year Ended December 31, | |||||||||||||||||||
2019 | 2018 | 2017 | 2016 | 2015 | |||||||||||||||
(in thousands) | |||||||||||||||||||
Reconciliation of net (loss) income to adjusted net income: | |||||||||||||||||||
Net (loss) income | $ | (2,943 | ) | $ | 6,952 | $ | 14,373 | $ | 13,463 | $ | 17,563 | ||||||||
Chesapeake Incident and Hurricane Events | (1,155 | ) | 12,951 | — | — | — | |||||||||||||
MSA Fee Waivers | 22,600 | — | — | — | — | ||||||||||||||
Interest expense from incremental borrowings related to Chesapeake Incident and Hurricane Events | 1,705 | 1,567 | — | — | — | ||||||||||||||
Early retirement of debt obligation | 9,042 | 751 | — | 4,438 | 4,699 | ||||||||||||||
Commercial Services | 4,139 | — | — | — | — | ||||||||||||||
Adjusted net income | $ | 33,388 | $ | 22,221 | $ | 14,373 | $ | 17,901 | $ | 22,262 | |||||||||
43
Year Ended December 31, | |||||||||||||||||||
2019 | 2018 | 2017 | 2016 | 2015 | |||||||||||||||
(in thousands, except per metric ton) | |||||||||||||||||||
Reconciliation of gross margin to adjusted gross margin per metric ton: | |||||||||||||||||||
Gross margin | $ | 81,068 | $ | 69,441 | $ | 78,802 | $ | 76,772 | $ | 59,540 | |||||||||
Loss on disposal of assets | 3,103 | 2,386 | 4,899 | 2,386 | 2,081 | ||||||||||||||
Depreciation and amortization | 50,521 | 40,179 | 39,904 | 27,700 | 30,692 | ||||||||||||||
Chesapeake Incident and Hurricane Events | (1,085 | ) | 7,799 | — | — | — | |||||||||||||
Changes in unrealized derivative instruments | 4,588 | (4,032 | ) | — | — | — | |||||||||||||
MSA Fee Waivers | 5,000 | — | — | — | — | ||||||||||||||
Acquisition costs | 4,296 | — | — | — | — | ||||||||||||||
Commercial Services | 4,139 | — | — | — | — | ||||||||||||||
Adjusted gross margin | $ | 151,630 | $ | 115,773 | $ | 123,605 | $ | 106,858 | $ | 92,313 | |||||||||
Metric tons sold | 3,564 | 2,983 | 2,724 | 2,346 | 2,374 | ||||||||||||||
Adjusted gross margin per metric ton | $ | 42.54 | $ | 38.81 | $ | 45.38 | $ | 45.55 | $ | 38.89 | |||||||||
44
Year Ended December 31, | |||||||||||||||||||
2019 | 2018 | 2017 | 2016 | 2015 | |||||||||||||||
(in thousands) | |||||||||||||||||||
Reconciliation of net (loss) income to adjusted EBITDA and distributable cash flow: | |||||||||||||||||||
Net (loss) income | $ | (2,943 | ) | $ | 6,952 | $ | 14,373 | $ | 13,463 | $ | 17,563 | ||||||||
Add: | |||||||||||||||||||
Depreciation and amortization | 51,581 | 40,745 | 40,361 | 27,735 | 30,738 | ||||||||||||||
Interest expense | 39,344 | 36,471 | 31,744 | 16,221 | 11,712 | ||||||||||||||
Income tax expense | — | — | — | — | 2,623 | ||||||||||||||
Early retirement of debt obligation | 9,042 | 751 | — | 4,438 | 4,699 | ||||||||||||||
Non-cash unit compensation expense | 5,410 | 6,229 | 5,014 | 4,230 | 704 | ||||||||||||||
Asset impairments and disposals(1) | 3,103 | 2,386 | 5,726 | 12,377 | 2,081 | ||||||||||||||
Chesapeake Incident and Hurricane Events(2) | (1,155 | ) | 12,951 | — | — | — | |||||||||||||
Changes in the fair value of derivative instruments | 4,588 | (4,032 | ) | 1,565 | — | — | |||||||||||||
MSA Fee Waivers(3) | 22,600 | — | — | — | — | ||||||||||||||
Purchase accounting adjustment to inventory | — | — | — | — | 697 | ||||||||||||||
Acquisition costs | 5,566 | 178 | 3,598 | 827 | 893 | ||||||||||||||
Commercial Services | 4,139 | — | — | — | — | ||||||||||||||
Adjusted EBITDA | $ | 141,275 | $ | 102,631 | $ | 102,381 | $ | 79,291 | $ | 71,710 | |||||||||
Less: | |||||||||||||||||||
Interest expense, net of amortization of debt issuance costs, debt premium, original issue discount, interest expense on the redemption of the 2021 Notes, and impact from incremental borrowings related to Chesapeake Incident and Hurricane Events | 35,893 | 33,970 | 30,297 | 14,329 | 10,106 | ||||||||||||||
Maintenance capital expenditures | 6,922 | 4,872 | 4,353 | 5,187 | 4,359 | ||||||||||||||
Distributable cash flow attributable to Enviva Partners, LP | 98,460 | 63,789 | 67,731 | 59,775 | 57,245 | ||||||||||||||
Less: Distributable cash flow attributable to incentive distribution rights | 11,425 | 5,867 | 3,398 | 1,077 | — | ||||||||||||||
Distributable cash flow attributable to Enviva Partners, LP limited partners | $ | 87,035 | $ | 57,922 | $ | 64,333 | $ | 58,698 | $ | 57,245 | |||||||||
(1) | In December 2016, we initiated a plan to sell the wood pellet production plant in Stone County, Mississippi (the “Wiggins plant”) owned by Enviva Pellets Wiggins, LLC. The carrying amount of the assets held for sale exceeded the estimated fair value of the Wiggins plant, which resulted in a $10.0 million non-cash impairment charge to earnings. In December 2017, we sold the Wiggins plant for $0.4 million and recorded a loss on the sale $0.8 million, net, upon deconsolidation. |
(2) | Insurance recoveries related to the Chesapeake Incident and Hurricane Events for expenses recorded in 2018. |
(3) | Expenses waived under agreements with Enviva Management. For more information on MSA Fee Waivers, see Note 15, Related-Party Transactions. |
45
ITEM 7. | MANAGEMENT’S DISCUSSION AND ANALYSIS OF FINANCIAL CONDITION AND RESULTS OF OPERATIONS |
The following discussion of our historical performance, financial condition and future prospects should be read in conjunction with Part I, Item 1. “Business” and the consolidated financial statements in Part II, Item 8. “Financial Statements and Supplementary Data.” References in this Annual Report to the “Partnership,” “we,” “our,” “us” or similar expressions refer to Enviva Partners, LP, including its subsidiaries. References to “our sponsor” refer to Enviva Holdings, LP, and, where applicable, its wholly owned subsidiaries Enviva MLP Holdco, LLC and Enviva Development Holdings, LLC. References to “our General Partner” refer to Enviva Partners GP, LLC, a wholly owned subsidiary of Enviva Holdings, LP. References to “Enviva Management” refer to Enviva Management Company, LLC, a wholly owned subsidiary of Enviva Holdings, LP, and references to “our employees” refer to the employees of Enviva Management and its affiliates who provide services to the Partnership. References to the “Sponsor JV” refer to Enviva JV Development Company, LLC, which is a joint venture between our sponsor and John Hancock Life Insurance Company (U.S.A.) and certain of its affiliates. Please read Cautionary Statement Regarding Forward‑Looking Statements on page 1 and Part 1, Item 1A. “Risk Factors” for information regarding certain risks inherent in our business.
Basis of Presentation
In April 2019, we acquired from our sponsor all of the Class B units of Enviva Wilmington Holdings, LLC (the “Hamlet JV,” and such acquisition, the “Hamlet Drop-Down”). The Hamlet JV owns a wood pellet production plant in Hamlet, North Carolina (the “Hamlet plant”). We are the managing member of the Hamlet JV, which is partially owned by John Hancock Life Insurance Company (U.S.A.) and certain of its affiliates (collectively, where applicable, “John Hancock”). We accounted for the Hamlet JV as a consolidated subsidiary, not as a joint venture, following the Hamlet Drop-Down. For more information regarding our rights and obligations with respect to the Hamlet JV, see Note 17, Partners’ Capital-Hamlet JV.
Business Overview
We are a Delaware limited partnership formed in 2013 to aggregate a natural resource, wood fiber and process it into a transportable form, wood pellets. We sell a significant majority of our wood pellets through long-term, take-or-pay off-take contracts with creditworthy customers in the United Kingdom, Europe and increasingly in Japan. We own and operate seven plants (collectively, “our plants”) with a combined production capacity of approximately 3.5 million metric tons of wood pellets per year (“MTPY”) in Virginia, North Carolina, Mississippi, and Florida, the production of which is fully contracted through 2025. We export wood pellets through our wholly owned dry-bulk, deep-water marine terminal at the Port of Chesapeake, Virginia (the “Chesapeake terminal”) and terminal assets at the Port of Wilmington, North Carolina (the “Wilmington terminal”) and from third-party deep-water marine terminals in Mobile, Alabama (the “Mobile terminal”) and Panama City, Florida (the “Panama City terminal”). All of our facilities are located in geographic regions with low input costs and favorable transportation logistics. Owning these cost-advantaged assets, the output from which is fully contracted, in a rapidly expanding industry provides us with a platform to generate stable and growing cash flows. Our plants are sited in robust fiber baskets providing stable pricing for the low-grade fiber used to produce wood pellets. Our raw materials are byproducts of traditional timber harvesting, principally low-value wood materials, such as trees generally not suited for sawmilling or other manufactured forest products, and tree tops and limbs, understory, brush and slash that are generated in a harvest.
Our strategy is to fully contract the wood pellet production from our plants under long-term, take-or-pay off-take contracts with a diversified and creditworthy customer base. Our long-term off-take contracts typically provide for fixed-price deliveries that may include provisions that escalate the price over time and provide for other margin protection. During 2019, production capacity from our wood pellet production plants and wood pellets sourced from our affiliates and third parties were approximately equal to the contracted volumes under our existing long-term, take-or-pay off-take contracts. Our long-term, take-or-pay off-take contracts provide for a product sales backlog of $10.6 billion and have a total weighted-average remaining term of 11.4 years from February 1, 2020. Under our current product sales backlog, our plants are fully contracted through 2025. Assuming all volumes under the firm and contingent long-term off-take contracts held by our sponsor and the Sponsor JV were included with our product sales backlog for firm and contingent contracted product sales, our product sales backlog would increase to $19.6 billion and the total weighted-average remaining term from February 1, 2020 would increase to 13.8 years.
Our customers use our wood pellets as a substitute fuel for coal in dedicated biomass or co-fired coal power plants. Wood pellets serve as a suitable “drop-in” alternative to coal because of their comparable heat content, density and form. Due to the uninterruptible nature of our customers’ fuel consumption, our customers require a reliable supply of wood pellets that meet stringent product specifications. We have built our operations and assets to deliver and certify the highest levels of product quality and our proven track record of reliable deliveries enables us to charge premium prices for this certainty. In addition to our customers’ focus on the reliability of supply, they are concerned about the combustion efficiency of the wood pellets and
46
their safe handling. Because combustion efficiency is a function of energy density, particle size distribution, ash/inert content and moisture, our customers require that we supply wood pellets meeting minimum criteria for a variety of specifications and, in some cases, provide incentives for exceeding our contract specifications.
Recent Developments
2026 Notes
On December 9 and December 12, 2019, Enviva Partners, LP, with its wholly owned subsidiary Enviva Partners Finance Corp., issued $550.0 million and $50.0 million, respectively, in principal amount of 6.5% senior unsecured notes due January 15, 2026 (the “2026 Notes”) in private placements under Rule 144A and Regulation S of the Securities Act of 1933, as amended (the “Securities Act”), for an aggregate principal amount of $600.0 million. We received gross proceeds of approximately $601.8 million from the offerings and net proceeds of approximately $595.8 million after deducting commissions and expenses. We used the net proceeds from the offerings (1) to redeem our existing $355.0 million principal amount of 8.5% senior unsecured notes due 2021 (the “2021 Notes”), including payment of the related redemption premium, (2) to repay borrowings under our senior secured revolving credit facility, including payment of the related accrued interest and (3) for general partnership purposes. Interest payments are due semi-annually in arrears on January 15 and July 15 of each year, commencing July 15, 2020.
Hamlet Drop-Down
The $165.0 million purchase price for the Hamlet Drop-Down consisted of (1) a cash payment of $24.7 million, net of a purchase price adjustment of $0.3 million, on April 2, 2019, (2) the issuance of 1,681,237 unregistered common units at a value of $29.74 per unit, or $50.0 million of common units, on April 20, 2019, (3) $50.0 million in cash paid on June 28, 2019, (4) a third and final cash payment of $40.0 million paid on January 2, 2020 and (5) the elimination of $3.0 million of net related-party receivables and payables included in the net assets of the Hamlet JV on the date of acquisition. We became a member of the Hamlet JV when we acquired the Class B Units on the date of the Hamlet Drop-Down.
The Hamlet JV owns the Hamlet plant and has a firm 15-year take-or-pay off-take contract to supply a customer with nearly 1.0 million MTPY of wood pellets following a ramp period through 2034. Prior to the Hamlet Drop-Down, we already had off-take contracts with the Hamlet JV to supply 470,000 MTPY of the volumes to be delivered pursuant to the 1.0 million MTPY contract; consequently, we acquired 500,000 MTPY in incremental product sales volumes in connection with the Hamlet Drop-Down.
On the date of the Hamlet Drop-Down:
• | We commenced an associated terminal services agreement to handle contracted volumes from the Hamlet plant. |
• | We entered into an agreement with our sponsor, pursuant to which (1) our sponsor agreed to guarantee certain cash flows from the Hamlet plant until June 30, 2020, (2) our sponsor agreed to reimburse us for construction cost overruns in excess of budgeted capital expenditures for the Hamlet plant, subject to certain exceptions, (3) we agreed to pay to our sponsor quarterly incentive payments for any wood pellets produced by the Hamlet plant in excess of forecast production levels through June 30, 2020 and (4) our sponsor agreed to retain liability for certain claims payable, if any, by the Hamlet JV (the “Make-Whole Agreement”). |
• | The Hamlet JV entered into an agreement with Enviva Management to waive the obligation to pay an aggregate of approximately $2.7 million of management fees payable to Enviva Management under the management services agreement (the “Hamlet JV MSA”) between the Hamlet JV and Enviva Management with respect to the period from the date of acquisition of the Hamlet plant until July 1, 2019 (the “Hamlet JV MSA Fee Waiver”). |
• | We entered into an agreement with Enviva Management to waive our obligation to pay an aggregate of approximately $13.0 million in fees payable under our management services agreement (the “EVA MSA,” and together with the Hamlet JV MSA, the “MSAs”) with Enviva Management with respect to the period from the date of the Hamlet Drop-Down through the second quarter of 2020 (the “First EVA MSA Fee Waiver”). |
• | Our sponsor assigned to us all of its rights and obligations under a credit agreement between the Hamlet JV, as borrower and our sponsor, as lender. On the date of the Hamlet Drop-Down, $4.1 million was outstanding from the Hamlet JV to our sponsor. |
• | The Hamlet JV entered into an interim services agreement (the “ISA”) with Enviva Hamlet Operator, LLC, a wholly owned subsidiary of our sponsor (“Hamlet Operator”) pursuant to which Hamlet Operator, as an |
47
independent contractor, agreed to manage, operate, maintain and repair the Hamlet plant and provide other services to the Hamlet JV for the period from July 1, 2019 through June 30, 2020 in exchange for a fixed fee per metric ton (“MT”) of wood pellets produced by the Hamlet plant during such period and delivered at place to the Wilmington terminal. Under and during the term of the ISA, Hamlet Operator agreed to (1) pay all operating and maintenance expenses at the Hamlet plant, (2) cover all reimbursable general and administrative expenses associated with the Hamlet plant and (3) pay other costs and expenses incurred by the Hamlet plant to produce and sell the wood pellets delivered to the Wilmington terminal from the Hamlet plant. Our sponsor guarantees all obligations of Hamlet Operator under the ISA.
We are the managing member and primary beneficiary of the Hamlet JV. We included all accounts of the Hamlet JV in our consolidated results as of April 2, 2019 as the Class B Units represent a controlling interest in the Hamlet JV. We are generally unrestricted in managing the assets and cash flows of the Hamlet JV; however, certain decisions, such as those relating to the issuance and redemption of equity interests in the Hamlet JV, guarantees of indebtedness and fundamental changes, including mergers and acquisitions, asset sales and liquidation and dissolution of the Hamlet JV, require the approval of the members of the Hamlet JV.
Wilmington Terminal Second Payment
We made an initial payment of $56.0 million to the Hamlet JV as partial payment of the $130.0 million purchase price for the Wilmington terminal in October 2017 (the “Wilmington Drop-Down”). On April 1, 2019, we made the second and final payment of $74.0 million for the Wilmington Drop-Down consisting of 1,691,627 common units at a price of $29.38 per common unit, or approximately $50.0 million in common units, subject to certain adjustments, and approximately $24.0 million in cash (the “Second Payment”).
Shelf Registration - Equity Interests in the Partnership
We filed a shelf registration statement on Form S-3 with the U.S. Securities and Exchange Commission (“SEC”) on June 21, 2019 to allow us, from time to time, in one or more offerings, to offer and sell (1) common units representing limited partner interests in Enviva Partners, LP and (2) preferred units representing equity interests in Enviva Partners, LP. The aggregate initial offering price of all securities sold by us under the effective shelf registration statement may not exceed $500.0 million.
On April 1, 2019, in connection with the Second Payment for the Wilmington Drop-Down, we issued 1,691,627 common units, or $49.7 million in common units, to the Hamlet JV, which common units were distributed to John Hancock. On April 2, 2019, in connection with the Hamlet Drop-Down, we issued 1,681,237 common units, or $50.0 million in common units, to our sponsor. In accordance with registration rights agreements with our sponsor and John Hancock, we registered the common units issued in connection with the Wilmington-Drop Down and the Hamlet Drop-Down for resale, subject to certain limitations, pursuant to our effective registration statement.
Mid-Atlantic Expansions
During 2019, we started construction to increase the aggregate wood pellet production capacity of our plants in Northampton, North Carolina, and Southampton, Virginia (the “Mid-Atlantic Expansions”) by approximately 400,000 MTPY. We expect to invest a total of approximately $130.0 million in additional wood pellet production assets and emissions control equipment for the Mid-Atlantic Expansions, of which we have spent $49.3 million through December 31, 2019. We expect to commence the production ramp for the Northampton and Southampton plant expansions in the second and third quarters of 2020, respectively.
Financing Activities
Our financing strategy is to fund acquisitions, drop-downs and major expansion projects with 50% equity and 50% debt. In keeping with such strategy, in addition to the approximately $100.0 million in common units issued as partial consideration for the Hamlet Drop-Down and the Second Payment, we issued an aggregate of 3,508,778 common units to investors in exchange for proceeds of $100.0 million in a registered direct offering (the “RDO”) pursuant to our effective registration statement at a purchase price of $28.50 per unit, representing a 4.2% discount to the 20-day volume-weighted average price as of March 20, 2019.
We used proceeds from the RDO, along with borrowings under our existing $350.0 million senior secured revolving credit facility and the common units issued as consideration for the Hamlet Drop-Down and the Second Payment, to finance (1)
48
$124.7 million of the total $165.0 million purchase price for the Hamlet Drop-Down, (2) the $74.0 million Second Payment, (3) the $24.0 million in capital expenditures, net of payments received pursuant to the Make-Whole Agreement, required to complete construction of the Hamlet plant and (4) the $130.0 million in expenditures required for the Mid-Atlantic Expansions.
Factors Impacting Comparability of Our Financial Results
Inventory Impairment and Asset Disposal
On February 27, 2018, a fire occurred at the Chesapeake terminal, causing damage to equipment and approximately 43,000 MT of wood pellets (the “Chesapeake Incident”). The Chesapeake terminal returned to operations on June 28, 2018. During the year ended December 31, 2018, we incurred $60.3 million in costs as a result of the Chesapeake Incident related to asset impairment, inventory write-off and disposal costs, emergency response costs, asset repair costs and business continuity costs, the latter of which represented incremental costs to commission temporary wood pellet storage and handling and ship loading operations at nearby locations to meet our contractual obligations to our customers. As of December 31, 2018, we had recovered $62.1 million related to the Chesapeake Incident, which included $1.8 million of lost profits. As of December 31, 2018, $3.8 million of probable insurance recoveries for the then-remaining costs not yet recovered were included in insurance receivables and subsequently received in February 2019, with an additional $0.5 million that was recognized as other income. During the year ended December 31, 2019, there were no fires or other incidents that materially affected operations at any of our plants or terminals.
We incurred other losses and costs associated with the Chesapeake Incident during and since the year ended December 31, 2018 and are pursuing outstanding claims of approximately $34.4 million related to such amounts. Consequently, our results of operations and cash flows, as well as our financial measures not presented in accordance with accounting principles generally accepted in the United States (“GAAP”), or non-GAAP financial measures, may not be comparable to those for reported periods before or after the year ended December 31, 2018.
Hurricane Events
In September 2018, Hurricane Florence caused unprecedented flooding across the Mid-Atlantic region. Our wood pellet production plant in Sampson County, North Carolina (the “Sampson plant”) and the Wilmington terminal incurred minor damage. The Sampson plant and Wilmington terminal were operational by September 30, 2018. The flooding impacted our ability to procure wood fiber as our raw material suppliers had limited access to tracts and many transportation routes for the delivery of wood fiber to our plants in the Mid-Atlantic region were temporarily closed.
In October 2018, our wood pellet production plant in Jackson County, Florida (the “Cottondale plant”) and a third-party deep-water marine terminal in Panama City, Florida (the “Panama City terminal”) incurred damage from the category four Hurricane Michael. The Cottondale plant was operational by October 31, 2018. Although we do not own material infrastructure assets at the Panama City terminal, Port Panama City remained closed for an extended period of time. As a result, portions of our shipping schedule were delayed and we incurred incremental logistics costs to deliver wood pellets to our customers.
We undertook substantial preparation in advance of Hurricane Florence and Hurricane Michael (collectively, “Hurricane Events”), including proactively idling operations, to secure the safety of our personnel and to minimize damage to our assets. Additionally, to minimize disruption to our customers, we commissioned temporary wood pellet storage and contracted alternative logistic capabilities.
During the year ended December 31, 2019, no major natural disasters affected operations at any of our plants or terminals.
How We Generate Revenue
Overview
We primarily earn revenue by supplying wood pellets to our customers under off‑take contracts, the majority of which are long-term in nature. Our off-take contracts are considered “take-or-pay” because they include a firm obligation of the customer to take a fixed quantity of product at a stated price and provisions that require that we be compensated in the case of a customer’s failure to accept all or a part of the contracted volumes or termination of a contract by a customer. Each of our long-term off-take contracts defines the annual volume of wood pellets that a customer is required to purchase and we are required to sell, the fixed price per MT for product satisfying a base net calorific value and other technical specifications. These prices are fixed for the entire term, and are subject to adjustments which may include annual inflation-based adjustments or price escalators, price adjustments for product specifications, as well as, in some instances, price adjustments due to changes in underlying indices. In addition to sales of our product under these long-term, off-take contracts, we routinely sell wood pellets under shorter-term contracts, which range in volume and tenor and, in some cases, may include only one specific shipment.
49
Because each of our off-take contracts is a bilaterally negotiated agreement, our revenue over the duration of such contracts does not generally follow observable current market pricing trends. Our performance obligations under these contracts include the delivery of wood pellets, which are aggregated into metric tons. We account for each MT as a single performance obligation. Our revenue from the sale of wood pellets we produce is recognized upon satisfaction of the performance obligation when control transfers to the customer at the time of loading wood pellets onto a ship.
Depending on the specific off-take contract, shipping terms are either Cost, Insurance and Freight (“CIF”), Cost and Freight (“CFR”) or Free On Board (“FOB”). Under a CIF contract, we procure and pay for shipping costs, which include insurance and all other charges, up to the port of destination for the customer. Under a CFR contract, we procure and pay for shipping costs, which include insurance (excluding marine cargo insurance) and all other charges, up to the port of destination for the customer. Shipping under CIF and CFR contracts after control has passed to the customer is considered a fulfillment activity rather than a performance obligation and associated expenses are accrued and included in the price to the customer. Under FOB contracts, the customer is directly responsible for shipping costs.
In some cases, we may purchase shipments of product from third-party suppliers and resell them in back-to-back transactions (“purchase and sale transactions”). We typically are the principal in such transactions because we control the wood pellets prior to transferring them to the customer and therefore recognize related revenue on a gross basis.
Other Revenue
Other revenue includes fees from customers related to cancellations, deferrals or accelerations of shipments and the Commercial Services.
We recognize third- and related-party terminal services revenue ratably over the contract term. Terminal services are performance obligations that are satisfied over time, as customers simultaneously receive and consume the benefits of the terminal services we perform. The consideration is generally fixed for minimum quantities and services above-minimum quantities are generally billed based on a per-MT rate.
Contracted Backlog
As of February 1, 2020, we had approximately $10.6 billion of product sales backlog for firm and contingent contracted product sales to our long-term off-take customers and have a total weighted-average remaining term of 11.4 years compared to approximately $7.9 billion and a total weighted-average remaining term of 9.7 years as of February 1, 2019. Contracted backlog represents the revenue to be recognized under existing contracts assuming deliveries occur as specified in the contracts. Contracted future product sales denominated in foreign currencies, excluding revenue hedged with foreign currency forward contracts, are included in U.S. Dollars at February 1, 2020 forward rates. The contracted backlog includes forward prices including inflation, foreign currency and commodity prices. The amount also includes the effects of related foreign currency derivative contracts. Please read Part II, Item 8. “Financial Statements and Supplementary Data—Derivative Instruments” for more information regarding our foreign currency forward contracts.
Our expected future product sales revenue under our contracted backlog as of February 1, 2020 is as follows (in millions):
Period from February 1, 2020 to December 31, 2020 | $ | 782 | |
Year ending December 31, 2021 | 1,043 | ||
Year ending December 31, 2022 and thereafter | 8,751 | ||
Total product sales contracted backlog | $ | 10,576 | |
Assuming all volumes under the firm and contingent off-take contracts held by our sponsor and its joint ventures were included with our product sales contracted backlog for firm and contingent contracted product sales, the total weighted-average remaining term as of February 1, 2020 would increase to 13.8 years and product sales contracted backlog would increase to $19.6 billion as follows (in millions):
Period from February 1, 2020 to December 31, 2020 | $ | 782 | |
Year ending December 31, 2021 | 1,086 | ||
Year ending December 31, 2022 and thereafter | 17,699 | ||
Total product sales contracted backlog | $ | 19,567 | |
50
Included in the product sales contracted backlog above are $1.3 billion and $3.9 billion of contingent contracts held by the Partnership and our sponsor and its joint ventures, respectively.
Costs of Conducting Our Business
Cost of Goods Sold
Cost of goods sold includes the costs to produce and deliver our wood pellets to customers, reimbursable shipping-related costs associated with specific off-take contracts with CIF or CFR shipping terms and costs associated with purchase and sale transactions. The primary expenses incurred to produce and deliver our wood pellets consist of raw material, production and distribution costs.
We have strategically located our plants in the Mid-Atlantic and Gulf Coast regions of the United States, geographic areas in which wood fiber sources are plentiful and readily available. We have short-term and long-term contracts to manage the supply of raw materials into our plants. Delivered wood fiber costs include stumpage as well as harvesting, transportation and, in some cases, size reduction services provided by our suppliers. The majority of our product volumes are sold under off-take contracts that include cost pass-through mechanisms to mitigate increases in raw material and distribution costs.
Production costs at our production plants consist of labor, energy, tooling, repairs and maintenance and plant overhead costs. Production costs also include depreciation expense associated with the use of our plants and equipment and any gain or loss on disposal of associated assets. Some of our off-take contracts include price escalators that mitigate inflationary pressure on certain components of our production costs. In addition to the wood pellets that we produce at our owned and operated production plants, we selectively purchase additional quantities of wood pellets from third- and related-party wood pellet producers.
Distribution costs include all transportation costs from our plants to our port locations, any storage or handling costs while the product remains at port and shipping costs related to the delivery of our product from our port locations to our customers. Both the strategic location of our plants and our ownership or control of our deep-water terminals have allowed for the efficient and cost-effective transportation of our wood pellets. We seek to mitigate shipping risk by entering into long-term, fixed-price shipping contracts with reputable shippers matching the terms and volumes of our off-take contracts pursuant to which we are responsible for arranging shipping. Certain of our off-take contracts include pricing adjustments for volatility in fuel prices, which allow us to pass the majority of the fuel price-risk associated with shipping through to our customers.
Costs associated with purchase and sale transactions are included in cost of goods sold.
Raw material, production and distribution costs associated with delivering our wood pellets to our owned and leased marine terminals and third- and related-party wood pellet purchase costs are capitalized as a component of inventory. Fixed production overhead, including the related depreciation expense, is allocated to inventory based on the normal capacity of the production plants. These costs are reflected in cost of goods sold when inventory is sold. Distribution costs associated with shipping our wood pellets to our customers are expensed as incurred. Our inventory is recorded using the first-in, first-out method (“FIFO”), which requires the use of judgment and estimates. Given the nature of our inventory, the calculation of cost of goods sold is based on estimates used in the valuation of the FIFO inventory and in determining the specific composition of inventory that is sold to each customer.
Recoveries from customers for certain costs incurred at the discharge port under our off-take contracts are not considered a part of the transaction price, and therefore are excluded from product sales and included as an offset to cost of goods sold.
General and Administrative Expenses
We and our General Partner are party to the MSAs. Under the MSAs, direct or indirect internal or third-party expenses incurred are either directly identifiable or allocated to us. Our sponsor estimates the percentage of employee salaries and related benefits, third-party costs, office rent and expenses and any other overhead costs to be provided to us. Each month, our sponsor allocates the actual costs incurred using these estimates. Our sponsor also charges us for any directly identifiable costs such as goods or services provided at our request. We believe our sponsor’s assumptions and allocations have been made on a reasonable basis and are the best estimate of the costs that we would have incurred on a stand-alone basis.
How We Evaluate Our Operations
Adjusted Net Income
We define adjusted net income as net income excluding certain expenses incurred related to the Chesapeake Incident and Hurricane Events, consisting of emergency response expenses, expenses related to the disposal of inventory, and asset disposal
51
and repair costs, offset by insurance recoveries received, as well as employee compensation and other related costs allocated to us in respect of the Chesapeake Incident and Hurricane Events pursuant to our management services agreement with an affiliate of our sponsor for services that could otherwise have been dedicated to our ongoing operations, certain non-cash waivers of fees for management services provided to us by our sponsor (collectively, the “MSA Fee Waivers”), interest expense associated with incremental borrowings related to the Chesapeake Incident and Hurricane Events, and early retirement of debt obligation and including certain sales and marketing, scheduling, sustainability, consultation, shipping and risk management services (collectively, the “Commercial Services”). We believe that adjusted net income enhances investors’ ability to compare the past financial performance of our underlying operations with our current performance separate from certain items of gain or loss that we characterize as unrepresentative of our ongoing operations.
Adjusted Gross Margin per Metric Ton
We define adjusted gross margin per metric ton as gross margin per metric ton excluding asset disposals, depreciation and amortization, changes in unrealized derivative instruments related to hedged items included in gross margin, MSA Fee Waivers, certain items of income or loss that we characterize as unrepresentative of our ongoing operations, including certain expenses incurred related to the Chesapeake Incident and Hurricane Events, consisting of emergency response expenses, expenses related to the disposal of inventory, and asset disposal and repair costs, offset by insurance recoveries received, as well as employee compensation and other related costs allocated to us in respect of the Chesapeake Incident and Hurricane Events pursuant to our management services agreement with an affiliate of our sponsor for services that could otherwise have been dedicated to our ongoing operations, and acquisition costs and including the Commercial Services. We believe adjusted gross margin per metric ton is a meaningful measure because it compares our revenue-generating activities to our operating costs for a view of profitability and performance on a per metric ton basis. Adjusted gross margin per metric ton will primarily be affected by our ability to meet targeted production volumes and to control direct and indirect costs associated with procurement and delivery of wood fiber to our production plants and the production and distribution of wood pellets.
Adjusted EBITDA
We define adjusted EBITDA as net income excluding depreciation and amortization, interest expense, income tax expense, early retirement of debt obligations, MSA Fee Waivers, non-cash unit compensation expense, asset impairments and disposals, changes in unrealized derivative instruments related to hedged items included in gross margin and other income and expense, certain items of income or loss that we characterize as unrepresentative of our ongoing operations, including certain expenses incurred related to the Chesapeake Incident and Hurricane Events, consisting of emergency response expenses, expenses related to the disposal of inventory, and asset disposal and repair costs, offset by insurance recoveries received, as well as employee compensation and other related costs allocated to us in respect of the Chesapeake Incident and Hurricane Events pursuant to our management services agreement with an affiliate of our sponsor for services that could otherwise have been dedicated to our ongoing operations, and acquisition costs and including the Commercial Services. Adjusted EBITDA is a supplemental measure used by our management and other users of our financial statements, such as investors, commercial banks and research analysts, to assess the financial performance of our assets without regard to financing methods or capital structure.
Distributable Cash Flow
We define distributable cash flow as adjusted EBITDA less maintenance capital expenditures and interest expense net of amortization of debt issuance costs, debt premium, original issue discounts, interest expense on the redemption of the 2021 Notes and the impact from incremental borrowings related to the Chesapeake Incident and Hurricane Events. We use distributable cash flow as a performance metric to compare the cash-generating performance of the Partnership from period to period and to compare the cash-generating performance for specific periods to the cash distributions (if any) that are expected to be paid to our unitholders. We do not rely on distributable cash flow as a liquidity measure.
Limitations of Non-GAAP Financial Measures
Adjusted net income, adjusted gross margin per metric ton, adjusted EBITDA and distributable cash flow are not financial measures presented in accordance with accounting principles generally accepted in the United States (“GAAP”). We believe that the presentation of these non-GAAP financial measures provides useful information to investors in assessing our financial condition and results of operations. Our non-GAAP financial measures should not be considered as alternatives to the most directly comparable GAAP financial measures. Each of these non-GAAP financial measures has important limitations as an analytical tool because they exclude some, but not all, items that affect the most directly comparable GAAP financial measures. You should not consider adjusted net income, adjusted gross margin per metric ton, adjusted EBITDA or distributable cash flow in isolation or as substitutes for analysis of our results as reported under GAAP.
Our definitions of these non-GAAP financial measures may not be comparable to similarly titled measures of other companies, thereby diminishing their utility. Please read Part II, Item 6. “Selected Financial Data—Limitations of Non-GAAP
52
Financial Measures” for a reconciliation of each of adjusted net income, adjusted gross margin per metric ton, adjusted EBITDA and distributable cash flow to the most directly comparable GAAP financial measure.
Results of Operations
Year Ended December 31, 2019 Compared to Year Ended December 31, 2018
Year Ended December 31, | Change | Chesapeake Incident and Hurricane Events | Net Change | ||||||||||||||||
2019 | 2018 | ||||||||||||||||||
(in thousands) | |||||||||||||||||||
Product sales | $ | 674,251 | $ | 564,010 | $ | 110,241 | $ | 300 | $ | 109,941 | |||||||||
Other revenue (1) | 10,142 | 9,731 | 411 | — | 411 | ||||||||||||||
Net revenue | 684,393 | 573,741 | 110,652 | 300 | 110,352 | ||||||||||||||
Cost of goods sold(1) | 549,701 | 461,735 | 87,966 | (8,584 | ) | 96,550 | |||||||||||||
Loss on disposal of assets | 3,103 | 2,386 | 717 | — | 717 | ||||||||||||||
Depreciation and amortization | 50,521 | 40,179 | 10,342 | — | 10,342 | ||||||||||||||
Total cost of goods sold | 603,325 | 504,300 | 99,025 | (8,584 | ) | 107,609 | |||||||||||||
Gross margin | 81,068 | 69,441 | 11,627 | 8,884 | 2,743 | ||||||||||||||
General and administrative expenses | 11,897 | 10,545 | 1,352 | (5,222 | ) | 6,574 | |||||||||||||
Related-party management services agreement fee | 24,492 | 17,096 | 7,396 | — | — | ||||||||||||||
Total general and administrative expenses | 36,389 | 27,641 | 8,748 | (5,222 | ) | 13,970 | |||||||||||||
Income from operations | 44,679 | 41,800 | 2,879 | 14,106 | (11,227 | ) | |||||||||||||
Interest expense | (39,344 | ) | (36,471 | ) | (2,873 | ) | (138 | ) | (2,735 | ) | |||||||||
Early retirement of debt obligation | (9,042 | ) | (751 | ) | (8,291 | ) | — | (8,291 | ) | ||||||||||
Other income (expense) | 764 | 2,374 | (1,610 | ) | — | (1,610 | ) | ||||||||||||
Net (loss) income | $ | (2,943 | ) | $ | 6,952 | $ | (9,895 | ) | $ | 13,968 | $ | (23,863 | ) | ||||||
(1) See Part II, Item 8. “Financial Statements and Supplementary Data—Note 15, Related-Party Transactions” | |||||||||||||||||||
Product sales
Revenue related to product sales for wood pellets produced or procured by us increased to $674.3 million in 2019 from $564.0 million in 2018. The $110.2 million, or 20%, increase was primarily attributable to a 19% increase in product sales volumes for the year ended December 31, 2019 as compared to the year ended December 31, 2018.
Cost of goods sold
Cost of goods sold increased to $603.3 million for the year ended December 31, 2019 from $504.3 million for the year ended December 31, 2018, an increase of $99.0 million, or 20%. Excluding the impact of the Chesapeake Incident and Hurricane Events, specifically $1.1 million of insurance recoveries received, net of costs incurred, during the year ended December 31, 2019 and $7.5 million of expenses incurred, net of insurance recoveries received, during the year ended December 31, 2018, costs of goods sold would have increased by 21%, which is primarily attributable to a 19% increase in product sales volumes during the year ended December 31, 2019 as compared to the year ended December 31, 2018.
Gross margin
Gross margin was $81.1 million for the year ended December 31, 2019 as compared to $69.4 million for the year ended December 31, 2018, an increase of $11.6 million, or 17%. The $11.6 million increase in gross margin was primarily attributable to a 19% increase in product sales volumes during the year ended December 31, 2019, as compared to the year ended December 31, 2018.
53
Adjusted gross margin per metric ton
Year Ended December 31, | |||||||||||
2019 | 2018 | Change | |||||||||
(in thousands, except per metric ton) | |||||||||||
Reconciliation of gross margin to adjusted gross margin per metric ton: | |||||||||||
Gross margin | $ | 81,068 | $ | 69,441 | $ | 11,627 | |||||
Loss on disposal of assets | 3,103 | 2,386 | 717 | ||||||||
Depreciation and amortization | 50,521 | 40,179 | 10,342 | ||||||||
Chesapeake Incident and Hurricane Events | (1,085 | ) | 7,799 | (8,884 | ) | ||||||
Changes in the fair value of derivative instruments | 4,588 | (4,032 | ) | 8,620 | |||||||
MSA Fee Waivers | 5,000 | — | 5,000 | ||||||||
Acquisition costs | 4,296 | — | 4,296 | ||||||||
Commercial Services | 4,139 | — | 4,139 | ||||||||
Adjusted gross margin | $ | 151,630 | $ | 115,773 | $ | 35,857 | |||||
Metric tons sold | 3,564 | 2,983 | 581 | ||||||||
Adjusted gross margin per metric ton | $ | 42.54 | $ | 38.81 | $ | 3.73 | |||||
We earned an adjusted gross margin of $151.6 million, or $42.54 per MT, for the year ended December 31, 2019 compared to $115.8 million, or $38.81 per MT, for the year ended December 31, 2018.
As described below, the increase in adjusted gross margin is due to (1) the waiver of $5.0 million in fees pursuant to the Second EVA MSA Fee Waiver, (2) the receipt of a non-refundable payment of $4.1 million for the Commercial Services and (3) the exclusion of $4.3 million of acquisition costs associated with our evaluation of the Potential Target.
As consideration for an assignment of two shipping contracts to our sponsor to rebalance our and our sponsor’s respective shipping obligations under our existing long-term off-take contracts, our sponsor waived certain management services fees pursuant to the EVA MSA during 2019 (the “Second EVA MSA Fee Waiver”).
Adjusted gross margin for the year ended December 31, 2019 excludes $4.3 million increase of incremental costs, which are unrepresentative of our ongoing operations, in connection with our evaluation of a third-party wood pellet production plant we previously had considered and were considering, purchasing (the “Potential Target”). When we commenced our review, the Potential Target had recently returned to operations following an extended shutdown during a bankruptcy proceeding with the intent of demonstrating favorable operations prior to proceeding to an auction sale process; however, the Potential Target had not yet established a logistics chain through a viable export terminal, given that the terminal through which the plant historically had exported was not operational at the time and was not reasonably certain to become operational in the future. Accordingly, as part of our diligence of the Potential Target, we developed an alternative logistics chain to bring the Potential Target’s wood pellets to market and began purchasing the production of the Potential Target for a trial period. The incremental costs associated with the establishment and evaluation of this new logistics chain primarily consist of barge, freight, trucking, storage and shiploading services. We have completed our evaluation of the alternative logistics chain and, therefore, do not expect to incur additional costs of this nature in the future.
During the quarter ended December 31, 2019, we received a non-refundable payment of $5.6 million from a customer in consideration for our performance during the quarter of certain sales and marketing, scheduling, sustainability, consultation, shipping and risk management services (collectively, the “Commercial Services”) that were outside of the scope of our existing take-or-pay off-take contract. The customer had requested the Commercial Services, among other things, in order to avoid its exposure to market price volatility associated with its anticipated failure to take required deliveries of certain wood pellet volumes during the fourth quarter of 2019 and first half of 2020 pursuant to the off-take contract. The Commercial Services had a value to the customer of $5.6 million. We included the entire non-refundable payment of $5.6 million in our publicly stated guidance for 2019 in our press release issued October 30, 2019.
Under GAAP, we recognized $1.5 million of the $5.6 million payment as revenue during the fourth quarter of 2019, under the breakage model of Accounting Standards Codification (“ASC”) Topic 606, Revenue from Contracts with Customers (“ASC 606”), and recorded the remaining $4.1 million as deferred revenue as of December 31, 2019, to be recognized as revenue during the first six months of 2020 in accordance with the original product sales schedule under the off-take contract. For presentation of our non-GAAP measures, we have included the $4.1 million in adjusted net income, adjusted gross margin per metric ton and adjusted EBITDA for the year ended December 31, 2019 as such amount relates to our performance of the
54
Commercial Services, which we completed and for which we were compensated in 2019. The $4.1 million payment increased adjusted net income, adjusted gross margin per metric ton and adjusted EBITDA for the year ended December 31, 2019 and will reduce adjusted net income, adjusted gross margin per metric ton and adjusted EBITDA during the first six months of 2020 as the $4.1 million is recognized as revenue under GAAP.
General and administrative expenses
General and administrative expenses were $36.4 million for the year ended December 31, 2019 and $27.6 million for the year ended December 31, 2018. The $8.7 million increase in general and administrative expenses is primarily attributable to the consolidation of the Hamlet JV following the Hamlet Drop-Down on April 2, 2019.
Interest expense
We incurred $39.3 million of interest expense during the year ended December 31, 2019 and $36.5 million during the year ended December 31, 2018. The increase in interest expense from the prior year was primarily attributable to an increase in borrowings under our senior secured revolving credit facility.
Early retirement of debt obligation
We redeemed all $355.0 million of aggregate principal amount of 2021 Notes and recognized a $9.0 million loss on the early retirement of debt obligation consisting of a $7.5 million debt redemption premium and $1.5 million for the write-off of unamortized debt issuance costs, original issue discount and premium. The amounts were amortized over the term of the 2021 Notes and were expensed in December 2019 when we repaid $355.0 million of aggregate principal amount of the 2021 Notes.
We incurred a $0.8 million charge during the year ended December 31, 2018 for the write-off of debt issuance costs and original issue discount associated with our senior secured revolving credit facility. The amounts were amortized over the term of the debt and were expensed in October 2018 when we repaid $41.2 million of term-loan borrowings outstanding under the senior secured revolving credit facility.
Other income
The $2.4 million of other income during the year ended December 31, 2018 primarily consists of $1.8 million of insurance proceeds received for lost margin on product sales related to the Chesapeake Incident.
Adjusted net income
Year Ended December 31, | |||||||||||
2019 | 2018 | Change | |||||||||
(in thousands) | |||||||||||
Reconciliation of net (loss) income to adjusted net income: | |||||||||||
Net (loss) income | $ | (2,943 | ) | $ | 6,952 | $ | (9,895 | ) | |||
Chesapeake Incident and Hurricane Events | (1,155 | ) | 12,951 | (14,106 | ) | ||||||
MSA Fee Waivers | 22,600 | — | 22,600 | ||||||||
Interest expense from incremental borrowings related to Chesapeake Incident and Hurricane Events | 1,705 | 1,567 | 138 | ||||||||
Early retirement of debt obligation | 9,042 | 751 | 8,291 | ||||||||
Commercial Services | 4,139 | — | 4,139 | ||||||||
Adjusted net income | $ | 33,388 | $ | 22,221 | $ | 11,167 | |||||
We generated adjusted net income of $33.4 million for the year ended December 31, 2019 compared to $22.2 million for the year ended December 31, 2018. The $11.2 million increase in adjusted net income was attributable to an increase in MSA Fee Waivers of $22.6 million and $8.3 million of early retirement of debt obligation, partially offset by a $14.1 million decrease in adjustments related to the Chesapeake Incident and Hurricane Events and a $9.9 million increase in net loss primarily attributable to the factors described above.
55
Adjusted EBITDA
Year Ended December 31, | |||||||||||
2019 | 2018 | Change | |||||||||
(in thousands) | |||||||||||
Reconciliation of net (loss) income to adjusted EBITDA: | |||||||||||
Net (loss) income | $ | (2,943 | ) | $ | 6,952 | $ | (9,895 | ) | |||
Add: | |||||||||||
Depreciation and amortization | 51,581 | 40,745 | 10,836 | ||||||||
Interest expense | 39,344 | 36,471 | 2,873 | ||||||||
Early retirement of debt obligation | 9,042 | 751 | 8,291 | ||||||||
Non-cash unit compensation expense | 5,410 | 6,229 | (819 | ) | |||||||
Asset impairments and disposals | 3,103 | 2,386 | 717 | ||||||||
Chesapeake Incident and Hurricane Events | (1,155 | ) | 12,951 | (14,106 | ) | ||||||
Changes in the fair value of derivative instruments | 4,588 | (4,032 | ) | 8,620 | |||||||
MSA Fee Waivers | 22,600 | — | 22,600 | ||||||||
Acquisition costs | 5,566 | 178 | 5,388 | ||||||||
Commercial Services | 4,139 | — | 4,139 | ||||||||
Adjusted EBITDA | $ | 141,275 | $ | 102,631 | $ | 38,644 | |||||
We generated adjusted EBITDA of $141.3 million for the year ended December 31, 2019 compared to $102.6 million for the year ended December 31, 2018. The $38.6 million increase was primarily attributable to the factors described above under the heading “Adjusted gross margin per metric ton.”
Distributable cash flow
The following is a reconciliation of adjusted EBITDA to distributable cash flow:
Year Ended December 31, | |||||||||||
2019 | 2018 | Change | |||||||||
(in thousands) | |||||||||||
Adjusted EBITDA | $ | 141,275 | $ | 102,631 | $ | 38,644 | |||||
Less: | |||||||||||
Interest expense, net of amortization of debt issuance costs, debt premium, original issue discount, interest expense on the redemption of the 2021 Notes, and impact from incremental borrowings related to Chesapeake Incident and Hurricane Events | 35,893 | 33,970 | 1,923 | ||||||||
Maintenance capital expenditures | 6,922 | 4,872 | 2,050 | ||||||||
Distributable cash flow attributable to Enviva Partners, LP | 98,460 | 63,789 | 34,671 | ||||||||
Less: Distributable cash flow attributable to incentive distribution rights | 11,439 | 5,867 | 5,572 | ||||||||
Distributable cash flow attributable to Enviva Partners, LP limited partners | $ | 87,021 | $ | 57,922 | $ | 29,099 | |||||
56
Year Ended December 31, 2018 Compared to Year Ended December 31, 2017
Year Ended December 31, | Change | Chesapeake Incident and Hurricane Events | Net Change | ||||||||||||||||
2018 | 2017 | ||||||||||||||||||
(in thousands) | |||||||||||||||||||
Product sales | $ | 564,010 | $ | 522,250 | $ | 41,760 | $ | (300 | ) | $ | 42,060 | ||||||||
Other revenue (1) | 9,731 | 20,971 | (11,240 | ) | — | (11,240 | ) | ||||||||||||
Net revenue | 573,741 | 543,221 | 30,520 | (300 | ) | 30,820 | |||||||||||||
Cost of goods sold (1) | 461,735 | 419,616 | 42,119 | 7,490 | 34,629 | ||||||||||||||
Loss on disposal of assets | 2,386 | 4,899 | (2,513 | ) | — | (2,513 | ) | ||||||||||||
Depreciation and amortization | 40,179 | 39,904 | 275 | — | 275 | ||||||||||||||
Total cost of goods sold | 504,300 | 464,419 | 39,881 | 7,490 | 32,391 | ||||||||||||||
Gross margin | 69,441 | 78,802 | (9,361 | ) | (7,790 | ) | (1,571 | ) | |||||||||||
General and administrative expenses | 10,545 | 14,975 | (4,430 | ) | 5,161 | (9,591 | ) | ||||||||||||
Related-party management services agreement fee | 17,096 | 15,132 | 1,964 | — | 1,964 | ||||||||||||||
Impairment of assets held for sale | — | 827 | (827 | ) | — | (827 | ) | ||||||||||||
Total general and administrative expenses | 27,641 | 30,934 | (3,293 | ) | 5,161 | (8,454 | ) | ||||||||||||
Income from operations | 41,800 | 47,868 | (6,068 | ) | (12,951 | ) | 6,883 | ||||||||||||
Interest expense | (36,471 | ) | (31,744 | ) | (4,727 | ) | (1,567 | ) | (3,160 | ) | |||||||||
Early retirement of debt obligation | (751 | ) | — | (751 | ) | — | (751 | ) | |||||||||||
Other income (expense) | 2,374 | (1,751 | ) | 4,125 | — | 4,125 | |||||||||||||
Net income | 6,952 | 14,373 | (7,421 | ) | (14,518 | ) | 7,097 | ||||||||||||
Less net loss attributable to noncontrolling partners’ interests | — | 3,140 | (3,140 | ) | — | (3,140 | ) | ||||||||||||
Net income attributable to Enviva Partners, LP | $ | 6,952 | $ | 17,513 | $ | (10,561 | ) | $ | (14,518 | ) | $ | 3,957 | |||||||
(1) See Part II, Item 8. “Financial Statements and Supplementary Data—Note 15, Related-Party Transactions” | |||||||||||||||||||
Product sales
Revenue related to product sales for wood pellets produced or procured by us increased to $564.0 million in 2018 from $522.3 million in 2017. The $41.8 million, or 8%, increase was primarily attributable to a 10% increase in product sales volumes for the year ended December 31, 2018 as compared to the year ended December 31, 2017. The increase in product sales was partially offset by a decrease in pricing during the year ended December 31, 2018 due primarily to customer contract mix. The increase in product sales is also attributable to the adoption of ASC 606.
Other revenue
Other revenue decreased by $11.2 million during the year ended December 31, 2018 as compared to the year ended December 31, 2017. The change was primarily driven by $10.4 million of purchase and sale transactions during the year ended December 31, 2017 recorded in other revenue prior to the adoption of ASC 606. During the year ended December 31, 2018, the purchase and sale transactions were recorded on a gross basis in product sales revenue and cost of goods sold because we acted as principal in the transactions.
Cost of goods sold
Cost of goods sold increased to $504.3 million for the year ended December 31, 2018 from $464.4 million for the year ended December 31, 2017. The $39.9 million, or 9%, increase was primarily attributable to an increase in our product sales volumes.
Gross margin
Gross margin was $69.4 million for the year ended December 31, 2018 as compared to $78.8 million for the year ended December 31, 2017. The $9.4 million decrease in gross margin was primarily attributable to the following:
• | An $11.2 million decrease in other revenue as described above. |
57
• | A $7.8 million decrease related to the Chesapeake Incident and Hurricane Events, which was attributable to idling our plants and terminals due to the Hurricane Events as well as related costs we incurred to commission temporary wood pellet storage and establish alternative logistic capabilities. This decrease is also attributable to employee compensation and other related costs associated with the Chesapeake Incident and Hurricane Events allocated to us pursuant to the EVA MSA for services that could otherwise have been dedicated to our ongoing operations. |
• | Lower pricing due to customer contract mix, partially offset by changes in unrealized derivative instruments (see Note 10, Derivative Instruments), which decreased gross margin by $4.4 million. |
• | An increase in depreciation expense, which decreased gross margin by $0.3 million. |
Offsetting the above were:
• | An increase in product sales volumes increased gross margin by $10.0 million. Adjusting for the impact of ASC 606 for comparison purposes, we would have sold 2,983,000 MT during the year ended December 31, 2018, or approximately 259,000 MT more than the year ended December 31, 2017. |
• | Lower loss on asset disposals, which increased gross margin by $2.5 million. |
• | Lower production costs of our wood pellets, which increased gross margin by $1.8 million. |
Adjusted gross margin per metric ton
Year Ended December 31, | |||||||||||
2018 | 2017 | Change | |||||||||
(in thousands, except per metric ton) | |||||||||||
Reconciliation of gross margin to adjusted gross margin per metric ton: | |||||||||||
Gross margin | $ | 69,441 | $ | 78,802 | $ | (9,361 | ) | ||||
Loss on disposal of assets | 2,386 | 4,899 | (2,513 | ) | |||||||
Depreciation and amortization | 40,179 | 39,904 | 275 | ||||||||
Chesapeake Incident and Hurricane Events | 7,799 | — | 7,799 | ||||||||
Changes in the fair value of derivative instruments | (4,032 | ) | — | (4,032 | ) | ||||||
Adjusted gross margin | $ | 115,773 | $ | 123,605 | $ | (7,832 | ) | ||||
Metric tons sold | 2,983 | 2,724 | 259 | ||||||||
Adjusted gross margin per metric ton | $ | 38.81 | $ | 45.38 | $ | (6.57 | ) | ||||
We earned an adjusted gross margin of $115.8 million, or $38.81 per MT, for the year ended December 31, 2018. Adjusted gross margin was $123.6 million, or $45.38 per MT, for the year ended December 31, 2017. Adjusting for the impact of ASC 606 for comparison purposes, adjusted gross margin per MT would have been $42.19 per MT for the year ended December 31, 2017. The factors impacting adjusted gross margin are detailed above under the heading “Gross margin.”
General and administrative expenses
General and administrative expenses were $27.6 million for the year ended December 31, 2018 and $30.1 million for the year ended December 31, 2017.
The $2.5 million decrease during the year ended December 31, 2018 as compared to the year ended December 31, 2017 is primarily attributable to a $3.4 million decrease in acquisition-related transaction expenses. Included in the $27.6 million of general and administrative expenses is $5.2 million of employee compensation and other related costs associated with the Chesapeake Incident and Hurricane Events allocated to us pursuant to the EVA MSA for services that could otherwise have been dedicated to our ongoing operations.
Disposal of assets held for sale
During the year ended December 31, 2017, we recorded a loss on the sale of $0.8 million, net, upon deconsolidation of the Wiggins plant.
58
Interest expense
We incurred $36.5 million of interest expense during the year ended December 31, 2018 and $31.7 million during the year ended December 31, 2017. The increase in interest expense from the prior year was primarily attributable to an increase in our long-term debt outstanding. See “Liquidity and Capital Resources—2021 Notes” below. We also incurred $1.6 million in interest expense on revolving borrowings under our senior secured revolving credit facility to fund timing differences between expenses incurred and associated insurance recoveries related to the Chesapeake Incident.
Early retirement of debt obligation
We incurred a $0.8 million charge during the year ended December 31, 2018 for the write-off of debt issuance costs and original issue discount associated with our senior secured revolving credit facility. The amounts were amortized over the term of the debt and were expensed in October 2018 when we repaid $41.2 million of term-loan borrowings outstanding under our senior secured revolving credit facility.
Other income (expense)
The $2.4 million of other income during the year ended December 31, 2018 primarily consists of $1.8 million of insurance proceeds received for lost margin on product sales related to the Chesapeake Incident.
Certain cash flow hedges related to foreign currency exchange risk previously designated as hedges ceased to qualify for hedge accounting treatment and we discontinued hedge accounting for such hedge transactions on December 31, 2017. A $1.6 million loss included in accumulated other comprehensive income was reclassified to other expense.
Adjusted net income
Year Ended December 31, | |||||||||||
2018 | 2017 | Change | |||||||||
(in thousands) | |||||||||||
Reconciliation of net income to adjusted net income: | |||||||||||
Net income | $ | 6,952 | $ | 14,373 | $ | (7,421 | ) | ||||
Chesapeake Incident and Hurricane Events | 12,951 | — | 12,951 | ||||||||
Interest expense from incremental borrowings related to Chesapeake Incident and Hurricane Events | 1,567 | — | 1,567 | ||||||||
Early retirement of debt obligation | 751 | — | 751 | ||||||||
Adjusted net income | $ | 22,221 | $ | 14,373 | $ | 7,848 | |||||
We generated adjusted net income of $22.2 million for the year ended December 31, 2018 compared to $14.4 million for the year ended December 31, 2017.
59
Adjusted EBITDA
Year Ended December 31, | |||||||||||
2018 | 2017 | Change | |||||||||
(in thousands) | |||||||||||
Reconciliation of net income to adjusted EBITDA: | |||||||||||
Net income | $ | 6,952 | $ | 14,373 | $ | (7,421 | ) | ||||
Add: | |||||||||||
Depreciation and amortization | 40,745 | 40,361 | 384 | ||||||||
Interest expense | 36,471 | 31,744 | 4,727 | ||||||||
Early retirement of debt obligation | 751 | — | 751 | ||||||||
Non-cash unit compensation expense | 6,229 | 5,014 | 1,215 | ||||||||
Asset impairments and disposals | 2,386 | 5,726 | (3,340 | ) | |||||||
Changes in the fair value of derivative instruments | (4,032 | ) | 1,565 | (5,597 | ) | ||||||
Chesapeake Incident and Hurricane Events | 12,951 | — | 12,951 | ||||||||
Acquisition costs | 178 | 3,598 | (3,420 | ) | |||||||
Adjusted EBITDA | $ | 102,631 | $ | 102,381 | $ | 250 | |||||
We generated adjusted EBITDA of $102.6 million for the year ended December 31, 2018 compared to $102.4 million for the year ended December 31, 2017. The $0.3 million increase was primarily attributable to the factors described above under the heading “Gross margin” and “General and administrative expenses.”
Distributable cash flow
The following is a reconciliation of adjusted EBITDA to distributable cash flow:
Year Ended December 31, | |||||||||||
2018 | 2017 | Change | |||||||||
(in thousands) | |||||||||||
Adjusted EBITDA | $ | 102,631 | $ | 102,381 | $ | 250 | |||||
Less: | |||||||||||
Interest expense, net of amortization of debt issuance costs, debt premium, original issue discount and impact from incremental borrowings related to Chesapeake Incident | 33,970 | 30,297 | 3,673 | ||||||||
Maintenance capital expenditures | 4,872 | 4,353 | 519 | ||||||||
Distributable cash flow attributable to Enviva Partners, LP | 63,789 | 67,731 | (3,942 | ) | |||||||
Less: Distributable cash flow attributable to incentive distribution rights | 5,867 | 3,398 | 2,469 | ||||||||
Distributable cash flow attributable to Enviva Partners, LP limited partners | $ | 57,922 | $ | 64,333 | $ | (6,411 | ) | ||||
Liquidity and Capital Resources
Overview
Our primary sources of liquidity include cash and cash equivalent balances, cash generated from operations, borrowings under our revolving credit commitments and, from time to time, debt and equity offerings. Our primary liquidity requirements are to fund working capital, service our debt, maintain cash reserves, finance plant acquisitions and plant expansion projects, finance maintenance capital expenditures and pay distributions. We believe cash on hand, cash generated from our operations and the availability of our revolving credit commitments will be sufficient to meet our primary liquidity requirements. However, future capital expenditures and other cash requirements could be higher than we currently expect as a result of various factors. Additionally, our ability to generate sufficient cash from our operating activities depends on our future performance, which is subject to general economic, political, financial, competitive and other factors beyond our control.
60
Cash Distributions
To the extent we have sufficient cash from our operations after establishment of cash reserves and payment of fees and expenses, we intend to pay to holders of our common units cash distributions of at least the minimum quarterly distribution of $0.4125 per common unit per quarter, which equates to approximately $13.9 million per quarter, or approximately $55.4 million per year, based on the number of common units outstanding as of February 14, 2020.
Capital Requirements
We operate in a capital-intensive industry, which requires significant investments to maintain and upgrade existing capital. Our capital requirements primarily have consisted, and we anticipate will continue to consist, of the following:
• | Maintenance capital expenditures, which are cash expenditures incurred to maintain our long-term operating income or operating capacity. These expenditures typically include certain system integrity, compliance and safety improvements; and |
• | Growth capital expenditures, which are cash expenditures we expect will increase our operating income or operating capacity over the long term. Growth capital expenditures include acquisitions or construction of new capital assets or capital improvements such as additions to or improvements on our existing capital assets as well as projects intended to extend the useful life of assets. |
The classification of capital expenditures as either maintenance or growth is made at the individual asset level during our budgeting process and as we approve, execute and monitor our capital spending.
We expect to invest a total of approximately $130.0 million in additional wood pellet production assets and emissions control equipment for the Mid-Atlantic Expansions, of which we have spent $49.3 million through December 31, 2019. We expect to commence the production ramp for the Northampton and Southampton plant expansions in the second and third quarters of 2020, respectively.
Long-Term Debt
2026 Notes
On December 9 and December 12, 2019, Enviva Partners, LP, with its wholly owned subsidiary Enviva Partners Finance Corp., issued $550.0 million and $50.0 million, respectively, in aggregate principal amount of, 6.5% senior unsecured notes due January 15, 2026 (the “2026 Notes) in private placements under Rule 144A and Regulation S of the Securities Act of 1933, as amended, for a total combined aggregate principal amount outstanding of $600.0 million maturing in 2026. We received gross proceeds of approximately $601.8 million from the offerings and net proceeds of approximately $595.8 million after deducting commissions and expenses. We used the net proceeds from the offerings to (1) redeem our existing $355.0 million principal amount of 8.5% senior unsecured 2021 Notes, including payment of the related redemption premium, (2) repay borrowings under our senior secured revolving credit facility, including payment of the related accrued interest and (3) for general partnership purposes. Interest payments are due semi-annually in arrears on January 15 and July 15 of each year, commencing July 15, 2020.
We may redeem all or a portion of the 2026 Notes at any time at the applicable redemption price, plus accrued and unpaid interest, if any (subject to the right of holders of record on the relevant record date to receive interest due on an interest payment date that is on or prior to the redemption date), and, in some cases, plus a make-whole premium.
We were in compliance with the covenants and restrictions associated with, and no events of default existed under, the indenture dated as of December 9, 2019 governing the 2026 Notes as of December 31, 2019. The 2026 Notes are guaranteed jointly and severally on a senior unsecured basis by our existing subsidiaries (excluding Enviva Partners Finance Corp.) that guarantee certain of our indebtedness and may be guaranteed by certain future restricted subsidiaries. For additional information on our senior secured credit facility, see Note 14, Long-Term Debt and Finance Lease Obligations.
2021 Notes
On December 9, 2019, we redeemed all $355.0 million of aggregate principal amount of 6.5% senior unsecured notes due 2021 (the “2021 Notes”) and recognized a $9.0 million loss on the early retirement of debt obligation consisting of a $7.5 million debt redemption premium and $1.5 million for the write-off of unamortized debt issuance costs, original issue discount and premium. The amounts were amortized over the term of the 2021 Notes and were expensed in December 2019 when we repaid $355.0 million of aggregate principal amount of the 2021 Notes. The 2021 Notes early redemption was funded from the issuance of the 2026 Notes.
61
Senior Secured Revolving Credit Facility
We have a $350.0 million senior secured revolving credit facility that matures on October 18, 2023.
Borrowings under the revolving credit commitments thereunder bear interest, at our option, at either a Eurodollar rate or at a base rate, in each case, plus an applicable margin. The applicable margin will fluctuate between 1.75% per annum and 3.00% per annum, in the case of Eurodollar rate borrowings, or between 0.75% per annum and 2.00% per annum, in the case of base rate loans, in each case, based upon our Total Leverage Ratio (as defined in our credit agreement) at such time, with 25 basis point increases or decreases for each 0.50 increase or decrease in our Total Leverage Ratio from 2.75:1:00 to 4.75:1:00.
We are required to pay a commitment fee on the daily unused amount under the revolving credit commitments at a rate between 0.25% and 0.50% per annum.
The credit agreement contains certain covenants, restrictions and events of default. We are required to maintain (1) a maximum Total Leverage Ratio at or below 4.75 to 1.00 (or 5.00 to 1.00 during a Material Transaction Period and (2) a minimum Interest Coverage Ratio (as defined in our credit agreement) of not less than 2.25 to 1.00.
As of December 31, 2019, we were in compliance with all covenants and restrictions associated with, and no events of default existed under, the credit agreement governing our senior secured revolving credit facility. Our obligations under the senior secured revolving credit facility are guaranteed by certain of our subsidiaries and secured by liens on substantially all of our assets; however, the senior secured revolving credit facility is not guaranteed by the Hamlet JV or secured by liens on its assets. For additional information on our senior secured revolving credit facility, see Note 14, Long-Term Debt and Finance Lease Obligations.
Shelf Registration - Equity Interests in the Partnership
We filed a shelf registration statement on Form S-3 with the SEC on June 21, 2019 to allow us, from time to time, in one or more offerings, to offer and sell (1) common units representing limited partner interests in Enviva Partners, LP and (2) preferred units representing equity interests in Enviva Partners, LP. The aggregate initial offering price of all securities sold by us under the effective shelf registration statement may not exceed $500.0 million.
On April 1, 2019, in connection with the Second Payment for the Wilmington Drop-Down, we issued 1,691,627 common units, or $49.7 million in common units, to the Hamlet JV, which common units were distributed to John Hancock. On April 2, 2019, in connection with the Hamlet Drop-Down, we issued 1,681,237 common units, or $50.0 million in common units, to our sponsor. In accordance with registration rights agreements with our sponsor and John Hancock, we registered the common units issued in connection with the Wilmington-Drop Down and the Hamlet Drop-Down for resale, subject to certain limitations, pursuant to the effective shelf registration statement.
At-the-Market Offering Program
Pursuant to an equity distribution agreement dated August 8, 2016, we may offer and sell common units from time to time through a group of managers, subject to the terms and conditions set forth in such agreement, of up to an aggregate sales amount of $100.0 million (the “ATM Program”).
We did not sell any units under the ATM Program during 2019. As of February 14, 2020, $88.4 million remained available for issuance under the ATM Program.
Cash Flows
The following table sets forth a summary of our net cash flows from operating, investing and financing activities for the years ended December 31, 2019, 2018 and 2017:
Year Ended December 31 | |||||||||||
2019 | 2018 | 2017 | |||||||||
(in thousands) | |||||||||||
Net cash provided by operating activities | $ | 53,860 | $ | 84,053 | $ | 87,095 | |||||
Net cash used in investing activities | (177,483 | ) | (26,002 | ) | (28,601 | ) | |||||
Net cash provided by (used in) financing activities | 130,216 | (56,115 | ) | (58,436 | ) | ||||||
Net increase in cash and cash equivalents | $ | 6,593 | $ | 1,936 | $ | 58 | |||||
62
Cash Provided by Operating Activities
Net cash provided by operating activities was $53.9 million, $84.1 million and $87.1 million for the years ended December 31, 2019, 2018 and 2017, respectively.
The $30.2 million decrease in cash provided by operating activities during the year ended December 31, 2019 compared to the year ended December 31, 2018 was largely due to changes in working capital, primarily attributable to the Chesapeake Incident.
The $3.0 million decrease in cash provided by operating activities during the year ended December 31, 2018 compared to the year ended December 31, 2017 was largely due to changes in working capital, primarily attributable to the Chesapeake Incident.
Cash Used in Investing Activities
Net cash used in investing activities was $177.5 million, $26.0 million and $28.6 million for the years ended December 31, 2019, 2018 and 2017, respectively.
The year ended December 31, 2019 includes a payment of $74.7 million in cash consideration for the Hamlet Drop-Down. The $111.3 million of cash used for property, plant and equipment during the year is primarily attributable to the completion of construction of the Hamlet plant and capital expenditures associated with the Mid-Atlantic Expansions.
The year ended December 31, 2018 includes $26.0 million in cash used for property, plant and equipment, which includes $16.9 million related to projects intended to increase the operating income or operating capacity of our plants, $4.9 million of capital expenditures to maintain operations and $5.3 million of capital expenditures associated with the Chesapeake Incident, offset by $1.1 million of insurance recoveries received.
The year ended December 31, 2017 includes purchases of property, plant and equipment related to the completion of both the Sampson plant and Wilmington terminal. Of the $28.6 million in cash used for property, plant and equipment during the year ended December 31, 2017, approximately $5.7 million related to projects intended to increase the production capacity of our plants and $4.4 million was used to maintain our equipment and machinery. Of the remaining amount in 2017, $10.2 million was used for the construction of the Sampson plant and $8.4 million was used for the construction of the Wilmington terminal.
Cash Provided by (Used in) Financing Activities
Net cash provided by financing activities was $130.2 million for the year ended December 31, 2019. Net cash used in financing activities was $56.1 million and $58.4 million for the years ended December 31, 2018 and 2017, respectively. The $186.3 million increase in net cash provided by financing activities in 2019, as compared to 2018, is primarily attributable to an increase in net proceeds from common unit issuances of $96.6 million and an increase of $143.9 million in proceeds from debt issuance, mainly due to the issuance of the 2026 Notes, net of principal payments on debt and finance lease obligations offset by the $24.3 million cash portion of the Second Payment.
Net cash used in financing activities during the year ended December 31, 2018 related primarily to distributions paid to our unitholders of $73.5 million, a $4.5 million tax withholding payment associated with the settlement of phantom unit awards that vested pursuant to our Long-Term Incentive Plan (the “LTIP”), a $2.3 million payment to our General Partner to purchase common units related to the settlement of phantom unit awards under the LTIP and $2.5 million in cash paid related to debt issuance costs. Offsetting the cash used in financing activities during the year ended December 31, 2018 was $26.5 million, net, in debt issuance proceeds.
Net cash used in financing activities during the year ended December 31, 2017 related primarily to distributions paid to our unitholders of $64.3 million, distributions to our sponsor of $55.9 million related to the Wilmington Drop-Down and $83.0 million of repayments, net, on our debt and finance lease obligations. The net cash used in financing activities was partially offset by proceeds of $60.0 million from the 2021 Notes and $72.0 million of borrowings under our senior secured revolving credit facility.
63
Contractual Obligations
____________________________________________
Contractual Obligations | Total | 2020 | 2021-2022 | 2023-2024 | 2025 and Beyond | |||||||||||||||
(in thousands) | ||||||||||||||||||||
Long-term debt (1) | $ | 600,000 | $ | — | $ | — | $ | — | $ | 600,000 | ||||||||||
Finance leases (2) | 7,538 | 4,584 | 2,573 | 381 | — | |||||||||||||||
Other long-term debt (3) | 2,006 | 2,006 | — | — | — | |||||||||||||||
Operating leases (4) | 80,570 | 4,140 | 7,609 | 7,291 | 61,530 | |||||||||||||||
Interest payments (5) | 238,386 | 23,723 | 78,144 | 78,019 | 58,500 | |||||||||||||||
Purchase obligations (6) | 11,644 | 11,644 | — | — | — | |||||||||||||||
Shipping commitments (7) | 928,486 | 80,606 | 158,150 | 145,485 | 544,245 | |||||||||||||||
Other purchase commitments (8) | 612,964 | 220,632 | 286,423 | 105,909 | — | |||||||||||||||
$ | 2,481,594 | $ | 347,335 | $ | 532,899 | $ | 337,085 | $ | 1,264,275 | |||||||||||
(1) | Long-term debt as of December 31, 2019 consisted of $593.5 million of outstanding indebtedness, net of unamortized discount, premium and debt issuance of $6.5 million related to the 2026 Notes. |
(2) | Finance leases are related to machinery, equipment and other assets included in property, plant and equipment. |
(3) | Other long-term debt primarily consists of a note payable held by Enviva Pellets Amory, LLC (“Amory”), a wholly owned subsidiary of the Partnership. |
(4) | Operating leases are related to real estate, machinery, equipment and other assets with an initial term of longer than 12 months. |
(5) | Cash obligations for interest expense reflect, as of December 31, 2019, (1) interest payments related to the 2026 Notes and (2) interest payments related to finance leases and other long-term debt. |
(6) | At December 31, 2019, we had $11.6 million of purchase obligations, which consisted of commitments for the purchase of materials, supplies and the engagement of services for the operation of our facilities to be used in the normal course of business. The amounts presented in the table do not include items already recorded in accounts payable or accrued liabilities at December 31, 2019. |
(7) | In order to mitigate volatility in our shipping costs, we have entered into fixed-price shipping contracts with reputable shippers matching the terms and volumes of certain of our off‑take contracts for which we are responsible for arranging shipping. Our contracts with shippers include provisions as to the minimum amount of MTPY to be shipped and may also stipulate the number of shipments. Pursuant to these contracts, the terms of which extend to up to 15 years, charges are based on a fixed‑price per MT and, in most cases, there are adjustment provisions for increases in the price of fuel or for other distribution-related costs. The price per MT may also vary depending on the loading port and the discharge port. Our shippers commit their resources based on our planned shipments and we would likely be liable for a portion of their expenses if we deviated from our communicated plans. As of December 31, 2019, we estimate our obligations related to these shipping contracts to be approximately $928.5 million through 2039. These amounts will be offset by the related sales transactions in the same period, which are not included in the table above. |
(8) | Purchase and other commitments consist primarily of commitments under certain wood fiber and wood pellet purchases, handling and terminal and stevedoring service contracts. Some of our suppliers and service providers commit resources based on our planned purchases and require minimum levels of commitments. The supply agreements for the purchase of 1,620,000 MT of wood pellets from British Columbia are fully offset by an agreement to sell 1,620,000 MT of wood pellets to the same counterparty from our terminal locations. The amounts in the table represent an estimate of the costs we would incur under these contracts as of December 31, 2019. Many of our contracts are requirement contracts and currently do not represent a firm commitment to purchase from our suppliers; therefore, they are not reflected in the table above. Under these contracts, we may be liable for the costs incurred on services rendered until termination and the costs of any supplies on hand. |
64
Off‑Balance Sheet Arrangements
As of December 31, 2019, we did not have any off‑balance sheet arrangements, as defined in Item 303(a)(4)(ii) of Regulation S‑K, such as the use of unconsolidated subsidiaries, structured finance, special purpose entities or a variable interest in unconsolidated entities.
Recently Issued Accounting Pronouncements
See Part II, Item 8. “Financial Statements and Supplementary Data—Note 2, “Significant Accounting Policies—Recently Adopted Accounting Standards and Recently Issued Accounting Standards not yet Adopted,” in the Notes to our Consolidated Financial Statements included in this Annual Report on Form 10-K for a description of recently issued and adopted accounting pronouncements.
Critical Accounting Policies and Estimates
The discussion and analysis of our financial condition and results of operations is based on our consolidated financial statements, which have been prepared in accordance with accounting principles generally accepted in the United States of America. The preparation of these consolidated financial statements requires us to make estimates and assumptions that affect the reported amounts of assets and liabilities and the disclosure of contingent assets and liabilities at the dates of the consolidated financial statements and the reported revenues and expenses during the reporting periods. We evaluate these estimates and assumptions on an ongoing basis and base our estimates on historical experience, current conditions and various other assumptions that we believe to be reasonable under the circumstances. The results of these estimates form the basis for making judgments about the carrying values of assets and liabilities as well as identifying and assessing the accounting treatment with respect to commitments and contingencies. Our actual results may materially differ from these estimates.
Listed below are accounting policies we believe are critical to our consolidated financial statements due to the degree of uncertainty regarding the estimates or assumptions involved, which we believe are critical to the understanding of our operations.
Revenue Recognition
We primarily earn revenue by supplying wood pellets to customers under off-take contracts, the majority of the commitments under which are long-term in nature. We refer to the structure of our off-take contracts as “take-or-pay” because they include a firm obligation of the customer to take a fixed quantity of product at a stated price and provisions that ensure we will be compensated in the case of a customer’s failure to accept all or a part of the contracted volumes or termination of a contract. Our long-term off-take contracts define the annual volume of wood pellets that a customer is required to purchase and we are required to sell, the fixed price per MT for product satisfying a base net calorific value and other technical specifications. The prices are fixed for the entire term and are subject to adjustments which may include annual inflation-based adjustments or price escalators, price adjustments for product specifications, as well as, in some instances, price adjustments due to changes in underlying indices. In addition to sales of our product under these long-term off-take contracts, we routinely sell wood pellets under shorter-term contracts, which range in volume and tenor and, in some cases, may include only one specific shipment. Because each of our off-take contracts is a bilaterally negotiated agreement, our revenue over the duration of such contracts does not generally follow observable current market pricing trends. Our performance obligations under these contracts, which we aggregate into metric tons, include the delivery of wood pellets. We account for each MT as a single performance obligation. Our revenue from the sales of wood pellets we produce is recognized as product sales upon satisfaction of our performance obligation when control transfers to the customer at the time of loading wood pellets onto a ship.
Depending on the specific off‑take contract, shipping terms are either CIF, CFR or FOB. Under a CIF contract, we procure and pay for shipping costs, which include insurance and all other charges, up to the port of destination for the customer. Under a CFR contract, we procure and pay for shipping costs, which include insurance (excluding marine cargo insurance) and all other charges, up to the port of destination for the customer. Shipping under CIF and CFR contracts after control has passed to the customer is considered a fulfillment activity rather than a performance obligation and associated expenses are included in the price to the customer. Under FOB contracts, the customer is directly responsible for shipping costs.
In some cases, we may purchase shipments of product from third-party suppliers and resell them in back-to-back transactions (“purchase and sale transactions”). We determined that we are the principal in such transactions because we control the pellets prior to transferring them to the customer and therefore we recognize the related revenue on a gross basis in product sales.
In instances in which a customer requests the cancellation, deferral or acceleration of a shipment, the customer may pay a fee, which is included in other revenue.
65
We recognize third- and related-party terminal services revenue ratably over the related contract term, which is included in other revenue. Terminal services are performance obligations that are satisfied over time, as customers simultaneously receive and consume the benefits of the terminal services we perform. The consideration is generally fixed for minimum quantities and any services above the minimum are generally billed based on a per-ton rate as variable consideration and recognized as services performed. Any deficiency payments receivable and probable of being collected from a customer not meeting quarterly minimum throughput requirements are recognized during the related quarter in satisfaction of the related performance obligation.
Variable consideration from off-take contracts arises from several pricing features outlined in our off-take contracts, pursuant to which such contract pricing may be adjusted in respect of particular shipments to reflect differences between certain contractual quality specifications of the wood pellets as measured both when the wood pellets are loaded onto ships and unloaded at the discharge port as well as certain other contractual adjustments.
Variable consideration from terminal services contracts arises from price increases based on agreed inflation indices and from above-minimum throughput quantities or services.
We allocate variable consideration under our off-take and terminal services contracts entirely to each performance obligation to which variable consideration relates. The estimate of variable consideration represents the amount that is probable that a significant reversal in the amount of cumulative revenue recognized will not occur when the uncertainty is resolved.
Under our off-take contracts, customers are obligated to pay the majority of the purchase price prior to the arrival of the ship at the customers’ discharge port. The remaining portion is paid after the wood pellets are unloaded at the discharge port. We generally recognize revenue prior to the issuance of an invoice to the customer.
Cost of Goods Sold
Cost of goods sold includes the cost to produce and deliver wood pellets to customers, reimbursable shipping-related costs associated with specific off-take contracts with CIF and CFR shipping terms and costs associated with purchase and sale transactions. Raw material, production and distribution costs associated with delivering wood pellets to marine terminals and third- and related-party wood pellet purchase costs are capitalized as a component of inventory. Fixed production overhead, including the related depreciation expense, is allocated to inventory based on the normal capacity of our production plants. These costs are reflected in cost of goods sold when inventory is sold. Distribution costs associated with shipping wood pellets to customers are expensed as incurred. Inventory is recorded using FIFO, which requires the use of judgment and estimates. The calculation of cost of goods sold is based on estimates used in the valuation of the FIFO inventory and in determining the specific composition of inventory that is sold to each customer.
We have strategically located our plants in the Southeastern United States, a region with plentiful wood fiber resources. We manage the supply of raw materials into our plants primarily through short-term contracts. Delivered wood fiber costs include stumpage as well as harvesting, transportation and, in some cases, size reduction services provided by our suppliers. The majority of our product volumes are sold under long-term off-take contracts that include cost pass-through mechanisms to mitigate increases in raw material and distribution costs.
Production costs at our production plants consist of labor, energy, tooling, repairs and maintenance and plant overhead costs. Production costs also include depreciation expense associated with the use of our plants and equipment and any gain or loss on disposal of associated assets. Some of our off-take contracts include price escalators that mitigate inflationary pressure on certain components of our production costs. In addition to the wood pellets that we produce at our owned and operated production plants, we selectively purchase additional quantities of wood pellets from third-party wood pellet producers.
Distribution costs include all transportation costs from our plants to our terminal locations, any storage or handling costs while the product remains at the terminal and shipping costs related to the delivery of our product from our terminal locations to our customers. Both the strategic location of our plants and our ownership or control of our marine terminals has allowed for the efficient and cost‑effective transportation of our wood pellets. We seek to mitigate shipping risk by entering into long-term, fixed-price shipping contracts with reputable shippers matching the terms and volumes of our off‑take contracts pursuant to which we are responsible for arranging shipping. Certain of our off-take contracts include pricing adjustments for volatility in fuel prices, which allows us to pass the majority of the fuel price risk associated with shipping through to our customers under those contracts.
Property, Plant and Equipment
Property, plant and equipment are recorded at cost, which includes the fair values of assets acquired. Equipment under finance leases is stated at the present value of lease payments. Useful lives of assets are based on historical experience and other
66
relevant information. The useful lives are adjusted when changes in the expected physical life of the asset, its planned use, technological advances or other factors show that a different life would be more appropriate. Changes in useful lives are recognized prospectively.
Depreciation is calculated using the straight-line method based on the estimated useful lives of the related assets. Plant and equipment held under finance leases are amortized on a straight‑line basis over the shorter of the lease term or estimated useful life of the asset.
Construction in progress primarily represents expenditures for the development and expansion of facilities. Capitalized interest cost and all direct costs, which include equipment and engineering costs related to the development and expansion of facilities, are capitalized as construction in progress. Depreciation is not recognized for amounts in construction in progress.
Normal repairs and maintenance costs are expensed as incurred. Amounts incurred that extend an asset’s useful life, increase its productivity or add production capacity are capitalized. Direct costs, such as outside labor, materials, internal payroll and benefits costs incurred during the construction of a new plant are capitalized; indirect costs are not capitalized. Repairs and maintenance costs were $21.9 million, $32.5 million and $21.4 million for the years ended December 31, 2019, 2018 and 2017, respectively.
Asset Impairment Assessments
Long-Lived Assets
Long-lived assets, such as property, plant and equipment and amortizable intangible assets, are tested for impairment whenever events or changes in circumstances indicate that the carrying amount of an asset may not be recoverable. If circumstances require that a long-lived asset or asset group be tested for possible impairment, we first compare undiscounted cash flows expected to be generated by that asset or asset group to such asset or asset group’s carrying value. If the carrying value of the long-lived asset or asset group is not recoverable on an undiscounted cash flow basis, an impairment is recognized to the extent that the carrying value exceeds its fair value. Fair value is determined through various valuation techniques including discounted cash flow models, quoted market values and third-party independent appraisals, as applicable.
Goodwill
Goodwill represents the purchase price paid for acquired businesses in excess of the identifiable acquired assets and assumed liabilities. Goodwill is not amortized but is tested for impairment annually and whenever an event occurs or circumstances change such that it is more likely than not that the fair value of the reporting unit is less than its carrying amounts. At December 31, 2019 and 2018, we identified one reporting unit that corresponded to our one reportable segment. We have selected December 1 to perform our annual goodwill impairment test.
The Partnership has the option of performing a qualitative assessment of goodwill to determine whether it is more likely than not that the fair value of its equity is less than the carrying value. If it is more likely than not that the fair value exceeds the carrying value, then no further testing is necessary; otherwise, the Partnership must perform a two-step quantitative assessment of goodwill. The Partnership may elect to bypass the qualitative assessment and proceed directly to performing a two-step quantitative assessment.
For the year ended December 31, 2019, the Partnership elected to perform a quantitative goodwill impairment assessment as the Partnership elected to perform a qualitative analysis in 2018. There have been no impairments to the carrying value of the Partnership’s goodwill during the periods presented (see Note 12, Goodwill).
67
ITEM 7A. | QUANTITATIVE AND QUALITATIVE DISCLOSURES ABOUT MARKET RISK |
Market risk is the risk of loss arising from adverse changes in market rates and prices. Historically, our risks have been predominantly related to potential changes in the fair value of our long-term debt due to fluctuations in applicable market interest rates. Our market risk exposure is expected to be limited to risks that arise in the normal course of business, as we do not engage in speculative, non‑operating transactions, nor do we use financial instruments or derivative instruments for trading purposes.
Interest Rate Risk
At December 31, 2019, our total debt had a carrying value of $603.0 million and fair value of $653.8 million.
Although we seek to mitigate a portion of our interest rate risk through interest rate swaps, we are exposed to fluctuations in interest rates on borrowings under the senior secured revolving credit facility. Borrowings under the senior secured revolving credit facility bear interest, at our option, at either a base rate plus an applicable margin or at a Eurodollar rate (with a 1.00% floor for term loan borrowings) plus an applicable margin.
In September 2016, we entered into a pay-fixed, receive-variable interest rate swap agreement to fix our exposure to fluctuations in London Interbank Offered Rate-based interest rates. The interest rate swap commenced on September 30, 2016 and expires in April 2020. We elected to discontinue hedge accounting as of December 14, 2016 following repayment of a portion of our outstanding indebtedness under the senior secured revolving credit facility and subsequently re-designated the interest rate swap for the remaining portion of such indebtedness during the year ended December 31, 2017. We enter into derivative instruments to manage cash flow. We do not enter into derivative instruments for speculative or trading purposes. The counterparty to our interest rate swap agreement is a major financial institution.
There can be no assurance that our interest rate risk-management practices, if any, will eliminate or substantially reduce risks associated with fluctuating interest rates. For more information, please read Part I, Item 1A “Risk Factors—Our exposure to risks associated with foreign currency and interest rate fluctuations, as well the hedging arrangements we may enter into to mitigate those risks, could have an adverse effect on our financial condition and results of operations.”
Credit Risk
Substantially all of our revenue was from long-term, take-or-pay off-take contracts with four customers for the years ended December 31, 2019, 2018 and 2017. Most of our customers are major power generators in Europe. This concentration of counterparties operating in a single industry and geographic area may increase our overall exposure to credit risk, in that the counterparties may be similarly affected by changes in economic, political, regulatory or other conditions. If a customer defaults or if any of our contracts expire in accordance with their terms, and we are unable to renew or replace these contracts, our gross margin and cash flows and our ability to make cash distributions to our unitholders may be adversely affected. Although we have entered into hedging arrangements in order to minimize our exposure to fluctuations in foreign currency exchange and interest rates, our derivatives also expose us to credit risk to the extent that counterparties may be unable to meet the terms of our hedging agreements. For more information, please read Part I, Item 1A “Risk Factors—Our exposure to risks associated with foreign currency and interest rate fluctuations, as well the hedging arrangements we may enter into to mitigate those risks, could have an adverse effect on our financial condition and results of operations and —Substantially all of our revenues currently are generated under contracts with four customers, and the loss of any of them could adversely affect our business, financial condition, results of operations, cash flows and ability to make cash distributions. We may not be able to renew or obtain new and favorable contracts with these customers when our existing contracts expire, which could adversely affect our revenues and profitability.”
Foreign Currency Exchange Risk
We primarily are exposed to fluctuations in foreign currency exchange rates related to contracts pursuant to which deliveries of wood pellets will be settled in foreign currency. We have entered into forward contracts and purchased options to hedge a portion of our forecasted revenue for these customer contracts.
As of December 31, 2019, we had notional amounts of 50.6 million GBP under foreign currency forward contracts and 43.4 million GBP and 1.2 million Euro (“EUR”) under foreign currency purchased options that expire between 2020 and 2023. As of December 31, 2019, we had no EUR forwards outstanding.
Historically, we designated and accounted for forward contracts and purchased options as cash flow hedges of anticipated foreign currency denominated revenue and, therefore, the effective portion of the changes in fair value on these instruments was recorded as a component of accumulated other comprehensive income in partners’ capital and was reclassified to revenue in the consolidated statements of operations in the same period in which the underlying revenue transactions occurred. During the
68
third quarter of 2018, we elected to discontinue hedge accounting for all designated foreign currency cash flow hedges and, as a result, we had no unrealized loss (gain) associated with foreign currency forward contracts and foreign currency purchased options in accumulated other comprehensive income. During December 2017, we determined that certain transactions were probable of not occurring within the forecasted time period. We discontinued hedge accounting for these transactions and a $1.6 million loss included in other comprehensive income related to these hedging relationships was reclassified to other expense on the consolidated statements of operations. At December 31, 2019 and December 31, 2018, no unrealized amounts associated with foreign currency forward contracts and foreign currency purchased options are included in other comprehensive income. At December 31, 2017, the unrealized loss associated with foreign currency forward contracts and foreign currency purchased options of approximately $2.1 million and $1.2 million, respectively, were included in other comprehensive income.
We do not utilize foreign exchange contracts for speculative or trading purposes. The counterparties to our foreign exchange contracts are major financial institutions. There can be no assurance that our hedging arrangements or other foreign exchange rate risk-management practices, if any, will eliminate or substantially reduce risks associated with our exposure to fluctuating foreign exchange rates. For more information, please read Part I, Item 1A “Risk Factors—Our exposure to risks associated with foreign currency and interest rate fluctuations, as well the hedging arrangements we may enter into to mitigate those risks, could have an adverse effect on our financial condition and results of operations.”
69
ITEM 8. | FINANCIAL STATEMENTS AND SUPPLEMENTARY DATA |
INDEX TO FINANCIAL STATEMENTS
ENVIVA PARTNERS, LP AND SUBSIDIARIES
70
Report of Independent Registered Public Accounting Firm
To the Unitholders and the Board of Directors of Enviva Partners, LP
Opinion on the Financial Statements
We have audited the accompanying consolidated balance sheet of Enviva Partners, LP and its subsidiaries (the Partnership) as of December 31, 2019, the related consolidated statement of operations, comprehensive (loss) income, changes in partners’ capital and cash flows for the year ended December 31, 2019, and the related notes (collectively referred to as the “consolidated financial statements”). In our opinion, the consolidated financial statements present fairly, in all material respects, the financial position of the Partnership at December 31, 2019, and the results of its operations and cash flows for the year ended December 31, 2019, in conformity with U.S. generally accepted accounting principles.
Adoption of New Accounting Standards
As discussed in Note 2 to the consolidated financial statements, the Partnership changed its method of accounting for leases as a result of the adoption of ASU 2016-02, Leases (Topic 842), and the amendments in ASUs 2017-13, 2018-01, 2018-10, 2018-11, 2018-20, and 2019-01, effective January 1, 2019.
Basis for Opinion
These financial statements are the responsibility of the management of the Partnership’s General Partner. Our responsibility is to express an opinion on the Partnership’s financial statements based on our audit. We are a public accounting firm registered with the Public Company Accounting Oversight Board (United States) (PCAOB) and are required to be independent with respect to the Partnership in accordance with the U.S. federal securities laws and the applicable rules and regulations of the Securities and Exchange Commission and the PCAOB.
We conducted our audit in accordance with the standards of the PCAOB. Those standards require that we plan and perform the audit to obtain reasonable assurance about whether the financial statements are free of material misstatement, whether due to error or fraud. The Partnership is not required to have, nor were we engaged to perform, an audit of its internal control over financial reporting. As part of our audit we are required to obtain an understanding of internal control over financial reporting but not for the purpose of expressing an opinion on the effectiveness of the Partnership’s internal control over financial reporting. Accordingly, we express no such opinion.
Our audit included performing procedures to assess the risks of material misstatement of the financial statements, whether due to error or fraud, and performing procedures that respond to those risks. Such procedures included examining, on a test basis, evidence regarding the amounts and disclosures in the financial statements. Our audit also included evaluating the accounting principles used and significant estimates made by the General Partner’s management, as well as evaluating the overall presentation of the financial statements. We believe that our audit provides a reasonable basis for our opinion.
/s/ Ernst & Young, LLP
We have served as the Partnership’s auditor since 2019.
Tysons, Virginia
February 26, 2020
71
Report of Independent Registered Public Accounting Firm
The Unitholders and Board of Directors
Enviva Partners, LP:
Opinion on the Consolidated Financial Statements
We have audited the accompanying consolidated balance sheet of Enviva Partners, LP and subsidiaries (the Partnership) as of December 31, 2018, the related consolidated statements of income, comprehensive income, changes in partners’ capital, and cash flows for each of the years in the two‑year period then ended, and the related notes (collectively, the consolidated financial statements). In our opinion, the consolidated financial statements present fairly, in all material respects, the financial position of the Partnership as of December 31, 2018, and the results of its operations and its cash flows for each of the years in the two‑year period then ended, in conformity with U.S. generally accepted accounting principles.
Change in Accounting Principle
As discussed in Note 2 to the consolidated financial statements, the Partnership has changed its method of accounting for revenue effective January 1, 2018 due to the adoption of Accounting Standards Update No. 2014-09, Revenue from Contracts with Customers (Topic 606) and its subsequent amendments.
Basis for Opinion
These consolidated financial statements are the responsibility of the Partnership’s management. Our responsibility is to express an opinion on these consolidated financial statements based on our audits. We are a public accounting firm registered with the Public Company Accounting Oversight Board (United States) (PCAOB) and are required to be independent with respect to the Partnership in accordance with the U.S. federal securities laws and the applicable rules and regulations of the Securities and Exchange Commission and the PCAOB.
We conducted our audits in accordance with the standards of the PCAOB. Those standards require that we plan and perform the audit to obtain reasonable assurance about whether the consolidated financial statements are free of material misstatement, whether due to error or fraud. The Partnership is not required to have, nor were we engaged to perform, an audit of its internal control over financial reporting. As part of our audits, we are required to obtain an understanding of internal control over financial reporting but not for the purpose of expressing an opinion on the effectiveness of the Partnership’s internal control over financial reporting. Accordingly, we express no such opinion.
Our audits included performing procedures to assess the risks of material misstatement of the consolidated financial statements, whether due to error or fraud, and performing procedures that respond to those risks. Such procedures included examining, on a test basis, evidence regarding the amounts and disclosures in the consolidated financial statements. Our audits also included evaluating the accounting principles used and significant estimates made by management, as well as evaluating the overall presentation of the consolidated financial statements. We believe that our audits provide a reasonable basis for our opinion.
(signed) KPMG LLP
We served as the Partnership’s auditor from 2010 to 2019.
McLean, Virginia
March 1, 2019
72
ENVIVA PARTNERS, LP AND SUBSIDIARIES
Consolidated Balance Sheets
December 31, 2019 and 2018
(In thousands, except number of units)
See accompanying notes to consolidated financial statements.
2019 | 2018 | ||||||
Assets | |||||||
Current assets: | |||||||
Cash and cash equivalents | $ | 9,053 | $ | 2,460 | |||
Accounts receivable | 72,421 | 54,794 | |||||
Insurance receivables | 275 | 5,140 | |||||
Related-party receivables | — | 1,392 | |||||
Inventories | 32,998 | 31,490 | |||||
Prepaid expenses and other current assets | 5,342 | 2,235 | |||||
Total current assets | 120,089 | 97,511 | |||||
Property, plant and equipment, net | 751,780 | 557,028 | |||||
Operating lease right-of-use assets | 32,830 | — | |||||
Goodwill | 85,615 | 85,615 | |||||
Other long-term assets | 4,504 | 8,616 | |||||
Total assets | $ | 994,818 | $ | 748,770 | |||
Liabilities and Partners’ Capital | |||||||
Current liabilities: | |||||||
Accounts payable | $ | 18,985 | $ | 15,551 | |||
Related-party payables, net | 304 | 28,225 | |||||
Deferred consideration for drop-downs due to related-party | 40,000 | 74,000 | |||||
Accrued and other current liabilities | 59,066 | 41,400 | |||||
Current portion of interest payable | 3,427 | 5,434 | |||||
Current portion of long-term debt and finance lease obligations | 6,590 | 2,722 | |||||
Total current liabilities | 128,372 | 167,332 | |||||
Long-term debt and finance lease obligations | 596,430 | 429,933 | |||||
Long-term operating lease liabilities | 33,469 | — | |||||
Long-term interest payable | — | 1,010 | |||||
Other long-term liabilities | 3,971 | 3,779 | |||||
Total liabilities | 762,242 | 602,054 | |||||
Commitments and contingencies | |||||||
Partners’ capital: | |||||||
Limited partners: | |||||||
Common unitholders—public (19,870,436 and 14,573,452 units issued and outstanding at December 31, 2019 and 2018, respectively) | 300,184 | 207,612 | |||||
Common unitholder—sponsor (13,586,375 and 11,905,138 units issued and outstanding at December 31, 2019 and 2018, respectively) | 82,300 | 72,352 | |||||
General partner (no outstanding units) | (101,739 | ) | (133,687 | ) | |||
Accumulated other comprehensive income | 23 | 439 | |||||
Total Enviva Partners, LP partners’ capital | 280,768 | 146,716 | |||||
Noncontrolling interest | (48,192 | ) | — | ||||
Total partners' capital | 232,576 | 146,716 | |||||
Total liabilities and partners’ capital | $ | 994,818 | $ | 748,770 | |||
73
ENVIVA PARTNERS, LP AND SUBSIDIARIES
Consolidated Statements of Operations
Years ended December 31, 2019, 2018 and 2017
(In thousands, except per unit amounts)
2019 | 2018 | 2017 | |||||||||
Product sales | $ | 674,251 | $ | 564,010 | $ | 522,250 | |||||
Other revenue (1) | 10,142 | 9,731 | 20,971 | ||||||||
Net revenue | 684,393 | 573,741 | 543,221 | ||||||||
Cost of goods sold (1) | 549,701 | 461,735 | 419,616 | ||||||||
Loss on disposal of assets | 3,103 | 2,386 | 4,899 | ||||||||
Depreciation and amortization | 50,521 | 40,179 | 39,904 | ||||||||
Total cost of goods sold | 603,325 | 504,300 | 464,419 | ||||||||
Gross margin | 81,068 | 69,441 | 78,802 | ||||||||
General and administrative expenses | 11,897 | 10,545 | 14,975 | ||||||||
Related-party management services agreement fee | 24,492 | 17,096 | 15,132 | ||||||||
Disposal of assets held for sale | — | — | 827 | ||||||||
Total general and administrative expenses | 36,389 | 27,641 | 30,934 | ||||||||
Income from operations | 44,679 | 41,800 | 47,868 | ||||||||
Other income (expense): | |||||||||||
Interest expense | (39,344 | ) | (36,471 | ) | (31,744 | ) | |||||
Early retirement of debt obligation | (9,042 | ) | (751 | ) | — | ||||||
Other income (expense) | 764 | 2,374 | (1,751 | ) | |||||||
Total other expense, net | (47,622 | ) | (34,848 | ) | (33,495 | ) | |||||
Net (loss) income | (2,943 | ) | 6,952 | 14,373 | |||||||
Less net loss attributable to noncontrolling partners’ interests | — | — | 3,140 | ||||||||
Net (loss) income attributable to Enviva Partners, LP | $ | (2,943 | ) | $ | 6,952 | $ | 17,513 | ||||
Less: Pre-acquisition loss from inception to October 1, 2017 from operations of Enviva Port of Wilmington, LLC Drop-Down allocated to General Partner | — | — | (3,049 | ) | |||||||
Enviva Partners, LP limited partners’ interest in net (loss) income | $ | (2,943 | ) | $ | 6,952 | $ | 20,562 | ||||
Net (loss) income per limited partner common unit: | |||||||||||
Basic | $ | (0.54 | ) | $ | 0.04 | $ | 0.65 | ||||
Diluted | $ | (0.54 | ) | $ | 0.04 | $ | 0.61 | ||||
Net income per limited partner subordinated unit: | |||||||||||
Basic | $ | — | $ | 0.04 | $ | 0.65 | |||||
Diluted | $ | — | $ | 0.04 | $ | 0.65 | |||||
Weighted-average number of limited partner units outstanding: | |||||||||||
Common—basic | 31,791 | 21,533 | 14,403 | ||||||||
Common—diluted | 31,791 | 22,553 | 15,351 | ||||||||
Subordinated—basic and diluted | — | 4,893 | 11,905 | ||||||||
(1) See Note 15, Related-Party Transactions | |||||||||||
See accompanying notes to consolidated financial statements.
74
ENVIVA PARTNERS, LP AND SUBSIDIARIES
Consolidated Statements of Comprehensive (Loss) Income
Years ended December 31, 2019, 2018 and 2017
(In thousands)
2019 | 2018 | 2017 | |||||||||
Net (loss) income | $ | (2,943 | ) | $ | 6,952 | $ | 14,373 | ||||
Other comprehensive (loss) income: | |||||||||||
Net unrealized (losses) gains on cash flow hedges | (146 | ) | 5,655 | (5,463 | ) | ||||||
Reclassification of net (gains) losses on cash flow hedges realized into net (loss) income | (288 | ) | (2,178 | ) | 1,828 | ||||||
Currency translation adjustment | — | 2 | — | ||||||||
Total other comprehensive (loss) income | (434 | ) | 3,479 | (3,635 | ) | ||||||
Total comprehensive (loss) income | (3,377 | ) | 10,431 | 10,738 | |||||||
Less: | |||||||||||
Pre-acquisition loss from inception to October 1, 2017 from operations of Enviva Port of Wilmington, LLC Drop-Down allocated to General Partner | — | — | (3,049 | ) | |||||||
Total comprehensive (loss) income subsequent to Enviva Port of Wilmington, LLC Drop-Down | (3,377 | ) | 10,431 | 13,787 | |||||||
Less: | |||||||||||
Comprehensive loss attributable to noncontrolling partners’ interests | — | — | (3,140 | ) | |||||||
Comprehensive (loss) income attributable to Enviva Partners, LP partners | $ | (3,377 | ) | $ | 10,431 | $ | 16,927 | ||||
See accompanying notes to consolidated financial statements.
75
ENVIVA PARTNERS, LP AND SUBSIDIARIES
Consolidated Statements of Changes in Partners’ Capital
Years ended December 31, 2019, 2018 and 2017
(In thousands)
Limited Partners’ Capital | ||||||||||||||||||||||||||||||||||||
General Partner Interest | Common Units— Public | Common Units— Sponsor | Subordinated Units— Sponsor | Accumulated Other Comprehensive Income (loss) | Non- controlling Interests | Total Partners Capital | ||||||||||||||||||||||||||||||
Units | Amount | Units | Amount | Units | Amount | |||||||||||||||||||||||||||||||
Partners’ capital, December 31, 2016 | $ | (40,713 | ) | 12,981 | $ | 239,902 | 1,347 | $ | 18,197 | 11,905 | $ | 120,872 | $ | 595 | $ | 38,009 | $ | 376,862 | ||||||||||||||||||
Distributions to unitholders, distribution equivalent and incentive distribution rights | (2,630 | ) | — | (31,533 | ) | — | (3,065 | ) | — | (27,084 | ) | — | — | (64,312 | ) | |||||||||||||||||||||
Issuance of units through Long-Term Incentive Plan | — | 21 | 503 | — | — | — | — | — | — | 503 | ||||||||||||||||||||||||||
Issuance of common units, net | — | 71 | 1,744 | — | — | — | — | — | — | 1,744 | ||||||||||||||||||||||||||
Non-cash Management Services Agreement expenses | 441 | — | 4,511 | — | — | — | — | — | — | 4,952 | ||||||||||||||||||||||||||
Other comprehensive loss | — | — | — | — | — | — | — | (3,635 | ) | — | (3,635 | ) | ||||||||||||||||||||||||
Excess consideration over Enviva Pellets Sampson, LLC net assets | (744 | ) | — | — | — | — | — | — | — | — | (744 | ) | ||||||||||||||||||||||||
Contribution of Enviva Port of Wilmington, LLC Drop-Down | 29,513 | — | — | — | — | — | — | — | (32,270 | ) | (2,757 | ) | ||||||||||||||||||||||||
Enviva Port of Wilmington, LLC net assets | (73,335 | ) | — | — | — | — | — | — | — | — | (73,335 | ) | ||||||||||||||||||||||||
Excess consideration over Enviva Port of Wilmington, LLC net Assets | (40,683 | ) | — | — | — | — | — | — | — | — | (40,683 | ) | ||||||||||||||||||||||||
Enviva Pellets Wiggins, LLC dissolution | — | — | — | — | — | — | — | — | (2,599 | ) | (2,599 | ) | ||||||||||||||||||||||||
Net (loss) income | (418 | ) | — | 8,900 | — | 918 | — | 8,113 | — | (3,140 | ) | 14,373 | ||||||||||||||||||||||||
Partners’ capital, December 31, 2017 | (128,569 | ) | 13,073 | 224,027 | 1,347 | 16,050 | 11,905 | 101,901 | (3,040 | ) | — | 210,369 | ||||||||||||||||||||||||
Distributions to unitholders, distribution equivalent and incentive distribution rights | (5,326 | ) | — | (38,241 | ) | — | (15,845 | ) | — | (14,822 | ) | — | — | (74,234 | ) | |||||||||||||||||||||
Issuance of units through Long-Term Incentive Plan | (5,675 | ) | 227 | 511 | (82 | ) | (1,301 | ) | — | — | — | — | (6,465 | ) | ||||||||||||||||||||||
Issuance of common units, net | — | 8 | 241 | — | — | — | — | — | — | 241 | ||||||||||||||||||||||||||
Sale of common units | — | 1,265 | 13,335 | (1,265 | ) | (13,335 | ) | — | — | — | — | — | ||||||||||||||||||||||||
Conversion of subordinated units to common units | — | — | — | 11,905 | 78,504 | (11,905 | ) | (78,504 | ) | — | — | — | ||||||||||||||||||||||||
Non-cash Management Services Agreement expenses | 557 | — | 5,817 | — | — | — | — | — | — | 6,374 | ||||||||||||||||||||||||||
Other comprehensive income | — | — | — | — | — | — | — | 3,479 | — | 3,479 | ||||||||||||||||||||||||||
Net income (loss) | 5,326 | — | 1,922 | — | 8,279 | — | (8,575 | ) | — | — | 6,952 | |||||||||||||||||||||||||
Partners’ capital, December 31, 2018 | (133,687 | ) | 14,573 | 207,612 | 11,905 | 72,352 | — | — | 439 | — | 146,716 | |||||||||||||||||||||||||
Excess consideration over Enviva Wilmington Holdings, LLC net assets and initial recognition of its noncontrolling interest | 5,422 | — | — | — | — | — | — | — | (48,192 | ) | (42,770 | ) | ||||||||||||||||||||||||
Distributions to unitholders, distribution equivalent and incentive distribution rights | (9,821 | ) | — | (51,906 | ) | — | (34,452 | ) | — | — | — | — | (96,179 | ) | ||||||||||||||||||||||
Issuance of units through Long-Term Incentive Plan | (1,882 | ) | 97 | 72 | — | — | — | — | — | — | (1,810 | ) | ||||||||||||||||||||||||
Issuance of common units, net | — | 5,200 | 146,278 | — | — | — | — | — | — | 146,278 | ||||||||||||||||||||||||||
Issuance of units associated with the Hamlet Drop-Down | — | — | — | 1,681 | 50,000 | — | — | — | — | 50,000 | ||||||||||||||||||||||||||
Non-cash Management Services Agreement expenses | 23,687 | — | 5,310 | — | — | — | — | — | — | 28,997 | ||||||||||||||||||||||||||
Reimbursable amounts under Make-Whole Agreement | 4,721 | — | — | — | — | — | — | — | — | 4,721 | ||||||||||||||||||||||||||
Cumulative effect of accounting change - derivative instruments | — | — | (10 | ) | — | (8 | ) | — | — | 18 | — | — | ||||||||||||||||||||||||
Other comprehensive loss | — | — | — | — | — | — | — | (434 | ) | — | (434 | ) | ||||||||||||||||||||||||
Net income (loss) | 9,821 | — | (7,172 | ) | — | (5,592 | ) | — | — | — | — | (2,943 | ) | |||||||||||||||||||||||
Partners’ capital, December 31, 2019 | $ | (101,739 | ) | 19,870 | $ | 300,184 | 13,586 | $ | 82,300 | — | $ | — | $ | 23 | $ | (48,192 | ) | $ | 232,576 | |||||||||||||||||
See accompanying notes to consolidated financial statements.
76
ENVIVA PARTNERS, LP AND SUBSIDIARIES
Consolidated Statements of Cash Flows
Years ended December 31, 2019, 2018 and 2017
(In thousands)
2019 | 2018 | 2017 | |||||||||
Cash flows from operating activities: | |||||||||||
Net (loss) income | $ | (2,943 | ) | $ | 6,952 | $ | 14,373 | ||||
Adjustments to reconcile net (loss) income to net cash provided by operating activities: | |||||||||||
Depreciation and amortization | 51,581 | 40,745 | 40,361 | ||||||||
MSA Fee Waivers | 22,600 | — | — | ||||||||
Amortization of debt issuance costs, debt premium and original issue discounts | 1,243 | 1,093 | 1,448 | ||||||||
General and administrative expense incurred by the Hamlet JV prior to Enviva Port of Wilmington, LLC and Enviva Pellets Sampson, LLC Drop-Downs | — | — | 1,343 | ||||||||
Early retirement of debt obligation | 9,042 | 751 | — | ||||||||
Loss on disposal of assets and assets held for sale | 3,103 | 2,386 | 5,726 | ||||||||
Unit-based compensation | 5,410 | 6,229 | 5,014 | ||||||||
De-designation of foreign currency forwards and options | — | (1,947 | ) | 1,593 | |||||||
Fair value changes in derivatives | 3,701 | (7,464 | ) | — | |||||||
Unrealized loss on foreign currency transactions, net | 177 | 23 | (3 | ) | |||||||
Change in operating assets and liabilities: | |||||||||||
Accounts and insurance receivables | (16,330 | ) | 19,230 | (1,317 | ) | ||||||
Related-party receivables | 1,392 | 2,720 | 1,577 | ||||||||
Prepaid expenses, assets held for sale and other current and long-term assets | (358 | ) | (182 | ) | (138 | ) | |||||
Inventories | (1,889 | ) | (7,843 | ) | 5,758 | ||||||
Derivatives | 1,770 | 4,907 | (1,720 | ) | |||||||
Accounts payable, accrued liabilities and other current liabilities | 9,287 | 14,916 | (2,331 | ) | |||||||
Related-party payables and accrued liabilities | (27,933 | ) | 173 | 15,733 | |||||||
Deferred revenue | 3,887 | — | — | ||||||||
Accrued interest | (5,148 | ) | 367 | (1,330 | ) | ||||||
Operating lease liabilities | (4,826 | ) | — | — | |||||||
Other long-term liabilities | 94 | 997 | 1,008 | ||||||||
Net cash provided by operating activities | 53,860 | 84,053 | 87,095 | ||||||||
Cash flows from investing activities: | |||||||||||
Purchases of property, plant and equipment | (111,269 | ) | (27,132 | ) | (28,744 | ) | |||||
Payment in relation to the Hamlet Drop-Down | (74,700 | ) | — | — | |||||||
Insurance proceeds from property loss | — | 1,130 | — | ||||||||
Proceeds from the sale of property, plant and equipment | — | — | 143 | ||||||||
Other | 8,486 | — | — | ||||||||
Net cash used in investing activities | (177,483 | ) | (26,002 | ) | (28,601 | ) | |||||
Cash flows from financing activities: | |||||||||||
Proceeds from senior secured revolving credit facility | 453,000 | 299,250 | 131,952 | ||||||||
Principal payments on senior secured revolving credit facility | (526,000 | ) | (226,250 | ) | (81,000 | ) | |||||
Principal payments on other long-term debt and finance lease obligations | (358,311 | ) | (46,466 | ) | (1,954 | ) | |||||
Cash paid related to debt issuance costs and deferred offering costs | (7,560 | ) | (2,495 | ) | (735 | ) | |||||
Distributions, proceeds from contributions and contributions associated with Enviva Pellets Sampson, LLC and Enviva Port of Wilmington, LLC Drop-Downs from our sponsor and Hamlet JV | — | — | (44,312 | ) | |||||||
Proceeds from common unit issuances, net | 96,822 | 241 | 1,938 | ||||||||
Payment of deferred consideration for Wilmington Drop-Down | (24,300 | ) | — | — | |||||||
Distributions to unitholders, distribution equivalent rights and incentive distribution rights holder | (95,659 | ) | (73,518 | ) | (64,325 | ) | |||||
Proceeds from debt issuance | 601,777 | — | — | ||||||||
Payment to General Partner to purchase affiliate common units for Long-Term Incentive Plan vesting | — | (2,341 | ) | — | |||||||
Payment for withholding tax associated with Long-Term Incentive Plan vesting | (1,910 | ) | (4,536 | ) | — | ||||||
Payments in relation to the Hamlet Drop-Down | (99 | ) | — | — | |||||||
Cash paid for redemption premium from early retirement of debt | (7,544 | ) | — | — | |||||||
Net cash provided by (used in) financing activities | 130,216 | (56,115 | ) | (58,436 | ) | ||||||
Net increase in cash, cash equivalents and restricted cash | 6,593 | 1,936 | 58 | ||||||||
Cash, cash equivalents and restricted cash, beginning of period | 2,460 | 524 | 466 | ||||||||
Cash, cash equivalents and restricted cash, end of period | $ | 9,053 | $ | 2,460 | $ | 524 | |||||
See accompanying notes to consolidated financial statements.
77
ENVIVA PARTNERS, LP AND SUBSIDIARIES
Consolidated Statements of Cash Flows (Continued)
Years ended December 31, 2019, 2018 and 2017
(In thousands)
2019 | 2018 | 2017 | |||||||||
Non-cash investing and financing activities: | |||||||||||
Common unit issuance for deferred consideration for Wilmington Drop-Down | $ | 49,700 | $ | — | $ | — | |||||
Common unit issuance for the Hamlet Drop-Down | 50,000 | — | — | ||||||||
The Partnership acquired property, plant and equipment in non-cash transactions as follows: | |||||||||||
Property, plant and equipment acquired included in accounts payable and accrued liabilities | 3,421 | 8,939 | 2,653 | ||||||||
Property, plant and equipment acquired under finance leases | 6,493 | 3,512 | 1,956 | ||||||||
Property, plant and equipment transferred from inventories | — | 2 | 226 | ||||||||
Property, plant and equipment capitalized interest | 2,104 | 158 | — | ||||||||
Deferred consideration to sponsor included in related-party payable | 40,000 | — | 74,000 | ||||||||
Retained matters from the Hamlet JV included in related-party receivables | — | — | 585 | ||||||||
Distributions included in liabilities | 2,180 | 1,659 | 741 | ||||||||
Conversion of subordinated units to common units | — | 78,504 | — | ||||||||
Application of short-term deposit to fixed assets | — | — | 258 | ||||||||
Transfer of Enviva Port of Wilmington, LLC Drop-Down consideration to short-term | — | 74,000 | — | ||||||||
Debt issuance costs included in accrued liabilities | 779 | 103 | — | ||||||||
Depreciation capitalized to inventories | 186 | 567 | (427 | ) | |||||||
Supplemental information: | |||||||||||
Interest paid, net of capitalized interest | $ | 41,190 | $ | 35,222 | $ | 31,513 | |||||
78
ENVIVA PARTNERS, LP AND SUBSIDIARIES
Notes to Consolidated Financial Statements (Continued)
(In thousands, except number of units, per unit amounts and unless otherwise noted)
(1) Description of Business and Basis of Presentation
Enviva Partners, LP (together with its subsidiaries, “we,” “us,” “our,” or the “Partnership”) is a Delaware limited partnership formed on November 12, 2013 as a wholly owned subsidiary of Enviva Holdings, LP (together with its wholly owned subsidiaries Enviva MLP Holdco, LLC and Enviva Development Holdings, LLC, where applicable, the “sponsor”). Enviva Partners GP, LLC, a wholly owned subsidiary of Enviva Holdings, LP, is the General Partner (the “General Partner”) of the Partnership. We procure wood fiber and process it into utility-grade wood pellets and load the finished wood pellets into railcars, trucks and barges for transportation to deep-water marine terminals, where they are received, stored and ultimately loaded onto oceangoing vessels for delivery under long-term, take-or-pay off-take contracts to our customers principally in the United Kingdom (the “U.K.”), Europe and increasingly Japan.
We own and operate seven industrial-scale wood pellet production plants located in the Mid-Atlantic and Gulf Coast regions of the United States. In addition to the volumes from our plants, we also procure wood pellets from third parties and Enviva Pellets Greenwood, LLC (“Greenwood”), which was acquired by the Sponsor JV in the first quarter of 2018. Greenwood owns a wood pellet production plant in Greenwood, South Carolina (the “Greenwood plant”). Wood pellets are exported from our wholly owned deep-water marine terminals at the Port of Chesapeake, Virginia (the “Chesapeake terminal”) and terminal assets at the Port of Wilmington, North Carolina (the “Wilmington terminal”), and from third-party deep-water marine terminals in Mobile, Alabama and Panama City, Florida, under a short-term and a long-term contract, respectively.
Basis of Presentation
Principles of Consolidation
The accompanying consolidated financial statements have been prepared in accordance with accounting principles generally accepted in the United States (“GAAP”). Our consolidated financial statements include all accounts of the Partnership and its wholly owned and controlled subsidiaries. All intercompany accounts and transactions have been eliminated. We operate and manage our business as one operating segment.
We entered into an agreement with our sponsor effective as of September 30, 2019 pursuant to which the parties agreed to the right of set off of related-party receivables and payables; consequently, we intend to set off related-party receivables and payables, which are reflected net in related-party receivables or payables, in accordance with the agreement. As of December 31, 2018, related-party accounts receivable and accounts payable were not intended to be set off and were reflected separately in current assets and current liabilities.
Reclassification
Certain amounts have been reclassified from proceeds and payments on revolving credit commitments, net, to proceeds from senior secured revolving credit facility and payments on senior secured revolving credit facility to conform to current period presentation on the consolidated statements of cash flows.
Enviva Wilmington Holdings, LLC
In April 2019, we acquired from our sponsor all of the issued and outstanding Class B Units in Enviva Wilmington Holdings, LLC (the “Hamlet JV”), a limited liability company owned by our sponsor and John Hancock Life Insurance Company (U.S.A.) and certain of its affiliates (together with its affiliates, as applicable, “John Hancock”). As of April 2, 2019, we began to consolidate the Hamlet JV as a variable interest entity of which we are the primary beneficiary. As managing member, we have the sole power to direct the activities that most impact the economics of the Hamlet JV. Additionally, as the Class B Units represent a controlling interest in the Hamlet JV, we account for the Hamlet JV as a consolidated subsidiary, not as a joint venture. The Hamlet JV owns a plant in Hamlet, North Carolina (the “Hamlet plant”) and a firm, 15-year take-or-pay off-take contract with a customer for the delivery of nearly 1.0 million metric tons per year (“MTPY”) of wood pellets, following a ramp period.
On the date of our acquisition of our sponsor’s Class B Units in the Hamlet JV (collectively, the “Hamlet Drop-Down”):
• | We commenced an associated terminal services agreement to handle contracted volumes from the Hamlet plant. |
79
ENVIVA PARTNERS, LP AND SUBSIDIARIES
Notes to Consolidated Financial Statements (Continued)
(In thousands, except number of units, per unit amounts and unless otherwise noted)
• | We entered into an agreement with our sponsor, pursuant to which (1) our sponsor will guarantee certain cash flows from the Hamlet plant until June 30, 2020, (2) our sponsor will reimburse us for construction cost overruns in excess of budgeted capital expenditures for the Hamlet plant, subject to certain exceptions, (3) we will pay to our sponsor quarterly incentive payments for any wood pellets produced by the Hamlet plant in excess of forecast production levels through June 30, 2020 and (4) our sponsor will retain liability for certain claims payable, if any, by the Hamlet JV (the “Make-Whole Agreement”). |
• | The Hamlet JV entered into an agreement with Enviva Management Company, LLC, a Delaware limited liability company and wholly owned subsidiary of our sponsor (together with its affiliates that provide services to us, as applicable, “Enviva Management”), to waive the obligation to pay an aggregate of approximately $2.7 million of management fees payable to Enviva Management under the management services agreement (the “Hamlet JV MSA”) between the Hamlet JV and Enviva Management with respect to the period from the date of acquisition of the Hamlet plant until July 1, 2020 (the “Hamlet JV MSA Fee Waiver”). Pursuant to the Hamlet JV MSA, Enviva Management provides services to the Hamlet JV, including those necessary or incidental to the operation and management of the Hamlet JV. |
• | We entered into an agreement with Enviva Management to waive our obligation to pay an aggregate of approximately $13.0 million in fees payable under our management services agreement with Enviva Management (the “EVA MSA,” and together with the Hamlet JV MSA, the “MSAs”) with respect to the period from the date of the Hamlet Drop-Down through the second quarter of 2020 (the “First EVA MSA Fee Waiver”). |
• | Our sponsor assigned to the Partnership all of its rights and obligations under a credit agreement between the Hamlet JV, as borrower and our sponsor, as lender (the “Hamlet JV Revolver”). On the date of the Hamlet Drop-Down, $4.1 million was outstanding from the Hamlet JV to our sponsor. |
• | The Hamlet JV entered into an interim services agreement (the “ISA”) with Enviva Hamlet Operator, LLC, a wholly owned subsidiary of our sponsor (“Hamlet Operator”), pursuant to which Hamlet Operator agreed to manage, operate, maintain and repair the Hamlet plant and provide other services to the Hamlet JV for the period from July 1, 2019 through June 30, 2020 in exchange for a fixed fee per metric ton (“MT”) of wood pellets produced by the Hamlet plant during such period and delivered at place to the Wilmington terminal. Under and during the term of the ISA, Hamlet Operator will (1) pay all operating and maintenance expenses at the Hamlet plant, (2) cover all reimbursable general and administrative expenses associated with the Hamlet plant and (3) pay other costs and expenses incurred by the Hamlet plant to produce and sell the wood pellets delivered to the Wilmington terminal from the Hamlet plant. Our sponsor guarantees all obligations of Hamlet Operator under the ISA. |
Fees paid to Enviva Management through the MSAs are expensed as incurred and, to the extent any amount is associated with the MSAs, the related amount is recorded as an increase to the General Partner in partners’ capital. Amounts under the Make-Whole Agreement are expensed or capitalized and the related amount is recorded as an increase to the General Partner in partners’ capital.
The $165.0 million purchase price for the Hamlet Drop-Down consisted of (1) a cash payment of $24.7 million, net of a purchase price adjustment of $0.3 million, (2) the issuance of 1,681,237 unregistered common units at a value of $29.74 per unit, or $50.0 million of common units, (3) $50.0 million in cash paid on June 28, 2019, (4) a third and final cash payment of $40.0 million paid on January 2, 2020 and (5) the elimination of $3.0 million of net related-party receivables and payables included in the net assets of the Hamlet JV on the date of acquisition. We became a member of the Hamlet JV when we acquired the Class B Units on the date of the Hamlet Drop-Down. During the year ended December 31, 2019, we incurred and expensed $1.3 million in acquisition costs to acquire the Hamlet JV which were recognized as general and administrative expenses.
We are responsible for managing the activities of the Hamlet JV, including the development, construction and operation of the Hamlet plant and are the primary beneficiary of the Hamlet JV. We included all accounts of the Hamlet JV in our consolidated results as of April 2, 2019 as the Class B Units represent a controlling interest in the Hamlet JV and we are generally unrestricted in managing the assets and cash flows of the Hamlet JV; however, certain decisions, such as those relating to the issuance and redemption of equity interests in the Hamlet JV, guarantees of indebtedness and fundamental changes, including mergers and acquisitions, asset sales and liquidation and dissolution of the Hamlet JV, require the approval of the
80
ENVIVA PARTNERS, LP AND SUBSIDIARIES
Notes to Consolidated Financial Statements (Continued)
(In thousands, except number of units, per unit amounts and unless otherwise noted)
members of the Hamlet JV. The Hamlet Drop-Down was an asset acquisition of entities under common control and accounted for on the carryover basis of accounting.
Enviva Port of Wilmington, LLC
In October 2017, we acquired from the Hamlet JV all of the issued and outstanding limited liability company interests in Enviva Port of Wilmington, LLC (“Wilmington”), which owns the Wilmington terminal.
We made an initial payment of $54.6 million, net of an approximate purchase price adjustment of $1.4 million to the Hamlet JV as partial payment of the $130.0 million purchase price for the Wilmington terminal in October 2017 (the “Wilmington Drop-Down”). On April 1, 2019, we made a second and final payment of $74.0 million, which consisted of $24.3 million in cash, of which $22.8 million was distributed to John Hancock and the issuance of 1,691,627 common units, or approximately $49.7 million in common units, which were distributed to John Hancock (“Second Payment”). The Wilmington Drop-Down included the Wilmington terminal and a long-term terminal services agreement with our sponsor (the “Holdings TSA”) to handle throughput volumes sourced by our sponsor from the Greenwood plant. See Note 15, Related-Party Transactions.
The Wilmington Drop-Down was accounted for as a combination of entities under common control at carryover basis in a manner similar to a pooling of interests. Accordingly, the consolidated financial statements for the periods prior to October 2, 2017, were retrospectively recast to reflect our acquisition of the Hamlet JV’s interests in Wilmington as if it had occurred on May 15, 2013, the date Wilmington was originally organized.
Enviva Pellets Wiggins, LLC
In 2016, we held a controlling interest in Enviva Pellets Wiggins, LLC (“Wiggins”), which owned a wood pellet plant in Stone County, Mississippi (the “Wiggins plant”). In December 2017, we sold the Wiggins plant to a third-party buyer for a purchase price of $0.4 million and recorded a loss on the sale of $0.8 million, net, upon deconsolidation, consisting of a loss on the sale of $3.4 million and a $2.6 million gain upon deconsolidation, which is included in general and administrative expenses on the consolidated statements of operations. In December 2017, Wiggins was dissolved.
Subsidiaries
As of December 31, 2019, the Partnership has 100% ownership of the following:
• | Enviva Partners Finance Corp. (“Enviva Finance Corp.”), a wholly owned subsidiary of the Partnership formed on October 3, 2016 for the purpose of being a co-issuer of some of the Partnership’s indebtedness |
• | Enviva GP, LLC |
The Partnership has 99.999% ownership of Enviva, LP
Enviva GP, LLC has 0.001% ownership of Enviva, LP
Enviva, LP has 100% ownership of the following:
• | Enviva Pellets Amory, LLC (“Amory”) |
• | Enviva Pellets Ahoskie, LLC |
• | Enviva Port of Chesapeake, LLC |
• | Enviva Pellets Northampton, LLC |
• | Enviva Pellets Southampton, LLC (“Southampton”) |
• | Enviva Pellets Cottondale, LLC (“Cottondale”) |
• | Enviva Energy Services, LLC |
81
ENVIVA PARTNERS, LP AND SUBSIDIARIES
Notes to Consolidated Financial Statements (Continued)
(In thousands, except number of units, per unit amounts and unless otherwise noted)
• | Enviva Pellets Sampson, LLC (“Sampson”) |
• | Enviva Port of Wilmington, LLC (“Wilmington”) |
• | Enviva Port of Panama City, LLC |
• | Enviva MLP International Holdings, LLC |
Enviva, LP has 99.99% ownership of the following:
• | Enviva Energy Services Coöperatief, U.A. |
Enviva MLP International Holdings has 100% ownership of the following:
• | Enviva Energy Services (Jersey), Limited |
Enviva MLP International Holdings has 0.01% ownership of the following:
• | Enviva Energy Services Coöperatief, U.A. |
Enviva, LP has 100% ownership of the Class B Units of Enviva Wilmington Holdings, LLC (the “Hamlet JV”)
John Hancock Life Insurance Company (U.S.A.) and certain of its affiliates has 100% ownership of the Class A Units of the Hamlet JV
Enviva Wilmington Holdings, LLC has 100% ownership of the Hamlet plant
(2) Significant Accounting Policies
Use of Estimates
The preparation of financial statements in conformity with GAAP requires management to make judgments, estimates and assumptions that affect the amounts reported in our consolidated financial statements and accompanying notes. Actual results could differ materially from those estimates.
Common Control Transactions
Assets and businesses acquired from our sponsor and its controlled subsidiaries are accounted for as common control transactions. For assets acquired in a common control transaction, net assets acquired are accounted for on the carryover basis of accounting and consolidated prospectively as of the transaction date. For businesses acquired in a common control transaction, the net assets acquired are combined at their historical costs and to the extent that such transactions require prior periods to be recast, historical net equity amounts prior to the transaction date are attributed to the General Partner and any noncontrolling partner interest at the historical amount. If any recognized consideration transferred in such a transaction exceeds the carrying value of the net assets acquired, the excess is treated as a capital distribution to the General Partner. If the carrying value of the net assets acquired exceeds any recognized consideration transferred including, if applicable, the fair value of any limited partner units issued, then that excess is treated as a capital contribution from the General Partner.
Other Comprehensive Income (Loss)
Comprehensive income (loss) consists of two components, net income (loss) and other comprehensive income (loss). Other comprehensive income (loss) refers to revenue, expenses, and gains and losses that under GAAP are included in comprehensive income (loss) but excluded from net income (loss). Other comprehensive income (loss) consists of net unrealized gains and losses related to derivative instruments accounted for as cash flow hedges and foreign currency translation adjustments.
Cash and Cash Equivalents
Cash and cash equivalents consist of short-term, highly liquid investments readily convertible into cash with an original maturity of three months or less.
82
ENVIVA PARTNERS, LP AND SUBSIDIARIES
Notes to Consolidated Financial Statements (Continued)
(In thousands, except number of units, per unit amounts and unless otherwise noted)
Accounts Receivable
Accounts receivable represent amounts billed and billable under our contracts and are recorded at the invoiced amount pending finalization of prerequisite billing documentation and do not bear interest. As of December 31, 2019 and 2018, we had no amounts in allowance for doubtful accounts given the lack of historical losses.
Inventories
Inventories consist of raw materials, work-in-progress, consumable tooling and finished goods. Fixed production overhead, including related depreciation expense, is allocated to inventory based on the normal production capacity of the facilities. To the extent we do not achieve normal production levels, we charge such under-absorption of fixed overhead to cost of goods sold in the period incurred.
Consumable tooling consists of spare parts and tooling to be consumed in the production process. Spare parts are expected to be used within a year and are expensed as used. Tooling items are amortized to expense over an estimated service life generally less than one year.
Inventories are stated at the lower of cost or net realizable value using the first-in, first-out method (“FIFO”) for all inventories, which requires the use of judgment and estimates. Raw material, production and distribution costs associated with delivering wood pellets to marine terminals and third- and related-party wood pellet purchase costs are capitalized as a component of inventory. Fixed production overhead, including the related depreciation expense, is allocated to inventory based on the normal capacity of our production plants. These costs are reflected in cost of goods sold when inventory is sold.
Revenue Recognition
We primarily earn revenue by supplying wood pellets to customers under off-take contracts, the majority of the commitments under which are long-term in nature. Our off-take contracts are considered “take-or-pay” because they include a firm obligation of the customer to take a fixed quantity of product at a stated price and provisions that require that we be compensated in the case of a customer’s failure to accept all or a part of the contracted volumes or termination of a contract by a customer. Each of our long-term off-take contracts define the annual volume of wood pellets that a customer is required to purchase, and we are required to sell, the fixed price per MT for product satisfying a base net calorific value and other technical specifications. These prices are fixed for the entire term and are subject to adjustments which may include annual inflation-based adjustments or price escalators, price adjustments for product specifications, as well as, in some instances, price adjustments due to changes in underlying indices. In addition to sales of our product under these long-term, off-take contracts, we routinely sell wood pellets under shorter-term contracts, which range in volume and tenor and, in some cases, may include only one specific shipment. Because each of our off-take contracts is a bilaterally negotiated agreement, our revenue over the duration of such contracts does not generally follow observable current market pricing trends. Our performance obligations under these contracts are the delivery of wood pellets, which we aggregate into MT. We account for each MT as a single performance obligation. Our revenue from the sales of wood pellets we produce is recognized as product sales upon satisfaction of our performance obligation when control transfers to the customer at the time of loading wood pellets onto a ship.
Depending on the specific off‑take contract, shipping terms are either Cost, Insurance and Freight (“CIF”), Cost and Freight (“CFR”) or Free on Board (“FOB”). Under a CIF contract, we procure and pay for shipping costs, which include insurance and all other charges, up to the port of destination for the customer. Under a CFR contract, we procure and pay for shipping costs, which include insurance (excluding marine cargo insurance) and all other charges, up to the port of destination for the customer. Shipping under CIF and CFR contracts after control has passed to the customer is considered a fulfillment activity rather than a performance obligation and associated expenses are included in the price to the customer. Under FOB contracts, the customer is directly responsible for shipping costs.
In some cases, we may purchase shipments of product from third-party suppliers and resell them in back-to-back transactions (“purchase and sale transactions”). We recognize revenue on a gross basis in product sales when we determine that we act as a principal by having control of the wood pellets before they are transferred to the customer. Indicators of control have included being primarily responsible for fulfilling the promise to provide the wood pellets (such as by contracting to sell wood pellets before contracting to buy them), having inventory risk, or having discretion in establishing the sales price for the wood pellets. The decision as to whether to recognize revenue on a gross or net basis requires significant judgment.
83
ENVIVA PARTNERS, LP AND SUBSIDIARIES
Notes to Consolidated Financial Statements (Continued)
(In thousands, except number of units, per unit amounts and unless otherwise noted)
In instances in which a customer requests the cancellation, deferral or acceleration of a shipment, the customer may pay a fee, which is included in other revenue.
We recognize third- and related-party terminal services revenue ratably over the related contract term, which is included in other revenue. Terminal services are performance obligations that are satisfied over time, as customers simultaneously receive and consume the benefits of the terminal services we perform. The consideration is generally fixed for minimum quantities and any services above the minimum are generally billed based on a per-MT rate as variable consideration and recognized as services performed. Any deficiency payments receivable and probable of being collected from a customer not meeting quarterly minimum throughput requirements are recognized during the related quarter in satisfaction of the related performance obligation.
Variable consideration from off-take contracts arises from several pricing features outlined in our off-take contracts, pursuant to which such contract pricing may be adjusted in respect of particular shipments to reflect differences between certain contractual quality specifications of the wood pellets as measured both when the wood pellets are loaded onto ships and unloaded at the discharge port as well as certain other contractual adjustments.
Variable consideration from terminal services contracts arises from price increases based on agreed inflation indices and from above-minimum throughput quantities or services.
We allocate variable consideration under our off-take and terminal services contracts entirely to each performance obligation to which variable consideration relates. The estimate of variable consideration represents the amount that is probable that a significant reversal in the amount of cumulative revenue recognized will not occur when the uncertainty is resolved.
Under our off-take contracts, customers are obligated to pay the majority of the purchase price prior to the arrival of the ship at the customers’ discharge port. The remaining portion is paid after the wood pellets are unloaded at the discharge port. We generally recognize revenue prior to the issuance of an invoice to the customer.
Cost of Goods Sold
Cost of goods sold includes the cost to produce and deliver wood pellets to customers, reimbursable shipping-related costs associated with specific off-take contracts with CIF and CFR shipping terms and costs associated with purchase and sale transactions. Distribution costs associated with shipping wood pellets to customers are expensed as incurred. The calculation of cost of goods sold is based on estimates used in the valuation of the FIFO inventory and in determining the specific composition of inventory that is sold to each customer.
Accrued and other current liabilities
Accrued and other current liabilities primarily includes amounts related to construction in progress, amounts related cost of goods sold such as utility costs at our production facilities, distribution costs associated with shipping wood pellets to customers and costs associated with the purchase of wood fiber and wood pellets.
Derivative Instruments
On and as of January 1, 2019, we adopted Accounting Standards Update (“ASU”) 2017-12, Derivatives and Hedging (Topic 815): Targeted Improvements to Accounting for Hedging Activities as issued by the Financial Accounting Standards Board (“FASB”). Upon adoption of ASU 2017-12 on January 1, 2019, we no longer measure and recognize ineffectiveness related to designated and qualifying cash flow hedges in earnings; as a result, any ineffectiveness is now included in accumulated other comprehensive income. See Recently Adopted Accounting Standards—Derivative Instruments below. Prior to adoption, we measured and recognized any ineffectiveness in earnings.
Derivative instruments are classified as either assets or liabilities on a gross basis and carried at fair value and included in prepaid expenses and other current assets, other long-term assets, accrued and other current liabilities and other long-term liabilities on the consolidated balance sheets. Changes in fair value are either recognized as unrealized gains and losses in accumulated other comprehensive income in partners’ capital or earnings depending on the nature of the underlying exposure, whether or not the derivative is formally designated as a hedge. To receive hedge accounting treatment, cash flow hedges must be highly effective in offsetting changes to expected future cash flows on hedged transactions. As of December 31, 2019 and 2018, we only apply hedge accounting treatment to interest rate swaps.
84
ENVIVA PARTNERS, LP AND SUBSIDIARIES
Notes to Consolidated Financial Statements (Continued)
(In thousands, except number of units, per unit amounts and unless otherwise noted)
The effective portion of foreign currency forward and option contracts designated as cash flow hedges was reported as a component of accumulated other comprehensive income in partners’ capital and reclassified into revenue in the same period or periods during which the hedged revenue affected earnings. During August 2018, we discontinued hedge accounting for all designated foreign currency cash flow hedges. The interest rate swaps designated as cash flow hedges is reported as a component of accumulated other comprehensive income in partners’ capital and reclassified into interest expense in the same period or periods during which the hedged interest expense affects earnings. We link interest rate swap derivative instruments designated as a hedge using the first payment technique to link the forecasted transaction which is the first London Inter-bank Offered Rate (“LIBOR”)-based payments on any borrowing.
To qualify for hedge accounting, the item to be hedged must cause an exposure risk and we must have an expectation that the related hedging instrument will be effective at reducing or mitigating that exposure. In accordance with the hedging requirements, we document all hedging relationships at inception and include a description of the risk management objective and strategy for undertaking the hedge, identification of the hedging instrument, the hedged item, the nature of the risk being hedged, the method for assessing effectiveness of the hedging instrument in offsetting the hedged risk and the method of measuring any ineffectiveness. When an event or transaction occurs or the derivative contract expires or the forecasted transaction is no longer probable of occurring, hedge accounting is discontinued. We also formally assess, both at the hedge’s inception and on an ongoing basis, whether the derivative instruments are highly effective in offsetting changes in cash flows of hedged items. If it is determined that a derivative instrument has ceased to be a highly effective hedge, hedge accounting is discontinued prospectively.
Hedge effectiveness for foreign exchange forward contracts designated as cash flow hedges was assessed by comparing the change in the fair value of the hedge contract with the change in the fair value of the forecasted cash flows of the hedged item. For foreign exchange option contracts, hedge effectiveness was assessed based on the hedging instrument’s entire change in fair value. Hedge effectiveness for interest rate swaps is assessed by comparing the change in fair value of the swap with the change in the fair value of the hedged item due to changes in the benchmark interest rate.
Derivative instruments that do not qualify, or no longer qualify, as hedges are adjusted to fair value through earnings in the current period.
Property, Plant and Equipment
Property, plant and equipment are recorded at cost, which includes the fair values of assets acquired. Equipment under finance leases is stated at the present value of minimum lease payments. Useful lives of assets are based on historical experience and other relevant information. The useful lives of assets are adjusted when changes in the expected physical life of the asset, its planned use, technological advances, or other factors show that a different life would be more appropriate. Changes in useful lives are recognized prospectively.
Depreciation is calculated using the straight-line method based on the estimated useful lives of the related assets. Plant and equipment held under finance leases are amortized on a straight-line basis over the shorter of the lease term or estimated useful life of the asset.
Construction in progress primarily represents expenditures for the development and expansion of facilities. Capitalized interest cost and all direct costs, which include equipment and engineering costs related to the development and expansion of facilities, are capitalized as construction in progress. Depreciation is not recognized for amounts in construction in progress.
Normal repairs and maintenance costs are expensed as incurred. Amounts incurred that extend an asset’s useful life, increase its productivity or add production capacity are capitalized. Direct costs, such as outside labor, materials, internal payroll and benefit costs, incurred during the construction of a new plant are capitalized; indirect costs are not capitalized.
85
ENVIVA PARTNERS, LP AND SUBSIDIARIES
Notes to Consolidated Financial Statements (Continued)
(In thousands, except number of units, per unit amounts and unless otherwise noted)
The principal useful lives are as follows:
Asset | Estimated useful life | |
Land improvements | 15 to 17 years | |
Buildings | 5 to 40 years | |
Machinery and equipment | 2 to 25 years | |
Vehicles | 5 to 6 years | |
Furniture and office equipment | 2 to 10 years | |
Leasehold improvements | Shorter of estimated useful life or lease term, generally 10 years | |
Costs and accumulated depreciation applicable to assets retired or sold are removed from the accounts and any resulting gain or loss is included in the consolidated statements of operations.
Long-lived assets, such as property, plant and equipment and amortizable intangible assets, are tested for impairment whenever events or changes in circumstances indicate that the carrying amount of a long-lived asset may not be recoverable. There were no such indicators that would require impairment testing to be performed during the years ended December 31, 2019 and 2018.
Leases
We have operating and finance leases related to real estate, machinery, equipment and other assets where we are the lessee. Operating leases with an initial term of 12 months or less are not recorded on the balance sheet but are recognized as lease expense on a straight-line basis over the applicable lease terms. Operating and finance leases with an initial term longer than 12 months are recorded on the balance sheet and classified as either operating or finance.
Right-of-use (“ROU”) assets represent our right to use an underlying asset for the lease term and lease liabilities represent our obligation to make lease payments arising from the lease. Our leases do not contain any material residual value guarantees, restrictive covenants or subleases. In addition to fixed lease payments, we have contracts that incur variable lease expense related to usage (e.g. throughput fees, maintenance and repair and machine hours), which are expensed as incurred. Our leases have remaining terms of one to 28 years, some of which include options to extend the leases by up to 5 years. Our leases are generally noncancelable. Certain leases also include options to purchase the leased property. The depreciable life of assets and leasehold improvements are limited by the expected lease term unless there is a transfer of title or purchase option reasonably certain of exercise.
An incremental borrowing rate is applied to our leases for balance sheet measurement. As most of our leases do not provide an implicit rate, we generally use our incremental borrowing rate based on the estimated rate of interest for a collateralized borrowing over a similar term of the lease payments as of the commencement date.
Operating leases are included in operating lease ROU assets, accrued and other current liabilities and long-term operating lease liabilities on our consolidated balance sheets. Finance leases are included in property, plant and equipment, and the current portion of long-term debt and finance lease obligations and long-term debt and finance lease obligations are included in our consolidated balance sheets. Changes in ROU assets and operating lease liabilities are included net in change in operating lease liabilities on the consolidated statement of cash flows.
Debt Issuance Costs and Original Issue Discounts and Premiums
Debt issuance costs and original issue discounts and premiums incurred with debt financing are capitalized and amortized over the life of the debt. Amortization expense is included in interest expense. If a debt instrument is retired before its scheduled maturity date, any related unamortized debt issuance costs and original issue discounts and premiums are written-off as gain or loss on debt extinguishment in the same period.
Unamortized debt issuance costs and original issue discounts and premiums related to a recognized debt liability are recognized as a direct deduction from the carrying amount of the related long-term debt and are amortized using the effective
86
ENVIVA PARTNERS, LP AND SUBSIDIARIES
Notes to Consolidated Financial Statements (Continued)
(In thousands, except number of units, per unit amounts and unless otherwise noted)
interest method. Unamortized debt issuance costs related to our revolving credit commitments are recognized as an asset and are amortized using the straight-line method.
Goodwill
Goodwill represents the purchase price paid for acquired businesses in excess of the identifiable acquired assets and assumed liabilities. Goodwill is not amortized but is tested for impairment annually and whenever an event occurs or circumstances change such that it is more likely than not that the fair value of the reporting unit is less than its carrying amounts. At December 31, 2019 and 2018, we identified the Partnership as having one reporting unit that corresponded to our one reportable segment. We have selected December 1 to perform our annual goodwill impairment test.
For the year ended December 31, 2019, we performed a quantitative assessment using the market approach and determined the fair value of the reporting unit exceeded its carrying amount. The fair value was determined based on our market capitalization, which is considered a Level 1 Input. For the year ended December 31, 2018, we performed a qualitative assessment and determined it was more likely than not that the estimated fair value of the reporting unit substantially exceeded the related carrying value of our reporting unit. There have been no impairments to the carrying value of the Partnership’s goodwill during the periods presented (see Note 12, Goodwill).
Unit-Based Compensation
Employees, consultants and directors of the General Partner and any of its affiliates are eligible to receive equity awards and other forms of compensation under the Enviva Partners, LP Long-Term Incentive Plan (the “LTIP”). Phantom units issued in tandem with corresponding distribution equivalent rights (“DERs”) are granted to employees of Enviva Management that provide services to us and to certain non-employee directors of the General Partner. Phantom unit awards vest subject to the satisfaction of service requirements and/or the achievement of certain performance goals following which common units in the Partnership will be delivered to the holder of the phantom units. For accounting purposes, units granted to employees of our affiliates (excluding the General Partner, the Partnership and subsidiaries of the Partnership) are treated as if they were distributed by the Partnership. Such affiliates recognize compensation expense for the phantom units awarded to their employees, a portion of which is allocated to us under the MSAs (see Note 15, Related-Party Transactions-Management Services Agreement and Note 18, Equity-Based Awards). We also recognize compensation expense for phantom units awarded to non-employee directors. As of December 31, 2019 our outstanding phantom unit awards under the LTIP did not have a cash option and were classified as equity on our balance sheets.
Commitments and Contingencies
Liabilities for loss contingencies arising from claims, assessments, litigation, fines, penalties and other sources are recorded when it is probable that a liability has been incurred and the amount can be reasonably estimated. Legal costs incurred in connection with loss contingencies are expensed as incurred.
Fair Value Measurements
We apply authoritative accounting guidance for fair value measurements of financial and nonfinancial assets and liabilities. We use valuation techniques that maximize the use of observable inputs and minimize the use of unobservable inputs to the extent possible. We determine fair value based on assumptions that market participants would use in pricing an asset or liability in the principal or most advantageous market. When considering market participant assumptions in fair value measurements, the following fair value hierarchy distinguishes between observable and unobservable inputs, which are categorized in one of the following levels:
• | Level 1 Inputs: Unadjusted, quoted prices in active markets for identical assets or liabilities accessible to the reporting entity at the measurement date. |
• | Level 2 Inputs: Other than quoted prices included in Level 1, inputs that are observable for the asset or liability, either directly or indirectly, for substantially the full term of the asset or liability. |
87
ENVIVA PARTNERS, LP AND SUBSIDIARIES
Notes to Consolidated Financial Statements (Continued)
(In thousands, except number of units, per unit amounts and unless otherwise noted)
• | Level 3 Inputs: Unobservable inputs for the asset or liability used to measure fair value to the extent that observable inputs are not available, thereby allowing for situations in which there is little, if any, market activity for the asset or liability at the measurement date. |
Recently Adopted Accounting Standards
Revenue Recognition
As of January 1, 2018, we adopted ASU 2014-09, Revenue from Contracts with Customers, which subsequently was issued as Accounting Standards Codification (“ASC”) 606. ASC 606 requires entities to recognize revenue when control of the promised goods or services is transferred to customers at an amount that reflects the consideration to which the entity expects to be entitled in exchange for those goods or services. We recognize revenue under ASC 606 and related amendments, which we adopted as of January 1, 2018, using the modified retrospective transition method.
Results for reporting periods beginning after January 1, 2018 are presented under ASC 606, whereas prior comparative reporting periods have not been adjusted and continue to be reported under the accounting standards in effect for such periods. We did not have a transition adjustment as a result of adopting ASC 606.
We determined that, upon adoption of ASC 606, revenue derived from our off-take contracts will continue to be classified as product sales. Revenue is recognized when control of the wood pellets passes to the customer which occurs as the wood pellets are loaded onto shipping vessels, which is consistent with the timing of revenue recognition under our legacy accounting policy. However, the adoption of ASC 606 impacted the basis of presentation for purchase and sale transactions. Prior to the adoption of ASC 606, we reported revenue from purchase and sale transactions net of costs paid to third-party suppliers, which was classified as other revenue. Subsequent to the adoption of ASC 606, we recognize revenue on a gross basis in product sales when we determine that we act as a principal and control the wood pellets before they are transferred to the customer.
Recoveries from customers for certain costs we incurred at the discharge port under our off-take contracts were reported in product sales prior to the adoption of ASC 606. Under ASC 606, these recoveries are not considered a part of the transaction price, and therefore are excluded from product sales and included as an offset to cost of goods sold.
Leases
In February 2016, the FASB issued ASU 2016-02, Leases, which established a ROU model that requires lessees to recognize a ROU asset and corresponding lease liability on the balance sheet for all leases with a term of longer than 12 months and classify leases as operating or finance. Operating lease expense is recorded in a single financial statement line item on a straight-line basis over the lease term.
We adopted ASU 2016-02 on and as of January 1, 2019 using the modified retrospective transition method, which we applied to all leases existing at the date of initial application of the ASU. We elected to use the effective date as the date of initial application, as opposed to the beginning of the earliest comparative period presented in the financial statements; consequently, financial information and disclosures are not presented under the new standard for periods prior to January 1, 2019. We elected the package of three practical expedients under the transition guidance within the new standard, which permitted us to not reassess our prior conclusions under the previous guidance concerning lease identification, lease classification and initial direct leasing costs. We elected the practical expedient to not evaluate existing or expired land easements that were not accounted for as leases under previous guidance. We did not, however, elect the separate practical expedient pertaining to the use of hindsight in determining the lease term for existing leases. We made an accounting policy election to not separate nonlease components from lease components for heavy machinery and equipment. We have a significant contract containing both lease and nonlease components, which are accounted for separately. As this contract has fixed payments, the allocation of lease and nonlease components is based on relative standalone price.
The adoption of the new standard as of January 1, 2019 resulted in the recognition of operating lease ROU assets of $27.4 million, net of $2.1 million of deferred rent liabilities existing as of December 31, 2018, and operating lease liabilities of $29.5 million for operating leases related to real estate, machinery and equipment and other operating leases with terms of longer than 12 months. The classification of a lease affects the pattern and classification of expense recognition in the income statement, which is unchanged from under the previous accounting method. The adoption of the new standard did not change our accounting for finance leases (which were described as “capital leases” under the previous standard) or impact our results of
88
ENVIVA PARTNERS, LP AND SUBSIDIARIES
Notes to Consolidated Financial Statements (Continued)
(In thousands, except number of units, per unit amounts and unless otherwise noted)
operations and cash flows. See Note 9, Leases.
Derivative Instruments
We adopted ASU 2017-12 on and as of January 1, 2019 using the modified retrospective method, which requires the recognition of the cumulative effect of the change on the opening balance of each affected component of equity in the statement of changes in partner’s capital as of the date of adoption of the new standard. Upon adoption of ASU 2017-12, we no longer measure and recognize ineffectiveness related to designated and qualifying cash flow hedges in earnings; as a result, any ineffectiveness is included in accumulated other comprehensive income. On January 1, 2019, we recorded a nominal cumulative effect adjustment to accumulated other comprehensive income and common units in partners’ capital. See Note 10, Derivative Instruments.
Recently Issued Accounting Standards not yet Adopted
Currently, there are no recently issued accounting standards not yet adopted by us that we expect to be reasonably likely to materially impact the financial position, results of operations or cash flows of the Partnership.
(3) Transactions Between Entities Under Common Control
The Hamlet Drop-Down was an asset acquisition of entities under common control and accounted for on the carryover basis of accounting. Accordingly, the consolidated financial statements for the period beginning April 2, 2019 reflect the acquisition.
The $165.0 million purchase price for the Hamlet Drop-Down consisted of (1) an initial cash payment of $24.7 million, net of a purchase price adjustment of $0.3 million, on April 2, 2019, (2) the issuance of 1,681,237 unregistered common units at a value of $29.74 per unit, or $50.0 million of common units, on April 2, 2019, (3) $50.0 million in cash, paid on June 28, 2019 and (4) a third and final cash payment of $40.0 million paid on January 2, 2020.
The changes in net assets at carryover basis on April 2, 2019 included $120.9 million net assets of the Hamlet JV, net of the elimination of $3.0 million of net related-party receivables and payables. The following table outlines the addition of net assets resulting from the Hamlet Drop-Down on April 2, 2019.
Assets: | |||
Cash and cash equivalents | $ | 3,426 | |
Related-party receivables | 241 | ||
Prepaid expenses and other current assets | 22 | ||
Property, plant and equipment, net | 140,446 | ||
Other long-term assets | 8 | ||
Total assets | 144,143 | ||
Liabilities: | |||
Accounts payable | 6,395 | ||
Related-party payables | 1,923 | ||
Accrued and other current liabilities | 14,965 | ||
Finance lease obligations | 3 | ||
Total liabilities | 23,286 | ||
Net assets contributed to Partnership | $ | 120,857 | |
(4) Revenue
We disaggregate our revenue into two categories: product sales and other revenue. Other revenue includes fees associated with customer requests to cancel, defer or accelerate shipments in satisfaction of the related performance obligation and third-
89
ENVIVA PARTNERS, LP AND SUBSIDIARIES
Notes to Consolidated Financial Statements (Continued)
(In thousands, except number of units, per unit amounts and unless otherwise noted)
and related-party terminal services fees. These categories best reflect the nature, amount, timing and uncertainty of our revenue and cash flows.
Performance Obligations
As of December 31, 2019, the aggregated amount from off-take contracts with customers allocated to the performance obligations that were unsatisfied or partially satisfied was approximately $9.2 billion. This amount excludes forward prices related to variable consideration including inflation, foreign currency and commodity prices. Also, this amount excludes the effects of the related foreign currency derivative contracts as they do not represent contracts with customers. We expect to recognize approximately 9.0% of our remaining performance obligations as revenue in 2020, an additional 11.4% by 2021 and the balance thereafter. Our off-take contracts expire at various times through 2040 and our terminal services contracts extend into 2026.
Variable Consideration
Variable consideration from off-take contracts arises from several pricing features in our off-take contracts, pursuant to which such contract pricing may be adjusted in respect of particular shipments to reflect differences between certain contractual quality specifications of the wood pellets as measured both when the wood pellets are loaded onto ships and unloaded at the discharge port as well as certain other contractual adjustments.
Variable consideration from terminal services contracts, which was not material for the years ended December 31, 2019 and 2018, arises from price increases based on agreed inflation indices and from above-minimum throughput quantities or services.
We allocate variable consideration under our off-take and terminal services contracts entirely to each performance obligation to which variable consideration relates. The estimate of variable consideration represents the amount that is not more likely than not to be reversed. For the year ended December 31, 2019, product sales revenue was reduced by $0.1 million related to performance obligations satisfied in previous periods. For the year ended December 31, 2018, we recognized an insignificant amount of revenue related to performance obligations satisfied in previous periods.
Contract Balances
Accounts receivable related to product sales as of December 31, 2019 and 2018 were $67.7 million and $51.3 million, respectively. Of these amounts, $64.7 million and $46.0 million, as of December 31, 2019 and 2018 respectively, related to amounts that were not yet billable under our contracts with customers pending finalization of prerequisite billing documentation. The amounts that have not been billed are expected to be billed within two months.
As of December 31, 2019 and December 31, 2018, we had $4.1 million and $0.3 million, respectively, for future performance obligations under contracts associated with off-take contracts.
(5) Significant Risks and Uncertainties, Including Business and Credit Concentrations
Our business is significantly impacted by greenhouse gas emission and renewable energy legislation and regulations in the U.K., European Union (“EU”) as well as its member states and Japan. If the U.K., the EU or its member states or Japan significantly modify such legislation or regulations, then our ability to enter into new contracts as our existing contracts expire may be materially affected.
Our current product sales are primarily to industrial customers located in the U.K., Denmark and Belgium. Product sales to third-party customers that accounted for 10% or a greater share of consolidated product sales for each of the years ended December 31 are as follows:
2019 | 2018 | 2017 | |||
Customer A | 48% | 46% | 66% | ||
Customer B | 10% | 11% | 12% | ||
Customer C | 20% | 16% | 2% | ||
Customer D | 15% | 17% | 15% | ||
90
(6) Inventory Impairment and Asset Disposal
On February 27, 2018, a fire occurred at the Chesapeake terminal, causing damage to equipment and approximately 43,000 MT of wood pellets (the “Chesapeake Incident”). As part of our risk management process, we maintain certain insurance policies, which are subject to deductibles and sublimits for each covered event. When recovery of all or a portion of property damage loss or other covered expenses through insurance proceeds is probable, a receivable is recorded and the loss or expense is reduced up to the amount of the total loss or expense. No gain or income resulting from business interruption insurance is recorded until all contingencies related to the insurance claim have been resolved.
To meet our contractual obligations to our customers, we incurred incremental costs to commission temporary wood pellet storage and handling and ship loading operations (collectively, “business continuity activities”) at nearby locations. The wood pellets from our production plants in the Mid-Atlantic region were delivered to such temporary locations as well as to the Wilmington terminal, which increased our distribution costs. We incurred $60.3 million related to asset impairment, inventory write-off and disposal costs, emergency response costs, asset repair costs and business continuity activities as a result of the Chesapeake Incident. During the year ended December 31, 2018, we recognized recoveries of $62.1 million related to the Chesapeake Incident, which included $25.5 million of business continuity insurance recoveries, recorded in cost of goods sold, and $1.8 million of business interruption insurance recoveries, recorded in other income, for lost profits from both damaged wood pellets and the subsequent reduction in the production of wood pellets. At December 31, 2018, $3.8 million of probable insurance recoveries were included in insurance receivables; we received the $3.8 million in probable insurance recoveries in February 2019 plus an additional $0.5 million recognized as other income in 2019.
(7) Inventories
Inventories consisted of the following at December 31:
2019 | 2018 | ||||||
Raw materials and work-in-process | $ | 9,795 | $ | 4,936 | |||
Consumable tooling | 20,485 | 17,561 | |||||
Finished goods | 2,718 | 8,993 | |||||
Total inventories | $ | 32,998 | $ | 31,490 | |||
(8) Property, Plant and Equipment, net
Property, plant and equipment, net consisted of the following at December 31:
2019 | 2018 | ||||||
Land | $ | 15,226 | $ | 13,492 | |||
Land improvements | 56,637 | 44,990 | |||||
Buildings | 217,167 | 196,574 | |||||
Machinery and equipment | 588,447 | 434,776 | |||||
Vehicles | 635 | 635 | |||||
Furniture and office equipment | 6,822 | 6,148 | |||||
Leasehold improvements | 1,029 | 987 | |||||
Property, plant and equipment | 885,963 | 697,602 | |||||
Less accumulated depreciation | (203,695 | ) | (154,967 | ) | |||
Property, plant and equipment, net | 682,268 | 542,635 | |||||
Construction in progress | 69,512 | 14,393 | |||||
Total property, plant and equipment, net | $ | 751,780 | $ | 557,028 | |||
At December 31, 2019 and 2018 we had assets under finance leases with a cost and related accumulated depreciation of $14.6 million and $7.2 million and $7.8 million and $3.0 million, respectively. Accrued amounts for property, plant and equipment and construction in progress included in accrued and other current liabilities were $9.4 million and $6.3 million at December 31, 2019 and 2018.
Total depreciation expense was $51.6 million, $40.6 million and $39.1 million for the years ended December 31, 2019, 2018 and 2017, respectively. Total interest capitalized related to construction in progress was $2.1 million and $0.2 million for
91
ENVIVA PARTNERS, LP AND SUBSIDIARIES
Notes to Consolidated Financial Statements (Continued)
(In thousands, except number of units, per unit amounts and unless otherwise noted)
the years ended December 31, 2019 and 2018, respectively. We did not capitalize interest to construction in progress during the year ended December 31, 2017. We recorded loss on disposal of assets of $3.1 million, $2.4 million and $4.9 million for the years ended December 31, 2019, 2018 and 2017, respectively, primarily attributable to the disposal of assets replaced in connection with maintenance capital expenditures.
(9) Leases
We have operating and finance leases related to real estate, machinery, equipment and other assets where we are the lessee. Leases with an initial term of 12 months or less are not recorded on the balance sheet but are recognized as lease expense on a straight-line basis over the applicable lease terms. Leases with an initial term of longer than 12 months are recorded on the balance sheet and classified as either operating or finance.
Right-of-use (“ROU”) assets represent our right to use an underlying asset for the lease term and lease liabilities represent our obligation to make lease payments arising from the lease. Our leases do not contain any material residual value guarantees, restrictive covenants or subleases. In addition to fixed lease payments, we have contracts that incur variable lease expense related to usage (e.g. throughput fees, maintenance and repair and machine hours), which are expensed as incurred. Our leases have remaining terms of one to 28 years, some of which include options to extend the leases for up to 5 years. Our leases are generally noncancelable. Certain leases also include options to purchase the leased property. The depreciable life of assets and leasehold improvements are limited by the expected lease term, unless there is a transfer of title or purchase option reasonably certain of exercise.
An incremental borrowing rate is applied to our leases for balance sheet measurement. As most of our leases do not provide an implicit rate, we generally use our incremental borrowing rate based on the estimated rate of interest for a collateralized borrowing over a similar term of the lease payments at the commencement date.
Operating leases are included in operating lease ROU assets, accrued and other current liabilities and long-term operating lease liabilities on our consolidated balance sheets. Finance leases are included in property, plant and equipment, current portion of long-term debt and finance lease obligations and long-term debt and finance lease obligations on our consolidated balance sheets. Changes in ROU assets and operating lease liabilities are included net in change in operating lease liabilities on the consolidated statement of cash flows. The management services fee charged by Enviva Holdings, LP to us under the EVA MSA includes rent-related amounts for noncancelable operating leases for office space in Maryland and North Carolina held by Enviva Holdings, LP.
Operating lease ROU assets and liabilities and finance leases were as follows as of December 31, 2019:
Operating leases: | ||||
Operating lease right-of-use assets | $ | 32,830 | ||
Current portion of operating lease liabilities | $ | 1,439 | ||
Long-term operating lease liabilities | 33,469 | |||
Total operating lease liabilities | $ | 34,908 | ||
Finance leases: | ||||
Property plant and equipment, net | $ | 7,398 | ||
Current portion of long-term finance lease obligations | $ | 4,584 | ||
Long-term finance lease obligations | 2,954 | |||
Total finance lease liabilities | $ | 7,538 | ||
Operating and finance lease costs were as follows for the year ended December 31, 2019:
92
ENVIVA PARTNERS, LP AND SUBSIDIARIES
Notes to Consolidated Financial Statements (Continued)
(In thousands, except number of units, per unit amounts and unless otherwise noted)
Lease Cost | Classification | 2019 | ||||
Operating lease cost: | ||||||
Fixed lease cost | Cost of goods sold | $ | 4,814 | |||
Variable lease cost | Cost of goods sold | 16 | ||||
Short-term lease costs | Cost of goods sold | 7,309 | ||||
Total operating lease costs | $ | 12,139 | ||||
Finance lease cost: | ||||||
Amortization of leased assets | Depreciation and amortization | 4,159 | ||||
Variable lease cost | Cost of goods sold | 9 | ||||
Interest on lease liabilities | Interest expense | 292 | ||||
Total finance lease costs | $ | 4,460 | ||||
Total lease costs | $ | 16,599 | ||||
Noncancelable operating lease costs were approximately $4.4 million for the year ended December 31, 2018 and insignificant for the year ended December 31, 2017.
In February 2015, Wilmington entered into a Deed of Lease Agreement with North Carolina State Ports Authority (“NCSPA”) to lease certain real property at NCSPA’s Wilmington, North Carolina marine terminal for the Wilmington terminal. The lease has a 21-year term, two five-year renewal options and annual base rent of $0.2 million that is payable monthly or annually, subject to an annual increase in the producer’s price index for industrial commodities less fuel. No payments are due until September 2021. The total base rent payments over the life of the lease are estimated at $4.7 million. In May 2016, the lease was amended to include a minimum annual throughput ton fee, subject to an annual increase in producer’s price index up to 1%. The total estimated minimum annual throughput ton fee is $1.9 million for 1.0 million tons annually, where the ultimate fee would increase for throughput above 1.0 million tons annually. Total estimated payments over the life of the lease are approximately $71.7 million. Operating lease expense related to the lease and included in noncancelable operating leases was $2.3 million for each of the years ended December 31, 2019 and December 31, 2018.
Operating and finance lease cash flow information was as follows for the year ended December 31, 2019:
2019 | ||||
Cash paid for amounts included in the measurement of lease liabilities: | ||||
Operating cash flows from operating leases | $ | 4,826 | ||
Operating cash flows from finance leases | 292 | |||
Financing cash flows from finance leases | 3,304 | |||
Assets obtained in exchange for lease obligations: | ||||
Operating leases | $ | 7,465 | ||
Finance leases | 6,493 | |||
The future minimum lease payments and the aggregate maturities of operating and finance lease liabilities are as follows as of December 31, 2019:
93
ENVIVA PARTNERS, LP AND SUBSIDIARIES
Notes to Consolidated Financial Statements (Continued)
(In thousands, except number of units, per unit amounts and unless otherwise noted)
Years Ending December 31, | Operating Leases | Finance Leases | Total | |||||||||
2020 | $ | 4,140 | $ | 4,906 | $ | 9,046 | ||||||
2021 | 3,890 | 2,388 | 6,278 | |||||||||
2022 | 3,719 | 332 | 4,051 | |||||||||
2023 | 3,710 | 305 | 4,015 | |||||||||
2024 | 3,581 | 92 | 3,673 | |||||||||
Thereafter | 61,530 | — | 61,530 | |||||||||
Total lease payments | 80,570 | 8,023 | 88,593 | |||||||||
Less: imputed interest | (45,662 | ) | (485 | ) | (46,147 | ) | ||||||
Total present value of lease liabilities | $ | 34,908 | $ | 7,538 | $ | 42,446 | ||||||
The future minimum lease payments as of December 31, 2018 for operating and finance lease liabilities were $73.8 million and $4.8 million, respectively.
The weighted-average remaining lease terms and discount rates for our operating and finance leases were weighted using the undiscounted future minimum lease payments and are as follows as of December 31, 2019:
Weighted average remaining lease term (years): | |||
Operating leases | 22 | ||
Finance leases | 2 | ||
Weighted average discount rate: | |||
Operating leases | 8 | % | |
Finance leases | 6 | % | |
(10) Derivative Instruments
We use derivative instruments to partially offset our business exposure to foreign currency exchange and interest rate risk. We may enter into foreign currency forward and option contracts to offset some of the foreign currency exchange risk on expected future cash flows and interest rate swaps to offset some of the interest rate risk on expected future cash flows on certain borrowings. Our derivative instruments expose us to credit risk to the extent that hedge counterparties may be unable to meet the terms of the applicable derivative instrument. We seek to mitigate such risks by limiting our counterparties to major financial institutions. In addition, we monitor the potential risk of loss with any one counterparty resulting from credit risk. Management does not expect material losses as a result of defaults by counterparties. We use derivative instruments to manage cash flow and do not enter into derivative instruments for speculative or trading purposes.
Cash Flow Hedges
For qualifying cash flow hedges, the effective portion of the gain or loss on the change in fair value is initially reported as a component of accumulated other comprehensive income in partners’ capital and subsequently reclassified into earnings when the hedged exposure affects earnings. Prior to January 1, 2019 and the adoption of ASU 2017-12 (see Note 2, Significant Accounting Policies), the ineffective portion of the gain or loss, if any, was reported in earnings in the current period. We considered our cash flow hedges to be highly effective at inception. Changes in fair value for derivative instruments not designated as hedging instruments are recognized in earnings.
Foreign Currency Exchange Risk
We are primarily exposed to fluctuations in foreign currency exchange rates related to off-take contracts that require future deliveries of wood pellets to be settled in British Pound Sterling (“GBP”) and Euro (“EUR”). We have entered and may continue to enter into foreign currency forward contracts, purchased option contracts or other instruments to partially manage this risk and, prior to August 2018, had designated certain of these instruments as cash flow hedges.
94
ENVIVA PARTNERS, LP AND SUBSIDIARIES
Notes to Consolidated Financial Statements (Continued)
(In thousands, except number of units, per unit amounts and unless otherwise noted)
In August 2018, due to market changes, increases in demand for wood pellets and requests from customers to accommodate the acceleration or deferral of contracted deliveries, we determined that it was not probable that the timing of the forecasted revenues associated with the hedged transactions would occur as originally scheduled. As a result, we discontinued hedge accounting for all designated foreign currency cash flow hedges and recognized the full amount of unrealized net gains included in accumulated other comprehensive income of $1.9 million in earnings. As of December 31, 2018, none of our foreign currency derivative instruments were designated as cash flow hedging instruments. In connection with the discontinuation of cash flow hedge accounting, we have recorded the on-going changes in the fair value of foreign currency derivatives as product sales or cost of sales depending on the nature of the item being hedged.
During December 2017, we determined that certain transactions were probable of not occurring within the forecasted time period, including the relevant cure period, due to unforeseen circumstances experienced by the customers to which the hedged transactions related. As a result, we discontinued hedge accounting for these transactions and recognized $1.6 million of unrealized losses that were reclassified from accumulated other comprehensive income to earnings.
Our outstanding foreign currency derivative instruments at December 31, 2019 expire on dates between 2020 and 2024.
Interest Rate Risk
We are exposed to fluctuations in interest rates on borrowings under our senior secured revolving credit facility. We have entered into a pay-fixed, receive-variable interest rate swap that expires in April 2020 to hedge interest rate risk associated with our variable rate borrowings under our senior secured revolving credit facilities. The interest rate swap is designated and qualifies as a cash flow hedge.
Derivative instruments are classified as Level 2 assets or liabilities based on inputs such as spot and forward benchmark interest rates (such as LIBOR) and foreign exchange rates. The fair value of derivative instruments as of December 31, 2019 and 2018 was as follows:
Asset (Liability) | ||||||||
Balance Sheet Classification | 2019 | 2018 | ||||||
Designated as hedging instruments: | ||||||||
Interest rate swap | ||||||||
Other current assets | $ | 56 | $ | 508 | ||||
Other long-term assets | — | 118 | ||||||
Total derivatives designated as hedging instruments | $ | 56 | $ | 626 | ||||
Not designated as hedging instruments: | ||||||||
Foreign currency exchange forward contracts: | ||||||||
Other current assets | $ | 277 | $ | 794 | ||||
Other long-term assets | 331 | 1,810 | ||||||
Other current liabilities | (735 | ) | (68 | ) | ||||
Other long-term liabilities | (1,055 | ) | (179 | ) | ||||
Foreign currency purchased option contracts: | ||||||||
Other current assets | 131 | 22 | ||||||
Other long-term assets | 1,443 | 3,348 | ||||||
Total derivatives not designated as hedging instruments | $ | 392 | $ | 5,727 | ||||
Net unrealized losses related to the change of fair market value of derivative instruments not designated as hedging instruments were $4.6 million during the year ended December 31, 2019 and are included in product sales on the consolidated statements of operations.
95
ENVIVA PARTNERS, LP AND SUBSIDIARIES
Notes to Consolidated Financial Statements (Continued)
(In thousands, except number of units, per unit amounts and unless otherwise noted)
During the year ended December 31, 2018, we recorded a net unrealized gain of $8.6 million related to changes in the fair value of foreign currency instruments not designated as hedging instruments, of which $8.4 million was included in product sales and $0.2 million is included in cost of goods sold on the consolidated statements of operations. Included in the unrealized net gains for the year ended December 31, 2018 was $1.9 million related to the reclassification of unrealized net gains previously included in accumulated other comprehensive income as described above.
Net unrealized gains included in other income (expense) related to the change of fair market value of derivative instruments not designated as hedging instruments during the year ended December 31, 2017 were $0.2 million.
Realized gains related to derivatives settled were $1.7 million and $4.6 million, respectively, during the years ended December 31, 2019 and 2018 and are included in product sales on the consolidated statements of operations.
The effects of instruments designated as cash flow hedges and the related changes in accumulated other comprehensive income and the gains and losses recognized in earnings for the year ended December 31, 2019 were as follows:
Amount of Gain (Loss) in Other Comprehensive Income on Derivative (Effective Portion) | Location of Gain (Loss) Reclassified from Accumulated Other Comprehensive Income (Effective Portion) | Amount of Gain (Loss) Reclassified from Accumulated Other Comprehensive Income into Income (Effective Portion) | |||||
Interest rate swap | (146 | ) | Interest expense | 288 | |||
The effects of instruments that were designated as cash flow hedges and the related changes in accumulated other comprehensive income and the gains and losses recognized in earnings for the year ended December 31, 2018 were as follows:
Amount of Gain in Other Comprehensive Income on Derivative (Effective Portion) | Location of Gain (Loss) Reclassified from Accumulated Other Comprehensive Income (Effective Portion) | Amount of Gain Reclassified from Accumulated Other Comprehensive Income into Income (Effective Portion) | Location of Gain (Loss) Recognized in Income on Derivative (Ineffective Portion and Amount Excluded from Effectiveness Testing) | Amount of Gain (Loss) Recognized in Income on Derivative (Ineffective Portion and Amount Excluded from Effectiveness Testing) | |||||||||||
Foreign currency exchange forward contracts | $ | 4,532 | Product sales | $ | — | Product sales | $ | 2,413 | |||||||
Foreign currency exchange purchased option contracts | 749 | Product sales | — | Product sales | (470 | ) | |||||||||
Interest rate swap | 374 | Interest expense | 231 | Interest expense | (13 | ) | |||||||||
We enter into master netting arrangements designed to permit net settlement of derivative transactions among the respective counterparties. If we had settled all transactions with our respective counterparties at December 31, 2019, we would have received a net settlement termination payment of $0.4 million, which differs insignificantly from the recorded fair value of the derivatives. We present our derivative assets and liabilities at their gross fair values.
The notional amounts of outstanding derivative instruments associated with outstanding or unsettled derivative instruments as of December 31, 2019 and 2018 were as follows:
2019 | 2018 | ||||||
Foreign exchange forward contracts in GBP | £ | 50,575 | £ | 42,170 | |||
Foreign exchange purchased option contracts in GBP | £ | 43,415 | £ | 39,365 | |||
Foreign exchange forward contracts in EUR | € | — | € | 14,300 | |||
Foreign exchange purchased option contracts in EUR | € | 1,200 | € | 1,675 | |||
Interest rate swap | $ | 34,354 | $ | 39,829 | |||
(11) Fair Value Measurements
The amounts reported in the consolidated balance sheets as cash and cash equivalents, accounts receivable, related-party receivables, prepaid expenses and other current assets, accounts payable, related-party payables, deferred consideration due to
96
ENVIVA PARTNERS, LP AND SUBSIDIARIES
Notes to Consolidated Financial Statements (Continued)
(In thousands, except number of units, per unit amounts and unless otherwise noted)
related-party and accrued and other current liabilities approximate fair value because of the short-term nature of these instruments.
Derivative instruments and long-term debt and finance lease obligations including the current portion are classified as Level 2 instruments. The fair value of our senior notes (see Note 14, Long-Term Debt and Finance Lease Obligations) was determined based on observable market prices in a less active market and was categorized as Level 2 in the fair value hierarchy. The fair value of other long-term debt and finance lease obligations classified as Level 2 was determined based on the usage of market prices not quoted on active markets and other observable market data. The fair value of the long-term debt and finance lease obligations are based upon rates currently available for debt and finance lease obligations with similar terms and remaining maturities. The carrying amount of derivative instruments approximates fair value.
The carrying amount and estimated fair value of long-term debt and finance lease obligations as of December 31, 2019 and 2018 was as follows:
December 31, 2019 | December 31, 2018 | ||||||||||||||
Carrying Amount | Fair Value | Carrying Amount | Fair Value | ||||||||||||
2026 Notes | $ | 593,476 | $ | 644,250 | $ | — | $ | — | |||||||
2021 Notes (1) | — | — | 352,843 | 359,943 | |||||||||||
Other long-term debt and finance lease obligations | 9,544 | 9,544 | 79,812 | 79,812 | |||||||||||
Total long-term debt and finance lease obligations | $ | 603,020 | $ | 653,794 | $ | 432,655 | $ | 439,755 | |||||||
(1) Notes were redeemed in December 2019 from proceeds from the issuance of the 2026 Notes. For more information, see Note 14, Long-Term Debt and Finance Lease Obligations.
(12) Goodwill
Goodwill includes $80.7 million associated with the acquisition of Cottondale by our sponsor and its contribution to us in 2015 and $4.9 million from acquisitions in 2010.
(13) Assets Held for Sale and Dissolution
In December 2017, we sold the Wiggins plant to a third-party buyer for a purchase price of $0.4 million and recorded a loss on the sale of $0.8 million, net, upon deconsolidation, consisting of a loss on the sale of $3.4 million and a $2.6 million gain upon deconsolidation, which is included in general and administrative expenses on the consolidated statements of operations. In December 2017, Wiggins was dissolved.
(14) Long-Term Debt and Finance Lease Obligations
Long-term debt and finance lease obligations at carrying value consisted of the following at December 31:
2019 | 2018 | ||||||
2026 Notes, net of unamortized discount, premium and debt issuance of $6.5 million as of December 31, 2019 | $ | 593,476 | $ | — | |||
2021 Notes, net of unamortized discount, premium and debt issuance of $2.2 million as of December 31, 2018 | — | 352,843 | |||||
Senior secured revolving credit facility | — | 73,000 | |||||
Other loans | 2,006 | 2,015 | |||||
Finance leases | 7,538 | 4,797 | |||||
Total long-term debt and finance lease obligations | 603,020 | 432,655 | |||||
Less current portion of long-term debt and finance lease obligations | (6,590 | ) | (2,722 | ) | |||
Long-term debt and finance lease obligations, excluding current installments | $ | 596,430 | $ | 429,933 | |||
2026 Notes
97
ENVIVA PARTNERS, LP AND SUBSIDIARIES
Notes to Consolidated Financial Statements (Continued)
(In thousands, except number of units, per unit amounts and unless otherwise noted)
On December 9 and December 12, 2019, Enviva Partners, LP, with its wholly owned subsidiary Enviva Partners Finance Corp., issued $550.0 million and $50.0 million, respectively, in aggregate principal amount of 6.5% senior unsecured notes due January 15, 2026 in private placements under Rule 144A and Regulation S of the Securities Act of 1933, as amended, for a total combined aggregate principal amount outstanding of $600.0 million. We received gross proceeds of approximately $601.8 million from the 2026 Notes and net proceeds of approximately $595.8 million after deducting commissions and expenses. We used the net proceeds from the 2026 Notes to (1) redeem our existing $355.0 million principal amount of 8.5% senior unsecured notes due 2021 (the “2021 Notes”), including payment of the related redemption premium, (2) repay borrowings under our senior secured revolving credit facility, including payment of the related accrued interest, and (3) for general partnership purposes. Interest payments are due semi-annually in arrears on January 15 and July 15 of each year, commencing July 15, 2020. We recorded $6.6 million of debt issuance costs. original issue discount and premium associated with the issuance of the 2026 Notes, which have been recorded as a deduction to long-term debt and finance lease obligations.
We may redeem all or a portion of the 2026 Notes at any time at the applicable redemption price, plus accrued and unpaid interest, if any, (subject to the right of holders of record on the relevant record date to receive interest due on an interest payment date that is on or prior to the redemption date) and, in some cases, plus a make-whole premium.
We were in compliance with the covenants and restrictions associated with, and no events of default existed under, the indenture dated as of December 9, 2019 governing the 2026 Notes as of December 31, 2019. The 2026 Notes are guaranteed jointly and severally on a senior unsecured basis by our existing subsidiaries (excluding Enviva Partners Finance Corp.) that guarantee certain of our indebtedness and may be guaranteed by certain future restricted subsidiaries.
2021 Notes
On December 9, 2019, we redeemed all $355.0 million of aggregate principal amount of 2021 Notes and recognized a $9.0 million loss on the early retirement of debt obligation consisting of a $7.5 million debt redemption premium and $1.5 million for the write-off of unamortized debt issuance costs, original issue discount and premium. The amounts were amortized over the term of the 2021 Notes and were expensed in December 2019 when we repaid $355.0 million of aggregate principal amount of the 2021 Notes. The 2021 Notes early redemption was funded from the issuance of the 2026 Notes.
Senior Secured Revolving Credit Facility
We have a $350.0 million senior secured revolving credit facility that matures on October 18, 2023.
Borrowings under the revolving credit commitments thereunder bear interest, at our option, at either a Eurodollar rate or at a base rate, in each case, plus an applicable margin. The applicable margin will fluctuate between 1.75% per annum and 3.00% per annum, in the case of Eurodollar rate borrowings, or between 0.75% per annum and 2.00% per annum, in the case of base rate loans, in each case, based upon our Total Leverage Ratio (as defined in our credit agreement) at such time, with 25 basis point increases or decreases for each 0.50 increase or decrease in our Total Leverage Ratio from 2.75:1:00 to 4.75:1:00.
We are required to pay a commitment fee on the daily unused amount under the revolving credit commitments at a rate between 0.25% and 0.50% per annum. As of December 31, 2019 and 2018, amounts paid were not material.
At December 31, 2019, we had no revolving borrowings under our senior secured revolving credit facility. At December 31, 2018, we had $73.0 million in revolving borrowings under our senior secured revolving credit facility.
The credit agreement contains certain covenants, restrictions and events of default. We are required to maintain (1) a maximum Total Leverage Ratio at or below 4.75 to 1.00 (or 5.00 to 1.00 during a Material Transaction Period and (2) a minimum Interest Coverage Ratio (as defined in our credit agreement) of not less than 2.25 to 1.00.
As of December 31, 2019 and 2018, we were in compliance with all covenants and restrictions associated with, and no events of default existed under, our senior secured revolving credit facility. Our obligations under the senior secured revolving credit facility are guaranteed by certain of our subsidiaries and secured by liens on substantially all of our assets; however, the senior secured revolving credit facility is not guaranteed by the Hamlet JV or secured by liens on its assets.
98
ENVIVA PARTNERS, LP AND SUBSIDIARIES
Notes to Consolidated Financial Statements (Continued)
(In thousands, except number of units, per unit amounts and unless otherwise noted)
Debt Issuance Costs and Original Issue Discounts and Premium
Unamortized debt issuance costs, original issue discounts and premium included in long-term debt at December 31, 2019 and 2018 were $6.5 million and $2.2 million, respectively. Unamortized debt issuance costs associated with the revolving credit facility included in long-term assets was $2.0 million and $2.5 million at December 31, 2019 and 2018, respectively. Amortization expense included in interest expense for the years ended December 31, 2019, 2018 and 2017 was $1.2 million, $1.1 million and $1.4 million, respectively.
Debt Maturities
Our long-term debt matures in 2026 and our finance lease obligations have maturity dates of between 2020 and 2024. The aggregate maturities of long-term debt and finance lease obligations as of December 31, 2019 are as follows:
Year Ending December 31: | ||||
2020 | $ | 6,590 | ||
2021 | 2,278 | |||
2022 | 295 | |||
2023 | 291 | |||
2024 and thereafter | 600,090 | |||
Long-term debt and finance lease obligations | 609,544 | |||
Unamortized premium | 1,735 | |||
Unamortized debt issuance costs | (8,259 | ) | ||
Total long-term debt and finance lease obligations | $ | 603,020 | ||
Depreciation expense relating to assets held under finance lease obligations was $4.2 million, $1.8 million and $0.7 million for each of the years ended December 31, 2019, 2018 and 2017, respectively.
(15) Related-Party Transactions
Related-party amounts included on the consolidated statements of operations were the following for each of the years ended December 31:
2019 | 2018 | 2017 | |||||||||
Other revenue | $ | 1,789 | $ | 3,545 | $ | 5,912 | |||||
Cost of goods sold | 111,491 | 84,148 | 69,445 | ||||||||
General and administrative expenses | 24,492 | 17,096 | 15,132 | ||||||||
Management Services Agreements
Pursuant to the MSAs, Enviva Management provides us with operations, general administrative, management and other services. We are required to reimburse Enviva Management for the amount of all direct or indirect internal or third-party expenses incurred by Enviva Management in connection with the provision of such services. The MSAs include rent-related amounts for noncancelable operating leases for office space in Maryland and North Carolina held by our sponsor. Under the Hamlet JV MSA, to the extent allocated costs exceed the annual management fee, the additional costs are recorded with an increase to partners’ capital.
99
ENVIVA PARTNERS, LP AND SUBSIDIARIES
Notes to Consolidated Financial Statements (Continued)
(In thousands, except number of units, per unit amounts and unless otherwise noted)
Related-party amounts included on the consolidated balance sheets and the consolidated statements of operations under our MSAs were as follows:
As of December 31, | 2019 | 2018 | ||||||
Finished goods inventory | $ | 419 | $ | 1,244 | ||||
Related-party payables | 18,703 | 19,015 | ||||||
For the Year Ended December 31, | 2019 | 2018 | 2017 | |||||||||
Cost of goods sold | $ | 63,377 | $ | 52,280 | $ | 49,875 | ||||||
General and administrative expenses | 24,492 | 17,096 | 15,132 | |||||||||
During the year ended December 31, 2019, $2.6 million of fees expensed under the Hamlet JV MSA were waived and recorded as an increase to partners’ capital.
Hamlet Drop-Down Agreements
During the year ended December 31, 2019, $19.7 million was recorded as an increase to partners’ capital and $7.7 million was recorded in cost of goods sold pursuant to the agreements we entered into on the date of acquisition of the Hamlet JV. The increases to partners’ capital are comprised of expenses waived under the First EVA MSA Fee Waiver and the Hamlet JV MSA Fee Waiver and reimbursement of construction cost overruns in excess of budgeted capital expenditures for the Hamlet plant. The net reduction in cost of goods sold comprises our receipt of a cost of cover deficiency fee from our sponsor pursuant to the Make-Whole Agreement as a result of Hamlet Operator’s failure to meet specified production levels, offset by the agreed-upon price due to Hamlet Operator for the pellets produced by the Hamlet plant that we have sold.
Hamlet JV Revolver
In connection with the Hamlet Drop-Down, on April 2, 2019, our sponsor assigned to us all of its rights and obligations under the amended and restated credit agreement, dated as of June 30, 2018, between the Hamlet JV, as borrower, and our sponsor, as lender. On April 2, 2019, we amended and restated the Hamlet JV Revolver to extend the maturity date of the revolving loans made to the Hamlet JV and increase our commitment as lender to fund increases in the amount of such loans from $30.0 million to $60.0 million in order to fund capital expenditures and working capital at the Hamlet plant. As of December 31, 2019, the outstanding balance of the Hamlet JV Revolver was $52.2 million due from the Hamlet JV to Enviva, LP, both of which are eliminated upon consolidation.
Second EVA MSA Fee Waiver
In June 2019, we entered into an additional agreement with Enviva Management (the “Second EVA MSA Fee Waiver”) pursuant to which we received a $5.0 million waiver of fees under the EVA MSA through September 30, 2019 as consideration for an assignment of two shipping contracts to our sponsor to rebalance our and our sponsor’s respective shipping obligations under our existing off-take contracts. During the year ended December 31, 2019, $5.0 million of fees expensed under the EVA MSA were waived and recorded as an increase to partners’ capital pursuant to the Second EVA MSA Fee Waiver. During the year ended December 31, 2018, no fees were waived under the EVA MSA pursuant to the Second EVA MSA Fee Waiver.
Wilmington Drop-Down - Second Payment
We completed the Wilmington Drop-Down in October 2017 for total consideration of $130.0 million, subject to certain conditions. On April 1, 2019, we made the second and final payment of $74.0 million, which consisted of $24.3 million in cash, of which $22.8 million was distributed to John Hancock, and the issuance of 1,691,627 common units, or approximately $49.7 million in common units, which were distributed to John Hancock (the “Second Payment”). The Second Payment was reflected in deferred consideration for drop-downs due to related-party on the consolidated balance sheets as of December 31, 2018.
100
ENVIVA PARTNERS, LP AND SUBSIDIARIES
Notes to Consolidated Financial Statements (Continued)
(In thousands, except number of units, per unit amounts and unless otherwise noted)
Related-Party Indemnification
In December 2016, we acquired from the Hamlet JV all of the issued and outstanding limited liability company interests in Sampson (the “Sampson Drop-Down”), which owns a wood pellet production plant in Sampson County, North Carolina (the “Sampson plant”). In connection with the Sampson Drop-Down and the Wilmington Drop-Down, the Hamlet JV agreed to indemnify us, our affiliates and our respective officers, directors, managers, counsel, agents and representatives from all costs and losses arising from certain vendor liabilities and claims related to the construction of the Sampson plant and the Wilmington terminal that were included in the net assets we acquired.
We recorded a related-party receivable from the Hamlet JV of $6.4 million for reimbursement of indemnifiable amounts related to the Sampson Drop-Down. At December 31, 2018, the related-party receivable associated with such amounts was $0.3 million. As of December 31, 2019, any reimbursement of indemnifiable amounts were eliminated upon consolidation.
We recorded a related-party receivable from the Hamlet JV of $1.8 million for reimbursement of indemnifiable amounts related to the Wilmington Drop-Down. As of December 31, 2019, no further amounts are outstanding. At December 31, 2018, the related-party receivable associated with such amounts was insignificant.
Sampson Construction Payments
Pursuant to payment agreements between us and the Hamlet JV, the Hamlet JV agreed to pay an aggregate amount of $2.9 million to us in consideration for costs incurred by us to repair or replace certain equipment at the Sampson plant following the consummation of the Sampson Drop-Down. As of December 31, 2018, $2.9 million was received and no further amounts are outstanding.
Greenwood Contract
In February 2018, we entered into a contract with Greenwood to purchase wood pellets produced by the Greenwood plant through March 2022 (the “Greenwood Contract”) and have a take-or-pay obligation with respect to 550,000 MTPY of wood pellets from July 2019 through March 2022. Pursuant to an amendment to the Greenwood Contract, our take-or-pay obligation with respect to 550,000 MTPY of wood pellets was deferred to 2021 and made subject to Greenwood’s option to increase or decrease the volume by 10% each contract year.
During the years ended December 31, 2019 and 2018, we purchased $46.2 million and $27.4 million of wood pellets from Greenwood and recorded a cost of cover deficiency fee of approximately $5.0 million and $0.7 million as Greenwood was unable to satisfy certain commitments. We did not purchase wood pellets from Greenwood during the year ended December 31, 2017.
As of December 31, 2019 and 2018, of the net $41.2 million and $26.7 million, $40.9 million and $26.2 million is included in cost of goods sold, and $0.3 million and $0.5 million is included in finished goods inventory, respectively.
As of December 31, 2019 and 2018, $1.3 million and $7.9 million, respectively, is included in related-party payables related to our wood pellet purchases from Greenwood.
Holdings TSA
The Wilmington Drop-Down included the Holdings TSA, pursuant to which our sponsor agreed to deliver a minimum of 125,000 MT of wood pellets per quarter for receipt, storage, handling and loading services by the Wilmington terminal and pay a fixed fee on a per-ton basis for such terminal services. The Holdings TSA remains in effect until September 1, 2026. During the year ended December 31, 2019, there was no terminal services revenue from our sponsor. During the years ended December 31, 2018 and 2017, we recorded $0.8 million and $2.8 million, respectively, as terminal services revenue from our sponsor, which is included in other revenue.
In February 2018, our sponsor amended and assigned the Holdings TSA to Greenwood. Deficiency payments are due to Wilmington if quarterly minimum throughput requirements are not met. During the years ended December 31, 2019 and 2018, we recorded $1.8 million and $2.2 million, respectively, of deficiency fees from Greenwood, which is included in other revenue. We did not have any deficiency fees from Greenwood for the year ended December 31, 2017.
101
ENVIVA PARTNERS, LP AND SUBSIDIARIES
Notes to Consolidated Financial Statements (Continued)
(In thousands, except number of units, per unit amounts and unless otherwise noted)
In September 2018, Hurricane Florence impacted the rail line on which wood pellets are typically transported from the Greenwood plant to the Wilmington terminal. As a result, Greenwood was unable to satisfy certain commitments under the Holdings TSA and the Greenwood Contract and agreed to pay $1.8 million to us as deficiency fees in consideration of these commitments. Consideration of $0.5 million related to the Holdings TSA was included in other revenue and $1.3 million related to the Greenwood contract was included as a reduction of cost of goods sold during the year ended December 31, 2018.
Enviva FiberCo, LLC
We purchase raw materials from Enviva FiberCo, LLC, a wholly owned subsidiary of our sponsor (“FiberCo”). During the year ended December 31, 2019, cost of cover deficiency fees net of raw material purchases was $0.5 million. During 2018 and 2017 raw material purchases were $7.1 million and $8.5 million, respectively. There were no cost of cover deficiency fees from FiberCo recorded during the years ended December 31, 2018 and 2017.
Biomass Purchase Agreement - Hamlet JV
In September 2016, Sampson entered into a confirmation under a master biomass purchase and sale agreement between us and the Hamlet JV pursuant to which Sampson agreed to sell to our sponsor 60,000 MT of wood pellets through August 31, 2017. On June 23, 2017, our sponsor satisfied its take-or-pay obligation under the agreement with a $2.7 million payment to us, which is included in other revenue.
Biomass Option Agreement – Enviva Holdings, LP
In February 2017, Enviva, LP entered into an agreement and a confirmation thereunder with our sponsor (together, as amended, the “Option Contract”
During the years ended December 31, 2018 and 2017, Enviva, LP purchased $1.7 million and $11.1 million, respectively, of wood pellets from our sponsor. The Option Contract terminated in accordance with its terms in March 2018.
Long-Term Incentive Plan Vesting
During the year ended December 31, 2018, we paid $6.9 million to the General Partner for the purchase of common units from our sponsor, and the satisfaction of related tax withholding obligations of the Provider for which we are responsible under the MSA, in connection with the vesting and settlement of performance-based phantom unit awards granted under the LTIP. During the year ended December 31, 2019, no common units were purchased from our sponsor in connection with the vesting and settlement of performance-based phantom unit awards granted under the LTIP.
(16) Income Taxes
The Partnership and its operating subsidiaries are organized as limited partnerships and entities that are disregarded entities for federal and state income tax purposes. As a result, we are not subject to U.S. federal and most state income taxes. The partners and unitholders of the Partnership are liable for these income taxes on their share of our taxable income. Some states impose franchise and capital taxes on the Partnership. Such taxes are not material to the consolidated financial statements and have been included in other income (expense) as incurred.
For calendar year 2019, the only periods subject to examination for federal and state income tax returns are 2016 through 2018. We believe our income tax filing positions, including our status as a pass-through entity, would be sustained on audit and we do not anticipate any adjustments that would result in a material change to our consolidated balance sheet. Therefore, no reserves for uncertain tax positions, nor interest and penalties, have been recorded. For the years ended December 31, 2019, 2018 and 2017, no provision for federal or state income taxes has been recorded in the consolidated financial statements.
Our consolidated financial statements include Enviva Finance Corp., which is a wholly owned C-corporation that was formed for the purpose of being the co-issuer of our senior unsecured notes. There were no activities generated by Enviva Finance Corp. during 2019 and 2018; as a result, no provision for federal or state income taxes has been recorded in the consolidated financial statements.
(17) Partners’ Capital
Common and Subordinated Units - Sponsor
102
ENVIVA PARTNERS, LP AND SUBSIDIARIES
Notes to Consolidated Financial Statements (Continued)
(In thousands, except number of units, per unit amounts and unless otherwise noted)
In January 2018, our sponsor sold to the General Partner 81,708 common units, which were used to satisfy our obligation to settle vested performance-based phantom unit awards granted under the LTIP. On May 9, 2018, our sponsor sold to third parties all of the 1,265,453 common units held by our sponsor on such date. All of our subordinated units, which at the time were held by our sponsor, converted into common units on a one-for-one basis at the end of the subordination period on May 30, 2018. As of December 31, 2018, 11,905,138 common units were held by our sponsor. On April 2, 2019, in connection with the Hamlet Drop-Down, we issued 1,681,237 common units, or $50.0 million in common units, to our sponsor.
Common Units - Issuance
During March 2019, we issued 3,508,778 common units in a registered direct offering for net proceeds of approximately $97.0 million, net of $3.0 million of issuance costs. On April 1, 2019, in connection with the Second Payment for the Wilmington Drop-Down, we issued 1,691,627 common units, or $49.7 million in common units, to the Hamlet JV, which common units were distributed to John Hancock.
Shelf Registration - Equity Interests in the Partnership
We filed a shelf registration statement on Form S-3 with the U.S. Securities and Exchange Commission (the “SEC”) on June 21, 2019 to allow us, from time to time, in one or more offerings, to offer and sell (1) common units representing limited partner interests in Enviva Partners, LP and (2) preferred units representing equity interests in Enviva Partners, LP. The aggregate initial offering price of all securities sold by us under the effective shelf registration statement may not exceed $500.0 million.
On April 1, 2019, in connection with the Second Payment for the Wilmington Drop-Down, we issued 1,691,627 common units, or $49.7 million in common units, to the Hamlet JV, which common units were distributed to John Hancock. On April 2, 2019, in connection with the Hamlet Drop-Down, we issued 1,681,237 common units, or $50.0 million in common units, to our sponsor. In accordance with our registration rights agreements with John Hancock, we registered the common units issued for the Wilmington-Drop Down and the Hamlet Drop-Down for resale, subject to certain limitations, pursuant to the effective shelf registration statement.
At-the-Market Offering Program
Pursuant to an equity distribution agreement dated August 8, 2016, we may offer and sell common units from time to time through a group of managers, subject to the terms and conditions set forth in such agreement, of up to an aggregate sales amount of $100.0 million (the “ATM Program”).
During the year ended December 31, 2019, we did not sell common units under the ATM Program. During the year ended December 31, 2018, we sold 8,408 common units under the ATM Program for net proceeds of $0.2 million, net of an insignificant amount of commissions. We had no accounting or other fees associated with the ATM Program during the year ended December 31, 2018. Net proceeds from sales under the ATM Program were used for general partnership purposes.
Allocations of Net Income (Loss)
The Partnership’s partnership agreement contains provisions for the allocation of net income and loss to the unitholders of the Partnership and the General Partner. For purposes of maintaining partner capital accounts, the partnership agreement specifies that items of income and loss shall be allocated among the partners of the Partnership in accordance with their respective percentage ownership interest. Such allocations are made after giving effect, if any, to priority income allocations in an amount equal to incentive cash distributions, which are allocated 100% to the General Partner.
Incentive Distribution Rights
Incentive distribution rights (“IDRs”) represent the right to receive increasing percentages (from 15.0% to 50.0%) of quarterly distributions from operating surplus after distributions in amounts exceeding specified target distribution levels have been achieved by the Partnership. The General Partner currently holds the IDRs but may transfer these rights at any time.
103
ENVIVA PARTNERS, LP AND SUBSIDIARIES
Notes to Consolidated Financial Statements (Continued)
(In thousands, except number of units, per unit amounts and unless otherwise noted)
Cash Distributions to Unitholders
The partnership agreement sets forth the calculation to be used to determine the amount of cash distributions that our unitholders and our sponsor will receive.
Distributions that have been paid or declared related to the reporting period are considered in the determination of earnings per unit. The following table details the cash distribution paid or declared (in millions, except per unit amounts):
Quarter Ended | Declaration Date | Record Date | Payment Date | Distribution Per Unit | Total Cash Distribution | Total Payment to General Partner for Incentive Distribution Rights | ||||||||||||
June 30, 2018 | August 1, 2018 | August 15, 2018 | August 29, 2018 | $ | 0.6300 | $ | 16.7 | $ | 1.4 | |||||||||
September 30, 2018 | October 31, 2018 | November 15, 2018 | November 29, 2018 | $ | 0.6350 | $ | 16.8 | $ | 1.5 | |||||||||
December 31, 2018 | January 29, 2019 | February 15, 2019 | February 28, 2019 | $ | 0.6400 | $ | 17.0 | $ | 1.7 | |||||||||
March 31, 2019 | May 2, 2019 | May 20, 2019 | May 29, 2019 | $ | 0.6450 | $ | 21.6 | $ | 2.3 | |||||||||
June 30, 2019 | July 31, 2019 | August 15, 2019 | August 29, 2019 | $ | 0.6600 | $ | 22.1 | $ | 2.8 | |||||||||
September 30, 2019 | October 30, 2019 | November 15, 2019 | November 29, 2019 | $ | 0.6700 | $ | 22.4 | $ | 3.1 | |||||||||
December 31, 2019 | January 29, 2020 | February 14, 2020 | February 28, 2020 | $ | 0.6750 | $ | 22.7 | $ | 3.3 | |||||||||
For purposes of calculating our earnings per unit under the two-class method, common units are treated as participating preferred units, and the subordinated units were treated as the residual equity interest, or common equity. IDRs are treated as participating securities.
Distributions made in future periods based on the current period calculation of cash available for distribution are allocated to each class of equity that will receive the distribution. Any unpaid cumulative distributions are allocated to the appropriate class of equity.
We determine the amount of cash available for distribution for each quarter in accordance with our partnership agreement. The amount to be distributed to unitholders and IDR holders is based on the distribution waterfall set forth in our partnership agreement. Net earnings for the quarter are allocated to each class of partnership interest based on the distributions to be made. On May 30, 2018, the subordination period ended in accordance with our partnership agreement and all of our subordinated units converted into common units on a one-for-one basis (see Note 19, Net Income (Loss) per Limited Partner Unit).
Accumulated Other Comprehensive Income (Loss)
Comprehensive income (loss) consists of two components, net income (loss) and other comprehensive income (loss). Other comprehensive income (loss) refers to revenue, expenses and gains and losses that pursuant to GAAP are included in comprehensive income (loss) but excluded from net income (loss).
The following table presents the changes in accumulated other comprehensive income:
Balance at December 31, 2017 | $ | (3,040 | ) |
Net unrealized gains on cash flow hedges | 5,655 | ||
Reclassification of net gains on cash flow hedges realized into net income | (2,178 | ) | |
Currency translation adjustment | 2 | ||
Accumulated other comprehensive income at December 31, 2018 | 439 | ||
Net unrealized losses on cash flow hedges | (146 | ) | |
Reclassification of net gains on cash flow hedges realized into net loss | (288 | ) | |
Cumulative effect of accounting change - derivative instruments | 18 | ||
Accumulated other comprehensive income at December 31, 2019 | $ | 23 | |
104
ENVIVA PARTNERS, LP AND SUBSIDIARIES
Notes to Consolidated Financial Statements (Continued)
(In thousands, except number of units, per unit amounts and unless otherwise noted)
Noncontrolling Interests—Enviva Pellets Wiggins, LLC
Prior to December 2017, we held a 67% controlling interest in Wiggins. In December 2017, we sold the Wiggins plant to a third-party buyer for a purchase price of $0.4 million and recorded a loss on the sale of $0.8 million, net, which is included in general and administrative expenses. In December 2017, Wiggins was dissolved. Upon dissolution, no amounts were distributed to the non-controlling interest holders and all intercompany balances were forgiven (see Note 13, Assets Held for Sale and Dissolution).
Hamlet JV
The capital of the Hamlet JV is divided into two classifications: (1) Class A Units and (2) Class B Units, issued at a price of $1.00 per unit for each class.
Class A Units - Noncontrolling Interests
Class A Units were issued to John Hancock in exchange for capital contributions at a price of $1.00 for each Class A Unit.
John Hancock had a total capital commitment of $235.2 million and, as of December 31, 2019, John Hancock held 227.0 million Class A Units with a remaining capital commitment amount of $8.2 million.
Class B Units - Controlling Interests
Class B Units were issued to the Partnership in exchange for capital contributions at a price of $1.00 for each Class B Unit.
The Partnership had a total capital commitment of $232.2 million and, as of December 31, 2019, the Partnership held 224.0 million Class B Units with a remaining commitment amount of $8.2 million.
Pursuant to the limited liability company agreement of the Hamlet JV (the “Hamlet JV LLCA”), we are the managing member of the Hamlet JV and have the authority to manage the business and affairs of the Hamlet JV and take actions on its behalf, including adopting annual budgets, entering into agreements, effecting asset sales or biomass purchase agreements, making capital calls, incurring debt and taking other actions, subject to consent of John Hancock in certain circumstances. The Hamlet JV LLCA also sets forth the capital commitments and limitations thereon from each of the members and provides for the allocation of sale proceeds and distributions among the holders of outstanding Class A Units and Class B Units.
We included all accounts of the Hamlet JV in our consolidated results as of April 2, 2019 as the Class B Units represent a controlling interest in the Hamlet JV.
Distribution Rights
Distributions to John Hancock and to the Partnership are made in the reasonable discretion of the Partnership as managing member and are governed by the waterfall provisions of the Hamlet JV LLCA, which provides that distributions, after repayment of revolving borrowings under the Hamlet JV Revolver borrowings, are to be made as follows:
• | First: To the members in proportion to their relative unreturned capital contributions, then to the members in proportion to their relative unpaid preference amount. |
• | Thereafter: 25% to John Hancock and 75% to the Partnership. |
Prior to the Hamlet Drop-Down, John Hancock had received all of its capital contributions and substantially all of its preference amount and the historical net losses of the Hamlet JV had been allocated to the members of the Hamlet JV in proportion to their unreturned capital contributions; consequently, the balance of members’ capital attributable to John Hancock was negative at the time of the Hamlet Drop-Down. The Partnership has not received repayment of revolving borrowings from the Hamlet JV pursuant to the Hamlet JV Revolver or its capital contributions and preference amount as of December 31, 2019; as a result, none of the net loss of the Hamlet JV has been allocated to John Hancock following the Hamlet Drop-Down and no change has been recognized to the negative noncontrolling interest balance attributable to John Hancock that was acquired by the Partnership.
105
ENVIVA PARTNERS, LP AND SUBSIDIARIES
Notes to Consolidated Financial Statements (Continued)
(In thousands, except number of units, per unit amounts and unless otherwise noted)
Wilmington Drop-Down
Wilmington was a wholly owned subsidiary of the Hamlet JV prior to the consummation of the Wilmington Drop-Down. Our consolidated financial statements for the periods prior to October 2, 2017, were retrospectively recast to include the financial results of Wilmington as if the consummation of the Wilmington Drop-Down had occurred on May 15, 2013, the date Wilmington was originally organized. The interests of the Hamlet JV’s third-party investors in Wilmington for periods prior to the related drop-down transactions have been reflected as a non-controlling interest in our financial statements. Our consolidated statements of operations for the year ended December 31, 2017 included net losses of $3.1 million attributable to the non-controlling interests in Wilmington. We had no non-controlling interests in Wilmington for the years ended December 31, 2019 and 2018.
(18) Equity-Based Awards
Long-Term Incentive Plan
The General Partner maintains the LTIP, which provides for the grant, from time to time, at the discretion of the board of directors of the General Partner or a committee thereof, of unit options, unit appreciation rights, restricted units, phantom units, DERs and other awards. The LTIP limits the number of common units that may be delivered pursuant to awards under the plan to 2,450,000 common units in accordance with the first amendment to the LTIP, which became effective on January 29, 2020. If equity awards granted under the LTIP are forfeited, canceled, exercised, paid in cash or otherwise terminate or expire without the actual delivery of the underlying common units, the corresponding number of such common units will remain available for delivery pursuant to other awards under the LTIP. The common units issuable pursuant to the LTIP will consist, in whole or in part, of common units acquired in the open market or from any affiliate or any other person, newly issued common units or any combination of the foregoing as determined by the board of directors of the General Partner or a committee thereof.
During 2019, 2018 and 2017, the board of directors of the General Partner granted phantom units in tandem with corresponding DERs to employees of Enviva Management who provide services to us (the “Affiliate Grants”) and phantom units in tandem with corresponding DERs to certain non-employee directors of the General Partner (the “Director Grants”). The phantom units and corresponding DERs are subject to certain vesting and forfeiture provisions. Award recipients do not have all of the rights of a common unitholder with respect to the phantom units until the phantom units have vested and been settled. Awards of the phantom units were settled in common units within 60 days after the applicable vesting date. If a phantom unit award recipient experiences a termination of service under certain circumstances set forth in the applicable award agreement, the unvested phantom units and corresponding DERs (in the case of performance-based Affiliate Grants) are forfeited. Forfeitures are recognized when the actual forfeiture occurs.
106
ENVIVA PARTNERS, LP AND SUBSIDIARIES
Notes to Consolidated Financial Statements (Continued)
(In thousands, except number of units, per unit amounts and unless otherwise noted)
Affiliate Grants
A summary of the Affiliate Grants for the years ended December 31, 2019, 2018 and 2017 is as follows:
Time-Based Phantom Units | Performance-Based Phantom Units | Total Affiliate Grant Phantom Units | ||||||||||||||||||
Units | Weighted-Average Grant Date Fair Value (per unit)(1) | Units | Weighted-Average Grant Date Fair Value (per unit)(1) | Units | Weighted-Average Grant Date Fair Value (per unit)(1) | |||||||||||||||
Nonvested December 31, 2017 | 595,866 | $ | 22.32 | 111,104 | $ | 25.52 | 706,970 | $ | 22.82 | |||||||||||
Granted | 398,729 | $ | 29.15 | 171,104 | $ | 28.92 | 569,833 | $ | 29.08 | |||||||||||
Adjusted | — | $ | — | 19,832 | $ | 18.19 | 19,832 | $ | 18.19 | |||||||||||
Forfeitures | (89,119 | ) | $ | 25.59 | (17,469 | ) | $ | 25.76 | (106,588 | ) | $ | 25.62 | ||||||||
Vested | (181,536 | ) | $ | 21.42 | (45,059 | ) | $ | 23.80 | (226,595 | ) | $ | 21.89 | ||||||||
Nonvested December 31, 2018 | 723,940 | $ | 25.91 | 239,512 | $ | 27.65 | 963,452 | $ | 26.34 | |||||||||||
Granted | 395,851 | $ | 30.41 | 219,943 | $ | 30.28 | 615,794 | $ | 30.36 | |||||||||||
Forfeitures | (99,999 | ) | $ | 28.56 | (24,185 | ) | $ | 29.82 | (124,184 | ) | $ | 28.80 | ||||||||
Vested | (145,506 | ) | $ | 18.30 | — | $ | — | (145,506 | ) | $ | 18.30 | |||||||||
Nonvested December 31, 2019 | 874,286 | $ | 28.90 | 435,270 | $ | 28.84 | 1,309,556 | $ | 28.88 | |||||||||||
(1) | Determined by dividing the aggregate grant date fair value of awards by the number of awards issued. |
Time-based Affiliate Grants vest on the third anniversary of the grant date and performance-based Affiliate Grants vest in three years upon achievement of specific performance milestones. We account for the delivery of common units upon the settlement of vested Affiliate Grants as if such common units were distributed by us. The fair value of the Affiliate Grants granted during 2019 and 2018 was $18.7 million and $16.6 million, respectively, based on the market price per unit on the applicable date of grant. The grant date fair value of performance-based Affiliate Grants is reported based on the probable outcome of the performance conditions on the grant date. The fair value of the Affiliate Grants is expensed by Enviva Management at the grant date. Compensation expense is based on the grant date fair value. Changes in unit-based compensation expense due to passage of time, forfeitures, probability of meeting required performance conditions and final settlements are recorded as adjustments to unit-based compensation expense and partners’ capital. For performance-based Affiliate Grants, expense is accrued only if the performance goals are considered to be probable of occurring.
Enviva Management recognizes unit-based compensation expense for the units awarded and a portion of that expense is allocated to us under the MSA in the same manner as other corporate expenses. Our portion of the unit-based compensation expense is included in general and administrative expenses. We recognized $5.0 million, $4.7 million and $3.4 million of general and administrative expense associated with the Affiliate Grants during the years ended December 31, 2019, 2018 and 2017, respectively. During the third quarter of 2019, $0.4 million of unit-based compensation with respect to performance-based Affiliate Grants was reversed as the related performance goals were not met and during the fourth quarter of 2017, $1.6 million of unit-based compensation with respect to performance-based Affiliate Grants was reversed as the related performance goals were not met. As performance goals were met during 2018, no unit-based compensation with respect to performance-based Affiliate Grants expense was adjusted.
We paid $1.9 million to Enviva Management to satisfy the withholding tax requirements associated with 145,506 time-based Affiliate Grants that vested under the LTIP during the year ended December 31, 2019. No performance-based Affiliate Grants vested under the LTIP during the year ended December 31, 2019. We paid $2.9 million to Enviva Management to satisfy the withholding tax requirements associated with 181,536 time-based Affiliate Grants and 45,059 performance-based Affiliate Grants that vested under the LTIP during the year ended December 31, 2018. The unrecognized estimated unit-based compensation cost relating to outstanding Affiliate Grants at December 31, 2019 was $8.7 million, which will be recognized over the remaining vesting period.
107
ENVIVA PARTNERS, LP AND SUBSIDIARIES
Notes to Consolidated Financial Statements (Continued)
(In thousands, except number of units, per unit amounts and unless otherwise noted)
Director Grants
A summary of the Director Grant unit awards subject to vesting for the years ended December 31, 2019, 2018 and 2017, is as follows:
Time-Based Phantom Units | ||||||
Units | Weighted-Average Grant Date Fair Value (per unit)(1) | |||||
Nonvested December 31, 2017 | 15,840 | $ | 25.25 | |||
Granted | 13,964 | $ | 28.65 | |||
Vested | (15,840 | ) | $ | 25.25 | ||
Nonvested December 31, 2018 | 13,964 | $ | 28.65 | |||
Granted | 13,264 | $ | 30.16 | |||
Vested | (13,964 | ) | $ | 28.65 | ||
Nonvested December 31, 2019 | 13,264 | $ | 30.16 | |||
(1) | Determined by dividing the aggregate grant date fair value of awards by the number of awards issued. |
In February 2019, Director Grants valued at $0.4 million were granted and vest on the first anniversary of the grant date in February 2020. In February 2020, the Director Grants that were unvested at December 31, 2019 vested and common units were issued in respect thereof. In addition, 420 common units were granted and issued to non-employee directors of the General Partner as compensation for services performed on the General Partner’s board of directors during the year ended December 31, 2018 and no units were granted during the year ended December 31, 2019. For the years ended December 31, 2019, 2018 and 2017 we recorded $0.4 million, $0.4 million and $0.5 million, respectively, of unit-based compensation expense with respect to the Director Grants. The unrecognized estimated unit-based compensation cost relating to outstanding Director Grants at December 31, 2019 is insignificant and will be recognized over the remaining vesting period.
Distribution Equivalent Rights
DERs associated with the Affiliate Grants and the Director Grants subject to time-based vesting entitle the recipients to receive payments in respect thereof in a per-unit amount that is equal to any distributions made by us to the holders of common units within 60 days following the record date for such distributions. The DERs associated with the Affiliate Grants subject to performance-based vesting will remain outstanding and unpaid from the grant date until the earlier of the settlement or forfeiture of the related performance-based phantom units.
DER distributions paid related to time-based Affiliate Grants were $2.7 million, $1.8 million and $1.0 million, respectively, for the years ended December 31, 2019, 2018 and 2017. At December 31, 2019 and 2018, $0.6 million and $0.9 million, respectively, of DER distributions unpaid related to time-based Affiliate Grants are included in related-party payables.
DER distributions unpaid related to the performance-based Affiliate Grants were as follows as of December 31:
2019 | 2018 | |||||||
Accrued liabilities | $ | 397 | $ | 419 | ||||
Other long-term liabilities | 1,193 | 312 | ||||||
Total unpaid DERs | $ | 1,590 | $ | 731 | ||||
(19) Net Income (Loss) per Limited Partner Unit
Net income (loss) per unit applicable to limited partners is computed by dividing limited partners’ interest in net income (loss), after deducting any incentive distributions, by the weighted-average number of outstanding units. Our net income (loss) is allocated to the limited partners in accordance with their respective ownership percentages, after giving effect to priority income allocations for incentive distributions, if any, to the holder of the IDRs, which are declared and paid following the close
108
ENVIVA PARTNERS, LP AND SUBSIDIARIES
Notes to Consolidated Financial Statements (Continued)
(In thousands, except number of units, per unit amounts and unless otherwise noted)
of each quarter. Earnings in excess of distributions are allocated to the limited partners based on their respective ownership interests. Payments made to our unitholders are determined in relation to actual distributions declared and are not based on the net income (loss) allocations used in the calculation of earnings per unit.
On May 30, 2018, the requirements under our partnership agreement for the conversion of all of our subordinated units into common units were satisfied and the subordination period for such subordinated units ended. As a result, all of our 11,905,138 outstanding subordinated units converted into common units on a one-for-one basis. The conversion did not impact the amount of the cash distribution paid or the total number of our outstanding units representing limited partner interests. Our net income (loss) was allocated to the General Partner and the limited partners, including the holders of the subordinated units and IDR holders, in accordance with our partnership agreement.
In addition to the common units, we have identified the IDRs and phantom units as participating securities and apply the two-class method when calculating the net income (loss) per unit applicable to limited partners, which is based on the weighted-average number of common units and subordinated units outstanding during the period. Diluted net income per unit includes the effects of potentially dilutive time-based and performance-based phantom units on our common units. Basic and diluted earnings per unit that previously was applicable to subordinated limited partners was the same because there were no potentially dilutive subordinated units outstanding.
The computation of net (loss) income available per limited partner unit is as follows for the years ended December 31:
2019 | 2018 | 2017 | |||||||||
Net (loss) income available to partners | $ | (5,822 | ) | $ | 6,952 | $ | 14,373 | ||||
Less net loss attributable to noncontrolling partners’ interests | — | — | 3,140 | ||||||||
Net (loss) income available to Enviva Partners, LP | $ | (5,822 | ) | $ | 6,952 | $ | 17,513 | ||||
Less: Pre-acquisition income from inception to October 1, 2017 from operations of Enviva Port of Wilmington, LLC Drop-Down allocated to General Partner | — | — | (3,049 | ) | |||||||
Enviva Partners, LP limited partners’ interest in net (loss) income | $ | (5,822 | ) | $ | 6,952 | $ | 20,562 | ||||
Less: Distributions declared on: | |||||||||||
Common units | $ | 88,761 | $ | 54,604 | $ | 34,033 | |||||
Subordinated units through end of subordination period | — | 12,407 | 28,096 | ||||||||
IDRs | 11,439 | 5,867 | 3,398 | ||||||||
Total distributions declared | 100,200 | 72,878 | 65,527 | ||||||||
Earnings less than distributions | $ | (106,022 | ) | $ | (65,926 | ) | $ | (44,965 | ) | ||
Basic and diluted net (loss) income per limited partner unit is as follows:
Year Ended December 31, 2019 | Common Units | General Partner | ||||
Weighted-average common units outstanding—basic | 31,791 | — | ||||
Effect of nonvested phantom units | — | — | ||||
Weighted-average common units outstanding—diluted | 31,791 | — | ||||
Year Ended December 31, 2019 | Common Units | General Partner | Total | |||||||||
Distributions declared | $ | 88,761 | $ | 11,439 | $ | 100,200 | ||||||
Earnings less than distributions | (106,022 | ) | — | (106,022 | ) | |||||||
Net (loss) income available to partners | $ | (17,261 | ) | $ | 11,439 | $ | (5,822 | ) | ||||
Weighted-average units outstanding—basic and diluted | 31,791 | |||||||||||
Net loss per limited partner unit—basic and diluted | $ | (0.54 | ) | |||||||||
109
ENVIVA PARTNERS, LP AND SUBSIDIARIES
Notes to Consolidated Financial Statements (Continued)
(In thousands, except number of units, per unit amounts and unless otherwise noted)
Year Ended December 31, 2018 | Common Units | Subordinated Units | General Partner | ||||||
Weighted-average common units outstanding—basic | 21,533 | 4,893 | — | ||||||
Effect of nonvested phantom units | 1,020 | — | — | ||||||
Weighted-average common units outstanding—diluted | 22,553 | 4,893 | — | ||||||
Year Ended December 31, 2018 | Common Units | Subordinated Units | General Partner | Total | ||||||||||||
Distributions declared | $ | 54,604 | $ | 12,407 | $ | 5,867 | $ | 72,878 | ||||||||
Earnings less than distributions | (53,720 | ) | (12,206 | ) | — | (65,926 | ) | |||||||||
Net income available to partners | $ | 884 | $ | 201 | $ | 5,867 | $ | 6,952 | ||||||||
Weighted-average units outstanding—basic and diluted | 21,533 | 4,893 | ||||||||||||||
Net income per limited partner unit—basic and diluted | $ | 0.04 | $ | 0.04 | ||||||||||||
Year Ended December 31, 2017 | Common Units | Subordinated Units | General Partner | ||||||
Weighted-average common units outstanding—basic | 14,403 | 11,905 | — | ||||||
Effect of nonvested phantom units | 948 | — | — | ||||||
Weighted-average common units outstanding—diluted | 15,351 | 11,905 | — | ||||||
Year Ended December 31, 2017 | Common Units | Subordinated Units | General Partner | Total | ||||||||||||
Distributions declared | $ | 34,033 | $ | 28,096 | $ | 3,398 | $ | 65,527 | ||||||||
Earnings less than distributions | (24,631 | ) | (20,334 | ) | — | (44,965 | ) | |||||||||
Net income available to partners | $ | 9,402 | $ | 7,762 | $ | 3,398 | $ | 20,562 | ||||||||
Weighted-average units outstanding—basic | 14,403 | 11,905 | ||||||||||||||
Weighted-average units outstanding—diluted | 15,351 | 11,905 | ||||||||||||||
Net income per limited partner unit—basic | $ | 0.65 | $ | 0.65 | ||||||||||||
Net income per limited partner unit—diluted | $ | 0.61 | $ | 0.65 | ||||||||||||
(20) Commitments and Contingencies
Commitments
We have entered into throughput agreements expiring in 2023 to receive terminal and stevedoring services at certain of our terminals. The agreements specify a minimum cargo throughput requirement at a fixed price per ton or a fixed fee, subject to an adjustment based on the consumer price index or the producer prices index, for a defined period of time, ranging from monthly to annually. At December 31, 2019, we had approximately $12.2 million related to firm commitments under such terminal and stevedoring services agreements. For the years ended December 31, 2019, 2018 and 2017, terminal and stevedoring services expenses were $11.3 million, $9.8 million and $10.6 million, respectively.
We have entered into long-term arrangements to secure transportation from our plants to our export terminals. Under certain of these agreements, which expire between 2021 through 2023, we committed to various annual minimum volumes under multi-year fixed-cost contracts with third-party logistics providers for trucking and rail transportation, subject to increases in the consumer price index and certain fuel price adjustments. For the years ended December 31, 2019, 2018 and 2017, transportation expenses were $25.5 million, $29.8 million and $23.8 million, respectively.
We have entered into long-term supply arrangements, expiring between 2020 through 2024, to secure the supply of wood pellets from third-party vendors and related parties. The minimum annual purchase volumes are at a fixed price per MT adjusted for volume, pellet quality and certain shipping-related charges. The supply agreements for the purchase of 1,620,000 MT of wood pellets from British Columbia are fully offset by an agreement to sell 1,620,000 MT of wood pellets to the same
110
ENVIVA PARTNERS, LP AND SUBSIDIARIES
Notes to Consolidated Financial Statements (Continued)
(In thousands, except number of units, per unit amounts and unless otherwise noted)
counterparty from our terminal locations. Under long-term supply arrangements, we purchased approximately $51.6 million, $29.5 million and $3.5 million of wood pellets for the years ended December 31, 2019, 2018 and 2017, respectively.
Fixed and determinable portions of the minimum aggregate future payments under these firm terminal and stevedoring services, transportation and supply agreements for the next five years are as follows:
2020 | $ | 220,632 | |
2021 | 211,073 | ||
2022 | 75,350 | ||
2023 | 55,265 | ||
2024 | 50,644 | ||
Total | $ | 612,964 | |
In order to mitigate volatility in our shipping costs, we have entered into fixed-price shipping contracts with reputable shippers matching the terms and volumes of certain of our off-take contracts for which we are responsible for arranging shipping. Contracts with shippers, expiring between 2021 through 2039, include provisions as to the minimum amount of MTPY to be shipped and may also stipulate the number of shipments. Pursuant to these contracts, the terms of which extend up to fifteen years, charges are based on a fixed-price per MT and, in some cases, there are adjustment provisions for increases in the price of fuel or for other distribution-related costs. The charge per MT varies depending on the loading and discharge port. Shipping expenses included in cost of sales were $64.1 million for each of the years ended December 31, 2019 and 2018 and $52.2 million for the year ended December 31, 2017.
(21) Quarterly Financial Data (Unaudited)
The following tables presents our unaudited quarterly financial data. The quarterly results of operations for these periods are not necessarily indicative of future results of operations. Certain amounts related to the change in the fair value of derivatives have been reclassified to product sales from other income for the first and second quarters of 2018 to conform to current period presentation. Basic and diluted earnings per unit are computed independently for each of the quarters presented. Therefore, the sum of quarterly basic and diluted per unit information may not equal annual basic and diluted earnings per unit.
For the Year Ended December 31, 2019 | First Quarter | Second Quarter | Third Quarter | Fourth Quarter | Total | |||||||||||||||
Net revenue | $ | 158,369 | $ | 168,079 | $ | 157,405 | $ | 200,540 | $ | 684,393 | ||||||||||
Gross margin | 9,907 | 16,507 | 26,466 | 28,188 | 81,068 | |||||||||||||||
Net (loss) income | (8,923 | ) | (3,801 | ) | 8,852 | 929 | (2,943 | ) | ||||||||||||
Enviva Partners, LP limited partners’ interest in net (loss) income | (8,923 | ) | (3,801 | ) | 8,852 | 929 | (2,943 | ) | ||||||||||||
Basic (loss) income per limited partner common unit | $ | (0.42 | ) | $ | (0.20 | ) | $ | 0.15 | $ | (0.10 | ) | $ | (0.54 | ) | ||||||
Diluted (loss) income per limited partner common unit | $ | (0.42 | ) | $ | (0.20 | ) | $ | 0.15 | $ | (0.10 | ) | $ | (0.54 | ) | ||||||
For the Year Ended December 31, 2018 | First Quarter | Second Quarter | Third Quarter | Fourth Quarter | Total | |||||||||||||||
Net revenue | $ | 125,324 | $ | 135,596 | $ | 144,148 | $ | 168,673 | $ | 573,741 | ||||||||||
Gross margin | (5,018 | ) | 19,811 | 30,119 | 24,529 | 69,441 | ||||||||||||||
Net (loss) income | (19,335 | ) | 3,544 | 13,356 | 9,387 | 6,952 | ||||||||||||||
Enviva Partners, LP limited partners’ interest in net (loss) income | (19,335 | ) | 3,544 | 13,356 | 9,387 | 6,952 | ||||||||||||||
Basic (loss) income per limited partner common unit | $ | (0.78 | ) | $ | 0.08 | $ | 0.45 | $ | 0.29 | $ | 0.04 | |||||||||
Diluted (loss) income per limited partner common unit | $ | (0.78 | ) | $ | 0.08 | $ | 0.43 | $ | 0.28 | $ | 0.04 | |||||||||
Basic (loss) income per limited partner subordinated unit | $ | (0.78 | ) | $ | 0.08 | $ | — | $ | — | $ | 0.04 | |||||||||
Diluted (loss) income per limited partner subordinated unit | $ | (0.78 | ) | $ | 0.08 | $ | — | $ | — | $ | 0.04 | |||||||||
111
ITEM 9. | CHANGES IN AND DISAGREEMENTS WITH ACCOUNTANTS ON ACCOUNTING AND FINANCIAL DISCLOSURE |
None.
112
ITEM 9A. | CONTROLS AND PROCEDURES |
Disclosure Controls and Procedures
An evaluation of the effectiveness of the design and operation of our disclosure controls and procedures (as defined in Rules 13(a)-15(e) and 15(d)-15(e) under the Exchange Act) was carried out under the supervision and with the participation of management, including the Chief Executive Officer and Chief Financial Officer of our General Partner. Our disclosure controls and procedures are designed to provide reasonable assurance that the information required to be disclosed by us in reports that we file or submit under the Exchange Act is accumulated and communicated to our management, including our Chief Executive Officer and Chief Financial Officer, as appropriate, to allow timely decisions regarding required disclosure and is recorded, processed, summarized and reported within the time periods specified in the rules and forms of the SEC. Based upon their evaluation, the Chief Executive Officer and Chief Financial Officer of our General Partner concluded that the design and operation of our disclosure controls and procedures were effective as of December 31, 2019, the end of the period covered by this Annual Report.
Internal Control over Financial Reporting
Management’s Annual Report on Internal Control over Financial Reporting
The management of our General Partner is responsible for establishing and maintaining adequate internal control over financial reporting for us as defined in Rules 13a‑15(f) and 15d‑15(f) of the Exchange Act. Under the supervision of, and with the participation of our management, including the Chief Executive Officer and Chief Financial Officer, we conducted an evaluation of the effectiveness of our internal control over financial reporting based on the framework and criteria established in Internal Control—Integrated Framework in 2013, issued by the Committee of Sponsoring Organizations of the Treadway Commission. Based on this evaluation, management of our General Partner concluded that our internal control over financial reporting was effective as of December 31, 2019. This Annual Report on Form 10‑K does not include an attestation report of our independent registered public accounting firm due to a transition period established by rules of the SEC for emerging growth companies.
Inherent Limitations on Effectiveness of Controls
Control systems, no matter how well conceived and operated, are designed to provide a reasonable, but not an absolute, level of assurance that the objectives of the control system are met. Further, the design of a control system must reflect the fact that there are resource constraints and the benefits of controls must be considered relative to their costs. Because of the inherent limitations in all control systems, no evaluation of controls can provide absolute assurance that all control issues and instances of fraud, if any, have been detected. Because of the inherent limitations in any control system, misstatements due to error or fraud may occur and not be detected.
Changes in Internal Control over Financial Reporting
There were no changes in our internal control over financial reporting (as defined in Rules 13a‑15(e) and 15d‑15(e) under the Exchange Act) that occurred during the three months ended December 31, 2019 that have materially affected, or are reasonably likely to materially affect, our internal control over financial reporting.
Indemnification for Consent from Predecessor Independent Registered Public Accounting Firm
We have agreed to indemnify and hold KPMG LLP (KPMG) harmless against and from any and all legal costs and expenses incurred by KPMG in successful defense of any legal action or proceeding that arises as a result of KPMG’s consent to the incorporation by reference of KPMG’s audit reports on the Partnership’s and Enviva Wilmington Holdings, LLC’s financial statements incorporated by reference into the Partnership’s registration statements on Form S-8 (File No. 333-236150 and 333-203756) and Form S-3 (333-232247).
113
ITEM 9B. | OTHER INFORMATION |
Amendment to Partnership Agreement
Our General Partner adopted Amendment No. 2 to the First Amended and Restated Limited Partnership Agreement (the “LPA Amendment”) to amend our partnership agreement, effective January 1, 2019, to provide that if a partner (or its affiliate) provides services to us or pays expenses on our behalf, and does not seek payment or reimbursement, then the amount of such foregone payment for services or reimbursable expense shall be treated as a deemed contribution of cash to us by such partner, followed by a deemed payment of the expense by the Partnership. The LPA Amendment also provides that any tax items of deduction or loss resulting from the deemed payment of the expense by the Partnership shall be allocated back to the partner that is deemed to have contributed such amount to the Partnership.
Amended and Restated Purchase Rights Agreement
In connection with our initial public offering, the Partnership entered into a purchase rights agreement with our sponsor, pursuant to which our sponsor granted the Partnership the right of first offer to acquire any wood pellet production plants and associated deep-water marine terminals that it or its development joint ventures may develop or acquire and elect to sell for a five-year period. Effective as of February 24, 2020, the Partnership, the General Partner and our sponsor amended and restated the purchase rights agreement to extend the initial term to May 2021 with automatic renewals on an annual basis unless the Partnership or our sponsor provide notice of termination within 60 days prior to the end of the then-current term.
114
PART III
ITEM 10. | DIRECTORS, EXECUTIVE OFFICERS AND CORPORATE GOVERNANCE |
We are managed and operated by the board of directors and executive officers of our General Partner. Our unitholders are not entitled to elect our General Partner’s directors or otherwise directly participate in our management or operations. Our General Partner owes certain contractual duties to our unitholders as well as a fiduciary duty to its owners.
As a result of owning our General Partner, our sponsor has the right to appoint all members of the board of directors of our General Partner. In evaluating director candidates, our sponsor will assess whether a candidate possesses the integrity, judgment, knowledge, experience, skill and expertise that are likely to enhance the board’s ability to manage and direct our affairs and business, including, when applicable, to enhance the ability of committees of the board to fulfill their duties.
The board of directors of our General Partner has ten directors, including four directors meeting the independence standards established by the New York Stock Exchange (the “NYSE”) and the Securities Exchange Act of 1934, as amended (the “Exchange Act”). The board of directors met ten times during 2019.
All of the executive officers of our General Partner listed below allocate their time between managing the business and affairs of us and our sponsor. The amount of time that our executive officers devote to our business and the business of our sponsor varies in any given year based on a variety of factors. Our executive officers devote as much time to the management of our business as is necessary for the proper conduct of our business and affairs.
We incur general and administrative costs related to our management services agreements with Enviva Management Company, LLC (the “MSAs”) that cover the corporate salary and overhead expenses associated with our business. If the MSAs were terminated without replacement, or our General Partner or its affiliates provided services outside of the scope of the MSAs, our partnership agreement would require us to reimburse our General Partner and its affiliates, including our sponsor, for all expenses incurred and payments made on our behalf.
Executive Officers and Directors of Our General Partner
The following table shows information for the executive officers and directors of our General Partner. As the owner of our General Partner, our sponsor appoints all members of the board of directors of our General Partner. Directors hold office until their successors have been appointed or qualified or until the earlier of their death, resignation, removal or disqualification. Executive officers are appointed by and serve at the discretion of the board. In 2019, we amended our corporate governance guidelines to provide that, unless the board determines otherwise, a non-employee director shall retire from service on the Board effective as of the last day of the fiscal year in which the director has turned 80, provided that the Chairman of the Board may, in his or her sole discretion, waive this requirement for an individual director for up to two years.
There are no family relationships among any of our directors or executive officers. One of our directors and all of our executive officers also serve as executive officers of our sponsor.
115
Name of Beneficial Owner | Age | Position With Our General Partner | ||
John K. Keppler | 49 | Chairman, President and Chief Executive Officer | ||
Shai S. Even | 51 | Executive Vice President and Chief Financial Officer | ||
Thomas Meth | 47 | Executive Vice President, Sales and Marketing | ||
William H. Schmidt, Jr. | 47 | Executive Vice President, Corporate Development and General Counsel | ||
E. Royal Smith | 47 | Executive Vice President, Operations | ||
Joseph N. Lane | 39 | Executive Vice President, Human Capital | ||
Yanina A. Kravtsova | 43 | Executive Vice President, Communications, Public and Environmental Affairs | ||
Raymond J. Kaszuba, III | 41 | Senior Vice President, Finance and Treasurer | ||
Ralph Alexander | 64 | Director | ||
John C. Bumgarner, Jr. | 77 | Director | ||
Jim H. Derryberry | 75 | Director | ||
Robin J. A. Duggan | 53 | Director | ||
Christopher B. Hunt | 56 | Director | ||
William K. Reilly | 80 | Director | ||
Gary L. Whitlock | 70 | Director | ||
Carl L. Williams | 43 | Director | ||
Janet S. Wong | 61 | Director | ||
John K. Keppler. Mr. Keppler has served as Chairman of the board of directors and President and Chief Executive Officer of our General Partner since our inception in November 2013. Mr. Keppler co-founded Intrinergy, the predecessor to our sponsor, in 2004. From 2002 to 2004, Mr. Keppler was the Director of Corporate Strategy in the Office of the Vice Chairman with America Online and, prior to that, he was Senior Manager, Business Affairs and Development with America Online from 2001 to 2002. Mr. Keppler holds a B.A. in political economy from the University of California, Berkeley, as well as an MBA from The Darden Graduate School of Business Administration at The University of Virginia. Over the course of Mr. Keppler’s career, he has gained extensive experience growing innovative ideas into successful businesses across a broad range of industries and has developed a wealth of experience in business strategy and operations and a keen knowledge of the renewable energy sector. For the past fifteen years, Mr. Keppler has been responsible for setting our strategic direction and leading our growth from a start-up company to the world’s leading producer of wood biomass fuels. In light of this experience, we believe that he has the requisite set of skills to serve as a director, as well as Chairman, President and Chief Executive Officer.
Shai S. Even. Mr. Even has served as Executive Vice President and Chief Financial Officer of our General Partner since June 2018. In this role, Mr. Even leads Enviva’s finance, accounting and information technology organizations and provides strategic leadership on finance matters. He has over 25 years of experience with operational and strategic finance, including in senior financial and management roles at master limited partnerships. Most recently, Mr. Even served as Senior Vice President and Chief Financial Officer of Alon USA Energy, Inc. and served as President and Chief Financial Officer of Alon USA Partners, LP. While at Alon, Mr. Even led Alon’s parent company’s successful IPO on the NYSE in 2005 and the successful IPO of Alon’s master limited partnership in 2012. During his tenure at Alon, he led the company’s two major acquisitions and scaled its finance organization to complement the growth of the company. Prior to joining Alon, Mr. Even served as the Chief Financial Officer of DCL Group in Tel Aviv, Israel, and as an auditor with KPMG. Mr. Even holds a bachelor’s degree in Economics and Accounting from Bar-Ilan University and is a certified public accountant.
Thomas Meth. Mr. Meth has served as Executive Vice President, Sales and Marketing of our General Partner since our inception in November 2013. He was also a co-founder of Intrinergy. Mr. Meth is responsible for our commercial customer relations as well as our market development, customer fulfillment and shipping initiatives. Prior to Intrinergy, Mr. Meth was Head of Sales and Marketing in Europe, the Middle East and Africa for the Colfax Corporation from 2002 to 2004. From 1993 to 2000, Mr. Meth was Director of Sales for Europay Austria, a consumer financial services company that offered MasterCard, Maestro and Electronic Purse services. Mr. Meth holds a bachelor of commerce from Vienna University of Economics and Business Administration in Austria as well as an MBA from The Darden Graduate School of Business Administration at The University of Virginia. Mr. Meth was an executive officer of Intrinergy Deutschland Management GmbH (“IDM”) and Enviva Pellets GmbH and Co. KG (“EPD”), which were engaged in pellet manufacturing in Germany unrelated to our core business. Both entities filed for insolvency in Amtsgerichts Straubing, a district court located in Germany, in November 2010. Our predecessor distributed its indirect interests in IDM and EPD to our sponsor as part of the reorganization in connection with our IPO.
116
William H. Schmidt, Jr. Mr. Schmidt has served as Executive Vice President, Corporate Development and General Counsel of our General Partner since February 2018 and, prior to that, as Executive Vice President, General Counsel and Secretary since our inception in November 2013. He also has served as Executive Vice President, Corporate Development and General Counsel of our sponsor’s general partner since February 2018 and, prior to that, as Executive Vice President, General Counsel and Secretary since March 2013. Mr. Schmidt also serves as President and General Counsel of Enviva Development Holdings, LLC, our sponsor’s development company. In these capacities, Mr. Schmidt is responsible for our and our sponsor’s corporate development activities and legal affairs. Prior to joining Enviva, Mr. Schmidt was Senior Vice President and General Counsel of Buckeye GP LLC, the general partner of Buckeye Partners, L.P., a diversified master limited partnership. Mr. Schmidt also was President of Lodi Gas Storage, L.L.C., a subsidiary of Buckeye Partners, L.P., from August 2009 to January 2012. Prior to joining Buckeye in September 2004, Mr. Schmidt practiced law at Chadbourne & Parke LLP, an international law firm.
E. Royal Smith. Mr. Smith has served as Executive Vice President, Operations of our General Partner and our sponsor since August 2016 and prior to that as Vice President, Operations since April 2014. Previously, he served as Director of Operations, NAA Division of Guilford Performance Textiles, a global textile manufacturing company, from March 2012 to July 2014. From August 2010 to March 2012, Mr. Smith also served as Director of Quality, NAA Division. Prior to joining Guilford, Mr. Smith worked as a Plant Manager at Pactiv, a food packaging manufacturer, from May 2009 to August 2010. Mr. Smith served as General Manager of a facility operated by United Plastics Group International from December 2005 to May 2009, after serving in other roles at the company from April 2002. From January 1999 to September 1999, he served as Production Supervisor of The General Motors Corporation, before serving as Mechanical Device/Tool and Die Supervisor from September 1999 to August 2000. Mr. Smith holds a B.S. in Mechanical Engineering from GMI Engineering and Management Institute.
Joseph N. Lane. Mr. Lane has served as Executive Vice President of Human Capital of our General Partner and our sponsor since March 2018. Previously, Mr. Lane was Vice President, Human Resources of Asia Pacific of Milliken & Company since 2015, after holding roles with progressively more responsibility since joining the company in 2001. Over the course of Mr. Lane’s career, he has gained a wealth of valuable experience dealing with talent-related matters associated with scaling organizations, mergers and acquisitions activity, industrial manufacturing and international operations. Mr. Lane received a Bachelor of Science in Business Administration with an emphasis in Human Resources Management from Clemson University in 2003 as well as an MBA from the Babcock Graduate School of Business Administration at Wake Forest University in 2009. He holds the SHRM certification for Senior HR Professionals (SPHR-CP).
Yanina A. Kravtsova. Ms. Kravtsova has served as Executive Vice President, Communications, Public & Environmental Affairs of our General Partner since December 2019 and, prior to that, as Vice President, Environmental Affairs and Chief Compliance Officer from October 2018. In her current role, Ms. Kravtsova leads the teams responsible for media, governmental and community relations, as well as environmental permitting of our facilities. Ms. Kravtsova brings to Enviva over 19 years of leadership and senior management experience in the renewable energy and power sector. Prior to joining Enviva, Ms. Kravtsova served as Senior Vice President, General Counsel and Secretary of Terraform Global, Inc. from February 2015. Ms. Kravtsova was also Legal Head of Renewable Energy Investments at Google Inc. from August 2011 to January 2015. Ms. Kravtsova practiced law at Clifford Chance U.S. LLP, Latham & Watkins LLP and The World Bank Group, handling international project finance, regulatory and corporate matters for energy projects.
Raymond J. Kaszuba, III. Mr. Kaszuba has served as Senior Vice President, Finance and Treasurer of our General Partner and our sponsor since June 2018 and prior to that as Vice President and Treasurer since July 2015. Previously, he worked in several treasury and finance-related positions at Exxon Mobil Corporation, a leading oil and natural gas company, for eight years. Mr. Kaszuba holds a B.S. in Finance and Economics from the University of Dayton and an MBA from the Tepper School of Business at Carnegie Mellon University.
Ralph Alexander. Mr. Alexander has served as director on the board of directors of our General Partner since our inception in November 2013. Mr. Alexander has served as the President and CEO of Talen Energy since December 2016. He became affiliated with Riverstone Holdings LLC in September 2007. For nearly 25 years, Mr. Alexander served in various positions with subsidiaries and affiliates of BP plc, one of the world’s largest oil and gas companies. From June 2004 until December 2006, he served as Chief Executive Officer of Innovene, BP’s $20 billion olefins and derivatives subsidiary. From 2001 until June 2004, he served as Chief Executive Officer of BP’s Gas, Power and Renewables and Solar segment and was a member of the BP group executive committee. Prior to that, Mr. Alexander served as a Group Vice President in BP’s Exploration and Production segment and BP’s Refinery and Marketing segment. He held responsibilities for various regions of the world, including North America, Russia, the Caspian, Africa, and Latin America. Prior to these positions, Mr. Alexander held various positions in the upstream, downstream and finance groups of BP. Mr. Alexander has served on the board of Talen Energy Corporation since June 2015. From December 2014 through December 2016, Mr. Alexander served on the board of EP Energy Corporation. He has previously served on the boards of Foster Wheeler, Stein Mart, Inc., Amyris and Anglo‑American plc. Mr.
117
Alexander holds an M.S. in Nuclear Engineering from Brooklyn Polytech (now NYU School of Engineering—Polytechnic) and an M.S. in Management Science from Stanford University.
John C. Bumgarner, Jr. Mr. Bumgarner has served as a director on the board of directors of our General Partner since April 2015. Mr. Bumgarner has been engaged in private investment since November 2002, and currently assists in operating a family-owned, multi-faceted real estate company. Mr. Bumgarner previously served as Co-Chief Operating Officer and President of Strategic Investments for Williams Communications Group, Inc., a high technology company, from May 2001 to November 2002. Mr. Bumgarner joined The Williams Companies, Inc., in 1977 and, prior to working at Williams Communications Group, Inc., served as Senior Vice President of Williams Companies Corporate Development and Planning, President of Williams International Company and President of Williams Real Estate Company. He most recently served as a director of Energy Partners, Ltd., an oil and natural gas exploration and production company, from January 2000 to February 2009, and at Market Planning Solutions Inc. from February 1982 until April 2011. Mr. Bumgarner holds a B.S. from the University of Kansas and an M.B.A. from Stanford University. Mr. Bumgarner’s substantial experience as an executive at a conglomerate and as a director on boards of public and private companies engaged in a variety of industries provide him with unique insight that is particularly helpful and valuable to the board of directors of our General Partner.
Jim H. Derryberry. Mr. Derryberry has served as a director on the board of directors of our General Partner since July 2018. Mr. Derryberry served as a director of USA Compression GP, LLC from January 2013 to April 2018. He is currently a special advisor for Riverstone Holdings LLC where he held the office of Chief Operating Officer and Chief Financial Officer until 2006. Prior to joining Riverstone, Mr. Derryberry was a managing director of J.P. Morgan where he was head of the Natural Resources and Power Group. He had previously served in the Goldman Sachs Global Energy and Power Group where he was responsible for mergers and acquisitions, capital markets financing, and the management of relationships with major energy companies. He also served on the Board of Directors of Magellan GP, LLC, the general partner of Magellan Midstream Partners, L.P, from 2005-2006. Mr. Derryberry has been a member of the Board of Overseers for the Hoover Institution at Stanford University and is a member of the Engineering Advisory Board at the University of Texas at Austin. He received his B.S. and M.S. degrees in engineering from the University of Texas at Austin and earned an M.B.A. from Stanford University.
Robin J. A. Duggan. Mr. Duggan has served as a director on the board of directors of our General Partner since our inception in November 2013. Mr. Duggan was a Managing Director of Riverstone from 2014 to June 2019, when he became a Senior Advisor to Riverstone, and previously served as a Principal of Riverstone for seven years. Prior to joining Riverstone, Mr. Duggan was the founder of Commodity Optimization Ventures Ltd., a business that provided advice to clients in the private equity industry, including Texas Pacific Group. Before founding his business, he served for over 17 years in various positions with subsidiaries and affiliates of BP plc. From 2004 to 2005, Mr. Duggan was the Vice President of European Business Optimization at Innovene, BP’s olefins and derivatives subsidiary, where he was responsible for commercial activity for olefins and refining in Europe and also oversaw Innovene’s successful separation from BP in Europe. From 1999 to 2003, Mr. Duggan held a number of senior level positions in BP’s Petrochemicals segment, including serving as the Performance Unit Leader of the Aromatics and Olefins division, Global Business Manager of the Styrene business unit, and the Planning, Performance and Strategy Manager of the Acetyls business unit. Prior to that time, Mr. Duggan held various positions in BP’s Upstream segment in the United Kingdom, Australia and Venezuela over a period of ten years. Mr. Duggan serves on the boards of a number of Riverstone portfolio companies and their affiliates. He holds a B.A. in biochemistry from Oxford University and an M.S. in management science from Stanford University. Based on his strong background in various aspects of the energy industry, we believe Mr. Duggan has the requisite set of skills to serve as a director.
Christopher B. Hunt. Mr. Hunt has served as a director on the board of directors of our General Partner since April 2016. Mr. Hunt is a partner of Riverstone and joined Riverstone in 2008. In addition to serving on the boards of a number of Riverstone portfolio companies and their affiliates, he also currently serves on the board of directors of NTR Plc. Prior to joining Riverstone, Mr. Hunt ran international power development and generation businesses for BP plc and Enron Corporation. Mr. Hunt received his BA from Wesleyan University and his MBA from Columbia University. He has also completed various post-graduate programs at Harvard University, Stanford University, the Massachusetts Institute of Technology and Oxford University. Mr. Hunt brings extensive experience in the renewable energy, conventional power and natural gas industries to the board of directors of our General Partner.
William K. Reilly. Mr. Reilly has served as a director on the board of directors of our General Partner since April 2015. Mr. Reilly served as Administrator of the U.S. Environmental Protection Agency from 1989 to 1993. From October 1997 to December 2009, Mr. Reilly served as President and Chief Executive Officer of Aqua International Partners, an investment group that finances water improvements in emerging markets. He also served as Senior Advisor to TPG Capital from September 1994 to December 2016. In 2010, Mr. Reilly was appointed by President Obama as co-chair of the National Commission on the BP Deepwater Horizon Oil Spill and Offshore Drilling and in 2012, President Obama named Mr. Reilly to the Council for Global Development. He currently serves as a director and chair of the board committee on environment, safety,
118
security and health of Royal Caribbean Cruises Ltd. Mr. Reilly served as a director of Conoco Inc. from 1998 until its merger with Phillips Petroleum Company in 2002, and thereafter served as a director of ConocoPhillips until May 2013. From 1993 until April 2012, Mr. Reilly also served on the board of directors of E.I. duPont de Nemours and Company and was a director of Energy Future Holdings from 2007 to 2019. He has also previously served as the first Payne Visiting Professor at Stanford University, President of the World Wildlife Fund and President of The Conservation Foundation. He is Chairman Emeritus of the World Wildlife Fund and Chairman of the Nicholas Institute for Environmental Policy Solutions at Duke University. Mr. Reilly’s extensive environmental regulatory experience and his service on various other boards make him well qualified to serve as a member of the board of directors of our General Partner, and allow him to provide unique and valuable perspective on matters critical to our operations.
Gary L. Whitlock. Mr. Whitlock has served as a director on the board of directors of our General Partner since April 2016. Mr. Whitlock served as Executive Vice President and Chief Financial Officer of CenterPoint Energy, Inc. (“CenterPoint”) from September 2002 until April 2015. From April 2015 until his retirement on October 1, 2015, he served as Special Advisor to the Chief Executive Officer of CenterPoint. While at CenterPoint, Mr. Whitlock was responsible for accounting, treasury, risk management, tax, strategic planning, business development, emerging businesses and investor relations. From July 2001 to September 2002, Mr. Whitlock served as Executive Vice President and Chief Financial Officer of the Delivery Group of Reliant Energy, Incorporated (“Reliant”). Prior to joining Reliant, Mr. Whitlock served as Vice President of Finance and Chief Financial Officer of Dow AgroSciences LLC, a subsidiary of The Dow Chemical Company (“Dow”), from 1998 to 2001. He began his career with Dow in 1972, where he held a number of financial leadership positions, both in the United States and globally. While at Dow, Mr. Whitlock served on the boards of directors of various Dow entities. Mr. Whitlock is a Certified Public Accountant and received a BBA in accounting from Sam Houston State University in 1972. He has previously served on the board of directors of Texas Genco Holdings, Inc., the board of directors of the general partner of Enable Midstream Partners, LP from March 2013 to August 2015, the board of directors of KiOR, Inc. from December 2010 to June 2015, the board of directors of CHI St. Luke’s Health System, The Woodlands, and the Leadership Cabinet of Texas Children’s Hospital. Mr. Whitlock brings extensive experience in public company financial management and reporting to the board of directors of our General Partner.
Carl L. Williams. Mr. Williams has served as a director on the board of directors of our General Partner since our inception in November 2013. Mr. Williams is a Partner at Riverstone and Co-Head of Riverstone Power. He also serves on the boards of a number of Riverstone portfolio companies and their affiliates. Prior to joining Riverstone in 2008, Mr. Williams was in the Global Natural Resources investment banking group at Goldman, Sachs & Co. from 2005 to 2008. While at Goldman, he focused on mergers and acquisitions and financing transactions in the power generation, alternative energy, oil and gas and refining industries. Prior to that, he held various positions in engineering and strategic sourcing with Lyondell Chemical Company, a supplier of raw materials and technology to the coatings industry, from 1999 to 2004. He received his MBA from Columbia Business School, and holds a B.S. in chemical engineering and a B.A. in economics and managerial studies from Rice University. We believe that Mr. Williams’ extensive experience in, and knowledge of, each of the finance and energy sectors enable him to provide essential guidance to the board of directors of our General Partner and our management team.
Janet S. Wong. Ms. Wong has served as a director on the board of directors of our General Partner since April 2015. Since January 2013, Ms. Wong has served as a National Executive Advisor for Ascend, a non‑profit professional organization that enables its members, corporate partners and the community to realize the leadership potential of Asians in global corporations. At Ascend, Ms. Wong leads the largest network of Asian corporate board directors and is a lecturer for its Executive Insight programs. In January 2018, she was elected to the Board of Trustees for the Computer History Museum. In addition, she serves on the Louisiana Tech University Foundation Board and the College of Business Advisory Board. Ms. Wong served as a Partner at Grant Thornton LLP from August 2008 through July 2012, where she was the Central Region Corporate and Partnership Services Lead Partner. In 2008, Ms. Wong retired from the partnership of KPMG, culminating a career with the global firm from 1985 through 2008, where she served as a National Industry Practice Lead Partner. Ms. Wong has extensive experience working with clients in the consumer markets, energy, financial services, manufacturing, and technology sectors. She is a Certified Public Accountant. She holds a Master of Professional Accountancy from Louisiana Tech University and a Master of Taxation from Golden Gate University. We believe Ms. Wong’s audit expertise and her professional and leadership experience enable her to provide essential guidance to the board of directors of our General Partner and our management team.
Director Independence
The board of directors of our General Partner has four independent directors: John C. Bumgarner, Jr., William K. Reilly, Gary L. Whitlock and Janet S. Wong. The NYSE does not require a publicly traded partnership such as ours to have a majority of independent directors on the board or to establish a compensation committee or a nominating committee. However, our General Partner is required to have an audit committee of at least three members, and all its members are required to meet the independence and experience standards established by the NYSE and the Exchange Act.
119
Committees of the Board of Directors
The board of directors of our General Partner has three standing committees: an audit committee, a compensation committee and a health, safety, sustainability and environmental committee. The board of directors of our General Partner may also form a conflicts committee from time to time.
Audit Committee
We are required to have an audit committee of at least three members, and all the members of the audit committee are required to meet the independence and experience standards established by the NYSE and the Exchange Act. Mr. Bumgarner, Mr. Whitlock and Ms. Wong currently serve as members of the audit committee. The board determined that all members of the audit committee are financially literate and are “independent” under the standards of the NYSE and SEC regulations currently in effect. SEC rules also require that a public company disclose whether or not its audit committee has an “audit committee financial expert” as a member. An “audit committee financial expert” is defined as a person who, based on his or her experience, possesses the attributes defined by Regulation S-K Item 407(d)(s)(ii). The board of directors of our General Partner believes Ms. Wong satisfies the definition of “audit committee financial expert.”
The audit committee assists the board of directors in its oversight of the integrity of our financial statements and our compliance with legal and regulatory requirements and partnership policies and controls. The audit committee has the sole authority to (1) retain and terminate our independent registered public accounting firm, (2) approve all auditing services and related fees and the terms thereof performed by our independent registered public accounting firm and (3) pre-approve any non‑audit services and tax services to be rendered by our independent registered public accounting firm. The audit committee is also responsible for confirming the independence and objectivity of our independent registered public accounting firm. Our independent registered public accounting firm has been given unrestricted access to the audit committee and our management.
Compensation Committee
As a limited partnership listed on the NYSE, we are not required to have a compensation committee. However, the board of directors of our General Partner has established a compensation committee consisting of Mr. Alexander, Mr. Bumgarner and Mr. Williams to, among other things, administer our long-term incentive plan and establish and review general policies related to, and determine and approve, or make recommendations to the board with respect to, the compensation and benefits of the non‑employee members of the board.
Conflicts Committee
Our General Partner’s board of directors may, from time to time, establish a conflicts committee to which the board will appoint at least one director and which may be asked to review specific matters that the board believes may involve conflicts of interest and determines to submit to the conflicts committee for review. The conflicts committee determines if the resolution of the conflict of interest is adverse to the interest of the partnership. The members of the conflicts committee may not be officers or employees of our General Partner or directors, officers or employees of its affiliates, including our sponsor, and must meet the independence standards established by the NYSE and the Exchange Act to serve on an audit committee of a board of directors, along with other requirements in our partnership agreement.
Any matters approved by the conflicts committee will be conclusively deemed to be approved by us and all of our partners and not a breach by our General Partner of any duties it may owe us or our unitholders.
Health, Safety, Sustainability and Environmental Committee
The board of directors of our General Partner has established a health, safety, sustainability and environmental committee (the “HSSE committee”) consisting of Mr. Duggan and Mr. Reilly. The HSSE committee assists the board of directors of our General Partner in fulfilling its oversight responsibilities with respect to the board’s and our continuing commitment to (1) ensuring the safety of our employees and the public and assuring that our businesses and facilities are operated and maintained in a safe and environmentally sound manner, (2) sustainability, including sustainable forestry practices, (3) delivering environmental benefits to our customers, the forests from which we source our wood fiber and the communities in which we operate and (4) minimizing the impact of our operations on the environment. The HSSE committee reviews and oversees our health, safety, sustainability and environmental policies, programs, issues and initiatives, reviews associated risks that affect or could affect us, our employees and the public and ensures proper management of those risks and reports to the board on health, safety, sustainability and environmental matters affecting us, our employees and the public. The members of the HSSE committee are non‑employee directors of our General Partner.
120
Executive Sessions of Non-Management Directors
The board of directors of our General Partner holds regular executive sessions in which the non-management directors meet without any members of management present. The purpose of these executive sessions is to promote open and candid discussion among the non-management directors. In the event that the non-management directors include directors who are not independent under the listing requirements of the NYSE, then at least once a year, there will be an executive session including only independent directors. The director who presides at these meetings is John C. Bumgarner, Jr. Unitholders and any other interested parties may communicate directly with the presiding director or with the non-management directors as a group, by mail addressed to:
Presiding Director c/o General Counsel
Enviva Partners, LP
7200 Wisconsin Avenue, Suite 1000
Bethesda, Maryland 20814
Communication with the Board of Directors
As set forth in the Communications Policy adopted by the board of directors of our General Partner, a holder of our units or other interested party who wishes to communicate with any director of our General Partner may do so by sending communications to the board, any committee of the board, the Chairman of the board or any other director to:
General Counsel
Enviva Partners, LP
7200 Wisconsin Avenue, Suite 1000
Bethesda, Maryland 20814
and marking the envelope containing each communication as “Unitholder Communication with Directors” and clearly identifying the intended recipient(s) of the communication. Communications will be relayed to the intended recipient of the board of directors of our General Partner pursuant to the Communications Policy, which is available on the “Investor Relations” section of our website at www.envivabiomass.com. Any communications withheld under the Communications Policy will nonetheless be recorded and available for any director who wishes to review them.
Corporate Governance
Our General Partner has adopted a Code of Business Conduct and Ethics that applies to our General Partner’s directors, officers and employees, as well as to employees of our subsidiaries or affiliates that perform work for us. The Code of Business Conduct and Ethics also serves as the financial code of ethics for our Chief Executive Officer, Chief Financial Officer, controller and other senior financial officers. Our General Partner has also adopted Corporate Governance Guidelines that outline the important policies and practices regarding our governance.
We make available free of charge, within the “Investor Relations” section of our website at www.envivabiomass.com and in print to any interested party who so requests, our Code of Business Conduct and Ethics, Corporate Governance Guidelines, Audit Committee Charter, Compensation Committee Charter and HSSE Committee Charter. Requests for print copies may be directed to Investor Relations, Enviva Partners, LP, 7200 Wisconsin Ave., Suite 1000, Bethesda, Maryland 20814, or by telephone at (301) 657‑5560. We will post on our website all waivers to or amendments of the Code of Business Conduct and Ethics, which are required to be disclosed by applicable law and the listing requirements of the NYSE. The information contained on, or connected to, our website is not incorporated by reference into this Annual Report on Form 10-K and should not be considered part of this or any other report we file with or furnish to the SEC.
121
ITEM 11. | EXECUTIVE COMPENSATION |
Neither we nor Enviva Partners GP, LLC (our “General Partner”) have any employees. All of our executive officers are currently employed by Enviva Management Company, LLC (“Enviva Management”).
We are providing compensation disclosure that satisfies the requirements applicable to emerging growth companies. For 2019, we determined our named executive officers (“Named Executive Officers” or “NEOs”) to be:
• | John K. Keppler, Chairman of the Board of Directors, President and Chief Executive Officer; |
• | E. Royal Smith, Executive Vice President, Operations; and |
• | Shai S. Even, Executive Vice President and Chief Financial Officer. |
The executive officers of our General Partner split their time between managing our business and the other businesses of our sponsor that are unrelated to us. Except with respect to awards that may be granted under the Enviva Partners, LP Long-Term Incentive Plan (the “LTIP”), all responsibility and authority for compensation‑related decisions for the NEOs remains with Enviva Management and its affiliates, and such decisions are not subject to any approval by us or our General Partner’s board of directors or any committees thereof. Other than awards that may be granted under the LTIP, Enviva Management and its affiliates have the ultimate decision‑making authority with respect to the total compensation of our executive officers.
The compensation disclosed below with respect to the NEOs reflects only the portion of compensation expense that is allocated to us pursuant to the management services agreement among us, our General Partner and Enviva Management (the “EVA MSA”). For more information about the EVA MSA, please read Part III, Item 13. “Certain Relationships and Related Transactions, and Director Independence—Agreements with Affiliates—Management Services Agreements—EVA MSA.”
The disclosures below relating to cash compensation paid by Enviva Management are based on information provided to us by Enviva Management.
SUMMARY COMPENSATION TABLE
The table below sets forth the annual compensation expensed by us for our Named Executive Officers for the fiscal years ended December 31, 2019 and December 31, 2018. As noted above, the amounts included in the table below reflect only the portion of compensation expense that is allocated to us pursuant to the EVA MSA.
Name and Principal Position | Year | Salary | Bonus (1) | Unit Awards (2) | All Other Compensation (3) | Total | ||||||||||||||||
John K. Keppler | 2019 | $ | 170,885 | $ | 204,300 | $ | 642,712 | $ | 2,100 | $ | 1,019,997 | |||||||||||
(Chairman of the Board of Directors, President and Chief Executive Officer) | 2018 | $ | 190,248 | $ | 269,925 | $ | 784,014 | $ | 2,355 | $ | 1,246,542 | |||||||||||
E. Royal Smith | 2019 | $ | 238,606 | $ | 160,650 | $ | 522,318 | $ | 5,880 | $ | 927,454 | |||||||||||
(Executive Vice President, Operations) | 2018 | $ | 178,480 | $ | 110,149 | $ | 728,566 | $ | 4,496 | $ | 1,021,691 | |||||||||||
Shai S. Even (4) | 2019 | $ | 109,614 | $ | 105,060 | $ | 273,594 | $ | 2,100 | $ | 490,368 | |||||||||||
(Executive Vice President and Chief Financial Officer) | 2018 | $ | 98,780 | $ | 168,096 | $ | 467,487 | $ | 835 | $ | 735,198 | |||||||||||
(1) | Amounts in this column represent the aggregate amount of the annual discretionary cash bonuses for each NEO under the Enviva Management Annual Incentive Compensation Plan (the “AIC Plan”) for fiscal year 2019. |
(2) | The amounts reflected in this column represent the grant date fair value of phantom units (which include tandem distribution equivalent rights (“DERs”)) granted to the NEOs pursuant to the LTIP, computed in accordance with Financial Accounting Standards Board (“FASB”) Accounting Standard Codification Topic 718. The grant date fair value for time-based phantom unit awards issued in 2019 is based on the closing price of our common units on the date of grant, which was $30.16 per unit for awards granted on January 30, 2019. The grant date fair value of performance-based phantom unit awards is reported based on the probable outcome of the performance conditions on the grant date. See Note 18, Equity-Based Awards, to our consolidated financial statements for additional detail regarding assumptions underlying the value of these awards. |
122
(3) | Amounts reported in the “All Other Compensation” column reflect employer contributions to the NEOs’ accounts under the 401(k) plan in which the NEOs participate. |
(4) | Amounts reported for Mr. Even for 2018 reflect compensation received beginning on June 4, 2018, the date Mr. Even assumed employment with Enviva Management. |
NARRATIVE DISCLOSURE TO THE SUMMARY COMPENSATION TABLE
Management Services Agreement
The executive officers of our General Partner are employed by Enviva Management and split their time between managing our business and the other businesses of our sponsor. The amount of time that each executive officer devotes to our business and the other businesses of our sponsor is determined based on a variety of factors, as determined under the EVA MSA. For more information about the EVA MSA, please read Part III, Item 13, “Certain Relationships and Related Transactions, and Director Independence—Agreements with Affiliates—Management Services Agreements—EVA MSA.”
Phantom Unit Awards
The board of directors of our General Partner granted phantom units under the LTIP to our NEOs on January 30, 2019. One-half of these awards are subject to time-based vesting conditions and will become vested on the third anniversary of the grant date so long as the applicable NEO remains continuously employed by Enviva Management or one of our affiliates from the grant date through the applicable vesting date. The other half of these awards vest based on the satisfaction of time-based vesting conditions and the achievement of performance metrics related to gross distributable cash flow over a three-year performance period ending December 31, 2021. Vested phantom units (less any phantom units withheld to satisfy applicable tax withholding obligations) will be settled through the delivery of common units within 60 days following the applicable vesting date.
While a NEO holds an outstanding phantom unit award, such NEO is entitled to accrue DER payments in respect thereof in a per-unit amount that is equal to any distributions made by us to the holders of our common units. The DERs included with performance-based phantom units are paid in cash within 60 days following the vesting of the associated phantom units (and are forfeited at the same time the associated phantom units are forfeited). The DERs included with time-based phantom units are paid in cash within 60 days following a cash distribution with respect to our common units. The potential acceleration and forfeiture events relating to these phantom units are described in greater detail under “—Potential Payments Upon Termination or a Change in Control” below.
Employment Agreements
Each of our NEOs is a party to an employment agreement with Enviva Management. Mr. Even’s employment agreement has a three-year initial term beginning in June 2018 and Messrs. Keppler’s and Smith’s employment agreements have one-year terms. Each employment agreement provides for automatic renewal for successive 12‑month periods following the end of such agreement’s term unless either party provides written notice of non-renewal at least 60 days prior to a renewal date. Under the employment agreements, our NEOs are each entitled to an annualized base salary and are eligible for discretionary annual bonuses pursuant to the AIC Plan based on performance targets established annually by the board of directors of the general partner of our sponsor, or a committee thereof, in its sole discretion. The employment agreements provide that each such annual bonus would have a target value of not less than 150% (in the case of Mr. Keppler), 90% (in the case of Mr. Smith), or 120% (in the case of Mr. Even) of the applicable NEO’s annualized base salary. During 2019, the employment agreements also provided that the NEOs were eligible to receive annual awards based on our common units pursuant to the LTIP and that such annual LTIP awards would have target values equal to 325%, 200% and 200% of the annualized base salary of Messrs. Keppler, Smith, and Even, respectively. In December 2019, effective for LTIP awards beginning in 2020, the employment agreements were amended and restated to increase the target value of the annual LTIP awards to 450% (in the case of Mr. Keppler), 200% (in the case of Mr. Smith), and 250% (in the case of Mr. Even) of the applicable NEO’s annualized base salary.
As discussed below under “—Potential Payments Upon Termination or a Change in Control,” the employment agreements also provide for certain severance payments in the event an NEO’s employment is terminated under certain circumstances.
123
OUTSTANDING EQUITY AWARDS AT 2019 FISCAL YEAR‑END
The following table reflects information regarding outstanding equity‑based awards held by our Named Executive Officers as of December 31, 2019:
Option Awards(1) | Unit Awards | |||||||||||||||||||||||
Name | Number of Securities Underlying Unexercised Options Unexercisable | Number of Securities Underlying Unexercised Options Exercisable (2) | Option Exercise Price (3) | Option Expiration Date (3) | Number of Units That Have Not Vested (4) | Market Value of Units That Have Not Vested (5) | Equity Incentive Plan Awards: Number of Unearned Units That Have Not Vested (6) | Equity Incentive Plan Awards: Market Value of Unearned Units That Have Not Vested (5) | ||||||||||||||||
John K. Keppler | ||||||||||||||||||||||||
Class C-1 Units | — | 232,941 | N/A | N/A | ||||||||||||||||||||
Class C-2 Units | — | 660,000 | N/A | N/A | ||||||||||||||||||||
Class E-1 Units | — | 275,000 | N/A | N/A | ||||||||||||||||||||
Phantom Units | 121,903 | $ | 4,548,201 | 93,544 | $ | 3,490,127 | ||||||||||||||||||
E. Royal Smith | ||||||||||||||||||||||||
Class C-4 Units | — | 175,000 | N/A | N/A | ||||||||||||||||||||
Class E-1 Units | — | 25,000 | N/A | N/A | ||||||||||||||||||||
Phantom Units | 48,319 | $ | 1,802,782 | 29,623 | $ | 1,105,235 | ||||||||||||||||||
Shai S. Even | ||||||||||||||||||||||||
Phantom Units | 32,170 | $ | 1,200,263 | 32,170 | $ | 1,200,263 | ||||||||||||||||||
(1) | The equity awards disclosed in these columns are incentive units in Enviva Holdings, LP that are intended to constitute profits interests for federal tax purposes rather than traditional option awards. |
(2) | Awards reflected as “Exercisable” are incentive units in Enviva Holdings, LP that have vested. |
(3) | These equity awards are not traditional options; therefore, there is no exercise price or expiration date associated with them. |
(4) | The amounts in this column reflect outstanding time-based phantom unit awards, which vest as follows, so long as the applicable Named Executive Officer remains continuously employed by Enviva Management or one of our affiliates from the grant date through each vesting date: |
Name | Vesting Date | Number of Time-Based Phantom Units to Vest |
John K. Keppler | ||
February 1, 2020 | 26,485 | |
January 31, 2021 | 30,367 | |
June 4, 2021 | 16,502 | |
January 30, 2022 | 48,549 | |
E. Royal Smith | ||
February 1, 2020 | 8,911 | |
January 31, 2021 | 9,438 | |
June 4, 2021 | 16,502 | |
January 30, 2022 | 13,468 | |
Shai S. Even | ||
June 4, 2021 | 14,027 | |
January 30, 2022 | 18,143 | |
124
(5) | The amounts reflected in this column represent the market value of the common units underlying the phantom unit awards granted to the Named Executive Officers and set forth in the preceding column, computed based on the closing price of our common units on December 31, 2019, which was $37.31 per unit. |
(6) | The amounts in this column reflect the target number of common units issuable upon settlement of outstanding performance-based phantom unit awards granted in 2017, 2018 and 2019, which vest on the dates set forth above based on achievement of performance metrics with respect to the three-year period ending on December 31, 2019, December 31, 2020 and December 31, 2021, respectively, so long as the applicable Named Executive Officer remains continuously employed by Enviva Management or one of our affiliates from the grant date through the end of each performance period. |
ADDITIONAL NARRATIVE DISCLOSURE
Retirement Benefits
We have not maintained, and do not currently maintain, a defined benefit pension plan or a nonqualified deferred compensation plan providing for retirement benefits. Our Named Executive Officers currently participate in a 401(k) plan maintained by Enviva Management. The 401(k) plan permits all eligible employees, including the Named Executive Officers, to make voluntary pre‑tax contributions and/or Roth after‑tax contributions to the plan. In addition, Enviva Management is permitted to make discretionary matching contributions under the plan. All matching contributions made during the first three years of an individual’s employment vest under the plan following the satisfaction of an initial three‑year cliff vesting schedule; thereafter, all matching contributions vest immediately. All contributions under the plan are subject to certain annual dollar limitations, which are periodically adjusted as required by law.
Potential Payments Upon Termination or a Change in Control
Under the employment agreements, if the applicable NEO’s employment is terminated without “cause,” by the applicable NEO for “good reason” or due to the applicable NEO’s death or “disability,” then so long as the applicable NEO (or, in the event of his death, his estate) executes (and does not revoke within the time provided to do so) a release in a form satisfactory to Enviva Management within the time period specified in such NEO’s employment agreement, such NEO will receive full vesting of outstanding awards under the LTIP (which vesting for awards that include a performance requirement (other than continued service) will be based on (i) actual performance if such termination occurs within the six-month period preceding the expiration of the performance period or (ii) target performance if such termination occurs at any other time during the performance period), and in addition, will receive the following severance benefits:
Mr. Keppler:
• | a severance payment (generally payable in installments) in an aggregate amount equal to 1.5 (or, if such termination occurs within 12 months following a “change in control,” 2.0) times the sum of his annualized base salary and target annual bonus as in effect on the date of such termination; and |
• | monthly reimbursement for the amount Mr. Keppler (or, in the event of his death, his spouse and eligible dependents) pays for continuation coverage under the employer’s group health plans for up to 18 months following such termination, plus an additional cash payment equal to six times his monthly premium for such coverage in the event his employment terminates within 12 months following a change in control and he has not obtained coverage under a group health plan sponsored by another employer within the time period specified in his employment agreement. |
Mr. Smith:
• | a severance payment (generally payable in installments) in an aggregate amount equal to the sum of his annualized base salary and target annual bonus as in effect on the date of such termination; and |
• | monthly reimbursement for the amount Mr. Smith (or, in the event of his death, his spouse and eligible dependents) pays for continuation coverage under the employer’s group health plans for up to 12 months following such termination. |
Mr. Even:
• | a severance payment (generally payable in installments) in an aggregate amount equal to the greater of (x) 1.0 (or, if such termination occurs within 12 months following a change in control, 1.5) times the sum of his annualized base salary and target annual bonus as in effect on the date of such termination or (y) the number of complete calendar months for the remainder of the current term of the employment agreement, divided by 12, times the sum of his annualized base salary and target annual bonus as in effect on the date of such termination; and |
125
• | monthly reimbursement for the amount Mr. Even (or, in the event of his death, his spouse and eligible dependents) pays for continuation coverage under the employer’s group health plans for up to the greater of (x) 12 months following such termination (or, up to 18 months if such termination occurs within 12 months following a change in control) or (y) the number of months remaining in the current term of Mr. Even’s employment agreement, up to a maximum of 18 months. |
For purposes of the employment agreements:
• | “Cause” means the applicable NEO’s: (i) material breach of any policy established by Enviva Management or its affiliates that pertains to health and safety and is applicable to the NEO, (ii) engaging in acts of disloyalty to the employer or its affiliates, including fraud, embezzlement, theft, commission of a felony, or proven dishonesty or (iii) willful misconduct in the performance of, or willful failure to perform a material function of, the NEO’s duties under the employment agreement. |
• | “Good Reason” means, without the applicable NEO’s consent and subject to certain notice and cure periods, (i) the material diminution in such NEO’s authority, duties, title or responsibilities, (ii) the material diminution in such NEO’s annualized base salary, minimum target annual bonus opportunity or target annual long-term incentive award, (iii) the relocation of the geographic location of such NEO’s principal place of employment by more than 100 miles from the location of his principal place of employment as of the effective date of the employment agreement or (iv) the employer’s delivery of a written notice of non‑renewal of the employment agreement. |
• | “Disability” exists if the applicable NEO is unable to perform the essential functions of his position, with reasonable accommodation, due to an illness or physical or mental impairment or other incapacity that continues for a period in excess of 90 days, whether consecutive or not, in any period of 365 consecutive days. The determination of a disability will be made by the employer after obtaining an opinion from a doctor selected by the employer. |
• | “Change in Control” (for Messrs. Keppler and Even) means (i) the sale or disposal by Holdings of all or substantially all of its assets to any person other than an affiliate of Holdings, (ii) the merger or consolidation of Holdings with or into another entity (other than a merger or consolidation in which unitholders in Holdings immediately prior to such transaction retain a greater than 50% equity interest in the surviving entity), (iii) the failure of the Riverstone Funds and their affiliates to possess the power to direct the management and policies of Holdings, (iv) the sale of all or substantially all of our assets to any person other than one of our affiliates, (v) our merger or consolidation with or into another entity (other than a merger or consolidation in which our unitholders immediately prior to such transaction retain a greater than 50% equity interest in the surviving entity) or (vi) the failure of the Riverstone Funds and their affiliates to possess the power to direct our management and policies. |
The employment agreements also contain certain restrictive covenants pursuant to which our NEOs have recognized an obligation to comply with, among other things, certain confidentiality covenants as well as covenants not to compete in a defined market area with Enviva Management (or any of its affiliates to which they have provided services or about which they have obtained confidential information) or solicit their employer’s or its affiliates’ employees, in each case, during the term of the agreement and for a period of one year thereafter.
Director Compensation
For the year ended December 31, 2019, directors of our General Partner, other than Mr. Keppler, received compensation for their services on our General Partner’s board of directors and committees thereof consisting of:
• | an annual retainer of $75,000, |
• | an additional annual retainer of $16,500 for services as the chair of the audit committee, |
• | an additional annual retainer of $15,000 for service as the chair of the compensation committee or the health, safety, sustainability and environmental committee (the “HSSE committee”), |
• | payment of $2,000 each time such independent director attended a board meeting, |
• | payment of $1,750 each time such independent director attended an audit committee meeting, and |
• | payment of $1,500 each time such independent director attended any meeting of the compensation committee or the HSSE committee. |
Additionally, for the year ended December 31, 2019, directors of our General Partner, other than Mr. Keppler and directors who are also officers or employees of Riverstone Holdings LLC or its affiliates (excluding the General Partner, the
126
Partnership and its subsidiaries) (the “Sponsor Directors”), received an annual grant under the LTIP with a grant date fair value of approximately $100,000.
Until the earlier of (i) four years after a director other than Mr. Keppler and the Sponsor Directors (such director, an “independent director”) is appointed to the board of directors of our General Partner or (ii) the date on which such independent director first holds an amount of our common units with an aggregate value equal to at least $250,000, one-half of all annual retainers and payments for attending board or committee meetings are paid to such independent director in the form of common units pursuant to the LTIP and the remainder is paid in cash. Each of our independent directors has met the above conditions and 100% of their annual retainers and payments for attending board or committee meetings were paid in cash. Each director is reimbursed for out-of-pocket expenses incurred in connection with attending board and committee meetings and each director will be fully indemnified by us for actions associated with serving as a director to the fullest extent permitted under Delaware law.
Prior to 2019, the Sponsor Directors did not receive compensation under our director compensation program. Compensation of the Sponsor Directors for their service on the Board is paid directly to Riverstone/Carlyle Management LP.
The following table provides information concerning the compensation of our directors, other than Mr. Keppler, for the fiscal year ended December 31, 2019:
Name | Fees Earned in Cash | Unit Awards (1) | Total | |||||||||
John C. Bumgarner, Jr. | $ | 193,121 | $ | 100,011 | $ | 293,132 | ||||||
William K. Reilly | 121,421 | 100,011 | 221,432 | |||||||||
Gary L. Whitlock | 146,121 | 100,011 | 246,132 | |||||||||
Janet S. Wong | 162,621 | 100,011 | 262,632 | |||||||||
Ralph Alexander (2) | 94,000 | — | 94,000 | |||||||||
Jim H. Derryberry (2) | 96,500 | — | 96,500 | |||||||||
Robin J. A. Duggan (2) | 93,750 | — | 93,750 | |||||||||
Christopher B. Hunt (2) | 94,500 | — | 94,500 | |||||||||
Carl L. Williams (2) | 101,250 | — | 101,250 | |||||||||
(1) | Amounts included in this column reflect the aggregate grant date fair value of phantom units (which include tandem DERs) granted to the independent directors, computed in accordance with FASB ASC Topic 718, in each case pursuant to the LTIP. See Note 18, Equity-Based Awards, for additional detail regarding assumptions underlying the value of these equity awards. The grant date fair value for the phantom unit awards is based on the closing price of our common units on the grant date of January 30, 2019, which was $30.16 per unit. These phantom unit awards vested in full on January 30, 2020. As of December 31, 2019, each independent director held 3,316 unvested phantom units in the aggregate. |
(2) | Compensation of the Sponsor Directors for their service on the Board is paid directly to Riverstone/Carlyle Management LP. |
127
ITEM 12. | SECURITY OWNERSHIP OF CERTAIN BENEFICIAL OWNERS AND MANAGEMENT AND RELATED STOCKHOLDER MATTERS |
The following table sets forth the beneficial ownership of common units of Enviva Partners, LP as of February 14, 2020 held by:
• | beneficial owners of 5% or more of our common units; |
• | each director and named executive officer; and |
• | all of our directors and executive officers as a group. |
Unless otherwise noted, the address for each beneficial owner listed below is 7200 Wisconsin Ave., Suite 1000, Bethesda, MD 20814.
Name of Beneficial Owner | Common Units Beneficially Owned(1) | Percentage of Common Units Beneficially Owned | ||||
Enviva Holdings, LP(2)(3)(4) | 13,586,375 | 40.43 | % | |||
Enviva Partners GP, LLC | — | — | % | |||
John Hancock Life Insurance Company (U.S.A.)(5) | 1,691,627 | 5.03 | % | |||
ValueAct Holdings GP, LLC(6) | 2,104,261 | 6.26 | % | |||
John K. Keppler | 73,754 | * | ||||
E. Royal Smith | 15,788 | * | ||||
Shai S. Even | — | — | ||||
Ralph Alexander | — | — | ||||
John C. Bumgarner, Jr.(7) | 185,830 | * | ||||
Robin J. A. Duggan | — | — | ||||
Jim H. Derryberry | — | — | ||||
Christopher B. Hunt | — | — | ||||
William K. Reilly | 30,405 | * | ||||
Gary L. Whitlock | 20,510 | * | ||||
Carl L. Williams | — | — | ||||
Janet S. Wong | 27,534 | * | ||||
All directors and executive officers as a group (17 persons) | 432,730 | 1.29 | % | |||
* | Less than 1% of common units outstanding. |
(1) | This column does not include phantom unit awards granted to our directors and officers pursuant to the LTIP. |
(2) | Of this aggregate amount beneficially owned, (i) Enviva MLP Holdco, LLC, a wholly owned subsidiary of Enviva Holdings, LP, has shared dispositive power over 5,897,684 common units, (ii) Enviva Cottondale Acquisition I, LLC, a wholly owned subsidiary of Enviva Holdings, LP, has shared dispositive power over 6,007,454 common units, (iii) Enviva Development Holdings, LLC, a wholly owned subsidiary of Enviva Holdings, LP has shared voting and dispositive power over 1,681,237 common units, (iv) Enviva Holdings, LP has shared dispositive power over 13,586,375 common units, (v) Enviva Holdings GP, LLC has shared voting and dispositive power over 13,586,375 common units, (vi) R/C Wood Pellet Investment Partnership, L.P. has shared voting and dispositive power over 13,586,375 common units, (vii) Riverstone/Carlyle Renewable Energy Partners II, L.P. has shared voting and dispositive power over 13,586,375 common units and (viii) R/C Renewable Energy GP II, L.L.C. has shared voting and dispositive power over 13,586,375 common units. |
(3) | R/C Renewable Energy GP II, L.L.C is the general partner of Riverstone/Carlyle Renewable Energy Partners II, L.P., which is the general partner of R/C Wood Pellet Investment Partnership, L.P., which is the sole member of Enviva Holdings GP, LLC, which is the general partner of Enviva Holdings, LP, which is the sole member of Enviva MLP Holdco, LLC and Enviva Cottondale Acquisition I, LLC. R/C Renewable Energy GP II, L.L.C. is managed by a |
128
four‑person investment committee consisting of Pierre F. Lapeyre, Jr., David M. Leuschen, Daniel A. D’Aniello and Edward J. Mathias.
(4) | The address for each of R/C Renewable Energy GP II, L.L.C., Riverstone/Carlyle Renewable Energy Partners II, L.P. and R/C Wood Pellet Investment Partnership, L.P. is c/o Riverstone Holdings LLC, 712 Fifth Avenue, 36th Floor, New York, New York 10019. |
(5) | John Hancock Life Insurance Company (U.S.A.) has beneficial ownership of 1,691,627 common units. It is an indirect, wholly owned subsidiary of Manulife Financial Corporation. |
(6) | ValueAct Holdings GP, LLC has beneficial ownership of 2,104,261 common units. ValueAct Management, LLC is the general partner of ValueAct Capital Management, L.P. ValueAct Holdings II, L.P. is the majority owner of the membership interests of ValueAct Management, LLC and ValueAct Holdings GP, LLC is the general partner of ValueAct Holdings II, L.P. |
(7) | These 185,830 common units are held by the Bumgarner Family Trust. Mr. Bumgarner has investment control over these units. |
Equity Compensation Plan Information
The following table sets forth information with respect to the securities that may be issued under the Enviva Partners, LP Long-Term Incentive Plan (the “LTIP”) as of December 31, 2019.
Plan category | Number of securities to be issued upon exercise of outstanding options, warrants and rights (a)(2) | Weighted- average exercise price of outstanding options, warrants and rights ($) (b)(3) | Number of securities remaining available for future issuance under equity compensation plans (excluding securities reflected in column (a)) (c)(4) | ||||||
Equity compensation plans approved by security holders(1) | 1,322,820 | n/a | 690,414 | ||||||
Equity compensation plans not approved by security holders | — | — | — | ||||||
Total | 1,322,820 | n/a | 690,414 | ||||||
(1) | The LTIP was approved by the board of directors of our General Partner prior to the IPO. |
(2) | The amount in column (a) of this table reflects (i) the aggregate number of common units issuable upon settlement of outstanding time-based phantom units and (ii) the aggregate number of common units issuable upon settlement of outstanding performance-based phantom units based on the performance target, under the LTIP as of December 31, 2019. The actual number of common units that may be issued in settlement of outstanding performance-based phantom unit awards is based on a factor of between 0% and 200%. |
(3) | This column is not applicable because only phantom units have been granted under the LTIP and phantom units do not have an exercise price. |
(4) | The amount in this column reflects the total number of common units remaining available for future issuance under the LTIP as of December 31, 2019. For additional information about the LTIP and the awards granted thereunder, please read Part III, Item 11. “Executive Compensation.” |
129
ITEM 13. | CERTAIN RELATIONSHIPS AND RELATED TRANSACTIONS AND DIRECTOR INDEPENDENCE |
As of February 14, 2020, our sponsor owned 13,586,375 common units representing an approximate 40% limited partner interest in us. In addition, our sponsor owns and controls (and appoints all the directors of) our General Partner, which maintains a non-economic general partner interest in us and owns all our incentive distribution rights.
The terms of the transactions and agreements disclosed in this section were determined by and among affiliated entities and, consequently, are not the result of arm’s-length negotiations. These terms are not necessarily at least as favorable to the parties to these transactions and agreements as the terms that could have been obtained from unaffiliated third parties.
Distributions and Payments to Our General Partner and Its Affiliates
We generally make 100% of our cash distributions to our unitholders, including affiliates of our General Partner. In addition, if distributions exceed the minimum quarterly distribution and other higher target distribution levels, our General Partner, or the holder of our incentive distribution rights, will be entitled to increasing percentages of the distributions, up to 50.0% of the distributions above the highest target distribution level.
Assuming we have sufficient cash available for distribution to pay the full minimum quarterly distribution on all of our outstanding common units for four quarters, our General Partner and its affiliates would receive total annual distributions of approximately $22.4 million on their common units.
Our General Partner does not receive a management fee or other compensation for its management of our partnership, but we reimburse our General Partner and its affiliates for all direct and indirect expenses they incur and payments they make on our behalf. These expenses include salary, bonus, incentive compensation and other amounts paid to persons who perform services for us or on our behalf and expenses allocated to our General Partner by its affiliates. Under our MSAs, we are obligated to reimburse Enviva Management for all direct or indirect costs and expenses incurred by, or chargeable to, Enviva Management in connection with its provision of services necessary for the operation of our business. If the MSAs were terminated without replacement, or our General Partner or its affiliates provided services outside of the scope of the MSAs, our partnership agreement would require us to reimburse our General Partner and its affiliates for all expenses they incur and payments they make on our behalf. Our partnership agreement does not set a limit on the amount of expenses for which our General Partner and its affiliates may be reimbursed.
If our General Partner withdraws or is removed, its non-economic general partner interest and its incentive distribution rights will either be sold to the new general partner for cash or converted into common units, in each case for an amount equal to the fair market value of those interests.
If we are ever liquidated, the partners, including our General Partner, will be entitled to receive liquidating distributions according to their respective capital account balances.
Agreements with Affiliates
Wilmington Contribution Agreement
In October 2017, pursuant to the terms of a contribution agreement with the Enviva Wilmington Holdings, LLC (the “Hamlet JV”), we acquired all of the issued and outstanding limited liability company interests in Enviva Port of Wilmington, LLC (“Wilmington”) for a purchase price of $130.0 million. The purchase price included an initial payment of $54.6 million, net of an approximate purchase price adjustment of $1.4 million. The acquisition (the “Wilmington Drop-Down”) included a marine terminal in Wilmington, North Carolina (the “Wilmington terminal”) and a long-term terminal services agreement (the “Holdings TSA”) with our sponsor to receive, handle and store throughput volumes sourced by our sponsor from a wood pellet production plant in Greenwood, South Carolina (the “Greenwood plant”).
Pursuant to the Holdings TSA, which remains in effect until September 1, 2026, our sponsor agreed to deliver a minimum of 125,000 metric tons per quarter and pay a fixed fee on a per-ton basis for terminal services. In February 2018, the Holdings TSA was amended and assigned to Enviva Pellets Greenwood, LLC (“Greenwood”), a wholly owned subsidiary of the Sponsor JV and the owner of the Greenwood plant. The Holdings TSA provides for deficiency payments to Wilmington if quarterly minimum throughput requirements are not met.
On April 1, 2019, we accelerated the payment of $74.0 million (the “Second Payment”) to the Hamlet JV as the second and final payment for the Wilmington Drop-Down. Such payment consisted of (i) approximately $24.0 million in cash, of which approximately $23.0 million was distributed to John Hancock Life Insurance Company (U.S.A.) (collectively, as applicable, “John Hancock”) and approximately $1.0 million was retained by the Hamlet JV and (ii) the issuance of 1,691,627 common units, or approximately $50.0 million in common units, which were distributed to John Hancock.
130
In connection with the Second Payment, Wilmington entered into a long-term terminal services agreement (the “Wilmington-Hamlet TSA”) with the Hamlet JV and Enviva Pellets Hamlet, LLC, a wholly owned subsidiary of the Hamlet JV that owns the wood pellet production plant in Hamlet, North Carolina (the “Hamlet plant”), pursuant to which the Wilmington terminal agreed to receive, handle, store and load wood pellets from the Hamlet plant. The Wilmington-Hamlet TSA provides for deficiency payments to Wilmington if minimum throughput requirements are not met.
Payments to Riverstone for Affiliated Director Services
Beginning in 2019, we paid Riverstone Holdings/Carlyle Management LP, an affiliate of our sponsor, compensation for the services of the officers or employees of Riverstone Holdings LLC or its affiliates who serve as directors on the board of directors of our General Partner. During the year ended December 31, 2019, total compensation expense related to the directors was $0.5 million.
Related-Party Indemnification
In connection with our acquisition of Enviva Pellets Sampson, LLC (the “Sampson Drop-Down”), which owns a wood pellet production plant in Sampson, North Carolina (the “Sampson plant”), from the Hamlet JV, the Hamlet JV agreed to indemnify us, our affiliates and our respective officers, directors, managers, counsel, agents and representatives from all costs and losses arising from certain vendor liabilities and claims related to the construction of the Sampson plant that were included in the net assets contributed.
In connection with the Wilmington Drop-Down, the Hamlet JV agreed to indemnify us, our affiliates and our respective officers, directors, managers, counsel, agents and representatives from all costs and losses arising from certain vendor liabilities and claims related to the construction of the Wilmington terminal that were included in the net assets contributed.
Sampson Construction Payments
Pursuant to certain payment agreements we entered into with the Hamlet JV prior to the Hamlet Drop-Down, the Hamlet JV agreed to pay an aggregate amount of $2.9 million to us in consideration for costs incurred by us to repair or replace certain equipment at the Sampson plant following the Sampson Drop-Down. As of December 31, 2019, $2.9 million has been received and no further amounts are outstanding.
EVA-MGT Contracts
In January 2016 we entered into a contract with the Hamlet JV to supply 375,000 metric tons per year (“MTPY”) of wood pellets (the “EVA‑MGT Contract”) to MGT Teesside Limited’s (“MGT”) Tees Renewable Energy Plant (the “Tees REP”), which is under development. In exchange for a fee, the Partnership amended the EVA-MGT Contract to delay delivery of volumes originally scheduled for 2019 until 2020 and cancel volumes originally scheduled for 2020. The EVA-MGT contract commences in 2020, ramps to full supply in 2021 and continues through 2034. The EVA-MGT Contract is denominated in U.S. Dollars for one shipment in 2020 and in British Pound Sterling (“GBP”) for all other shipments. On January 22, 2016, the Partnership entered into a Contingent Novation Agreement relating to the Tees REP with the Hamlet JV and MGT pursuant to which, in the event MGT terminates the MGT Contract or we notify MGT that we wish to terminate the EVA-MGT Contract, MGT may become a party to the EVA-MGT Contract in lieu of the Hamlet JV, subject to the terms thereof.
We entered into a second supply agreement (the “Second Supply Agreement”) with the Hamlet JV in connection with the Sampson Drop-Down to supply an additional 95,000 metric tons per year (“MTPY”) of the contracted volume to the Tees REP. In connection with the Hamlet Drop-Down, on March 20, 2019 we amended the Second Supply Agreement, whereby option volumes excisable by the Hamlet JV in 2019 were added for the Hamlet JV to meet its delivery obligations under its long-term, take-or-pay off-take contract with MGT (the “MGT Contract”) existing as of the date thereof. In exchange for a fee, we further amended the Second Supply Agreement on November 22, 2019 to cancel certain volumes originally scheduled for 2020. The Secondary Supply Agreement is denominated in GBP, commences in 2021 and continues through 2034.
On August 10, 2016, the Hamlet JV entered into a Fuel Supply Direct Agreement related to the MGT Contract together with our sponsor, John Hancock, MGT and Lloyds Bank PLC, acting as security trustee, pursuant to which, among other things, (1) MGT, as borrower, granted security for the payment of certain liabilities under its financing documents and, on a second-ranking basis, payments to the Hamlet JV under the MGT Contract and certain related documents, and (2) the Hamlet JV, our sponsor and John Hancock consented to MGT granting such security interests and agreed to notify the security trustee of any material default under the MGT Contract or certain other related documents, in all cases subject to the terms thereof.
131
Registration Rights Agreement - Sponsor
In connection with our initial public offering (“IPO”) on May 4, 2015, we entered into a registration rights agreement with our sponsor pursuant to which we may be required to register the sale of the common units issued (or issuable) to our sponsor. Under the registration rights agreement, our sponsor will have piggyback registration rights, subject to certain limitations. The registration rights agreement also includes provisions dealing with indemnification and contribution and allocation of expenses. All common units held by our sponsor or any permitted transferee will be entitled to these registration rights. In accordance with the registration rights agreement, we registered all of our sponsor’s common units for resale, subject to certain limitations, pursuant to our effective registration statement on Form S-3, filed with the SEC on June 21, 2019.
Registration Rights Agreement - John Hancock
In connection with the Second Payment, on April 2, 2019 we entered into a registration rights agreement with John Hancock covering the resale of the common units issued by us to John Hancock through such date. The registration rights agreement included provisions dealing with indemnification and contribution and allocation of expenses. We registered all of John Hancock’s common units for sale, subject to certain limitations, pursuant to an effective shelf registration statement.
Purchase Rights Agreement
We entered into a purchase rights agreement with our sponsor pursuant to which our sponsor agreed to provide us with a right of first offer to purchase any wood pellet production plant or deep‑water marine terminal that it, its subsidiaries or any other entity that it controls (including its joint venture with John Hancock (the “Sponsor JV”)) owns and proposes to sell (each, a “ROFO Asset”) for a five-year period. Pursuant to an amendment, the term of the purchase rights agreement was extended to May 2021 and will automatically renew on an annual basis unless either party provides notice of termination within 60 days prior to the end of the then-current term.
We will have thirty days following receipt of notice of our sponsor entity’s intention to sell a ROFO Asset to propose an offer for the ROFO Asset. If we submit an offer, our sponsor will negotiate with us exclusively and in good faith to enter into a letter of intent or definitive documentation for the purchase of the ROFO Asset on mutually acceptable terms. If we are unable to agree to terms within 45 days, our sponsor entity will have 150 days to enter into definitive documentation with a third party purchaser on terms that are, in the good faith judgment of our sponsor entity selling such ROFO Assets, superior to the most recent offer proposed by us.
Hamlet Drop-Down
We entered into a contribution agreement dated April 2, 2019 with our sponsor pursuant to which our sponsor contributed to us all of the issued and outstanding Class B Units in the Hamlet JV for $165.0 million, subject to certain adjustments (the “Hamlet Drop-Down”). The $165.0 million purchase price consisted of (1) a cash payment of $24.7 million, net of a purchase price adjustment of $0.3 million, (2) the issuance of 1,681,237 unregistered common units at a value of $29.74 per unit, or $50.0 million of common units, (3) $50.0 million in cash paid on June 28, 2019, (4) $40.0 million in cash paid on January 2, 2020 and (5) the elimination of $3.0 million of net related-party receivables and payables included in the net assets of the Hamlet JV on the date of acquisition. We became a member of the Hamlet JV when we acquired the Class B Units on the date of the Hamlet Drop-Down. The closing of the Hamlet Drop-Down occurred on April 2, 2019.
Management Services Agreements
EVA MSA
In April 2015, all of our employees and members of management became employed by Enviva Management, and we and our General Partner entered into the EVA MSA. The EVA MSA has a term of five years, which is automatically renewed unless terminated by us for cause. Enviva Management is also able to terminate the agreement if we fail to reimburse it for its costs and expenses allocable to us.
Pursuant to the EVA MSA, we reimburse Enviva Management for all direct or indirect costs and expenses incurred by, or chargeable to, Enviva Management in connection with the provision of the services, including, without limitation, salary and benefits of employees engaged in providing such services, as well as office rent, expenses and other overhead costs of Enviva Management. Enviva Management determines the amount of costs and expenses that is allocable to us.
In connection with the Hamlet Drop-Down, we and Enviva Management entered into an agreement pursuant to which an aggregate of approximately $13 million in fees that otherwise would be owed by us under the EVA MSA will be waived during the period from the closing of the Hamlet Drop-Down through the second quarter of 2020.
132
In June 2019, we entered into an additional agreement with Enviva Management (the “Second EVA MSA Fee Waiver”) pursuant to which we received a $5.0 million waiver of fees under the EVA MSA through September 30, 2019 as consideration for an assignment of two shipping contracts to our sponsor to rebalance our and our sponsor’s respective shipping obligations under existing off-take contracts. During the year ended December 31, 2019, $5.0 million of fees expensed under the EVA MSA were waived and recorded as an increase to partners’ capital pursuant to the Second EVA MSA Fee Waiver.
Hamlet JV MSA
In connection with the Hamlet Drop-Down, the Hamlet JV entered into an agreement with a wholly owned subsidiary of our sponsor (“Hamlet Operator”) to waive approximately $2.7 million of management fees payable to Enviva Management under the management services agreement (the “Hamlet JV MSA”) between the Hamlet JV and Hamlet Operator with respect to the period from the date of acquisition of the Hamlet plant until July 1, 2020. Pursuant to the Hamlet JV MSA, Enviva Management provides services to the Hamlet JV, including those necessary or incidental to the operation and management of the Hamlet JV.
Make-Whole Agreement
In connection with the Hamlet Drop-Down, on April 2, 2019 we entered into a make-whole agreement with our sponsor, pursuant to which (1) our sponsor agreed to guarantee certain cash flows from the Hamlet plant until June 30, 2020, (2) our sponsor agreed to reimburse us for construction cost overruns in excess of budgeted capital expenditures for the Hamlet plant, subject to certain exceptions, (3) we agreed to pay to our sponsor quarterly incentive payments for any wood pellets produced by the Hamlet plant in excess of forecast production levels through June 30, 2020 and (4) our sponsor agreed to retain liability for certain claims payable, if any, by the Hamlet JV.
Interim Services Agreement and Guaranty
In connection with the Hamlet Drop-Down, on April 2, 2019 we entered into an interim services agreement (the “ISA”) with Hamlet Operator pursuant to which Hamlet Operator agreed to manage, operate, maintain and repair the Hamlet plant and provide other services to the Hamlet JV for the period from July 1, 2019 through June 30, 2020 in exchange for a fixed fee per metric ton of wood pellets produced by the Hamlet plant during such period and delivered at place to the Wilmington terminal. Under and during the term of the ISA, Hamlet Operator agreed to (1) pay all operating and maintenance expenses at the Hamlet plant, (2) cover all reimbursable general and administrative expenses associated with the Hamlet plant and (3) pay certain other costs and expenses incurred by the Hamlet plant. Our sponsor guarantees all obligations of Hamlet Operator under the ISA.
Hamlet JV Revolver
In connection with the Hamlet Drop-Down, on April 2, 2019, our sponsor assigned to us all of its rights and obligations under the amended and restated credit agreement, dated as of June 30, 2018, between the Hamlet JV, as borrower, and our sponsor, as lender. On April 2, 2019, we amended and restated the credit agreement to extend the maturity date of the revolving loans made to the Hamlet JV and increase our commitment as the lender to fund increases in the amount of such loans from $30.0 million to $60.0 million in order to fund capital expenditures and working capital at the Hamlet plant. As of December 31, 2019, the outstanding balance of the Hamlet JV Revolver was $52.2 million due from the Hamlet JV, which was eliminated upon consolidation.
Off-take Contract
On April 9, 2015, we entered into a master biomass purchase and sale agreement with the Hamlet JV. In connection with the Hamlet Drop-Down, on March 20, 2019 we entered into a new confirmation (the “Confirmation”) thereunder pursuant to which we agreed to purchase all wood pellets produced by the Hamlet plant from commencement of operations through December 31, 2019 and all wood pellets produced by the Hamlet plant but not sold to MGT from January 1, 2020 through June 30, 2020.
Hamlet JV LLC Agreement
On December 29, 2016, our sponsor and John Hancock entered into the Fourth Amended and Restated Limited Liability Company Agreement of the Hamlet JV (the “Hamlet JV LLCA”). Following the Hamlet Drop-Down and pursuant to the Hamlet JV LLCA, we are the managing member of the Hamlet JV and have the authority to manage the business and affairs of the Hamlet JV and take actions on its behalf, including adopting annual budgets, entering into agreements, effecting asset sales or biomass purchase agreements, making capital calls, incurring debt and taking other actions, subject to John Hancock’s
133
consent in certain circumstances. The Hamlet JV LLCA also sets forth the capital commitments and limitations thereon for each of the members and provides for the allocation of sale proceeds and distributions among the holders of outstanding Class A Units and Class B Units. For more information on capital commitments, please see Item 8—Financial Statements and Supplementary Data, Notes to the Consolidated Financial Statements, (17)—Partners’ Capital—Hamlet JV.
Replacement Pledge Agreement
In connection with the Hamlet Drop-Down, on April 2, 2019 we entered into a pledge agreement in favor of John Hancock pursuant to which, among other things, we pledged our Class B Units in the Hamlet JV to John Hancock in replacement of a corresponding pledge previously made to John Hancock by our sponsor as support for a guaranty previously provided to John Hancock.
Guarantee Fee Agreement
On December 28, 2017, the Hamlet JV entered into a guarantee fee agreement (the “Guarantee Fee Agreement”) with our sponsor pursuant to which our sponsor agreed to guarantee certain obligations of the Hamlet JV under certain equipment leases and shipping contracts related to its business in exchange for certain fees.
Sponsor Indemnification Agreement
In connection with the Hamlet Drop-Down, on April 2, 2019 we entered into an agreement (the “Sponsor Indemnification Agreement”) with our sponsor pursuant to which we agreed to indemnify our sponsor for any amounts owed under the Guarantee Fee Agreement and our sponsor agreed to pay to us any fees it receives from the Hamlet JV for providing guarantees under the Guarantee Fee Agreement. Pursuant to the Sponsor Indemnification Agreement, the Partnership also agreed to indemnify our sponsor with respect to its obligations under certain guarantee and indemnity agreements with John Hancock related to the Hamlet JV.
Management Services Fee Adjustment Agreement
On March 20, 2019, our sponsor entered into a management services fee adjustment agreement pursuant to which our sponsor agreed to make payments to us in respect of any amounts payable by the Hamlet JV pursuant to the Hamlet JV MSA in excess of the fixed-priced amounts for services established in the ISA. The agreement terminated on April 2, 2019 in accordance with its terms. No payments were made thereunder.
Equipment Transfers
In January 2019, Enviva Pellets Northampton, LLC purchased certain equipment from the Hamlet plant for approximately $0.5 million.
In February 2019, Enviva Pellets Sampson, LLC purchased pellet presses and related equipment from the Hamlet plant for approximately $0.7 million.
Other Transactions with Related Persons
Enviva FiberCo, LLC
We purchase raw materials from Enviva FiberCo, LLC (“FiberCo”), a wholly owned subsidiary of our sponsor. During the year ended December 31, 2019, cost of cover deficiency fees net of raw material purchases was $0.5 million. During 2018 and 2017 raw material purchases were $7.1 million and $8.5 million, respectively. There were no cost of cover deficiency fees from FiberCo recorded during the years ended December 31, 2018 and 2017.
On July 1, 2019, we entered into an agreement with FiberCo pursuant to which FiberCo agreed to build specified levels of stumpage inventory and we agreed to purchase such inventory during the first and second quarter of 2020 at a fixed-price premium to the then-prevailing market price. Pursuant to such agreement, FiberCo is required to pay us fixed shortfall payments in the event that actual inventory levels fall below the specified levels as of specified dates.
Greenwood Contract
In December 2017, we entered into a master off-take contract with the Sponsor JV (the “Sponsor JV Off-take Master Agreement”). In February 2018, we entered into a confirmation governed by the Sponsor JV Off-take Master Agreement with Greenwood. We amended such confirmation in March 2018, July 2019 and December 2019. Under the amended confirmation,
134
we agreed to purchase the wood pellets produced by the Greenwood plant through March 2022 and have a take-or-pay obligation with respect to 550,000 MTPY of wood pellets (prorated for partial contract years) beginning in 2021 and subject to Greenwood’s option to increase or decrease the volume by 10% each contract year.
Netting Agreement
We entered into an agreement with our sponsor effective as of September 30, 2019 (the “Netting Agreement”) pursuant to which we agreed to set off related-party accounts receivable and accounts payable; consequently, we intend to set off related-party receivables and payables, which are reflected net in related-party receivables and payables, as applicable, in accordance with the Netting Agreement. As of December 31, 2018, related-party accounts receivable and accounts payable were not intended to be set off and were reflected separately in current assets and current liabilities.
Procedures for Review, Approval and Ratification of Transactions with Related Persons
In connection with the closing of our IPO, the board of directors of our General Partner adopted policies for the review, approval and ratification of transactions with related persons. The board adopted a written Code of Business Conduct and Ethics under which a director is required to bring to the attention of the board any conflict or potential conflict of interest that may arise between the director or any affiliate of the director, on the one hand, and us or our General Partner on the other. The resolution of any such conflict or potential conflict should, at the discretion of the board in light of the circumstances, be determined by a majority of the disinterested directors.
Under the provisions of our Code of Business Conduct and Ethics, any executive officer will be required to avoid conflicts of interest unless approved by the board of directors of our General Partner.
The Code of Business Conduct and Ethics described above was adopted in connection with the closing of our IPO and, as a result, the transactions described above that were entered into prior to or in connection with the IPO were not reviewed according to such procedures.
The board has also adopted a Conflicts of Interest Policy, under which if a conflict or potential conflict of interest arises between our General Partner or its affiliates, on the one hand, and us or our unitholders, on the other hand, the resolution of any such conflict or potential conflict should be addressed by the board of directors of our General Partner in accordance with the provisions of our partnership agreement. At the discretion of the board in light of the circumstances, the resolution may be determined by the board in its entirety or by a conflicts committee meeting the definitional requirements for such a committee under our partnership agreement.
The Conflicts of Interest Policy provides that the board may approve certain contracts (“Affiliated Contracts”) between us, on the one hand, and the General Partner and any of its affiliates, on the other hand, so long as the board reasonably determines that such contracts are on terms (in the aggregate) not less favorable to us than could be obtained on an arm’s‑length basis from an unrelated third party, taking into account the totality of the circumstances involved.
The Conflicts of Interest Policy also provides that either of the Chief Executive Officer or the Chief Financial Officer (each, an “Approving Officer”) of our General Partner have the authority, without prior board approval but subject to board review, to approve certain Affiliated Contracts involving asset transfers, services related to the production, storage, terminaling or transportation of biomass, or leases in order to promote the proper functioning of our day-to-day business affairs so long as the applicable Approving Officer and the General Counsel of our General Partner determine, after reasonable inquiry, that such Affiliated Contracts are on terms (in the aggregate) not less favorable to us than could be obtained on an arm’s‑length basis from an unrelated third party, taking into account the totality of the circumstances involved.
Director Independence
See Part III, Item 10. “Directors, Executive Officers and Corporate Governance” for information regarding the directors of our General Partner and independence requirements applicable to the board of directors of our General Partner and its committees.
135
ITEM 14. | PRINCIPAL ACCOUNTING FEES AND SERVICES |
Ernst & Young LLP (“EY”) and KPMG LLP (“KPMG”) served as our independent auditors during the years ended December 31, 2019 and 2018, respectively. The following table presents fees paid for professional audit services of our annual consolidated financial statements and for other services for the years ended December 31, 2019 and 2018.
Year Ended December 31, | ||||||||
(in thousands) | 2019 | 2018 | ||||||
Audit fees(1) | $ | 1,439 | $ | 1,490 | ||||
Audit related fees(2) | 10 | — | ||||||
Tax fees | — | — | ||||||
All other fees(3) | 11 | — | ||||||
Total | $ | 1,460 | $ | 1,490 | ||||
(1) | Fees for audit services related to the fiscal year consolidated audit, quarterly reviews, registration statements and services that were provided in connection with statutory and regulatory filings. |
(2) | Fees for non-audit services related to internal controls in compliance preparation for Section 404 of the Sarbanes-Oxley Act. |
(3) | Fees for use of the EY global accounting and financial reporting research tool. |
Policy for Approval of Audit and Permitted Non-Audit Services
Before the independent registered public accounting firm is engaged by us or our subsidiaries to render audit or non‑audit services, the audit committee must pre-approve the engagement. Audit committee pre-approval of audit and non-audit services is not required if the engagement for the services is entered into pursuant to pre-approval policies and procedures established by the audit committee. The chairman of the audit committee has the authority to grant pre-approvals, provided such approvals are within the pre-approval policy and presented to the audit committee at a subsequent meeting.
The audit committee approved the appointment of EY as our independent auditor to conduct the audit of our consolidated financial statements for the year ended December 31, 2019 and all of the services described above.
136
PART IV
ITEM 15. EXHIBITS, FINANCIAL STATEMENT SCHEDULES
(a) | Certain documents are filed as a part of this Annual Report and are incorporated by reference and found on the pages below. |
1. | Financial Statements—Please read Part II, Item 8. “Financial Statements and Supplementary Data—Index to Financial Statements.” |
2. | All schedules have been omitted because they are either not applicable, not required or the information called for therein appears in the consolidated financial statements or notes thereto. |
3. | Exhibits—Exhibits required to be filed by Item 601 of Regulation S‑K set forth below are incorporated herein by reference. |
137
EXHIBIT INDEX
Exhibit Number | Exhibit | |
2.1 | ||
3.1 | ||
3.2 | ||
3.3 | ||
3.4* | ||
4.1 | ||
4.2 | ||
4.3 | ||
4.4 | ||
4.5 | ||
4.6 | ||
4.7* | ||
10.1* | ||
10.2† | ||
10.3† | ||
10.4 | ||
10.7 | ||
10.8† | ||
10.9† | ||
10.10† | ||
10.11† | ||
10.12† | ||
138
Exhibit Number | Exhibit | |
10.13† | ||
10.16 | ||
10.17 | ||
10.18 | ||
10.19† | ||
10.20† | ||
10.21*† | ||
10.22*† | ||
10.23*† | ||
10.25*† | ||
16.1 | ||
21.1* | ||
23.1* | ||
23.2* | ||
23.3* | ||
24.1* | Power of Attorney (incorporated by reference to the signature page of this Annual Report on Form 10‑K) | |
31.1* | ||
31.2* | ||
32.1** | ||
32.2** | ||
101.INS | XBRL Instance Document | |
101.SCH | XBRL Schema Document | |
101.CAL | XBRL Calculation Linkbase Document | |
101.DEF | XBRL Definition Linkbase Document | |
101.LAB | XBRL Labels Linkbase Document. | |
101.PRE | XBRL Presentation Linkbase Document | |
* Filed herewith.
** Furnished herewith.
† Management Contract or Compensatory Plan or Arrangement
139
SIGNATURES
Pursuant to the requirements of Section 13 or 15(d) of the Securities Exchange Act of 1934, the registrant has duly caused this report to be signed on its behalf by the undersigned, hereunto duly authorized.
ENVIVA PARTNERS, LP | ||
By: | Enviva Partners GP, LLC, as its sole general partner | |
Date: February 26, 2020 | By: | /s/ JOHN K. KEPPLER |
John K. Keppler | ||
Title: Chairman, President and Chief Executive Officer | ||
140
POWER OF ATTORNEY
KNOW ALL PERSONS BY THESE PRESENTS, that each person whose signature appears below constitutes and appoints each of William H. Schmidt, Jr. and Jason E. Paral as his true and lawful attorney-in-fact and agent with full power of substitution and resubstitution, for him and in his name, place, and stead, in any and all capacities, to sign any and all amendments to this Annual Report, and to file the same, with all exhibits thereto and other documents in connection therewith, with the Securities and Exchange Commission, granting unto said attorneys-in-fact and agents, and each of them, full power and authority to do and perform each and every act and thing requisite and necessary to be done in connection therewith, as fully to all intents and purposes as he might or could do in person, hereby ratifying and confirming all that said attorneys-in-fact and agents, and each of them, or their or his substitute or substitutes, may lawfully do or cause to be done by virtue hereof.
Pursuant to the requirements of the Securities Exchange Act of 1934, as amended, this Annual Report has been signed below by the following persons on behalf of the registrant and in the capacities and on the dates indicated.
Name | Title | Date | ||
/s/ JOHN K. KEPPLER | Chairman, President and Chief Executive Officer | February 26, 2020 | ||
John K. Keppler | (Principal Executive Officer) | |||
/s/ SHAI S. EVEN | Executive Vice President and Chief Financial Officer | February 26, 2020 | ||
Shai S. Even | (Principal Accounting Officer and Principal Financial Officer) | |||
/s/ RALPH ALEXANDER | Director | February 26, 2020 | ||
Ralph Alexander | ||||
/s/ JOHN C. BUMGARNER, JR. | Director | February 26, 2020 | ||
John C. Bumgarner, Jr. | ||||
/s/ JIM H. DERRYBERRY | Director | February 26, 2020 | ||
Jim H. Derryberry | ||||
/s/ ROBIN J. A. DUGGAN | Director | February 26, 2020 | ||
Robin J. A. Duggan | ||||
/s/ CHRISTOPHER B. HUNT | Director | February 26, 2020 | ||
Christopher B. Hunt | ||||
/s/ WILLIAM K. REILLY | Director | February 26, 2020 | ||
William K. Reilly | ||||
/s/ GARY L. WHITLOCK | Director | February 26, 2020 | ||
Gary L. Whitlock | ||||
/s/ CARL L. WILLIAMS | Director | February 26, 2020 | ||
Carl L. Williams | ||||
/s/ JANET S. WONG | Director | February 26, 2020 | ||
Janet S. Wong | ||||
141