Attached files
| file | filename |
|---|---|
| EX-99.1 - EXHIBIT 99.1 - CURTISS WRIGHT CORP | a52180092ex99_1.htm |
| 8-K - CURTISS-WRIGHT CORPORATION 8-K - CURTISS WRIGHT CORP | a52180092.htm |
|
|
Exhibit 99.2
|

4Q & FY 2019 Earnings Conference CallFebruary 27, 2020 NYSE: CW
Safe Harbor Statement Please note that the information provided in this presentation is accurate as of
the date of the original presentation. The presentation will remain posted on this website from one to twelve months following the initial presentation, but content will not be updated to reflect new information that may become available
after the original presentation posting. The presentation contains forward-looking statements including, among other things, management's estimates of future performance, revenue and earnings, our management's growth objectives, our
management’s ability to integrate our acquisition, and our management's ability to produce consistent operating improvements. These forward-looking statements are based on expectations as of the time the statements were made only, and are
subject to a number of risks and uncertainties which could cause us to fail to achieve our then-current financial projections and other expectations. Any references to organic growth exclude the effects of foreign currency translation,
acquisitions and divestitures, unless otherwise noted. This presentation also includes certain non-GAAP financial measures with reconciliations to GAAP financial measures being made available in the earnings release that is posted to our
website and furnished with the SEC. We undertake no duty to update this information. More information about potential factors that could affect our business and financial results is included in our filings with the Securities and Exchange
Commission, including our Annual Reports on Form 10-K and Quarterly Reports on Form 10-Q, including, among other sections, under the captions, "Risk Factors" and "Management's Discussion and Analysis of Financial Condition and Results of
Operations," which is on file with the SEC and available at the SEC's website at www.sec.gov.
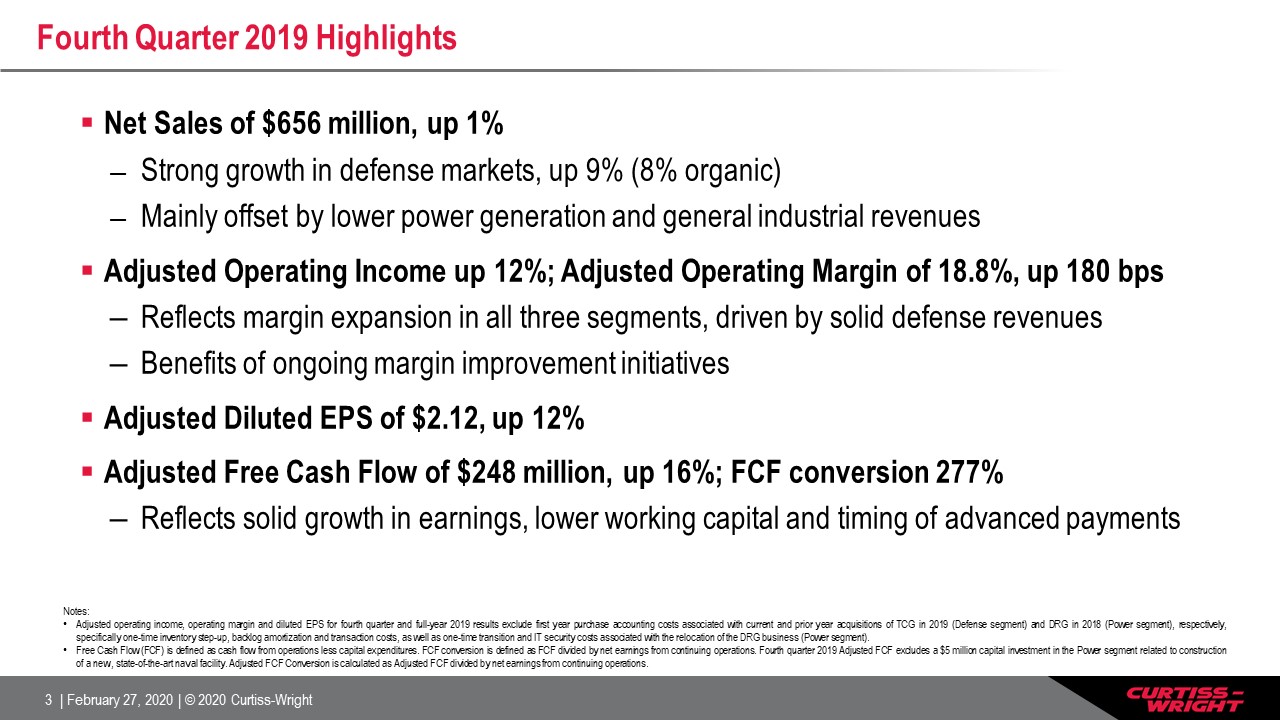
Fourth Quarter 2019 Highlights Net Sales of $656 million, up 1% Strong growth in defense markets, up
9% (8% organic)Mainly offset by lower power generation and general industrial revenuesAdjusted Operating Income up 12%; Adjusted Operating Margin of 18.8%, up 180 bpsReflects margin expansion in all three segments, driven by solid defense
revenuesBenefits of ongoing margin improvement initiativesAdjusted Diluted EPS of $2.12, up 12%Adjusted Free Cash Flow of $248 million, up 16%; FCF conversion 277%Reflects solid growth in earnings, lower working capital and timing of advanced
payments Notes: Adjusted operating income, operating margin and diluted EPS for fourth quarter and full-year 2019 results exclude first year purchase accounting costs associated with current and prior year acquisitions of TCG in 2019
(Defense segment) and DRG in 2018 (Power segment), respectively, specifically one-time inventory step-up, backlog amortization and transaction costs, as well as one-time transition and IT security costs associated with the relocation of the
DRG business (Power segment).Free Cash Flow (FCF) is defined as cash flow from operations less capital expenditures. FCF conversion is defined as FCF divided by net earnings from continuing operations. Fourth quarter 2019 Adjusted FCF
excludes a $5 million capital investment in the Power segment related to construction of a new, state-of-the-art naval facility. Adjusted FCF Conversion is calculated as Adjusted FCF divided by net earnings from continuing operations.

Full-Year 2019 Highlights Net Sales of $2.5 billion, up 3% Strong growth in defense markets, up 12%
(9% organic)Partially offset by lower power generation and general industrial revenuesAdjusted Operating Income up 7%; Adjusted Operating Margin of 16.5%, up 70 bps Solid profitability in C/I and Power segments, partially offset by
unfavorable mix in Defense segmentAdjusted Diluted EPS of $7.27, up 14%Adjusted Free Cash Flow of $371 million, up 11%; FCF conversion 121%Reflects double-digit growth in earnings, lower working capital and timing of advanced paymentsNew
Orders up 6%, led by double-digit growth in defense markets; Book-to-bill 1.04x Notes: Adjusted operating income, operating margin and diluted EPS for fourth quarter and full-year 2019 results exclude first year purchase accounting costs
associated with current and prior year acquisitions of TCG in 2019 (Defense segment) and DRG in 2018 (Power segment), respectively, specifically one-time inventory step-up, backlog amortization and transaction costs, as well as one-time
transition and IT security costs associated with the relocation of the DRG business (Power segment).Free Cash Flow (FCF) is defined as cash flow from operations less capital expenditures. FCF conversion is defined as FCF divided by net
earnings from continuing operations. Full-year 2019 Adjusted FCF excludes a $19 million capital investment in the Power segment related to construction of a new, state-of-the-art naval facility. Adjusted FCF Conversion is calculated as
Adjusted FCF divided by net earnings from continuing operations.
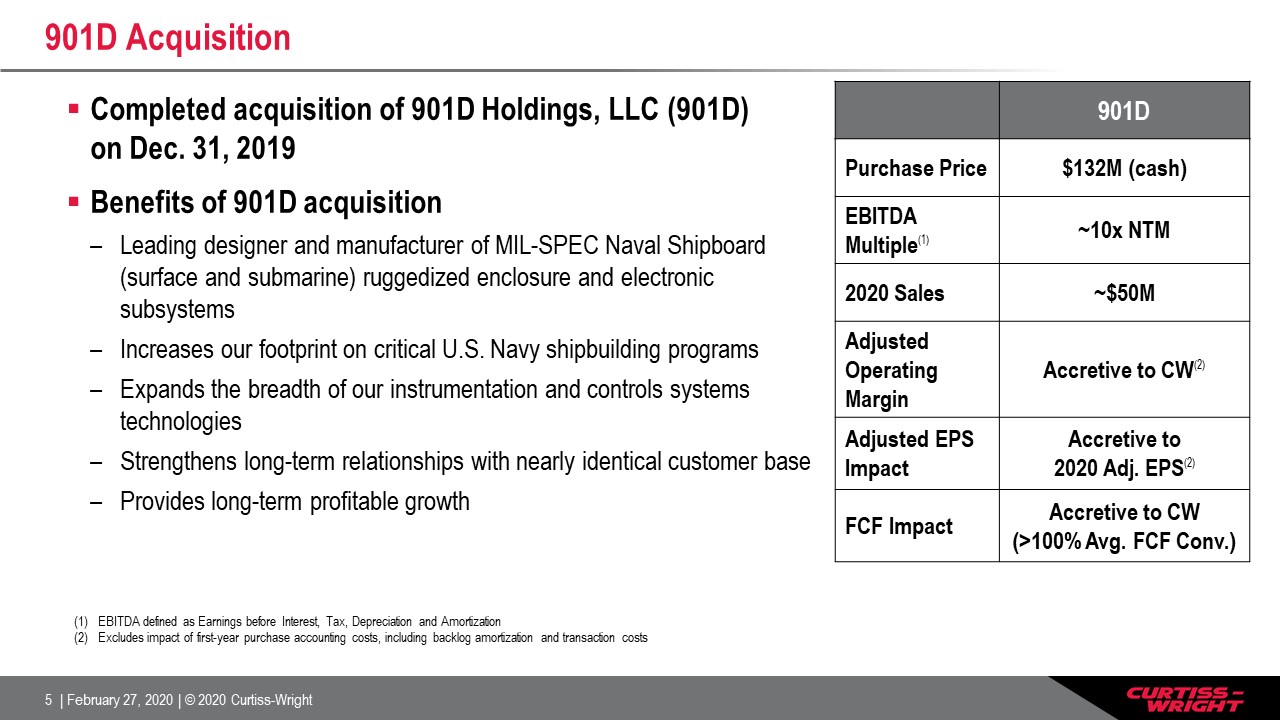
901D Acquisition Completed acquisition of 901D Holdings, LLC (901D) on Dec. 31, 2019Benefits of 901D
acquisitionLeading designer and manufacturer of MIL-SPEC Naval Shipboard (surface and submarine) ruggedized enclosure and electronic subsystemsIncreases our footprint on critical U.S. Navy shipbuilding programsExpands the breadth of our
instrumentation and controls systems technologiesStrengthens long-term relationships with nearly identical customer baseProvides long-term profitable growth 901D Purchase Price $132M (cash) EBITDA Multiple(1) ~10x NTM 2020
Sales ~$50M Adjusted Operating Margin Accretive to CW(2) Adjusted EPS Impact Accretive to 2020 Adj. EPS(2) FCF Impact Accretive to CW(>100% Avg. FCF Conv.) EBITDA defined as Earnings before Interest, Tax, Depreciation and
Amortization Excludes impact of first-year purchase accounting costs, including backlog amortization and transaction costs

2020E End Market Sales Growth (Guidance as of February 26, 2020) 2019 2020E 2020E % Total
Sales Key Drivers Aero Defense 11% 4% - 6% 16% Favorable growth on key platforms (esp. F-35) Ground Defense (4%) 5% - 7% 4% Modernization of U.S. ground platforms Naval Defense 17% 12% - 14% 25% Strong DoD support for
submarines and aircraft carriersContribution from 901D acquisition Total Defense 12% 8% - 10% 45% Organic growth up 4% - 6% Commercial Aero 4% 0% - 2% 17% Higher sales on Airbus platformsBoeing ~Flat (impact of MAX) Power
Generation (9%) 3% - 5% 16% Higher CAP1000 program revenues (timing) Part. offset by lower Int’l aftermarket (U.S. market flat) General Industrial (4%) Flat 22% In-line with global GDP growth rate (flat) Total Commercial
(3%) 0% - 2% 55% Total Curtiss-Wright 3% 4% - 6% 100% Organic growth up 2% - 4%
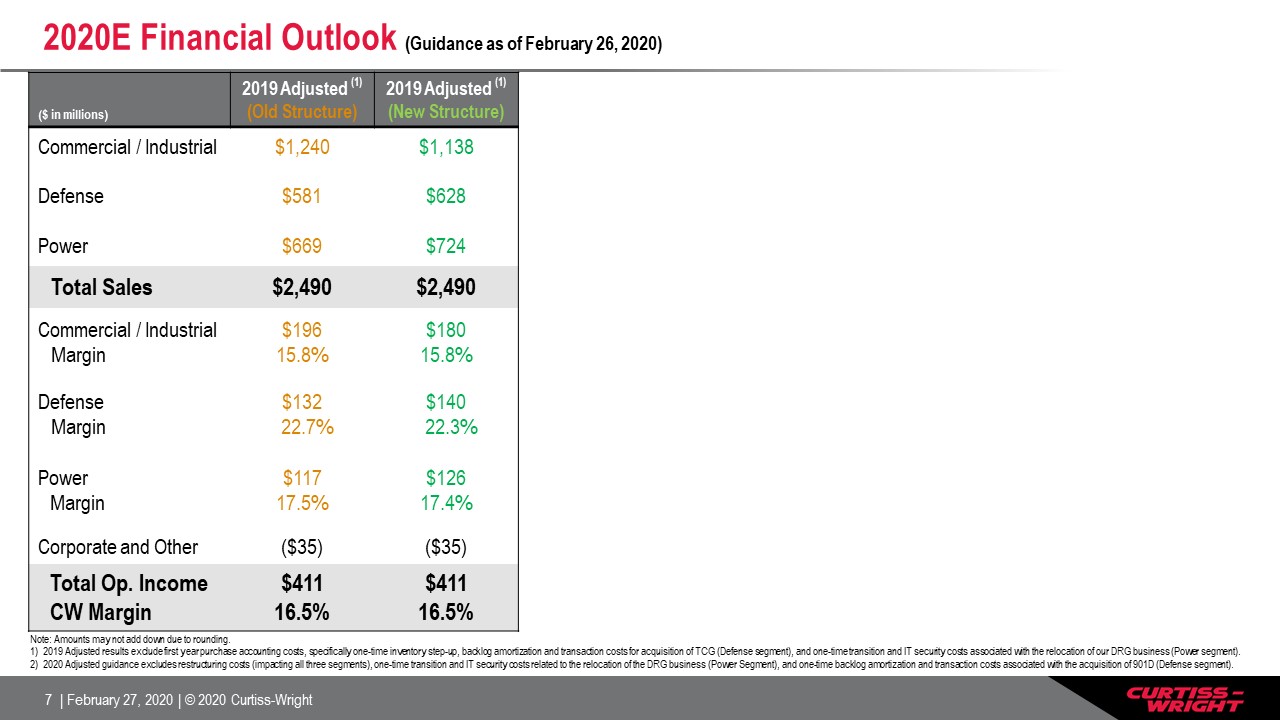
($ in millions) 2019 Adjusted (1)(Old Structure) 2019 Adjusted (1)(New Structure) Commercial /
Industrial $1,240 $1,138 Defense $581 $628 Power $669 $724 Total Sales $2,490 $2,490 Commercial / IndustrialMargin $19615.8% $18015.8% DefenseMargin $132 22.7% $140 22.3% PowerMargin $11717.5% $12617.4% Corporate and
Other ($35) ($35) Total Op. IncomeCW Margin $41116.5% $41116.5% 2020E Financial Outlook (Guidance as of February 26, 2020) Note: Amounts may not add down due to rounding. 2019 Adjusted results exclude first year purchase accounting
costs, specifically one-time inventory step-up, backlog amortization and transaction costs for acquisition of TCG (Defense segment), and one-time transition and IT security costs associated with the relocation of our DRG business (Power
segment).2020 Adjusted guidance excludes restructuring costs (impacting all three segments), one-time transition and IT security costs related to the relocation of the DRG business (Power Segment), and one-time backlog amortization and
transaction costs associated with the acquisition of 901D (Defense segment).
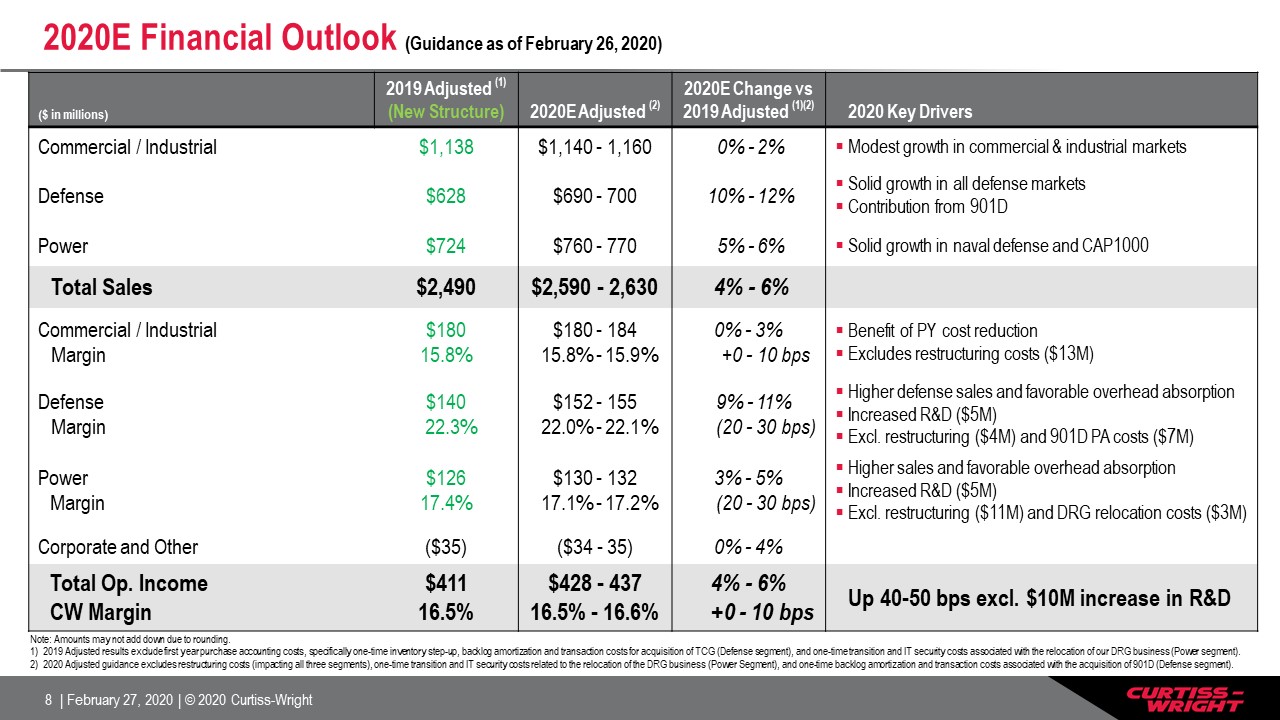
($ in millions) 2019 Adjusted (1)(New Structure) 2020E Adjusted (2) 2020E Change vs 2019 Adjusted
(1)(2) 2020 Key Drivers Commercial / Industrial $1,138 $1,140 - 1,160 0% - 2% Modest growth in commercial & industrial markets Defense $628 $690 - 700 10% - 12% Solid growth in all defense marketsContribution from 901D
Power $724 $760 - 770 5% - 6% Solid growth in naval defense and CAP1000 Total Sales $2,490 $2,590 - 2,630 4% - 6% Commercial / IndustrialMargin $18015.8% $180 - 184 15.8% - 15.9% 0% - 3% +0 - 10 bps Benefit of PY cost
reductionExcludes restructuring costs ($13M) DefenseMargin $140 22.3% $152 - 155 22.0% - 22.1% 9% - 11% (20 - 30 bps) Higher defense sales and favorable overhead absorption Increased R&D ($5M)Excl. restructuring ($4M) and 901D PA
costs ($7M) PowerMargin $12617.4% $130 - 132 17.1% - 17.2% 3% - 5% (20 - 30 bps) Higher sales and favorable overhead absorption Increased R&D ($5M)Excl. restructuring ($11M) and DRG relocation costs ($3M) Corporate and
Other ($35) ($34 - 35) 0% - 4% Total Op. IncomeCW Margin $41116.5% $428 - 43716.5% - 16.6% 4% - 6% +0 - 10 bps Up 40-50 bps excl. $10M increase in R&D 2020E Financial Outlook (Guidance as of February 26, 2020) Note: Amounts
may not add down due to rounding. 2019 Adjusted results exclude first year purchase accounting costs, specifically one-time inventory step-up, backlog amortization and transaction costs for acquisition of TCG (Defense segment), and one-time
transition and IT security costs associated with the relocation of our DRG business (Power segment).2020 Adjusted guidance excludes restructuring costs (impacting all three segments), one-time transition and IT security costs related to the
relocation of the DRG business (Power Segment), and one-time backlog amortization and transaction costs associated with the acquisition of 901D (Defense segment).
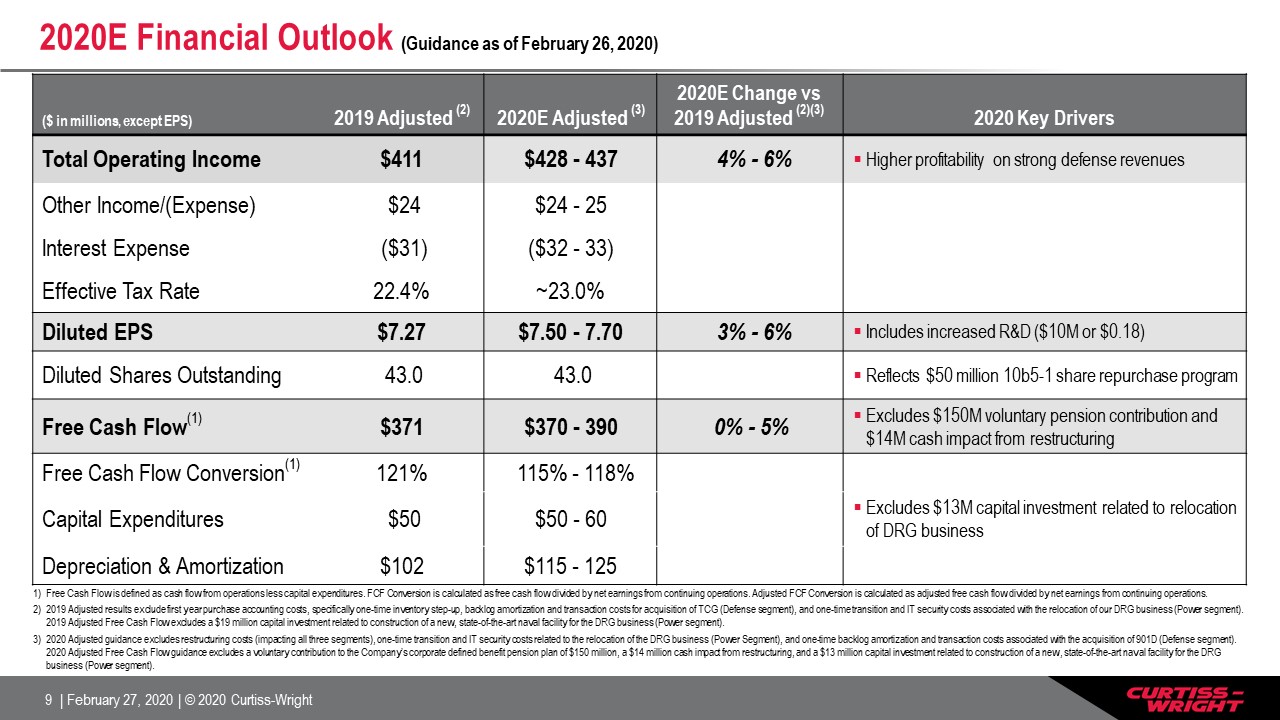
2020E Financial Outlook (Guidance as of February 26, 2020) ($ in millions, except EPS) 2019 Adjusted
(2) 2020E Adjusted (3) 2020E Change vs 2019 Adjusted (2)(3) 2020 Key Drivers Total Operating Income $411 $428 - 437 4% - 6% Higher profitability on strong defense revenues Other Income/(Expense) $24 $24 - 25 Interest
Expense ($31) ($32 - 33) Effective Tax Rate 22.4% ~23.0% Diluted EPS $7.27 $7.50 - 7.70 3% - 6% Includes increased R&D ($10M or $0.18) Diluted Shares Outstanding 43.0 43.0 Reflects $50 million 10b5-1 share
repurchase program Free Cash Flow(1) $371 $370 - 390 0% - 5% Excludes $150M voluntary pension contribution and $14M cash impact from restructuring Free Cash Flow Conversion(1) 121% 115% - 118% Capital Expenditures $50 $50 -
60 Excludes $13M capital investment related to relocation of DRG business Depreciation & Amortization $102 $115 - 125 Free Cash Flow is defined as cash flow from operations less capital expenditures. FCF Conversion is
calculated as free cash flow divided by net earnings from continuing operations. Adjusted FCF Conversion is calculated as adjusted free cash flow divided by net earnings from continuing operations.2019 Adjusted results exclude first year
purchase accounting costs, specifically one-time inventory step-up, backlog amortization and transaction costs for acquisition of TCG (Defense segment), and one-time transition and IT security costs associated with the relocation of our DRG
business (Power segment). 2019 Adjusted Free Cash Flow excludes a $19 million capital investment related to construction of a new, state-of-the-art naval facility for the DRG business (Power segment).2020 Adjusted guidance excludes
restructuring costs (impacting all three segments), one-time transition and IT security costs related to the relocation of the DRG business (Power Segment), and one-time backlog amortization and transaction costs associated with the
acquisition of 901D (Defense segment). 2020 Adjusted Free Cash Flow guidance excludes a voluntary contribution to the Company’s corporate defined benefit pension plan of $150 million, a $14 million cash impact from restructuring, and a $13
million capital investment related to construction of a new, state-of-the-art naval facility for the DRG business (Power segment).
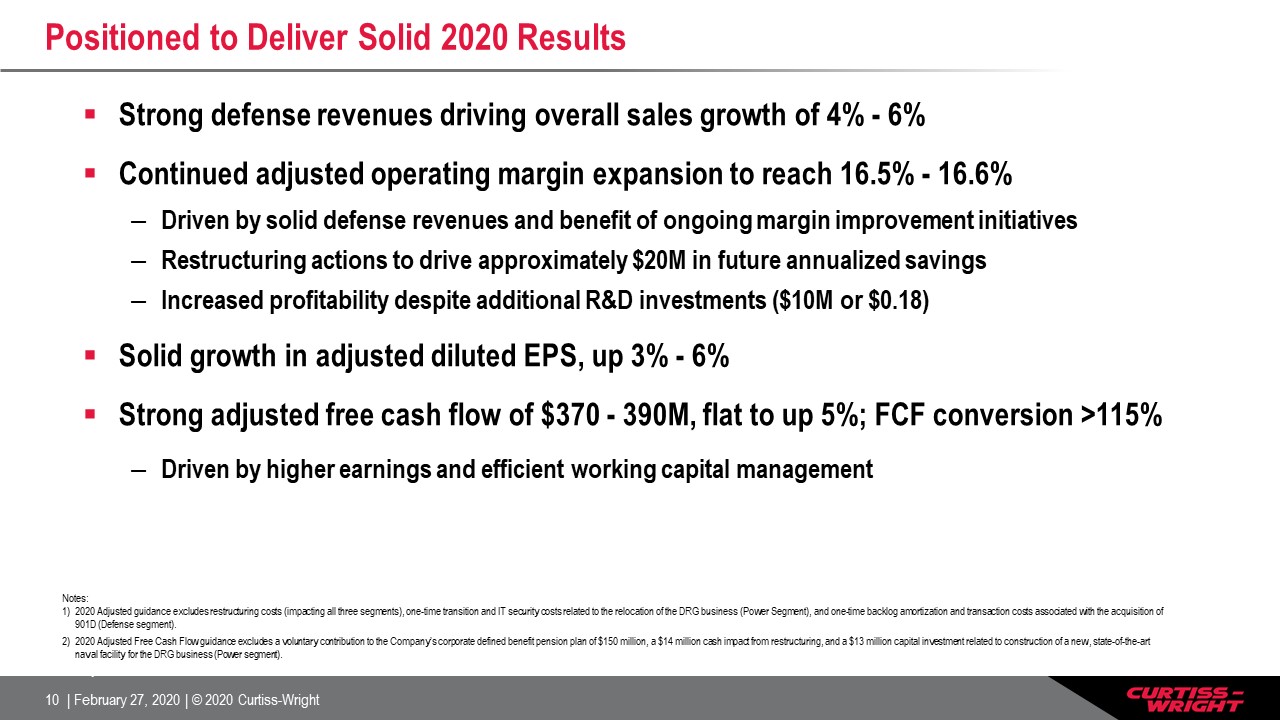
Positioned to Deliver Solid 2020 Results Strong defense revenues driving overall sales growth of 4% -
6%Continued adjusted operating margin expansion to reach 16.5% - 16.6% Driven by solid defense revenues and benefit of ongoing margin improvement initiativesRestructuring actions to drive approximately $20M in future annualized savings
Increased profitability despite additional R&D investments ($10M or $0.18)Solid growth in adjusted diluted EPS, up 3% - 6%Strong adjusted free cash flow of $370 - 390M, flat to up 5%; FCF conversion >115% Driven by higher earnings and
efficient working capital management Notes: 2020 Adjusted guidance excludes restructuring costs (impacting all three segments), one-time transition and IT security costs related to the relocation of the DRG business (Power Segment), and
one-time backlog amortization and transaction costs associated with the acquisition of 901D (Defense segment). 2020 Adjusted Free Cash Flow guidance excludes a voluntary contribution to the Company’s corporate defined benefit pension plan of
$150 million, a $14 million cash impact from restructuring, and a $13 million capital investment related to construction of a new, state-of-the-art naval facility for the DRG business (Power segment).Any
Appendix Non-GAAP Financial Results The company reports its financial performance in accordance with
accounting principles generally accepted in the United States of America ("GAAP"). This press release refers to "Adjusted" amounts, which are Non-GAAP financial measures described below. We utilize a number of different financial measures in
analyzing and assessing the overall performance of our business, and in making operating decisions, forecasting and planning for future periods. We consider the use of the non-GAAP measures to be helpful in assessing the performance of the
ongoing operation of our business. We believe that disclosing non-GAAP financial measures provides useful supplemental data that, while not a substitute for financial measures prepared in accordance with GAAP, allows for greater transparency
in the review of our financial and operational performance. The Company’s presentation of its financials and guidance includes an Adjusted (non-GAAP) view that excludes first year purchase accounting costs associated with its acquisitions,
as well as one-time transition and IT security costs, and capital investments, specifically associated with the relocation of the DRG business in the Power segment. Transition costs include relocation of employees and equipment as well as
overlapping facility and labor costs associated with the relocation. The Company is also excluding significant restructuring costs in 2020 associated with its operations. We believe this Adjusted view will provide improved transparency to the
investment community in order to better measure Curtiss-Wright’s ongoing operating and financial performance and better comparisons of our key financial metrics to our peers. Reconciliations of “Reported” GAAP amounts to “Adjusted” non-GAAP
amounts are furnished with this presentation. All per share amounts are reported on a diluted basis. The following definitions are provided: Adjusted Operating Income, Operating Margin, Net Income and Diluted EPSThese Adjusted financials are
defined as Reported Operating Income, Operating Margin, Net Income and Diluted EPS under GAAP excluding the impact of first year purchase accounting costs associated with acquisitions for current and prior year periods, specifically one-time
inventory step-up, backlog amortization and transaction costs; one-time transition and IT security costs associated with the relocation of a business; and significant restructuring costs in 2020 associated with its operations.Organic Sales
and Organic Operating IncomeThe Corporation discloses organic sales and organic operating income because the Corporation believes it provides investors with insight as to the Company’s ongoing business performance. Organic sales and organic
operating income are defined as revenue and operating income excluding the impact of foreign currency fluctuations and contributions from acquisitions made during the last twelve months.Free Cash Flow and Free Cash Flow ConversionThe
Corporation discloses free cash flow because it measures cash flow available for investing and financing activities. Free cash flow represents cash available to repay outstanding debt, invest in the business, acquire businesses, return
capital to shareholders and make other strategic investments. Free cash flow is defined as cash flow provided by operating activities less capital expenditures. Adjusted free cash flow excludes a capital investment in the Power segment
related to the new, state-of-the-art naval facility principally for DRG, voluntary contributions to the Company’s corporate defined benefit pension plan made in the first quarters of 2018 and 2020, and the cash impact from restructuring in
2020. The Corporation discloses free cash flow conversion because it measures the proportion of net earnings converted into free cash flow and is defined as free cash flow divided by net earnings from continuing operations.
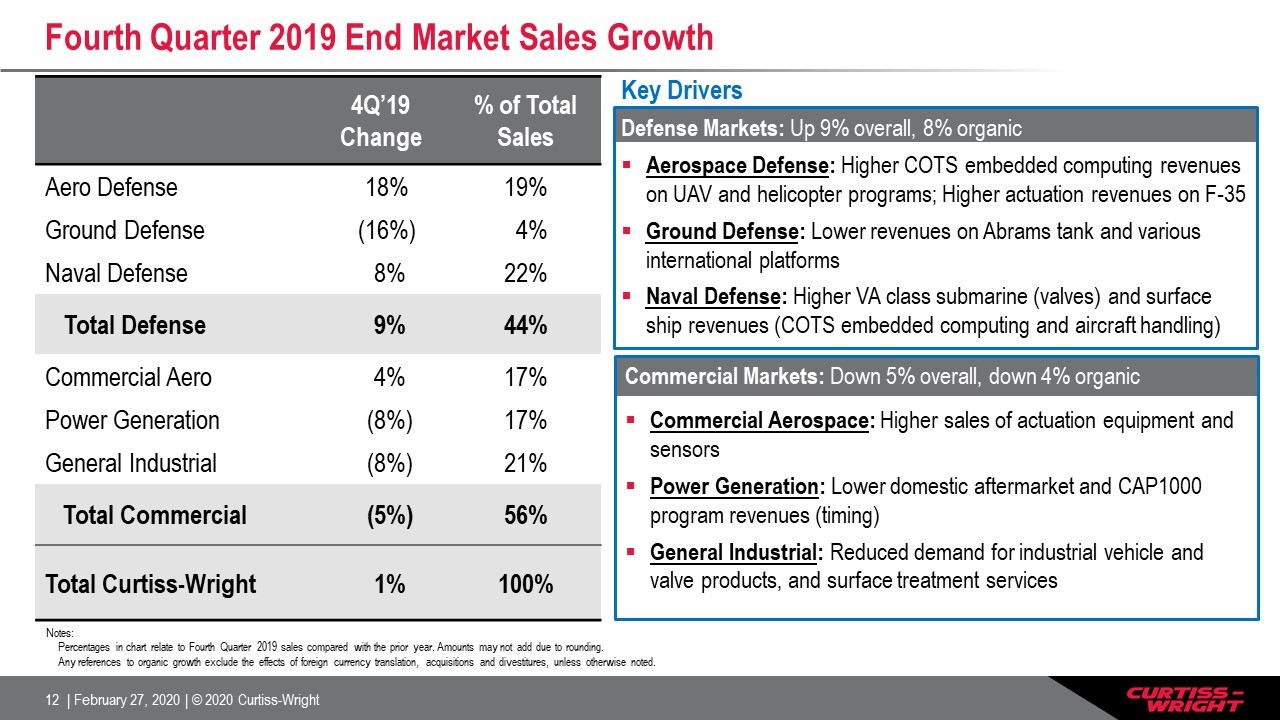
Fourth Quarter 2019 End Market Sales Growth Notes: Percentages in chart relate to Fourth Quarter
2019 sales compared with the prior year. Amounts may not add due to rounding.Any references to organic growth exclude the effects of foreign currency translation, acquisitions and divestitures, unless otherwise noted. 4Q’19Change % of
Total Sales Aero Defense 18% 19% Ground Defense (16%) 4% Naval Defense 8% 22% Total Defense 9% 44% Commercial Aero 4% 17% Power Generation (8%) 17% General Industrial (8%) 21% Total Commercial
(5%) 56% Total Curtiss-Wright 1% 100% Commercial Markets: Down 5% overall, down 4% organicCommercial Aerospace: Higher sales of actuation equipment and sensorsPower Generation: Lower domestic aftermarket and CAP1000 program revenues
(timing)General Industrial: Reduced demand for industrial vehicle and valve products, and surface treatment services Key DriversDefense Markets: Up 9% overall, 8% organicAerospace Defense: Higher COTS embedded computing revenues on UAV and
helicopter programs; Higher actuation revenues on F-35Ground Defense: Lower revenues on Abrams tank and various international platformsNaval Defense: Higher VA class submarine (valves) and surface ship revenues (COTS embedded computing and
aircraft handling)
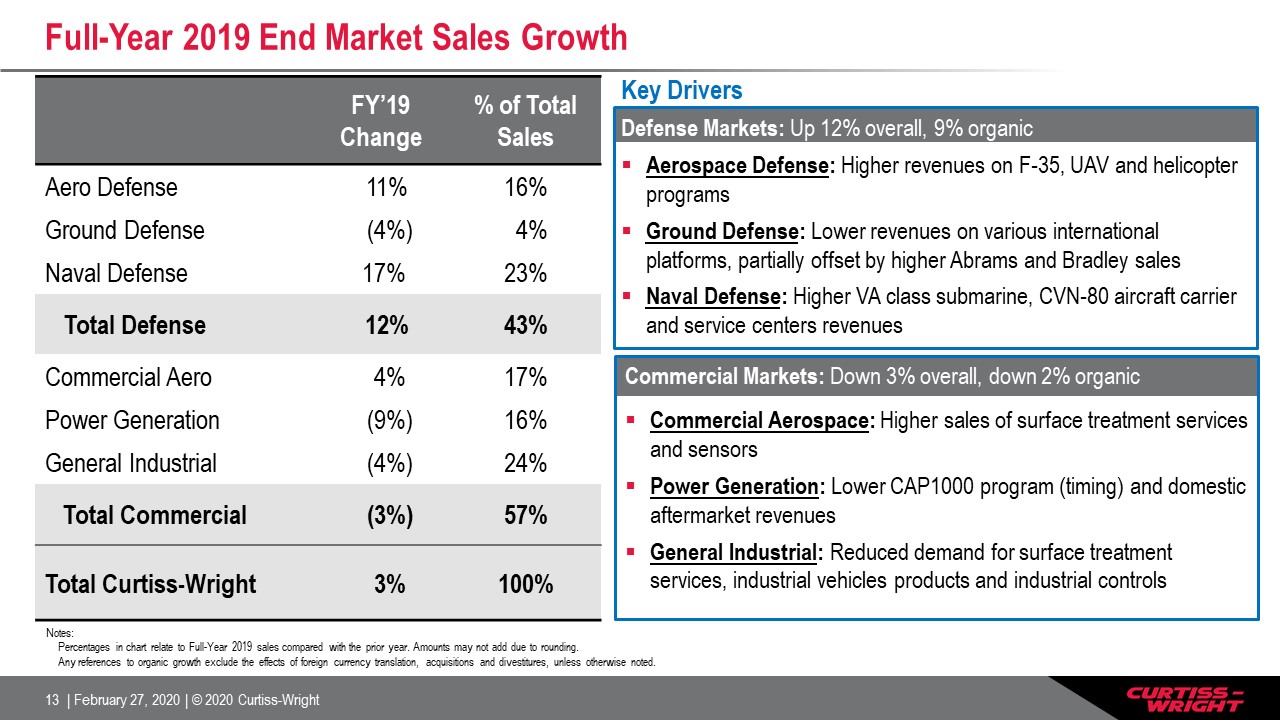
Full-Year 2019 End Market Sales Growth Notes: Percentages in chart relate to Full-Year 2019 sales
compared with the prior year. Amounts may not add due to rounding.Any references to organic growth exclude the effects of foreign currency translation, acquisitions and divestitures, unless otherwise noted. FY’19Change % of Total
Sales Aero Defense 11% 16% Ground Defense (4%) 4% Naval Defense 17% 23% Total Defense 12% 43% Commercial Aero 4% 17% Power Generation (9%) 16% General Industrial (4%) 24% Total Commercial (3%) 57% Total
Curtiss-Wright 3% 100% Commercial Markets: Down 3% overall, down 2% organicCommercial Aerospace: Higher sales of surface treatment services and sensorsPower Generation: Lower CAP1000 program (timing) and domestic aftermarket
revenuesGeneral Industrial: Reduced demand for surface treatment services, industrial vehicles products and industrial controls Key DriversDefense Markets: Up 12% overall, 9% organicAerospace Defense: Higher revenues on F-35, UAV and
helicopter programsGround Defense: Lower revenues on various international platforms, partially offset by higher Abrams and Bradley salesNaval Defense: Higher VA class submarine, CVN-80 aircraft carrier and service centers revenues
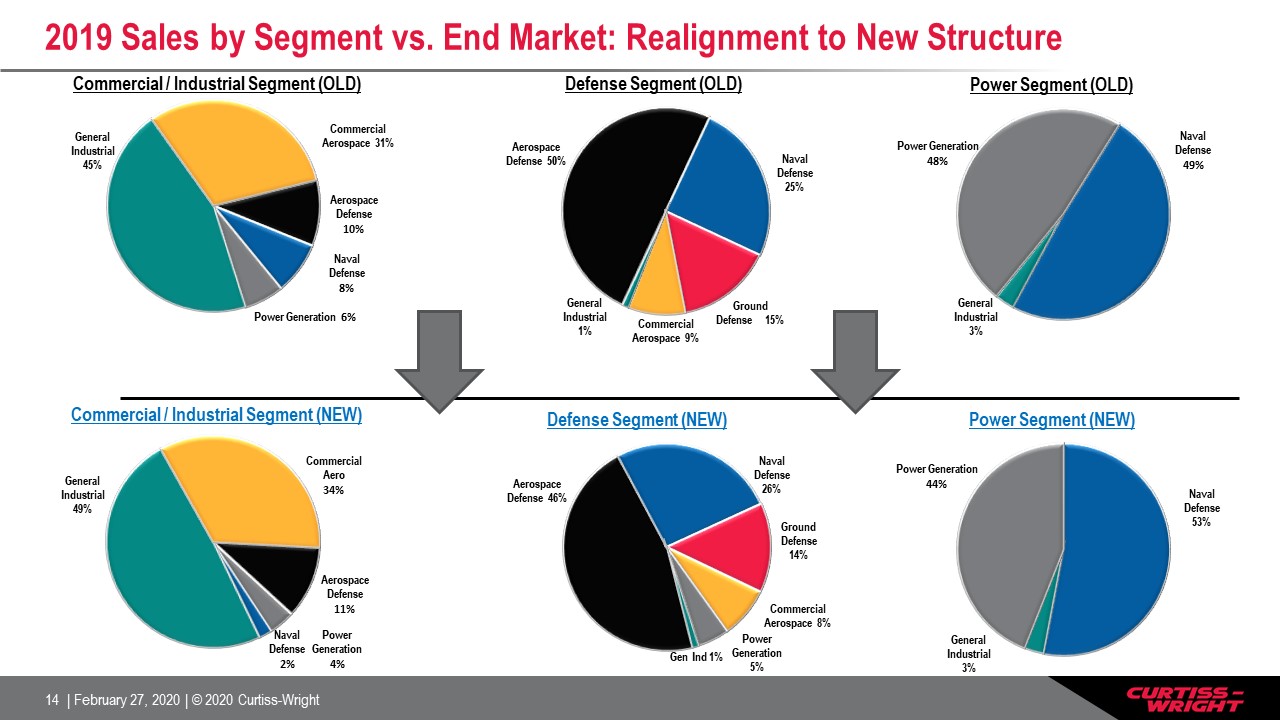
2019 Sales by Segment vs. End Market: Realignment to New Structure Power Segment (OLD) Commercial
Aerospace 31% Commercial Aerospace 9% Ground Defense 15% Commercial Aerospace 8% Commercial / Industrial Segment (NEW) Defense Segment (OLD) Defense Segment (NEW) Commercial / Industrial Segment (OLD) Power Segment (NEW)
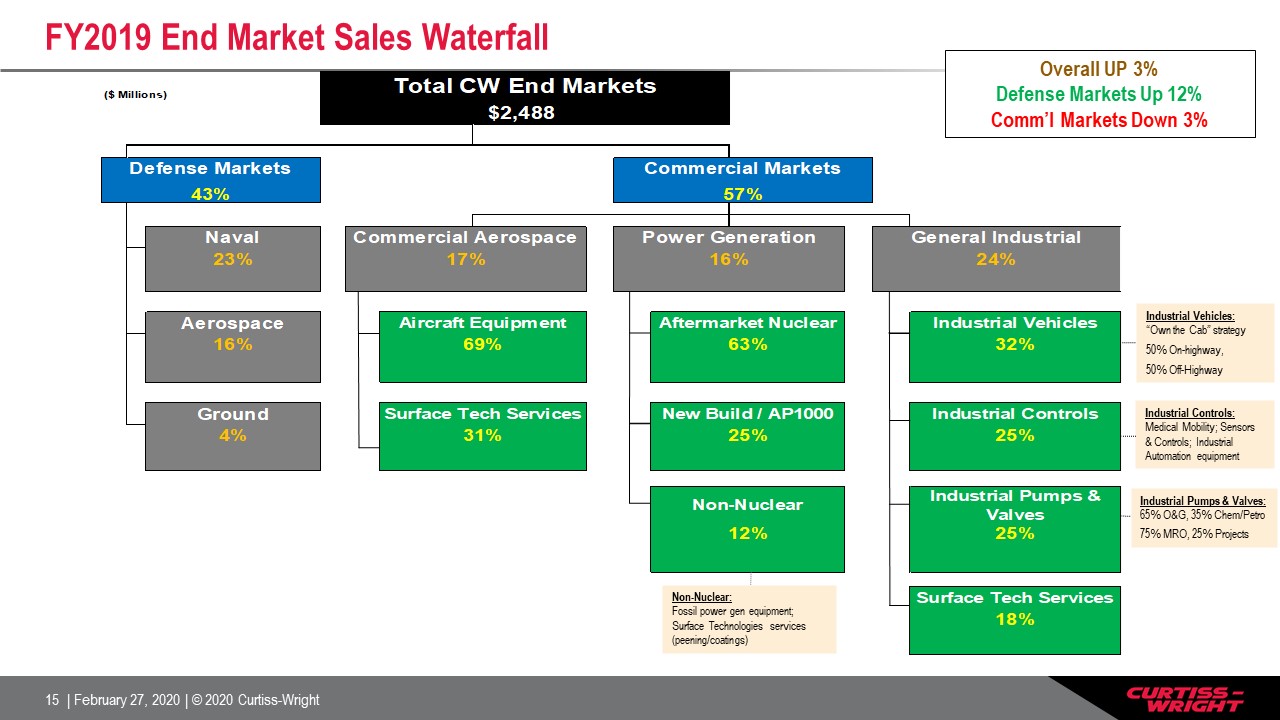
FY2019 End Market Sales Waterfall Non-Nuclear:Fossil power gen equipment; Surface Technologies
services (peening/coatings) Industrial Pumps & Valves:65% O&G, 35% Chem/Petro75% MRO, 25% Projects Industrial Vehicles:“Own the Cab” strategy50% On-highway,50% Off-Highway Industrial Controls:Medical Mobility; Sensors &
Controls; Industrial Automation equipment Overall UP 3%Defense Markets Up 12%Comm’l Markets Down 3%
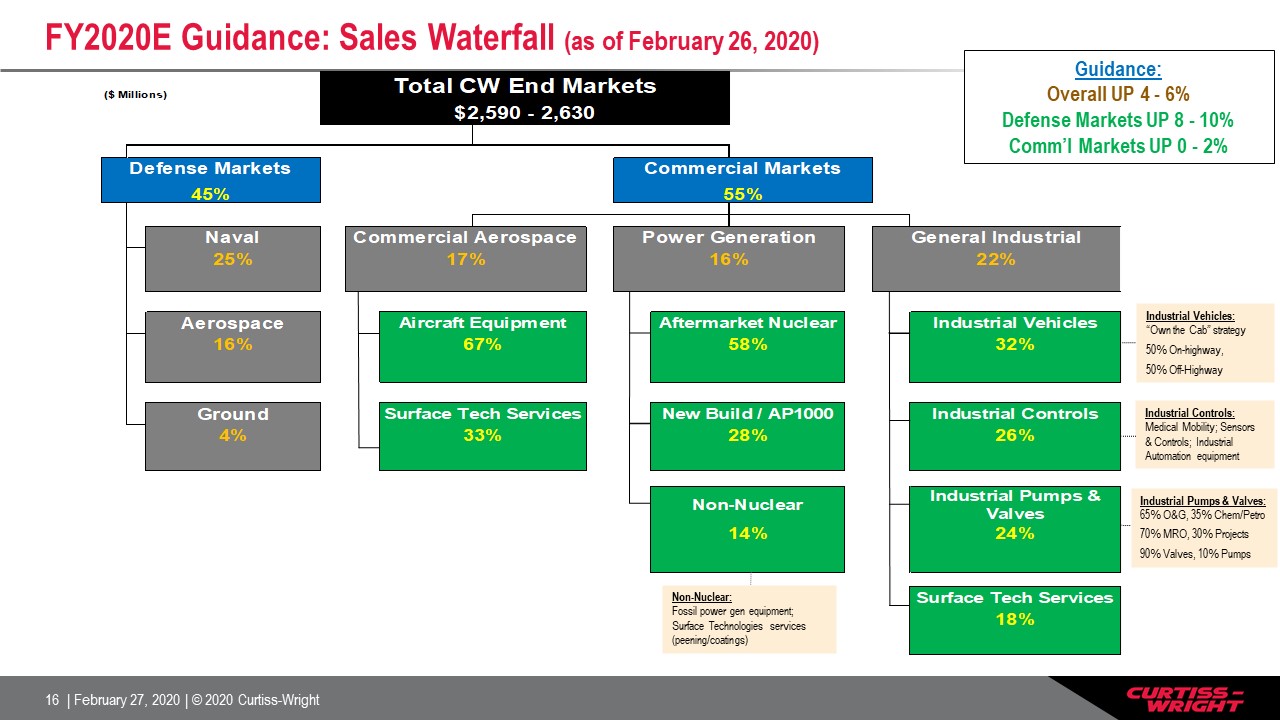
FY2020E Guidance: Sales Waterfall (as of February 26, 2020) Non-Nuclear:Fossil power gen equipment;
Surface Technologies services (peening/coatings) Industrial Pumps & Valves:65% O&G, 35% Chem/Petro70% MRO, 30% Projects90% Valves, 10% Pumps Industrial Vehicles:“Own the Cab” strategy50% On-highway,50% Off-Highway Industrial
Controls:Medical Mobility; Sensors & Controls; Industrial Automation equipment Guidance:Overall UP 4 - 6%Defense Markets UP 8 - 10%Comm’l Markets UP 0 - 2%
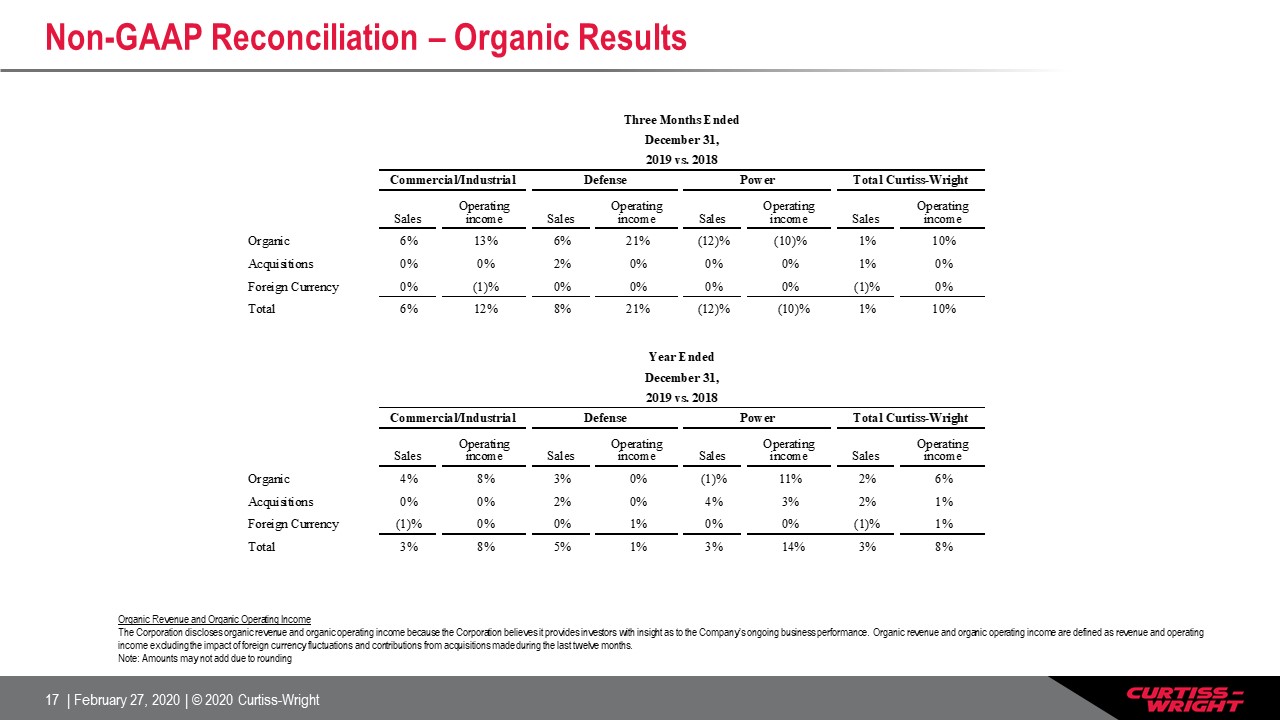
Non-GAAP Reconciliation – Organic Results Organic Revenue and Organic Operating Income
The Corporation discloses organic revenue and organic operating income because the Corporation believes it provides investors with insight as to the Company’s ongoing business performance. Organic revenue and organic operating income are
defined as revenue and operating income excluding the impact of foreign currency fluctuations and contributions from acquisitions made during the last twelve months. Note: Amounts may not add due to rounding
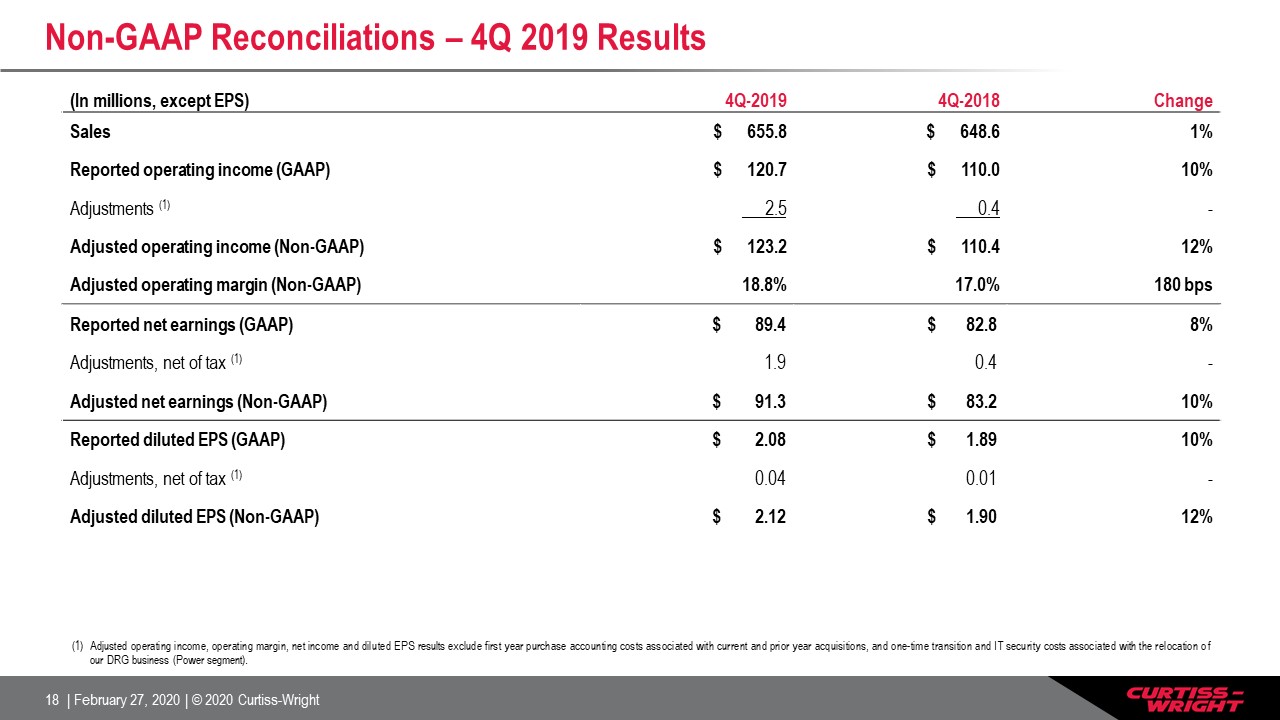
Non-GAAP Reconciliations – 4Q 2019 Results (In millions, except EPS) 4Q-2019 4Q-2018
Change Sales $ 655.8 $ 648.6 1% Reported operating income (GAAP) $ 120.7 $ 110.0 10% Adjustments (1) 2.5 0.4 - Adjusted operating income (Non-GAAP) $ 123.2 $ 110.4 12% Adjusted operating margin (Non-GAAP)
18.8% 17.0% 180 bps Reported net earnings (GAAP) $ 89.4 $ 82.8 8% Adjustments, net of tax (1) 1.9 0.4 - Adjusted net earnings (Non-GAAP) $ 91.3 $ 83.2 10% Reported diluted EPS (GAAP) $ 2.08 $ 1.89 10% Adjustments, net of
tax (1) 0.04 0.01 - Adjusted diluted EPS (Non-GAAP) $ 2.12 $ 1.90 12% Adjusted operating income, operating margin, net income and diluted EPS results exclude first year purchase accounting costs associated with current and prior year
acquisitions, and one-time transition and IT security costs associated with the relocation of our DRG business (Power segment).
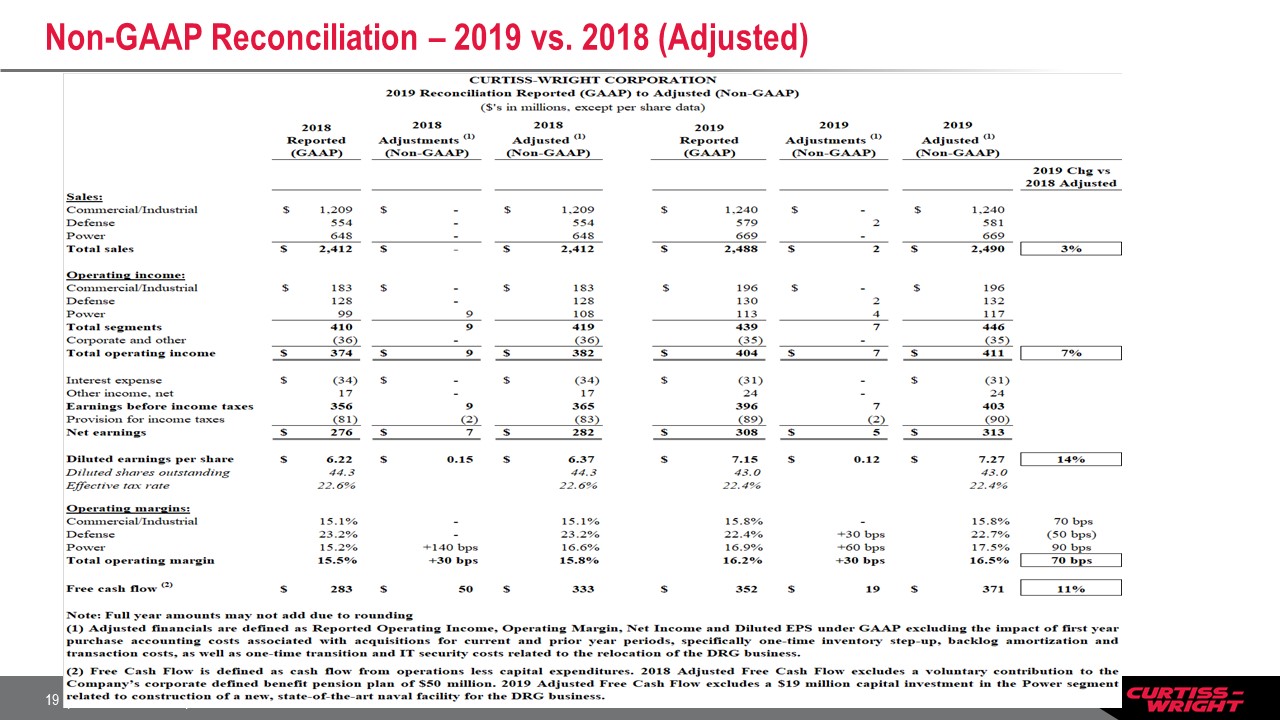
Non-GAAP Reconciliation – 2019 vs. 2018 (Adjusted)
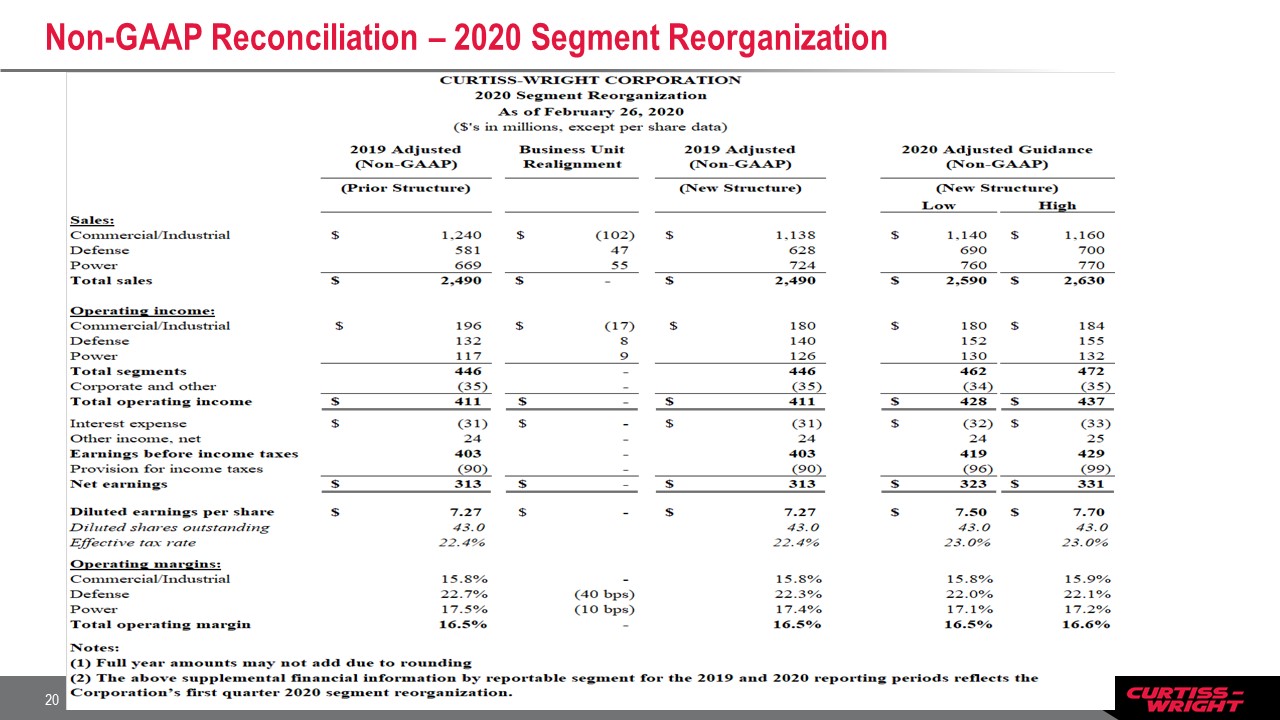
Non-GAAP Reconciliation – 2020 Segment Reorganization
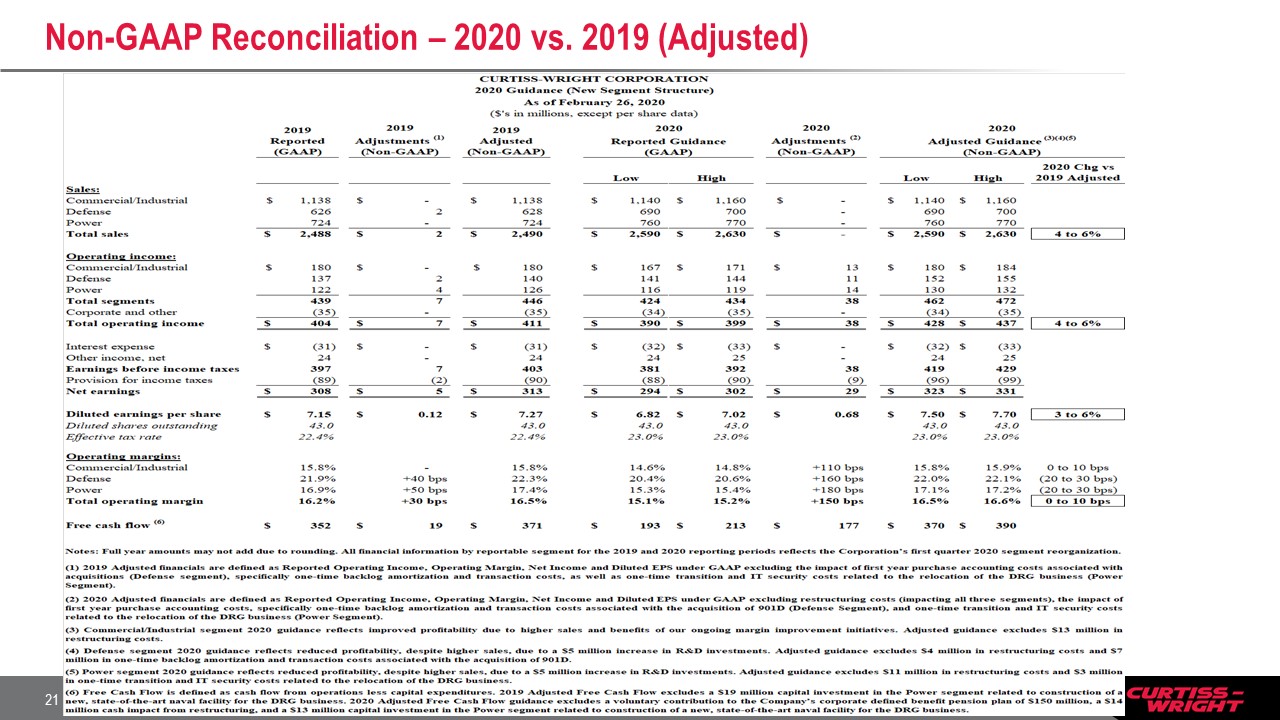
Non-GAAP Reconciliation – 2020 vs. 2019 (Adjusted)