Attached files
| file | filename |
|---|---|
| 8-K - 8-K - BP Midstream Partners LP | bpmp-20200227.htm |
| FOR IMMEDIATE RELEASE |  | ||||
BP Midstream Partners LP (NYSE: BPMP) Exhibit 99.1
BP MIDSTREAM PARTNERS
REPORTS FOURTH QUARTER & FULL YEAR 2019 RESULTS
•Achieved strong operational and financial results in the second full year of operation since IPO.
•Increased annual gross pipeline throughput by ~6% organically.
•Increased Net income attributable to the Partnership by ~26% and Adjusted EBITDA attributable to the Partnership by ~31% compared with 2018.
•2019 full year Cash available for distribution was $180.4 million, an increase of ~25% compared with 2018 - above the top end of guidance range.
•Declared quarterly cash distribution of 34.75 cents per unit for the fourth quarter of 2019, an increase of 3.6% over the third quarter of 2019.
•Target Cash available for distribution of $185-195 million and ~10% distribution growth in 2020.
HOUSTON, February 27, 2020 - BP Midstream Partners LP (“BPMP” or the “Partnership”) today reported financial results for the fourth quarter and full year 2019.
Commenting on the results, CEO Rip Zinsmeister said: “In 2019, we delivered unitholders mid-teens distribution growth without another dropdown transaction. Operational results were consistently strong, with our asset portfolio demonstrating resilience and organic growth throughout the year. And we finished 2019 with strong financial performance, with Cash available for distribution exceeding the top end of our guidance range. We increased cash on the balance sheet by around $40 million during the year, allowing us to self-fund some attractive organic growth opportunities in 2020, as well as to target distribution growth of ~10% in 2020 excluding a dropdown.”
Operational results
During the fourth quarter, total pipeline gross throughput was more than 1.7 million barrels of oil equivalent per day, higher than the third quarter of 2019, reflecting the recovery of offshore volumes from weather impacts in the Gulf of Mexico in the third quarter, increased throughput on the Proteus and Endymion pipelines due to the ramp up of the Shell-operated Appomattox offshore facility and stronger volumes on the River Rouge pipeline than planned. This was partly offset by lower volumes on the BP2 pipeline due to slightly higher levels of apportionment during the quarter, offshore producer maintenance in the Gulf of Mexico, as well as schedule slippage of new well development by offshore producers from the fourth quarter to early 2020.
For the full year 2019, total pipeline gross throughput was around 1.7 million barrels of oil equivalent per day, representing a ~6% increase compared with 2018. This increase was driven by higher throughput on BP2 with BP’s Whiting refinery continuing to perform well notwithstanding apportionment on the Enbridge mainline, and higher throughput on Mars and Ursa reflecting continued new well development at several fields connected to the offshore facilities tied into these two pipelines.
Financial results
GAAP Measures:
•Net income attributable to the Partnership in the fourth quarter was $47.6 million (or $0.45 per unit). Full year results were $167.9 million (or $1.58 per unit).
•Cash from operating activities was $47.1 million for the fourth quarter and $189.3 million for the year ended December 31, 2019.
•Cash on hand was $98.8 million at December 31, 2019.
•Outstanding borrowings were $468.0 million under our $600.0 million unsecured revolving credit facility with an affiliate of BP, at December 31, 2019.
1
| FOR IMMEDIATE RELEASE | | ||||
Non-GAAP Measures:
•Adjusted EBITDA* attributable to the Partnership in the fourth quarter was $54.2 million. Full year Adjusted EBITDA attributable to the Partnership was $196.3 million.
•Cash available for distribution* attributable to the Partnership generated in the fourth quarter was $52.8 million. Full year Cash available for distribution was $180.4 million.
•Quarterly cash distribution: On January 16, 2020, the board of directors of the general partner of BPMP declared an increased quarterly cash distribution of $0.3475 per unit for the fourth quarter of 2019.
•Distribution coverage ratio was 1.41 times for the fourth quarter and 1.28 times for full year.
* Adjusted EBITDA and cash available for distribution are Non-GAAP supplemental financial measures. See reconciliation tables later in this press release.
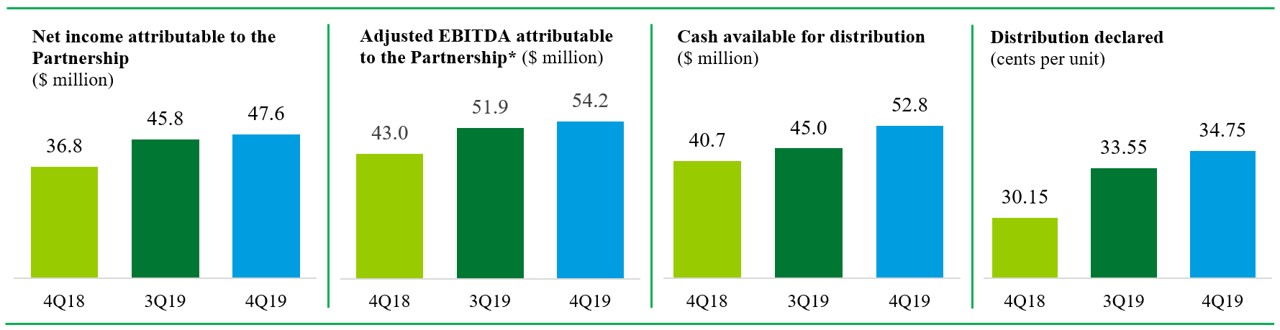
Net income attributable to the Partnership for the fourth quarter was $47.6 million. This was ~4% higher compared with the third quarter of 2019, and ~29% higher than the same period in 2018.
Adjusted EBITDA attributable to the Partnership for the fourth quarter was $54.2 million, ~4% higher compared with the third quarter of 2019 and ~26% higher than the same period in 2018.
Cash available for distribution for the fourth quarter was $52.8 million, ~17% higher compared with the third quarter of 2019 and ~30% higher than the same period in 2018. Cash available for distribution in the fourth quarter was favorably impacted by the release of cash associated with throughput on the River Rouge pipeline being above the minimum volume commitment.
On a full year basis, Adjusted EBITDA attributable to the Partnership and Cash available for distribution increased by ~31% and ~25% respectively compared with 2018. Cash available for distribution was $180.4 million, above the top end of the guidance range, with volumes on River Rouge and Diamondback higher than planned, mid-year tariff increases across all onshore pipelines higher than expected and inspection costs relating to Diamondback lower than planned.
2
| FOR IMMEDIATE RELEASE | | ||||
2020 Guidance
BPMP's target distribution growth in 2020 is ~10%, driven by organic growth from existing assets and assuming no drop down.
BPMP has provided the following guidance for 2020:
Annual distribution growth1 | ~10% | ||||
Pipeline gross throughput2 | ~1.8 million boed | ||||
Pipeline average revenue per barrel2,3,4 | Broadly flat with 2019 | ||||
Maintenance: | ~$22 million | ||||
| Expense | |||||
| Wholly owned assets | ~$6 million | ||||
Equity method investments5 | ~$4 million | ||||
| Capex | |||||
Wholly owned assets6 | ~$6 million | ||||
Equity method investments5 | ~$6 million | ||||
Financing costs | ~$3 million lower than 2019 | ||||
| Debt | Gross Debt to Adjusted EBITDA ratio not to exceed 3.5 times; target credit metrics consist with investment grade | ||||
| Distribution coverage ratio | 1.1–1.2 times | ||||
| Adjusted EBITDA attributable to the Partnership | $200-210 million | ||||
| Cash available for distribution | $185-195 million | ||||
(1)Excludes dropdown transaction.
(2)Pipeline gross throughput and average revenue/bbl for Mars, Mardi Gras and Ursa joint ventures are presented on a full year, 100% basis.
(3)Cleopatra gas volumes are converted to mboed by dividing mmscf/d by 5.8.
(4)Portfolio basis.
(5)Maintenance expenses and capex associated with equity method investments are deducted prior to receiving cash distributions.
(6)Includes $4 million relating to Griffith station repairs; we expect to receive insurance proceeds of the same amount in 2020.
Webcast and conference call
A webcast and conference call will be held at 9:00 a.m. CST on February 27, 2020, hosted by Robert Zinsmeister, chief executive officer; Craig Coburn, chief financial officer; and Brian Sullivan, vice president investor relations, to discuss BPMP’s performance in the fourth quarter and full year 2019. Interested parties may listen to the presentation at www.bpmidstreampartners.com, by clicking on the “2019 Fourth Quarter and Full Year Results Webcast” link, found in the "Events & Presentations" section under the Investor Relations menu option. A replay of the webcast will be available following the live event. The Partnership has also posted an investor presentation to its website. Information on the Partnership's website does not constitute a portion of this press release.
About BP Midstream Partners
BPMP is a fee-based, growth-oriented master limited partnership formed by BP Pipelines (North America), Inc. (“BP Pipelines”) to own, operate, develop and acquire pipelines and other midstream assets. BPMP’s assets consist of interests in entities that own crude oil, natural gas, refined products and diluent pipelines, and refined product terminals, serving as key infrastructure for BP and other customers to transport onshore crude oil production to BP’s Whiting Refinery and offshore crude oil and natural gas production to key refining markets and trading and distribution hubs. Certain of BPMP’s assets deliver refined products and diluent from the Whiting Refinery and other U.S. supply hubs to major demand centers.
For more information on BPMP and the assets owned by BPMP, please visit www.bpmidstreampartners.com.
3
| FOR IMMEDIATE RELEASE | | ||||
Cautionary statement
Certain statements contained in this news release constitute “forward-looking statements” within the meaning of Section 27A of the Securities Act of 1933, as amended, and Section 21E of the Securities Exchange Act of 1934, as amended. These forward-looking statements represent BPMP’s expectations or beliefs concerning future events, and it is possible that the results described in this news release will not be achieved. These forward-looking statements are subject to risks, uncertainties and other factors, many of which are outside of BPMP’s control, which could cause actual results to differ materially from the results discussed in the forward-looking statements. Any forward-looking statement speaks only as of the date on which it is made, and, except as required by law, BPMP does not undertake any obligation to update or revise any forward-looking statement, whether as a result of new information, future events or otherwise. New factors emerge from time to time, and it is not possible for BPMP to predict all such factors. When considering these forward-looking statements, you should keep in mind the risk factors and other cautionary statements found in BPMP’s filings with the SEC, including the annual report on Form 10-K for the year ended December 31, 2019 filed with SEC on February 27, 2020. The risk factors and other factors noted in BPMP’s SEC filings could cause its actual results to differ materially from those contained in any forward-looking statement.
Non-GAAP financial measures
This press release includes the terms Adjusted EBITDA and cash available for distribution. Adjusted EBITDA and cash available for distribution are non-GAAP supplemental financial measures that management and external users of our consolidated financial statements, such as industry analysts, investors, lenders and rating agencies, may use to assess:
•our operating performance as compared to other publicly traded partnerships in the midstream energy industry, without regard to historical cost basis or, in the case of Adjusted EBITDA, financing methods;
•the ability of our business to generate sufficient cash to support our decision to make distributions to our unitholders;
•our ability to incur and service debt and fund capital expenditures; and
•the viability of acquisitions and other capital expenditure projects and the returns on investment of various investment opportunities.
We believe that the presentation of Adjusted EBITDA and cash available for distribution provides useful information to investors in assessing our financial condition and results of operations. The GAAP measures most directly comparable to Adjusted EBITDA and cash available for distribution are net income and net cash provided by operating activities, respectively. Adjusted EBITDA and cash available for distribution should not be considered as an alternative to GAAP net income or net cash provided by operating activities.
Adjusted EBITDA and cash available for distribution have important limitations as analytical tools because they exclude some but not all items that affect net income and net cash provided by operating activities. You should not consider Adjusted EBITDA or cash available for distribution in isolation or as a substitute for analysis of our results as reported under GAAP. Additionally, because Adjusted EBITDA and cash available for distribution may be defined differently by other companies in our industry, our definitions of Adjusted EBITDA and cash available for distribution may not be comparable to similarly titled measures of other companies, thereby diminishing their utility.
References to Adjusted EBITDA in this press release refer to net income before net interest expense, income taxes, gain or loss from disposition of property, plant and equipment and depreciation and amortization, plus cash distributed to the Partnership from equity method investments for the applicable period, less income from equity method investments. We define Adjusted EBITDA attributable to the Partnership as Adjusted EBITDA less Adjusted EBITDA attributable to non-controlling interests. We define cash available for distribution as Adjusted EBITDA attributable to the Partnership plus net adjustments from volume deficiency agreements, less maintenance capital expenditures, net interest paid/received, cash reserves, and income taxes paid. Cash available for distribution does not reflect changes in working capital balances.
The Partnership is unable to provide financial guidance for projected net income or net cash provided by operating activities without unreasonable effort, and, therefore, is unable to provide a reconciliation of its Adjusted EBITDA and cash available for distributions projections to net income or net cash provided by operating activities, the most comparable financial measures calculated in accordance with GAAP.
4
| FOR IMMEDIATE RELEASE | | ||||
The Partnership has not included a reconciliation of projected cash available for distribution to the nearest GAAP financial measure for 2019 because it cannot do so without unreasonable effort and any attempt to do so would be inherently imprecise.
Further Information
BP Press Office: uspress@bp.com
BPMP Investor Relations: bpmpir@bp.com
RESULTS OF OPERATIONS (UNAUDITED)
| Three Months Ended December 31, | Twelve Months Ended December 31, | ||||||||||||||||||||||
| (in thousands of dollars, unless otherwise indicated) | 2019 | 2018 | 2019 | 2018 | |||||||||||||||||||
| Revenue | $ | 35,066 | $ | 28,811 | $ | 128,468 | $ | 116,439 | |||||||||||||||
| Costs and expenses | |||||||||||||||||||||||
| Operating expenses | 5,045 | 4,481 | 19,977 | 16,488 | |||||||||||||||||||
| Maintenance expenses | 429 | 1,139 | 1,754 | 2,737 | |||||||||||||||||||
| General and administrative | 4,311 | 5,299 | 16,867 | 18,654 | |||||||||||||||||||
| Depreciation | 660 | 671 | 2,630 | 2,658 | |||||||||||||||||||
| Impairment and other, net | — | — | 1,000 | — | |||||||||||||||||||
| Property and other taxes | 361 | 95 | 722 | 483 | |||||||||||||||||||
| Lease expense | 18 | 16 | 71 | 61 | |||||||||||||||||||
| Total costs and expenses | 10,824 | 11,701 | 43,021 | 41,081 | |||||||||||||||||||
| Operating income | 24,242 | 17,110 | 85,447 | 75,358 | |||||||||||||||||||
| Income from equity method investments | 33,435 | 28,099 | 116,747 | 94,361 | |||||||||||||||||||
| Interest expense, net | 3,817 | 3,924 | 15,127 | 4,043 | |||||||||||||||||||
| Net income | 53,860 | 41,285 | 187,067 | 165,676 | |||||||||||||||||||
| Less: Net income attributable to non-controlling interests | 6,214 | 4,456 | 19,183 | 32,619 | |||||||||||||||||||
| Net income attributable to the Partnership | $ | 47,646 | $ | 36,829 | $ | 167,884 | $ | 133,057 | |||||||||||||||
| Net income attributable to the Partnership per limited partner unit - basic and diluted (in dollars): | |||||||||||||||||||||||
| Common units | $ | 0.45 | $ | 0.35 | $ | 1.58 | $ | 1.27 | |||||||||||||||
| Subordinated units | $ | 0.45 | $ | 0.35 | $ | 1.58 | $ | 1.27 | |||||||||||||||
| Distributions declared per limited partner unit (in dollars): | |||||||||||||||||||||||
| Common units | $ | 0.3475 | $ | 0.3015 | $ | 1.3193 | $ | 1.1330 | |||||||||||||||
| Subordinated units | $ | 0.3475 | $ | 0.3015 | $ | 1.3193 | $ | 1.1330 | |||||||||||||||
| Weighted average number of limited partner units outstanding - basic and diluted (in millions): | |||||||||||||||||||||||
| Common units – public | 47.8 | 47.8 | 47.8 | 47.8 | |||||||||||||||||||
| Common units – BP Holdco | 4.6 | 4.6 | 4.6 | 4.6 | |||||||||||||||||||
| Subordinated units – BP Holdco | 52.4 | 52.4 | 52.4 | 52.4 | |||||||||||||||||||
5
| FOR IMMEDIATE RELEASE | | ||||
ADDITIONAL FINANCIAL DATA
| Three Months Ended | Twelve Months Ended | ||||||||||
| (in thousands of dollars, except per-unit data and ratio data) | December 31, 2019 | December 31, 2019 | |||||||||
| Quarterly distribution declared per unit (in dollars) | $ | 0.3475 | $ | 1.3193 | |||||||
| Adjusted EBITDA attributable to the Partnership | 54,206 | 196,289 | |||||||||
| Cash available for distribution attributable to the Partnership | 52,804 | 180,378 | |||||||||
| Distribution declared: | |||||||||||
| Limited partner units – public | 16,613 | 63,070 | |||||||||
| Limited partner units – BP Holdco | 19,792 | 75,143 | |||||||||
| General partner | 1,162 | 2,506 | |||||||||
| Total distribution declared | 37,567 | 140,719 | |||||||||
| Coverage ratio(1) | 1.41 | 1.28 | |||||||||
(1)Coverage ratio is equal to Cash available for distribution attributable to the Partnership divided by Total distribution declared.
6
| FOR IMMEDIATE RELEASE | | ||||
RECONCILIATION OF ADJUSTED EBITDA AND CASH AVAILABLE FOR DISTRIBUTION TO NET INCOME
| Three Months Ended December 31, | Twelve Months Ended December 31, | ||||||||||||||||||||||
| (in thousands of dollars) | 2019 | 2018 | 2019 | 2018 | |||||||||||||||||||
| Net income | $ | 53,860 | $ | 41,285 | $ | 187,067 | $ | 165,676 | |||||||||||||||
| Add: | |||||||||||||||||||||||
| Depreciation | 660 | 671 | 2,630 | 2,658 | |||||||||||||||||||
| Interest expense, net | 3,817 | 3,924 | 15,127 | 4,043 | |||||||||||||||||||
| Cash distribution received from equity method investments – Mardi Gras Joint Ventures | 20,923 | 17,025 | 66,261 | 67,591 | |||||||||||||||||||
| Cash distribution received from equity method investments – Mars | 13,324 | 11,428 | 53,412 | 47,538 | |||||||||||||||||||
| Cash distribution received from equity method investments – Others | 2,380 | 2,675 | 11,730 | 2,675 | |||||||||||||||||||
| Less: | |||||||||||||||||||||||
| Income from equity method investments – Mardi Gras Joint Ventures | 17,755 | 12,730 | 54,810 | 47,935 | |||||||||||||||||||
| Income from equity method investments – Mars | 13,334 | 12,810 | 51,153 | 43,867 | |||||||||||||||||||
| Income from equity method investments – Others | 2,346 | 2,559 | 10,784 | 2,559 | |||||||||||||||||||
| Adjusted EBITDA | 61,529 | 48,909 | 219,480 | 195,820 | |||||||||||||||||||
| Less: | |||||||||||||||||||||||
| Adjusted EBITDA attributable to non-controlling interests | 7,323 | 5,959 | 23,191 | 46,412 | |||||||||||||||||||
| Adjusted EBITDA attributable to the Partnership | 54,206 | 42,950 | 196,289 | 149,408 | |||||||||||||||||||
| Add: | |||||||||||||||||||||||
| Net adjustments from volume deficiency agreements | 2,792 | 1,853 | — | — | |||||||||||||||||||
Maintenance capital recovery(1) | 282 | — | 282 | — | |||||||||||||||||||
| Less: | |||||||||||||||||||||||
| Net interest paid/(received) | 3,770 | (76) | 15,112 | 50 | |||||||||||||||||||
| Maintenance capital expenditures | 706 | 263 | 1,081 | 1,604 | |||||||||||||||||||
Cash reserves(2) | — | 3,882 | — | 3,882 | |||||||||||||||||||
| Cash available for distribution attributable to the Partnership | $ | 52,804 | $ | 40,734 | $ | 180,378 | $ | 143,872 | |||||||||||||||
(1)Relates to the portion of maintenance capital for Griffith Station Incident reimbursable by insurance.
(2)Acquisition financing expenses.
7
| FOR IMMEDIATE RELEASE | | ||||
RECONCILIATION OF ADJUSTED EBITDA AND CASH AVAILABLE FOR DISTRIBUTION TO NET CASH PROVIDED BY OPERATING ACTIVITIES
| Three Months Ended December 31, | Twelve Months Ended December 31, | ||||||||||||||||||||||
| (in thousands of dollars) | 2019 | 2018 | 2019 | 2018 | |||||||||||||||||||
| Net cash provided by operating activities | $ | 47,102 | $ | 40,297 | $ | 189,332 | $ | 173,783 | |||||||||||||||
| Add: | |||||||||||||||||||||||
| Interest expense, net | 3,817 | 3,924 | 15,127 | 4,043 | |||||||||||||||||||
| Distributions in excess of earnings from equity method investments | 3,243 | 4,308 | 11,538 | 19,670 | |||||||||||||||||||
| Less: | |||||||||||||||||||||||
| Change in other assets and liabilities | (7,443) | (417) | (4,771) | 1,499 | |||||||||||||||||||
| Non-cash adjustments | 76 | 37 | 288 | 177 | |||||||||||||||||||
Impairment and other, net(1) | — | — | 1,000 | — | |||||||||||||||||||
| Adjusted EBITDA | 61,529 | 48,909 | 219,480 | 195,820 | |||||||||||||||||||
| Less: | |||||||||||||||||||||||
| Adjusted EBITDA attributable to non-controlling interests | 7,323 | 5,959 | 23,191 | 46,412 | |||||||||||||||||||
| Adjusted EBITDA attributable to the Partnership | 54,206 | 42,950 | 196,289 | 149,408 | |||||||||||||||||||
| Add: | |||||||||||||||||||||||
| Net adjustments from volume deficiency agreements | 2,792 | 1,853 | — | — | |||||||||||||||||||
Maintenance capital recovery(2) | 282 | — | 282 | — | |||||||||||||||||||
| Less: | |||||||||||||||||||||||
| Net interest paid/(received) | 3,770 | (76) | 15,112 | 50 | |||||||||||||||||||
| Maintenance capital expenditures | 706 | 263 | 1,081 | 1,604 | |||||||||||||||||||
Cash reserves(3) | — | 3,882 | — | 3,882 | |||||||||||||||||||
| Cash available for distribution attributable to the Partnership | $ | 52,804 | $ | 40,734 | $ | 180,378 | $ | 143,872 | |||||||||||||||
(1)This includes $6.0 million of costs related to the Griffith Station Incident (impairment charge of $4.4 million and $1.6 million as a response expense), net of $5.0 million in offsetting insurance receivable. The net charge of $1.0 million reflects our insurance deductible.
(2)Relates to the portion of maintenance capital for Griffith Station Incident reimbursable by insurance.
(3)Acquisition financing expenses.
8
| FOR IMMEDIATE RELEASE | | ||||
SELECTED OPERATING DATA
| Three Months Ended December 31, | Twelve Months Ended December 31, | ||||||||||||||||||||||
| Pipeline throughput (thousands of barrels per day) (1)(2) | 2019 | 2018 | 2019 | 2018 | |||||||||||||||||||
| BP2 | 302 | 249 | 300 | 277 | |||||||||||||||||||
| Diamondback | 58 | 43 | 63 | 62 | |||||||||||||||||||
| River Rouge | 77 | 69 | 73 | 66 | |||||||||||||||||||
| Total Wholly Owned Assets | 437 | 361 | 436 | 405 | |||||||||||||||||||
| Mars | 539 | 566 | 546 | 516 | |||||||||||||||||||
| Caesar | 183 | 197 | 194 | 198 | |||||||||||||||||||
| Cleopatra (3) | 21 | 23 | 24 | 23 | |||||||||||||||||||
| Proteus | 224 | 178 | 175 | 172 | |||||||||||||||||||
| Endymion | 224 | 178 | 175 | 172 | |||||||||||||||||||
| Mardi Gras Joint Ventures | 652 | 576 | 568 | 565 | |||||||||||||||||||
| Ursa | 94 | 101 | 107 | 74 | |||||||||||||||||||
| Average revenue per barrel ($ per barrel)(2)(4) | |||||||||||||||||||||||
| Total Wholly Owned Assets | $ | 0.79 | $ | 0.74 | $ | 0.77 | $ | 0.73 | |||||||||||||||
| Mars | 1.53 | 1.15 | 1.31 | 1.19 | |||||||||||||||||||
| Mardi Gras Joint Ventures | 0.61 | 0.65 | 0.65 | 0.66 | |||||||||||||||||||
| Ursa | 0.89 | 0.83 | 0.87 | 0.83 | |||||||||||||||||||
(1)Pipeline throughput is defined as the volume of delivered barrels.
(2)Interest in Ursa was contributed to the Partnership on October 1, 2018 and throughput and average revenue per barrel is presented on a 100% basis for the year ended December 31, 2018.
(3)Natural gas is converted to oil equivalent at 5.8 million cubic feet per one thousand barrels.
(4)Based on reported revenues from transportation and allowance oil divided by delivered barrels over the same time period.
9
| FOR IMMEDIATE RELEASE | | ||||
CAPITAL EXPENDITURES(1) (UNAUDITED)
| Three Months Ended December 31, | Twelve Months Ended December 31, | ||||||||||||||||||||||
| (in thousands of dollars) | 2019 | 2018 | 2019 | 2018 | |||||||||||||||||||
| Cash spent on maintenance capital expenditures | $ | 706 | $ | 263 | $ | 1,081 | $ | 1,604 | |||||||||||||||
| Increase in accrued capital expenditures | (127) | (4) | 55 | 145 | |||||||||||||||||||
| Total capital expenditures incurred | $ | 579 | $ | 259 | $ | 1,136 | $ | 1,749 | |||||||||||||||
(1)Capital expenditures presented above are related to the Wholly Owned Assets.
10
| FOR IMMEDIATE RELEASE | | ||||
SELECTED BALANCE SHEET DATA (UNAUDITED)
| (in thousands of dollars) | December 31, 2019 | December 31, 2018 | |||||||||
| Cash and cash equivalents | $ | 98,831 | $ | 56,970 | |||||||
| Property, plant and equipment, net | 62,693 | 68,580 | |||||||||
| Total assets | 722,096 | 693,203 | |||||||||
| Long-term debt | 468,000 | 468,000 | |||||||||
| Total equity | 240,230 | 210,852 | |||||||||
February 27, 2020
The information in this release reflects the unaudited consolidated financial position and results of BP Midstream Partners LP.
11