Attached files
| file | filename |
|---|---|
| EX-32.2 - EX-32.2 - 10x Genomics, Inc. | d849320dex322.htm |
| EX-32.1 - EX-32.1 - 10x Genomics, Inc. | d849320dex321.htm |
| EX-31.2 - EX-31.2 - 10x Genomics, Inc. | d849320dex312.htm |
| EX-31.1 - EX-31.1 - 10x Genomics, Inc. | d849320dex311.htm |
| EX-23.1 - EX-23.1 - 10x Genomics, Inc. | d849320dex231.htm |
| EX-4.3 - EX-4.3 - 10x Genomics, Inc. | d849320dex43.htm |
Table of Contents
UNITED STATES
SECURITIES AND EXCHANGE COMMISSION
Washington, D.C. 20549
FORM 10-K
(Mark One)
| ☒ | ANNUAL REPORT PURSUANT TO SECTION 13 OR 15(d) OF THE SECURITIES EXCHANGE ACT OF 1934 |
For the fiscal year ended December 31, 2019
OR
| ☐ | TRANSITION REPORT PURSUANT TO SECTION 13 OR 15(d) OF THE SECURITIES EXCHANGE ACT OF 1934 |
For the transition period from to
Commission File Number: 001-39035
10x Genomics, Inc.
(Exact Name of Registrant as Specified in Its Charter)
| Delaware | 45-5614458 | |
| (State or other jurisdiction of incorporation or organization) |
(I.R.S. Employer Identification No.) | |
| 6230 Stoneridge Mall Road Pleasanton, California |
94588 | |
| (Address of principal executive offices) | (Zip Code) | |
Registrant’s telephone number, including area code: (925) 401-7300
Securities registered pursuant to Section 12(b) of the Act:
| Title of each class |
Trading Symbol |
Name of each exchange on which registered | ||
| Class A common stock, par value $0.00001 per share | TXG | The Nasdaq Stock Market LLC |
Securities registered pursuant to Section 12(g) of the Act: None
Indicate by check mark if the registrant is a well-known seasoned issuer, as defined in Rule 405 of the Securities Act. Yes ☐ No ☒
Indicate by check mark if the registrant is not required to file reports pursuant to Section 13 or Section 15(d) of the Act. Yes ☐ No ☒
Indicate by check mark whether the registrant (1) has filed all reports required to be filed by Section 13 or 15(d) of the Securities Exchange Act of 1934 during the preceding 12 months (or for such shorter period that the registrant was required to file such reports), and (2) has been subject to such filing requirements for the past 90 days. Yes ☒ No ☐
Indicate by check mark whether the registrant has submitted electronically every Interactive Data File required to be submitted pursuant to Rule 405 of Regulation S-T (§ 232.405 of this chapter) during the preceding 12 months (or for such shorter period that the registrant was required to submit such files). Yes ☒ No ☐
Indicate by check mark whether the registrant is a large accelerated filer, an accelerated filer, a non-accelerated filer, a smaller reporting company, or an emerging growth company. See the definitions of “large accelerated filer,” “accelerated filer,” “smaller reporting company,” and “emerging growth company” in Rule 12b-2 of the Exchange Act.
| Large accelerated filer | ☐ | Accelerated filer | ☐ | |||
| Non-accelerated filer | ☒ | Smaller reporting company | ☐ | |||
| Emerging growth company | ☒ | |||||
If an emerging growth company, indicate by check mark if the registrant has elected not to use the extended transition period for complying with any new or revised financial accounting standards provided pursuant to Section 13(a) of the Exchange Act. ☐
Indicate by check mark whether the registrant is a shell company (as defined in Rule 12b-2 of the Exchange Act). Yes ☐ No ☒
The registrant was not a public company as of June 28, 2019, the last business day of its most recently completed second fiscal quarter and therefore, cannot calculate the aggregate market value of its voting and non-voting common equity held by non-affiliates as of such date. The registrant’s Class A common stock began trading on The Nasdaq Stock Market LLC on September 12, 2019.
As of January 31, 2020, the registrant had 21,282,464 shares of Class A common stock, $0.00001 par value per share, outstanding and 75,269,430 shares of Class B common stock, $0.00001 par value per share, outstanding.
Portions of the registrant’s Definitive Proxy Statement relating to the registrant’s 2020 Annual Meeting of Shareholders are incorporated by reference into Part III of this Annual Report on Form 10-K where indicated. Such Definitive Proxy Statement will be filed with the Securities and Exchange Commission within 120 days after the end of the registrant’s fiscal year ended December 31, 2019.
Table of Contents
Table of Contents
10x Genomics, Inc.
SPECIAL NOTE REGARDING FORWARD-LOOKING STATEMENTS
This Annual Report on Form 10-K (this “Annual Report”) contains “forward-looking statements” within the meaning of Section 27A of the Securities Act of 1933, as amended (the “Securities Act”), and Section 21E of the Securities Exchange Act of 1934, as amended (the “Exchange Act”), which are subject to the “safe harbor” created by those sections. All statements, other than statements of historical facts included in this Annual Report, including statements concerning our plans, objectives, goals, beliefs, business strategies, future events, business conditions, results of operations, financial position, business outlook, business trends and other information, may be forward-looking statements. Forward-looking statements generally can be identified by the use of forward-looking terminology such as “may,” “will,” “should,” “expect,” “plan,” “anticipate,” “could,” “intend,” “target,” “project,” “contemplate,” “believe,” “estimate,” “predict,” “potential” or “continue” or the negatives of these terms or variations of them or similar terminology. Although we believe that the expectations reflected in these forward-looking statements are reasonable, we cannot provide any assurance that these expectations will prove to be correct and actual results may vary materially from what is expressed in or indicated by the forward-looking statement. Such statements reflect the current views of our management with respect to our business, results of operations and future financial performance.
You should not rely upon forward-looking statements as predictions of future events. We have based the forward-looking statements contained in this Annual Report primarily on our current expectations and projections about future events and trends that we believe may affect our business, financial condition, results of operations and prospects. The outcome of the events described in these forward-looking statements is subject to risks, uncertainties and other factors, including those described in the section titled “Risk Factors” and elsewhere in this Annual Report. Moreover, we operate in a very competitive and rapidly changing environment. New risks and uncertainties emerge from time to time and it is not possible for us to predict all risks and uncertainties that could have an impact on the forward-looking statements contained in this Annual Report. We cannot assure you that the results, events and circumstances reflected in the forward-looking statements will be achieved or occur, and actual results, events or circumstances could differ materially from those described in the forward-looking statements. For a more detailed discussion of the risks, uncertainties and other factors that could cause actual results to differ, please refer to the “Risk Factors” in this Annual Report, as such risk factors may be updated from time to time in our periodic filings with the SEC. Our periodic filings are accessible on the SEC’s website at www.sec.gov.
The forward-looking statements made in this Annual Report relate only to events as of the date on which the statements are made. We undertake no obligation to update any forward-looking statements made in this Annual Report to reflect events or circumstances after the date of this Annual Report or to reflect new information or the occurrence of unanticipated events, except as required by law. Although we believe that the expectations reflected in the forward-looking statements are reasonable, we cannot guarantee that the future results, levels of activity, performance and events and circumstances reflected in the forward-looking statements will be achieved or occur and you should not place undue reliance on our forward-looking statements. Our forward-looking statements do not reflect the potential impact of any future acquisitions, mergers, dispositions, joint ventures or investments we may make.
In addition, statements that “we believe” and similar statements reflect our beliefs and opinions on the relevant subject. These statements are based upon information available to us as of the date of this Annual Report, and while we believe such information forms a reasonable basis for such statements, such information may be limited or incomplete, and our statements should not be read to indicate that we have conducted an exhaustive inquiry into, or review of, all potentially available relevant information. These statements are inherently uncertain and investors are cautioned not to unduly rely upon these statements.
Unless otherwise stated or the context otherwise indicates, references to “we,” “us,” “our,” “the Company,” “10x” and similar references refer to 10x Genomics, Inc.
Channels for Disclosure of Information
Investors and others should note that we may announce material information to the public through filings with the SEC, our website (https://www.10xGenomics.com), press releases, public conference calls, public webcasts and our social media accounts (https://twitter.com/10xGenomics, https://www.facebook.com/10xGenomics/ and https://www.linkedin.com/company/10xgenomics/). We use these channels to communicate with our customers and the public about the Company, our products, our services and other matters. We encourage our investors, the media and others to review the information disclosed through such channels as such information could be deemed to be material information. The information on such channels, including on our website and our social media accounts, is not incorporated by reference in this Annual Report and shall not be deemed to be incorporated by reference into any other filing under the Securities Act or the Exchange Act, except as expressly set forth by specific reference in such a filing. Please note that this list of disclosure channels may be updated from time to time.
1
Table of Contents
PART I
Mission
Our mission is to accelerate the mastery of biology to advance human health.
Overview
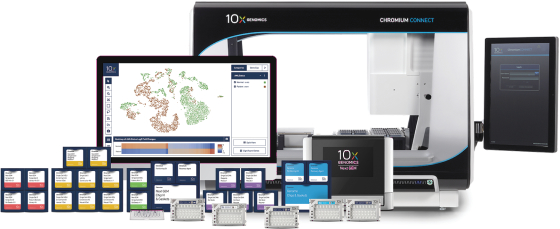
We are a life science technology company building products to interrogate, understand and master biology. Our integrated solutions include instruments, consumables and software for analyzing biological systems at a resolution and scale that matches the complexity of biology. We have built deep expertise across diverse disciplines including chemistry, biology, hardware and software. Innovations in all of these areas have enabled our rapidly expanding suite of products, which allow our customers to interrogate biological systems at previously inaccessible resolution and scale. Our products have enabled researchers to make fundamental discoveries across multiple areas of biology, including oncology, immunology and neuroscience, and have helped empower the single cell revolution hailed by Science magazine as the 2018 “Breakthrough of the Year” and the technological advancements in single cell multimodal omics hailed by Nature Methods journal as the 2019 “Method of the Year.” Our Single Cell ATAC solution was named one of the top 10 life sciences innovations of 2019 by The Scientist magazine. Since launching our first product in mid-2015 through December 31, 2019, we have sold 1,666 instruments to researchers around the world, including 97 of the top 100 global research institutions as ranked by Nature in 2018 based on publications and 19 of the top 20 global biopharmaceutical companies by 2018 revenue. We believe that this represents the very beginning of our penetration into multiple large markets. We expect that 10x will power a “Century of Biology” in which many of humanity’s most pressing health challenges will be solved by precision diagnostics, targeted therapies and cures to currently intractable diseases.
The “10x” in our name refers to our focus on opportunities with the greatest potential for exponential advances and impact. We believe that the scientific and medical community currently understands only a tiny fraction of the full complexity of biology. The key to advancing human health lies in accelerating this understanding. The human body consists of over 40 trillion cells, each with a genome of 3 billion DNA base pairs and a unique epigenetic program regulating the transcription of tens of thousands of different RNAs, which are then translated into tens of thousands of different proteins. Progress in the life sciences will require the ability to measure biological systems in a much more comprehensive fashion and to experiment on biological systems at fundamental resolutions and massive scales, which are inaccessible with existing technologies. We believe that our technologies overcome these limitations, unlocking fundamental biological insights essential for advancing human health.
Resolution and scale are the imperatives underlying our technologies and products. Our Chromium and Visium product lines provide this resolution and scale along distinct but complementary dimensions of biology. Our Chromium products enable high throughput analysis of individual biological components, such as up to millions of single cells. They use our precisely engineered reagent delivery system to divide a sample into individual components in up to a million or more partitions, enabling large numbers of parallel micro-reactions. In this manner, a large population of cells can be segregated into partitions and analyzed on a cell by cell basis. Our Visium products enable analysis of biological molecules within their spatial context, providing the locations of analytes that give insight into higher order biological structure and function. Our Visium platform uses high density DNA arrays with DNA sequences that encode the physical locations of biological analytes within a sample, such as a tissue section. Our products utilize our sensitive and robust molecular assays to convert biological analytes into detectable signals, enabling researchers to obtain vast amounts of information about diverse biological analytes together with their single cell and spatial context. Finally, we provide highly sophisticated and scalable software for analyzing the raw data researchers generate and presenting it in a form that is readily understood by biologists.
2
Table of Contents
Our product portfolio consists of multiple integrated solutions that include instruments, consumables and software. These solutions guide customers through the workflow from sample preparation to sequencing on third-party sequencers that are commonly available in research settings to subsequent analysis and visualization.
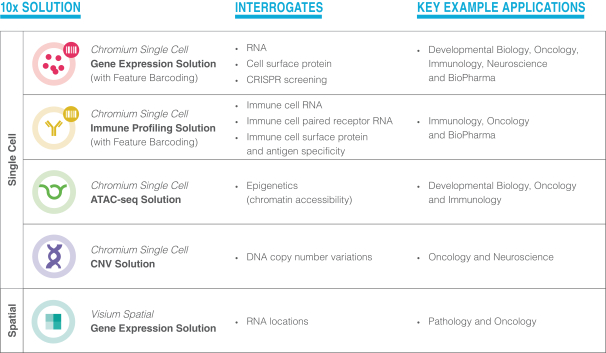
Each of our solutions is designed to interrogate a major class of biological information that is impactful to researchers:
| • | Our single cell solutions, all of which run on our Chromium instruments, include: |
| • | Single Cell Gene Expression for measuring gene activity on a cell-by-cell basis; |
| • | Single Cell Immune Profiling for measuring the activity of immune cells and their targets; |
| • | Single Cell ATAC for measuring epigenetics, including the physical organization of DNA; and |
| • | Single Cell CNV for measuring cellular heterogeneity through DNA changes such as copy number variation. |
| • | Our Visium Spatial Gene Expression solution measures the spatial gene expression patterns across a tissue sample. |
Our Feature Barcoding technology, which is currently compatible with our Single Cell Gene Expression and Immune Profiling solutions, allows researchers to simultaneously measure multiple analytes, such as protein and RNA, within the same set of cells or tissues.
Collectively, our solutions enable researchers to interrogate, understand and master biology at the appropriate resolution and scale.
We believe our solutions, which enable a comprehensive view of biology, target numerous market opportunities across the more than $50 billion global life sciences research tools market. We view much of this total market opportunity as ultimately accessible to us due to our ability to answer a broad diversity of biological questions. Based on the capabilities of our current solutions, and focusing solely on cases where our current solutions offer alternative or complementary approaches to existing tools, we believe, based on our internal estimates, we could access approximately $13 billion of the global life sciences research tools market. We believe we can further drive growth across our current and adjacent markets by improving or enabling new uses and applications of existing tools and technologies, as our solutions allow researchers to answer questions that may be impractical or impossible to address using existing tools.
As of December 31, 2019, we employed a commercial team of over 200 employees, many of whom hold Ph.D. degrees, who help drive adoption of our products and support our vision. We prioritize creating a superior user
3
Table of Contents
experience from pre-sales to onboarding through the generation of novel publishable discoveries, which drive awareness and adoption of our products. We have a scalable, multi-channel commercial infrastructure including a direct sales force in North America and certain regions of Europe and distribution partners in Asia, certain regions of Europe, Oceania, South America, the Middle East and Africa that drives our customer growth. This is supplemented with an extensive and highly specialized customer service infrastructure with Ph.D.-level specialists. We currently have customers in more than 40 countries.
Our revenue was $146.3 million and $245.9 million for the years ended 2018 and 2019, respectively, representing an annual growth rate of 68%. We generated net losses of $112.5 million and $31.3 million for the years ended 2018 and 2019, respectively.
The complexity of biology
Biology is staggeringly complex. The cell is the basic, fundamental organizational unit of all biological organisms. A human being starts from a single cell, which divides into over 40 trillion cells–such as blood cells, skin cells, muscle cells, bone cells, stem cells and neurons–to create the tissues that enable all necessary functions in the human body. These cells utilize the basic building blocks of DNA, RNA and protein, configured in cell-specific ways.
DNA, the hereditary material of living organisms, is the foundation for a series of biological processes that form the basis for biology and how cells function. DNA is transcribed into messenger RNA (“mRNA”) in a process referred to as transcription or, alternatively, gene expression. Information from the mRNA molecules is then translated into protein in a process called translation. Each gene has the ability to create multiple different mRNAs, resulting in the production of over 100,000 different mRNAs from about 30,000 genes. The complete collection of all of the DNA, mRNA and proteins are called the genome, transcriptome or gene expression profile, and the proteome, respectively. The epigenome includes molecular configurations and chemical DNA modifications that affect how genes are regulated. The genome, epigenome, transcriptome and proteome can be distinct for each of the trillions of cells in the human body and collectively constitute a rich architecture of biology.
Industry direction
The 20th century discovery of DNA, RNA, protein and the basic molecular and cellular mechanisms of their function paved early foundations for humanity to understand our own biology. In the early 2000s, the study of biology shifted from focusing on individual genes and their products to a more global level of characterizing the full collection of DNA, RNA and proteins and how they interact, giving rise to the field of genomics. Genomics is a broad, highly interdisciplinary field that approaches the study of biology at a system-wide level. We believe that genomics-based approaches will encompass much of biology and medical applications in the coming decades.
The Human Genome Project, which was completed in 2003, determined a reference sequence of the three billion nucleotides of the human genome as a composite over several individuals. This reference sequence provided an initial “parts list” of genes, enabling researchers to begin understanding human biology at a global molecular level.
The subsequent two decades of genomic research in many ways have been defined by genome-wide association studies (“GWAS”) and large-scale sequencing of individuals and populations. The goal was to compile all of the genetic variants in human populations and to link those variants to different conditions, traits and diseases. These associations would serve to generate clues and hypotheses that can be tested by subsequent experimentation to understand the detailed biology of each gene and variant.
Both of these efforts have provided substantial value and have been foundational in enabling multiple new research and clinical applications. However, much of the initial promise of the Human Genome Project and
4
Table of Contents
subsequent GWAS projects remains unfulfilled. We believe this is ultimately due to the tremendous underlying complexity of biology. The human genome project provided a list of parts and subsequent GWAS projects looked for statistical links between these parts and various diseases and traits. Going forward we need to understand the biological function of each gene and all the molecular and cellular networks they encode. Genomics needs to expand from its focus on the genome and statistical associations to the study of biology more broadly.
This presents an enormous challenge because of the limited capabilities of existing tools for accessing biology at the molecular and cellular level. Some of these limitations are:
| • | Average, or “bulk,” measurements obscure underlying differences between different biological units, such as individual cells; |
| • | Low throughput prevents requisite sampling of the underlying complexity—for example, when only a few hundred cells can be evaluated at a time; |
| • | Limited number of biological analytes are interrogated, giving a myopic view of only a few biological processes; |
| • | Limited ability for multi-omic interrogation; |
| • | Inefficient use of sample to generate a signal of sufficient strength to analyze the biological molecules of interest; and |
| • | Inadequate bioinformatics and software tools. |
We believe technologies that address these limitations will serve large and unmet market needs by providing a better understanding of molecular and cellular function, the origin of disease and how to improve treatment.
Measure the full complexity of biology. A major need is for an in-depth cataloguing of biological complexity. This will involve going from a basic biological parts list to a detailed map of exactly how all of these parts are used and interact in both healthy and disease states. Researchers and clinicians need to characterize every cell in the human body, to understand how cell-to-cell variations in genomes, epigenomes, transcriptomes and proteomes give rise to function or dysfunction. They also need to characterize every tissue at a full molecular and cellular level, including how cells are arranged together into spatial patterns that affect function, give rise to disease or impact treatment. For example, in the context of cancer biology, many tumors consist of a heterogeneous population of healthy and cancerous cells, the latter of which may consist of genetically distinct subpopulations that are susceptible to different therapeutics. Furthermore, different spatial patterns of cancer antigens may require different treatment approaches. Without being able to see cells and molecules in their spatial context it is difficult to fully understand tumor resistance and how cells interact with one another within the tumor microenvironment and enable targeted therapies.
Massively parallelize experimentation. Mastering biology will require moving beyond the cataloguing of biological complexity and into performing experiments to understand the impact of active changes to biological systems. We believe technologies that enable measurement of massively parallel perturbation and the impact of these perturbations will be important for accelerating biological and medical discovery. For example, an unmet goal of researchers has been to compile all of the genetic variations in human populations and link those variations to different conditions, traits and diseases. Linking these variations to disease requires the analysis of the impact of these variations within different systems, alone and in various combinations. Technologies that enable these variations to be created in arbitrary combinations within various biological contexts and the impact of these combinations measured in a massively parallel fashion will highly accelerate this work. In another example, a longstanding need of researchers has been to predict the interactions between immune cells and the target molecules they can recognize. The human body can make over a trillion different immune cells that are collectively capable of recognizing and mounting a response to nearly any conceivable antigen. We believe that understanding, and ultimately harnessing, this targeting will require technologies that can enable the massively
5
Table of Contents
parallel screening of interactions between a set of recognizing immune cells and a set of synthetic antigen target molecules.
We believe technologies that address these needs will redefine biological discovery and power a “Century of Biology” in which many of humanity’s most pressing health challenges will be solved by precision diagnostics, targeted therapies and cures to currently intractable diseases.
Our solutions
We have built and commercialized multiple product lines that allow researchers to interrogate, understand and master biological systems at a resolution and scale commensurate with the complexity of biology. We believe that our products overcome the limitations of existing tools. Our vision, discipline and multidisciplinary approach have allowed us to continuously innovate to develop the platforms, molecular assays and software that underlie our solutions.
Our technological imperatives: resolution and scale
Resolution and Scale are the imperatives that underlie our products and technology. First, our solutions enable understanding biology at the right level of biological resolution, such as at the level of the single cell or at high spatial resolution of tissues and organs. Second, we believe that high resolution tools only become truly powerful when they are built into technologies with tremendous scale. Measuring individual cells, spatial portions of tissues or molecular interactions in small numbers is insufficient. Our products enable measuring and manipulating up to millions of single cells or thousands of tissue sample positions. Thus, our products provide the appropriate levels of both resolution and scale in a manner that allows researchers to easily sift through the complexity to access the underlying biology.
Our platforms, molecular assays and software
Our Chromium platform, Visium platform, molecular assays and software constitute the building blocks of our integrated solutions. These shared building blocks allow us to rapidly build and improve our solutions for studying biology at the appropriate resolution and scale:
Our Chromium platform enables high-throughput analysis of individual biological components. It is a precisely engineered reagent delivery system that divides a sample into individual components in up to a million or more partitions, enabling large numbers of parallel micro-reactions. In this manner, for example, the individual single cells of a large population of cells can be segregated so that each cell resides in its own partition. Each partition then behaves as a micro-scale reaction vessel in which its contents are barcoded with a DNA sequence that specifically identifies those contents as being distinct from the contents of other partitions. Once biological material in each partition is barcoded, they can then be pooled and sequenced together. Finally, the barcode sequences can be used to easily tease apart information originating from different partitions. Our paradigm of partitioning and barcoding gives researchers the ability to measure many discrete biological materials and/or perform many different experiments in parallel, providing tremendous resolution and scale.
We have leveraged our Chromium platform to create a suite of solutions that measure biological analytes at the resolution of the single cell, the most fundamental organizational unit of biology. We believe that, in this sense, all of biology is single cell biology and that our single cell solutions can enhance and sharpen a wide array of scientific work in genetics, developmental biology, molecular biology and cell biology.
Our Visium platform empowers researchers to identify where biological components are located and how they are arranged with respect to each other, otherwise referred to as “spatial analysis.” Our Visium platform uses high density DNA arrays which have DNA barcode sequences that encode the physical location of biological analytes within a sample, such as a tissue section. This solution allows the spatial location of the analytes to be
6
Table of Contents
“read out” using sequencing to constitute a visual map of the analytes across the sample. Similar to partitioning, spatial barcoding with large numbers of probes on an array can unlock tremendous insights, providing high resolution genomic information to visualize analytes across biological tissues.
Our molecular assays are used with our Chromium and Visium platforms to provide sensitive and robust biochemistries that convert minute amounts of biological analytes into detectable signals. We have created a wide variety of proprietary assays compatible with our platforms for measuring the genome, epigenome, transcriptome and proteome. For example:
| • | Our GEM-RT assay is a highly sensitive technique for detecting mRNA molecules that are in low abundance in single cells. Less sensitive methods easily miss low abundance mRNA molecules, resulting in loss of information about the activities of many important genes that are detectable using our assay. |
| • | Our ATAC-seq assay can be used to determine whether particular genes are active or dormant on a system-wide basis and is tremendously useful in studying gene regulation. |
| • | Our Feature Barcoding assay allows simultaneous multi-omic interrogation of different classes of biological analytes in a sample. Feature Barcoding is highly versatile and can be customized to analyze many different classes of analytes for a wide variety of applications. |
| • | Our Visium Spatial Gene Expression assay can be used to assess gene expression across biological samples. |
Our software is essential to our mission of accelerating the mastery of biology. Since our platforms and molecular assays enable new levels of resolution and scale, they produce entirely new types of data and at much larger scales than previously achievable. To that end, we have developed sophisticated and scalable software that completes our solutions which we provide to researchers generally free of charge. Our analysis software transforms large amounts of raw data into usable results, giving researchers user friendly tools to dynamically explore these results. As larger and larger amounts of biological data are generated with greater ease, we believe that software tools will become increasingly critical for progress in biology.
Since our founding, we have committed to making software engineering and computational biology world-class, core internal competencies. We believe this deep investment distinguishes us from our competition and is worthwhile because it:
| • | Removes barriers to adoption. With our software, our customers can immediately begin making sense of their experimental data. Without it, they would be forced to develop their own software or wait for the community to do so, slowing down adoption of our products by months or even years; |
| • | Accelerates pull-through. Easy-to-use, efficient software helps our customers analyze their data and complete their experiments and studies faster, enabling them to move on to their next experimental questions sooner; |
| • | Increases scale. Reliable, scalable software helps to remove analysis as a bottleneck as our customers plan larger and more ambitious experimental designs; |
| • | Expands the user base. While early adopters are more likely to have access to bioinformatics expertise, our software enables a broader range of customers to take advantage of our solutions; |
| • | Enables better understanding of our customers’ needs. By supplying analysis software for our customers, we gain much greater insight into their use cases, helping us to design future products that best meet their needs; and |
| • | Enhances and accelerates product development. The software we ship to customers is the same software we use to develop and optimize our platforms and chemistry. This aligns us closely with the needs of our customers and reduces our time-to-market. |
7
Table of Contents
Our product development approach
The success of our products is founded on how we approach product development. Our employees are deeply scientifically oriented, having the relevant scientific expertise embedded not only within research and development, but also within the management team and throughout the company. We are ambitious and focus on fundamentals. We strive to solve big challenges to enable new fundamental biology and to build technological capabilities with potential for exponential impact. We work closely with our customers, many of whom are thought leaders in genomics and medicine, to identify future frontiers and unmet needs. Once we identify the correct opportunities, we have the discipline to focus on execution and have a track record of bringing successful products to market.
Multidisciplinary collaboration and technological innovation are central to our product development process. We have built teams with deep expertise across diverse disciplines including chemistry, molecular biology, microfluidics, hardware, computational biology and software engineering. This multidisciplinary expertise forms the basis of our innovation engine, which allows us to introduce new products at a rapid pace as well as continuously launch improved versions of our existing products.
Our solutions enable our customers to focus on biology by providing them with intuitive user interfaces and software. Our products guide customers through the workflow, from preparing samples, to reading sample information on a third-party sequencer, through analyzing and visualizing this information, to make obtaining biological answers as easy as possible. Our workflows operate with existing sequencers that are widely available in research settings.
Our market opportunity
According to industry sources, the worldwide life sciences research tools market totaled more than $50 billion in 2017. Our diverse products and solutions allow biologists to interrogate and understand biological systems at exceptional resolution and scale. Our focus on enabling a comprehensive view of biology, and not narrowly focusing on a particular analyte such as DNA alone, has produced products which we believe have broad applications and target numerous market opportunities across different areas of life sciences research. Because we provide solutions to answer a broad diversity of biological questions, we view much of this total market as ultimately accessible to us.
Markets in which our current solutions offer alternative or complementary approaches to existing tools represented a total market opportunity of approximately $13 billion of the more than $50 billion global life sciences research tools market in 2017. This $13 billion market includes flow cytometry, next generation sequencing, laboratory automation, microscopy and sample preparation, among other tools. In many cases, our current solutions offer alternative approaches to existing tools, where the advantages of our solutions can provide more precise answers to existing biological questions than existing tools and technologies. Our tools may also complement, enhance and enable new applications of these technologies. Within this market, and more broadly within the entire life science research tools market, we believe we will compete for research spending and capture an increasing share of research budgets as our solutions deliver new capabilities, enable new applications and lead to new discoveries. We also expect to enter additional markets in the future that will further expand our market opportunity.
We believe a strong benchmark of the potential adoption of our solutions is the installed base of real-time polymerase chain reaction (“RT-PCR”) units, which is approximately 50,000 units globally. We also believe, based on industry sources, that there are over 15,000 next generation sequencers installed globally. While owners of next-generation sequencing instruments are one of several potential constituencies for buying our solutions, many of our customers do not own a sequencer and, as our installed base has grown, many of our customers have purchased multiple Chromium instruments. We believe that our market opportunity for placements of our instruments is meaningfully larger than the installed base of next generation sequencers.
8
Table of Contents
Growth of our market opportunity is also driven by a broad and increasing range of applications for our solutions. Our solutions can be used in many different applications, including basic biology, oncology and immuno-oncology, genetic disease, neurological disease, autoimmunity, infectious disease, the human microbiome and many others. As we enter the “Century of Biology,” we believe that the mastery of biology will create advances and benefits for a broad and growing range of industries including broader segments of the healthcare industry and beyond.
Our competitive strengths
We believe our continued growth will be driven by the following competitive strengths:
Our position as a leader in a large and growing market. Since launching our first product in mid-2015 through December 31, 2019, we have sold 1,666 instruments and we serve thousands of researchers globally. We have fostered deep relationships with many key opinion leaders and as of December 31, 2019, our customers included 97 of the top 100 global research institutions as ranked by Nature in 2018 based on publications and 19 of the top 20 global biopharmaceutical companies by 2018 revenue. Our products are entrenched within our customers’ workflow and a significant portion of them utilize more than one of our solutions. Our technologies have become a vital tool for biological research. To date, more than 700 peer-reviewed articles have been published based on data generated using our products, with more than 200 of these published in 2018 and more than 300 published in 2019. Our position as a leader in this market allows us to form deep partnerships with our customers who help us stay on the frontiers of biology, giving us insight on industry needs that inform our product strategy and providing us with a strong competitive advantage.
Our proprietary technologies. Through multiple years of development, acquisition and licensing, we have amassed a core set of technologies that form the foundation of our growing suite of products and solutions. These technologies, including instruments, assays and software, combine a diverse set of disciplines, including chemistry, molecular biology, microfluidics, hardware, computational biology and software engineering. Our technologies underlie features and performance that differentiate our products from the competition. Further, many of these technological elements can be utilized across multiple products, enabling us to leverage our existing infrastructure and investment when building future products, increasing the speed of product development and product performance. As of December 31, 2019, worldwide we owned or exclusively licensed over 200 issued or allowed patents and over 480 pending patent applications. In addition to these exclusively licensed patents and pending patent applications, we also license patents on a non-exclusive and/or territory restricted basis. Our intellectual property portfolio includes foundational patents in single cell analysis, epigenomics, spatial analysis and multi-omics.
Our rigorous product development processes and scalable infrastructure. We have implemented a rigorous and systematic product development process by which our vision can be efficiently translated into commercial products. We develop our products over a set of defined phases delineated by validating multifunctional reviews, which ensure our teams remain focused on quality, efficiency and profitability. This process allows many highly focused teams to execute on separate product development efforts in parallel while drawing effectively on the resources and capabilities of the company. We have also built extensive technological and operational infrastructure to support the efficient execution of these teams. This infrastructure includes multiple technological investments across a range of areas, including custom barcoded gel bead production, microfluidic chip manufacturing, scalable high-performance computation and automated software productization and testing tools. This infrastructure can be drawn on to develop new products and improved versions of our existing products with high quality at a rapid pace.
Our customer experience and broad commercial reach. We believe in providing our customers with a high-quality experience from start to finish: starting with a collection of validated methods for preparation of samples to be run on our systems and ending with extensive software to aid in analysis and visualization of the data generated. We have also built comprehensive product testing and quality control into our culture and processes to help guarantee the performance of our products in customer hands. As of December 31, 2019, we employed a
9
Table of Contents
commercial team of over 200 full time employees. This includes an extensive and highly specialized customer service infrastructure with technical specialists covering multiple areas of expertise, including both experimental biology and software. Many members of our sales and customer service teams have a Ph.D. degree in the relevant scientific field. Both our sales and customer service teams help ensure our customers have a positive experience with our products.
Our experienced multidisciplinary team. At 10x, our success begins with our people. We have built a multidisciplinary team with expertise across a diverse set of areas such as chemistry, molecular biology, microfluidics, hardware, computational biology and software engineering who are committed to identifying and addressing problems at the forefront of biology. We have supplemented our diverse technical experience by assembling an operational team with expertise in manufacturing, legal, sales, marketing, customer service and finance. We believe this confluence of talent from multiple disciplines at 10x allows us to stay ahead of our competitors by identifying highly impactful opportunities and building products and solutions that address these opportunities.
Our growth strategy
Our growth strategy includes the following key elements:
Develop critical enabling technologies. Just as our past success is attributable to our innovative technologies, we believe that our future growth will be driven in large part by our significant continued investment in research and development. We aim to build new platforms, consumables and software that further our goals of interrogating, understanding and mastering biological systems at the needed resolution and scale. We prioritize innovations that meet large unmet market needs, such as measuring novel biological analytes with key functional impact at the single cell or spatial level. We expect that these investments in research and development will allow us to increase our penetration of our accessible market.
Expand the installed base of our Chromium instruments. Since our commercial launch in mid-2015 through December 31, 2019, we have placed 1,666 instruments and serve thousands of researchers globally. Utilizing our multi-channel sales and distribution infrastructure, we will continue to engage with researchers to increase our installed base of Chromium instruments. We will target new customers in addition to expanding the number of instruments within institutions that have already recognized the significant value of our technology. A portion of our current laboratory customers do not yet own a Chromium instrument, but rather gain access to one of our instruments through an adjacent lab or core facility within the institution. These customers are substantial and easily accessible and therefore represent an opportunity for future instrument sales. We also intend to expand our existing geographic reach, both directly and through distributors.
Strengthen use and adoption of our consumables. Our instruments are designed to be used exclusively with our consumables. This closed system generates recurring revenue from consumables tied to each instrument we sell. We plan to drive wider adoption of our products within the workflows of our existing customers. For example, although most of the biopharmaceutical companies using our products use them at multiple sites, we believe that as our applications are increasingly incorporated into the validation steps in the drug development process, the amount of our consumables used will grow. We have built a dedicated global strategic sales, marketing and business development team to support the adoption cycle by biopharmaceutical companies. The recent introduction of our Chromium Connect instrument is also aimed at driving higher consumable revenue growth, as the fully automated workflow will reduce bottlenecks caused by manual processes. We also plan to demonstrate new applications using our current solutions, including applications making synergistic use of multiple solutions.
Identify the most relevant technologies, create or acquire such technologies and develop them into new products. Over the years, we have developed, acquired and licensed a core set of technologies and associated intellectual property across a broad range of emerging areas within biology and life sciences. The ability to identify these core technologies and capabilities has complemented our internal product development process and
10
Table of Contents
enhanced the foundation of our growing suite of products and solutions. We will continue to identify and acquire or license foundational technologies and intellectual property that accelerate the development of new products or complement our existing products and technologies. For instance, we acquired Epinomics, Inc. (“Epinomics”) and Spatial Transcriptomics Holdings AB (“Spatial Transcriptomics”) in 2018, obtaining technology and intellectual property that formed the foundation of our ATAC-seq assay and Visium platform, respectively.
Promote our platforms as the standard for single and spatial cell analysis. We believe many key opinion leaders have recognized our Chromium platform as the standard for single cell analysis. One of our strategies is to broaden this recognition and promote the breadth of scientific achievements enabled by our products. To date, more than 700 peer-reviewed articles have been published using data generated by our portfolio of Chromium solutions. We also highlight successful instances where our Visium platform is used to analyze biological samples within their spatial context. Further research and discoveries will unfold as our solutions are utilized as the global standard.
Our products and technology
Our products are integrated solutions comprised of instruments, consumables and software. They are built with our expertise in chemistry, molecular biology, microfluidics, hardware, computational biology and software engineering. Our products begin with a researcher’s sample (such as a collection of thousands to millions of cells) and perform high-throughput barcoding to construct libraries that are compatible with standard sequencers. Our proprietary software then provides turn-key analysis pipelines and intuitive visualization tools that allow researchers to easily interpret the biological data from the samples. A summary of our solutions is as follows:
Our Chromium Platform
Our Chromium platform, which includes our Chromium Controllers, microfluidic chips and related consumables, enables high-throughput analysis of individual biological components. It is a precisely engineered reagent delivery system that divides a sample into individual components in up to a million or more partitions, enabling large numbers of parallel micro-reactions. The Chromium platform can be used to partition not only single cells,
11
Table of Contents
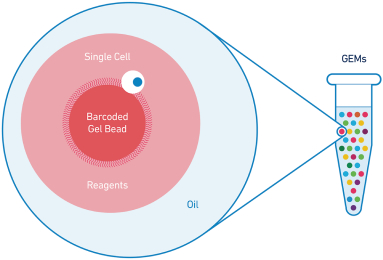
but also other biological materials such as cell nuclei and DNA molecules. The large numbers of partitions generated using our Chromium products can be used for analyzing samples at high resolutions and at large scales. We pair a partitioned sample with our proprietary gel beads bearing barcodes that allow researchers to uniquely identify the contents of each partition and distinguish them from contents of other partitions. We refer to the partitions that are generated on our Chromium platform as “GEMs,” which stands for Gel beads in EMulsion. We collectively refer to our partitioning and barcoding technologies as our GemCode technology.
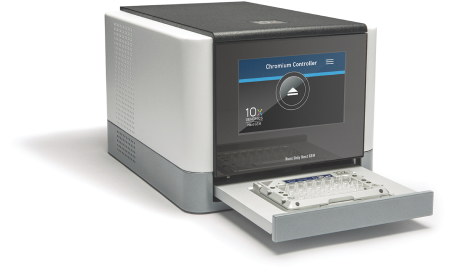
Our Chromium Controller and microfluidic chips. All of our Chromium consumables run on our Chromium Controller instrument. We have designed our instrument to be widely accessible to researchers with a list price of $75,000 and a form factor that easily fits on a standard laboratory bench. Our Chromium Controller operates exclusively with our microfluidic chips, which are highly engineered single-use devices that process sample and reagents. During our Chromium workflows, the researcher loads sample onto the microfluidic chip along with our proprietary gel beads and oils. The loaded chip is inserted into the Chromium Controller, which facilitates the generation of GEMs that contain sample and gel beads. Our recently introduced Chromium Connect product is a high-throughput version of our Chromium instrument that incorporates liquid handling robotics to automate our workflow and can be utilized with our Single Cell Gene Expression solution.
12
Table of Contents
Our Gel Beads. Within each GEM, the sample is co-encapsulated with one of our proprietary gel beads which are designed to contain a unique, identifying DNA barcode for subsequent sequencing and analysis. Our gel beads, which we manufacture in-house using proprietary methods, incorporate barcoded DNA molecules that are designed to react with the sample inside each GEM. The GEMs act as individual reaction vessels to generate barcoded molecules. We have developed various molecular assays that can be used to perform barcoding reactions with different types of biological analytes—for example, our proprietary GEM-RT assay incorporates sequences of mRNA into barcoded molecules. Once those barcoded molecules are generated inside individual GEMs, the GEMs can be broken and their contents pooled to generate libraries that can be analyzed by widely available third-party sequencers. Critically, because different GEMs have different DNA barcodes, each sequencing read can be traced back to its GEM of origin, allowing identification of the biological source or context of the contents of the GEM. This barcoding paradigm enables multiplexing across very large numbers of cells or other biological material.
Key GemCode advantages. Our GemCode technology has a number of technological advantages over alternative tools. For example, our gel beads are composed of proprietary materials that permit their incorporation into GEMs at high efficiency. This efficiency increases the number of partitions that include one and only one barcoded gel bead and avoids loss of information from samples that are not paired with barcodes. Furthermore, the chemical structure of our gel beads allows them to not only encapsulate hundreds of millions of copies of DNA barcode oligonucleotides, but also permit their controlled release at precise times during our workflow. Similarly, our microfluidic chips are engineered to highly precise dimensions and consist of materials that optimize the partitioning of biological materials into GEMs. Such features enable our Chromium platform to provide a combination of superior performance characteristics for single cell analyses:
| • | High cell throughput: How many cells can be measured at once? Measuring more cells with resolution allows researchers to look for rare cells in a population. If a disease-causing cell occurs in only 1 in 10,000 cells in a sample, then measuring just 1,000 cells will be unlikely to find a single copy of the disease-causing cell. Our Single Cell Gene Expression and Immune Profiling solutions, on the other hand, have cell throughputs of up to 80,000 cells per run using one microfluidic chip which increases the likelihood of finding a copy of the disease-causing cell. |
| • | High cell capture rate: What fraction of the researcher’s sample cells are measured rather than lost? A high cell capture rate is important in many cases where researchers start with only a limited number of rare cells, such as a tumor biopsy from a patient. Our Single Cell Gene Expression and Immune Profiling solutions, for example, have typical cell capture rates of about 65%, which is significantly higher than those achieved by many competing solutions. |
| • | Low doublet rate: How often do researchers avoid doublets—artifacts where two or more cells are read as one? Doublets result in loss of cell information, inaccurate information, and wasted sequencing. Researchers seek products with low doublet rates. Our Single Cell Gene Expression, ATAC and Immune Profiling solutions, for example, have doublet rates of less than 1% per 1,000 cells. |
Our Chromium platform currently provides researchers with solutions in four major application areas:
Single Cell Gene Expression
Our Chromium Single Cell Gene Expression solution provides customers with the ability to measure the transcriptome of single cells, revealing gene activity and networks on a cell-by-cell basis. This approach enables customers to identify and characterize rare cell types in a population of cells, characterize cell populations without prior knowledge of cell subtypes or cell markers, define novel cell types and cell states, discover new biomarkers for specific cell populations and analyze and understand cellular heterogeneity and its effects on biological systems.
For this solution, customers run their samples of interest on the Chromium Controller or Chromium Connect to generate GEMs containing single cells and prepare single cell libraries using our reagents. Researchers can
13
Table of Contents
sequence these single cell libraries on compatible third-party sequencers, analyze their data using our Cell Ranger analysis pipeline software and visualize their data using our Loupe Cell Browser software. The browser displays a visual representation of the data in which cells having similar gene expression profiles are colored and clustered together. Researchers can explore their data by cluster or gene(s) of interest to derive biological meaning from the visualizations. The following visualization is an example showing single cell profiling of approximately 10,000 mouse brain cells that reveals multiple types of neurons.
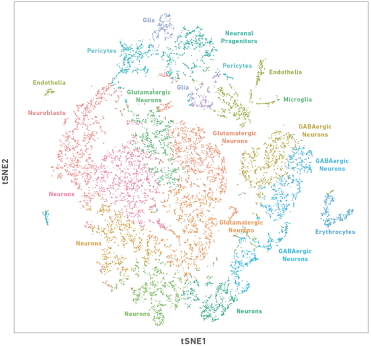
t-SNE projection of approximately 10,000 mouse brain cells derived from the combined cortex, hippocampus and ventricular zones of embryonic day 18 brain tissue. Major subpopulations were identified based on gene markers that are enriched in each class.
Our Single Cell Gene Expression solution uses our proprietary biochemistry, GEM-RT, to capture mRNA molecules with high sensitivity. Sensitivity is the number of different mRNA transcripts that can be detected. Higher sensitivities are required to detect mRNA molecules that are present in low abundance in a cell. Our latest version of this solution uses a new GEM-RT biochemistry that now has an increased sensitivity of up to 8,500 unique transcripts per cell.
Furthermore, our Single Cell Gene Expression solution can be used with our Feature Barcoding technology to simultaneously measure multiple analytes in the same cells. Our Feature Barcoding is highly customizable, allowing our customers to add a barcode to any biological feature they want to analyze in conjunction with gene expression and other biological data. Feature Barcoding can currently be used to:
| • | Measure cell surface proteins simultaneously with gene expression, giving a far fuller picture of the states of single cells that includes the transcriptional profile inside the cells as well as the proteins on the outside of the cells; and |
| • | Measure a set of CRISPR genetic perturbations that have been applied to a cell simultaneously with the resulting changes to gene expression and/or surface protein characterization, allowing users to interrogate the impact of actively perturbing many different aspects of a biological system in a massively parallel fashion. |
14
Table of Contents
Our Single Cell Gene Expression solution, along with our other single cell solutions, are currently used by the Human Cell Atlas (“HCA”). The HCA is an international consortium of prominent genomics researchers that has emerged as the first and largest project aiming to develop reference maps for all cell types in all tissues of the human body. In 2017, we announced a collaboration with the HCA to enable pilot research projects. Under the terms of this collaboration, we provide members of the HCA consortium with discounts on our instruments and consumables. Sales to members of the HCA consortium accounted for less than 10% of our revenue for the years ended December 31, 2018 and December 31, 2019. In much the same way that the standardized reference human genome generated by the Human Genome Project in 2003 paved the way for significant leaps in genomics, we believe that creation of a standardized reference of human cell types is critical for future advances. We believe that our partnership with the HCA is a recognition of the quality of our products and may accelerate their adoption by the wider research community.
To date, more than 540 peer-reviewed scientific publications have been published using data generated by our Single Cell Gene Expression solution with the top research areas being developmental biology, immunology and oncology. This body of work is already yielding insights into diseases. For example, in 2018 researchers used our solution to identify all of the cell types present in the mouse trachea. They found the seven previously known lung cell types, but also found evidence for an eighth rare cell type that was previously unknown. This rare cellular population, comprising less than 1% of all lung cells in both mouse and human, was found to express more than 50% of the lung Cftr protein. Loss of Cftr protein in humans is known to cause cystic fibrosis, a relatively common inherited disorder for which carrier screening is routinely performed. Although the gene underlying cystic fibrosis has been known for nearly 30 years, the cells that may be most critical to understanding the progression of the disease were unknown until single cell expression analysis became available.
Single Cell Immune Profiling
Our Chromium Single Cell Immune Profiling solution is used to study the immune system, which is the body’s natural diagnostic and therapeutic system. The immune system has a vast network of T-cells and B-cells that recognize pathogens using receptor molecules that bind to foreign molecules, or antigens. T-cells and B-cells can generate an immense diversity of receptors that are each specific to a different potential antigen, making it possible for the human body to recognize nearly any conceivable antigen. Our Single Cell Immune Profiling solution enables researchers to study these receptor molecules at the single cell level in conjunction with the transcriptome of the immune cell. Through the use of our solutions, researchers can measure both the T-cell or B-cell receptors while also determining whether the cell has been activated to attack its target or is quiescent and waiting for a threat to emerge. Importantly, because our analysis is performed at the single cell level, we obtain information regarding the pairing of the sequences of the alpha and beta chains of T-cell receptors or the heavy and light chains of B-cell receptors. This paired receptor information is unavailable from traditional bulk approaches for analyzing immune cells and is critical as it is the pair of receptors that defines the targets of each immune cell. By enabling paired immune receptor and transcriptome analysis in massive numbers of immune cells, our Single Cell Immune Profiling solution sheds insight on the clonality, diversity and cellular context of the immune repertoire.
The workflow of this solution, which is similar to that of the Single Cell Gene Expression solution, utilizes our Chromium Controller to generate GEMs, followed by single cell library preparation and sequencing. In contrast to Gene Expression, our Single Cell Immune Profiling solution uses a different biochemistry that obtains sequence information from the 5’ end of mRNA molecules, rather than their 3’ end. This biochemistry allows researchers to capture the more information-rich regions of immune receptor transcripts. Our Single Cell Immune Profiling solution also includes a step of enriching for immune receptor transcripts using specific primers to create an immune-specific library that can be sequenced separately from gene expression. We have also developed specialized pipelines within our Cell Ranger software and a specialized visualization software, Loupe V(D)J Browser, for visualizing the paired immune receptor information derived from this product. This software allows researchers to identify cell type clusters based on gene expression and then layer T-cell and/or B-cell
15
Table of Contents
receptor sequence diversity directly onto that visualization, enabling users to easily derive biological meaning from these two different data types. The following visualization is an example showing the simultaneous assessment of paired immune cell receptor information and gene expression in colorectal cancer cells.
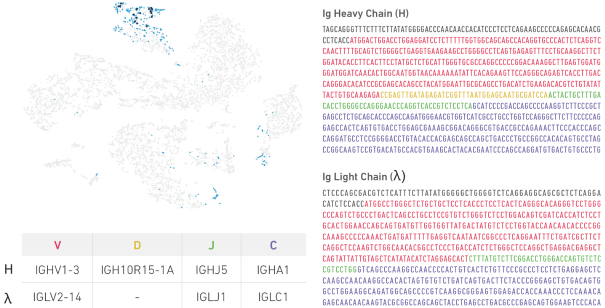
Overlay of gene expression and lg clonotypes for colorectal cancer cells visualized using Loupe Cell Browser. Light blue dots indicate an lg clonotype cell. Dark blue dots show the location of the most prevalent lg clonotype in the plasma cell cluster, with the table outlining the gene calls for the heavy (H) and lambda l light chain. The paired H and l chain V(D)J sequences are shown to the right and corresponding V(D)J nucleotides are color-coded (5’UTR: gray, V: red, D: yellow, J: green, C: purple).
Feature Barcoding can be used in combination with our Single Cell Immune Profiling solution, adding significant multi-omic functionality. Importantly, this functionality allows users to determine the antigen that is bound by immune cells simultaneously with their gene expression. This capability allows researchers to determine both the receptor sequences of individual immune cells as well as an antigen that the receptor targets and makes this analysis practical to perform for millions of immune cells. We believe that the capability to understand immune receptor-antigen interactions at a high-throughput single cell level is tremendously valuable for elucidating the rules of immune cell targeting and can be used to understand disease and identify leads for immunotherapies.
We believe our technology can assist researchers in constructing an immune map of receptor-antigen targeting rules. Such a map would allow for the prediction of the antigens recognized by a given receptor, or conversely, the prediction of receptors that bind to a given antigen. Due to the large number of potential receptor sequences and the large number of possible antigens, researchers previously assumed that computational prediction of the cognate antigen from receptor sequence alone would be impractical. However, recent work demonstrated that T-cell receptor sequences that recognize the same antigen shared enough sequence features that a computational prediction framework for mapping T-cell receptors to antigens is feasible. We believe that our Single Cell Immune Profiling Solution combined with Feature Barcoding will enable extending this work at far higher scales.
As a proof of concept for the immune map, we presented at the Advances of Genomes, Biology and Technology (“AGBT”) meeting in February 2019 results from a single experiment utilizing our Single Cell Immune Profiling Solution on approximately 200,000 T-cells from four individuals and 44 feature-barcoded antigens to identify T-cell receptor-antigen pairs. This experiment, which took place over approximately one week, generated a paired receptor-antigen dataset six times larger than the collection of all previously published receptor-antigen
16
Table of Contents
pairings. This leap was made possible by the tremendous resolution and scale with which the immune system can be analyzed using our solutions.
Single Cell ATAC
Our Chromium Single Cell ATAC solution enables customers to understand the epigenetic state—including how the genome and its surroundings are modified to “open” and “closed” states, affecting how genes are regulated—in up to millions of cells. While our Single Cell Gene Expression solution answers the “what” of what makes two cells different from each other, our Single Cell ATAC solution answers the “how.” These two products are highly complementary and can be used as a powerful combination to understand both the cause and effect of gene regulation.
ATAC-seq stands for “Assay for Transposase Accessible Chromatin using sequencing.” This technique uses an engineered transposase enzyme to insert nucleic acids tags into the genome while also excising the tagged sequences from its surroundings. ATAC-seq is based on the fact that the transposase enzyme will preferentially tag and excise regions of the genome that have an “open” chromatin state that is unimpeded by proteins bound to genomic DNA. The tagged sequences can be sequenced to infer genomic regions of increased chromatin accessibility as well as map regions that are bound by transcription factor proteins responsible for regulating gene expression. ATAC–seq was pioneered by researchers at Stanford University and is exclusively licensed to us. ATAC-seq has now become an important tool in epigenetics and genome-regulation research.
Our Single Cell ATAC solution uses the ATAC-seq assay in conjunction with our Chromium platform to create a product for high-throughput epigenetic interrogation at single cell resolution. In the workflow, users treat cell nuclei with transposase enzyme and then use our Chromium Controller to encapsulate these nuclei in GEMs. The tagged sequences from the nuclei are barcoded inside GEMs and then processed to generate sequencing libraries. Sequencing reads are analyzed using our Cell Ranger ATAC software, and visualized using our Loupe Cell Browser, which has been especially configured to display epigenetic data. The following visualization is an example of plots showing open chromatin around genes that are specifically associated with certain cell types.
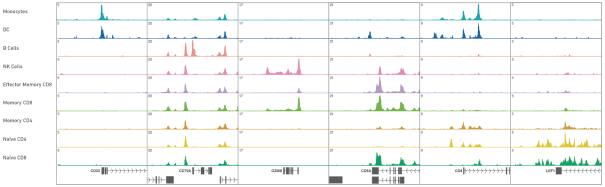
Open chromatin signals around marker genes are specifically associated with the cell type of expression. Plots show aggregate chromatin accessibility profiles for each cluster at several marker gene loci.
Though we only launched this product in the fourth quarter of 2018, our Single Cell ATAC solution has already been adopted by a number of key opinion leaders. In one example, researchers used a combination of single cell transcriptome profiling and single cell ATAC-seq to identify enhancer elements that mark specific sub-classes of cells in the mouse brain. Once these elements are identified they can be targeted in order to generate mice with specific cell types labeled or perturbed at a level of specificity not usually achievable using gene expression alone. The ability to specifically target new cell types of interest allows in-depth investigations of the functions of those targeted cells.
17
Table of Contents
Single Cell Copy Number Variation (CNV)
Our Chromium Single Cell CNV solution enables the measurement of DNA changes—specifically changes in the number of copies of DNA segments—on a genome-wide basis at single cell resolution. This product is particularly useful for cancer research. Tumor cells frequently mutate and change such that a single “tumor” is actually comprised of many different types of tumor cells having different DNA mutations. This tumor heterogeneity allows different tumor cell types to evolve separately and respond differently to treatments. Our Single Cell CNV solution product enables researchers to systematically measure genomic differences between cells, providing information that is crucial in understanding how cancers evolve and can provide valuable insights into cancer treatment.
Our Single Cell CNV solution leverages a two-step process in which we first encapsulate cellular contents into cell beads, which are composed of a synthetic material that renders the genomic contents of individual cells accessible to our assays’ biochemistries. Once cell beads are formed, they are encapsulated into GEMs along with barcoded gel beads and undergo a reaction to generate barcoded sequencing libraries. Our Single Cell CNV solution has a cell throughput of up to 20,000 cells per run, cell capture rates of approximately 15% and doublet rates of less than 1% per 1,000 cells. Sequencing data is analyzed using our Cell Ranger DNA pipelines software, and visualized using our Loupe scDNA Browser, which offers intuitive visualization of DNA copy number changes along each human chromosome in the genome. The following visualization is an example of the detection of rare clones of a cell population having a particular DNA copy number variation.
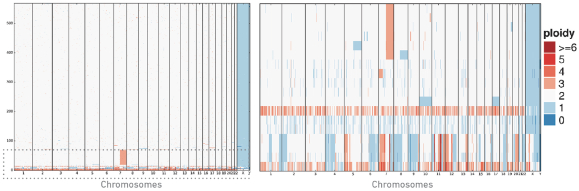
Left: Heatmap showing the CNV profiles of 569 cells after 1% spike-in of MKN-45 cells (cancer cell line) into a BJ diploid cell line sample. The CNV profiles primarily correspond to the diploid cell line, while the bottom region of the heatmap corresponds to the MKN-45 cells.
Right: Enlargement of the bottom region of the heatmap highlighting the heterogeneous, non-diploid CNV profiles of the MKN-45 cells and an amplification in chromosome 7 of the diploid cell line, demonstrating that cell lines may not always be homogeneous.
This product, which became widely available in the third quarter of 2018, is yielding insights into disease states. For example, in a study undertaken by a major research university utilizing our products, gastric cancer samples were subjected to both single cell gene expression profiling and single cell CNV profiling. This combined approach allowed the direct comparison of sub-clonal structure revealed by DNA and RNA profiling. This study revealed that the use of both assays provided a more complete picture of the structure of the different cancerous and non-cancerous cells in their sample. This solution provides more resolution to researchers, enabling them to better understand the variations between the DNA in cloned cells.
For information relating to limitations on our ability to sell our Single Cell CNV solution, see the section titled “Risk Factors—Risks related to litigation and our intellectual property—We are involved in significant litigation which has consumed significant resources and management time and adverse resolution of these lawsuits could require us to pay significant damages, and prevent us from selling our products, which would severely adversely impact our business, financial condition or results of operations.”
18
Table of Contents
Our Visium platform
Our Visium platform enables researchers to understand the spatial positions of biological analytes within tissues at high resolution. Such spatial analysis can be critically important in understanding tissue function in both healthy and disease states. For example, in the context of neurobiology, neuronal degeneration in the substantia nigra, an area of the brain associated with movement, results in Parkinson’s disease, while degeneration of upper and lower motor neurons results in amyotrophic lateral sclerosis, or Lou Gehrig’s disease. In the context of cancer treatment, the knowledge of whether T-cells have infiltrated inside of a tumor, rather than merely surrounding the tumor, is an important prognostic indicator. Understanding the spatial relationship of the biological analytes in tissues may hold the key to unlocking the underlying causes and identifying cures for such diseases.
Our Visium products are based on technology that we acquired from Spatial Transcriptomics in 2018. Spatial Transcriptomics utilized arrays having specialized probes on their surfaces that are encoded with the spatial position of the probe. In the Visium product workflow, a tissue sample is placed onto the array and reagents are added by the user to create barcoded molecules from the array probes and the biological material in the tissues. This barcoded material encodes the spatial information that was contained in the probes. Users then pool the material from the array and follow a protocol to create libraries of molecules that can be sequenced using a standard sequencer. After sequencing, analysis software assigns each sequencing read to its spatial position of origin. Collectively, the spatially defined reads provide a visual depiction of the locations and patterns of large numbers of biological analytes simultaneously in the tissue sample.
The Spatial Transcriptomics product performed spatial analysis of mRNAs using arrays that had 1,000 probes with distances of approximately 200 microns between probes. This product was used to identify heterogeneity in metastatic melanoma and to demonstrate that there was significantly more heterogeneity than could be predicted by manual pathology annotation. In an independent study of mouse and human amyotrophic lateral sclerosis samples, researchers were able to observe changes in RNA expression over the disease course, while preserving the understanding of those changes in the spatial context. This allowed them to visualize the key changes that occur in brain regions before and during neuronal degeneration.
Our Visium solution for spatial gene expression analysis was launched in late 2019. Our Visium Spatial Gene Expression product has significant improvements over the Spatial Transcriptomics product, including increased spatial resolution, increased gene sensitivity, a simpler workflow and fully developed analysis and visualization software. We intend to continuously innovate to provide enhanced resolution, performance, throughput and efficiency for our existing Visium Spatial Gene Expression product and we also intend to develop additional Visium spatial products using our other assays which, analogously to the Chromium platform, allow spatial interrogation of a broader range of biological analytes including DNA, immune molecules, epigenetics and protein.
Our analysis and visualization software
Our software is a fundamental part of our integrated solutions and is comprised of two parts, analysis and visualization. Our analysis pipeline software tools, including Cell Ranger, Space Ranger, Long Ranger and Supernova, take raw sequencing data as input and transform them into biologically meaningful results. Customers can further analyze these results in their own or third-party tools, or take them into our Loupe family of visualization software tools, which allow users to draw insights using an intuitive user interface without writing code. Our analysis and visualization software is generally available to researchers free of charge, so as to accelerate the adoption of our products and software as a standard for genome, single cell and spatial analysis.
Since our launch, we have shipped more than 50 major releases of our software. We believe that the main factors that differentiate our software include:
| • | Ease of installation and use. Much of the software typically used in bioinformatics analysis requires substantial programming expertise to use and even just to install. We invest substantial effort in making our |
19
Table of Contents
| software both easy to install and use, so researchers can focus on their experiments rather than installation requirements. |
| • | Advanced algorithms and methods. Our software makes the latest analytical methods easily accessible to researchers and we are constantly working to improve our software’s ability to realize the maximum value and benefit of the data produced by our chemistries and platforms. |
| • | Scalable from workstation to cluster to cloud. A robust, common architecture underlying our software tools gives researchers maximum flexibility to run our software on-premises on individual workstations or servers, on large high-performance compute clusters and in private and public clouds. |
Peer-reviewed scientific publications using our products
To date, more than 700 peer-reviewed articles have been published based on data generated using our products. More than 125 of these articles were published in three of the most highly regarded journals: Cell, Nature and Science. Underscoring the reach of our products, these publications cover a wide range of research and applied areas from cell biology to genetic health to neuroscience with the top three areas of publication being developmental biology, immunology and cancer research.
| Research area |
Number of articles | Percentage | ||||||
| Developmental Biology |
158 | 16.9 | % | |||||
| Immunology |
138 | 14.8 | % | |||||
| Cancer Research |
99 | 10.6 | % | |||||
| Computational Method |
85 | 9.1 | % | |||||
| Neuroscience |
73 | 7.8 | % | |||||
| Genome Assembly |
58 | 6.2 | % | |||||
| Cell Biology |
52 | 5.6 | % | |||||
| Cell Atlas |
47 | 5.0 | % | |||||
| Functional Genomics |
42 | 4.5 | % | |||||
| Assay Method |
41 | 4.4 | % | |||||
| Genetic Health |
34 | 3.6 | % | |||||
| Immuno-oncology |
24 | 2.6 | % | |||||
| Microbiology |
18 | 1.9 | % | |||||
| Agrigenomics |
16 | 1.7 | % | |||||
| Population Genetics |
15 | 1.6 | % | |||||
| Reproductive Biology |
11 | 1.2 | % | |||||
| Conservation Biology |
10 | 1.1 | % | |||||
| Single Cell Multi-omics Method |
8 | 0.9 | % | |||||
| Method Comparison
|
|
5
|
|
|
0.5
|
%
| ||
20
Table of Contents
We have seen robust quarter-over-quarter growth in the number of publications commensurate with our commercial growth and success:
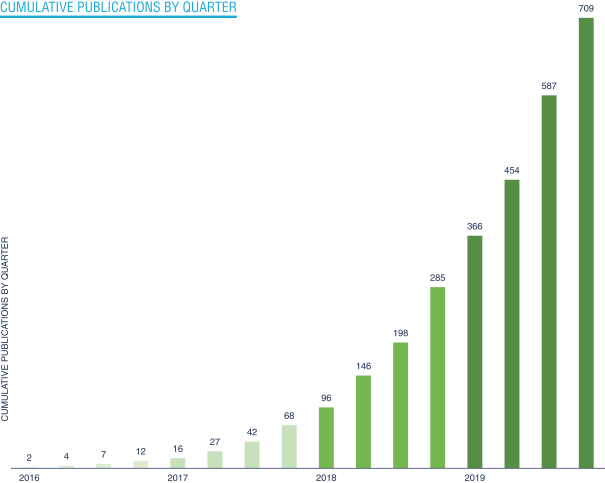
These publications describe, for example, the use of our products to:
| • | Construct a molecular map of cellular differentiation during early development in mice; |
| • | Understand kidney tumors by studying cell types and compositions in malignant versus normal cells; |
| • | Track patients with aggressive skin cancer undergoing immunotherapy to understand how the body develops resistance to immunotherapy; |
| • | Understand why multiple myeloma, a cancer originating from plasma cells, is symptomatic or asymptomatic depending on underlying cell types, and identify rare circulating tumor cells as a potential early diagnostic indicator; |
| • | Demonstrate that transcriptional diversity in cutaneous T cell lymphomas can be used to predict disease stage and guide treatment; |
| • | Identify non-essential genes in humans; |
| • | Identify structural rearrangements in cancer; and |
| • | Study the microbiome. |
21
Table of Contents
Research and development
Our research and development teams have designed and developed our proprietary products using an interdisciplinary approach that combines expertise across the fields of chemistry, molecular biology, microfluidics, hardware, computational biology and software engineering. Our research and development groups work together in cross-functional project teams; an approach that has been key to our success to date. Our research and development teams are currently located in our headquarters in Pleasanton, California and in Stockholm, Sweden.
The overarching goals of our research and development programs are to continue to bring new technologies to market that address the most pressing questions in biology and to provide exponential advances in human health. To this end, we plan to focus our research and development efforts on the following areas:
Improve the performance of our existing solutions. We plan to improve our existing assays and software. These improvements may provide increased sensitivity to capture greater amounts of signal from biological analytes, allow broader types of biological samples to be interrogated with our solutions and increase the amount of biological information that can be obtained using our software.
Develop new solutions for our Chromium platform. We plan to expand the range of solutions that are available on our Chromium platform to allow researchers access to new types of biological information. For example, we are planning to develop additional multi-omics solutions on our Chromium platform for simultaneous interrogation of different classes of analytes.
Develop our Visium platform. In 2019, we introduced the first product on our Visium platform, which offers high spatial resolution, high sensitivity, efficient workflow and analysis and visualization software. We are working to develop new technologies for our Visium platform that will further enhance the spatial resolution, usability and automation of our platform.
Improve and develop new capabilities for our Chromium instruments. We plan to develop new capabilities that would improve the usability and increase the performance of our Chromium instruments by increasing automation, throughput, workflow visibility or troubleshooting capabilities.
Develop combined software and workflows across multiple solutions. We plan to develop workflows that enable users to run multiple assays on the same biological samples and software that simultaneously analyzes the data generated from these multiple assays. We plan to do this for key solution combinations where the information obtained from the two solutions is highly complementary.
Investigate new technologies. We will seek to both develop and acquire new technologies that could be additive to or complementary with our current portfolio.
Our research and development costs were $47.5 million and $83.1 million for the years ended December 31, 2018 and 2019, respectively. In-process research and development costs, consisting of costs incurred to acquire intellectual property for research and development were $62.4 million for the year ended December 31, 2018. There were no similar purchases in the year ended December 31, 2019. As of December 31, 2019, we employed 223 employees in research and development. Looking forward, we will continue to invest in efforts to support the ongoing development of our instruments, consumables and software, as well as enhance the overall performance of our solutions.
Commercial
Commercial team
We began the full launch of our first product in mid-2015 and have since sold thousands of products globally. Our customers primarily include academic, government, biopharmaceutical, biotechnology and other institutions
22
Table of Contents
focused on life sciences research. We sell our products primarily through our own direct sales force in North America and certain regions of Europe. As of December 31, 2019, our commercial organization consisted of over 200 full time employees, including more than 75 commissioned sales representatives, many with Ph.D. degrees and many with significant industry experience. We sell our products through third-party distributors in Asia, certain regions of Europe, Oceania, South America, the Middle East and Africa. We have sold products in more than 40 countries.
For both the years ended December 31, 2018 and 2019, no single customer, including distributors, represented greater than 10% of our business. For both the years ended December 31, 2018 and 2019, sales to academic institutions represented approximately 70% of our direct sales revenue. We expect that sales to biopharmaceutical companies will represent a growing proportion of our revenue in the future.
Commercial strategy
Our products are integrated solutions comprised of instruments, consumables and software. We aim to drive customer adoption and the installed base of our Chromium instruments which then forms a base of users who drive revenue by purchasing our consumables. Our products are designed to be easy to install and use without the need for extensive training.
Our customers primarily include academic, government, biopharmaceutical, biotechnology and other institutions. Our strategy typically involves targeting key opinion leaders during the initial phase of our product launches, after which we aim to expand adoption of our products across a broader base of customers. As our customer base has grown, we have been able to leverage our larger installed base of instruments to accelerate the adoption of new solutions. Approximately half of our customers purchased our consumables relating to more than one of our solutions in both the years ended December 31, 2018 and 2019.
Our commercial strategy focuses on ensuring our customers are successful with our products. These successes often result in publications which can drive increased public awareness and further market adoption. Since our first product launch in 2015, there have been more than 700 publications by researchers using data generated by our products.
Our direct sales and marketing efforts are targeted at the principal investigators, research scientists, department heads, research laboratory directors and core facility directors at leading academic institutions, biopharmaceutical companies and publicly and privately funded research institutions who control the buying decision. Due to the pricing of our instruments and consumables, the buying decision is typically made by the principal investigator rather than by committee or department chair, which we believe simplifies the purchasing decision and has helped accelerate adoption of our products. The sales cycle of our Chromium Controller instrument is typically between four and six months.
We also target researchers who do not own their own Chromium Controller instrument, but who have access to one, which we refer to as “halo users.” By sharing one instrument across groups within an institution, multiple halo users are able to utilize the instrument for their own research and experiments, contributing meaningfully to consumable pull-through on just one instrument. Halo users help drive consumable revenue and utilization of our consumable products and may become future purchasers of a Chromium instrument.
The use of our products requires the access to, but not necessarily the ownership of, a third-party next-generation sequencer. Since sequencers are often accessible as a shared resource, our target customer base is broader than those who own a next-generation sequencer.
We increase awareness of our products among our target customers through direct sales calls, trade shows, seminars, academic conferences, web presence, social media and other forms of internet marketing. We supplement these traditional marketing efforts by fostering an active online community of users of our products consisting of communities, forums and blogs with internally generated and user-generated content. We also provide education and training resources, both online and in person.
23
Table of Contents
Suppliers and manufacturing
Consumables
The majority of our consumable products are manufactured in-house at our facilities in Pleasanton, California. These manufacturing operations include: gel bead generation, surfactant synthesis and emulsion oil formulation, reagent formulation and tube filling, microfluidic chip manufacturing, kit assembly and packaging as well as analytical and functional quality control testing. We achieved ISO 9001:2015 certification in the fourth quarter of 2017, which covers design, development, manufacturing, distribution, service and sales.
We obtain some components of our consumables from third-party suppliers. While some of these components are sourced from a single supplier, we have qualified second sources for several of our critical reagents, including microfluidic chips, arrays and oligonucleotides. We believe that having dual sources for our components helps reduce the risk of a production delay caused by a disruption in the supply of a critical component. For further discussion of the risks relating to our third-party suppliers, see the section titled “Risk Factors—Risks related to our business and industry—We are dependent on single source and sole source suppliers for some of the components and materials used in our products and the loss of any of these suppliers could harm our business.”
Instruments
We outsource manufacturing for our Chromium Controller to a qualified contract manufacturer. This manufacturer has represented to us that they maintain ISO 13485 certification. Our recently introduced Chromium Connect includes an automated workflow liquid handling robot which is manufactured by our partner.
Employees
As of December 31, 2019, we had 584 employees, including 223 in research and development, 219 in sales, marketing and support, 93 in general and administrative and 49 in manufacturing. None of our United States employees are represented by a labor union or covered under a collective bargaining agreement and we consider our relationship with our employees to be positive. As of December 31, 2019, 493 of our employees were employed in the United States and 91 were employed outside the United States.
Competition
The life sciences market is highly competitive. There are other companies, both established and early stage, that have indicated that they are designing, manufacturing and marketing products for, among other things, genomics analysis, single cell analysis and spatial analysis. These companies include Becton, Dickinson and Company, Bio-Rad Laboratories, Inc. and Nanostring Technologies, Inc., each of which has products that compete to varying degrees with some but not all of our product solutions, as well as a number of other emerging and established companies. Some of these companies may have substantially greater financial and other resources than us, including larger research and development staff or more established marketing and sales forces. Other competitors are in the process of developing novel technologies for the life sciences market which may lead to products that rival or replace our products.
However, we believe we are substantially differentiated from our competitors for many reasons, including our position as a leader in a large and growing market, proprietary technologies, rigorous product development processes and scalable infrastructure, customer experience and multidisciplinary teams. We believe our customers favor our products and company because of these differentiators.
For further discussion of the risks we face relating to competition, see the section titled “Risk Factors—Risks related to our business and industry—Our markets are highly competitive. If we fail to compete effectively, our business and operating results will suffer.”
24
Table of Contents
Government regulation
The development, testing, manufacturing, marketing, post-market surveillance, distribution, advertising and labeling of certain of medical devices are subject to regulation in the United States by the Center for Devices and Radiological Health of the U.S. Food and Drug Administration (“FDA”) under the Federal Food, Drug, and Cosmetic Act (“FDC Act”) and comparable state and international agencies. A medical device is an instrument, apparatus, implement, machine, contrivance, implant, in vitro reagent or other similar or related article, including any component part or accessory, which is (1) intended for use in the diagnosis of disease or other conditions, or in the cure, mitigation, treatment or prevention of disease, in man or other animals, or (2) intended to affect the structure or any function of the body of man or other animals and which does not achieve any of its primary intended purposes through chemical action within or on the body of man or other animals and which is not dependent upon being metabolized for the achievement of any of its primary intended purposes. Medical devices to be commercially distributed in the United States must receive from the FDA either clearance of a premarket notification, known as 510(k), or premarket approval pursuant to the FDC Act prior to marketing, unless subject to an exemption. None of our products are currently medical devices and all of our products are currently designed “For Research Use Only. Not for use in diagnostic procedures” (“RUO”) products, as they are not meant for clinical applications. RUO products are not regulated as medical devices and are therefore not subject to the regulatory requirements enforced by the FDA. The products must bear the statement: “For Research Use Only. Not for Use in Diagnostic Procedures.” RUO products cannot make any claims related to safety, effectiveness or diagnostic utility and they cannot be intended for human clinical diagnostic use. In November 2013, the FDA issued a final guidance on products labeled RUO, which, among other things, reaffirmed that a company may not make any clinical or diagnostic claims about an RUO product. The FDA will also evaluate the totality of the circumstances to determine if the product is intended for diagnostic purposes. If FDA were to determine, based on the totality of circumstances, that our products labeled and marketed for RUO are intended for diagnostic purposes, they would be considered medical devices that will require clearance or approval prior to commercialization. Further, sales of devices for diagnostic purposes may subject us to additional healthcare regulation. We continue to monitor the changing legal and regulatory landscape to ensure our compliance with any applicable rules, laws and regulations.
Intellectual property
Our success depends in part on our ability to obtain and maintain intellectual property protection for our products and technology. We utilize a variety of intellectual property protection strategies, including patents, trademarks, trade secrets and other methods of protecting proprietary information. As of December 31, 2019, worldwide we owned or exclusively licensed over 200 issued or allowed patents and 480 pending patent applications.
Our customers may apply for and receive patents of their own relating to underlying discoveries resulting from the use of our products in areas such as developmental biology, immunology and oncology, areas where we do not currently hold nor believe we require extensive patent protection.
We also license additional patents on a non-exclusive and/or territory restricted basis. Patent rights generally have a term of twenty years from the date in which they were filed. We own registered trademarks on 10X GENOMICS and product related brand names in the United States and worldwide.
We license certain U.S. and foreign patents and patent applications from various third parties for use in our products and technology. Some of these license agreements provide use the exclusive right to practice the licensed intellectual property subject to specific field or territory restrictions and certain fee and royalty arrangements. Subject to common termination rights, these exclusive license agreements typically are in force until the last of the licensed patents expires or, in some cases, upon our failure to achieve specified sales volume thresholds. Certain of these agreements also require that any products related to the licensed patents be substantially manufactured in the United States.
In connection with our acquisition of Spatial Transcriptomics, we are required to make contingent payments to the sellers based on revenue from sales of Spatial Transcriptomics products and Visium products, for the years
25
Table of Contents
ended December 31, 2019 through December 31, 2022. These contingent payments are equal to a percentage in the teens multiplied by such revenue. Pursuant to the license agreement we entered into with The Board of Trustees of the Leland Stanford Junior University (“Stanford”), we are required to pay Stanford a low single-digit royalty percentage based on the net revenue of certain ATAC-seq products during the applicable term of the licensed patents. Pursuant to the license agreement we entered into with the President and Fellows of Harvard University (“Harvard”), we are required to pay Harvard a low single-digit royalty percentage based on the net revenue of certain products covered by the licensed patents during the applicable term of those patents. For the years ended December 31, 2018 and 2019, we made aggregate contingent and royalty payments under the Spatial Transcriptomics acquisition agreement, Stanford license agreement and Harvard license agreement, collectively, of less than $4.0 million and $6.6 million, respectively. We expect the size of these payments to grow as our business grows.
The patents we own expire beginning in 2033 and the patents we exclusively license expire beginning in 2028. The Harvard license is exclusive in the field of sequencing sample preparation and single cell analysis and is projected to terminate in 2034. The Stanford license is exclusive in all fields and the initial exclusivity period of the license terminates in 2025, however we have the option to extend the exclusivity period for additional one-year terms if we meet certain minimum sales thresholds beginning in 2025. If the exclusivity period ends or we fail to extend the exclusivity period, we retain a non-exclusive license to the applicable patents. The Stanford license is projected to terminate in 2038. Both the Harvard and Stanford licenses are worldwide licenses.
We intend to pursue additional intellectual property protection to the extent we believe it would be beneficial and cost-effective. We cannot provide any assurance that any of our current or future patent applications will result in the issuance of patents, or that any of our current or future issued patents will effectively protect any of our products or technology from infringement or prevent others from commercializing infringing products or technology.
For further discussion of the risks relating to intellectual property, see the section titled “Risk Factors—Risks related to litigation and our intellectual property.”
Corporate information
We were incorporated in the State of Delaware on July 2, 2012 under the name Avante Biosystems, Inc. We changed our name to 10X Technologies, Inc. in September 2012 and to 10x Genomics, Inc. in November 2014. Our principal executive offices are located at 6230 Stoneridge Mall Road, Pleasanton, California 94588, and our telephone number is (925) 401-7300. We completed our initial public offering in September 2019, and our Class A common stock is listed on the Nasdaq Global Select Market under the symbol “TXG.”
Available information
Our website is located at https://www.10xgenomics.com/, and our investor relations website is located at https://investors.10xgenomics.com/. We have used, and intend to continue to use, our investor relations website as a means of disclosing material non-public information and for complying with our disclosure obligations under Regulation FD. The following filings are available through our investor relations website as soon as reasonably practicable after we file them with, or furnish them to, the Securities and Exchange Commission (“SEC”): Annual Reports on Form 10-K, Quarterly Reports on Form 10-Q, Current Reports on Form 8-K and our Proxy Statement for our annual meeting of stockholders. These filings are also available for download free of charge through a link on our investor relations website. The SEC also maintains an Internet website at www.sec.gov that contains reports, proxy statements and other information about issuers, like us, that file electronically with the SEC. The contents of these websites are not incorporated into this filing. Further, our references to the URLs for these websites are intended to be inactive textual references only.
26
Table of Contents
Investing in our Class A common stock involves a high degree of risk. You should carefully consider the risks described below, as well as the other information in this Annual Report, including our financial statements and the related notes and the section titled “Management’s discussion and analysis of financial condition and results of operations” in this Annual Report, before deciding whether to invest in our Class A common stock. The occurrence of any of the events or developments described below could harm our business, financial condition, results of operations and growth prospects. In such an event, the market price of our Class A common stock could decline and you may lose all or part of your investment. Additional risks and uncertainties not presently known to us or that we currently deem immaterial also may impair our business operations and the market price of our Class A common stock.
Risks related to our business and industry
We have incurred significant losses since inception, we expect to incur losses in the future and we may not be able to generate sufficient revenue to achieve and maintain profitability.
We have incurred significant losses since we were formed in 2012 and expect to incur losses in the future. We incurred net losses of $31.3 million and $112.5 million for the years ended December 31, 2019 and 2018, respectively. As of December 31, 2019, we had an accumulated deficit of $262.4 million. We expect that our losses will continue in the near term as we continue to invest significant additional funds toward ongoing research and development and toward the timely commercialization of both new products and improved versions of existing products. We also expect that our operating expenses will increase as a result of being a public company and will continue to increase as we grow our business. To date, we have financed our operations principally from the sale of convertible preferred stock, the sale of Class A common stock in our IPO, revenue from sales of our products and the incurrence of indebtedness. There can be no assurance that our revenue and gross profit will increase sufficiently such that our net losses decline, or we attain profitability, in the future. Further, our limited operating history and rapid revenue growth over the last several years make it difficult to effectively plan for and model future growth and operating expenses. Our ability to achieve or sustain profitability is based on numerous factors, many of which are beyond our control, including the impact of market acceptance of our products, future product development, our market penetration and margins and current and future litigation. We may never be able to generate sufficient revenue to achieve or sustain profitability and our recent and historical growth should not be considered indicative of our future performance. Our failure to achieve or maintain profitability could negatively impact the value of our Class A common stock.
In particular, we are subject to significant risks of losses related to current litigation matters. See “—Risks related to litigation and our intellectual property.”
Our markets are highly competitive. If we fail to compete effectively, our business and operating results will suffer.
We face significant competition. We currently compete with both established and early-stage companies that design, manufacture and market instruments, consumables and software for, among other applications, genomics, single cell analysis, spatial analysis and immunology. We believe our competitors include Becton, Dickinson and Company, Bio-Rad Laboratories, Inc. (“Bio-Rad”) and Nanostring Technologies, Inc., each of which has products that compete to varying degrees with some but not all of our product solutions, as well as a number of other emerging and established companies.
Some of our current competitors are large publicly traded companies, or are divisions of large publicly traded companies, and may enjoy a number of competitive advantages over us, including:
| • | greater name and brand recognition; |
| • | greater financial and human resources; |
27
Table of Contents
| • | broader product lines; |
| • | larger sales forces and more established distributor networks; |
| • | substantial intellectual property portfolios; |
| • | larger and more established customer bases and relationships; and |
| • | better established, larger scale and lower cost manufacturing capabilities. |
We also face competition from researchers developing their own solutions. The area in which we compete involves rapid innovation and some of our customers have in the past, and more may in the future, elect to create their own platform or assays rather than rely on a third-party supplier such as ourselves. This is particularly true for the largest research centers and labs who are continually testing and trying new technologies, whether from a third-party vendor or developed internally. We also compete for the resources our customers allocate for purchasing a wide range of products used to analyze biological systems, some of which are additive to or complementary with our own but not directly competitive.
We cannot assure investors that our products will compete favorably or that we will be successful in the face of increasing competition from products and technologies introduced by our existing competitors, companies entering our markets or developed by our customers internally. In addition, we cannot assure investors that our competitors do not have or will not develop products or technologies that currently or in the future will enable them to produce competitive products with greater capabilities or at lower costs than ours or that are able to run comparable experiments at a lower total experiment cost. Any failure to compete effectively could materially and adversely affect our business, financial condition and operating results.
Our business depends significantly on the success of our Next GEM microfluidic chip.
Since our inception through December 31, 2019, a substantial number of our Chromium instruments utilized our GEM microfluidic chips and associated consumables. In November 2018, a jury concluded that our Chromium instruments operating these chips and associated consumables infringe certain of Bio-Rad’s patents. We have dedicated significant resources to designing and manufacturing our new Next GEM microfluidic chip, which uses a microfluidic architecture with fundamentally different physics from our GEM microfluidic chip. We introduced our Next GEM microfluidic chips for our Single Cell Gene Expression, Single Cell Immune Profiling and Single Cell ATAC solutions in the second quarter of 2019. We plan to gradually phase out our GEM microfluidic chips and anticipate that our Chromium products utilizing our Next GEM microfluidic chips will become an increasing percentage of our sales and will constitute substantially all of our Chromium consumables sales by the end of 2020. In addition, we have not yet developed Next GEM microfluidic chips for our Single Cell CNV solution. Although the Federal Circuit has stayed the injunction with respect to our Single Cell CNV solution during the pendency of the appeal, we have not yet released a new version of our instrument that would allow our customers to use this solution using our GEM microfluidic chip during the pendency of the appeal. Furthermore, it is possible that the injunction could be reinstated with respect to our Single Cell CNV solution using our GEM microfluidic chips after the appeal if the Federal Circuit does not rule in our favor. Until we are able to completely transition to our Next GEM microfluidic chip design, our margins will be negatively impacted by any royalty obligations that result from ongoing litigation matters.
Although our Next GEM microfluidic chips were designed to replace our GEM microfluidic chips, we cannot assure you that we will be able to make our Next GEM microfluidic chip work with all of our solutions, that our Next GEM microfluidic chip will allow our customers to retain the level of performance or quality they have come to expect using our GEM microfluidic chip, that our Next GEM microfluidic chip will replace the sales of our GEM microfluidic chip or that we will be able to manufacture our Next GEM microfluidic chip in sufficient volumes and in sufficient quality in a timely fashion. While we believe that our Chromium solutions, when used with our Next GEM microfluidic chip, do not infringe the asserted Bio-Rad patents, we cannot assure you that our Next GEM microfluidic chip would not be found to infringe the patents asserted Bio-Rad patents or other
28
Table of Contents
patents, which could prevent us from making, selling and importing our Next GEM microfluidic chips or substantially all of our products. Since August 28, 2019, all Chromium instruments that we sell and have sold operate exclusively with our Next GEM solutions. We believe that these solutions are very important to our customers’ research but the delay caused by the injunction may slow customer adoption of our products or cause customers to investigate the availability of competing products or technologies.
We have incurred and expect to continue to incur additional expenses in the near term related to the introduction of, and transition to, our Next GEM microfluidic chip. Our failure to effectively manage product transitions or accurately forecast customer demand with respect to both instruments and consumables may lead to an increased risk of insufficient, excess or obsolete inventory and resulting charges. We expect that as we transition to our Next GEM microfluidic chips we may need to write down the value of our GEM microfluidic chips and associated consumables we currently hold in inventory. As we transition to our Next GEM microfluidic chips, we cannot guarantee that our customers will quickly switch to using our Next GEM microfluidic chips in their research. Customers may delay transitioning to our Next GEM microfluidic chips for a variety of reasons, including if they have experiments underway for which they do not want to introduce additional variables. More significantly, customers may decline to purchase our products altogether if they do not believe that our Next GEM microfluidic chips can produce results that are reliable, consistent and comparable to our GEM microfluidic chips.
For additional information relating to this litigation, see the section titled “Risk Factors—Risks related to litigation and our intellectual property—We are involved in significant litigation which has consumed significant resources and management time and adverse resolution of these lawsuits could require us to pay significant damages, and prevent us from selling our products, which would severely adversely impact our business, financial condition or results of operations.”
We are significantly dependent upon revenue generated from the sale of our Chromium solutions, and in particular our Single Cell Gene Expression solutions.
We currently generate substantially all of our revenue from the sale of our Chromium instruments, which we refer to as “instruments,” and our proprietary microfluidic chips, slides, reagents and other consumables for both our Visium and Chromium solutions, which we refer to as “consumables.” In particular, we are dependent upon revenue generated from sales of our Single Cell Gene Expression consumables. There can be no assurance that we will be able to design future products, particularly non-Chromium product lines, that will meet the expectations of our customers or that our future products will become commercially viable. As technologies change in the future for research equipment in general and in genomics solutions specifically, we will be expected to upgrade or adapt our products in order to keep up with the latest technology. To date we have limited experience simultaneously designing, testing, manufacturing and selling non-Chromium products and there can be no assurance we will be able to do so. Our sales expectations are based in part on the assumption that our recently introduced Chromium Connect instrument will increase workflows for our future customers and their associated purchases of our consumables. If sales of our Chromium Connect instruments fail to materialize so will the related consumable sales and associated revenue. Our sales expectations are also based in part on the continued success of our Single Cell Gene Expression solutions. If our Single Cell Immune Profiling consumables, which were introduced in 2017, and Single Cell ATAC consumables, which were introduced in 2018, or our Visium Spatial Gene Expression product, which was introduced in 2019, fail to achieve sufficient market acceptance or sales of our Single Cell Gene Expression consumables decrease, our consumables revenue could be materially and adversely impacted.
Our business currently depends significantly on research and development spending by academic institutions, a reduction in which could limit demand for our products and adversely affect our business and operating results.
In the year ended December 31, 2019, approximately 70% of our direct sales revenue came from sales to academic institutions. Much of their funding was, in turn, provided by various state, federal and international
29
Table of Contents
government agencies. In the near term, we expect that a large portion of our revenue will continue to be derived from sales of Chromium products, including our instruments and consumables, to academic institutions. As a result, in the near term, the demand for our products will depend upon the research and development budgets of these customers, which are impacted by factors beyond our control, such as:
| • | decreases in government funding of research and development; |
| • | changes to programs that provide funding to research laboratories and institutions, including changes in the amount of funds allocated to different areas of research or changes that have the effect of increasing the length of the funding process; |
| • | macroeconomic conditions and the political climate; |
| • | scientists’ and customers’ opinions of the utility of new products or services; |
| • | citation of new products or services in published research; |
| • | changes in the regulatory environment; |
| • | differences in budgetary cycles; |
| • | competitor product offerings or pricing; |
| • | market-driven pressures to consolidate operations and reduce costs; and |
| • | market acceptance of relatively new technologies, such as ours. |
In addition, various state, federal and international agencies that provide grants and other funding may be subject to stringent budgetary constraints that could result in spending reductions, reduced grant making, reduced allocations or budget cutbacks, which could jeopardize the ability of these customers, or the customers to whom they provide funding, to purchase our products. For example, congressional appropriations to the National Institutes of Health (the “NIH”) have generally increased year-over-year in recent years, but the NIH also experiences occasional year-over-year decreases in appropriations, including as recently as 2013. In addition, funding for life sciences research has increased more slowly during the past several years compared to previous years and has actually declined in some countries. There is no guarantee that NIH appropriations will not decrease in the future, and a decrease may be more likely under the current administration, whose annual budget proposals have repeatedly decreased NIH appropriations. A decrease in the amount of, or delay in the approval of, appropriations to NIH or other similar United States or international organizations, such as the Medical Research Council in the United Kingdom, could result in fewer grants benefiting life sciences research. These reductions or delays could also result in a decrease in the aggregate amount of grants awarded for life sciences research or the redirection of existing funding to other projects or priorities, any of which in turn could cause our customers and potential customers to reduce or delay purchases of our products. Our operating results may fluctuate substantially due to any such reductions and delays. Any decrease in our customers’ budgets or expenditures, or in the size, scope or frequency of their capital or operating expenditures, could materially and adversely affect our business, operating results and financial condition.
Our failure to effectively manage product transitions or accurately forecast customer demand could result in excess or obsolete inventory and resulting charges.
Because the market for our products is characterized by rapid technological advances, we frequently introduce new products with improved ease-of-use, improved performance or additional features and functionality. We pre-announce products and services, in some cases before such products and services have been fully developed or tested, and risk failing to meet expectations when such products and services become available. The risks associated with the introduction of new products include the difficulties of predicting customer demand and effectively managing inventory levels to ensure adequate supply of the new product and avoiding excess supply of the legacy product.
We may strategically enter into non-cancelable commitments with vendors to purchase materials for our products in advance of demand to take advantage of favorable pricing, address concerns about the availability of future
30
Table of Contents
supplies or build safety stock to help ensure customer shipments are not delayed should we experience higher than anticipated demand for materials with long lead times.
Our future success is dependent upon our ability to increase penetration in our existing markets.
Our customer base includes academic, government, biopharmaceutical, biotechnology and other institutions. In the year ended December 31, 2019, approximately 70% of our direct sales revenue came from sales to academic institutions. Our success will depend upon our ability to increase our market penetration among these customers and to expand our market by developing and marketing new products and new applications for existing products. We recently introduced our Visium product line for spatial analysis and our future success will partially depend on our ability to commercialize this product line. As we continue to scale our business, we may find that certain of our products, certain customers or certain markets, including the biopharmaceutical market, may require a dedicated sales force or sales personnel with different experience than those we currently employ. Identifying, recruiting and training additional qualified personnel would require significant time, expense and attention.
We cannot assure investors that we will be able to further penetrate our existing market or that the market will be able to sustain our current and future product offerings. Any failure to increase penetration in our existing markets would adversely affect our ability to improve our operating results.
We may not be able to develop new products, enhance the capabilities of our existing products to keep pace with rapidly changing technology and customer requirements or successfully manage the transition to new product offerings, any of which could have a material adverse effect on our business and operating results.
Our success depends on our ability to develop new products and applications for our technology in existing and new markets, while improving the performance and cost-effectiveness of our existing products, in each case in ways that address current and anticipated customer requirements. Such success is dependent upon several factors, including functionality, competitive pricing and integration with existing and emerging technologies. New technologies, techniques or products could emerge that might offer better combinations of price and performance or better address customer requirements as compared to our current or future products. Existing markets for our products, including the genomics, single cell analysis, spatial analysis and other relevant markets, are characterized by rapid technological change and innovation. Competitors may be able to respond more quickly and effectively than we can to new or changing opportunities, technologies, standards or customer requirements. Due to the significant lead time involved in bringing a new product to market, we are required to make a number of assumptions and estimates regarding the commercial feasibility of a new product, including assumptions and estimates regarding the biological analytes that researchers will want to measure, the appropriate method of measuring such analytes, how researchers intend to use the resulting data and the scope and type of data that will be most useful to researchers. As a result, it is possible that we may introduce a new product that uses technologies or methods of analysis that have been displaced by the time of launch, addresses a market that no longer exists or is smaller than previously thought, targets biological analytes or produces data that provides less utility to researchers than previously thought or otherwise is not competitive at the time of launch. We anticipate that we will face increased competition in the future as existing companies and competitors develop new or improved products and as new companies enter the market with new technologies. Our ability to mitigate downward pressure on our selling prices will be dependent upon our ability to maintain or increase the value we offer to researchers. The expenses or losses associated with unsuccessful product development or launch activities, or a lack of market acceptance of our new products, could adversely affect our business, financial condition or results of operations.
Because our solutions are used with other products, such as sequencers, to conduct an experiment, we also expect to face competition from these complementary products, either directly or indirectly, as researchers and labs look to reduce the total cost of any given experiment. For example, if a sequencer manufacturer was successful in vertically integrating their product to provide functionality equivalent to our instruments, they would likely be able to deliver a solution that is capable of running comparable experiments with a total experiment cost that is significantly less than the cost of running such experiments using our products together with third-party
31
Table of Contents
sequencers. Conversely, if genome sequencing falls out of favor as a preferred approach for genomic research, whether through the development of alternative solutions or real or perceived problems with sequencing itself, the utility of our products could be significantly impacted. It is critical to our success that we anticipate changes such as these in technology and customer requirements and successfully introduce new, enhanced and competitive technologies to meet our customers’ and prospective customers’ needs on a timely and cost-effective basis. If we do not successfully innovate and introduce new technology into our product lines, our business and operating results will be adversely impacted.
Our ability to attract new customers and increase revenue from existing customers depends in large part on our ability to enhance and improve our existing solutions and to introduce compelling new solutions. The success of any enhancement to our solutions depends on several factors, including timely completion and delivery, competitive pricing, adequate quality testing, integration with existing technologies and overall market acceptance. Any new solution that we develop may not be introduced in a timely or cost-effective manner, may contain errors, vulnerabilities or bugs, or may not achieve the market acceptance necessary to generate significant revenue. If we are unable to successfully develop new solutions, enhance our existing solutions to meet customer requirements, or otherwise gain market acceptance, our business, results of operations and financial condition would be harmed.
Our ability to attract new customers and increase revenue from existing customers also depends on our ability to deliver any enhanced or new solutions to our customers in a format where they can be easily and consistently deployed by most or all users without significant customer service or training. If our customers believe that deploying our enhanced or new solutions would be overly time-consuming, confusing or technically challenging, or require significant training or retraining, then our ability to grow our business would be substantially harmed. We need to create and deliver a repeatable, user-friendly, prescriptive approach to deployment that allows users of all kinds to effectively and easily deploy our solutions, and if we fail to do so, our business and results of operations would be harmed.
The typical development cycle of new life sciences products can be lengthy and complicated and may require new scientific discoveries or advancements and complex technology and engineering. Such developments may involve external suppliers and service providers, making the management of development projects complex and subject to risks and uncertainties regarding timing, timely delivery of required components or services and satisfactory technical performance of such components or assembled products. If we do not achieve the required technical specifications or successfully manage new product development processes, or if development work is not performed according to schedule, then such new technologies or products may be adversely impacted and our business and operating results may be harmed.
If our existing and new products fail to achieve and sustain sufficient scientific acceptance, we will not generate expected revenue and our prospects may be harmed.
The life sciences scientific community is comprised of a small number of early adopters and key opinion leaders who significantly influence the rest of the community. The success of life sciences products is due, in large part, to acceptance by the scientific community and their adoption of certain products as best practice in the applicable field of research. The current system of academic and scientific research views publishing in a peer-reviewed journal as a measure of success. In such journal publications, the researchers will describe not only their discoveries but also the methods and typically the products used to fuel such discoveries. Mentions in peer-reviewed journal publications is a good barometer for the general acceptance of our products as best practices. Ensuring that early adopters and key opinion leaders publish research involving the use of our products is critical to ensuring our products gain widespread acceptance and market growth. Continuing to maintain good relationships with such key opinion leaders is vital to growing our market. The number of times our products were mentioned in peer-reviewed publications has increased significantly in recent years. During this time our revenue has also increased significantly. We cannot assure investors that our products will continue to be mentioned in peer-reviewed articles with any frequency or that any new products that we introduce in the future
32
Table of Contents
will be mentioned in peer-reviewed articles. If too few researchers describe the use of our products, too many researchers shift to a competing product and publish research outlining their use of that product or too many researchers negatively describe the use or usability of our products in publications, it may drive existing and potential customers away from our products, which could harm our operating results.
If we do not sustain or successfully manage our growth and anticipated growth, our business and prospects will be harmed.
We have experienced rapid growth in recent periods. This growth and our anticipated growth will place significant strains on our management, operational and manufacturing systems and processes, financial systems and internal controls and other aspects of our business. For example, we consummated two acquisitions in 2018 and intend to continue to make investments that meet management’s criteria to expand or add key technologies that we believe will facilitate the commercialization of new products in the future. In addition, we intend to launch additional new products and new versions of existing products in the near future. Further development and commercialization of our current and future products are key elements of our growth strategy. Developing and launching new products and innovating and improving our existing products have required us to hire and retain additional scientific, sales and marketing, software, manufacturing, distribution and quality assurance personnel. As a result, we have experienced rapid headcount growth from 110 employees as of December 31, 2015 to 584 employees as of December 31, 2019. As we have grown, our employees have become more geographically dispersed. We currently serve thousands of researchers in many countries and plan to continue to expand to new international jurisdictions as part of our growth strategy which will lead to increased dispersion of our employees. Moreover, we expect that we will need to hire additional accounting, finance and other personnel in connection with our efforts to comply with the requirements of being a public company. As a public company, our management and other personnel must devote a substantial amount of time towards maintaining compliance with these requirements. We may face challenges integrating, developing and motivating our rapidly growing and increasingly dispersed employee base. In addition, certain members of our management have not previously worked together for an extended period of time, do not have experience managing a public company or do not have experience managing a global business, which may affect how they manage our growth. To effectively manage our growth, we must continue to improve our operational and manufacturing systems and processes, our financial systems and internal controls and other aspects of our business and continue to effectively expand, train and manage our personnel. As our organization continues to grow, and we are required to implement more complex organizational management structures, we may find it increasingly difficult to maintain the benefits of our corporate culture, including our ability to quickly develop and launch new and innovative products. If we do not successfully manage our anticipated growth, our business, results of operations and growth prospects will be harmed.
Our limited operating history and rapid revenue growth make it difficult to evaluate our future prospects and the risks and challenges we may encounter.
We launched our first product in mid-2015 and have experienced significant revenue growth in recent periods. In addition, we operate in highly competitive markets characterized by rapid technological advances and our business has, and we expect it to continue, to evolve over time to remain competitive. Our limited operating history, evolving business and rapid growth make it difficult to evaluate our future prospects and the risks and challenges we may encounter and may increase the risk that we will not continue to grow at or near historical rates.
If we fail to address the risks and difficulties that we face, including those described elsewhere in this “Risk Factors” section, our business, financial condition and results of operations could be adversely affected. We have encountered in the past, and will encounter in the future, risks and uncertainties frequently experienced by growing companies with limited operating histories in rapidly changing industries. If our assumptions regarding these risks and uncertainties, which we use to plan and operate our business, are incorrect or change, or if we do not address these risks successfully, our results of operations could differ materially from our expectations and our business, financial condition and results of operations could be adversely affected.
33
Table of Contents
Our operating results have in the past fluctuated significantly and may continue to fluctuate significantly in the future, which makes our future operating results difficult to predict and could cause our operating results to fall below expectations or any guidance we may provide.
Our quarterly and annual operating results may fluctuate significantly, which makes it difficult for us to predict our future operating results. These fluctuations may occur due to a variety of factors, many of which are outside of our control, including, but not limited to:
| • | our dependence on single source and sole source suppliers for some of the components and materials used in our products; |
| • | production problems which could impact our ability to manufacture and ship our instruments, consumables and related components; |
| • | the level of demand for our products, which may vary significantly, and our ability to increase penetration in our existing markets and expand into new markets; |
| • | the outcomes of and related rulings in the litigation and administrative proceedings in which we are currently or may in the future become involved; |
| • | our ability to successfully manufacture and transition our existing customers to our Next GEM microfluidic chips; |
| • | the timing and cost of, and level of investment in, research and development and commercialization activities relating to our products, which may change from time to time; |
| • | the volume and mix of our instrument and consumable sales or changes in the manufacturing or sales costs related to our instruments and consumables; |
| • | the success of our recently introduced products, such as our Visium platform, and the introduction of other new products or product enhancements by us or others in our industry; |
| • | the timing and amount of expenditures that we may incur to acquire, develop or commercialize additional products and technologies or for other purposes, such as the expansion of our facilities; |
| • | changes in governmental funding of life sciences research and development or changes that impact budgets, budget cycles or seasonal spending patterns of our customers; |
| • | future accounting pronouncements or changes in our accounting policies; |
| • | the outcome of any future litigation or governmental investigations involving us, our industry or both; |
| • | difficulties encountered by our commercial carriers in delivering our instruments or consumables, whether as a result of external factors such as weather or internal issues such as labor disputes; |
| • | general market conditions and other factors, including factors unrelated to our operating performance or the operating performance of our competitors; |
| • | higher than anticipated warranty costs; |
| • | customers accelerating, canceling, reducing or delaying orders as a result of developments related to our litigation or to our transition to Next GEM microfluidic chips; |
| • | the impacts of infectious disease, epidemics and outbreaks, including the effects of the coronavirus outbreak on our business operations in geographic locations impacted by such disease, epidemic or outbreak and on the business operations of our customers, manufacturers and suppliers; and |
| • | the other factors described in this “Risk Factors” section. |
The cumulative effects of the factors discussed above could result in large fluctuations and unpredictability in our quarterly and annual operating results. As a result, comparing our operating results on a period-to-period basis may not be meaningful. Investors should not rely on our past results as an indication of our future performance.
34
Table of Contents
This variability and unpredictability could also result in our failing to meet the expectations of industry or financial analysts or investors for any period. If our revenue or operating results fall below the expectations of analysts or investors or below any guidance we may provide, or if the guidance we provide is below the expectations of analysts or investors, the price of our Class A common stock could decline substantially. Such a stock price decline could occur even when we have met or exceeded any previously publicly stated guidance we may provide.
The sizes of the markets for our solutions may be smaller than estimated and new market opportunities may not develop as quickly as we expect, or at all, limiting our ability to successfully sell our solutions.
The market for genomics products is new and evolving, making it difficult to predict with any accuracy the sizes of the markets for our current and future solutions. Our estimates of the annual total addressable market for our current and future solutions are based on a number of internal and third-party estimates and assumptions. In particular, our estimates are based on our expectations that: (a) researchers in the market for certain life sciences research tools and technologies will view our solutions as competitive alternatives to, or better options than, such existing tools and technologies; (b) researchers who already own such existing tools and technologies will recognize the ability of our solutions to complement, enhance and enable new applications of their current tools and technologies and find the value proposition offered by our solutions convincing enough to purchase our solutions in addition to the tools and technologies they already own; and (c) the trends we have seen among our customers with respect to placements of our instruments are representative of the broader market. Underlying each of these expectations are a number of estimates and assumptions, including the assumption that government or other sources of funding will continue to be available to life sciences researchers at times and in amounts necessary to allow them to purchase our solutions.
In addition, our growth strategy involves launching new solutions and expanding sales of existing solutions into new markets in which we have limited or no experience, such as the biopharmaceutical market. Sales of new or existing solutions into new market opportunities may take several years to develop and mature and we cannot be certain that these market opportunities will develop as we expect. For example, new life sciences technology is often not adopted by the relevant market until a sufficient amount of research conducted using such technology has been published in peer-reviewed publications. Because there can be a considerable delay between the launch of a new life sciences product and publication of research using such product, new life sciences products do not generally contribute a meaningful amount of revenue in the year they are introduced. In certain markets, such as the biopharmaceutical market, new life sciences technology, even if sufficiently covered in peer-reviewed publications, may not be adopted until the consistency and accuracy of such technology, method or device has been proven. As a result, the sizes of the annual total addressable market for new markets and new products are even more difficult to predict.
While we believe our assumptions and the data underlying our estimates of the total annual addressable market for our solutions are reasonable, these assumptions and estimates may not be correct and the conditions supporting our assumptions or estimates, or those underlying the third-party data we have used, may change at any time, thereby reducing the accuracy of our estimates. As a result, our estimates of the annual total addressable market for our solutions may be incorrect.
The future growth of the market for our current and future solutions depends on many factors beyond our control, including recognition and acceptance of our solutions by the scientific community as best practice and the growth, prevalence and costs of competing products and solutions. Such recognition and acceptance may not occur in the near term, or at all. If the markets for our current and future solutions are smaller than estimated or do not develop as we expect, our growth may be limited and our business, financial condition and operational results may be adversely affected.
35
Table of Contents
Our management uses certain key business metrics to evaluate our business, measure our performance, identify trends affecting our business, formulate financial projections and make strategic decisions and such metrics may not accurately reflect all of the aspects of our business needed to make such evaluations and decisions, in particular as our business continues to grow.
In addition to our consolidated financial results, our management regularly reviews a number of operating and financial metrics, including our instrument installed base and consumable pull-through per instrument, to evaluate our business, measure our performance, identify trends affecting our business, formulate financial projections and make strategic decisions. We define the instrument installed base as the cumulative number of instruments sold since inception and define consumable pull-through per instrument as the total consumables revenue in the relevant period divided by the average instrument installed base during that period. We believe that these metrics are representative of our current business; however, these metrics may not accurately reflect all aspects of our business and we anticipate that these metrics may change or may be substituted for additional or different metrics as our business grows and as we introduce new products. For example, we expect that our expansion into new markets and adoption by new customers who may not have the same financial resources to devote to consumable purchases as our existing customer base could adversely impact our pull-through figures. These metrics also do not accurately reflect information relating to customers who purchase consumables but do not own an instrument, whom we refer to as “halo users.” Halo users and the introduction of consumables that may not use instruments, such as our Visium solution, or instruments that are expected to use a greater amount of consumables, such as our recently introduced Chromium Connect instrument, could reduce the utility of our consumable pull-through per instrument metric and make it difficult to compare such figures over time. Moreover, we expect some of our halo users to purchase instruments of their own which would decrease the consumables sold per instrument and therefore decrease our annual consumable pull-through per instrument. Though we expect the introduction of enhanced features and additional solutions on our Chromium instrument to increase consumable pull-through per instrument and to offset this decline, there are no assurances we will be successful in doing so. If our management fails to review other relevant information or change or substitute the key business metrics they review as our business grows and we introduce new products, their ability to accurately formulate financial projections and make strategic decisions may be compromised and our business, financial results and future growth prospects may be adversely impacted.
We are dependent on single source and sole source suppliers for some of the components and materials used in our products and the loss of any of these suppliers could harm our business.
We do not have long-term contracts with our suppliers for the significant majority of the services, materials and components we use for the manufacture and delivery of our products. In certain cases, we also rely on single suppliers for all of our requirements for some of our materials or components. In most cases we do not have long term contracts with these suppliers, and even in the cases where we do the contracts include significant qualifications that would make it extremely difficult for us to force the supplier to provide us with their services, materials or components should they choose not to do so. We are therefore subject to the risk that these third-party suppliers will not be able or willing to continue to provide us with materials and components that meet our specifications, quality standards and delivery schedules. Factors that could impact our suppliers’ willingness and ability to continue to provide us with the required materials and components include disruption at or affecting our suppliers’ facilities, such as work stoppages or natural disasters, infectious disease, epidemics, outbreaks, adverse weather or other conditions that affect their supply, the financial condition of our suppliers, deterioration in our relationships with these suppliers or the decision by such suppliers to introduce products that compete directly with our solutions. In addition, we cannot be sure that we will be able to obtain these materials and components on satisfactory terms. Any increase in material and component costs could reduce our sales and harm our gross margins. In addition, any loss of a material supplier may permanently cause a change in one or more of our products that may not be accepted by our customers or cause us to eliminate that product altogether.
For example, we depend on a limited number of suppliers for enzymes and amplification mixes used in our consumables. In some cases, these manufacturers are the sole source of certain types of enzymes and reagents.
36
Table of Contents
We do not have long-term contracts with any of these sole source suppliers. Lead times for some of these components can be several months or more. In the event that demand increases, a manufacturing ‘lot’ does not meet our specifications or we fail to forecast and place purchase orders sufficiently in advance, this could result in a material shortage. Some of the components and formulations are proprietary to our vendors, thereby making second sourcing and development of a replacement difficult. Furthermore, such vendors may have intellectual property rights that could prevent us from sourcing such reagents from other vendors. Some vendors could choose to use their enzymes, amplification mixes or other components to create products that directly compete with our consumables and end our current supplier-customer relationship. If enzymes and reagents become unavailable from our current suppliers and we are unable to find acceptable substitutes for these suppliers, we may be required to produce them internally or change our product designs.
We have not qualified secondary sources for all materials or components that we source through a single supplier and we cannot assure investors that the qualification of a secondary supplier will prevent future supply issues. Disruption in the supply of materials or components would impair our ability to sell our products and meet customer demand, and also could delay the launch of new products, any of which could harm our business and results of operations. If we were to have to change suppliers, the new supplier may not be able to provide us materials or components in a timely manner and in adequate quantities that are consistent with our quality standards and on satisfactory pricing terms. In addition, alternative sources of supply may not be available for materials that are scarce or components for which there are a limited number of suppliers.
If our facilities or our third-party manufacturers’ facilities become unavailable or inoperable, our research and development programs could be adversely impacted and manufacturing of our instruments and consumables could be interrupted.
The manufacturing process for our Chromium Controller takes place at our third-party manufacturer’s facilities in California. The majority of our consumables are manufactured at our facilities in Pleasanton, California using proprietary equipment. Certain raw materials, such as oligonucleotides and enzymes, are custom manufactured by outside partners. We periodically review the manufacturing capacity of our consumables and we expect to manufacture an increasing amount of consumables in-house. Our Pleasanton facilities also house the majority of our research and development and quality assurance teams. Our Chromium Connect is manufactured by our partner at their facility. The facilities and the equipment we and our third-party manufacturers use to manufacture our instruments and consumables and that we use in our research and development programs would be costly to replace and could require substantial lead times to repair or replace.
Our facilities in Pleasanton are vulnerable to natural disasters and catastrophic events. For example, our Pleasanton facilities are located near earthquake fault zones and are vulnerable to damage from earthquakes as well as other types of disasters, including fires, floods, power loss, communications failures and similar events. If any disaster or catastrophic event were to occur, our ability to operate our business would be seriously, or potentially completely, impaired. If our facilities or any of our third-party manufacturers’ facilities become unavailable for any reason, we cannot provide assurances that we will be able to secure alternative manufacturing facilities with the necessary capabilities and equipment on acceptable terms, if at all. We may encounter particular difficulties in replacing our Pleasanton facilities given the specialized equipment housed within it. The inability to manufacture our instruments and/or consumables, combined with our limited inventory of manufactured instruments and consumables, may result in the loss of customers or harm our reputation, and we may be unable to reestablish relationships with those customers in the future. Because certain of our consumables and the raw materials we use to manufacture consumables at our Pleasanton facilities are perishable and must be kept in temperature controlled storage, the loss of power to our facilities, mechanical or other issues with our storage facilities or other events that impact our temperature controlled storage could result in the loss of some or all of such consumables and raw materials and we may not be able to replace them without disruption to our customers or at all.
In the year ended December 31, 2019, approximately 70% of our direct sales revenue came from sales to academic institutions, whose research often requires long uninterrupted studies performed on a consistent basis
37
Table of Contents
over time; thus interruptions in our ability to supply consumables could be particularly damaging to these studies and our reputation. In addition, the budgetary planning and approval process for academic research programs can be lengthy and begin well in advance of the planned purchase of our instrument and/or consumables. If our products become unavailable during the planning process, researchers may use alternative products.
If our research and development programs were disrupted by a disaster or catastrophe, the launch of new products and the timing of improvements to existing products could be significantly delayed and could adversely impact our ability to compete with other available products and solutions. If our or our third-party manufacturers’ capabilities are impaired, we may not be able to manufacture and ship our products in a timely manner, which would adversely impact our business. Although we possess insurance for damage to our property and the disruption of our business, this insurance may not be sufficient to cover all of our potential losses and may not continue to be available to us on acceptable terms, or at all.
Our instruments, consumables and related components are specialized, complex and difficult to manufacture. We could experience production problems that impact our ability to manufacture and ship our instruments, consumables and related components, which would adversely affect our business, financial condition and results of operations.
The manufacturing processes we and our third-party manufacturers use to produce our instruments, consumables and related components are specialized and highly complex and require high-quality components. We may have quality variations, supply issues, backorders or production difficulties of needed components and may require components that are difficult to obtain or manufacture at the necessary quantities and necessary quality, in a timely manner or in accordance with regulatory requirements.
Such issues, issues with our manufacturing processes or the manufacturing processes of our third-party manufacturers, shipping issues, inaccurate demand forecasts or other production issues could result in our inability to supply our products to our customers, backorders, insufficient inventory, excess inventory, shipping delays, product deficiencies or other operational failures. If we cannot supply our products to our customers in a timely manner, our customers may delay or cancel their orders. Furthermore, even if we have inventory, if we do not have adequate inventory of products in the geographic regions in which they are ordered, we may not be able to deliver products to our customers in a timely manner and customers may delay or cancel their orders. Many other factors could cause production or shipping delays or interruptions, including difficulties in transporting materials, raw material shortages, raw material failures, equipment malfunctions, facility contamination, labor problems, natural disasters, disruption in utility services, terrorist activities or circumstances beyond our control. Additionally, we and our third-party manufacturers may encounter problems in hiring and retaining the experienced specialized personnel needed to develop and operate our manufacturing processes or the manufacturing processes of our third-party manufacturers, which could result in backorders, delays in our production or difficulties in maintaining compliance with applicable regulatory requirements.
These issues, or any other problems with the production or timely manufacture and shipment of our instruments, consumables and related components, could materially harm our business, financial condition and results of operations.
We may be unable to consistently manufacture our instruments and consumables to the necessary specifications or in quantities necessary to meet demand at an acceptable cost or at an acceptable performance level.
Our products are integrated solutions with many different components that work together. As such, a quality defect in a single component can compromise the performance of the entire solution. Certain of our consumables are manufactured at our Pleasanton, California facilities using complex processes, sophisticated equipment and strict adherence to specifications and quality systems procedures. In many cases, the consumables we manufacture are bundled with products or components that we source from third parties and assemble, package
38
Table of Contents
and perform quality assurance testing at our Pleasanton facilities. Our Chromium Controllers are manufactured by our third-party manufacturer at their facilities. In order to successfully generate revenue from our products, we need to supply our customers with products that meet their expectations for quality and functionality in accordance with established specifications. In order to ensure we are able to meet these expectations, our Pleasanton, California manufacturing facilities, as well as the facilities of our third-party manufacturers, have obtained International Organization for Standardization (“ISO”) quality management certifications and employ other quality control measures. While customer complaints regarding defects in our products and consumables have historically been low, our customers have experienced quality control and manufacturing defects in the past. For example, a manufacturing defect in certain of our Chromium Controllers resulted in an unacceptable level of LCD screen failures and we launched a free replacement program in 2018 to allow customers to replace affected LCD screens as a result. As we continue to grow and introduce new products, and as our products incorporate increasingly sophisticated technology, it will be increasingly difficult to ensure our products are produced in the necessary quantities without sacrificing quality. There is no assurance that we or our third-party manufacturers will be able to continue to manufacture our products so that they consistently achieve the product specifications and quality that our customers expect. Certain of our consumables are subjected to a shelf life, after which their performance is not ensured. Shipment of consumables that effectively expire early or shipment of defective instruments or consumables to customers may result in recalls and warrantee replacements, which would increase our costs, and depending upon current inventory levels and the availability and lead time for additional inventory, could lead to availability issues. Any future design issues, unforeseen manufacturing problems, such as contamination of our or their facilities, equipment malfunctions, aging components, quality issues with components and materials sourced from third-party suppliers, or failures to strictly follow procedures or meet specifications, may have a material adverse effect on our brand, business, financial condition and operating results and could result in us or our third-party manufacturers losing ISO quality management certifications. If we or our third-party manufacturers fail to maintain ISO quality management certifications, our customers might choose not to purchase products from us. Furthermore, we or our third-party manufacturers may not be able to increase manufacturing to meet anticipated demand or may experience downtime.
In addition, as we increase manufacturing capacity, we will also need to make corresponding improvements to other operational functions, such as our customer service and billing systems, compliance programs and our internal quality assurance programs. We will also need additional equipment, manufacturing and warehouse space and trained personnel to process higher volumes of products. We cannot assure you that any increases in scale, related improvements and quality assurance will be successfully implemented or that equipment, manufacturing and warehouse space and appropriate personnel will be available. As we develop additional products, we may need to bring new equipment on-line, implement new systems, technology, controls and procedures and hire personnel with different qualifications. Our ability to increase our manufacturing capacity at our Pleasanton, California location is complicated by the use of our proprietary equipment that is not readily available from third-party manufacturers.
The risk of manufacturing defects or quality control issues is generally higher for new products, whether produced by us or a third-party manufacturer, products that are transitioned from one manufacturer to another, particularly if manufacturing is transitioned or initiated with a manufacturer we have not worked with in the past, and products that are transferred from one manufacturing facility to another. Our current product roadmap calls for the introduction of new instruments and consumables, which may require that we utilize manufacturers with which we have little or no prior manufacturing experience and the risk of manufacturing defects or quality control issues could increase as a result. Similarly, we also expect to expand our manufacturing facilities in Pleasanton, California during 2020. This expansion will result in the relocation of certain manufacturing processes and the risk of manufacturing defects or quality control issues in the consumables we manufacture there could increase as a result. We cannot assure investors that we and our third-party manufacturers will be able to launch new products on time, transition manufacturing of existing products to new manufacturers, transition our manufacturing capabilities to a new location or transition manufacturing of any additional consumables in-house without manufacturing defects.
39
Table of Contents
An inability to manufacture products and components that consistently meet specifications, in necessary quantities and at commercially acceptable costs will have a negative impact and may have a material adverse effect on our business, financial condition and results of operations.
Undetected errors or defects in our solutions could harm our reputation and decrease market acceptance of our solutions.
Our instruments and consumables, as well as the software that accompanies them, may contain undetected errors or defects when first introduced or as new versions are released. Disruptions or other performance problems with our products or software may adversely impact our customers’ research or business, harm our reputation and result in reduced revenue or increased costs associated with product repairs or replacements. If that occurs, we may also incur significant costs, the attention of our key personnel could be diverted or other significant customer relations problems may arise. We may also be subject to warranty claims or breach of contract for damages related to errors or defects in our solutions.
Certain disruptions in supply of, and changes in the competitive environment for, raw materials integral to the manufacturing of our products may adversely affect our profitability.
We use a broad range of materials and supplies, including metals, chemicals and other electronic components, in our products. A significant disruption in the supply of these materials could decrease production and shipping levels, materially increase our operating costs and materially adversely affect our profit margins. Shortages of materials or interruptions in transportation systems, labor strikes, work stoppages, war, acts of terrorism or other interruptions to or difficulties in the employment of labor or transportation in the markets in which we purchase materials, components and supplies for the production of our products, in each case may adversely affect our ability to maintain production of our products and sustain profitability. Unforeseen end-of-life for certain components, such as enzymes, could cause backorders as we modify our product specifications to accommodate replacement components. If we were to experience a significant or prolonged shortage of critical components from any of our suppliers and could not procure the components from other sources, we would be unable to manufacture our products and to ship such products to our customers in a timely fashion, which would adversely affect our sales, margins and customer relations.
We depend on certain technologies that are licensed to us. We do not control these technologies and any loss of our rights to them could prevent us from selling our products.
We rely on licenses in order to be able to use various proprietary technologies that are used in a substantial majority of our consumables. We do not own the patents that are the subject matter of these licenses. Our rights to use these patented technologies in our business are subject to the continuation of and compliance with the terms of those licenses.
We may need to license other technologies to commercialize future products. We may also need to negotiate licenses to patents after launching new products. Our business may suffer if the technologies or patents are unavailable for license or if we are unable to enter into necessary licenses on acceptable terms.
If we fail to offer high-quality customer service, our business and reputation could suffer.
We differentiate ourselves from our competition through our commitment to an exceptional customer experience. Accordingly, high-quality customer service is important for the growth of our business and any failure to maintain such standards of customer service, or a related market perception, could affect our ability to sell products to existing and prospective customers. Additionally, we believe our customer service team has a positive influence on recurring consumables revenue. Providing an exceptional customer experience requires significant time and resources from our customer service team. Therefore, failure to scale our customer service organization adequately may adversely impact our business results and financial condition.
40
Table of Contents
Customers utilize our service teams and online content for help with a variety of topics, including how to use our products efficiently, how to integrate our products into existing workflows, how to determine which of our other products may be needed for a given experiment and how to resolve technical, analysis and operational issues if and when they arise. As we introduce new products such as our Chromium Connect and Visium solutions and enhance existing products, we expect utilization of our customer service teams to increase. In particular, the introduction of new or improved products that utilize different workflows or variations on existing workflows may require additional customer service efforts to ensure customers use such products correctly and efficiently. While we have developed significant resources for remote training, including an extensive library of online videos, we may need to rely more on these resources for future customer training, or we may experience increased expenses to enhance our online and remote solutions. If our customers do not adopt these resources, we may be required to increase the staffing of our customer service team, which would increase our costs. Also, as our business scales, we may need to engage third-party customer service providers, which could increase our costs and negatively impact the quality of the customer experience if such third parties are unable to provide service levels equivalent to ours.
The number of our customers has grown significantly and such growth, as well as any future growth, will put additional pressure on our customer service organization. We may be unable to hire qualified staff quickly enough or to the extent necessary to accommodate increases in demand.
In addition, as we continue to grow our operations and reach a global customer base, we need to be able to provide efficient customer service that meets our customers’ needs globally at scale. In geographies where we sell through distributors, we rely on those distributors to provide customer service. If these third-party distributors do not provide a high-quality customer experience, our business operations and reputation may suffer.
We depend on our key personnel and other highly qualified personnel, and if we are unable to recruit, train and retain our personnel, we may not achieve our goals.
Our future success depends on our ability to recruit, train, retain and motivate key personnel, including our senior management, research and development, manufacturing and sales, customer service and marketing personnel. In particular, Dr. Saxonov, our Chief Executive Officer and one of our co-founders, and Dr. Hindson, our Chief Scientific Officer, President and one of our co-founders, are critical to our vision, strategic direction, culture and products. Competition for qualified personnel is intense, particularly in the San Francisco Bay Area. As we grow, we may continue to make changes to our management team, which could make it difficult to execute on our business plans and strategies. New hires also require significant training and, in most cases, take significant time before they achieve full productivity. Our failure to successfully integrate these key personnel into our business could adversely affect our business.
Our continued growth depends, in part, on attracting, retaining and motivating highly trained sales personnel with the necessary scientific background and ability to understand our systems at a technical level to effectively identify and sell to potential new customers. In addition, the continued development of complementary software tools, such as our analysis tools and visualization software, requires us to compete for highly trained software engineers in the San Francisco Bay Area and for highly trained customer service personnel globally. We also compete for computational biologists and qualified scientific personnel with other life sciences companies, academic institutions and research institutions. Many of our scientific personnel are qualified foreign nationals whose ability to live and work in the United States is contingent upon the continued availability of appropriate visas. Due to the competition for qualified personnel in the San Francisco Bay Area, we expect to continue to rely on foreign nationals to fill part of our recruiting needs. As a result, changes to United States immigration policies could restrain the flow of technical and professional talent into the United States and may inhibit our ability to hire qualified personnel. The current United States administration has made restricting immigration and reforming the work visa process a key focus of its initiatives and these efforts may adversely affect our ability to find qualified personnel.
41
Table of Contents
We do not maintain key person life insurance or fixed term employment contracts with any of our employees. As a result, our employees could leave our company with little or no prior notice and would be free to work for a competitor. Because of the complex and technical nature of our products and the dynamic market in which we compete, any failure to attract, train, retain and motivate qualified personnel could materially harm our operating results and growth prospects.
Acquisitions could disrupt our business, cause dilution to our stockholders and otherwise harm our business.
We have and may continue to acquire other businesses and legal entities to add specialized employees, products or technologies as well as pursue technology licenses or investments in complementary businesses. In 2018, we acquired Epinomics, an epigenetics company based in California, and Spatial Transcriptomics, a spatial analysis company based in Stockholm, Sweden. We believe we are successfully integrating the technologies acquired from those companies into our business, but the long-term success of these acquisitions is not guaranteed. These transactions and any future transactions could be material to our financial condition and operating results and expose us to many risks, including:
| • | disruption in our relationships with customers, distributors, manufacturers or suppliers as a result of such a transaction; |
| • | unanticipated liabilities related to acquired companies, including liabilities related to acquired intellectual property or litigation relating thereto; |
| • | difficulties integrating acquired personnel, technologies and operations into our existing business; |
| • | diversion of management time and focus from operating our business; |
| • | failure to realize anticipated benefits or synergies from such a transaction; |
| • | increases in our expenses and reductions in our cash available for operations and other uses; |
| • | possible write-offs or impairment charges relating to acquired businesses; and |
| • | potential higher taxes if our tax position relating to the acquisitions were challenged. |
Foreign acquisitions, such as our acquisition of Spatial Transcriptomics, involve unique risks in addition to those mentioned above, including those related to integration of operations across different cultures and languages, currency risks and the particular economic, political and regulatory risks associated with specific countries. Even if we identify a strategic transaction that we wish to pursue, we may be prohibited from consummating such transaction due to the terms of our Second Amended and Restated Loan and Security Agreement, dated February 9, 2018, with Silicon Valley Bank (as amended, restated or supplemented from time to time, the “Loan and Security Agreement”) or any future indebtedness we incur. For example, the Loan and Security Agreement includes a covenant that limits our ability to consummate acquisitions and the exceptions to this covenant are limited. If we were to pursue an acquisition that is not permitted by the Loan and Security Agreement, we would be required to seek a waiver from the lender under the Loan and Security Agreement and we cannot assure investors that the lender would grant such a waiver.
Future acquisitions or dispositions could result in potentially dilutive issuances of our equity securities, the incurrence of debt, contingent liabilities or amortization expenses or write-offs of goodwill, any of which could harm our financial condition. We cannot predict the number, timing or size of future acquisitions or the effect that any such transactions might have on our operating results.
Seasonality may cause fluctuations in our revenue and results of operations.
We operate on a December 31st year end and believe that there are significant seasonal factors which may cause sales of our products, and particularly our Chromium Controller, to vary on a quarterly or yearly basis and increase the magnitude of quarterly or annual fluctuations in our operating results. We believe that this
42
Table of Contents
seasonality results from a number of factors, including the procurement and budgeting cycles of many of our customers, especially government- or grant-funded customers, whose cycles often coincide with government fiscal year ends. For example, the United States government’s fiscal year end occurs in our third quarter and may result in increased sales of our products during such quarter if government-funded customers have unused funds that may be forfeited, or future budgets that may be reduced, if such funds remain unspent at such fiscal year end. Furthermore, the academic budgetary cycle similarly requires grantees to ‘use or lose’ their grant funding, which seems to be tied disproportionately to the end of the calendar year, driving sales higher during the fourth quarter. Similarly, our biopharmaceutical customers typically have calendar year fiscal years which also result in a disproportionate amount of their purchasing activity occurring during our fourth quarter. These factors have contributed, and may contribute in the future, to substantial fluctuations in our quarterly operating results. Because of these fluctuations, it is possible that in some quarters our operating results will fall below the expectations of securities analysts or investors. If that happens, the market price of our Class A common stock would likely decrease. These fluctuations, among other factors, also mean that our operating results in any particular period may not be relied upon as an indication of future performance. Seasonal or cyclical variations in our sales have in the past, and may in the future, become more or less pronounced over time, and have in the past materially affected, and may in the future materially affect, our business, financial condition, results of operations and prospects.
Our reliance on distributors for sales of our products in certain geographies outside of the United States could limit or prevent us from selling our products and impact our revenue.
We sell our products through third-party distributors in Asia, certain regions of Europe, Oceania, South America, the Middle East and Africa. We intend to continue to grow our business internationally and to do so we must attract additional distributors and retain existing distributors to maximize the commercial opportunity for our products. There is no guarantee that we will be successful in attracting or retaining desirable sales and distribution partners or that we will be able to enter into such arrangements on favorable terms. Most of our distribution relationships are non-exclusive and permit such distributors to distribute competing products. As such, our distributors may not commit the necessary resources to market our products to the level of our expectations or may choose to favor marketing the products of our competitors. If current or future distributors do not perform adequately or we are unable to enter into effective arrangements with distributors in particular geographic areas, we may not realize long-term international revenue growth.
We rely exclusively on commercial carriers to transport our products, including perishable consumables, to our customers in a timely and cost-efficient manner and if these delivery services are disrupted, our business will be harmed.
Our business depends on our ability to quickly and reliably deliver our products and in particular, our consumables, to our customers. Certain of our consumables are perishable and must be kept below certain temperatures. As such, we ship certain of our refrigerated consumables on dry ice and only ship such consumables on certain days of the week to reach customers on a timely basis. Disruptions in the delivery of our products, whether due to labor disruptions, bad weather, natural disasters, terrorist acts or threats or for other reasons could result in our customers receiving consumables that are not fit for usage, and if used, could result in inaccurate results or ruined experiments. While we work with customers to replace any consumables that are impacted by delivery disruptions, our reputation and our business may be adversely impacted even if we replace perished consumables free of charge. In addition, if we are unable to continue to obtain expedited delivery services on commercially reasonable terms, our operating results may be adversely affected.
In addition, should our commercial carriers encounter difficulties in delivering our instruments or consumables to customers, particularly at the end of any financial quarter, it could adversely impact our ability to recognize revenue for those products in that period and accordingly adversely affect our financial results for that period.
43
Table of Contents
Ethical, legal, privacy and social concerns or governmental restrictions surrounding the use of the genomic and multi-omic information and gene editing could reduce demand for our products.
While we do not make gene sequencing or gene editing products, our products are used to better understand genomic information that could further gene editing endeavors. For example, our single cell gene expression solutions allow users to examine cells that have been genetically perturbed using clustered regularly interspaced short palindromic repeats (“CRISPR”) gene editing technology. Advances in genome editing or gene therapy, such as CRISPR Cas9 technology have been subject to negative publicity and increased regulatory scrutiny, in part due to the underlying ethical, legal, privacy and social concerns regarding the use or potential misuse of such technology. Governmental authorities could, for safety, social or other purposes, call for limits on or regulation of technologies and products used in the genome editing or gene therapy fields. Such concerns or governmental restrictions could limit the use of our products. Because the science and technology of genome editing or gene therapy is incredibly complex, any regulations or restrictions placed on such technology or aimed at curtailing its usage could, intentionally or inadvertently, limit or restrict the usage of our products. Any such restrictions or any reduction in usage of our products as a result of concerns regarding the usage of genome editing technology could have a material adverse effect on our business, financial condition and results of operations.
We are subject to certain manufacturing restrictions related to licensed technologies that were developed with the financial assistance of United States government grants.
We are subject to certain United States government regulations because we have licensed technologies that were developed with United States government grants. Such licensed technologies are used, for example, in a substantial majority of our consumables. In accordance with these regulations, these licenses provide that products embodying the technologies are subject to domestic manufacturing requirements. If this domestic manufacturing requirement is not met, the government agency that funded the relevant grant is entitled to exercise specified rights (“march-in rights”) which if exercised would allow the government agency to require the licensors or us to grant a non-exclusive, partially exclusive or exclusive license in any field of use to a third-party designated by such agency. The exercise of march-in rights or the termination of our license of the relevant technologies could materially adversely affect our business, operations and financial condition. As of December 31, 2019, all of our products embodying licensed technology subject to march-in rights were manufactured in the United States. While we do not expect to move manufacturing of these products to facilities located outside of the United States, we cannot assure investors that such products will always be manufactured in the United States or that the applicable government agency would grant a waiver of such requirement. These restrictions may limit our ability to manufacture our products in geographies where it may be more economically favorable to do so which could limit our ability to respond to competitive developments or otherwise adversely affect our results of operations.
Our products could become subject to government regulation and the regulatory approval and maintenance process for such products may be expensive, time-consuming and uncertain both in timing and in outcome.
Our products are not subject to the clearance or approval of the U.S. Food and Drug Administration (the “FDA”), as they are not intended to be used for the diagnosis, treatment or prevention of disease. However, as we continue to expand our product line and the applications and uses of our existing products into new fields, certain of our current or future products could become subject to regulation by the FDA, or comparable international agencies, including requirements for regulatory clearance or approval of such products before they can be marketed. Such regulatory approval processes or clearances may be expensive, time-consuming and uncertain, and our failure to obtain or comply with such approvals and clearances could have an adverse effect on our business, financial condition and operating results. In addition, changes to the current regulatory framework, including the imposition of additional or new regulations, including regulation of our products, could arise at any time during the development or marketing of our products, which may negatively affect our ability to obtain or maintain FDA or comparable regulatory approval of our products, if required. Further, sales of devices for diagnostic purposes may subject us to additional healthcare regulation and enforcement by the applicable government agencies. Such laws include, without limitation, state and federal anti-kickback, fraud and abuse, false claims, privacy and security and physician sunshine laws and regulations.
44
Table of Contents
Diagnostic products are regulated as medical devices by the FDA and comparable international agencies and may require either clearance from the FDA following the 510(k) pre-market notification process or pre-market approval from the FDA, in each case prior to marketing. Obtaining the requisite regulatory approvals can be expensive and may involve considerable delay. None of our products are currently regulated as medical devices, however, if our products labeled as “For Research Use Only. Not for use in diagnostic procedures” are used, or could be used, for the diagnosis of disease, the regulatory requirements related to marketing, selling and supporting such products could change or be uncertain, even if such use by our customers is without our consent.
If the FDA or other regulatory authorities assert that any of our products are subject to regulatory clearance or approval, our business, financial condition or results of operations could be adversely affected.
Enhanced trade tariffs, import restrictions, export restrictions, Chinese regulations or other trade barriers may materially harm our business.
We are continuing to expand our international operations as part of our growth strategy and have experienced an increasing concentration of sales in certain regions outside the United States, especially in the Asia-Pacific region. For the years ended December 31, 2019 and 2018, sales outside of North America constituted approximately 43% and 42%, respectively, of our sales revenue and our largest markets outside of North America were China and Germany. There is currently significant uncertainty about the future relationship between the United States and various other countries, most significantly China, with respect to trade policies, treaties, government regulations and tariffs. The current United States presidential administration has called for substantial changes to United States foreign trade policy with respect to China and other countries, including the possibility of imposing greater restrictions on international trade and significant increases in tariffs on goods imported into the United States. While the United States and China have recently entered into a phase one trade deal, significant uncertainty about future trade policies between the United States and China remains.
Additionally, our business may be adversely impacted by retaliatory trade measures taken by China or other countries. Such measures could include restrictions on our ability to sell or import our instruments and/or consumables into certain countries or have the effect of increasing the prices of our instruments and/or consumables. The nature of the dispute between the United States and China is evolving and additional products such as ours could become subject to tariffs, which could adversely affect the marketability of our products and our results of operations. Further, the continued threats of tariffs, trade restrictions and trade barriers could have a generally disruptive impact on the global economy and, therefore, negatively impact our sales. Given the relatively fluid regulatory environment in China and the United States and uncertainty how the United States or foreign governments will act with respect to tariffs, international trade agreements and policies, there could be additional tax or other regulatory changes in the future. Any such changes could directly and adversely impact our financial results and results of operations.
Additionally, in November 2018, the United States Commerce Department’s Bureau of Industry and Security released an advance notice of proposed rulemaking to control the export of emerging technologies. This notice included “[b]iotechnology, including nanobiology; synthetic biology; genomic and genetic engineering; or neurotech” as possible areas of increased export controls. Therefore, it is possible that our ability to export our products may be restricted in the future.
The imposition of new, or changes in existing, tariffs, trade restrictions, trade barriers, export controls or retaliatory trade measures taken by other countries could adversely impact our business, financial condition and results of operations.
Doing business internationally creates operational and financial risks for our business.
We currently serve thousands of researchers in more than 40 countries and plan to continue to expand to new international jurisdictions as part of our growth strategy. For the year ended December 31, 2019, approximately
45
Table of Contents
43% of our revenue was generated from sales to customers located outside of North America. We believe that a significant portion of our future revenue will come from international sources. We sell directly in North America and certain regions of Europe and have a significant portion of our sales and customer service personnel in the United States. We sell our products through third-party distributors in Asia, certain regions of Europe, Oceania, South America, the Middle East and Africa. As a result, we or our distribution partners may be subject to additional regulations. Conducting operations on an international scale requires close coordination of activities across multiple jurisdictions and time zones. If we fail to coordinate and manage these activities effectively, our business, financial condition or results of operations could be materially and adversely affected and failure to comply with laws and regulations applicable to business operations in foreign jurisdictions may also subject us to significant liabilities and other penalties. International operations entail a variety of other risks, including, without limitation:
| • | challenges in staffing and managing foreign operations; |
| • | potentially longer sales cycles and more time required to engage and educate customers on the benefits of our products outside of the United States; |
| • | the potential need for localized software, documentation and post-sales support; |
| • | reduced protection for intellectual property rights in some countries and practical difficulties of enforcing intellectual property and contract rights abroad; |
| • | complexities associated with managing a third-party contract manufacturer located outside of the United States; |
| • | United States and foreign government trade restrictions, including those which may impose restrictions on the importation, exportation, re-exportation, sale, shipment or other transfer of programming, technology, components and/or services to foreign persons; |
| • | changes in diplomatic and trade relationships, including new tariffs, trade protection measures, import or export licensing requirements, trade embargoes and other trade barriers; |
| • | tariffs imposed by the United States on goods from other countries and tariffs imposed by other countries on United States goods, or increases in existing tariffs; |
| • | deterioration of political relations between the United States and Canada, China, the United Kingdom and the European Union, which could have a material adverse effect on our sales and operations in these countries; |
| • | changes in social, political and economic conditions or in laws, regulations and policies governing foreign trade, manufacturing, development and investment both domestically as well as in the other countries and jurisdictions into which we sell our products, including as a result of the United Kingdom’s exit from the European Union; |
| • | difficulties in obtaining export licenses or in overcoming other trade barriers and restrictions resulting in delivery delays or our inability to sell our products in certain countries; |
| • | increased financial accounting and reporting burdens and complexities; and |
| • | significant taxes or other burdens of complying with a variety of foreign laws, including laws relating to privacy and data protection such as the General Data Protection Regulation (the “GDPR”). |
In conducting our international operations, we are subject to United States laws relating to our international activities, such as the Foreign Corrupt Practices Act of 1977, as well as foreign laws relating to our activities in other countries, such as the United Kingdom Bribery Act of 2010. Additionally, we are subject to laws that prohibit the conduct of business with persons that are subject to “sanctions,” including but not limited to persons listed on the United States Department of Commerce’s List of Denied Persons and the United States Department of Treasury’s Specially Designated Nationals and Blocked Persons List. Failure to comply with these laws and
46
Table of Contents
other applicable laws may subject us to claims or financial and/or other penalties in the United States and/or foreign countries that could materially and adversely impact our operations or financial condition. These risks have become increasingly prevalent as we have expanded our sales into countries that are generally recognized as having a higher risk of corruption.
Historically, most of our revenue has been denominated in U.S. dollars, although we have sold our products and services in local currency outside of the United States, principally the euro. For the year ended December 31, 2019, approximately 15% of our sales were denominated in currencies other than U.S. dollars. Our expenses are generally denominated in the currencies in which our operations are located, which is primarily in the United States. As our operations in countries outside of the United States grow, our results of operations and cash flows will become increasingly subject to fluctuations due to changes in foreign currency exchange rates, which could harm our business in the future. For example, if the value of the U.S. dollar increases relative to foreign currencies, in the absence of a corresponding change in local currency prices, our revenue could be adversely affected as we convert revenue from local currencies to U.S. dollars. In addition, because we conduct business in currencies other than U.S. dollars, but report our results of operations in U.S. dollars, we also face remeasurement exposure to fluctuations in currency exchange rates, which could hinder our ability to predict our future results and earnings and could materially impact our results of operations. We do not currently maintain a program to hedge foreign currency exposures.
Violations of complex foreign and United States laws and regulations could result in fines and penalties, criminal sanctions against us, our officers or our employees, prohibitions on the conduct of our business and on our ability to offer our products and services in one or more countries, and could also materially affect our brand, our international growth efforts, our ability to attract and retain employees, our business and our operating results. Even if we implement policies or procedures designed to ensure compliance with these laws and regulations, there can be no assurance that our distribution partners, our employees, contractors or agents will not violate our policies and subject us to potential claims or penalties.
Significant U.K. or European developments stemming from the U.K.’s withdrawal from the European Union could have a material adverse effect on us.
In January 2020, the United Kingdom exited from the European Union (“Brexit”) under the terms of a withdrawal agreement, entering into a “transition period” ending December 31, 2020 during which the existing regulatory regime will essentially be the same. Formal regulatory and trading relationships between the United Kingdom and the European Union will be dependent upon whether the United Kingdom extends the transition period as provided for in the withdrawal agreement, whether the two parties reach an agreement before the end of the transition period and the content of any agreement(s) reached. The withdrawal process has created political and economic uncertainty, particularly in the United Kingdom and the European Union, and this uncertainty may continue through the transition period and beyond. Our business in the United Kingdom, the European Union and worldwide could be affected during the transition period, and perhaps longer, depending, in part, on the outcome of tariff, trade, regulatory and other negotiations between the United Kingdom and European Union. There are many ways in which our business could be affected, only some of which we are able to currently identify.
The events that could occur in the future as a consequence of the United Kingdom’s withdrawal may cause significant volatility in global financial markets, including in global currency and debt markets. This volatility could cause a slowdown in economic activity in the United Kingdom, Europe or globally, which could adversely affect our operating results and growth prospects. In addition, our business could be negatively affected by new trade agreements or data transfer agreements between the United Kingdom and other countries, including the United States, and by the possible imposition of trade or other regulatory and immigration barriers in the United Kingdom. In addition, access to European Union research funding by research scientists based in the United Kingdom may be reduced or cut off altogether. It also is unclear whether Brexit may limit the ability or willingness of the United Kingdom’s Medical Research Council or other funding sources to continue funding genomic or single cell research by local research centers and labs. The impact of the United Kingdom’s
47
Table of Contents
withdrawal from the European Union could negatively impact our revenue as a result of currency fluctuations, a slowdown in research funding or restricted budgets. In addition, the growth of sales in the United Kingdom may be slowed or those sales may even decline as a result of this withdrawal. Additionally, distribution costs for products sold in the United Kingdom may be increased due to trade agreements and incremental importation expenses. These possible negative impacts, and others resulting from the United Kingdom’s withdrawal from the European Union, may increase our cost of doing business in Europe, disrupt our European operations and adversely affect our operating results and growth prospects.
The illegal distribution and sale by third parties of counterfeit or unfit versions of our products or stolen products could have a negative impact on our reputation and business.
Third parties might illegally distribute and sell counterfeit or unfit versions of our products, which do not meet our rigorous manufacturing, distribution and quality standards. As we expand our business internationally, we expect to encounter counterfeit versions of our products, particularly our consumables. A researcher who receives and uses counterfeit consumables could obtain erroneous results, experience failed experiments or potentially damage his or her instrument. Our reputation and business could suffer harm as a result of counterfeit products sold under our brand name. In addition, inventory that is stolen from warehouses, plants or while in-transit, and that is subsequently improperly stored and sold through unauthorized channels, could adversely impact our customers’ experiments, our reputation and our business.
We currently plan to implement a new company-wide enterprise resource planning system in 2020 and such implementation could adversely affect our business and results of operations or the effectiveness of internal control over financial reporting.
We currently plan to implement a new company-wide enterprise resource planning (“ERP”) system in 2020 to handle the business and financial processes within our operations, manufacturing and corporate functions. ERP implementations are complex and time-consuming projects that involve substantial expenditures on system software, the need to hire consultants and additional personnel for the implementation and implementation activities that can continue for several years. ERP implementations also require transformation of business and financial processes in order to reap the benefits of the ERP system. Our business and results of operations could be adversely affected if we experience operating problems and/or cost overruns during the ERP implementation process, or if the ERP system and the associated process changes do not give rise to the benefits that we expect. If we do not effectively implement and transition to the new ERP system as planned or if the system does not operate as intended, our business, results of operations and internal controls over financial reporting could be adversely affected.
Our solutions contain third-party open source software components and failure to comply with the terms of the underlying open source software licenses could restrict our ability to sell our products.
Our solutions contain software tools licensed by third parties under open source software licenses. Use and distribution of open source software may entail greater risks than use of third-party commercial software, as open source software licensors generally do not provide warranties or other contractual protections regarding infringement claims or the quality of the code. Some open source software licenses contain requirements that the licensee make its source code publicly available if the licensee creates modifications or derivative works using the open source software, depending on the type of open source software the licensee uses and how the licensee uses it. If we combine our proprietary software with open source software in a certain manner, we could, under certain open source software licenses, be required to release the source code of our proprietary software to the public for free. This would allow our competitors to create similar products with less development effort and time and ultimately could result in a loss of product sales and revenue. In addition, some companies that use third-party open source software have faced claims challenging their use of such open source software and their compliance with the terms of the applicable open source license. We may be subject to suits by third parties claiming ownership of what we believe to be open source software, or claiming non-compliance with the
48
Table of Contents
applicable open source licensing terms. Use of open source software may also present additional security risks because the public availability of such software may make it easier for hackers and other third parties to compromise or attempt to compromise our technology platform and systems.
Although we review our use of open source software to avoid subjecting our solutions to conditions we do not intend, the terms of many open source software licenses have not been interpreted by United States courts, and there is a risk that these licenses could be construed in a way that could impose unanticipated conditions or restrictions on our ability to commercialize our solutions. Moreover, we cannot assure investors that our processes for monitoring and controlling our use of open source software in our solutions will be effective. If we are held to have breached the terms of an open source software license, we could be required to seek licenses from third parties to continue offering our solutions on terms that are not economically feasible, to re-engineer our solutions, to discontinue the sale of our solutions if re-engineering could not be accomplished on a timely basis, or to make generally available, in source code form, our proprietary code, any of which could adversely affect our business, operating results and financial condition.
We collect, process, store, share, disclose and use personal information and other data, which subjects us to governmental regulations and other legal obligations related to privacy and security, and our actual or perceived failure to comply with such obligations could harm our business.
We collect, process, store, transmit, disclose and use information from our employees, customers and others, including personal information and other data, some of which may be sensitive in nature. There are numerous federal, state and foreign laws and regulations regarding data protection, privacy and security. We strive to comply with applicable laws, our posted policies and legal contractual obligations relating to privacy and data protection. However, the scope of these laws is changing, is subject to differing interpretations, may be costly to comply with and may be inconsistent among countries and jurisdictions or conflict with other rules. Our business, including our ability to operate and expand internationally, could be adversely affected if legislation or regulations are adopted, interpreted or implemented in a manner that is inconsistent with our current business practices and that require changes to these practices.
The global data protection landscape is rapidly evolving and new laws and regulations are likely to be enacted and violations of existing and new laws and regulations may subject companies to significant penalties and fines, government investigations and/or enforcement actions, private litigation and other claims. For example, the European Union’s adoption of the GDPR introduced stringent requirements for processing personal data. The GDPR is likely to increase compliance burdens on us, including by mandating potentially burdensome documentation requirements and granting certain rights to individuals to control how we collect, use, disclose, retain and leverage information about them or how we obtain consent from them. The processing of sensitive personal data, such as physical health condition, may impose heightened compliance burdens under the GDPR and is a topic of active interest among foreign regulators. In addition, the GDPR provides for breach reporting requirements, more robust regulatory enforcement and greater penalties for noncompliance than previous data protection laws, including fines of up to €20 million or 4% of a noncompliant company’s global annual revenue for the preceding financial year, whichever is greater. As we continue to expand into other foreign countries and jurisdictions, we may be subject to additional laws and regulations that may affect how we conduct business.
In the United States, California enacted the California Consumer Privacy Act (the “CCPA”), which came into effect on January 1, 2020 and limits and imposes requirements on how we may collect and use personal information and provides for civil penalties for violations and a private right of action for data breaches. The impact of this law on us and others in our industry is and will remain unclear until final regulations are issued by the California Attorney General later this year and such regulations are interpreted by enforcement action (which cannot be brought under the CCPA until July 1, 2020) or otherwise. Similar privacy and data protection laws have also been proposed in other states and at the federal level.
Any failure or perceived failure by us or our vendors or partners to comply with these laws and regulations, our privacy and notice policies, our privacy-related obligations to employees, customers or other third parties or
49
Table of Contents
privacy or security-related legal obligations, or any actual or perceived compromise of security that results in the unauthorized access to or disclosure, alteration, theft, loss, transfer or use of personal or other information, including personally identifiable information or other sensitive data, may result in governmental enforcement actions, fines and penalties, litigation or public statements critical of us by consumer advocacy groups or others and could cause our customers, partners or others to lose trust in us, which could have an adverse effect on our business.
If we experience a significant disruption in our information technology systems or breaches of data security, our business could be adversely affected.
We rely on information technology systems to keep financial records, facilitate our research and development initiatives, manage our manufacturing operations, maintain quality control, fulfill customer orders, maintain corporate records, communicate with staff and external parties and operate other critical functions. Our information technology systems are potentially vulnerable to disruption due to breakdown, malicious intrusion, computer viruses, worms, ransomware or other disruptive events including but not limited to natural disasters and catastrophes. Cyberattacks and other malicious internet-based activity continue to increase and cloud-based platform providers of services have been and are expected to continue to be targeted. In addition to traditional computer “hackers,” malicious code (such as viruses, worms and ransomware), employee theft or misuse, denial-of-service attacks and sophisticated nation-state and nation-state supported actors now engage in attacks (including advanced persistent threat intrusions). Despite significant efforts to create security barriers to such threats, it is virtually impossible for us to entirely mitigate these risks. If our security measures are compromised as a result of third-party action, employee or customer error, malfeasance, stolen or fraudulently obtained log-in credentials or otherwise, our reputation could be damaged, our business may be harmed and we could incur significant liability. If we were to experience a prolonged system disruption in our information technology systems or those of certain of our vendors, it could negatively impact our ability to serve our customers, which could adversely impact our business. If operations at our facilities were disrupted, it may cause a material disruption in our business if we are not capable of restoring functionality on an acceptable timeframe. In addition, our information technology systems (and those of our vendors and partners) are potentially vulnerable to data security breaches, whether by internal bad actors (e.g., employees) or external bad actors (attacks of which are becoming increasingly sophisticated, including social engineering and phishing scams), which could lead to the exposure of personal data, sensitive data and confidential information to unauthorized persons. Such data security breaches could lead to the loss of trade secrets or other intellectual property, or could lead to the exposure of personal information (including sensitive personal information) of our employees, customers and others, any of which could have a material adverse effect on our business, reputation, financial condition and results of operations.
We have not always been able in the past and may be unable in the future to anticipate or prevent techniques used to obtain unauthorized access or to compromise our systems because the techniques used change frequently and are generally not detected until after an incident has occurred. Concerns regarding data privacy and security may cause some of our customers to stop using our solutions and fail to renew their subscriptions. This discontinuance in use or failure to renew could substantially harm our business, operating results and growth prospects.
In addition, any such access, disclosure or other loss or unauthorized use of information or data could result in legal claims or proceedings, regulatory investigations or actions, and other types of liability under laws that protect the privacy and security of personal information, including federal, state and foreign data protection and privacy regulations, violations of which could result in significant penalties and fines. In addition, although we seek to detect and investigate all data security incidents, security breaches and other incidents of unauthorized access to our information technology systems and data can be difficult to detect and any delay in identifying such breaches or incidents may lead to increased harm and legal exposure of the type described above.
The cost of investigating, mitigating and responding to potential data security breaches and complying with applicable breach notification obligations to individuals, regulators, partners and others can be significant. Our
50
Table of Contents
insurance policies may not be adequate to compensate us for the potential costs and other losses arising from such disruptions, failures or security breaches. In addition, such insurance may not be available to us in the future on economically reasonable terms, or at all. Further, defending a suit, regardless of its merit, could be costly, divert management attention and harm our reputation.
We rely on on-premise, co-located and third-party data centers and platforms to host our website and other online services, as well as for research and development purposes and any interruptions of service or failures may impair and harm our business.
Our proprietary software is a crucial component of our solutions, as our software allows our end users to visualize genomic and multi-omic information provided by our instruments and reagents. Our software is generally downloadable free of charge from our website for installation and use by end users on their computer systems. Our website is hosted with various third-party service providers located in the United States. We rely on on-premises, co-located and third-party infrastructure in the San Francisco Bay Area and other regions in the United States to perform computationally demanding analysis tasks for our research and development programs and for other business purposes.
In the event of any technical problems that may arise in connection with our on-premise, co-located or third-party data centers, we could experience interruptions in our ability to provide products and services to our customers or in our internal functions, including research and development, which rely on such services. Interruptions or failures may be caused by a variety of factors, including infrastructure changes, human or software errors, viruses, worms, ransomware, security attacks, fraud, spikes in customer usage and denial of service issues. Interruptions or failures in our operations or services may reduce our revenue, result in the loss of customers, adversely affect our ability to attract new customers or harm our reputation. Significant interruptions to our research and development programs could cause us to delay the introduction of new products or improvements to existing products, which could adversely impact our business, our results of operations and the competitiveness of our products.
Our current solutions are capable of generating large datasets, the analysis of which can be time consuming without access to a high-performance computing system. The visualization of such data can also be computationally intensive. As we iterate and improve our products and as the related technologies advance, our continued growth may require an ability to provide our customers with direct access to a high-performance computing system and/or alternative means of obtaining our software. As a result, we expect our reliance on internal and third-party data centers to increase in the future.
Further, as we rely on third-party and public-cloud infrastructure, we will depend in part on third-party security measures to protect against unauthorized access, cyberattacks and the mishandling of customer data. In addition, failures to meet customers’ expectations with respect to security and confidentiality of their data and information could damage our reputation and affect our ability to retain customers, attract new customers and grow our business. In addition, a cybersecurity event could result in significant increases in costs, including costs for remediating the effects of such an event, lost revenue due to a decrease in customer trust and network downtime; increases in insurance coverage due to cybersecurity incidents; and damages to our reputation because of any such incident.
Indebtedness may impair our financial and operating flexibility.
The Loan and Security Agreement contains affirmative and negative covenants, including a covenant requiring us to maintain minimum revenue over specified periods of time and covenants that restrict, among other things, our ability to dispose of assets, change our business, management, ownership or business locations, enter into mergers or acquisitions, incur indebtedness or encumber any of our assets. Borrowings under the Loan and Security Agreement are secured by substantially all of our assets, excluding our intellectual property but including the proceeds from the sale of any of our intellectual property. These restrictions could limit our
51
Table of Contents
operational flexibility and the need to make principal and interest payments on our debt will reduce our ability to fund other aspects of our business, such as our research and development programs. Our ability to make principal and interest payments on our indebtedness will depend on our ability to generate cash. If we default under the Loan and Security Agreement and if the default is not cured or waived, the lender could terminate its commitments to lend to us and cause any amounts outstanding to be payable immediately. Under certain circumstances, the lender could also exercise its rights with respect to the collateral securing such loans. Such a default could also result in cross-defaults under other debt instruments. Moreover, any such default would limit our ability to obtain additional financing, which may have an adverse effect on our cash flow and liquidity.
We may incur indebtedness in the future. The debt instruments governing such indebtedness could contain restrictive provisions. If we incur debt, a portion of our cash flows will be needed to satisfy our debt service obligations. While we do not anticipate that we will need to raise additional financing in the future to fund our operations, in the event that additional financing is required, we may not be able to raise it on terms acceptable to us or at all. As a result, we would be more vulnerable to general adverse economic, industry and capital markets conditions in addition to the risks associated with indebtedness described above.
Our ability to use net operating losses to offset future taxable income may be subject to certain limitations.
As of December 31, 2019, we had federal net operating loss carryforwards (“NOLs”) of $110.7 million and federal tax credit carryforwards of $12.3 million. Our federal NOLs generated after January 1, 2018, which total $6.5 million, are carried forward indefinitely, while all of our other federal NOLs and tax credit carryforwards expire beginning in 2032. As of December 31, 2019, we had state NOLs of $86.6 million, which expire beginning in 2032. In addition, we had state tax credit carryforwards of $11.4 million, which carry forward indefinitely. Our ability to utilize such carryforwards for income tax savings is subject to certain conditions and may be subject to certain limitations in the future due to ownership changes as described below. As such, there can be no assurance that we will be able to utilize such carryforwards. We have experienced a history of losses and a lack of future taxable income would adversely affect our ability to utilize these NOLs and research and development credit carryforwards.
Under Sections 382 and 383 of the Internal Revenue Code of 1986, as amended (the “Code”), if a corporation undergoes an “ownership change,” the corporation’s ability to use its pre-change net operating loss carryforwards and other pre-change attributes, such as research tax credits, to offset its post-change income may be limited. In general, an “ownership change” will occur if there is a cumulative change in our ownership by “5% shareholders” that exceeds 50 percentage points over a rolling three-year period. Similar rules may apply under state tax laws. We completed a study through the date of our IPO to determine whether an ownership change had occurred under Section 382 or 383 of the Code, and we determined at that time that an ownership change occurred in 2013. As a result, our net operating losses generated through November 1, 2013 may be subject to limitation under Section 382 of the Code. The amount of pre-change loss carryforwards which may be subject to this limitation is $4.8 million. Our ability to use net operating loss carryforwards, research and development credit carryforwards and other tax attributes to reduce future taxable income and liabilities may be further limited as a result of future changes in stock ownership. As a result, if we earn net taxable income, our ability to use our pre-change net operating loss carryforwards or other pre-change tax attributes to offset United States federal and state taxable income may still be subject to limitations, which could potentially result in increased future tax liability to us.
We are subject to risks related to taxation in multiple jurisdictions.
We are subject to income taxes in both the United States and foreign jurisdictions. Significant judgments based on interpretations of existing tax laws or regulations are required in determining our provision for income taxes. Our effective income tax rate could be adversely affected by various factors, including, but not limited to, changes in the mix of earnings in tax jurisdictions with different statutory tax rates, changes in the valuation of
52
Table of Contents
deferred tax assets and liabilities, changes in existing tax policies, laws, regulations or rates, changes in the level of non-deductible expenses (including share-based compensation), changes in the location of our operations, changes in our future levels of research and development spending, mergers and acquisitions or the result of examinations by various tax authorities. Although we believe our tax estimates are reasonable, if the United States Internal Revenue Service or other taxing authority disagrees with the positions taken on our tax returns, we could have additional tax liability, including interest and penalties. If material, payment of such additional amounts upon final adjudication of any disputes could have a material impact on our results of operations and financial position.
Changes in tax laws or regulations that are applied adversely to us or our customers may have a material adverse effect on our business, cash flow, financial condition or results of operations.
New income, sales, use or other tax laws, statutes, rules, regulations or ordinances could be enacted at any time, which could affect the tax treatment of our domestic and foreign earnings. Any new taxes could adversely affect our domestic and international business operations and our business and financial performance. Further, existing tax laws, statutes, rules, regulations or ordinances could be interpreted, changed, modified or applied adversely to us. For example, the Tax Cuts and Jobs Act of 2017 (the “TCJA”) significantly revised the Code. The recently enacted federal income tax law, among other things, contains significant changes to corporate taxation, including a reduction of the federal statutory rates from a top marginal rate of 35% to a flat rate of 21%, limitation of the tax deduction for interest expense to 30% of adjusted earnings (except for certain small businesses), limitation of the deduction for net operating losses to 80% of current year taxable income, elimination of net operating loss carrybacks, one time taxation of offshore earnings at reduced rates regardless of whether they are repatriated, elimination of U.S. tax on foreign earnings (subject to certain important exceptions), immediate deductions for certain new investments instead of deductions for depreciation expense over time and modifying or repealing many business deductions and credits. Notwithstanding the reduction in the corporate income tax rate, the overall impact of the new federal tax law is uncertain and our business and financial condition could be adversely affected. It is also unknown if and to what extent various states will conform to the newly enacted federal tax law. We have completed our evaluation of the overall impact of TCJA on our effective tax rate and balance sheet through December 31, 2019 and have reflected the amounts in our financial statements for the year ended December 31, 2019.
If we fail to maintain an effective system of disclosure controls and internal control over financial reporting, our ability to produce timely and accurate financial statements or comply with applicable regulations could be impaired.
As a public company, we are subject to the reporting requirements of the Securities Exchange Act of 1934, as amended (the “Exchange Act”), the Sarbanes-Oxley Act of 2002, as amended (“SOX”), and the rules and regulations of the applicable listing standards of the Nasdaq Global Select Market (“Nasdaq”). We expect that the requirements of these rules and regulations will continue to increase our legal, accounting and financial compliance costs, make some activities more difficult, time-consuming and costly, and place significant strain on our personnel, systems and resources.
SOX requires, among other things, that we maintain effective disclosure controls and procedures and internal control over financial reporting. We are continuing to develop and refine our disclosure controls and other procedures that are designed to ensure that information required to be disclosed by us in the reports that we file with the Securities and Exchange Commission (“SEC”) is accurately recorded, processed, summarized and reported within the time periods specified in SEC rules and forms and that information required to be disclosed in reports under the Exchange Act is accumulated and communicated to our principal executive and financial officers. We are also continuing to improve our internal control over financial reporting. In order to maintain and improve the effectiveness of our disclosure controls and procedures and internal control over financial reporting, we have expended, and anticipate that we will continue to expend, significant resources including accounting-related costs and significant management oversight.
53
Table of Contents
Our current controls and any new controls that we develop may become inadequate because of changes in conditions in our business. Further, weaknesses in our disclosure controls and internal control over financial reporting may be discovered in the future. Any failure to develop or maintain effective controls or any difficulties encountered in their implementation or improvement could harm our results of operations or cause us to fail to meet our reporting obligations and may result in a restatement of our financial statements for prior periods. Any failure to implement and maintain effective internal control over financial reporting also could adversely affect the results of periodic management evaluations and annual independent registered public accounting firm attestation reports regarding the effectiveness of our internal control over financial reporting that we will eventually be required to include in our periodic reports that will be filed with the SEC. Ineffective disclosure controls and procedures and internal control over financial reporting could also cause investors to lose confidence in our reported financial and other information, which would likely have a negative effect on the trading price of our Class A common stock. In addition, if we are unable to continue to meet these requirements, we may not be able to remain listed on Nasdaq. We are not currently required to comply with the SEC rules that implement Section 404 of SOX and are therefore not required to make a formal assessment of the effectiveness of our internal control over financial reporting for that purpose. As a public company, we will be required to provide an annual management report on the effectiveness of our internal control over financial reporting commencing with our second annual report on Form 10-K, which will be filed in 2021.
We cannot provide any assurance that significant deficiencies or material weaknesses in our internal controls over financial reporting will not be identified in the future. If we fail to remediate any significant deficiencies or material weaknesses that may be identified in the future or encounter problems or delays in the implementation of internal controls over financial reporting, we may be unable to conclude that our internal controls over financial reporting are effective. We are currently implementing an internal audit function and any failure to correctly do so could lead to significant deficiencies or material weaknesses in our financial reporting. Any failure to develop or maintain effective controls or any difficulties encountered in our implementation of our internal controls over financial reporting could result in material misstatements that are not prevented or detected on a timely basis, which could potentially subject us to sanctions or investigations by the SEC or other regulatory authorities. Ineffective internal controls could cause investors to lose confidence in us and the reliability of our financial statements and cause a decline in the price of our Class A common stock.
Our independent registered public accounting firm is not required to formally attest to the effectiveness of our internal control over financial reporting until our first annual report filed with the SEC where we are an “accelerated filer” or a “large accelerated filer”. At such time, our independent registered public accounting firm may issue a report that is adverse in the event it is not satisfied with the level at which our internal control over financial reporting is documented, designed or operating. Any failure to maintain effective disclosure controls and internal control over financial reporting could materially and adversely affect our business, results of operations and financial condition and could cause a decline in the trading price of our Class A common stock.
If our estimates or judgments relating to our critical accounting policies are based on assumptions that change or prove to be incorrect, our operating results could fall below our publicly announced guidance or the expectations of securities analysts and investors, resulting in a decline in the market price of our Class A common stock.
The preparation of financial statements in conformity with generally accepted accounting principles in the United States (“GAAP”) requires management to make estimates and assumptions that affect the amounts reported in our financial statements and accompanying notes. We base our estimates on historical experience and on various other assumptions that we believe to be reasonable under the circumstances, the results of which form the basis for making judgments about the carrying values of assets, liabilities, equity, revenue and expenses that are not readily apparent from other sources. If our assumptions underlying our estimates and judgements relating to our critical accounting policies change or if actual circumstances differ from our assumptions, estimates or judgements, our operating results may be adversely affected and could fall below our publicly announced guidance or the expectations of securities analysts and investors, resulting in a decline in the market price of our Class A common stock.
54
Table of Contents
Risks related to litigation and our intellectual property
We are involved in significant litigation which has consumed significant resources and management time and adverse resolution of these lawsuits could require us to pay significant damages, and prevent us from selling our products, which would severely adversely impact our business, financial condition or results of operations.
Our success depends in part on our non-infringement of the patents or proprietary rights of third parties. Third parties have asserted and may in the future assert that our products infringe patents that they have obtained and may in the future obtain. We have incurred and could incur substantial costs and divert the attention of our management and technical personnel in defending ourselves against any of these claims. Any adverse ruling or perception of an adverse ruling in defending ourselves against these claims could have an adverse impact on our business, financial condition or results of operations. Furthermore, parties making claims against us have obtained and may in the future be able to obtain injunctive or other relief, which effectively could block our ability to further develop, commercialize, market or sell products or services and have resulted and could in the future result in the award of substantial damages against us. In the event of a successful infringement claim against us, we may be required to pay damages and obtain one or more licenses from third parties or be prohibited from selling certain products or services. In addition, we may be unable to obtain these licenses at a reasonable cost, if at all. We could therefore incur substantial costs related to royalty payments for licenses obtained from third parties, which could negatively affect our gross margins and earnings per share. In addition, we could encounter delays in product introductions while we attempt to develop alternative methods or products. Defense of any lawsuit or failure to obtain any of these licenses on favorable terms could prevent us from commercializing products and the prohibition of sale of any of our products or services could adversely affect our ability to grow or achieve or maintain profitability. Regardless of merit or eventual outcome, lawsuits brought against us may result in decreased demand for our products, injury to our reputation and increased insurance costs.
We have been involved in multiple patent litigation matters in the past several years and we expect that given the litigious history of our industry and the high profile of operating as a public company, other third parties, in addition to the parties identified herein, may claim that our products infringe their intellectual property rights. Our success depends in part on our ability to defend ourselves against such claims and maintain the validity of our patents and other proprietary rights.
In particular, we are currently involved in the following litigation matters related to substantially all of our products, the loss of any of which could have a material adverse effect on our business, operations, financial results and reputation. Beginning in 2015, Bio-Rad has filed six separate patent infringement cases against substantially all of our products, including instruments and consumables. These litigations are generally distinct and involve different Bio-Rad patents, however, the patents asserted by Bio-Rad in the U.S. International Trade Commission (“ITC”) are also asserted in the district court case filed in the Northern District of California.
The details of these litigation matters are described below:
The 2015 Delaware Action
In February 2015, Raindance Technologies, Inc. (“Raindance”) and the University of Chicago filed suit against us in the U.S. District Court for the District of Delaware, alleging that substantially all of our products that use our GEM microfluidic chips are infringing seven U.S. patents owned by or exclusively licensed to Raindance (the “Delaware Action”). In May 2017, Bio-Rad was substituted as the plaintiff following its acquisition of Raindance. A jury trial was held in November 2018. The jury found that all of our accused products infringed one or more of U.S. Patent Nos. 8,304,193, 8,329,407 and 8,889,083. The jury also concluded that our infringement was willful and awarded Bio-Rad approximately $24 million in damages. Post-trial, Bio-Rad moved for a permanent injunction, treble damages for willful infringement, attorneys’ fees, supplemental damages for the period from the second quarter of 2018 through the end of the trial as well as pre- and post-judgment interest.
55
Table of Contents
The Court denied Bio-Rad’s request for attorneys’ fees and enhanced damages for willful infringement. The Court awarded supplemental damages for the period from the second quarter of 2018 through the end of trial as well as pre- and post-judgment interest. The Court entered final judgment against us in the amount of approximately $35 million in August 2019. In the fourth quarter of 2018, we began recording an accrual for estimated royalties as cost of revenue. This accrual is based on an estimated royalty rate of 15% of worldwide sales of our Chromium instruments operating our GEM microfluidic chips and associated consumables. As of December 31, 2019, we had accrued a total of $68.7 million relating to this matter which includes the $35 million judgment and our estimated 15% royalty for subsequent sales through that date.
The Court also granted Bio-Rad a permanent injunction against our GEM microfluidic chips and associated consumables that were found to infringe the Bio-Rad patents, which have historically constituted a significant amount of our product sales. However, under the injunction, we are permitted to continue to sell our GEM microfluidic chips and associated consumables for use with our historical installed base of instruments provided that we pay a royalty of 15% into escrow on our net revenue related to such sales. We appealed the injunction to the Federal Circuit. The Federal Circuit granted an interim order staying the injunction pending resolution of our motion with respect to our Single Cell CNV and Linked-Read solutions subject to the 15% royalty payment described above. On September 24, 2019, the Federal Circuit extended the stay with respect to the Single Cell CNV and Linked-Read solutions for the pendency of the appeal, but otherwise denied our request to stay the injunction. We also appealed the judgment to the Federal Circuit, which will hold oral arguments in April 2020.
We have dedicated significant resources to designing and manufacturing our Next GEM microfluidic chips which use fundamentally different physics from our GEM microfluidic chips. Neither the jury verdict nor the injunction relate to our Next GEM microfluidic chips based on our new proprietary design and associated consumables which we launched in May 2019 for three of our single cell solutions – Single Cell Gene Expression, Single Cell Immune Profiling and Single Cell ATAC. Since August 28, 2019, all Chromium instruments that we sell and have sold operate exclusively with our Next GEM solutions and we currently expect that our Chromium products utilizing our Next GEM microfluidic chips will constitute substantially all of our Chromium consumables sales by the end of 2020.
Although our Next GEM microfluidic chips were designed to replace our GEM microfluidic chips, we cannot assure you that we will be able to make our Next GEM microfluidic chip work with all of our solutions, that our Next GEM microfluidic chip will allow our customers to maintain the level of performance or quality of our GEM microfluidic chip, that our Next GEM microfluidic chip will replace the sales of the GEM microfluidic chip or that we will be able to manufacture the Next GEM microfluidic chips in sufficient volumes in a timely fashion. Our Next GEM microfluidic chips may be subject to future claims of infringement by Bio-Rad or others and are currently the subject of the litigation described in this risk factor. While we believe that our Chromium solutions, when used with our Next GEM microfluidic chip, would not infringe the asserted Bio-Rad patents, we cannot assure you that our Next GEM microfluidic chip would not become subject to additional patent infringement litigation, which could prevent us from making, selling and importing our Next GEM microfluidic chips. In addition, it is possible that Bio-Rad could, in the future, claim that our continued sale of products violates orders issued by the court and request that the court impose sanctions or other penalties on us for such violations.
In addition, we have not developed Next GEM microfluidic chips for our Single Cell CNV and Linked-Read solutions. Although the Federal Circuit has stayed the injunction with respect to our Single Cell CNV and Linked-Read solutions during the pendency of the appeal, we have not yet released a new version of our instrument that would allow our customers to use these solutions using our GEM microfluidic chip during the pendency of the appeal. Furthermore, it is possible that the injunction could be reinstated with respect to our Single Cell CNV and Linked-Read solutions using our GEM microfluidic chips after the appeal if the Federal Circuit does not rule in our favor.
As of December 31, 2019, we had accrued a total of $68.7 million relating to this matter. Depending upon the ultimate outcome of the litigation with Bio-Rad, we may be required to pay damages, interest and other amounts
56
Table of Contents
at a time specified by the court in excess of these reserves should our accruals prove insufficient to cover the actual damages awarded in the case. While we will continue to evaluate and review our estimate of amounts payable from time to time for any indications that could require us to change our assumptions relating to the amounts already recorded, we cannot assure investors that our estimates and related reserves will be sufficient.
Also in 2015, we filed multiple petitions for inter partes review (“IPR”) at the Patent Trial and Appeal Board (“PTAB”) of the U.S. Patent and Trademark Office (“USPTO”) against Raindance and the University of Chicago relating to the patents asserted in the Delaware Action, including U.S. Patent Nos. 7,129,091, 8,658,430, 8,304,193, 8,273,573, 8,329,407, 8,889,083 and 8,822,148. Among these proceedings, all the claims in the ‘430 patent were determined by the PTAB to be invalid, all the claims in the ‘573 patent were canceled, and our invalidity challenges to the remaining Bio-Rad patents were unsuccessful. Accordingly, we may be precluded from challenging the ‘091, ‘193, ‘407 and ‘148 patents at the PTAB in the future as a result of these decisions. Further, because all the claims in the ‘083 patent survived the IPR challenge, we will be precluded from making certain invalidity challenges to this patent at the PTAB, or in a district court or ITC litigation in the future.
The ITC 1068 Action
On July 31, 2017, Bio-Rad and Lawrence Livermore National Security, LLC filed a complaint against us in the ITC pursuant to Section 337 of the Tariff Act of 1930, alleging that substantially all of our products infringe U.S. Patents Nos. 9,089,844, 9,126,160, 9,500,664, 9,636,682 and 9,649,635 (the “ITC 1068 Action”). Bio-Rad is seeking an exclusion order preventing us from importing the accused microfluidic chips, including (1) our GEM microfluidic chip, (2) our gel bead manufacturing microfluidic chip and (3) our Next GEM microfluidic chip, into the United States and a cease and desist order preventing us from selling such imported chips. An evidentiary hearing for the ITC 1068 Action was held in May of 2018 and the presiding judge issued an Initial Determination in September 2018, finding that our GEM microfluidic chips infringe the ‘664, ‘682 and ‘635 patents but not the ‘160 patent. The judge further found that our gel bead manufacturing microfluidic chip and Next GEM microfluidic chip do not infringe any claim asserted against them.
On December 18, 2019, the ITC issued its final determination in the ITC 1068 Action (the “Final Determination”). The Final Determination affirmed the Initial Determination that our Next GEM microfluidic chips and gel bead manufacturing microfluidic chips do not infringe any of the claims asserted against them. The Final Determination also affirmed the ruling that our GEM microfluidic chips infringe the ‘664, ‘682 and ‘635 patents but not the ‘160 patent. The ITC issued (1) a limited exclusion order prohibiting the unlicensed importation of the GEM microfluidic chips into the United States and (2) a cease and desist order preventing us from selling such imported GEM microfluidic chips in the United States. The ITC expressly allowed the importation and sale of the GEM microfluidic chips for use by researchers who were using such chips as of December 18, 2019, and who have a documented need to continue receiving such chips for a specific current ongoing research project for which that need cannot be met by any alternative product. The Final Determination was subject to a 60-day presidential review period. During the presidential review period, we were permitted to continue importation and sales of the GEM microfluidic chips subject to payment of a bond of three (3) percent of the entered value of the accused microfluidic chips.
In order to allow our customers to continue their important research, we have dedicated significant resources to developing the capabilities to manufacture our microfluidic chips in the United States prior to the entry of the exclusion order or cease and desist order which took effect in February 2020. Prior to the second quarter of 2019, all of our microfluidic chips were manufactured outside of the United States. Our United States manufacturing facilities achieved volume production of certain of our GEM microfluidic chips accounting for the majority of our United States consumable revenue beginning in the third quarter of 2019. We cannot assure investors that our U.S. manufacturing facilities can produce our microfluidic chips to the same level of functionality, quality or quantity as our current foreign manufacturer. Moreover, Bio-Rad has also filed other suits against us, including in the U.S. District Court for the Northern District of California, which is discussed separately below. If Bio-Rad succeeds in obtaining an injunction in the district court case or any of the other cases, we could be prohibited
57
Table of Contents
from selling our GEM microfluidic chips, regardless of where they are manufactured. If we are prohibited from selling our GEM microfluidic chips, our business, operations, financial results and reputation would be significantly adversely impacted.
Further, although the ITC affirmed that our Next GEM microfluidic chips do not infringe the Bio-Rad patents asserted in this action, we expect Bio-Rad to appeal this non-infringement ruling to the Court of Appeals for the Federal Circuit. We expect the appeal to be completed in approximately mid-2021, and we cannot assure investors that this non-infringement ruling will not be reversed on appeal. We have not yet manufactured our Next GEM microfluidic chips in the United States. If the Federal Circuit reverses the non-infringement finding about our Next GEM microfluidic chips and prohibits us from importing such chips or selling previously imported chips, our business, operations, financial results and reputation would be significantly adversely impacted.
In addition, it is possible that Bio-Rad could, in the future, file enforcement proceedings claiming that we have violated the exclusion order and/or cease and desist order entered in the ITC 1068 Action and requesting that the ITC impose sanctions or other penalties on us for such violations. Our Next GEM microfluidic chips could also become subject to other patent infringement litigations. If we are prohibited from selling our Next GEM microfluidic chips, our business, operations, financial results and reputation would be significantly adversely impacted.
The Northern District of California Action
On July 31, 2017, Bio-Rad and Lawrence Livermore National Security, LLC also filed suit against us in the U.S. District Court for the Northern District of California, alleging that substantially all of our products infringe U.S. Patents Nos. 9,216,392, 9,347,059 and the five patents asserted in the ITC 1068 Action. The complaint seeks injunctive relief, unspecified monetary damages, costs and attorneys’ fees. This litigation has been stayed pending resolution of the ITC 1068 Action. If we are found to infringe these patents or if we are prohibited from selling our products, our business, operations, financial results and reputation could be significantly adversely impacted.
In 2017 and 2018, we filed multiple petitions for IPR at the PTAB against Bio-Rad regarding U.S. Patent Nos. 9,126,160, 9,216,392, 9,649,635, 9,089,844, 9,636,682 and 9,500,664, all of which were also asserted in the ITC 1068 Action or the Northern District of California Case. The PTAB denied institution of all the IPRs, which may preclude us from challenging these patents at the PTAB in the future.
The Germany Action
On February 13, 2018, Bio-Rad filed suit against us in Germany in the Munich Region Court alleging that our Chromium instruments, GEM microfluidic chips and certain accessories infringe German Utility Model No. DE 20 2011 110 979. Bio-Rad seeks unspecified damages and an injunction prohibiting sales of these products in Germany and requiring us to recall these products sold in Germany subsequent to February 11, 2018. An initial hearing was held on November 27, 2018, and a subsequent hearing was held on May 15, 2019. The Court issued a ruling on November 20, 2019. The Court ruled that the Company’s GEM microfluidic chips, as well as certain Chromium instruments and accessories used with GEM microfluidic chips, infringed the German Utility Model. The Court issued an injunction with respect to such GEM microfluidic chips, Chromium instruments and accessories used with such systems, prohibiting among other things the sale of these products in Germany and the importation of such products into Germany. The Court found that the Company is obligated to compensate Bio-Rad for unspecified damages and required that these products be recalled from distribution channels in Germany. The Court further found that the Company has to bear the statutory costs of the legal dispute in a minimum amount of at least 61,000 Euros. The remedies, including the injunction, will take effect once enforced upon the posting of a bond by Bio-Rad. The Court’s ruling did not address the Company’s Next GEM products, which were not accused in this action and which constitute substantially all of the Company’s sales in Germany.
58
Table of Contents
We are currently appealing the Court’s ruling. If we are prohibited from selling our products in Germany, or if our products are recalled in Germany, our business, operations, financial results and reputation could be adversely impacted.
The 2018 Delaware Action
On October 25, 2018, Bio-Rad filed suit against us in the U.S. District Court for the District of Delaware, alleging that substantially all of our products, including our GEM products and Next GEM products, infringe U.S. Patent Nos. 9,562,837 and 9,896,722. Bio-Rad seeks injunctive relief, unspecified monetary damages, costs and attorneys’ fees. Discovery is in progress. A trial is scheduled in September 2021. If we are found to infringe these patents or if we are prohibited from selling our products, our business, operations, financial results and reputation could be significantly adversely impacted.
The Massachusetts Action
On September 11, 2019, Bio-Rad filed suit against us in the U.S. District Court for the District of Delaware, alleging that our Next GEM products infringe certain claims of U.S. Patent No. 8,871,444. On November 5, 2019, Bio-Rad amended the complaint to additionally allege that our Next GEM products infringe certain claims of U.S. Patent Nos. 9,919,277 and 10,190,115. The ‘444 and ‘277 patents are exclusively licensed by Bio-Rad from Harvard University, which subsequently joined the suit as a party plaintiff.
On December 18, 2019, Bio-Rad dismissed this action in the District of Delaware and refiled it in the U.S. District Court for the District of Massachusetts. The case is assigned to Judge William G. Young. On January 14, 2020, the judge consolidated this case with a separate action, Bio-Rad Laboratories Inc. et al. v. Stilla Technologies, Inc., in which Bio-Rad is asserting the ‘444 patent (among other patents) against Stilla Technologies, Inc.’s droplet digital PCR product. On January 23, 2020, we filed a motion to dismiss the case and to transfer the ‘115 patent to the Northern District of California, where the related ‘059 patent is stayed. A hearing on our motion to dismiss and transfer is scheduled in March 2020.
On January 24, 2020, we filed antitrust counterclaims against Bio-Rad alleging violations of (a) Section 7 of the Clayton Act, (b) Section 2 of the Sherman Act, and (c) California unfair competition laws, for illegally acquiring Raindance Technologies and illegally monopolizing or attempting to monopolize markets relating to droplet digital PCR products, droplet single cell products and droplet genetic analysis technology. On February 19, 2020, Bio-Rad moved to dismiss, or alternatively to stay and sever, our antitrust claims. A hearing on Bio-Rad’s motion to dismiss is scheduled in March 2020.
On February 5, we filed additional counterclaims against Bio-Rad alleging that Bio-Rad’s single cell ATAC-seq products infringe U.S. Patent No. 9,029,085 and 9,850,526 that are exclusively licensed to us from Harvard University.
A Markman hearing has been scheduled in June 2020. The judge has ordered the parties to be ready for trial with respect to our antitrust counterclaims by April 2021. A trial date for Bio-Rad’s patent claims and our patent counterclaims has not yet been set, but may be set for shortly after the antitrust trial.
If we are found to infringe the asserted patents or if we are prohibited from selling our products, our business, operations, financial results and reputation could be significantly adversely impacted.
We are involved in lawsuits to protect, enforce or defend our patents and other intellectual property rights, which are expensive, time consuming and could ultimately be unsuccessful.
On January 11, 2018, we filed a complaint against Bio-Rad at the ITC pursuant to Section 337 of the Tariff Act of 1930 alleging that Bio-Rad infringes our U.S. Patent Nos. 9,644,204, 9,689,024, 9,695,468 and 9,856,530 (the “ITC 1100 Action”). The judge issued an Initial Determination on July 12, 2019 finding that Bio-Rad’s ddSEQ products infringe the ‘024, ‘468 and ‘530 patents. The judge also found all of our asserted patents to be valid and rejected Bio-Rad’s claim of ownership in all of the asserted patents.
59
Table of Contents
On February 12, 2020, the ITC issued its Final Determination affirming the judge’s findings with respect to Bio-Rad’s violation of the ‘024, ‘468 and ‘530 patents, including the judge’s findings for those patents with respect to infringement, validity and ownership. The ITC issued an exclusion order prohibiting Bio-Rad from importing into the United States infringing microfluidic devices, components thereof and products containing same, including the ddSEQ products. The ITC also issued a cease and desist order preventing Bio-Rad from selling such imported products in the United States. The ITC’s remedial orders do not identify any ddSEQ assay as exempted from their potential scope. The ITC orders do not prohibit the importation or sale of microfluidic consumables imported into the U.S. for use by researchers who are using such consumables as of February 12, 2020, and who have a documented need to continue receiving such consumables for a specific current ongoing research project for which that need cannot be met by any alternative product. The Final Determination is subject to a 60-day presidential review period. We expect Bio-Rad to appeal the Final Determination to the Court of Appeals for the Federal Circuit. We expect appeals to be completed in mid 2021, and we cannot guarantee investors that the Final Determination will not be reversed on appeal.
Also in January 2018, we filed a related but separate suit against Bio-Rad in the U.S. District Court for the Northern District of California, alleging that Bio-Rad infringes the ‘204, ‘024, ‘468 and ‘530 patents. The ‘204, ‘024, ‘468 and ‘530 patents generally relate to gel bead reagents that are used in our Chromium products, which historically have constituted a significant amount of our current sales. This litigation has been stayed pending resolution of the ITC 1100 Action.
In January 2019, Bio-Rad also filed petitions for IPR of the ‘024, ‘468 and ‘530 patents at the PTAB seeking to invalidate these patents. In July and August of 2019, the PTAB denied institution of all of these Bio-Rad IPR petitions.
In addition to the litigation and legal proceedings discussed above, we are currently and may in the future be a party to other litigation or legal proceedings to determine the scope and validity of our intellectual property, which, if resolved adversely to us, could invalidate or render unenforceable our intellectual property or generally preclude us from restraining, enjoining or otherwise seeking to exclude competitors from commercializing products using technology developed or used by us. For example, our patents and any patents which we in-license may be challenged, narrowed, invalidated or circumvented. If patents we own or license are invalidated or otherwise limited, other companies may be better able to develop products that compete with ours, which would adversely affect our competitive position, business prospects, results of operations and financial condition.
The following are examples of litigation and other adversarial proceedings or disputes that we could become a party to involving our patents or patents licensed to us:
| • | we have initiated, and in the future may initiate, litigation or other proceedings against third parties to enforce our patent rights; |
| • | third parties have initiated, and in the future may initiate, litigation or other proceedings seeking to invalidate patents owned by or licensed to us or to obtain a declaratory judgment that their product or technology does not infringe our patents or patents licensed to us or that such patents are invalid or unenforceable; |
| • | third parties have initiated, and in the future may initiate, oppositions, IPRs, post grant reviews or reexamination proceedings challenging the validity or scope of our patent rights, requiring us and/or licensors to participate in such proceedings to defend the validity and scope of our patents; |
| • | there are, and in the future may be, more challenges or disputes regarding inventorship or ownership of patents currently identified as being owned by or licensed to us; or |
| • | at our initiation or at the initiation of a third-party, the USPTO may initiate an interference between patents or patent applications owned by or licensed to us and those of our competitors, requiring us and/or licensors to participate in an interference proceeding to determine the priority of invention, which could jeopardize our patent rights. |
60
Table of Contents
Furthermore, many of our employees were previously employed at universities or other life sciences companies, including our competitors or potential competitors. We or our employees may be subject to claims that these employees or we have inadvertently or otherwise used or disclosed trade secrets or other proprietary information of their former employers. Although no such claims are currently pending, litigation may be necessary to defend against such claims if they arise in the future. If we fail to successfully defend such claims, in addition to paying monetary damages, we may be subject to injunctive relief and lose valuable intellectual property rights. A loss of key research personnel work product could hamper or prevent our ability to commercialize certain potential products, which could severely harm our business. Even if we are successful in defending against these claims, litigation could result in substantial costs and be a distraction to management.
If we are unable to protect our intellectual property effectively, our business would be harmed.
We rely on patent protection as well as trademark, copyright, trade secret and other intellectual property rights protection and contractual restrictions to protect our proprietary technologies, all of which provide limited protection and may not adequately protect our rights or permit us to gain or keep any competitive advantage. As of December 31, 2019, worldwide we owned or exclusively licensed over 200 issued or allowed patents and 480 pending patent applications. We also license additional patents on a non-exclusive and/or territory restricted basis. We continue to file new patent applications to attempt to obtain further legal protection of the full range of our technologies. If we fail to protect our intellectual property, third parties may be able to compete more effectively against us and we may incur substantial litigation costs in our attempts to recover or restrict the use of our intellectual property.
Our success depends in part on obtaining patent protection for our products and processes, preserving trade secrets, patents, copyrights and trademarks, operating without infringing the proprietary rights of third parties and acquiring licenses for technology or products. We may exercise our business judgment and choose to relinquish rights in trade secrets by filing applications that disclose and describe our inventions and certain trade secrets when we seek patent protection for certain of our products and technology. We cannot assure investors that any of our currently pending or future patent applications will result in issued patents and we cannot predict how long it will take for such patents to be issued. Further, in some cases, we have only filed provisional patent applications on certain aspects of our products and technologies and each of these provisional patent applications is not eligible to become an issued patent until, among other things, we file a non-provisional patent application within 12 months of the filing date of the applicable provisional patent application. Such provisional patents may not become issued patents for a variety of reasons, including our failure to file a non-provisional patent application within the permitted timeframe or a decision that doing so no longer makes business or financial sense. Publications of discoveries in scientific literature often lag behind the actual discoveries and patent applications in the United States and other jurisdictions are typically not published until 18 months after filing or in some cases not at all. Therefore, we cannot know with certainty whether we were the first to make the inventions claimed in our owned or licensed patents or pending patent applications, or that we were the first to file for patent protection of such inventions. As a result, the issuance, scope, validity, enforceability and commercial value of our patent rights are highly uncertain, despite the importance of seeking patent protection in our industry.
Further, we cannot assure investors that other parties will not challenge any patents issued to us or that courts or regulatory agencies will hold our patents to be valid or enforceable. We cannot guarantee investors that we will be successful in defending challenges made against our patents and patent applications, even if we spend significant resources defending such challenges. Any successful third-party challenge to our patents could result in the unenforceability or invalidity of such patents and could deprive us of the ability to prevent others from using the technologies claimed in such issued patents.
Changes in either the patent laws or in interpretations of patent laws in the United States or other countries may diminish the value of our intellectual property. We cannot predict the breadth of claims that may be allowed or enforced in our patents or in third-party patents.
61
Table of Contents
In addition to pursuing patents on our technology, we take steps to protect our intellectual property and proprietary technology by entering into confidentiality agreements and intellectual property assignment agreements with our employees, consultants, corporate partners and, when needed, our advisors. Such agreements may not be enforceable or may not provide meaningful protection for our trade secrets or other proprietary information in the event of unauthorized use or disclosure or other breaches of the agreements and we may not be able to prevent such unauthorized disclosure. Monitoring unauthorized disclosure is difficult and we do not know whether the steps we have taken to prevent such disclosure are, or will be, adequate. If we were to enforce a claim that a third-party had illegally obtained and was using our trade secrets, it would be expensive and time consuming and the outcome would be unpredictable.
We also seek trademark registration to protect key trademarks such as our 10X, CHROMIUM and VISIUM marks, however, we have not yet registered all of our trademarks in all of our current and potential markets. If we apply to register these trademarks, our applications may not be allowed for registration and our registered trademarks may not be maintained or enforced. In addition, opposition or cancellation proceedings may be filed against our trademark applications and registrations and our trademarks may not survive such proceedings. If we do not secure registrations for our trademarks, we may encounter more difficulty in enforcing them against third parties than we otherwise would.
With respect to all categories of intellectual property protection, our competitors could purchase our products and attempt to replicate some or all of the competitive advantages we derive from our development efforts, willfully infringe our intellectual property rights, design around our protected technology or develop their own competitive technologies that fall outside of our intellectual property rights. In addition, competitors may develop their own versions of our products in countries where we did not apply for patents, where our patents have not issued or where our intellectual property rights are not recognized and compete with us in those countries and markets.
The laws of some countries do not protect intellectual property rights to the same extent as the laws of the United States and many companies have encountered significant problems in protecting and defending such rights in foreign jurisdictions. The legal systems of certain countries, particularly certain developing countries, do not favor the enforcement of patents and other intellectual property protection, particularly those relating to biotechnology, which could make it difficult for us to stop the infringement of our patents. The legal systems in certain countries may also favor state-sponsored or companies headquartered in particular jurisdictions over our first-in-time patents and other intellectual property protection. We are aware of incidents where such entities have stolen the intellectual property of domestic companies in order to create competing products and we believe we may face such circumstances ourselves in the future. In the Office of the United States Trade Representative (“USTR”) annual “Special 301” Report released in 2019, the adequacy and effectiveness of intellectual property protection in a number of foreign countries were analyzed. A number of countries in which both we and our distributors operate are identified in the report as being on the Priority Watch List. In China, for instance, the USTR noted a range of IP-related concerns, including a need to “strengthen IP protection and enforcement, including as to trade secret theft, online piracy and counterfeiting, the high-volume manufacture and export of counterfeit goods, and impediments to pharmaceutical innovation.” The absence of harmonized intellectual property protection laws and effective enforcement makes it difficult to ensure consistent respect for patent, trade secret, and other intellectual property rights on a worldwide basis. As a result, it is possible that we will not be able to enforce our rights against third parties that misappropriate our proprietary technology in those countries.
The U.S. law relating to the patentability of certain inventions in the life sciences is uncertain and rapidly changing, which may adversely impact our existing patents or our ability to obtain patents in the future.
Various courts, including the U.S. Supreme Court, have rendered decisions that impact the scope of patentability of certain inventions or discoveries relating to the life sciences. Specifically, these decisions stand for the proposition that patent claims that recite laws of nature (for example, the relationships between gene expression levels and the likelihood of risk of recurrence of cancer) are not themselves patentable unless those patent claims have sufficient additional features that provide practical assurance that the processes are genuine inventive
62
Table of Contents
applications of those laws rather than patent drafting efforts designed to monopolize the law of nature itself. What constitutes a “sufficient” additional feature is uncertain. Furthermore, in view of these decisions, in December 2014 the USPTO, published revised guidelines for patent examiners to apply when examining process claims for patent eligibility. This guidance was updated by the USPTO in July 2015 and additional illustrative examples provided in May 2016. The USPTO provided additional guidance on examination procedures pertaining to subject matter eligibility in April 2018 and June 2018. The guidance indicates that claims directed to a law of nature, a natural phenomenon or an abstract idea that do not meet the eligibility requirements should be rejected as non-statutory, patent ineligible subject matter; however, method of treatment claims that practically apply natural relationships should be considered patent eligible. We cannot assure you that our patent portfolio will not be negatively impacted by the current uncertain state of the law, new court rulings or changes in guidance or procedures issued by the USPTO. From time to time, the U.S. Supreme Court, other federal courts, the U.S. Congress or the USPTO may change the standards of patentability and validity of patents within the life sciences and any such changes could have a negative impact on our business.
Risks related to ownership of our Class A common stock
The market price of our Class A common stock may be volatile, which could result in substantial losses for investors.
The trading price of our Class A common stock has been and may continue to be highly volatile and could be subject to wide fluctuations in response to various factors, some of which are beyond our control. In addition to the factors discussed in this “Risk Factors” section and elsewhere in this report, these factors include:
| • | the timing of our launch of future products and degree to which the launch and commercialization thereof meets the expectations of securities analysts and investors; |
| • | the outcomes of and related rulings in the litigation and administrative proceedings in which we are currently or may in the future become involved; |
| • | the timing and rate of market acceptance of our Next GEM microfluidic chips, the successful transition of our customers to our Next GEM microfluidic chips and our ability to make our Next GEM microfluidic chip work with all of our solutions; |
| • | the failure or discontinuation of any of our product development and research programs; |
| • | changes in the structure or funding of research at academic and research laboratories and institutions, including changes that would affect their ability to purchase our instruments or consumables; |
| • | the success of existing or new competitive businesses or technologies; |
| • | announcements about new research programs or products of our competitors; |
| • | developments or disputes concerning patent applications, issued patents or other proprietary rights; |
| • | the recruitment or departure of key personnel; |
| • | litigation and governmental investigations involving us, our industry or both; |
| • | regulatory or legal developments in the United States and other countries; |
| • | volatility and variations in market conditions in the life sciences sector generally, or the genomics sector specifically; |
| • | investor perceptions of us or our industry; |
| • | the level of expenses related to any of our research and development programs or products; |
| • | actual or anticipated changes in our estimates as to our financial results or development timelines, variations in our financial results or those of companies that are perceived to be similar to us or changes in estimates or recommendations by securities analysts, if any, that cover our Class A common stock or companies that are perceived to be similar to us; |
63
Table of Contents
| • | whether our financial results meet the expectations of securities analysts or investors; |
| • | the announcement or expectation of additional financing efforts; |
| • | stock-based compensation expense under applicable accounting standards; |
| • | sales of our Class A common stock or Class B common stock by us, our insiders or other stockholders; |
| • | the expiration of market standoff or lock-up agreements; |
| • | general economic, industry and market conditions; |
| • | natural disasters, infectious diseases, epidemics, outbreaks or major catastrophic events; and |
| • | the other factors described in this “Risk Factors” section. |
In recent years, stock markets in general, and the market for life sciences technology companies in particular (including companies in the genomics, biotechnology, diagnostics and related sectors), have experienced significant price and volume fluctuations that have often been unrelated or disproportionate to changes in the operating performance of the companies whose stock is experiencing those price and volume fluctuations. Broad market and industry factors may seriously affect the market price of our Class A common stock, regardless of our actual operating performance. In the past, when the market price of a stock has been volatile, securities class action litigation has often been brought against that company. Because of the potential volatility of our stock price, we may become the target of securities litigation in the future. Securities litigation could result in substantial costs and divert management’s attention and resources from our business.
Sales of a substantial number of shares of our Class A common stock by our existing stockholders could cause the price of our Class A common stock to decline.
Sales of a substantial number of shares of our Class A common stock in the public market could occur at any time following the expiration of the market standoff and lock-up agreements executed in connection with our IPO, the early release of these agreements or the perception in the market that the holders of a large number of shares of Class A common stock intend to sell shares and any of these events could reduce the market price of our Class A common stock. The restrictions in the lock-up agreements executed in connection with our IPO are expected to expire and shares of our Class A common stock covered thereby will be able to be sold in the public market beginning on March 6, 2020.
Moreover, holders of shares of our Class B common stock have rights, subject to conditions, to require us to file registration statements with the SEC covering their shares or to include their shares in registration statements that we may file for ourselves or other stockholders. We have also registered all shares of Class A common stock that we may issue under our equity compensation and employee stock purchase plans. These shares can be freely sold in the public market upon issuance and, if applicable, vesting, subject to volume limitations applicable to affiliates under Rule 144 and Rule 701 and the lock-up agreements described in preceding paragraph. Sales of Class A common stock in the public market as restrictions end or pursuant to registration rights may make it more difficult for us to sell equity securities in the future at a time and at a price that we deem appropriate. These sales also could cause the trading price of our Class A common stock to fall and make it more difficult for you to sell shares of our Class A common stock.
Raising additional capital may cause dilution to our existing stockholders or restrict our operations.
We anticipate that we will seek additional capital through a combination of public and private equity offerings, debt financings, strategic partnerships and alliances and licensing arrangements in the future to fund our operations. We, and indirectly, our stockholders, will bear the cost of issuing and servicing such securities. Because our decision to issue debt or equity securities in any future offering will depend on market conditions and other factors beyond our control, we cannot predict or estimate the amount, timing or nature of any future
64
Table of Contents
offerings. Our decision to issue debt or equity securities will also depend on contractual, legal and other restrictions that may limit our ability to raise additional capital. For example, the terms of our Loan and Security Agreement prohibit, subject to certain exceptions, our ability to incur indebtedness. To the extent that we raise additional capital through the sale of equity or debt securities, your ownership interest will be diluted and the terms may include liquidation or other preferences that adversely affect your rights as a stockholder. The incurrence of indebtedness would result in fixed payment obligations and could involve restrictive covenants, such as limitations on our ability to incur additional debt, limitations on our ability to acquire, sell or license intellectual property rights and other operating restrictions that could adversely impact our ability to conduct our business. Certain of the foregoing transactions may require us to obtain stockholder approval, which we may not be able to obtain.
The multi-class structure of our common stock has the effect of concentrating voting control with those stockholders who held our capital stock prior to the completion of our IPO and may depress the trading price of our Class A common stock.
Our Class A common stock has one vote per share and our Class B common stock has ten votes per share, except as otherwise required by law. Because of the ten-to-one voting ratio between our Class B common stock and Class A common stock, the holders of our Class B common stock collectively control a majority of the combined voting power of our common stock and therefore are able to control all matters submitted to our stockholders for approval. This concentrated control is expected to limit or preclude your ability to influence corporate matters for the foreseeable future, including the election of directors, amendments of our organizational documents and any merger, consolidation, sale of all or substantially all of our assets or other major corporate transaction requiring stockholder approval. In addition, this may prevent or discourage unsolicited acquisition proposals or offers for our capital stock that you may feel are in your best interest as one of our stockholders.
Future transfers by holders of Class B common stock will generally result in those shares converting to Class A common stock, subject to limited exceptions, such as certain transfers effected for estate planning purposes where sole dispositive power and exclusive voting control with respect to the shares of Class B common stock is retained by the transferring holder and transfers between our co-founders. In addition, each outstanding share of Class B common stock held by a stockholder who is a natural person, or held by the permitted entities of such stockholder (as described in our amended and restated certificate of incorporation), will convert automatically into one share of Class A common stock upon the death of such natural person. In the event of the death or permanent and total disability of a co-founder, shares of Class B common stock held by such co-founder or his permitted entities will convert to Class A common stock, provided that the conversion will be deferred for nine months, or up to 18 months if approved by a majority of our independent directors, following his death or permanent and total disability. Transfers between our co-founders are permitted transfers and will not result in conversion of the shares of Class B common stock that are transferred. The conversion of Class B common stock to Class A common stock will have the effect, over time, of increasing the relative voting power of those individual holders of Class B common stock who retain their shares in the long term.
In addition, in July 2017, FTSE Russell and Standard & Poor’s announced that they would cease to allow most newly public companies utilizing dual or multi-class capital structures to be included in their indices. Affected indices include the Russell 2000 and the S&P 500, S&P MidCap 400, and S&P SmallCap 600, which together make up the S&P Composite 1500. Under the announced policies, our multi-class capital structure makes us ineligible for inclusion in any of these indices, and as a result, mutual funds, exchange-traded funds and other investment vehicles that attempt to passively track these indices will not be investing in our stock. It is as of yet unclear what effect, if any, these policies have had and will have on the valuations of publicly traded companies excluded from the indices, but it is possible that these policies may depress valuations of excluded companies as compared to those of other similar companies that are included.
65
Table of Contents
We are an “emerging growth company” and the reduced disclosure requirements applicable to emerging growth companies may make our Class A common stock less attractive to investors.
We are an “emerging growth company,” as defined in the JOBS Act. For so long as we remain an emerging growth company, we are permitted by SEC rules and plan to rely on exemptions from certain disclosure requirements that are applicable to other SEC-registered public companies that are not emerging growth companies. These exemptions include not being required to comply with the auditor attestation requirements of Section 404 of the SOX, not being required to comply with any requirement that may be adopted by the Public Company Accounting Oversight Board regarding mandatory audit firm rotation or a supplement to the auditor’s report providing additional information about the audit and the financial statements, reduced disclosure obligations regarding executive compensation and exemptions from the requirements of holding a nonbinding advisory vote on executive compensation and stockholder approval of any golden parachute payments not previously approved. As a result, the information we provide stockholders will be different than the information that is available with respect to other public companies. We cannot predict whether investors will find our Class A common stock less attractive if we rely on these exemptions. If some investors find our Class A common stock less attractive as a result, there may be a less active trading market for our Class A common stock and our stock price may be more volatile.
In addition, the JOBS Act provides that an emerging growth company can take advantage of an extended transition period for complying with new or revised accounting standards. This allows an emerging growth company to delay the adoption of certain accounting standards until those standards would otherwise apply to private companies. We have elected to avail ourselves of this exemption from new or revised accounting standards and, therefore, we will not be subject to the same new or revised accounting standards as other public companies that are not emerging growth companies. As a result, our financial statements may not be comparable to companies that comply with new or revised accounting pronouncements as of public company effective dates.
We have incurred and will continue to incur increased costs as a result of operating as a public company, and our management will be required to devote substantial time to new compliance initiatives and corporate governance practices, including maintaining an effective system of internal controls over financial reporting.
As a public company, and particularly after we are no longer an emerging growth company, we have incurred and will continue to incur significant legal, accounting and other expenses that we did not incur as a private company. The Dodd-Frank Wall Street Reform and Consumer Protection Act, SOX, the listing requirements of Nasdaq and other applicable federal and Delaware rules and regulations impose various requirements on public companies, including establishment and maintenance of effective disclosure and financial controls and corporate governance practices. We expect that we will need to hire additional accounting, finance and other personnel in connection with our being a public company and our management and other personnel will need to devote a substantial amount of time towards maintaining compliance with these requirements. These requirements will increase our legal and financial compliance costs and will make some activities more time-consuming and costly.
The rules and regulations applicable to us as a public company and recent trends in the insurance market have made it more expensive for us to obtain director and officer liability insurance. We have currently obtained only director and officer liability coverage (commonly referred to as “Side A” coverage). This means that while our directors and officers have direct insurance coverage for acts which the company is not legally required or permitted to indemnify them, the company itself does not have coverage for amounts incurred in defending, among other things, stockholder derivative or securities class action lawsuits or in the event of certain investigative actions, for amounts it must pay as a result of such suits or amounts it must pay to indemnify our directors or officers. We are in essence self-insuring for these costs. Any costs incurred in connection with such litigation could have a material adverse effect on our business, financial condition and results of operations.
In September 2018, California enacted a law that requires publicly held companies headquartered in California to have at least one female director by the end of 2019 and at least three by the end of 2021, depending on the size
66
Table of Contents
of the board. The law would impose financial penalties for failure to comply. We are currently in compliance with the requirements of the law but we may incur costs associated with complying with the law in future years, including costs associated with expanding our board of directors or identifying qualified candidates for appointment to our board of directors, or financial penalties or harm to our brand and reputation if we fail to comply. We cannot predict or estimate the amount of additional costs we may incur or the timing of such costs.
Pursuant to SOX Section 404, we expect that we will be required to furnish a report by our management on our internal control over financial reporting beginning with the filing of our Annual Report on Form 10-K for the year ended December 31, 2020. However, while we remain an emerging growth company, we will not be required to include an attestation report on internal control over financial reporting issued by our independent registered public accounting firm. To achieve compliance with SOX Section 404 within the prescribed period, we will be engaged in a process to document and evaluate our internal control over financial reporting, which is both costly and challenging. In this regard, we will need to continue to dedicate internal resources, potentially engage outside consultants, adopt a detailed work plan to assess and document the adequacy of internal control over financial reporting, continue steps to improve control processes as appropriate, validate through testing that controls are functioning as documented and implement a continuous reporting and improvement process for internal control over financial reporting. Despite our efforts, there is a risk that we will not be able to conclude, within the prescribed timeframe or at all, that our internal control over financial reporting is effective as required by SOX Section 404. If we identify one or more material weaknesses, it could result in an adverse reaction in the financial markets due to a loss of confidence in the reliability of our financial statements.
As a public company, we are required to file with the SEC annual and quarterly information and other reports that are specified in Section 13 of the Exchange Act. We are also required to ensure that we have the ability to prepare financial statements that are fully compliant with all SEC reporting requirements on a timely basis. We are also subject to other reporting and corporate governance requirements, including the requirements of Nasdaq and certain provisions of SOX and the regulations promulgated thereunder, which impose significant compliance obligations upon us. As a public company, we have to and will continue to, among other things:
| • | prepare and distribute periodic public reports and other stockholder communications in compliance with our obligations under the federal securities laws and applicable Nasdaq rules; |
| • | create or expand the roles and duties of our board of directors and committees of the board; |
| • | institute more comprehensive financial reporting and disclosure compliance functions; |
| • | supplement our internal accounting, auditing and reporting function, including hiring additional staff with expertise in accounting and financial reporting for a public company; |
| • | enhance and formalize closing procedures at the end of our accounting periods; |
| • | enhance our internal audit and tax functions; |
| • | enhance our investor relations function; |
| • | establish new internal policies, including those relating to disclosure controls and procedures; and |
| • | involve and retain to a greater degree outside counsel and accountants in the activities listed above. |
We may not be successful in implementing these requirements and the significant commitment of resources required for implementing them could adversely affect our business, financial condition and results of operations. In addition, if we fail to implement the requirements with respect to our internal accounting and audit functions, our ability to report our results of operations on a timely and accurate basis could be impaired and we could suffer adverse regulatory consequences or violate the Nasdaq rules. There could also be a negative reaction in the financial markets due to a loss of investor confidence in us and the reliability of our financial statements.
The requirements of being a public company require a significant commitment of resources and management oversight that has increased and may continue to increase our costs and might place a strain on our systems and
67
Table of Contents
resources. As a result, our management’s attention might be diverted from other business concerns. If we fail to maintain an effective internal control environment or to comply with the numerous legal and regulatory requirements imposed on public companies, we could make material errors in, and be required to restate, our financial statements. Any such restatement could result in a loss of public confidence in the reliability of our financial statements and sanctions imposed on us by the SEC. In addition, the rules and regulations imposed on public companies are often subject to varying interpretations and, as a result, their application in practice may evolve over time as new guidance is provided by regulatory and governing bodies. This could result in continuing uncertainty regarding compliance matters and higher costs necessitated by ongoing revisions to disclosure and governance practices.
Delaware law and provisions in our amended and restated certificate of incorporation and amended and restated bylaws might discourage, delay or prevent a change in control of our company or changes in our management and, therefore, depress the trading price of our Class A common stock.
Our status as a Delaware corporation and the anti-takeover provisions of the Delaware General Corporation Law may discourage, delay or prevent a change in control by prohibiting us from engaging in a business combination with an interested stockholder for a period of three years after the person becomes an interested stockholder, even if a change of control would be beneficial to our existing stockholders. In addition, our restated certificate of incorporation and restated bylaws contain provisions that may make the acquisition of our company more difficult, including the following:
| • | any transaction that would result in a change in control of our company requires the approval of a majority of our outstanding Class B common stock voting as a separate class; |
| • | our multi-class common stock structure provides our holders of Class B common stock with the ability to significantly influence the outcome of matters requiring stockholder approval, even if they own significantly less than a majority of the shares of our outstanding Class A common stock and Class B common stock; |
| • | our board of directors is classified into three classes of directors with staggered three-year terms and directors are only able to be removed from office for cause by the affirmative vote of holders of at least two-thirds of the voting power of our then outstanding capital stock; |
| • | certain amendments to our amended and restated certificate of incorporation require the approval of stockholders holding two-thirds of the voting power of our then outstanding capital stock; |
| • | any stockholder-proposed amendment to our amended and restated bylaws requires the approval of stockholders holding two-thirds of the voting power of our then outstanding capital stock; |
| • | our stockholders are only able to take action at a meeting of stockholders and are not able to take action by written consent for any matter; |
| • | our stockholders are able to act by written consent only if the action is first recommended or approved by the board of directors; |
| • | vacancies on our board of directors are able to be filled only by our board of directors and not by stockholders; |
| • | only our chairman of the board of directors, chief executive officer or a majority of the board of directors are authorized to call a special meeting of stockholders; |
| • | certain litigation against us can only be brought in Delaware; |
| • | our restated certificate of incorporation authorizes undesignated preferred stock, the terms of which may be established and shares of which may be issued, without the approval of the holders of our capital stock; and |
| • | advance notice procedures apply for stockholders to nominate candidates for election as directors or to bring matters before an annual meeting of stockholders. |
68
Table of Contents
These anti-takeover defenses could discourage, delay or prevent a transaction involving a change in control of our company. These provisions could also discourage proxy contests and make it more difficult for stockholders to elect directors of their choosing and to cause us to take other corporate actions they desire, any of which, under certain circumstances, could limit the opportunity for our stockholders to receive a premium for their shares of our capital stock and could also affect the price that some investors are willing to pay for our Class A common stock.
Our amended and restated bylaws designate a state or federal court located within the State of Delaware as the exclusive forum for substantially all disputes between us and our stockholders, which could limit our stockholders’ ability to choose the judicial forum for disputes with us or our directors, officers or employees.
Our amended and restated bylaws provide that, unless we consent in writing to the selection of an alternative forum, (i) any derivative action or proceeding brought on our behalf, (ii) any action asserting a claim of breach of a fiduciary duty owed by any of our directors, officers, stockholders or employees to us or our stockholders, (iii) any action asserting a claim arising pursuant to any provision of the Delaware General Corporation Law, our certificate of incorporation or our amended and restated bylaws or (iv) any action asserting a claim governed by the internal affairs doctrine of the law of the State of Delaware shall, to the fullest extent permitted by law, be exclusively brought in the Court of Chancery of the State of Delaware or, if such court does not have subject matter jurisdiction thereof, the federal district court of the State of Delaware. Nothing in our amended and restated bylaws precludes stockholders that assert claims under the Securities Act of 1933, as amended (the “Securities Act”), or the Exchange Act, or any successors thereto, from bringing such claims in state or federal court, subject to applicable law.
Any person or entity purchasing or otherwise acquiring or holding any interest in any of our securities shall be deemed to have notice of and consented to the foregoing forum selection provisions. These exclusive-forum provisions may limit a stockholder’s ability to bring a claim in a judicial forum of such stockholder’s choosing for disputes with us or our directors, officers or other employees, which may discourage lawsuits against us and our directors, officers and other employees. If a court were to find either exclusive-forum provision in our amended and restated bylaws to be inapplicable or unenforceable in an action, we may incur additional costs associated with resolving the dispute in other jurisdictions, which could harm our results of operations.
69
Table of Contents
Item 1B. Unresolved Staff Comments.
None.
Our corporate headquarters, research and development facilities and manufacturing and distribution centers are located in Pleasanton, California, where we lease approximately 200,000 square feet of space under leases expiring between December 2020 and September 2029. These leases include our global headquarters and research and development center occupying approximately 150,000 square feet in Pleasanton, California. We do not own any real property and believe that our current facilities, together with our global headquarters and research and development center, are sufficient to meet our ongoing needs and that, if we require additional space, we will be able to obtain additional facilities on commercially reasonable terms.
We are regularly subject to claims, lawsuits, arbitration proceedings, administrative actions and other legal and regulatory proceedings involving commercial disputes, competition, intellectual property disputes and other matters, and we may become subject to additional types of claims, lawsuits, arbitration proceedings, administrative actions, government investigations and legal and regulatory proceedings in the future and as our business grows, including proceedings related to product liability or our acquisitions, securities issuances or our business practices, including public disclosures about our business. Our success depends in part on our non-infringement of the patents or proprietary rights of third parties. Third parties have asserted and may in the future assert that we are employing their proprietary technology without authorization. We have been involved in multiple patent litigation matters in the past several years and we expect that given the litigious history of our industry and the high profile of operating as a public company, other third parties, in addition to the parties identified herein, may claim that our products infringe their intellectual property rights. There are inherent uncertainties in these legal matters, some of which are beyond management’s control, making the ultimate outcomes difficult to predict. We are currently involved in the following litigation matters:
The 2015 Delaware Action
In February 2015, Raindance Technologies, Inc. (“Raindance”) and the University of Chicago filed suit against us in the U.S. District Court for the District of Delaware, alleging that substantially all of our products that use our GEM microfluidic chips are infringing seven U.S. patents owned by or exclusively licensed to Raindance (the “Delaware Action”). In May 2017, Bio-Rad Laboratories, Inc. (“Bio-Rad”) was substituted as the plaintiff following its acquisition of Raindance. A jury trial was held in November 2018. The jury found that all of our accused products infringed one or more of U.S. Patent Nos. 8,304,193, 8,329,407 and 8,889,083. The jury also concluded that our infringement was willful and awarded Bio-Rad approximately $24 million in damages. Post-trial, Bio-Rad moved for a permanent injunction, treble damages for willful infringement, attorneys’ fees, supplemental damages for the period from the second quarter of 2018 through the end of the trial as well as pre- and post-judgment interest.
The Court denied Bio-Rad’s request for attorneys’ fees and enhanced damages for willful infringement. The Court awarded supplemental damages for the period from the second quarter of 2018 through the end of trial as well as pre- and post-judgment interest. The Court entered final judgment against us in the amount of approximately $35 million in August 2019.
In the fourth quarter of 2018, we began recording an accrual for estimated royalties as cost of revenue. This accrual is based on an estimated royalty rate of 15% of worldwide sales of our Chromium instruments operating our GEM microfluidic chips and associated consumables. As of December 31, 2019, we had accrued a total of $68.7 million relating to this matter which includes the $35 million judgment and our estimated 15% royalty for subsequent sales through that date.
70
Table of Contents
The Court also granted Bio-Rad a permanent injunction against our GEM microfluidic chips and associated consumables that were found to infringe the Bio-Rad patents, which have historically constituted a significant amount of our product sales. However, under the injunction, we are permitted to continue to sell our GEM microfluidic chips and associated consumables for use with our historical installed base of instruments provided that we pay a royalty of 15% into escrow on our net revenue related to such sales. We appealed the injunction to the Federal Circuit. The Federal Circuit granted an interim order staying the injunction pending resolution of our motion with respect to our Single Cell CNV and Linked-Read solutions subject to the 15% royalty payment described above. On September 24, 2019, the Federal Circuit extended the stay with respect to the Single Cell CNV and Linked-Read solutions for the pendency of the appeal, but otherwise denied our request to stay the injunction. We also appealed the judgment to the Federal Circuit, which will hold oral arguments in April 2020.
We have dedicated significant resources to designing and manufacturing our Next GEM microfluidic chips which use fundamentally different physics from our GEM microfluidic chips. Neither the jury verdict nor the injunction relate to our Next GEM microfluidic chips based on our new proprietary design and associated consumables which we launched in May 2019 for three of our single cell solutions – Single Cell Gene Expression, Single Cell Immune Profiling and Single Cell ATAC. Since August 28, 2019, all Chromium instruments that we sell and have sold operate exclusively with our Next GEM solutions and we currently expect that our Chromium products utilizing our Next GEM microfluidic chips will constitute substantially all of our Chromium consumables sales by the end of 2020.
The ITC 1068 Action
On July 31, 2017, Bio-Rad and Lawrence Livermore National Security, LLC filed a complaint against us in the U.S. International Trade Commission (“ITC”) pursuant to Section 337 of the Tariff Act of 1930, alleging that substantially all of our products infringe U.S. Patents Nos. 9,089,844, 9,126,160, 9,500,664, 9,636,682 and 9,649,635 (the “ITC 1068 Action”). Bio-Rad is seeking an exclusion order preventing us from importing the accused microfluidic chips, including (1) our GEM microfluidic chip, (2) our gel bead manufacturing microfluidic chip and (3) our Next GEM microfluidic chip, into the United States and a cease and desist order preventing us from selling such imported chips. An evidentiary hearing for the ITC 1068 Action was held in May of 2018 and the presiding judge issued an Initial Determination in September 2018, finding that our GEM microfluidic chips infringe the ‘664, ‘682 and ‘635 patents but not the ‘160 patent. The judge further found that our gel bead manufacturing microfluidic chip and Next GEM microfluidic chip do not infringe any claim asserted against them.
On December 18, 2019, the ITC issued its final determination in the ITC 1068 Action (the “Final Determination”). The Final Determination affirmed the Initial Determination that our Next GEM microfluidic chips and gel bead manufacturing microfluidic chips do not infringe any of the claims asserted against them. The Final Determination also affirmed the ruling that our GEM microfluidic chips infringe the ‘664, ‘682 and ‘635 patents but not the ‘160 patent. The ITC issued (1) a limited exclusion order prohibiting the unlicensed importation of the GEM microfluidic chips into the United States and (2) a cease and desist order preventing us from selling such imported GEM microfluidic chips in the United States. The ITC expressly allowed the importation and sale of the GEM microfluidic chips for use by researchers who were using such chips as of December 18, 2019, and who have a documented need to continue receiving such chips for a specific current ongoing research project for which that need cannot be met by any alternative product. The Final Determination was subject to a 60-day presidential review period. During the presidential review period, we were permitted to continue importation and sales of the GEM microfluidic chips subject to payment of a bond of three (3) percent of the entered value of the accused microfluidic chips.
In order to allow our customers to continue their important research, we have dedicated significant resources to developing the capabilities to manufacture our microfluidic chips in the United States prior to the entry of the exclusion order or cease and desist order which took effect in February 2020. Prior to the second quarter of 2019, all of our microfluidic chips were manufactured outside of the United States. Our United States manufacturing
71
Table of Contents
facilities achieved volume production of certain of our GEM microfluidic chips accounting for the majority of our United States consumable revenue beginning in the third quarter of 2019.
The Northern District of California Action
On July 31, 2017, Bio-Rad and Lawrence Livermore National Security, LLC also filed suit against us in the U.S. District Court for the Northern District of California, alleging that substantially all of our products infringe U.S. Patents Nos. 9,216,392, 9,347,059 and the five patents asserted in the ITC 1068 Action. The complaint seeks injunctive relief, unspecified monetary damages, costs and attorneys’ fees. This litigation has been stayed pending resolution of the ITC 1068 Action.
The Germany Action
On February 13, 2018, Bio-Rad filed suit against us in Germany in the Munich Region Court alleging that our Chromium instruments, GEM microfluidic chips and certain accessories infringe German Utility Model No. DE 20 2011 110 979. Bio-Rad seeks unspecified damages and an injunction prohibiting sales of these products in Germany and requiring us to recall these products sold in Germany subsequent to February 11, 2018. An initial hearing was held on November 27, 2018, and a subsequent hearing was held on May 15, 2019. The Court issued a ruling on November 20, 2019. The Court ruled that our GEM microfluidic chips, as well as certain Chromium instruments and accessories used with GEM microfluidic chips, infringed the German Utility Model. The Court issued an injunction with respect to such GEM microfluidic chips, Chromium instruments and accessories used with such systems, prohibiting among other things the sale of these products in Germany and the importation of such products into Germany. The Court found that we are obligated to compensate Bio-Rad for unspecified damages and required that these products be recalled from distribution channels in Germany. The Court further found that we have to bear the statutory costs of the legal dispute in a minimum amount of at least 61,000 Euros. The remedies, including the injunction, will take effect once enforced upon the posting of a bond by Bio-Rad. The Court’s ruling did not address our Next GEM products, which were not accused in this action and which constitute substantially all of our sales in Germany. We are currently appealing the Court’s ruling.
The 2018 Delaware Action
On October 25, 2018, Bio-Rad filed suit against us in the U.S. District Court for the District of Delaware, alleging that substantially all of our products, including our GEM products and Next GEM products, infringe U.S. Patent Nos. 9,562,837 and 9,896,722. Bio-Rad seeks injunctive relief, unspecified monetary damages, costs and attorneys’ fees. Discovery is in progress. A trial is scheduled in September 2021.
The Massachusetts Action
On September 11, 2019, Bio-Rad filed suit against us in the U.S. District Court for the District of Delaware, alleging that our Next GEM products infringe certain claims of U.S. Patent No. 8,871,444. On November 5, 2019, Bio-Rad amended the complaint to additionally allege that our Next GEM products infringe certain claims of U.S. Patent Nos. 9,919,277 and 10,190,115. The ‘444 and ‘277 patents are exclusively licensed by Bio-Rad from Harvard University, which subsequently joined the suit as a party plaintiff.
On December 18, 2019, Bio-Rad dismissed this action in the District of Delaware and refiled it in the U.S. District Court for the District of Massachusetts. The case is assigned to Judge William G. Young. On January 14, 2020, the judge consolidated this case with a separate action, Bio-Rad Laboratories Inc. et al. v. Stilla Technologies, Inc., in which Bio-Rad is asserting the ‘444 patent (among other patents) against Stilla Technologies, Inc.’s droplet digital PCR product. On January 23, 2020, we filed a motion to dismiss the case and to transfer the ‘115 patent to the Northern District of California, where the related ‘059 patent is stayed. A hearing on our motion to dismiss and transfer is scheduled in March 2020.
72
Table of Contents
On January 24, 2020, we filed antitrust counterclaims against Bio-Rad alleging violations of (a) Section 7 of the Clayton Act, (b) Section 2 of the Sherman Act, and (c) California unfair competition laws, for illegally acquiring Raindance Technologies, Inc. and illegally monopolizing or attempting to monopolize markets relating to droplet digital PCR products, droplet single cell products and droplet genetic analysis technology. On February 19, 2020, Bio-Rad moved to dismiss, or alternatively to stay and sever, our antitrust claims. A hearing on Bio-Rad’s motion to dismiss is scheduled in March 2020.
On February 5, we filed additional counterclaims against Bio-Rad alleging that Bio-Rad’s single cell ATAC-seq products infringe U.S. Patent No. 9,029,085 and 9,850,526 that are exclusively licensed to us from Harvard University.
A Markman hearing has been scheduled in June 2020. The judge has ordered the parties to be ready for trial with respect to our antitrust counterclaims by April 2021. A trial date for Bio-Rad’s patent claims and our patent counterclaims has not yet been set, but may be set for shortly after the antitrust trial.
The ITC 1100 Action
On January 11, 2018, we filed a complaint against Bio-Rad at the ITC pursuant to Section 337 of the Tariff Act of 1930 alleging that Bio-Rad infringes our U.S. Patent Nos. 9,644,204, 9,689,024, 9,695,468 and 9,856,530 (the “ITC 1100 Action”). The judge issued an Initial Determination on July 12, 2019 finding that Bio-Rad’s ddSEQ products infringe the ‘024, ‘468 and ‘530 patents. The judge also found all of our asserted patents to be valid and rejected Bio-Rad’s claim of ownership in all of the asserted patents.
On February 12, 2020, the ITC issued its Final Determination affirming the judge’s findings with respect to Bio-Rad’s violation of the ‘024, ‘468 and ‘530 patents, including the judge’s findings for those patents with respect to infringement, validity and ownership. The ITC issued an exclusion order prohibiting Bio-Rad from importing into the United States infringing microfluidic devices, components thereof and products containing same, including the ddSEQ products. The ITC also issued a cease and desist order preventing Bio-Rad from selling such imported products in the United States. The ITC’s remedial orders do not identify any ddSEQ assay as exempted from their potential scope. The ITC orders do not prohibit the importation or sale of microfluidic consumables imported into the U.S. for use by researchers who are using such consumables as of February 12, 2020, and who have a documented need to continue receiving such consumables for a specific current ongoing research project for which that need cannot be met by any alternative product. The Final Determination is subject to a 60-day presidential review period. We expect Bio-Rad to appeal the Final Determination to the Court of Appeals for the Federal Circuit. We expect appeals to be completed in mid 2021.
For further discussion of the risks relating to intellectual property and our pending litigation, see the section titled “Risk Factors—Risks related to litigation and our intellectual property” under Item 1A above.
Item 4. Mine Safety Disclosures.
Not applicable.
73
Table of Contents
PART II
Item 5. Market for Registrant’s Common Equity, Related Stockholder Matters and Issuer Purchases of Equity Securities.
Market Information
Our Class A common stock has been listed on the Nasdaq Global Select Market under the symbol “TXG” since September 12, 2019. Prior to that date, there was no public trading market for our Class A common stock.
Holders of Common Stock
As of January 31, 2020, there were 91 holders of record of our Class A common stock and 62 holders of record of our Class B common stock. The actual number of stockholders is greater than this number of record holders and includes stockholders who are beneficial owners but whose shares are held in street name by brokers and other nominees.
Dividend Policy
We have never declared or paid any cash dividends on our capital stock. We currently intend to retain any future earnings and do not expect to pay any dividends in the foreseeable future. Any future determination to declare cash dividends will be made at the discretion of our board of directors, subject to applicable laws, and will depend on a number of factors, including our financial condition, results of operations, capital requirements, contractual restrictions, general business conditions and other factors that our board of directors may deem relevant. In addition, the terms of our Loan and Security Agreement place certain limitations on the amount of cash dividends we can pay, even if no amounts are currently outstanding.
Stock Performance Graph
This graph below is not “soliciting material” or deemed “filed” with the SEC for purposes of Section 18 of the Exchange Act, or otherwise subject to liabilities under that section, and shall not be deemed incorporated by reference into this Annual Report or into any other filing of 10x Genomics, Inc. under the Securities Act except to the extent that we specifically incorporate this information by reference therein, whether made before or after the date hereof and irrespective of any general incorporation language in any such filing.
The following graph compares the cumulative total return to stockholder return on our Class A common stock relative to the cumulative total returns of the NASDAQ Composite Index and the NASDAQ Biotechnology Composite Index. An investment of $100 is assumed to have been made in our Class A common stock and each index at market close on September 12, 2019 (the first day of trading of our common stock) and its relative performance is tracked through December 31, 2019. Pursuant to applicable Securities and Exchange Commission rules, all values assume reinvestment of the full amount of all dividends, however no dividends have been declared on our Class A common stock to date. The offering price of our Class A common stock in our initial public offering (“IPO”), which had a closing stock price of $52.75 on September 12, 2019, was $39.00 per share. The stockholder returns shown on the graph below are based on historical results and are not indicative of future performance, and we do not make or endorse any predictions as to future stockholder returns.
74
Table of Contents
COMPARISON OF CUMULATIVE TOTAL RETURN
among 10x Genomics, Inc., the NASDAQ Composite Index
and the NASDAQ Biotechnology Composite Index
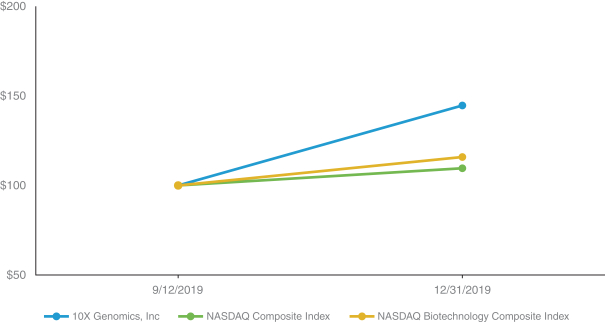
Sales of Unregistered Securities
None during the quarter ended December 31, 2019.
Use of Proceeds
On September 11, 2019, our Registration Statement on Form S-1 (File No. 333-233361) relating to the IPO of our Class A common stock was declared effective by the SEC. Pursuant to such Registration Statement, we sold an aggregate of 11,500,000 shares of our common stock, including 1,500,000 shares sold pursuant to the underwriters’ full exercise of their option to purchase additional shares, at a price of $39.00 per share. Including the underwriters’ option exercise, the aggregate gross proceeds from the offering were $448.5 million, before deducting underwriting discounts and commissions and estimated offering expenses. J.P. Morgan LLC, Goldman Sachs & Co. LLC and BofA Merrill Lynch acted as lead joint book-running managers for the offering. Cowen acted as lead manager for the offering. On September 16, 2019, we closed the sale of such shares, resulting in aggregate cash proceeds to us of approximately $410.8 million, net of underwriting discounts, commissions and offering expenses paid or payable by us. No offering expenses were paid or are payable, directly or indirectly, to our directors or officers, to persons owning 10% or more of any class of our equity securities or to any of our affiliates.
There has been no material change in the expected use of the net proceeds from our IPO, as described in our final prospectus filed with the SEC on September 12, 2019 pursuant to Rule 424(b) under the Securities Act.
Issuer Purchases of Equity Securities
None.
75
Table of Contents
Item 6. Selected Financial Data.
The selected consolidated statements of operations data for the years ended December 31, 2019, 2018 and 2017, and the selected consolidated balance sheet data as of December 31, 2019, 2018 and 2017, have been derived from our audited consolidated financial statements and related notes. You should read the following selected consolidated financial data in conjunction with our consolidated financial statements and the accompanying notes and the information in “Part II, Item 7 – Management’s Discussion and Analysis of Financial Condition and Results of Operations” below. Our historical results are not necessarily indicative of the results that may be expected for any other period in the future.
| Year Ended December 31, | ||||||||||||
| 2019 | 2018 | 2017 | ||||||||||
| (in thousands, except per share data) | ||||||||||||
| Consolidated statements of operations data: |
||||||||||||
| Revenue |
$ | 245,893 | $ | 146,313 | $ | 71,085 | ||||||
| Cost of revenue(1) |
61,033 | 28,661 | 10,560 | |||||||||
|
|
|
|
|
|
|
|||||||
| Gross profit |
184,860 | 117,652 | 60,525 | |||||||||
| Operating expenses: |
||||||||||||
| Research and development(1) |
83,097 | 47,537 | 32,164 | |||||||||
| In-process research and development |
— | 62,363 | — | |||||||||
| Selling, general and administrative(1) |
130,834 | 87,936 | 46,736 | |||||||||
| Accrued contingent liabilities |
1,502 | 30,580 | — | |||||||||
|
|
|
|
|
|
|
|||||||
| Total operating expenses |
215,433 | 228,416 | 78,900 | |||||||||
|
|
|
|
|
|
|
|||||||
| Loss from operations |
(30,573 | ) | (110,764 | ) | (18,375 | ) | ||||||
| Other income (expense): |
||||||||||||
| Interest income |
2,805 | 1,024 | 308 | |||||||||
| Interest expense |
(3,079 | ) | (2,409 | ) | (811 | ) | ||||||
| Other income (expense), net |
(186 | ) | (249 | ) | 137 | |||||||
|
|
|
|
|
|
|
|||||||
| Total other expense |
(460 | ) | (1,634 | ) | (366 | ) | ||||||
|
|
|
|
|
|
|
|||||||
| Loss before provision for income taxes |
(31,033 | ) | (112,398 | ) | (18,741 | ) | ||||||
| Provision for income taxes |
218 | 87 | 21 | |||||||||
|
|
|
|
|
|
|
|||||||
| Net loss |
$ | (31,251 | ) | $ | (112,485 | ) | $ | (18,762 | ) | |||
|
|
|
|
|
|
|
|||||||
| Net loss per share, basic and diluted(2) |
$ | (0.80 | ) | $ | (8.40 | ) | $ | (1.62 | ) | |||
|
|
|
|
|
|
|
|||||||
| Weighted-average shares used to compute net loss per share, basic and diluted(2) |
39,091,366 | 13,392,273 | 11,587,751 | |||||||||
|
|
|
|
|
|
|
|||||||
| (1) | Includes stock-based compensation expense as follows: |
| Year Ended December 31, | ||||||||||||
| 2019 | 2018 | 2017 | ||||||||||
| (in thousands) | ||||||||||||
| Cost of revenue |
$ | 325 | $ | 85 | $ | 44 | ||||||
| Research and development |
5,721 | 1,030 | 801 | |||||||||
| Selling, general and administrative |
7,287 | 1,543 | 816 | |||||||||
|
|
|
|
|
|
|
|||||||
| Total stock-based compensation expense |
$ | 13,333 | $ | 2,658 | $ | 1,661 | ||||||
|
|
|
|
|
|
|
|||||||
76
Table of Contents
| (2) | See Note 2 and Note 11 to the Notes to Consolidated Financial Statements included in Part II, Item 8 of this Annual Report on Form 10-K for further details on the calculation of net loss per share, basic and diluted, the weighted-average shares used to compute net loss per share stockholders, basic and diluted. |
| Year Ended December 31, | ||||||||||||
| 2019 | 2018 | 2017 | ||||||||||
| (in thousands) | ||||||||||||
| Consolidated balance sheet data: |
||||||||||||
| Cash and cash equivalents |
$ | 424,166 | $ | 65,080 | $ | 47,857 | ||||||
| Working capital |
417,791 | 73,874 | 45,966 | |||||||||
| Total assets |
605,923 | 124,310 | 75,609 | |||||||||
| Total current liabilities |
63,049 | 32,362 | 22,141 | |||||||||
| Total liabilities |
185,840 | 101,053 | 29,704 | |||||||||
| Total convertible preferred stock |
— | 243,244 | 158,414 | |||||||||
| Total stockholders’ equity (deficit) |
420,083 | (219,987 | ) | (112,509 | ) | |||||||
77
Table of Contents
Item 7. Management’s Discussion and Analysis of Financial Condition and Results of Operations.
You should read the following discussion of our financial condition and results of operations in conjunction with our audited consolidated financial statements and the related notes and other financial information included elsewhere in this Annual Report and our audited consolidated financial statements and notes thereto.
As discussed in the section titled “Special Note Regarding Forward Looking Statements,” the following discussion and analysis, in addition to historical financial information, contains forward-looking statements that involve risks and uncertainties. Our actual results could differ materially from those anticipated in these forward-looking statements as a result of various factors, including those set forth in the section titled “Risk Factors” under Part I, Item 1A above.
We operate on a fiscal year that ends on December 31.
Overview
We are a life sciences technology company focused on building innovative products and solutions to interrogate, understand and master biological systems at resolution and scale that matches the complexity of biology. Our expanding suite of offerings leverages our cross-functional expertise across chemistry, biology, hardware and software to provide a comprehensive, dynamic and high-resolution view of complex biological systems. We have launched multiple products that enable researchers to understand and interrogate biological analytes in their full biological context. Our commercial product portfolio leverages our Chromium instruments, which we refer to as “instruments,” and our proprietary microfluidic chips, slides, reagents and other consumables for both our Visium and Chromium solutions, which we refer to as “consumables.” We bundle our software with these products to guide customers through the workflow, from sample preparation through analysis and visualization. Since launching our first product in mid-2015, and as of December 31, 2019, we have sold 1,666 instruments to customers around the world, including 97 of the top 100 global research institutions as ranked by Nature in 2018 based on publications and 19 of the top 20 global biopharmaceutical companies by 2018 revenue.
Our products cover a wide variety of applications and allow researchers to analyze biological systems at fundamental resolutions and on massive scales, such as at the single cell level for millions of cells. Our Chromium instruments and Chromium consumables are designed to work together exclusively. After buying a Chromium instrument, customers purchase consumables from us for use in their experiments. Accordingly, as the installed base of our instruments grows, we expect recurring revenue from consumable sales to become an increasingly important driver of our operating results. As such, our revenue growth is expected to outpace growth in our instrument placements as our business develops. In addition to instrument and consumable sales, we derive revenue from post-warranty service contracts for our Chromium instruments. For the years ended December 31, 2019 and 2018, sales of our Chromium instruments accounted for 14% and 25% of our revenue, respectively, sales of our consumables accounted for 84% and 74% of our revenue, respectively, and sales of services accounted for 2% and 1% of our revenue, respectively.
We currently serve thousands of researchers in more than 40 countries. Our customers include a range of academic, government, biopharmaceutical, biotechnology and other leading institutions around the globe. In both the years ended December 31, 2019 and 2018, approximately 70% of our direct sales revenue came from sales to academic institutions.
As of December 31, 2019, we employed a commercial team of over 200 employees, including more than 75 commissioned sales representatives, many with Ph.D. degrees and many with significant industry experience. We follow a direct sales model in North America and certain regions of Europe, representing the majority of our revenue. We sell our products through third-party distributors in Asia, certain regions of Europe, Oceania, South America, the Middle East and Africa. We currently sell our products for research use only. For the years ended December 31, 2019 and 2018, sales within North America accounted for approximately 57% and 58% of our revenue, respectively.
78
Table of Contents
Revenue increased 68% to $245.9 million in the year ended December 31, 2019 as compared to $146.3 million in the year ended December 31, 2018, primarily due to the adoption of our instruments by customers and the associated consumables on those instruments.
We focus a substantial portion of our resources on developing new products and solutions. Our research and development efforts are centered around improving the performance of our existing assays and software, developing new Chromium solutions such as multi-omics solutions, developing our Visium platform, improving and developing new capabilities for our Chromium platform, developing combined software and workflows across multiple solutions and investigating new technologies. We incurred research and development expenses of $83.1 million and $47.5 million for the years ended December 31, 2019 and 2018, respectively. We intend to make significant investments in this area for the foreseeable future. In addition, in 2018, we made acquisitions for an aggregate purchase price of $62.4 million. There were no similar acquisitions in the year ended December 31, 2019.
Our instrument manufacturing is contracted out to a third-party contract manufacturer and we manufacture the majority of our consumable products in-house, with a small amount of our components outsourced to key suppliers. We have designed our operating model to be capital efficient and to scale efficiently as our product volumes grow.
Historically, we have financed our operations primarily from the sale of our instruments and consumable products, the issuance and sale of our convertible preferred stock and common stock and the issuances of debt. On September 16, 2019, we completed an initial public offering (“IPO”), in which we sold 11,500,000 shares of Class A common stock (which included 1,500,000 shares that were offered and sold pursuant to the full exercise of the IPO underwriters’ option to purchase additional shares) at a price to the public of $39.00 per share. We received aggregate net proceeds of $410.8 million after deducting, offering costs, underwriting discounts and commissions of $37.7 million.
Since our inception in 2012, we have incurred net losses in each year. Our net losses were $31.3 million and $112.5 million for the years ended December 31, 2019 and 2018, respectively. As of December 31, 2019, we had an accumulated deficit of $262.4 million and cash and cash equivalents totaling $424.2 million. We expect to continue to incur significant expenses for the foreseeable future and to incur operating losses in the near term. We expect our expenses will increase substantially in connection with our ongoing activities, as we:
| • | attract, hire and retain qualified personnel; |
| • | scale our technology platforms and introduce new products and services; |
| • | protect and defend our intellectual property; |
| • | acquire businesses or technologies; and |
| • | invest in processes, tools and infrastructure to support the growth of our business. |
Acquisitions
In October 2019, we completed the acquisition of a worldwide royalty-free, nonexclusive license to certain intellectual property as part of the 2019 Becton Dickinson Settlement and Patent Cross License Agreement. Under the terms of this agreement, we are required to make aggregate payments of $25 million in annual amounts of $6.25 million over four years beginning in January 2020.
In November 2018, we completed the acquisition of Spatial Transcriptomics, a privately held company based in Stockholm, Sweden, for an all cash purchase price of $38.6 million. With the acquisition of Spatial Transcriptomics, we obtained intellectual property relating to the spatial interrogation of biological analytes, which we believe will open up the possibilities for discoveries in oncology, neuroscience and immunology, as
79
Table of Contents
well as in the broader area of biology. Pursuant to the Spatial Transcriptomics acquisition agreement, we are obligated to make contingent payments to the sellers through December 31, 2022. Aside from this obligation, all of our obligations under the Spatial Transcriptomics acquisition agreement have been fully performed.
In November 2018, we completed the acquisition of a worldwide exclusive license to foundational intellectual property relating to spatial analysis technologies from Prognosys Biosciences, Inc. (“Prognosys”), for a combination of cash and common stock for a purchase price of $3.3 million. All of our obligations under the Prognosys license agreement have been fully performed.
In March 2018, we completed the acquisition of Epinomics, a privately held company based in California, for an all cash purchase price of $22.2 million. Epinomics’s patent portfolio includes foundational intellectual property and a worldwide exclusive license relating to ATAC-seq, which supplements our existing patent portfolio and enables us to provide ATAC-seq solutions for single cell and other epigenetic applications. All of our obligations under the Epinomics acquisition agreement have been fully performed.
Key business metrics
We regularly review a number of operating and financial metrics, including the instrument installed base and consumable pull-through, to evaluate our business, measure our performance, identify trends affecting our business, formulate financial projections and make strategic decisions. We believe that these metrics are representative of our current business; however, we anticipate these may change or may be substituted for additional or different metrics as our business grows and as we introduce new products.
Instrument installed base
| As of December 31, | ||||||||
| 2019 | 2018 | |||||||
| Instrument installed base |
1,666 | 1,021 | ||||||
Our products are sold to academic, government, biopharmaceutical, biotechnology and other leading institutions around the globe. Our Chromium Controller instrument is user installable and does not require in-person training. Our recently introduced Chromium Connect instrument requires installation and we offer in-person training for its use. We believe the instrument installed base is one of the indicators of our ability to drive customer adoption of our products. We define the instrument installed base as the cumulative number of Chromium instruments sold since inception.
Our quarterly instrument unit volumes can fluctuate due to a number of factors, including the procurement and budgeting cycles of many of our customers, especially government and academic institutions where unused funds may be forfeited or future budgets reduced if purchases are not made by their fiscal year end. Similarly, our biopharmaceutical customers typically have calendar year fiscal years which may result in a disproportionate amount of their purchasing activity occurring during our fourth quarter. We also believe the timing of unit sales has been impacted and will continue to be impacted by the timing of product introductions and transitions which can either accelerate or delay demand of existing and new products depending on the needs of individual researchers to conclude existing studies or to use new and improved product capabilities. Further, the growth of our market in certain geographic regions and our continued efforts to service these regions impact unit volumes quarter to quarter. Finally, our recently introduced Chromium Connect instrument could create variability in our installed base since Chromium Connect instruments require installation and in-person training prior to being added to our instrument installed base. We therefore believe that an annual representation of our instrument installed base is most appropriate for assessing trends in our business.
80
Table of Contents
Chromium consumable pull-through per instrument
| Year ended December 31, | ||||||||
| (in thousands) |
2019 | 2018 | ||||||
| Chromium consumable pull-through per instrument |
$ | 158 | $ | 148 | ||||
Our consumables portfolio includes proprietary microfluidic chips, slides, reagents and other consumables for both our Visium and Chromium solutions. Our Chromium instruments and Chromium consumables are designed to work together exclusively. This Chromium closed-system model generates recurring revenue from each instrument we sell. Our growth in the instrument installed base has been the largest contributor to our growth in consumable sales. In addition, we believe that annual consumable pull-through per instrument is an indicator of our ability to generate future consumable revenue and the rate of customer adoption of our new applications. We define consumable pull-through per instrument as the total consumables revenue in the given quarter divided by the average instrument installed base during that quarter. We calculate the average instrument installed base for a given quarter using the instrument installed base as of the last day of the prior quarter and the instrument installed base as of the last day of the given quarter. We calculate the annual consumable pull-through per instrument figure by summing the quarterly pull-through for the quarters in a given year. The figures in the table above represent the annual consumable pull-through per instrument for the years ended December 31, 2019 and 2018.
We do not believe the consumable pull-through per instrument in an individual quarter is an effective indicator of the current state of our business trends. Our quarterly consumable pull-through can fluctuate due to a number of factors. In addition to timing of product transitions such as the Next GEM consumable transition, other factors such as the budget and funding cycles of our customers can cause our quarterly consumables pull-through fluctuate quarter to quarter. For example, a significant portion of our current customers are reliant on government funding and research grants. These funds and grants typically expire at year end, resulting in a higher consumable pull-through per instrument in the fourth quarter relative to the first three quarters of the year. Finally, as we continue to expand into new markets globally as well as into new industries, our average pull-through could be adversely impacted in a particular period. We therefore believe that an annual, rather than quarterly, representation of our consumable pull-through is most appropriate for assessing trends in our business.
Our current customer base includes customers who purchase consumables for use on a shared or centralized instrument. We refer to customers who purchase consumables but do not own an instrument as “halo users.” For the year ended December 31, 2019, halo users represented close to half of our revenue from sales of consumables. Halo users, as well as the future introduction of consumables that may not use instruments, such as our recently introduced Visium solution, or Chromium instruments that are expected to use a greater amount of consumables, such as our Chromium Connect instrument, could reduce the utility of this metric and make it difficult to compare consumable pull-through per instrument metrics over time.
Key factors affecting our performance
We believe that our financial performance has been and in the foreseeable future will continue to be primarily driven by the following factors. While each of these factors presents significant opportunities for our business, they also pose important challenges that we must successfully address in order to sustain our growth and improve our results of operations. Our ability to successfully address the factors below is subject to various risks and uncertainties, including those described under the heading “Risk Factors.”
Instrument sales
Our financial performance has largely been driven by, and in the future will continue to be impacted by, the rate of sales of our Chromium instruments. Management focuses on instrument sales as an indicator of current business success and a leading indicator of likely future sales of consumables. We expect our instrument sales to continue to grow as we increase penetration in our existing markets and expand into, or offer new features and solutions that appeal to new markets.
81
Table of Contents
We plan to grow our instrument sales in the coming years through multiple strategies including expanding our sales efforts globally and continuing to enhance the underlying technology and applications for life sciences research. As part of this strategy and in an effort to increase the rate of sales of our instruments, we increased our sales force by 54% from December 31, 2018 through December 31, 2019, with more than 75 commissionable sales representatives as of December 31, 2019. We regularly solicit feedback from our customers and focus our research and development efforts on enhancing the Chromium Controller instrument and enabling its ability to use additional applications that address their needs, which we believe in turn helps to drive additional sales of our instruments and consumables. We have developed and recently introduced our Chromium Connect instrument, which is an automated version of our current Chromium Controller instrument. We believe the automated features of the Chromium Connect will increase our addressable market by increasing utilization by biopharmaceutical customers.
Our sales process varies considerably depending upon the type of customer to whom we are selling. Our sales process with small laboratories and individual researchers is often short, and in some cases, we receive purchase orders from these customers in under a month. Our sales process with other institutions can be longer with most customers submitting purchase orders within six months. Given the variability of our sales cycle, we have in the past experienced, and likely will in the future experience, fluctuations in our instrument sales on a period-to-period basis.
Recurring consumable revenue
We regularly assess trends relating to recurring consumable revenue based on our product offerings, our customer base and our understanding of how our customers use our products. As our instrument installed base expands, consumables revenue on an absolute basis is expected to increase and over time should be an increasingly important contributor to our revenue.
We expect our annual consumable pull-through per instrument to be relatively stable as the instrument installed base increases. Our expansion into new markets with less experienced users could adversely impact average pull-through, but we expect the sales of our recently introduced Visium Spatial Gene Expression solution as well as the release of new products and applications for our Chromium instruments and Visium platform to increase consumable pull-through per instrument and offset these declines. We have reported our Visium product revenue as part of consumable revenue and included it in the average pull-through per instrument calculation. Even though Visium is not processed through a Chromium instrument, we will sell the product primarily to Chromium instrument users and view it as pull-through from a business perspective.
Revenue mix and gross margin
Our revenue is derived from sales of our instruments, consumables and services. There have been fluctuations in the mix between instruments and consumables and amongst our consumables. Our consumable revenue as a percentage of total revenue has continued to grow. Each of our consumables solutions is designed to allow researchers to study a different aspect of biology, such as DNA, RNA, protein or epigenetics, at a resolution and scale that may be impractical or impossible using existing tools. As each of our solutions has been introduced, they have been initially purchased by a small number of early adopters. As these early adopters successfully perform experiments and publish scientific articles using our solutions, the utility of these solutions is more broadly understood and the solutions are then subsequently adopted by the larger research community. The revenue contribution from these and other consumable products has varied and is expected to vary on a quarterly basis due to several factors, including the publication of scientific papers demonstrating the value of the consumables, the availability of grants to fund research, budgetary timing and our introduction of new product features and new consumables offerings.
For each of the years ended December 31, 2019 and 2018, our Single Cell Gene Expression consumables, which were introduced in 2016, accounted for the majority of our consumables revenue. For the year ended December 31, 2018, the remaining consumables revenue was substantially comprised of sales of our Single Cell
82
Table of Contents
Immune Profiling consumables, which we introduced in 2017. For the year ended December 31, 2019, the remaining consumables revenue was substantially comprised of sales of our Single Cell Immune Profiling consumables and our Single Cell ATAC consumables. The mix in variance between these periods was attributable to the introduction of our Single Cell ATAC consumables in the fourth quarter of 2018 which was met with significant initial demand. Revenue from each of our Single Cell Gene Expression, Single Cell Immune Profiling and Single Cell ATAC consumables increased in absolute dollars period over period. Revenue contribution from our Single Cell Gene Expression consumables decreased as a percentage of overall consumables revenue while revenue contribution from our Single Cell Immune Profiling and to a greater extent our Single Cell ATAC consumables increased as a percentage of overall consumables revenue for the year ended December 31, 2019. In the fourth quarter of 2019, we introduced our new Visium product, which exhibited high initial demand.
Over time, as our instrument installed base grows and sales of our Visium products increase, we expect consumables revenue to constitute a larger percentage of revenue. In addition, our margins are higher for those instruments and consumables that we sell directly to customers as compared to those that we sell through distributors. While we expect the mix of direct sales as compared to sales through distributors to remain relatively constant in the near term, we are currently evaluating increasing our direct sales capabilities in certain geographies.
From the fourth quarter of 2016 to the first quarter of 2019, we offered two versions of the Chromium Controller, one at a $125,000 list price with firmware that enabled the use of all our Chromium consumables and another at a $75,000 list price with firmware that enabled the use of only our Single Cell Chromium consumables. Beginning in the first quarter of 2019, we standardized our instrument offering on the fully enabled Chromium Controller with a list price of $75,000. In addition to this list price reduction, we offered various discount incentives to drive increased product adoption resulting in our Chromium Controller average selling price decreasing in the year ended 2019 from those realized in 2017 and 2018. The list prices of our consumables vary by solution. Future instrument and consumable selling prices and gross margins may fluctuate due to a variety of factors, including the introduction by others of competing products and solutions or the attempted integration by third parties of capabilities similar to ours into their existing products, such as sequencers. We aim to mitigate downward pressure on our average selling prices by increasing the value proposition offered by our instruments and consumables, primarily by, for example, expanding the applications for our instruments and increasing the quantity and quality of data that can be obtained using our consumables.
In the near term, we expect the reduced accrued royalties related to the Bio-Rad litigation as described below under “Part I, Item 3–Legal Proceedings,” product mix changes between established products and lower margin new products, and investment in the expansion of manufacturing, warehousing and product distribution facilities to have the greatest impact on our margins. In addition to the impact of competing products entering the market, the future margin profiles of our instruments and consumables will depend upon the outcome of such litigation, any royalties we are required to pay and the royalty rates and products to which such royalties apply.
Continued investment in growth
Our significant revenue growth has been driven by rapid innovation towards novel solutions that command price premiums and quick adoption of our solutions by our customer base. In 2019, we introduced four new products or updates to existing products. We intend to continue to make focused investments to increase revenue and scale operations to support the growth of our business and therefore expect expenses in this area to increase. We have invested, and will continue to invest, significantly in our manufacturing capabilities and commercial infrastructure. The transition to our new Pleasanton global headquarters and research and development center, which we completed in 2019, will help us achieve these goals in the near term by providing additional manufacturing, research and development and general office space. We plan to further invest in research and development as we hire employees with the necessary scientific and technical backgrounds to enhance our existing products and help us bring new products to market, and we expect to incur additional research and
83
Table of Contents
development expenses and higher stock-based compensation expenses as a result. We also plan to invest in sales and marketing activities, and we expect to incur additional general and administrative expenses and to have higher stock-based compensation expenses as we support our growth and status as a publicly traded company. As cost of revenue, operating expenses and capital expenditures fluctuate over time, we may experience short-term, negative impacts to our results of operations and cash flows, but we are undertaking such investments in the belief that they will contribute to long-term growth.
Acquisitions of key technologies
We have made, and intend to continue to make, investments that meet management’s criteria to expand or add key technologies that we believe will facilitate the commercialization of new products in the future. Such investments could take the form of an asset acquisition, the acquisition of a business or the exclusive or non-exclusive license of patented technology. Any such acquisitions we make may affect our future financial results. For example, our 2018 acquisitions of Spatial Transcriptomics and Epinomics were largely comprised of purchases of intellectual property which were expensed as in-process research and development in the quarter during which such acquisitions occurred. While we have not previously entered into material joint-development, partnership or joint- venture agreements, we may in the future decide to do so and any such arrangements may limit our rights and the commercial opportunities of any jointly developed technology.
Components of Results of Operations
Revenue
We generate virtually all of our revenue through the sale of our instruments and consumables to customers. We also generate a small portion of our revenue from instrument service agreements which relate to extended warranties. Our revenue is subject to fluctuation based on the foreign currency in which our products are sold, principally for sales denominated in the euro.
Revenue from consumables is largely driven by the size of our instrument installed base and the volume of consumables sold per instrument. Beginning in the fourth quarter of 2019, revenue from consumables also includes sales of our Visium products, which do not require the use of an instrument. Our instruments and consumables are generally sold without the right of return. Revenue is recognized as instruments and consumables are shipped. Revenue is recognized net of any sales incentive, distributor rebates and commissions and any taxes collected from customers. Some of our recently announced products, such as our Chromium Connect instrument, may result in our recognizing revenue with respect to such products upon installation rather than upon shipment. Instrument service agreements are typically entered into for a one-year term, with the coverage period beginning after the expiration of the standard one-year warranty period. Revenue from the sale of instrument service agreements are recognized ratably over the coverage period. Since its introduction in May 2019, the revenue attributable to our Next GEM microfluidics chips and associated consumables has continued to increase. We expect the transition to Next GEM to have a minimal impact on our revenue since we intend to sell those products at prices similar to the GEM products they are replacing.
Cost of revenue, gross profit and gross margin
Cost of revenue. Cost of revenue primarily consists of manufacturing costs incurred in the production process including personnel and related costs, costs of component materials, manufacturing overhead, packaging and delivery costs and allocated costs including facilities and information technology. We plan to hire additional employees as well as expand our manufacturing, warehousing and product distribution facilities, including increasing manufacturing automation to support our growth. In addition, cost of revenue includes royalty costs for licensed technologies included in our products, warranty costs, provisions for slow-moving and obsolete inventory and personnel and related costs and component costs incurred in connection with our obligations under our instrument service agreements. Beginning with the three months ended December 31, 2018, we began recording royalty accruals relating to sales of our GEM microfluidic chips and associated consumables, which are the subject of the Bio-Rad litigation discussed in Item I, Part 3 above, as cost of revenue.
84
Table of Contents
Gross profit/gross margin. Gross profit is calculated as revenue less cost of revenue. Gross margin is gross profit expressed as a percentage of revenue. Our gross profit and gross margins in future periods are expected to fluctuate from quarter to quarter and will depend on a variety of factors, including: market conditions that may impact our pricing; sales mix changes among consumables, instruments and services; product mix changes between established products and new products; excess and obsolete inventories; royalties; our cost structure for manufacturing operations relative to volume; and product warranty obligations. We currently anticipate that we will experience an increase in absolute dollars of both revenue and cost of revenue as we grow our business. Additionally, we expect gross margins to be positively impacted through the end of 2020 by reduced accrued royalties related to the Bio-Rad litigation. We expect this positive impact to be reduced, at least partially, by expenses related to our planned increases in manufacturing and distribution capacity in our Pleasanton, California headquarters as well as in certain locations outside the United States.
As noted above, since Next GEM’s introduction in May 2019, we experienced improved gross profit for the year ended December 31, 2019, as we sold more Next GEM microfluidic chips and associated consumables because these products are not subject to the royalty payments to Bio-Rad. However, consumables subject to the 15% royalty accrual related to the Bio-Rad litigation still comprised a large percentage of our consumable sales for year ended December 31, 2019. We expect our gross margins for 2020 will be positively impacted by the continued transition of our customers to our Next GEM microfluidic chips and associated consumables since these microfluidic chips and associated consumables are not subject to the 15% royalty accrual (See “Part I, Item 3 – Legal Proceedings”) and have similar selling prices to the GEM products that they are replacing. Further developments in our litigation with Bio-Rad could have a material impact on our gross margins, both in the near term and beyond.
Beginning on August 28, 2019, our cost of revenue no longer includes a 15% royalty accrual related to the Bio-Rad litigation on our instruments, since all Chromium instruments that have been sold since that date operate exclusively with our Next GEM solutions. As a result, we expect that this will continue to positively impact gross margins for those instrument sales in the near term. Because the Next GEM product selling prices and product manufacturing costs are similar to the GEM products they are replacing, we do not anticipate that Next GEM selling prices and product manufacturing costs will have a significant effect on our gross margins.
Operating expenses
Research and development. Research and development expense primarily consists of personnel and related costs, independent contractor costs, laboratory supplies, equipment maintenance prototype and materials expenses, amortization of developed technology and intangibles and allocated costs including facilities and information technology.
We plan to continue to invest significantly in our research and development efforts, including hiring additional employees, to enhance existing products and develop new products. We also expect allocated facilities and information technology costs to increase in future periods as a result of higher costs associated with the transition to our global headquarters and research and development center in Pleasanton, California. As a result of these and other initiatives, we expect research and development expense will increase in absolute dollars in future periods and vary from period to period as a percentage of revenue.
In-process research and development. In-process research and development consists of costs incurred to acquire intellectual property for research and development. We expect these costs to be recognized only in periods during which we complete an acquisition of assets comprised in whole or part of intellectual property for research and development. While we periodically evaluate acquisitions of this nature from time to time, we have no definitive agreements currently in place to acquire additional intellectual property for research and development.
Selling, general and administrative. Selling, general and administrative expense primarily consists of costs related to the selling and marketing of our products, including sales incentives and advertising expenses and costs
85
Table of Contents
associated with our finance, accounting, legal (excluding accrued contingent liabilities), human resources and administrative personnel. Related costs associated with these functions, such as attorney and accounting fees, recruiting services, administrative services, insurance, public relations and communication activities, marketing programs and trade show appearances, travel, customer service costs and allocated costs including facilities and information technology, are also included in selling, general and administrative expenses.
We expect to incur additional selling, general and administrative expenses due to continued investment in our sales, marketing and customer service efforts to support the anticipated growth of our business. We also expect increased infrastructure costs, as well as increased costs for accounting, human resources, legal including litigation-related fees and contingency payments, insurance, investor relations and other costs associated with being a public company. We expect to continue our hiring, in the United States as well as internationally, in all these areas in line with the continued growth of our business. We also expect allocated facilities costs to increase in future periods as a result of higher costs associated with the transition to our global headquarters and research and development center in Pleasanton, California. We also expect allocated information technology costs to increase following the expected implementation of a new enterprise resource planning system in 2020. As a result of these and other initiatives, we expect selling, general and administrative expenses to vary from period to period as a percentage of revenue and increase in absolute dollars in future periods. We expect our stock-based compensation expense allocated to cost of revenue, research and development expenses and selling, general and administrative expenses to increase in absolute dollars.
Accrued contingent liabilities
Accrued contingent liabilities is comprised of changes in our litigation reserve, primarily relating to our litigation with Bio-Rad discussed above under “Part I, Item 3–Legal Proceedings.” The litigation reserve currently consists of accruals we make for our estimated losses in these pending legal proceedings. We record a liability when it is probable that a loss has been incurred and the amount is reasonably estimable, the determination of which requires significant judgment. Changes in the reserve are made as we change our estimates or make payments in damages or settlement. In the year ended December 31, 2018, we recorded a $30.6 million charge to reflect our best estimate of loss in resolving our ongoing disputes. In the year ended December 31, 2019, we recorded an additional $1.5 million charge related to additional pre- and post- judgment interest. Beginning in the fourth quarter of 2018, we began recording an accrual for estimated royalties as cost of revenue. For the years ended December 31, 2019 and 2018, we accrued royalties of $29.2 million and $7.4 million, respectively. As of December 31, 2019 and 2018, the total amount accrued was $68.7 million and $38.0 million, respectively, comprising of the original charge, the estimated royalties and the interest charges. Should we ultimately obtain a more favorable outcome in this litigation any reversal of the accrual related to the litigation would be reflected as a change to this item in the period in which it occurs. Any reversal for amounts recorded as estimated royalty accruals would be credited to our cost of revenue in such period.
Interest income
Interest income consists of interest earned on our cash and cash equivalents which are invested in bank deposit and in money market funds.
Interest expense
Interest expense consists primarily of interest on our outstanding debt.
Other income (expense), net
Other income (expense), net primarily consists of realized and unrealized gains and losses related to foreign exchange rate remeasurements recorded from consolidating our foreign subsidiaries each period-end.
86
Table of Contents
Provision for income taxes
Our provision for income taxes consists primarily of foreign taxes and state taxes in the United States. As we expand the scale and scope of our international business activities, any changes in the United States and foreign taxation of such activities may increase our overall provision for income taxes in the future.
As of December 31, 2019, we had federal net operating loss carryforwards (“NOLs”) of approximately $110.7 million and federal tax credit carryforwards of approximately $12.3 million. Our federal NOLs generated after January 1, 2018, which total $6.5 million, are carried forward indefinitely, while all of our other federal NOLs and tax credit carryforwards expire beginning in 2032. As of December 31, 2019, we had state NOLs of approximately $87 million, which expire beginning in 2032. In addition, we had state tax credit carryforwards of approximately $11 million, which do not expire. Our ability to utilize such carryforwards for income tax savings is subject to certain conditions and may be subject to certain limitations in the future due to ownership changes. As such, there can be no assurance that we will be able to utilize such carryforwards. We have experienced a history of losses and a lack of future taxable income would adversely affect our ability to utilize these NOLs and research and development credit carryforwards. We currently maintain a full valuation allowance against these tax assets.
Under Sections 382 and 383 of the Internal Revenue Code of 1986, as amended (the “Code”), if a corporation undergoes an “ownership change,” the corporation’s ability to use its pre-change net operating loss carryforwards and other pre-change attributes, such as research tax credits, to offset its post-change income may be limited. In general, an “ownership change” will occur if there is a cumulative change in our ownership by “5% shareholders” that exceeds 50 percentage points over a rolling three-year period. Similar rules may apply under state tax laws. We completed a study through the date of our IPO to determine whether an ownership change had occurred under Section 382 or 383 of the Code, and we determined at that time that an ownership change occurred in 2013. As a result, our net operating losses generated through November 1, 2013 may be subject to limitation under Section 382 of the Code. The amount of pre-change loss carryforwards which may be subject to this limitation is $4.8 million. Our ability to use net operating loss carryforwards, research and development credit carryforwards and other tax attributes to reduce future taxable income and liabilities may be further limited as a result of future changes in stock ownership. As a result, if we earn net taxable income, our ability to use our pre-change net operating loss carryforwards or other pre-change tax attributes to offset United States federal and state taxable income may still be subject to limitations, which could potentially result in increased future tax liability to us.
87
Table of Contents
Results of Operations
| Year Ended December 31, | ||||||||||||
| (in thousands) |
2019 | 2018 | 2017 | |||||||||
| Revenue |
$ | 245,893 | $ | 146,313 | $ | 71,085 | ||||||
| Cost of revenue(1) |
61,033 | 28,661 | 10,560 | |||||||||
|
|
|
|
|
|
|
|||||||
| Gross profit |
184,860 | 117,652 | 60,525 | |||||||||
| Operating expenses: |
||||||||||||
| Research and development(1) |
83,097 | 47,537 | 32,164 | |||||||||
| In-process research and development |
— | 62,363 | — | |||||||||
| Selling, general and administrative(1) |
130,834 | 87,936 | 46,736 | |||||||||
| Accrued contingent liabilities |
1,502 | 30,580 | — | |||||||||
|
|
|
|
|
|
|
|||||||
| Total operating expenses |
215,433 | 228,416 | 78,900 | |||||||||
|
|
|
|
|
|
|
|||||||
| Loss from operations |
(30,573 | ) | (110,764 | ) | (18,375 | ) | ||||||
| Other income (expense): |
||||||||||||
| Interest income |
2,805 | 1,024 | 308 | |||||||||
| Interest expense |
(3,079 | ) | (2,409 | ) | (811 | ) | ||||||
| Other income (expense), net |
(186 | ) | (249 | ) | 137 | |||||||
|
|
|
|
|
|
|
|||||||
| Total other expense |
(460 | ) | (1,634 | ) | (366 | ) | ||||||
|
|
|
|
|
|
|
|||||||
| Loss before provision for income taxes |
$ | (31,033 | ) | $ | (112,398 | ) | $ | (18,741 | ) | |||
| Provision for income taxes |
218 | 87 | 21 | |||||||||
|
|
|
|
|
|
|
|||||||
| Net loss |
$ | (31,251 | ) | $ | (112,485 | ) | $ | (18,762 | ) | |||
|
|
|
|
|
|
|
|||||||
| (1) | Includes stock-based compensation expense as follows: |
| Year Ended December 31, | ||||||||||||
| (in thousands) |
2019 | 2018 | 2017 | |||||||||
| Cost of revenue |
$ | 325 | $ | 85 | $ | 44 | ||||||
| Research and development |
5,721 | 1,030 | 801 | |||||||||
| Selling, general and administrative |
7,287 | 1,543 | 816 | |||||||||
|
|
|
|
|
|
|
|||||||
| Total stock-based compensation expense |
$ | 13,333 | $ | 2,658 | $ | 1,661 | ||||||
|
|
|
|
|
|
|
|||||||
88
Table of Contents
The following table sets forth our consolidated results of operations data as a percentage of revenue for the periods presented.
| Year Ended December 31, | ||||||||||||
| 2019 | 2018 | 2017 | ||||||||||
| Revenue |
100.0 | % | 100.0 | % | 100.0 | % | ||||||
| Cost of revenue(1) |
24.8 | % | 19.6 | % | 14.9 | % | ||||||
|
|
|
|
|
|
|
|||||||
| Gross profit |
75.2 | % | 80.4 | % | 85.1 | % | ||||||
| Operating expenses: |
||||||||||||
| Research and development(1) |
33.8 | % | 32.5 | % | 45.3 | % | ||||||
| In-process research and development |
— | 42.6 | % | — | ||||||||
| Selling, general and administrative(1) |
53.2 | % | 60.1 | % | 65.7 | % | ||||||
| Accrued contingent liabilities |
0.6 | % | 20.9 | % | — | |||||||
|
|
|
|
|
|
|
|||||||
| Total operating expenses |
87.6 | % | 156.1 | % | 111.0 | % | ||||||
|
|
|
|
|
|
|
|||||||
| Loss from operations |
(12.4 | )% | (75.7 | )% | (25.9 | )% | ||||||
|
|
|
|
|
|
|
|||||||
| Other income (expense): |
||||||||||||
| Interest income |
1.2 | % | 0.7 | % | 0.4 | % | ||||||
| Interest expense |
(1.3 | )% | (1.6 | )% | (1.1 | )% | ||||||
| Other income (expense), net |
(0.1 | )% | (0.2 | )% | 0.2 | % | ||||||
|
|
|
|
|
|
|
|||||||
| Total other expense |
(0.2 | )% | (1.1 | )% | (0.5 | )% | ||||||
|
|
|
|
|
|
|
|||||||
| Loss before provision for income taxes |
(12.6 | )% | (76.8 | )% | (26.4 | )% | ||||||
| Provision for income taxes |
0.1 | % | 0.1 | % | 0 | % | ||||||
|
|
|
|
|
|
|
|||||||
| Net loss |
(12.7 | )% | (76.9 | )% | (26.4 | )% | ||||||
|
|
|
|
|
|
|
|||||||
| (1) | Includes stock-based compensation expense as follows: |
| Year Ended December 31, | ||||||||||||
| (in thousands) |
2019 | 2018 | 2017 | |||||||||
| Cost of revenue |
0.1 | % | 0.1 | % | 0.1 | % | ||||||
| Research and development |
2.3 | % | 0.7 | % | 1.1 | % | ||||||
| Selling, general and administrative |
3.0 | % | 1.0 | % | 1.1 | % | ||||||
|
|
|
|
|
|
|
|||||||
| Total stock-based compensation expense |
5.4 | % | 1.8 | % | 2.3 | % | ||||||
|
|
|
|
|
|
|
|||||||
Comparison of the Year Ended December 31, 2019 and 2018
Revenue
| Year Ended December 31, | Change | |||||||||||||||
| (dollars in thousands) |
2019 | 2018 | $ | % | ||||||||||||
| Revenue |
$ | 245,893 | $ | 146,313 | $ | 99,580 | 68 | % | ||||||||
Revenue increased $99.6 million, or 68%, for the year ended December 31, 2019 as compared to year ended December 31, 2018. The increase was driven primarily by an increase in consumables revenue partially offset by lower instrument revenue. Consumables revenue increased $99.3 million, or 92%, to $206.9 million for the year ended December 31, 2019 as compared to the year ended December 31, 2018. The growth in consumables revenue was substantially driven by the growth in the instrument installed base. We experienced continued increases in revenue from our Single Cell Gene Expression, Single Cell Immune Profiling and Single Cell ATAC consumables. In addition, in the fourth quarter of 2019 we began selling our Visium Spatial Gene Expression solution which experienced high initial demand.
89
Table of Contents
Instrument revenue decreased $1.6 million, or 4%, to $34.9 million for the year ended December 31, 2019 as compared to the year ended December 31, 2018. Lower average selling prices were partially offset by higher volumes. The Chromium Controller average selling price decreased by 21% for the year ended December 31, 2019. Lower average selling prices for the year ended 2019 as compared to 2018 were the result of our 2019 first quarter list price reduction for our fully enabled Chromium Controller which brought down the list price for these instruments to $75,000 from $125,000. In addition, we offered various pricing discounts to drive product adoption. The number of instruments sold during the year ended December 31, 2019 was 645 units, an increase of 22% as compared to the prior year, resulting in an ending installed base of 1,666 instruments.
Cost of revenue, gross profit and gross margin
| Year Ended December 31, | Change | |||||||||||||||
| (dollars in thousands) |
2019 | 2018 | $ | % | ||||||||||||
| Cost of revenue |
$ | 61,033 | $ | 28,661 | $ | 32,372 | 113 | % | ||||||||
| Gross profit |
$ | 184,860 | $ | 117,652 | $ | 67,208 | 57 | % | ||||||||
| Gross margin |
75 | % | 80 | % | ||||||||||||
Cost of revenue increased $32.4 million, or 113%, in the year ended December 31, 2019 as compared to the year ended December 31, 2018. In addition to higher cost of sales in line with revenue growth, the increase was also due to additional accrued royalties of $21.7 million related to the judgment in the Bio-Rad litigation and higher inventory reserves.
Gross profit increased $67.2 million, or 57%, and gross margin percentage decreased by 5 points for the year ended December 31, 2019 as compared to the year ended December 31, 2018. These changes were primarily due to increased revenue partially offset by higher accrued royalties related to the judgment in the Bio-Rad litigation in the year ended December 31, 2019.
Operating expenses
| Year Ended December 31, | Change | |||||||||||||||
| (dollars in thousands) |
2019 | 2018 | $ | % | ||||||||||||
| Research and development |
$ | 83,097 | $ | 47,537 | $ | 35,560 | 75 | % | ||||||||
| In-process research and development |
— | 62,363 | (62,363 | ) | N/M | |||||||||||
| Selling, general and administrative |
130,834 | 87,936 | 42,898 | 49 | % | |||||||||||
| Accrued contingent liabilities |
1,502 | 30,580 | (29,078 | ) | (95 | )% | ||||||||||
|
|
|
|
|
|
|
|
|
|||||||||
| Total operating expenses |
$ | 215,433 | $ | 228,416 | $ | (12,983 | ) | (6 | )% | |||||||
|
|
|
|
|
|
|
|
|
|||||||||
N/M: result not meaningful.
Research and development expense increased $35.6 million, or 75%, for the year ended December 31, 2019 as compared to the year ended December 31, 2018. The increase was primarily driven by an increase in personnel expenses of $19.3 million and laboratory materials, supplies and expensed equipment of $10.9 million, which were attributable to an increase in headcount and expenses supporting our continued research and development efforts to enhance our existing products and develop new products. In addition, we incurred additional allocated costs of $5.0 million for facilities to support the expansion of our operations.
In-process research and development expense for the year ended December 31, 2018 relates to intellectual property we purchased in connection with our acquisitions of Spatial Transcriptomics and Epinomics and our acquisition of an exclusive license to certain intellectual property from Prognosys. There were no similar purchases in the year ended December 31, 2019.
90
Table of Contents
Selling, general and administrative expenses increased $42.9 million, or 49%, for the year ended December 31, 2019 as compared to the year ended December 31, 2018. The increase in expenses was primarily driven by an increase in personnel expenses of $27.8 million, increased allocated costs of $7.3 million for facilities, and an increase of $3.6 million of marketing expenses to support our future sales growth and the overall expansion of our operations. In addition, expenses for the year ended December 31, 2019 included $3.6 million of increased professional services and insurance costs associated with our status as a publicly traded company compared to the year ended December 31, 2018.
Accrued contingent liabilities decreased by $29.1 million, or 95%, for the year ended December 31, 2019 as compared to the year ended December 31, 2018. The change is due to the decrease in expenses relating to the litigation with Bio-Rad, for which we established an accrual of $30.6 million in November 2018.
Other income (expense), net
| Year Ended December 31, | Change | |||||||||||||||
| (dollars in thousands) |
2019 | 2018 | $ | % | ||||||||||||
| Interest income |
$ | 2,805 | $ | 1,024 | $ | 1,781 | 174 | % | ||||||||
| Interest expense |
(3,079 | ) | (2,409 | ) | (670 | ) | 28 | % | ||||||||
| Other income (expense) |
(186 | ) | (249 | ) | 63 | (25 | )% | |||||||||
|
|
|
|
|
|
|
|
|
|||||||||
| Total other expense, net |
$ | (460 | ) | $ | (1,634 | ) | $ | 1,174 | (72 | )% | ||||||
|
|
|
|
|
|
|
|
|
|||||||||
Interest income increased by $1.8 million to $2.8 million for the year ended December 31, 2019 from $1.0 million for the year ended December 31, 2018. The increase was primarily due to interest income earned from the investment of the net proceeds from the IPO completed in September 2019.
Interest expense increased by $0.7 million to $3.1 million for the year ended December 31, 2019 from the year ended December 31, 2018. The slight increase was driven primarily by higher interest rates on our then-outstanding term loan borrowings and the interest paid on the revolving credit facility.
Other income (expense) is comprised of realized and unrealized losses from foreign currency rate measurement fluctuations for the years ended December 31, 2019 and December 31, 2018.
Comparison of the Year Ended December 31, 2018 and 2017
Revenue
| Year Ended December 31, | Change | |||||||||||||||
| (dollars in thousands) |
2018 | 2017 | $ | % | ||||||||||||
| Revenue |
$ | 146,313 | $ | 71,085 | $ | 75,228 | 106 | % | ||||||||
Revenue increased $75.2 million, or 106%, for the year ended December 31, 2018 as compared to the prior year. The increase was driven primarily by an increase in consumables revenue. Consumables revenue increased $61.3 million, or 133%, to $107.5 million for the year ended December 31, 2018 as compared to the prior year. $54.9 million of the increase in consumables revenue was due to growth in the instrument installed base and $6.4 million of the increase was due to increased pull-through per instrument driven by new product introductions and updates to existing products.
Instrument revenue increased $12.1 million, or 49%, for the year ended December 31, 2018 as compared to the prior year due to higher volumes of instruments sold, partially offset by lower average selling prices. The number of instruments sold during the year ended December 31, 2018 was 530 units, an increase of 74% as compared to the prior year, resulting in an ending installed base of 1,021 instruments. The Chromium Controller
91
Table of Contents
average selling price decreased by 14% from the prior year, contributing to the $6.0 million decrease in instruments revenue. The incremental discounts offered to drive product adoption and increase our instrument installed base resulted in $4.4 million of this decrease in instrument revenue and the shift towards the version of the Chromium Controller with firmware that enabled the use of only our Single Cell Chromium Consumables, which was offered at a lower price than the fully enabled version, resulted in $1.6 million of this decrease in instrument revenue.
Cost of revenue, gross profit and gross margin
| Year Ended December 31, | Change | |||||||||||||||
| (dollars in thousands) |
2018 | 2017 | $ | % | ||||||||||||
| Cost of revenue |
$ | 28,661 | $ | 10,560 | $ | 18,101 | 171 | % | ||||||||
| Gross profit |
$ | 117,652 | $ | 60,525 | $ | 57,127 | 94 | % | ||||||||
| Gross margin |
80 | % | 85 | % | ||||||||||||
Cost of revenue increased $18.1 million, or 171%, for the year ended December 31, 2018 as compared to the prior year. In addition to higher cost of sales in line with revenue growth, the increase was primarily due to additional royalties of $7.4 million related to the Bio-Rad litigation which we began accruing in the fourth quarter of 2018, higher inventory reserves of $1.2 million as we transitioned to newer versions of our products and higher warranty-related expenses of $1.2 million.
Gross profit increased $57.1 million, or 94%, for the year ended December 31, 2018 as compared to the prior year, primarily due to increased revenue partially offset by additional accrued royalties. Gross margin percentage decreased by 5 points for the year ended December 31, 2018 as compared to the prior year, driven primarily by accrued royalties in the fourth quarter of 2018.
Operating expenses
| Year Ended December 31, | Change | |||||||||||||||
| (dollars in thousands) |
2018 | 2017 | $ | % | ||||||||||||
| Research and development |
$ | 47,537 | $ | 32,164 | $ | 15,373 | 48 | % | ||||||||
| In-process research and development |
62,363 | — | $ | 62,363 | — | % | ||||||||||
| Selling, general and administrative |
87,936 | 46,736 | $ | 41,200 | 88 | % | ||||||||||
| Accrued contingent liabilities |
30,580 | — | $ | 30,580 | — | % | ||||||||||
|
|
|
|
|
|
|
|
|
|||||||||
| Total operating expenses |
$ | 228,416 | $ | 78,900 | $ | 149,516 | 190 | % | ||||||||
|
|
|
|
|
|
|
|
|
|||||||||
Research and development expense increased $15.4 million, or 48%, for the year ended December 31, 2018 as compared to the prior year. The increase was primarily driven by an increase in personnel expenses of $7.8 million and laboratory materials and supplies expenses of $4.4 million, which were attributable to an increase in headcount and expenses supporting our continued research and development efforts to enhance our existing products and develop new products.
In-process research and development expense relates to intellectual property we purchased in 2018 in connection with our acquisitions of Spatial Transcriptomics and Epinomics and our acquisition of an exclusive license to certain intellectual property from Prognosys, in each case to be used as part of our research and development efforts to enhance our existing products and develop new products. There were no similar purchases in 2017. See the section above titled “—Acquisitions.”
Selling, general and administrative expenses increased $41.2 million, or 88%, for the year ended December 31, 2018 as compared to the prior year. The increase in expenses was primarily driven by an increase in personnel expenses of $15.0 million to support our sales growth and the overall expansion of our operations and increased outside legal fees of $16.5 million.
92
Table of Contents
Accrued contingent liabilities consisted of $30.6 million of expenses relating to the litigation with Bio-Rad, for which we established an accrual in November 2018. There was no similar accrual in 2017.
Other income (expense), net
| Year Ended December 31, | Change | |||||||||||||||
| (dollars in thousands) |
2018 | 2017 | $ | % | ||||||||||||
| Interest income |
$ | 1,024 | $ | 308 | $ | 716 | N/M | |||||||||
| Interest expense |
(2,409 | ) | (811 | ) | (1,598 | ) | N/M | |||||||||
| Other income (expense) |
(249 | ) | 137 | (386 | ) | N/M | ||||||||||
|
|
|
|
|
|
|
|||||||||||
| Total other expense, net |
$ | (1,634 | ) | $ | (366 | ) | $ | (1,268 | ) | N/M | ||||||
|
|
|
|
|
|
|
|||||||||||
N/M: result not meaningful.
Interest income increased $0.7 million for the year ended December 31, 2018 as compared to the prior year. The increase was driven primarily by higher cash and cash-equivalent balances in interest bearing accounts along with increased yields on such balances.
Interest expense increased $1.6 million for the year ended December 31, 2018 as compared to the prior year. The increase was driven primarily by higher outstanding term loan borrowings in 2018 following the refinancing of our previous loan and security agreement in February 2018 and increased interest rates.
The change in other income (expense), net during the year ended December 31, 2018 was driven by realized and unrealized losses from foreign currency rate measurement fluctuations. Foreign currency losses increased compared to the prior year as a result of the overall strengthening of the U.S. dollar when compared to the foreign currencies in which we operate.
Liquidity and Capital Resources
As of December 31, 2019, we had approximately $424.2 million in unrestricted cash and cash equivalents which were primarily held in U.S. bank deposit accounts and money market funds, $33.4 million in accounts receivable and an accumulated deficit of $262.4 million. Approximately $5.0 million of cash, which serves as collateral for an outstanding letter of credit, $45.2 million of cash on deposit with a financial institution in connection with the issuance of a bond related to the Bio-Rad litigation, and $2.1 million of cash, which is held in escrow related to royalties on certain sales in connection with the Bio-Rad litigation, were classified as noncurrent restricted cash as of December 31, 2019. While we generated positive cash flows from operations of $34.6 million for the year ended December 31, 2019, we have generated negative cash flows from operations since inception through the year ended December 31, 2019 and we have generated losses from operations since inception as reflected in our accumulated deficit of $262.4 million. We expect to continue to incur operating losses for the foreseeable future due to the investments we intend to make and as a result we may require additional capital resources to execute strategic initiatives to grow our business.
In August 2019, the U.S. District Court for the District of Delaware entered final judgment in the amount of approximately $35 million and subsequently ordered that we may post a bond in the amount of $52 million in lieu of payment of the final judgment. On September 13, 2019, we posted a $52 million bond in lieu of payment of the final judgment pending our ongoing appeal. In connection with the bond, we deposited $45 million as collateral in a segregated cash account, where it will be held until the conclusion of the appeal. On October 10, 2019, the Court denied our motion to decrease the bond amount and stayed any execution or enforcement of the judgment until the completion of appeal, and for thirty days thereafter.
Pursuant to the judgment, we place into escrow each quarter an amount equal to 15% of net sales of our GEM microfluidic chips and associated consumables subsequent to the effective date of the injunction, which was August 28, 2019. The amounts have and will be held until conclusion of the appeal and are classified as noncurrent restricted cash. As of December 31, 2019, the amount placed into escrow was $2.1 million.
93
Table of Contents
In October 2019, we entered into an agreement to make an aggregate payment of $25.0 million in annual amounts of $6.25 million over four years beginning in January 2020 in connection with the 2019 Becton Dickinson Settlement and Patent Cross License Agreement. See Note 7 to the Notes to Consolidated Financial Statements included in Part II, Item 8 of this Annual Report.
We currently anticipate making aggregate capital expenditures of between approximately $55 million and $70 million during the next 18 months, which includes the construction costs of our global expansion and for equipment to be used for manufacturing and research and development. Our future capital requirements will depend on many factors including our revenue growth rate, research and development efforts, the timing and extent of additional capital expenditures to invest in existing and new facilities, the expansion of sales and marketing and international activities, the timing of capital expenditures relating to our planned implementation of a new enterprise resource planning system and the introduction of new products. We have and may in the future enter into arrangements to acquire or invest in businesses, services and technologies, including intellectual property rights, and any such acquisitions or investments could significantly increase our capital needs.
We believe that our existing cash and cash equivalents, and cash generated from sales of our products will be sufficient to meet our anticipated cash needs for at least the next 12 months. However, our liquidity assumptions may prove to be incorrect, and we could exhaust our available financial resources sooner than we currently expect.
Sources of liquidity
Since our inception, we have financed our operations and capital expenditures primarily through sales of convertible preferred stock and common stock, revenue from sales and issuances of debt. In September 2019, we completed our IPO for proceeds of $410.8 million, net of offering costs, underwriter discounts and commissions of $37.7 million.
Silicon Valley Bank Loan and Security Agreement
We are party to a Second Amended and Restated Loan and Security Agreement, dated February 9, 2018, with Silicon Valley Bank (as amended, restated or supplemented from time to time, the “Loan and Security Agreement”), under which (i) $30.0 million of term loan borrowings were outstanding and (ii) no borrowings were outstanding under the $25.0 million revolving line of credit, in each case as of December 31, 2019.
The term loan borrowings were prepaid in full on February 20, 2020. We were in compliance with all covenants under the Loan and Security Agreement as of December 31, 2019, remained in compliance with such covenants at the time the term loan borrowings were prepaid in full on February 20, 2020 and currently remain in compliance with such covenants.
Borrowings under the term loan were to mature on December 1, 2022 and accrued interest at a floating rate equal to the greater of The Wall Street Journal prime rate plus 2.0% or 6.25% per annum. Monthly payments of interest were due on the term loan through December 31, 2019, after which equal monthly installments of principal and interest were to be due.
The revolving line of credit matures on December 1, 2022 and the amount available under the revolving line of credit is based on 80% of eligible receivables and is subject to a borrowing base calculation. Borrowings under the revolving line of credit accrue interest which is payable monthly at a floating rate equal to the greater of The Wall Street Journal prime rate plus 0.25% or 4.5% per annum.
94
Table of Contents
Cash flow summary
The following table summarizes our cash flows for the periods indicated:
| Year Ended December 31, | ||||||||||||
| 2019 | 2018 | 2017 | ||||||||||
| (in thousands) | ||||||||||||
| Net cash provided by (used in): |
||||||||||||
| Operating activities |
$ | 34,627 | $ | (76,409 | ) | $ | (10,699 | ) | ||||
| Investing activities |
(42,767 | ) | (6,709 | ) | (3,756 | ) | ||||||
| Financing activities |
414,590 | 105,367 | 20,583 | |||||||||
| Effect of exchange rates on cash, cash equivalents and restricted cash |
(45 | ) | (18 | ) | (14 | ) | ||||||
|
|
|
|
|
|
|
|||||||
| Net (decrease) increase in cash, cash equivalents and restricted cash |
$ | 406,405 | $ | 22,231 | $ | 6,114 | ||||||
|
|
|
|
|
|
|
|||||||
Operating activities
The net cash provided by operating activities of $34.6 million in the year ended December 31, 2019 was due primarily to a net loss of $31.3 million with adjustments for stock-based compensation expense of $13.3 million and depreciation and amortization of $7.1 million and an increase from the net change in operating assets and liabilities of $44.8 million. The inflow from operating assets and liabilities was primarily due to an increase in accrued contingent liabilities of $30.7 million, an increase in noncurrent deferred rent of $12.7 million, an increase in accrued expenses and other current liabilities of $5.8 million, an increase in accrued compensation and other related benefits of $5.3 million, and an increase in accounts payable of $4.9 million, partially offset by an increase in inventory of $6.7 million, an increase in accounts receivable of $5.3 million, an increase in prepaid expenses and other current assets of $3.5 million.
The net cash used in operating activities of $76.4 million in the year ended December 31, 2018 was due primarily to a net loss of $112.5 million with adjustments for depreciation and amortization of $3.9 million and stock-based compensation expense of $2.7 million and an increase from the net change in operating assets and liabilities of $28.0 million. The inflow from operating assets and liabilities was primarily due to the establishment of an accrual for contingent liabilities of $38.0 million, an increase in noncurrent deferred rent of $3.3 million, an increase in accounts payable of $2.6 million, an increase in accrued compensation and other related benefits of $2.6 million, an increase in accrued expenses and other current liabilities of $1.7 million and an increase in deferred revenue of $1.7 million, partially offset by an increase in accounts receivable of $14.7 million, an increase in inventory of $3.7 million and an increase in prepaid expenses and other current assets of $2.4 million.
The net cash used in operating activities of $10.7 million in the year ended December 31, 2017 was due primarily to a net loss of $18.8 million with adjustments for depreciation and amortization of $4.3 million and stock-based compensation expense of $1.7 million. The inflow from operating assets and liabilities was primarily due to an increase in accrued compensation and other related benefits of $3.5 million, an increase in accounts payable of $3.0 million, an increase in accrued expenses and other current liabilities of $1.8 million, and an increase in deferred revenue of $1.3 million, partially offset by an increase in accounts receivable of $5.1 million, an increase in inventory of $2.0 million and an increase in prepaid expenses and other current assets of $0.7 million.
Investing activities
The net cash used in investing activities of $42.8 million in the year ended December 31, 2019 was due to purchases of property and equipment of $42.7 million.
95
Table of Contents
The net cash used in investing activities of $6.7 million in the year ended December 31, 2018 was due to purchases of property and equipment of $6.3 million and the purchase of intangible assets of $0.4 million.
The net cash used in investing activities of $3.8 million in the year ended December 31, 2017 was due to purchases of property and equipment of $3.8 million.
Financing activities
The net cash provided by financing activities of $414.6 million in the year ended December 31, 2019 was primarily from proceeds of $410.8 million from issuance of Class A common stock in our IPO, net of issuance costs and proceeds of $3.8 from the issuance of common stock from the exercise of stock options.
The net cash provided by financing activities of $105.4 million in the year ended December 31, 2018 was primarily from proceeds from the issuance of convertible preferred stock, net of issuance costs, of $84.8 million, net proceeds from additional borrowings of $19.5 million, and proceeds of $1.8 million from the issuance of common stock from the exercise of stock options, partially offset by payments on debt obligations of $0.7 million.
The net cash provided by financing activities of $20.6 million in the year ended December 31, 2017 was primarily from proceeds from the issuance of convertible preferred stock, net of issuance costs, of $20.0 million and proceeds of $1.1 million from the issuance of common stock from the exercise of stock options, partially offset by payments of capital lease obligation of $0.4 million.
Concentrations of credit risk
As of December 31, 2019 and 2018, no single customer represented 10% or more of our accounts receivable balance. There was no single customer, including distributors, that individually exceeded 10% of our revenue during the years ended December 31, 2019, 2018 and 2017.
Contractual Obligations and Commitments
The following table summarizes our commitments to settle contractual obligations as of December 31, 2019:
| Payments due by period | ||||||||||||||||||||
| (in thousands) |
Total | Less than 1 year |
1 – 3 years |
3 – 5 years |
More than 5 years |
|||||||||||||||
| Debt obligations, including interest(1) |
$ | 34,969 | $ | 11,744 | $ | 23,225 | $ | — | $ | — | ||||||||||
| Lease commitments(2) |
72,979 | 6,247 | 14,375 | 14,012 | 38,345 | |||||||||||||||
| Accrued license fee(3) |
25,000 | 6,250 | 12,500 | 6,250 | — | |||||||||||||||
| Other obligations(4) |
15,547 | 3,395 | 5,463 | 3,989 | 2,700 | |||||||||||||||
|
|
|
|
|
|
|
|
|
|
|
|||||||||||
| Total |
$ | 148,495 | $ | 27,636 | $ | 55,563 | $ | 24,251 | $ | 41,045 | ||||||||||
|
|
|
|
|
|
|
|
|
|
|
|||||||||||
| (1) | As of December 31, 2019, the outstanding principal balance of our term loan under our Loan and Security Agreement was $30.0 million. Monthly payments of interest were due under the term loan through December 31, 2019, with equal monthly installments of principal and interest due for thirty-six months thereafter. An end of term payment of $1.8 million due to the lender upon maturity, prepayment or acceleration of the term loan is reflected as additional interest expense over the term of the loan. On February 20, 2020 we prepaid the outstanding principal balance in full. See Note 5 of the Notes to Consolidated Financial Statements included in Part II, Item 8 of this Annual Report for more information regarding the terms of the Loan and Security Agreement. |
96
Table of Contents
| (2) | We have entered into various non-cancelable leases for certain offices with contractual lease periods expiring between 2019 and 2029. As of December 31, 2019, we had an unused letter of credit in the amount of $5.0 million outstanding associated with the lease of our new Pleasanton headquarters and research and development center. |
| (3) | We are required to make an aggregate payment of $25.0 million in four annual installments related to the purchase of certain licenses. The present value of these payments of $22.4 million is recognized as a liability in our audited consolidated financial statements as of December 31, 2019. |
| (4) | Other obligations include purchase obligations, prepaid services and royalties. Purchase obligations relate to our contract manufacturer which manufacturers our instruments and makes advance purchases of components based on our sales forecasts and the placement of purchase orders by us. To the extent components are purchased by the contract manufacturer on our behalf and cannot be used by the contract manufacturer’s other customers, we are obligated to purchase such components. In addition, certain supplier agreements require us to make minimum annual purchases under the agreements. To date, we have met the minimum purchase commitments. Prepaid services include subscription software services for which we have entered into non-cancelable arrangements. Royalties include minimum commitments for license arrangements. |
Off-Balance Sheet Arrangements
We did not have during the periods presented, and we do not currently have, any off-balance sheet financing arrangements or any relationships with unconsolidated entities or financial partnerships, including entities sometimes referred to as structured finance or special purpose entities, that were established for the purpose of facilitating off-balance sheet arrangements or other contractually narrow or limited purposes.
Critical Accounting Policies and Estimates
Our consolidated financial statements and the related notes thereto included elsewhere in this Annual Report are prepared in accordance with GAAP. The preparation of consolidated financial statements also requires us to make estimates and assumptions that affect the reported amounts of assets, liabilities, revenue, costs and expenses and related disclosures. We base our estimates on historical experience and on various other assumptions that we believe to be reasonable under the circumstances. Actual results could differ significantly from our estimates. To the extent that there are differences between our estimates and actual results, our future financial statement presentation, financial condition, results of operations and cash flows will be affected.
We believe that the accounting policies described below involve a significant degree of judgment and complexity. Accordingly, we believe these are the most critical to aid in fully understanding and evaluating our consolidated financial condition and results of operations. For further information, see Note 2 of the Notes to Consolidated Financial Statements included in Part II, Item 8 of this Annual Report.
Revenue recognition
We generate revenue from sales of our products and services. Our products consist of instruments and consumables, including proprietary microfluidic chips, slides, reagents and other consumables for both our Visium and Chromium solutions. We also generate a small portion of our revenue from instrument service agreements which relate to extended warranties.
Effective January 1, 2019, we adopted Accounting Standards Codification (“ASC”) Topic 606, Revenue from Contracts with Customers, using the modified retrospective transition method. The cumulative effect of initially adopting ASC Topic 606 was immaterial.
97
Table of Contents
The revenue recognition accounting policy described below relates to revenue transactions from January 1, 2019 and onward, which are accounted for in accordance with ASC Topic 606—Revenue from Contracts with Customers.
We recognize revenue when control of the products and services is transferred to our customers in an amount that reflects the consideration we expect to receive from our customers in exchange for those products and services. This process involves identifying the contract with a customer, determining the performance obligations in the contract, determining the contract price, allocating the contract price to the distinct performance obligations in the contract, and recognizing revenue when the performance obligations have been satisfied. A performance obligation is considered distinct from other obligations in a contract when it provides a benefit to the customer either on its own or together with other resources that are readily available to the customer and is separately identified in the contract. We consider a performance obligation satisfied once we have transferred control of a good or service to the customer, meaning the customer has the ability to use and obtain the benefit of the good or service.
Revenue from product sales is recognized when control of the product is transferred, which is generally upon shipment to the customer. In instances where right of payment or transfer of title is contingent upon the customer’s acceptance of the product, revenue is deferred until all acceptance criteria have been met. Instrument service agreements, which relate to extended warranties, are typically entered into for one-year terms, following the expiration of the standard one-year warranty period. Revenue for extended warranties is recognized ratably over the term of the extended warranty period as a stand ready performance obligation. Revenue is recorded net of discounts, distributor commissions and sales taxes collected on behalf of governmental authorities. Customers are invoiced generally upon shipment, or upon order for services, and payment is typically due within 45 days. Cash received from customers in advance of product shipment or providing services is recorded as a contract liability. Our contracts with our customer generally do not include rights of return or a significant financing component.
We regularly enter into contracts that include various combinations of products and services which are generally distinct and accounted for as separate performance obligations. The transaction price is allocated to each performance obligation in proportion to its standalone selling price. We determine standalone selling price using average selling prices with consideration of current market conditions. If the product or service has no history of sales or if the sales volume is not sufficient, we rely upon prices set by management, adjusted for applicable discounts.
The revenue recognition accounting policy described below relates to revenue transactions prior to January 1, 2019, which are accounted for in accordance with ASC Topic 605—Revenue Recognition.
We recognize revenue when persuasive evidence of an arrangement exists, delivery has occurred or services have been rendered, the price to the customer is fixed or determinable and collectability is reasonably assured. We assess collectability based on factors such as the customer’s creditworthiness and past collection history, if applicable. If collection is not reasonably assured, revenue recognition is deferred until receipt of payment. We also assess whether a price is fixed or determinable by, among other things, reviewing contractual terms and conditions related to payment. Delivery occurs when there is a transfer of title and risk of loss passes to the customer.
Certain of our sales arrangements involve the delivery of multiple products and services within contractually binding arrangements. Multiple-deliverable sales transactions typically consist of the sale and delivery of one or more instruments and consumables together and may include an instrument service agreement.
For sales arrangements that include multiple deliverables, we use the stated contractual price for the instrument service agreements, if and when sold, and allocate the remaining contract consideration at the inception of the contract to the other units of accounting based upon their relative selling price. We may use our
98
Table of Contents
best estimate of selling price for individual deliverables when vendor specific objective evidence or third-party evidence is unavailable. A delivered item is considered to be a separate unit of accounting when it has value to the customer on a stand-alone basis.
Our products, other than instrument service agreements, are typically delivered together or within a short time frame, generally within one to three months of the contract date. Instrument service agreements are typically entered into for a one-year term, following the expiration of the standard one-year warranty period. Our products are generally sold without the right of return. Amounts received before revenue recognition criteria are met are classified in the balance sheets as deferred revenue.
Inventory
Inventory is recorded at the lower of cost, determined on a first-in, first-out basis, or net realizable value. We use judgment to analyze and determine if the composition of its inventory is obsolete, slow-moving or unsalable and frequently review such determinations. We write down specifically identified unusable, obsolete, slow-moving or known unsalable inventory in the period that it is first recognized by using a number of factors including product expiration dates, open and unfulfilled orders and sales forecasts. Any write-down of its inventory to net realizable value establishes a new cost basis and will be maintained even if certain circumstances suggest that the inventory is recoverable in subsequent periods. Costs associated with the write-down of inventory are recorded to cost of revenue on our consolidated statements of operations. We make assumptions about future demand, market conditions and the release of new products that may supersede old ones. However, if actual market conditions are less favorable than anticipated, additional inventory write-downs could be required.
Stock-based compensation
We estimate the fair value of share-based payment awards granted to employees and directors on the grant date using the Black-Scholes option-pricing model. The fair value of share-based payment awards is recognized as compensation expense on a straight-line basis over the requisite service period in which the awards are expected to vest, which is generally four years, and forfeitures are recognized as they occur. Share-based payment awards that include both a service condition and a performance condition are considered expected to vest when the performance condition is probable of being met.
The Black-Scholes model considers several variables and assumptions in estimating the fair value of stock-based awards. These variables include the per share fair value of the underlying common stock, exercise price, expected term, risk-free interest rate, expected annual dividend yield and expected stock price volatility over the expected term. For all stock options granted, we calculated the expected term using the simplified method for “plain vanilla” stock option awards. We had no publicly available stock price information prior to our IPO and limited available stock price information subsequent to our IPO; therefore, we have used the historical volatility of the stock price of similar publicly traded peer companies. The risk-free interest rate is based on the yield available on U.S. Treasury zero-coupon issues similar in duration to the expected term of the equity-settled award.
Equity instruments granted to nonemployees are valued using the Black-Scholes option pricing model. Nonemployee stock-based compensation is recognized over the related performance period, which is generally the vesting term of the awards.
Common stock valuation
Prior to our IPO, there was no public market for our common stock. As such, the estimated fair value of our common stock and underlying stock options has been determined at each grant date by our board of directors, with input from management, based on the information known to us on the grant date and upon a review of any
99
Table of Contents
recent events and their potential impact on the estimated per share fair value of our common stock. As part of these fair value determinations, our board of directors obtained and considered valuation reports prepared by a third-party valuation firm in accordance with the guidance outlined in the American Institute of Certified Public Accountants Technical Practice Aid, Valuation of Privately-Held-Company Equity Securities Issued as Compensation.
For valuations after the completion of our initial public offering, the fair value of each share of underlying common stock is based on the closing price of our Class A common stock as reported on the date of grant.
Accrued contingent liabilities
We have been and are currently involved in various legal proceedings which arise in the ordinary course of business. The outcomes of these legal proceedings are not within our complete control or may not be known for prolonged periods of time. Management is required to assess the probability of loss and amount of such loss, if any, in preparing our consolidated financial statements. We evaluate the likelihood of a potential loss from legal proceedings to which we are a party. We record a liability for such claims when a loss is deemed probable and the amount can be reasonably estimated. Significant judgment may be required in the determination of both probability and whether an exposure is reasonably estimable. Our judgments are subjective based on the status of the legal proceedings, the merits of our defenses and consultation with in-house and outside legal counsel. As additional information becomes available, we reassess the potential liability related to pending claims and may revise our estimates. Due to the inherent uncertainties of the legal processes in the multiple jurisdictions in which we operate, our judgments may be materially different than the actual outcomes, which could have material adverse effects on our business, financial conditions and results of operations.
Acquisitions of intellectual property
We evaluate acquisitions of assets and other similar transactions to assess whether or not the transaction should be accounted for as a business combination or asset acquisition by first applying a screen to determine if substantially all of the fair value of the gross assets acquired is concentrated in a single identifiable asset or group of similar identifiable assets. If the screen is met, the transaction is accounted for as an asset acquisition. If the screen is not met, further determination is required as to whether or not we have acquired inputs and processes that have the ability to create outputs, which would meet the requirements of a business.
We account for an asset acquisition under Accounting Standards Codification, Business Combinations Topic 805, Subtopic 50, which requires the acquiring entity in an asset acquisition to recognize net assets based on the cost to the acquiring entity on a relative fair value basis, which includes transaction costs in addition to consideration given. Goodwill is not recognized in an asset acquisition and any excess consideration transferred over the fair value of the net assets acquired is allocated to the non-monetary identifiable assets based on relative fair values. In-process research and development expenses are expensed as incurred provided there is no alternative future use.
Contingent consideration payments in asset acquisitions are recognized when the contingency is resolved and the consideration is paid or becomes payable (unless the contingent consideration meets the definition of a derivative, in which case the amount becomes part of the basis in the asset acquired). Upon recognition of the contingent consideration payment, the amount is included in the cost of the acquired asset or group of assets.
JOBS Act accounting election
We are an emerging growth company, as defined in the JOBS Act. Under the JOBS Act, emerging growth companies can delay adopting new or revised accounting standards issued subsequent to the enactment of the JOBS Act until such time as those standards apply to private companies. We have elected to use this extended transition period for complying with new or revised accounting standards that have different effective dates for
100
Table of Contents
public and private companies until the earlier of the date we (i) are no longer an emerging growth company or (ii) affirmatively and irrevocably opt out of the extended transition period provided in the JOBS Act. As a result, our financial statements may not be comparable to companies that comply with new or revised accounting pronouncements as of public company effective dates.
Recent Accounting Pronouncements
See Note 2, “Summary of Significant Accounting Policies” in our Notes to Consolidated Financial Statements included in Part II, Item 8 of this Annual Report for a discussion of recent accounting pronouncements.
Emerging Growth Company Status
We are an emerging growth company, as defined in the JOBS Act. Under the JOBS Act, emerging growth companies can delay adopting new or revised accounting standards issued subsequent to the enactment of the JOBS Act until such time as those standards apply to private companies. We have elected to use this extended transition period for complying with new or revised accounting standards that have different effective dates for public and private companies until the earlier of the date we (i) are no longer an emerging growth company or (ii) affirmatively and irrevocably opt out of the extended transition period provided in the JOBS Act. As a result, our financial statements may not be comparable to companies that comply with new or revised accounting pronouncements as of public company effective dates.
101
Table of Contents
Item 7A. Quantitative and Qualitative Disclosures About Market Risk.
We are exposed to market risks in the ordinary course of our business. Market risk represents the risk of loss that may impact our financial position due to adverse changes in financial market prices and rates. Our market risk exposure is primarily the result of fluctuations in foreign currency exchange rates.
Interest Rate Risk
We have exposure to interest rate risk that relates primarily to our cash and cash equivalents held in bank deposit and money market funds and our borrowings that bear variable interest rates under our credit facility. We maintain our portfolio of cash equivalents in money market funds. All of our cash equivalents are carried at fair market value.
The primary objective of our investment activities is to preserve principal while at the same time improving yields without significantly increasing risk. To achieve this objective, we maintain our portfolio of cash equivalents in asset types including bank deposits and money market funds. Declines in interest rates, however, would reduce future interest income. A 10% decline in interest rates, occurring on January 1, 2020, and sustained throughout the period ending December 31, 2020, would not significantly impact interest income. A hypothetical 10% change in interest rates would not significantly increase our interest expense as it relates to our borrowings that bear variable interest rates.
Foreign Currency Exchange Risk
Our reporting currency is the U.S. dollar and the functional currency of each of our subsidiaries is either its local currency or the U.S. dollar depending on the circumstances. Historically, most of our revenue has been denominated in U.S. dollars, although we have sold our products and services in local currency outside of the United States, principally the Euro. For the twelve months ended December 31, 2019, approximately 15% of our sales were denominated in currencies other than U.S. dollars. Our expenses are generally denominated in the currencies in which our operations are located, which is primarily in the United States. As our operations in countries outside of the United States grow, our results of operations and cash flows will be subject to fluctuations due to changes in foreign currency exchange rates, which could harm our business in the future. For example, if the value of U.S. dollar increases relative to foreign currencies, in the absence of a corresponding change in local currency prices, our revenue could be adversely affected as we convert revenue from local currencies to U.S. dollars. In addition, because we conduct business in currencies other than U.S. dollars, but report our results of operations in U.S. dollars, we also face remeasurement exposure to fluctuations in currency exchanges rates, which could hinder our ability to predict our future results and earning and could materially impact our results of operations. We do not currently maintain a program to hedge exposures to non-U.S. dollar currencies. We believe that an immediate 10% increase or decrease in the relative value of the U.S. dollar to other currencies would not have a material effect on our operating results.
102
Table of Contents
Item 8. Financial Statements and Supplementary Data.
10x Genomics, Inc.
Index to Consolidated Financial Statements
| Page | ||||
| 104 | ||||
| 105 | ||||
| Consolidated Statements of Operations and Comprehensive Loss |
106 | |||
| Consolidated Statements of Convertible Preferred Stock and Stockholders’ Equity (Deficit) |
107 | |||
| 108 | ||||
| 109 | ||||
103
Table of Contents
Report of Independent Registered Public Accounting Firm
To the Stockholders and the Board of Directors of 10x Genomics, Inc.
Opinion on the Financial Statements
We have audited the accompanying consolidated balance sheets of 10x Genomics, Inc. (the “Company”) as of December 31, 2019 and 2018, the related consolidated statements of operations and comprehensive loss, convertible preferred stock and stockholders’ equity (deficit) and cash flows for each of the three years in the period ended December 31, 2019, and the related notes (collectively referred to as the “financial statements”). In our opinion, the consolidated financial statements present fairly, in all material respects, the financial position of the Company as of December 31, 2019 and 2018, and the results of its operations and its cash flows for each of the three years in the period ended December 31, 2019, in conformity with U.S. generally accepted accounting principles.
Basis for Opinion
These financial statements are the responsibility of the Company’s management. Our responsibility is to express an opinion on the Company’s financial statements based on our audits. We are a public accounting firm registered with the Public Company Accounting Oversight Board (United States) (PCAOB) and are required to be independent with respect to the Company in accordance with the U.S. federal securities laws and the applicable rules and regulations of the Securities and Exchange Commission and the PCAOB.
We conducted our audits in accordance with the standards of the PCAOB. Those standards require that we plan and perform the audit to obtain reasonable assurance about whether the financial statements are free of material misstatement, whether due to error or fraud. The Company is not required to have, nor were we engaged to perform, an audit of its internal control over financial reporting. As part of our audits we are required to obtain an understanding of internal control over financial reporting but not for the purpose of expressing an opinion on the effectiveness of the Company’s internal control over financial reporting. Accordingly, we express no such opinion.
Our audits included performing procedures to assess the risks of material misstatement of the financial statements, whether due to error or fraud, and performing procedures that respond to those risks. Such procedures included examining, on a test basis, evidence regarding the amounts and disclosures in the financial statements. Our audits also included evaluating the accounting principles used and significant estimates made by management, as well as evaluating the overall presentation of the financial statements. We believe that our audits provide a reasonable basis for our opinion.
/s/ Ernst & Young LLP
We have served as the Company’s auditor since 2015.
Redwood City, California
February 27, 2020
104
Table of Contents
10x Genomics, Inc.
(In thousands, except share and per share data)
| December 31, | ||||||||
| 2019 | 2018 | |||||||
| Assets |
||||||||
| Current assets: |
||||||||
| Cash and cash equivalents |
$ | 424,166 | $ | 65,080 | ||||
| Accounts receivable, net |
33,371 | 28,088 | ||||||
| Inventory |
15,270 | 8,570 | ||||||
| Prepaid expenses and other current assets |
8,033 | 4,498 | ||||||
|
|
|
|
|
|||||
| Total current assets |
480,840 | 106,236 | ||||||
| Property and equipment, net |
48,821 | 11,127 | ||||||
| Restricted cash |
52,327 | 5,008 | ||||||
| Other assets |
23,935 | 1,939 | ||||||
|
|
|
|
|
|||||
| Total assets |
$ | 605,923 | $ | 124,310 | ||||
|
|
|
|
|
|||||
| Liabilities, convertible preferred stock and stockholders’ equity (deficit) |
||||||||
| Current liabilities: |
||||||||
| Accounts payable |
$ | 13,028 | $ | 8,792 | ||||
| Accrued compensation and related benefits |
12,394 | 7,047 | ||||||
| Accrued expenses and other current liabilities |
24,448 | 9,941 | ||||||
| Term loans, current portion |
9,882 | 4,187 | ||||||
| Deferred revenue, current |
3,297 | 2,395 | ||||||
|
|
|
|
|
|||||
| Total current liabilities |
63,049 | 32,362 | ||||||
| Term loans, noncurrent portion |
19,837 | 25,489 | ||||||
| Accrued contingent liabilities |
68,658 | 38,000 | ||||||
| Accrued license fee, noncurrent |
16,251 | — | ||||||
| Deferred revenue, noncurrent |
834 | 1,102 | ||||||
| Deferred rent, noncurrent |
16,120 | 3,329 | ||||||
| Other noncurrent liabilities |
1,091 | 771 | ||||||
|
|
|
|
|
|||||
| Total liabilities |
185,840 | 101,053 | ||||||
|
|
|
|
|
|||||
| Commitments and contingencies (Note 8) |
||||||||
| Convertible preferred stock, $0.00001 par value, no shares authorized and no shares issued and outstanding as of December 31, 2019; 67,904,871 shares authorized and 67,704,278 shares issued and outstanding as of December 31, 2018; aggregate liquidation preference of $242,588 as of December 31, 2018 |
— | 243,244 | ||||||
| Stockholders’ equity (deficit): |
||||||||
| Preferred stock, $0.00001 par value; 100,000,000 shares authorized, no shares issued and outstanding as of December 31, 2019; no shares authorized, issued or outstanding as of December 31, 2018 |
— | — | ||||||
| Common stock, $0.00001 par value; 1,100,000,000 shares authorized and 96,241,596 shares issued and outstanding as of December 31, 2019; 190,955,000 shares authorized and 14,549,801 shares issued and outstanding as of December 31, 2018 |
2 | 1 | ||||||
| Additional paid-in capital |
682,494 | 11,165 | ||||||
| Accumulated deficit |
(262,367 | ) | (231,116 | ) | ||||
| Accumulated other comprehensive loss |
(46 | ) | (37 | ) | ||||
|
|
|
|
|
|||||
| Total stockholders’ equity (deficit) |
420,083 | (219,987 | ) | |||||
|
|
|
|
|
|||||
| Total liabilities, convertible preferred stock and stockholders’ equity (deficit) |
$ | 605,923 | $ | 124,310 | ||||
|
|
|
|
|
|||||
The accompanying notes are an integral part of these consolidated financial statements.
105
Table of Contents
10x Genomics, Inc.
Consolidated Statements of Operations and Comprehensive Loss
(In thousands, except share and per share data)
| Year Ended December 31, | ||||||||||||
| 2019 | 2018 | 2017 | ||||||||||
| Revenue |
$ | 245,893 | $ | 146,313 | $ | 71,085 | ||||||
| Cost of revenue |
61,033 | 28,661 | 10,560 | |||||||||
|
|
|
|
|
|
|
|||||||
| Gross profit |
184,860 | 117,652 | 60,525 | |||||||||
| Operating expenses: |
||||||||||||
| Research and development |
83,097 | 47,537 | 32,164 | |||||||||
| In-process research and development |
— | 62,363 | — | |||||||||
| Selling, general and administrative |
130,834 | 87,936 | 46,736 | |||||||||
| Accrued contingent liabilities |
1,502 | 30,580 | — | |||||||||
|
|
|
|
|
|
|
|||||||
| Total operating expenses |
215,433 | 228,416 | 78,900 | |||||||||
|
|
|
|
|
|
|
|||||||
| Loss from operations |
(30,573 | ) | (110,764 | ) | (18,375 | ) | ||||||
| Other income (expense): |
||||||||||||
| Interest income |
2,805 | 1,024 | 308 | |||||||||
| Interest expense |
(3,079 | ) | (2,409 | ) | (811 | ) | ||||||
| Other income (expense), net |
(186 | ) | (249 | ) | 137 | |||||||
|
|
|
|
|
|
|
|||||||
| Total other expense |
(460 | ) | (1,634 | ) | (366 | ) | ||||||
|
|
|
|
|
|
|
|||||||
| Loss before provision for income taxes |
(31,033 | ) | (112,398 | ) | (18,741 | ) | ||||||
| Provision for income taxes |
218 | 87 | 21 | |||||||||
|
|
|
|
|
|
|
|||||||
| Net loss |
$ | (31,251 | ) | $ | (112,485 | ) | $ | (18,762 | ) | |||
|
|
|
|
|
|
|
|||||||
| Other comprehensive loss |
||||||||||||
| Foreign currency translation adjustment |
(9 | ) | (22 | ) | (15 | ) | ||||||
|
|
|
|
|
|
|
|||||||
| Comprehensive loss |
$ | (31,260 | ) | $ | (112,507 | ) | $ | (18,777 | ) | |||
|
|
|
|
|
|
|
|||||||
| Net loss per share, basic and diluted |
$ | (0.80 | ) | $ | (8.40 | ) | $ | (1.62 | ) | |||
|
|
|
|
|
|
|
|||||||
| Weighted-average shares used to compute net loss per share, basic and diluted |
39,091,366 | 13,392,273 | 11,587,751 | |||||||||
|
|
|
|
|
|
|
|||||||
The accompanying notes are an integral part of these consolidated financial statements.
106
Table of Contents
10x Genomics, Inc.
Consolidated Statements of Convertible Preferred Stock and Stockholders’ Equity (Deficit)
(In thousands, except share data)
| Convertible Preferred Stock |
Common Stock | Additional Paid-in Capital |
Accumulated Deficit |
Accumulated Other Comprehensive Income (Loss) |
Total Stockholders’ Equity (Deficit) |
|||||||||||||||||||||||||||
| Shares | Amount | Shares | Amount | |||||||||||||||||||||||||||||
| Balance as of December 31, 2016 |
55,264,133 | $ | 138,450 | 11,330,679 | $ | 1 | $ | 3,437 | $ | (99,869 | ) | $ | — | $ | (96,431 | ) | ||||||||||||||||
| Issuance of Series C convertible preferred stock, net of issuance costs |
4,466,080 | 19,964 | — | — | — | — | — | — | ||||||||||||||||||||||||
| Issuance of Class A common stock upon exercise of options |
— | — | 1,628,251 | — | 926 | — | — | 926 | ||||||||||||||||||||||||
| Repurchase of unvested Class A common stock related to early exercised options |
— | — | ( 75,000 | ) | — | — | — | — | — | |||||||||||||||||||||||
| Vesting of shares subject to repurchase, including early exercised options |
— | — | — | — | 112 | — | — | 112 | ||||||||||||||||||||||||
| Stock-based compensation |
— | — | — | — | 1,661 | — | — | 1,661 | ||||||||||||||||||||||||
| Net loss |
— | — | — | — | — | (18,762 | ) | — | (18,762 | ) | ||||||||||||||||||||||
| Other comprehensive loss |
— | — | — | — | — | — | (15 | ) | (15 | ) | ||||||||||||||||||||||
|
|
|
|
|
|
|
|
|
|
|
|
|
|
|
|
|
|||||||||||||||||
| Balance as of December 31, 2017 |
59,730,213 | 158,414 | 12,883,930 | 1 | 6,136 | (118,631 | ) | (15 | ) | (112,509 | ) | |||||||||||||||||||||
|
|
|
|
|
|
|
|
|
|
|
|
|
|
|
|
|
|||||||||||||||||
| Issuance of Series D convertible preferred stock, net of issuance costs |
5,224,658 | 49,878 | — | — | — | — | — | — | ||||||||||||||||||||||||
| Issuance of Series D-1 convertible preferred stock, net of issuance costs |
2,749,407 | 34,952 | — | — | — | — | — | — | ||||||||||||||||||||||||
| Issuance of Class A common stock upon exercise of options |
— | — | 1,508,762 | — | 1,173 | — | — | 1,173 | ||||||||||||||||||||||||
| Issuance of Class A common stock for in-process research and development |
— | — | 157,109 | — | 792 | — | — | 792 | ||||||||||||||||||||||||
| Vesting of shares subject to repurchase, including early exercised options |
— | — | — | — | 256 | — | — | 256 | ||||||||||||||||||||||||
| Issuance of warrants to purchase Class A common stock |
— | — | — | — | 150 | — | — | 150 | ||||||||||||||||||||||||
| Stock-based compensation |
— | — | — | — | 2,658 | — | — | 2,658 | ||||||||||||||||||||||||
| Net loss |
— | — | — | — | — | (112,485 | ) | — | (112,485 | ) | ||||||||||||||||||||||
| Other comprehensive loss |
— | — | — | — | — | — | (22 | ) | (22 | ) | ||||||||||||||||||||||
|
|
|
|
|
|
|
|
|
|
|
|
|
|
|
|
|
|||||||||||||||||
| Balance as of December 31, 2018 |
67,704,278 | 243,244 | 14,549,801 | 1 | 11,165 | (231,116 | ) | (37 | ) | (219,987 | ) | |||||||||||||||||||||
|
|
|
|
|
|
|
|
|
|
|
|
|
|
|
|
|
|||||||||||||||||
| Issuance of Class A common stock upon exercise of options |
— | — | 2,226,493 | — | 3,435 | — | — | 3,435 | ||||||||||||||||||||||||
| Conversion of convertible preferred stock into Class B common stock |
(67,704,278 | ) | (243,244 | ) | 67,704,278 | 1 | 243,243 | — | — | 243,244 | ||||||||||||||||||||||
| Issuance of Class A common stock upon initial public offering, net of issuance costs |
— | — | 11,500,000 | — | 410,824 | — | — | 410,824 | ||||||||||||||||||||||||
| Cashless exercise of Class A common stock warrants |
— | — | 261,024 | — | — | — | — | — | ||||||||||||||||||||||||
| Vesting of shares subject to repurchase, including early exercised options |
— | — | — | — | 494 | — | — | 494 | ||||||||||||||||||||||||
| Stock-based compensation |
— | — | — | — | 13,333 | — | — | 13,333 | ||||||||||||||||||||||||
| Net loss |
— | — | — | — | — | (31,251 | ) | — | (31,251 | ) | ||||||||||||||||||||||
| Other comprehensive loss |
— | — | — | — | — | — | (9 | ) | (9 | ) | ||||||||||||||||||||||
|
|
|
|
|
|
|
|
|
|
|
|
|
|
|
|
|
|||||||||||||||||
| Balance as of December 31, 2019 |
— | $ | — | 96,241,596 | $ | 2 | $ | 682,494 | $ | (262,367 | ) | $ | (46 | ) | $ | 420,083 | ||||||||||||||||
|
|
|
|
|
|
|
|
|
|
|
|
|
|
|
|
|
|||||||||||||||||
The accompanying notes are an integral part of these consolidated financial statements
107
Table of Contents
10x Genomics, Inc.
Consolidated Statements of Cash Flows
(In thousands)
| Year Ended December 31, | ||||||||||||
| 2019 | 2018 | 2017 | ||||||||||
| Operating activities: |
||||||||||||
| Net loss |
$ | (31,251 | ) | $ | (112,485 | ) | $ | (18,762 | ) | |||
| Adjustments to reconcile net loss to net cash provided by (used in) operating activities: |
||||||||||||
| Depreciation and amortization |
7,066 | 3,905 | 4,305 | |||||||||
| Stock-based compensation |
13,333 | 2,658 | 1,661 | |||||||||
| Class A common stock issued for in-process research and development |
— | 792 | — | |||||||||
| Loss on disposal of property and equipment |
614 | 251 | — | |||||||||
| Accretion of discount on term loan |
101 | 455 | 149 | |||||||||
| Changes in operating assets and liabilities: |
||||||||||||
| Accounts receivable |
(5,284 | ) | (14,747 | ) | (5,131 | ) | ||||||
| Inventory |
(6,699 | ) | (3,732 | ) | (1,995 | ) | ||||||
| Prepaid expenses and other current assets |
(3,535 | ) | (2,429 | ) | (702 | ) | ||||||
| Other assets |
(251 | ) | (999 | ) | 33 | |||||||
| Accounts payable |
4,901 | 2,587 | 3,034 | |||||||||
| Accrued compensation and other related benefits |
5,292 | 2,600 | 3,498 | |||||||||
| Deferred revenue |
634 | 1,673 | 1,317 | |||||||||
| Accrued contingent liabilities |
30,658 | 38,000 | — | |||||||||
| Accrued expenses and other current liabilities |
5,771 | 1,701 | 1,844 | |||||||||
| Deferred rent, noncurrent |
12,730 | 3,328 | (68 | ) | ||||||||
| Other noncurrent liabilities |
547 | 33 | 118 | |||||||||
|
|
|
|
|
|
|
|||||||
| Net cash provided by (used in) operating activities |
34,627 | (76,409 | ) | (10,699 | ) | |||||||
|
|
|
|
|
|
|
|||||||
| Investing activities: |
||||||||||||
| Purchases of property and equipment |
(42,742 | ) | (6,284 | ) | (3,756 | ) | ||||||
| Purchases of intangible assets |
(25 | ) | (425 | ) | — | |||||||
|
|
|
|
|
|
|
|||||||
| Net cash used in investing activities |
(42,767 | ) | (6,709 | ) | (3,756 | ) | ||||||
|
|
|
|
|
|
|
|||||||
| Financing activities: |
||||||||||||
| Proceeds from term loans |
— | 19,512 | — | |||||||||
| Payments on term loans |
— | (704 | ) | — | ||||||||
| Proceeds from borrowings under revolver |
11,000 | — | — | |||||||||
| Payments on borrowings under revolver |
(11,000 | ) | — | — | ||||||||
| Payments on capital lease obligations |
— | (69 | ) | (393 | ) | |||||||
| Proceeds from issuance of common stock upon initial public offering, net of issuance costs |
410,824 | — | — | |||||||||
| Proceeds from issuance of preferred stock, net of issuance costs |
— | 84,830 | 19,964 | |||||||||
| Repurchase of unvested common stock related to early exercised shares |
— | — | (80 | ) | ||||||||
| Proceeds from issuance of common stock upon exercise of stock options |
3,766 | 1,798 | 1,092 | |||||||||
|
|
|
|
|
|
|
|||||||
| Net cash provided by financing activities |
414,590 | 105,367 | 20,583 | |||||||||
|
|
|
|
|
|
|
|||||||
| Effect of exchange rates on changes in cash, cash equivalents, and restricted cash |
(45 | ) | (18 | ) | (14 | ) | ||||||
|
|
|
|
|
|
|
|||||||
| Net increase in cash, cash equivalents, and restricted cash |
406,405 | 22,231 | 6,114 | |||||||||
| Cash, cash equivalents, and restricted cash at beginning of year |
70,088 | 47,857 | 41,743 | |||||||||
|
|
|
|
|
|
|
|||||||
| Cash, cash equivalents, and restricted cash at end of year |
$ | 476,493 | $ | 70,088 | $ | 47,857 | ||||||
|
|
|
|
|
|
|
|||||||
| Supplemental disclosures of cash flow information: |
||||||||||||
| Cash paid for interest |
$ | 2,250 | $ | 1,824 | $ | 658 | ||||||
|
|
|
|
|
|
|
|||||||
| Cash paid for taxes |
$ | 22 | $ | 6 | $ | — | ||||||
|
|
|
|
|
|
|
|||||||
| Noncash investing and financing activities |
||||||||||||
| Purchases of property and equipment included in accounts payable and accrued expenses and other current liabilities |
$ | 4,492 | $ | 2,260 | $ | 250 | ||||||
|
|
|
|
|
|
|
|||||||
| Conversion of convertible preferred stock into common stock upon initial public offering |
$ | 243,244 | $ | — | $ | — | ||||||
|
|
|
|
|
|
|
|||||||
| Purchase of technology licenses under financing arrangement |
$ | 22,099 | $ | — | $ | — | ||||||
|
|
|
|
|
|
|
|||||||
The accompanying notes are an integral part of these consolidated financial statements.
108
Table of Contents
10x Genomics, Inc.
Notes to Consolidated Financial Statements
| 1. | Description of Business and Basis of Presentation |
Organization and Description of Business
10x Genomics, Inc. (the “Company”) was incorporated in the state of Delaware on July 2, 2012. The Company’s integrated solutions include the Company’s Chromium instruments, which are referred to as “instruments,” its enzymes, reagents, microfluidic chips and other consumable products, which are referred to as “consumables,” and software for analyzing biological systems. These solutions guide customers through the workflow from sample preparation to next-generation sequencing to subsequent analysis and visualization. Each of the Company’s solutions is designed to interrogate a major class of biological information that is impactful to researchers. The Company began commercial and manufacturing operations and selling its instruments and consumables in 2015. The Company is headquartered in Pleasanton, California and has wholly-owned subsidiaries in Sweden, Netherlands, Singapore, Germany and China.
Initial Public Offering
The Company’s registration statement on Form S-1 related to its initial public offering (“IPO”) was declared effective on September 11, 2019 by the Securities and Exchange Commission (“SEC”), and the Company’s Class A common stock began trading on the Nasdaq Global Select Market on September 12, 2019. On September 16, 2019, the Company completed its IPO, in which the Company sold 11,500,000 shares of Class A common stock (which included 1,500,000 shares that were offered and sold pursuant to the full exercise of the IPO underwriters’ option to purchase additional shares) at a price to the public of $39.00 per share. Including the option exercise, the Company received aggregate net proceeds of $410.8 million after deducting offering costs, underwriting discounts and commissions of $37.7 million.
Immediately prior to the completion of the IPO, 67,704,278 shares of convertible preferred stock then outstanding converted into an equivalent number of shares of Class B common stock, 8,050,000 shares of Historical Class A common stock converted into an equivalent number of shares of Class B common stock, and 8,095,382 shares of Historical Class B common stock converted into an equivalent number of shares of Class A common stock. The Company has reflected the renaming of Historical Class A common stock and Historical Class B common stock to Class B common stock and Class A common stock, respectively, throughout the document and all instances of Class A common stock and Class B common stock reflect this change. Immediately prior to the completion of the IPO, the Company filed its Amended and Restated Certificate of Incorporation, which authorizes a total of 1,000,000,000 shares of Class A common stock, 100,000,000 shares of Class B common stock and 100,000,000 shares of preferred stock. During the third quarter of 2019, 484,484 shares of Class B common stock were converted to Class A common stock. As of December 31, 2019, Class A common stock and Class B common stock issued and outstanding was 20,972,166 and 75,269,430, respectively. Each share of Class A common stock is entitled to one vote per share. Each share of Class B common stock is entitled to ten votes per share and is convertible at any time into one share of Class A common stock.
Basis of Presentation
The consolidated financial statements, which include the Company’s accounts and the accounts of its wholly-owned subsidiaries, are prepared in accordance with U.S. generally accepted accounting principles (or “GAAP”). All intercompany transactions and balances have been eliminated.
Liquidity
While the Company generated positive cash flows from operations of $34.6 million for the year ended December 31, 2019, the Company has incurred significant losses and has historically had negative cash flows
109
Table of Contents
from operations. As of December 31, 2019, the Company had unrestricted cash and cash equivalents of $424.2 million and an accumulated deficit of $262.4 million. Management expects to continue to incur significant expenses for the foreseeable future and to incur operating losses in the near term while the Company makes investments to support its anticipated growth. The Company believes that its cash and cash equivalents balance as of December 31, 2019 provides sufficient capital resources to continue its operations for at least 12 months from the issuance date of the accompanying consolidated financial statements.
| 2. | Summary of Significant Accounting Policies |
Use of Estimates
The preparation of financial statements in conformity with GAAP requires management to make judgments, estimates and assumptions that affect the reported amounts of assets and liabilities at the date of the financial statements, disclosure of contingent liabilities, and the reported amounts of revenue and expense. These judgments, estimates and assumptions are used for, but not limited to, revenue recognition, inventory valuation and write-downs, loss contingencies, accounting for assets acquisitions and the valuation of stock-based compensation awards. The Company bases its estimates on various factors and information, which may include, but are not limited to, history and prior experience, the Company’s forecasts and future plans, current economic conditions and information from third-party professionals that management believes to be reasonable under the circumstances, the results of which form the basis for making judgments about the carrying value of assets and liabilities and recorded amounts of expenses that are not readily apparent from other sources. To the extent there are material differences between the Company’s estimates and the actual results, the Company’s future consolidated results of operation may be affected.
Segment Information
The Company operates as a single operating segment. The Company’s chief operating decision maker, its Chief Executive Officer, manages the Company’s operations on a consolidated basis for the purposes of allocating resources, making operating decisions and evaluating financial performance.
Cash Equivalents and Restricted Cash
The Company considers all highly liquid investments with an original maturity of three months or less from the date of purchase to be cash equivalents. Cash equivalents consist primarily of amounts invested in money market funds and are stated at fair value.
Restricted cash mainly represents $5.0 million of cash on deposit with a financial institution as security for a letter of credit outstanding for the benefit of the landlord related to the Company’s noncancelable operating lease for its corporate headquarters (see “—Commitments and Contingencies” below), $45.2 million of cash on deposit with a financial institution in connection with the issuance of a bond related to The 2015 Delaware Action (see “—Commitments and Contingencies” below), and $2.1 million of cash held in escrow related to royalties on certain sales pursuant to the terms of The 2015 Delaware Action. The restricted cash related to the letter of credit is classified as noncurrent restricted cash on the consolidated balance sheets based on the term of the underlying lease.
The following table provides a reconciliation of cash, cash equivalents and restricted cash reported on the consolidated balance sheets that sum to the total of the same amounts shown in the consolidated statements of cash flows (in thousands):
| Year Ended December 31, | ||||||||||||
| 2019 | 2018 | 2017 | ||||||||||
| Cash and cash equivalents |
$ | 424,166 | $ | 65,080 | $ | 47,857 | ||||||
| Restricted cash |
52,327 | 5,008 | — | |||||||||
|
|
|
|
|
|
|
|||||||
| Total cash, cash equivalents and restricted cash |
$ | 476,493 | $ | 70,088 | $ | 47,857 | ||||||
|
|
|
|
|
|
|
|||||||
110
Table of Contents
Fair Value of Financial Instruments
The Company determines the fair value of an asset or liability based on the assumptions that market participants would use in pricing the asset or liability in an orderly transaction between market participants at the measurement date. The identification of market participant assumptions provides a basis for determining what inputs are to be used for pricing each asset or liability.
A fair value hierarchy has been established which gives precedence to fair value measurements calculated using observable inputs over those using unobservable inputs. This hierarchy prioritized the inputs into three broad levels as follows:
Level 1: Quoted prices in active markets for identical instruments
Level 2: Other significant observable inputs (including quoted prices in active markets for similar instruments)
Level 3: Significant unobservable inputs (including assumptions in determining the fair value of certain investments)
Money market funds are highly liquid investments and are actively traded. The pricing information for the Company’s money market funds are readily available and can be independently validated as of the measurement date. This approach results in the classification of these securities as Level 1 of the fair value hierarchy. There were no transfers between Levels 1, 2 or 3 for any of the periods presented. As of December 31, 2019 and December 31, 2018, the Company held $398.5 million and $44.5 million in money market funds, respectively, with no unrealized gains or losses.
The Company has issued common stock warrants for which fair value is determined using Level 3 inputs, see discussion in Note 8.
Accounts Receivable, Net
Accounts receivable consist of amounts due from customers for the sales of products and services. The Company reviews its accounts receivable and provides allowances of specific amounts if collectability is no longer reasonably assured based on historical experience and specific customer collection issues. The allowance for doubtful accounts was $0.3 million as of December 31, 2018. There was no allowance for doubtful accounts as of December 31, 2019.
Business Concentrations
The Company’s instruments are mostly assembled and tested by a single contract manufacturer in the United States. The Company’s agreement with the contract manufacturer expires in 2020 and may be terminated by either party for any reason by providing the other party with at least 30 days written notice. The Company’s agreement with the contract manufacturer contains purchase commitments. In addition, the Company is reliant on several suppliers for key components for its reagent kits. A significant disruption in the operations of the contract manufacturer or suppliers may impact the production of the Company’s products for a substantial period of time, which could have a material adverse effect on its business, financial condition and results of operations.
Concentrations
Financial instruments that potentially subject the Company to credit risk consist of cash equivalents and accounts receivable. The Company’s cash and cash equivalents are primarily held with a large financial institution in the United States and deposits exceed the Federal Deposit Insurance Corporation’s insurance limit. The Company’s debt is with this same financial institution. The Company performs periodic evaluations of the risks associated with its investments and the relative credit standing of this financial institution.
111
Table of Contents
The Company performs ongoing credit evaluations of its customers’ financial condition. The Company does not require collateral from its customers but may require upfront payments from certain customers. The Company has not experienced significant credit losses to date. For the years ended December 31, 2019, 2018, and 2017, no single customer represented more than 10% of revenue. As of December 31, 2019 and December 31, 2018, no single customer represented more than 10% of the Company’s outstanding accounts receivable.
Substantially all the Company’s long-lived assets are located in the United States.
Inventory
Inventory is recorded at the lower of cost, determined on a first-in, first-out basis, or net realizable value. The Company uses judgment to analyze and determine if the composition of its inventory is obsolete, slow-moving or unsalable and frequently reviews such determinations. The Company writes down specifically identified unusable, obsolete, slow-moving or known unsalable inventory in the period that it is first recognized by using a number of factors including product expiration dates, open and unfulfilled orders and sales forecasts. Any write-down of its inventory to net realizable value establishes a new cost basis and will be maintained even if certain circumstances suggest that the inventory is recoverable in subsequent periods. Costs associated with the write-down of inventory are recorded to cost of revenue on the Company’s consolidated statements of operations.
Property and Equipment, Net
Property and equipment, net is stated at cost, net of accumulated depreciation. Depreciation is computed using the straight-line method based on the estimated useful lives of the assets. Assets held under capital leases are recorded at the lower of the net present value of the minimum lease payments or the fair value of the leased assets at the inception of the lease. Amortization expense is computed using the straight-line method over the shorter of the estimated useful lives of the leased assets or the period of the related lease. Amortization of assets under capital leases is included in depreciation expense. The estimated useful lives of the Company’s property and equipment are as follows:
| Useful Life | ||||
| Laboratory equipment and machinery |
3 – 5 years | |||
| Computer equipment |
2 – 3 years | |||
| Furniture and fixtures |
3 years | |||
| Leasehold improvements |
1 – 10 years | |||
Impairment of Long-Lived Assets
The Company evaluates long-lived assets, such as property and equipment and intangible assets, for impairment whenever events or changes in circumstances indicate that the carrying value of an asset may not be recoverable. If indicators of impairment exist and the undiscounted future cash flows that the assets are expected to generate are less than the carrying value of the assets, the Company reduces the carrying amount of the assets to their estimated fair values based on a discounted cash flow approach or, when available and appropriate, to comparable market values. There were no impairment losses recorded for the years ended December 31, 2019 and December 31, 2018.
Product Warranties
The Company generally provides a one-year warranty on its instruments. The Company reviews its exposure to estimated warranty obligations associated with instrument sales and establishes an accrual based on historical product failure rates and actual warranty costs incurred. This expense is recorded as a component of cost of revenue in the consolidated statements of operations and comprehensive loss.
112
Table of Contents
Deferred Revenue
Deferred revenue consists of payments received in advance of revenue recognition primarily related to instrument service agreements, also referred to as extended warranties. Revenue under these agreements is recognized over the related service period. Deferred revenue that will be recognized during the 12 months following the balance sheet date is recorded as current portion of deferred revenue and the remaining portion is recorded as long term.
Accrued Contingent Liabilities
Accrued contingent liabilities represents the Company’s estimates of possible losses on pending litigation, including related accrued royalties that are both probable and reasonably estimable. See Note 7.
Revenue Recognition
The Company generates revenue from sales of products and services. The Company’s products consist of instruments and consumables.
The revenue recognition accounting policy described below relates to revenue transactions from January 1, 2019 and onward, which are accounted for in accordance with Accounting Standards Codification Topic 606 – Revenue from Contracts with Customers
The Company recognizes revenue when control of the products and services is transferred to its customers in an amount that reflects the consideration it expects to receive from its customers in exchange for those products and services. This process involves identifying the contract with a customer, determining the performance obligations in the contract, determining the contract price, allocating the contract price to the distinct performance obligations in the contract and recognizing revenue when the performance obligations have been satisfied. A performance obligation is considered distinct from other obligations in a contract when it provides a benefit to the customer either on its own or together with other resources that are readily available to the customer and is separately identified in the contract. The Company considers a performance obligation satisfied once it has transferred control of a good or service to the customer, meaning the customer has the ability to use and obtain the benefit of the good or service.
Revenue from product sales is recognized when control of the product is transferred, which is generally upon shipment to the customer. In instances where right of payment or transfer of title is contingent upon the customer’s acceptance of the product, revenue is deferred until all acceptance criteria have been met. Instrument service agreements, which relate to extended warranties, are typically entered into for one-year terms, following the expiration of the standard one-year warranty period. Revenue for extended warranties is recognized ratably over the term of the extended warranty period as a stand ready performance obligation. Revenue is recorded net of discounts, distributor commissions and sales taxes collected on behalf of governmental authorities. Customers are invoiced generally upon shipment, or upon order for services, and payment is typically due within 45 days. Cash received from customers in advance of product shipment or providing services is recorded as a contract liability. The Company’s contracts with its customers generally do not include rights of return or a significant financing component.
The Company regularly enters into contracts that include various combinations of products and services which are generally distinct and accounted for as separate performance obligations. The transaction price is allocated to each performance obligation in proportion to its standalone selling price. The Company determines standalone selling price using average selling prices with consideration of current market conditions. If the product or service has no history of sales or if the sales volume is not sufficient, the Company relies upon prices set by management, adjusted for applicable discounts.
113
Table of Contents
The revenue recognition accounting policy described below relates to revenue transactions prior to January 1, 2019, which are accounted for in accordance with Accounting Standards Codification Topic 605 – Revenue Recognition
The Company recognizes revenue when persuasive evidence of an arrangement exists, delivery has occurred or services have been rendered, the price to the customer is fixed or determinable, and collectability is reasonably assured. The Company assesses collectability based on factors such as the customer’s creditworthiness and past collection history, if applicable. If collection is not reasonably assured, revenue recognition is deferred until receipt of payment. The Company also assesses whether a price is fixed or determinable by, among other things, reviewing contractual terms and conditions related to payment. Delivery occurs when there is a transfer of title and risk of loss passes to the customer.
Certain of the Company’s sales arrangements involve the delivery of multiple products and services within contractually binding arrangements. Multiple-deliverable sales transactions typically consist of the sale and delivery of one or more instruments and consumables together and may include an instrument service agreement.
For sales arrangements that include multiple deliverables, the Company uses the stated contractual price for its instrument service agreements as its best estimate of selling price, if and when sold, and allocates the remaining contract consideration at the inception of the contract to the other units of accounting based upon their relative selling price. The Company may use its best estimate of selling price for individual deliverables when vendor specific objective evidence or third-party evidence is unavailable. A delivered item is considered to be a separate unit of accounting when it has value to the customer on a stand-alone basis.
The Company’s products are typically delivered together or within a short time frame, generally within one to three months of the contract date. Instrument service agreements, which relate to extended warranties, are typically entered into for one-year terms, following the expiration of the standard one-year warranty period. The Company’s products are generally sold without the right of return. Amounts received before revenue recognition criteria are met are classified on the consolidated balance sheets as deferred revenue.
Cost of Revenue
Costs of revenue primarily consist of manufacturing costs incurred in the production process, including personnel and related costs, component materials, labor and overhead, packaging and delivery costs and allocated costs including facilities and information technology. In addition, costs of product revenue includes royalty costs for licensed technologies included in the Company’s products, warranty costs and provisions for slow-moving and obsolete inventory. In addition, beginning in November 2018, cost of revenue includes estimated accrued royalties related to the Bio-Rad litigation. See Note 7.
Shipping and Handling Costs
Shipping and handling charged to customers are recorded as revenue. Shipping and handling costs are included in the Company’s cost of revenue.
Research and Development
Research and development costs are expensed in the period incurred. Research and development expense consists of personnel and related costs, independent contractor costs, laboratory supplies, equipment maintenance, prototype and materials expenses, amortization of developed technology and intangibles and allocated costs including facilities and information technology.
See Note 3 for discussion of in-process research and development included on the consolidated statements of operations.
114
Table of Contents
Advertising Costs
Advertising costs are expensed as incurred. The Company incurred advertising costs of $1.5 million, $0.7 million, and $0.2 million for the years ended December 31, 2019, 2018, and 2017, respectively.
Stock-Based Compensation
The Company estimates the fair value of share-based payment awards granted to employees and directors on the grant date using the Black-Scholes option-pricing model. The fair value of share-based payment awards is recognized as compensation expense on a straight-line basis over the requisite service period in which the awards are expected to vest and forfeitures are recognized as they occur. Share-based payment awards that include a service condition and a performance condition are considered expected to vest when the performance condition is probable of being met.
The Black-Scholes model considers several variables and assumptions in estimating the fair value of stock-based awards. These variables include the per share fair value of the underlying common stock, exercise price, expected term, risk-free interest rate, expected annual dividend yield and the expected stock price volatility over the expected term. For all stock options granted, the Company calculated the expected term using the simplified method for “plain vanilla” stock option awards. The Company had no publicly available stock price information prior to its IPO and limited publicly available stock price information subsequent to its IPO and therefore, the Company has used the historical volatility of the stock price of similar publicly traded peer companies. The risk-free interest rate is based on the yield available on U.S. Treasury zero-coupon issues similar in duration to the expected term of the equity-settled award.
Stock-based compensation expense for nonemployee stock options is measured based on fair market value using the Black-Scholes option pricing model and is recorded as the options vest. Prior to January 1, 2019, nonemployee stock options subject to vesting were revalued periodically over the requisite service period, which was generally the same as the vesting term of the award. From January 1, 2019, the grant date fair market value of nonemployee stock options is recognized in the consolidated statements of operations on a straight-line basis over the requisite service period and forfeitures are recognized as they occur.
Foreign Currency
For foreign subsidiaries where the functional currency is the local currency, assets and liabilities are translated to the U.S. dollar using month-end exchange rates, and revenue and expenses using average exchange rates. The adjustments resulting from these foreign currency translations are recorded in accumulated other comprehensive loss.
For entities where the functional currency is the U.S. dollar, monetary assets and liabilities are remeasured using exchange rates in effect at the balance sheet dates and non-monetary assets and liabilities are remeasured at historical exchange rates. Revenue and expenses are remeasured at the average exchange rates for the period. Gains or losses from foreign currency remeasurement are included in other income (expense), net in the consolidated statements of operations and comprehensive loss. The Company recognized foreign currency transaction gains of $0.1 million for the year ended December 31, 2019, foreign currency transaction losses of $0.3 million for the year ended December 31, 2018, and foreign currency transaction gains of $0.1 million for the year ended December 31, 2017.
Income Taxes
The Company uses the asset and liability method of accounting for income taxes, in which deferred tax assets and liabilities are recognized for the future tax consequences attributable to the differences between the financial statement carrying amounts of existing assets and liabilities and their respective tax bases. Deferred tax
115
Table of Contents
assets and liabilities are measured using the enacted tax rates expected to apply to taxable income in the years in which those temporary differences are expected to be reversed. The effect on deferred tax assets and liabilities of a change in tax rates is recognized as income in the period that includes the enactment date. A valuation allowance is established if it is more likely than not that all or a portion of the deferred tax asset will not be realized.
The Company’s tax positions are subject to income tax audits. The Company recognizes the tax benefit of an uncertain tax position only if it is more likely than not that the position is sustainable upon examination by the taxing authority, based on the technical merits. The tax benefit recognized is measured as the largest amount of benefit which is more likely than not (greater than 50% likely) to be realized upon settlement with the taxing authority. The Company recognizes interest accrued and penalties related to unrecognized tax benefits in its tax provision.
The Company calculates the current and deferred income tax provision based on estimates and assumptions that could differ from the actual results reflected in income tax returns filed in subsequent years. Adjustments based on filed income tax returns are recorded when identified. The amount of income tax paid is subject to examination by U.S. federal and state tax authorities. The estimate of the potential outcome of any uncertain tax issue is subject to management’s assessment of the relevant risks, facts and circumstances existing at that time. To the extent the assessment of such tax position changes, the change in estimate is recorded in the period in which the determination is made.
Net Loss Per Share
Net loss per share is computed using the two-class method required for multiple classes of common stock and participating securities. The rights, including the liquidation and dividend rights and sharing of losses, of the Class A common stock and Class B common stock are identical, other than voting rights. As the liquidation and dividend rights and sharing of losses are identical, the undistributed earnings are allocated on a proportionate basis and the resulting net loss per share will, therefore, be the same for both Class A and Class B common stock on an individual or combined basis.
The Company’s participating securities included the Company’s convertible preferred stock, as the holders are entitled to receive noncumulative dividends on a pari passu basis in the event that a dividend is paid on common stock. The Company also considers any shares issued on the early exercise of stock options subject to repurchase to be participating securities because holders of such shares have non-forfeitable dividend rights in the event a dividend is paid on common stock. The holders of convertible preferred stock, as well as the holders of early exercised shares subject to repurchase, do not have a contractual obligation to share in losses.
Basic net loss per share is computed by dividing net loss by the weighted-average number of shares of common stock outstanding during the period, adjusted for outstanding shares that are subject to repurchase.
For the calculation of diluted net loss per share, basic net loss per share is adjusted by the effect of dilutive securities, including convertible preferred stock, awards under the Company’s equity compensation plan and common stock warrants. Diluted net loss per share is computed by dividing net loss by the weighted-average number of shares of common stock outstanding. For periods in which the Company reports net losses, diluted net loss per share is the same as basic net loss per share because potentially dilutive shares of common stock are not assumed to have been issued if their effect is anti-dilutive.
Acquisitions
The Company evaluates acquisitions of assets and other similar transactions to assess whether or not the transaction should be accounted for as a business combination or asset acquisition by first applying a screen to determine if substantially all of the fair value of the gross assets acquired is concentrated in a single identifiable
116
Table of Contents
asset or group of similar identifiable assets. If the screen is met the transaction is accounted for as an asset acquisition. If the screen is not met, further determination is required as to whether or not the Company has acquired inputs and processes that have the ability to create outputs which would meet the requirements of a business.
The Company accounts for an asset acquisition under Accounting Standards Codification (“ASC”), Business Combinations Topic 805, Subtopic 50, which requires the acquiring entity in an asset acquisition to recognize net assets based on the cost to the acquiring entity on a relative fair value basis, which includes transaction costs in addition to consideration given. Goodwill is not recognized in an asset acquisition; any excess consideration transferred over the fair value of the net assets acquired is allocated to the non-monetary identifiable assets based on relative fair values. In-process research and development expense is expensed as incurred provided there is no alternative future use.
Contingent consideration payments in asset acquisitions are recognized when the contingency is resolved and the consideration is paid or becomes payable (unless the contingent consideration meets the definition of a derivative, in which case the amount becomes part of the basis in the asset acquired). Upon recognition of the contingent consideration payment, the amount is included in the cost of the acquired asset or group of assets.
Recently Adopted Accounting Pronouncements
In May 2014, the FASB issued ASU No. 2014-09, Revenue from Contracts with Customers (Topic 606), which supersedes the revenue recognition requirements in ASC 605, Revenue Recognition. This standard is based on the principle that revenue is recognized to depict the transfer of goods or services to customers in an amount that reflects the consideration to which the entity expects to be entitled in exchange for those goods or services. The standard also requires additional disclosure about the nature, amount, timing and uncertainty of revenue and cash flows arising from customer contracts, including significant judgments and changes in judgments and assets recognized from costs incurred to obtain or fulfill a contract. The Company adopted this standard as of January 1, 2019 using the modified retrospective approach, which did not have a material impact on its consolidated financial statements.
In October 2016, the FASB issued ASU No. 2016-16, Income Taxes (Topic 740): Intra-Entity Transfers of Assets Other Than Inventory. This standard will require entities to recognize the income tax consequences of an intra-entity transfer of an asset other than inventory when the transfer occurs instead of when the asset is sold. This standard is effective for annual periods beginning after December 15, 2018. The Company adopted this standard on January 1, 2019, which did not have a material impact to its consolidated financial statements.
In June 2018, the FASB issued ASU 2018-07, Compensation-Stock Compensation (Topic 718): Improvements to Nonemployee Share-Based Payment Accounting. This standard expands the scope of Topic 718, Compensation—Stock Compensation (which currently only includes share-based payments to employees) to include share-based payments issued to nonemployees for goods or services. Consequently, the accounting for share-based payments to nonemployees and employees will be substantially aligned. This standard is effective for annual periods beginning after December 15, 2019. The Company early adopted this standard on January 1, 2019, which did not have a material impact on its consolidated financial statements.
Recently Issued Accounting Pronouncements
In February 2016, the FASB issued ASU No. 2016-02, Leases (Topic 842). This standard requires substantially all leases be recognized by lessees on their balance sheet as a right-of-use asset and corresponding lease liability, including leases currently accounted for as operating leases. The Company will early adopt this standard on January 1, 2020 using the optional transition method by recognizing a cumulative effect adjustment to the opening balance of accumulated deficit as of that date. The Company expects to recognize right-to-use assets in the range of $33 million to $43 million and corresponding lease liabilities in the range of $49 million to
117
Table of Contents
$59 million at the date of adoption and does not expect the adoption to significantly impact its consolidated statement of operations and comprehensive loss or cash flows. The Company also expects to elect the “package of practical expedients”, which permits the Company to not reassess under this standard its prior conclusions about lease identification, lease classification and initial direct costs. In addition, the Company expects to elect the short-term lease recognition exemption for all leases that qualify.
In June 2016, the FASB issued ASU No. 2016-13, Credit losses (Topic 326), which sets forth a “current expected credit loss” (CECL) model which requires the Company to measure all expected credit losses for financial instruments held at the reporting date based on historical experience, current conditions, and reasonable supportable forecasts. This replaces the existing incurred loss model and is applicable to the measurement of credit losses on financial assets measured at amortized cost and applies to some off-balance sheet credit exposures. The standard is effective for fiscal years beginning after December 15, 2022 and interim periods within those fiscal years. Early adoption is permitted. The Company is currently evaluating the impact of adopting this standard on its consolidated financial statements.
In August 2018, the FASB issued ASU 2018-15, Intangibles – Goodwill and Other – Internal Use Software (Subtopic 350-40) – Customer’s Accounting for Implementation Costs Incurred in a Cloud Computing Arrangement That is a Service Contract, which aligns the accounting for implementation costs incurred in a hosting arrangement that is a service contract with the accounting for implementation costs incurred to develop or obtain internal-use software under ASC 350-40, in order to determine which costs to capitalize and recognize as an asset and which costs to expense. This standard is effective for annual periods beginning after December 15, 2020, and interim periods within annual periods beginning after December 15, 2021. Early adoption is permitted, including adoption in any interim period. This standard can be applied either retrospectively or prospectively to all implementation costs incurred after the date of adoption. The Company is currently evaluating the impact of adopting this standard on its consolidated financial statements.
In November 2019, the FASB issued ASU 2019-08, Compensation – Stock Compensation (Topic 718) and Revenue from Contracts with Customers (Topic 606), which expands the scope of ASC Topic 718 to provide guidance for share-based payment awards granted to a customer in conjunction with selling goods or services accounted for under Topic 606. This standard is effective for fiscal years beginning after December 15, 2019 and interim periods within those fiscal years. The Company is currently evaluating the impact of adopting this standard on its consolidated financial statements.
In December 2019, the FASB issued ASU No. 2019-12, Income Taxes (Topic 740), which simplifies the accounting for income taxes, primarily by eliminating certain exceptions to the guidance in ASC 740. This ASU is effective for fiscal periods beginning after December 15, 2021. The Company is currently evaluating this guidance and the impact it may have on the Company’s consolidated financial statements.
| 3. | Asset Acquisitions |
In November 2018, the Company purchased all of the outstanding shares of Spatial Transcriptomics Holdings AB (“Spatial Transcriptomics”), for $38.6 million inclusive of acquisition costs of $0.5 million. The patents acquired in this transaction will enable the Company to develop spatial products. The transaction was accounted for as an asset acquisition. In connection with this acquisition, the Company acquired patents, trademarks and customer relationships. The patents acquired were allocated a value of $36.9 million. Accordingly, the Company recognized a charge of $36.9 million related to the transaction which is included as a component of in-process research and development on the consolidated statements of operations and comprehensive loss. The Company recognized a total of $0.4 million in intangible assets related to acquired trademarks and customer relationships which are included in other assets on the consolidated balance sheets. The Company must also make contingent payments to the sellers of Spatial Transcriptomics of a low double-digit percentage of revenue from certain spatial-related technology sales for the years ended December 31, 2019 through December 31, 2022, which are subject to continuing service requirements. Due to continuing service
118
Table of Contents
requirements pertaining to earn the contingent payments, the contingent payments have been deemed to be a compensation arrangement which will be accounted for if and when earned.
The following table summarizes the value of assets acquired and liabilities assumed (in thousands):
| Assets Acquired and Liabilities Assumed |
||||
| In-process research and development |
$ | 36,899 | ||
| Intangible assets |
425 | |||
| Other assets and liabilities |
1,237 | |||
|
|
|
|||
| Total net assets acquired |
$ | 38,561 | ||
|
|
|
In March 2018, the Company acquired all of the outstanding shares of Epinomics Inc. (“Epinomics”) for $22.2 million inclusive of acquisition costs of $0.3 million. Of this amount, $6.2 million was due upon close of the acquisition and $16.0 million was due upon the amendment and assignment of a license agreement with the Board of Trustees of the Leland Stanford Junior University which occurred in August 2018. The technology licenses acquired in this transaction will enable the Company to develop products for epigenetics research. The transaction was accounted for as an asset acquisition. As the technology licenses acquired did not have alternative future use, the Company recognized charges of $22.2 million during the year ended December 31, 2018 related to this transaction which are included as a component of in-process research and development on the consolidated statements of operations and comprehensive loss.
| 4. | Other Financial Statement Information |
Inventory
Inventory was comprised of the following (in thousands):
| Year Ended December 31, | ||||||||
| 2019 | 2018 | |||||||
| Purchased materials |
$ | 6,436 | $ | 3,052 | ||||
| Work in progress |
3,996 | 2,553 | ||||||
| Finished goods |
4,838 | 2,965 | ||||||
|
|
|
|
|
|||||
| Inventory |
$ | 15,270 | $ | 8,570 | ||||
|
|
|
|
|
|||||
Property and Equipment, Net
Property and equipment, net consisted of the following (in thousands):
| Year Ended December 31, | ||||||||
| 2019 | 2018 | |||||||
| Laboratory equipment and machinery |
$ | 22,400 | $ | 14,616 | ||||
| Computer equipment |
4,991 | 3,303 | ||||||
| Furniture and fixtures |
4,143 | 1,002 | ||||||
| Leasehold improvements |
33,936 | 3,342 | ||||||
| Construction in progress |
2,406 | 2,947 | ||||||
|
|
|
|
|
|||||
| Total property and equipment |
67,876 | 25,210 | ||||||
| Less: accumulated depreciation and amortization |
(19,055 | ) | (14,083 | ) | ||||
|
|
|
|
|
|||||
| Property and equipment, net |
$ | 48,821 | $ | 11,127 | ||||
|
|
|
|
|
|||||
Depreciation expense was $6.7 million, $3.8 million and $4.3 million for the years ended December 31, 2019, 2018, and 2017, respectively.
119
Table of Contents
Intangible Assets, Net
In October 2019, as part of the 2019 Becton Dickinson Settlement and Patent Cross License Agreement with Becton, Dickinson and Company and Cellular Research, Inc. (“BD Entities”), the Company was granted a worldwide royalty-free, nonexclusive license to certain intellectual property from the BD Entities for a purchase price of $25.0 million, to be paid in annual amounts of $6.25 million over four years beginning in January 2020. The Company recognized the present value of the annual payments of $21.1 million as a liability as of the date of the agreement, which is included within accrued expenses and other current liabilities and accrued license fee. The Company recognized the estimated fair value of the license received of $22.1 million as an intangible asset which is being amortized to cost of revenue over its estimated useful life.
Intangible assets, net consisted of the following (in thousands):
| Year Ended December 31, | ||||||||||||||||||||||||
| 2019 | 2018 | |||||||||||||||||||||||
| Gross Carrying Amount |
Accumulated Amortization |
Intangibles, Net |
Gross Carrying Amount |
Accumulated Amortization |
Intangibles, Net |
|||||||||||||||||||
| Technology licenses |
$ | 22,504 | $ | (440 | ) | $ | 22,064 | $ | 379 | $ | (136 | ) | $ | 243 | ||||||||||
| Customer relationships |
204 | (32 | ) | 172 | 204 | (3 | ) | 201 | ||||||||||||||||
| Trademarks |
204 | (74 | ) | 130 | 204 | (6 | ) | 198 | ||||||||||||||||
|
|
|
|
|
|
|
|
|
|
|
|
|
|||||||||||||
| Total intangible assets, net |
$ | 22,912 | $ | (546 | ) | $ | 22,366 | $ | 787 | $ | (145 | ) | $ | 642 | ||||||||||
|
|
|
|
|
|
|
|
|
|
|
|
|
|||||||||||||
The estimated annual amortization of intangible assets for the next five years is shown below (in thousands).
| Estimated Annual Amortization |
||||
| 2020 |
$ | 1,630 | ||
| 2021 |
1,625 | |||
| 2022 |
1,563 | |||
| 2023 |
1,532 | |||
| 2024 |
1,503 | |||
| 2025 |
1,500 | |||
| Thereafter |
13,013 | |||
|
|
|
|||
| Total |
$ | 22,366 | ||
|
|
|
|||
Actual amortization expense to be reported in future periods could differ from these estimates as a result of acquisitions, divestitures and asset impairments, among other factors.
Accrued Compensation and Related Benefits
Accrued compensation and related benefits were comprised of the following (in thousands):
| Year Ended December 31, | ||||||||
| 2019 | 2018 | |||||||
| Accrued bonus |
$ | 6,154 | $ | 3,545 | ||||
| Accrued commissions |
2,473 | 2,299 | ||||||
| Other |
3,767 | 1,203 | ||||||
|
|
|
|
|
|||||
| Accrued compensation and related benefits |
$ | 12,394 | $ | 7,047 | ||||
|
|
|
|
|
|||||
120
Table of Contents
Accrued Expenses and Other Current Liabilities
Accrued expenses and other current liabilities were comprised of the following (in thousands):
| Year Ended December 31, | ||||||||
| 2019 | 2018 | |||||||
| Accrued legal expenses |
$ | 4,375 | $ | 1,769 | ||||
| Accrued license fee |
6,183 | — | ||||||
| Accrued royalties for licensed technologies |
2,025 | 1,571 | ||||||
| Accrued property and equipment |
3,885 | 990 | ||||||
| Accrued consulting |
1,173 | 741 | ||||||
| Product warranties |
467 | 804 | ||||||
| Customer deposits |
1,304 | 381 | ||||||
| Taxes payable |
1,087 | 738 | ||||||
| Other |
3,949 | 2,947 | ||||||
|
|
|
|
|
|||||
| Accrued expenses and other current liabilities |
$ | 24,448 | $ | 9,941 | ||||
|
|
|
|
|
|||||
Product Warranties
Changes in the reserve for product warranties were as follows (in thousands):
| Year Ended December 31, | ||||||||
| 2019 | 2018 | |||||||
| Beginning of period |
$ | 804 | $ | 174 | ||||
| Additions charged to cost of revenue |
741 | 1,685 | ||||||
| Repairs and replacements |
(1,078 | ) | (1,055 | ) | ||||
|
|
|
|
|
|||||
| End of period |
$ | 467 | $ | 804 | ||||
|
|
|
|
|
|||||
Revenue and Deferred Revenue
As of December 31, 2019, the aggregate amount of the transaction price allocated to remaining performance obligations was $4.1 million, of which approximately 80% is expected to be recognized to revenue in the next 12 months, with the remainder thereafter. These contract liabilities of $4.1 million consisted of deferred revenue related to extended warranty service agreements, and as of December 31, 2019, the short-term portion was $3.3 million. Revenue recorded during the year ended December 31, 2019 included $2.3 million of previously deferred revenue that was included in contract liabilities as of the adoption date of January 1, 2019.
A summary of the change in contract liabilities is as follows (in thousands):
| 2019 | ||||
| Balance as of January 1 |
$ | 3,497 | ||
| Revenue recognized that was included in the contract liability at the beginning of the year |
2,250 | |||
| Revenue deferred excluding amounts recognized as revenue during the period |
2,884 | |||
|
|
|
|||
| Balance as of December 31 |
$ | 4,131 | ||
|
|
|
|||
Contract assets as of the adoption date of January 1, 2019 and December 31, 2019 were not material.
121
Table of Contents
The following table represents revenue by source for the periods indicated (in thousands):
| Year Ended December 31, | ||||||||||||
| 2019 | 2018 | 2017 | ||||||||||
| Instruments |
$ | 34,945 | $ | 36,540 | $ | 24,467 | ||||||
| Consumables |
206,878 | 107,616 | 46,192 | |||||||||
| Services |
4,070 | 2,157 | 426 | |||||||||
|
|
|
|
|
|
|
|||||||
| Total revenue |
$ | 245,893 | $ | 146,313 | $ | 71,085 | ||||||
|
|
|
|
|
|
|
|||||||
The following table presents revenue by geography based on the location of the customer for the periods indicated (in thousands):
| Year Ended December 31, | ||||||||||||
| 2019 | 2018 | 2017 | ||||||||||
| North America |
$ | 139,758 | $ | 85,132 | $ | 43,622 | ||||||
| Europe, Middle East and Africa |
58,004 | 35,812 | 18,602 | |||||||||
| China |
29,920 | 15,075 | 3,171 | |||||||||
| Asia Pacific |
18,211 | 10,294 | 5,690 | |||||||||
|
|
|
|
|
|
|
|||||||
| Total revenue |
$ | 245,893 | $ | 146,313 | $ | 71,085 | ||||||
|
|
|
|
|
|
|
|||||||
Revenue for the United States, which is included in North America in the table above, was 54% and 55% of consolidated revenue for the years ended December 31, 2019 and 2018, respectively.
| 5. | Debt |
In September 2016, the Company entered into a loan and security agreement which includes a term loan and revolving line of credit facility, and initially borrowed $10.6 million as a term loan, known as Tranche A. In February 2018, the loan and security agreement was amended and restated. Under the terms of the amended and restated loan and security agreement, amounts available under Tranche A were increased to $30.0 million (the “Amended Tranche A”). As of the date of modification, the balance outstanding under Tranche A was $10.5 million. After giving consideration to the end of term payment, the Company borrowed an additional $19.5 million under the Amended Tranche A. Under the amended agreement, the Company had the option to borrow an additional $20.0 million as a term loan, known as the Amended Tranche B, beginning October 1, 2018 through June 30, 2019, or the date of an event of default if earlier, and the revolving line of credit facility was increased from $5.0 million to up to $25.0 million.
Monthly payments of interest were due under the Amended Tranche A term loan through June 30, 2019, with monthly installments of principal and interest due for 42 months thereafter. If the Amended Tranche B was borrowed, monthly installments of principal and interest were to be reduced to 36 months. In June 2019, the Company’s loan and security agreement was amended to extend the Company’s option to borrow the Amended Tranche B through December 31, 2019. This extended period expired with no amounts borrowed. Additionally, the interest-only period was extended to December 31, 2019, with monthly installments of principal and interest due for 36 months thereafter. The term loan accrues interest at the greater of the floating per annum rate equal to the greater of The Wall Street Journal prime rate plus 2.0% or 6.25%. Additionally, an end of term payment is due to the lender in the amount of $1.8 million upon maturity, prepayment or acceleration of the term loan, as amended. The end of term payment is accreted as additional interest expense over the term of the debt using the effective interest method. In connection with the amendment, the Company paid a one-time fee of $50,000 to the lender.
The term loan may be repaid prior to the maturity date, however, a prepayment fee of 3.0% of the outstanding principal balance would be due in addition to all outstanding principal and interest, if the prepayment
122
Table of Contents
is made before the first anniversary date of the loan closing date. This prepayment fee decreased to 2.0% after the first anniversary of the loan closing date. On the second anniversary date of the loan closing date, the prepayment fee decreases to 1.0% of the outstanding principal amount if paid after the second anniversary and prior to the maturity date.
The loan and security agreement provides the Company with a revolving line of credit of up to $25.0 million through December 2022. The amount available on the revolving line of credit is based on 80% of eligible receivables and is subject to a borrowing base calculation. Principal amounts outstanding under the revolving line of credit accrue interest at the greater of a floating per annum rate equal to the greater of The Wall Street Journal prime rate plus 0.25% or 4.5% and are repayable monthly. Upon termination of the agreement for any reason prior to the revolving credit facility’s maturity date, a termination fee of $250,000 would be due in addition to all outstanding principal and interest. Additionally, the revolving line of credit has a nonrefundable annual commitment fee of $62,500 payable on each anniversary date. In August 2019, the Company borrowed $11.0 million under the revolving line of credit. As of December 31, 2019, no amounts were outstanding under the revolving line of credit.
In connection with the amendment of the loan and security agreement, the Company issued the lender a warrant to purchase 125,000 Class A common shares with an exercise price per share of $1.62. The warrants had an estimated fair value of $150,000 which was recorded as a debt discount. The Company had previously issued warrants to purchase an aggregate of 141,099 additional Class A common shares in connection with the loan. Thus, following the amendment of the loan and security agreement, the Company had issued warrants to purchase an aggregate of 266,099 Class A common shares.
Amounts borrowed under the loan and security agreement are collateralized by all of the Company’s assets, except for intellectual property, but including the proceeds from the sale of any of the Company’s intellectual property. In addition, the Company provides a negative pledge regarding its intellectual property and may not encumber it without the lender’s consent. The loan and security agreement contains various covenants for reporting, protecting and obtaining adequate insurance coverage for assets collateralized and for coverage of business operations, and complying with requirements, including the payment of all necessary taxes and fees for all federal, state and local government entities. Immediately upon the occurrence and during the continuance of an event of default, including the noncompliance with the above covenants, the lender may increase the interest rate per annum by 5.0% above the rate that would be otherwise applicable; stop future loan advances; require the Company to deposit 105% of any undrawn letters of credit, or 110% if the letter of credit was denominated in a foreign currency; and take control over all assets collateralizing the loan and take necessary means to protect the collateral. The loan and security agreement contains a material adverse change clause, including terms for subjective acceleration.
The term loan borrowings were prepaid in full on February 20, 2020. As of December 31, 2019 and as of February 20, 2020, the Company was in compliance with all loan covenants.
123
Table of Contents
Aggregate annual payments due on the term loan as of December 31, 2019, were as follows (in thousands):
| 2020 |
11,744 | |||
| 2021 |
11,055 | |||
| 2022 |
12,170 | |||
|
|
|
|||
| Total payments |
34,969 | |||
| Less: amount representing interest |
(4,969 | ) | ||
|
|
|
|||
| Total term loan |
30,000 | |||
| Less: unamortized debt discount |
(281 | ) | ||
|
|
|
|||
| Total term loan, net of debt discount |
29,719 | |||
| Less: current portion |
(9,882 | ) | ||
|
|
|
|||
| Non-current portion |
$ | 19,837 | ||
|
|
|
| 6. | Income Tax |
Loss before provision for income taxes were as follows for the periods indicated (in thousands):
| Year Ended December 31, | ||||||||
| 2019 | 2018 | |||||||
| United States |
$ | (35,675 | ) | $ | (77,517 | ) | ||
| International |
4,642 | (34,881 | ) | |||||
|
|
|
|
|
|||||
| Total |
$ | (31,033 | ) | $ | (112,398 | ) | ||
|
|
|
|
|
|||||
The provision for income taxes was $0.2 million for the year ended December 31, 2019, which related to foreign and state income taxes. For the year ended December 31, 2018, the provision for income taxes was $0.1 million.
A reconciliation of the federal statutory income tax provision to the effective income tax provision is as follows for the periods indicated (in thousands):
| Year Ended December 31, | ||||||||
| 2019 | 2018 | |||||||
| Income tax provision at statutory rate |
$ | (6,517 | ) | $ | (23,604 | ) | ||
| State taxes, net |
(2,958 | ) | (4,479 | ) | ||||
| Tax credits |
(2,684 | ) | (1,631 | ) | ||||
| Foreign taxes |
101 | 41 | ||||||
| Stock-based compensation |
1,032 | 421 | ||||||
| Change in valuation allowance |
10,783 | 19,133 | ||||||
| Acquisition related expenses |
116 | 10,143 | ||||||
| Other |
345 | 63 | ||||||
|
|
|
|
|
|||||
| Total provision for income taxes |
$ | 218 | $ | 87 | ||||
|
|
|
|
|
|||||
124
Table of Contents
Deferred income taxes reflect the net tax effect of temporary differences between amounts recorded for financial reporting purposes and amounts used for tax purposes. The major components of deferred tax assets and liabilities are as follows as of the dates indicated (in thousands):
| Year Ended December 31, | ||||||||
| 2019 | 2018 | |||||||
| Deferred tax assets |
||||||||
| Net operating loss carryforwards |
$ | 28,878 | $ | 31,031 | ||||
| Research and development tax credits |
15,961 | 10,874 | ||||||
| Accruals and reserves |
23,804 | 12,612 | ||||||
| Other |
2,766 | 1,616 | ||||||
|
|
|
|
|
|||||
| Total deferred tax assets |
71,409 | 56,133 | ||||||
|
|
|
|
|
|||||
| Valuation allowance |
(66,456 | ) | (55,673 | ) | ||||
| Net deferred tax assets |
4,953 | 460 | ||||||
| Year Ended December 31, | ||||||||
| 2019 | 2018 | |||||||
| Deferred tax liabilities |
||||||||
| Fixed assets |
(4,946 | ) | (460 | ) | ||||
|
|
|
|
|
|||||
| Net deferred taxes |
$ | 7 | $ | — | ||||
|
|
|
|
|
|||||
As of December 31, 2019 and 2018, the Company maintained a full valuation allowance on its domestic net deferred tax assets. The domestic deferred tax assets predominantly relate to operating losses and tax credits. The domestic valuation allowance was estimated based on an assessment of both positive and negative evidence to determine whether it is more likely than not that deferred tax assets are recoverable. Such assessment is required on a jurisdiction-by-jurisdiction basis. The Company’s history of cumulative losses, along with expected future U.S. losses, required that a full valuation allowance be recorded against all domestic net deferred tax assets. In 2019, the Company determined it to be more likely than not that its Swedish deferred tax assets would be realized. Accordingly, the Company released its related foreign valuation allowance. The Company intends to maintain a full valuation allowance on domestic net deferred tax assets until sufficient positive evidence exists to support a reversal of the valuation allowance. The valuation allowance increased by $10.8 million and by $19.3 million for the years ended December 31, 2019 and 2018, respectively.
As of December 31, 2019, the Company had federal NOL carryforwards of approximately $110.7 million and federal tax credit carryforwards of approximately $12.3 million. The federal NOL carryforwards generated during and after fiscal 2018 totaling $6.5 million are carried forward indefinitely, while all others, along with the federal tax credit carryforwards, expire in years beginning in 2032. As of December 31, 2019, the Company had state net operating loss carryforwards of approximately $87 million, which begin to expire in 2032. In addition, the Company had state tax credit carryforwards of approximately $11 million, which do not expire.
The federal and state net operating losses and credit carryforwards are subject to change of ownership limitations provided by the Internal Revenue Code and similar state provisions. In general, if the Company experiences a greater than 50 percentage point aggregate change in ownership over a 3-year period (a “Section 382 ownership change”), utilization of its pre-change NOL and credit carryforwards are subject to an annual limitation. The Company completed a study through the date of the IPO to determine whether a Section 382 ownership change had occurred and determined at that time that a Section 382 ownership change occurred in 2013. As a result, the Company’s net operating losses generated through November 1, 2013 may be subject to limitation under Section 382 of the Code. The amount of pre-change loss carryforwards which may be subject to this limitation is $4.8 million. Such limitations may result in expiration of a portion of the carryforwards before utilization. The Company’s ability to use net operating loss carryforwards, research and
125
Table of Contents
development credit carryforwards and other tax attributes to reduce future taxable income and liabilities may be further limited as a result of future changes in stock ownership. As a result, if the Company earns net taxable income, its ability to use pre-change net operating loss carryforwards or other pre-change tax attributes to offset United States federal and state taxable income may still be subject to limitations, which could potentially result in increased future tax liability.
The total balance of unrecognized gross tax benefits for the years ended December 31, 2019 and 2018 resulting primarily from research and development tax credits claimed on the Company’s annual tax returns were as follows (in thousands):
| 2019 | 2018 | |||||||
| Unrecognized tax benefits at beginning of year |
$ | 4,169 | $ | 2,692 | ||||
| Additions based on prior year tax provisions |
— | 118 | ||||||
| Additions based on current year tax provisions |
2,241 | 1,359 | ||||||
|
|
|
|
|
|||||
| Unrecognized tax benefits at end of year |
$ | 6,410 | $ | 4,169 | ||||
|
|
|
|
|
|||||
The Company has not been audited by the Internal Revenue Service or any state income tax agency. As of December 31, 2019, its federal returns for the years ended 2012 through the current period and state returns for the years ended 2012 through the current period are still open to examination. The Company recognizes accrued interest and penalties related to unrecognized tax benefits as income tax expense, in statements of comprehensive loss. In addition, all of the net operating losses and research and development credit carry-forwards that may be used in future years are still subject to inquiry given that the statute of limitation for these items would begin in the year of utilization. The Company does not expect its unrecognized tax benefits to change significantly over the next 12 months.
An immaterial amount of liability related to foreign uncertain tax positions has been recorded in the Company’s consolidated financial statements. For U.S. uncertain tax positions, due to a full valuation allowance, such liabilities have been netted against deferred tax attribute carryovers.
The Company maintained undistributed earnings overseas as of December 31, 2019. As of December 31, 2019, the Company believed the funds held by all non-US subsidiaries will be permanently reinvested outside of the U.S. However, if these funds were repatriated to the U.S. or used for U.S. operations the Company may be subject to withholding taxes in the foreign countries. As a result of tax reform, the Company’s unrepatriated earnings are no longer subject to federal income tax in the U.S. when distributed.
The Tax Cuts and Jobs Act (the “Tax Act”), was enacted on December 22, 2017. The Tax Act created a new requirement that global intangible low-taxed income (“GILTI”) earned by the Company’s foreign subsidiaries must be included in gross U.S. taxable income. While the Tax Act provides for a modified territorial tax system, beginning in 2018, GILTI provisions will be applied providing an incremental tax on low taxed foreign income. The GILTI provisions require the Company to include in its U.S. income tax return foreign subsidiary earnings in excess of an allowable return on the foreign subsidiary’s tangible assets. During 2018, the Company made an accounting policy election to treat taxes related to GILTI as a current period expense when incurred.
| 7. | Commitments and Contingencies |
Indemnification
From time to time, the Company has entered into indemnification provisions under certain agreements in the ordinary course of business, typically with business partners, customers and suppliers. Pursuant to these agreements, the Company may indemnify, hold harmless and agree to reimburse the indemnified parties on a case-by-case basis for losses suffered or incurred by the indemnified parties in connection with any patent or other intellectual property infringement claim by any third party with respect to the Company’s products. The
126
Table of Contents
Company maintains product liability insurance coverage that would generally enable it to recover a portion of the amounts paid. The Company has also agreed to indemnify its directors and executive officers for costs associated with any fees, expenses, judgments, fines and settlement amounts incurred by them in any action or proceeding to which any of them are, or are threatened to be, made a party by reason of their service as a director or officer (see “—Litigation” below). The Company also may be subject to indemnification obligations by law with respect to the actions of its employees under certain circumstances and in certain jurisdictions.
Non-cancelable Purchase Commitments
The Company’s contract manufacturer makes advance purchases of components based on the instrument unit forecasts and purchase orders placed by the Company. To the extent these components are purchased by the contract manufacturer on the Company’s behalf and cannot be used by their other customers, the Company is obligated to purchase these components. In addition, certain supplier agreements require that the Company make minimum annual purchases under the agreements. As of December 31, 2019, the Company has commitments to make a total of $6.4 million in purchases over the next five years. To date, the Company has met the minimum purchase commitments.
As of December 31, 2019, the Company has entered into non-cancelable arrangements for subscription software services under which the Company has an obligation to make payments aggregating to $4.2 million over the next five years.
Intellectual Property Licensing
In October 2019, as part of the 2019 Becton Dickinson Settlement and Patent Cross License Agreement with Becton, Dickinson and Company and Cellular Research, Inc. (“BD Entities”), the Company was granted a worldwide royalty-free, nonexclusive license to certain intellectual property from the BD Entities. The Company recognized $22.1 million in technology licenses as an intangible asset with a weighted average amortization period of 15 years. This license is classified within other assets on the Company’s consolidated balance sheet as of December 31, 2019. See the discussion of the 2019 Becton Dickinson Settlement and Patent Cross License Agreement below.
In November 2018, the Company and Prognosys Biosciences, Inc. (“Prognosys”) entered into a license agreement pursuant to which the Company was granted an exclusive license to certain intellectual property relating to spatial analysis from Prognosys. As part of the agreement, the Company fully expensed total purchase consideration of $3.3 million comprised of cash consideration and shares of the Company’s Class A common stock.
In July 2018, the Company and The Board of Trustees of the Leland Stanford Junior University (“Stanford”) entered into a license agreement pursuant to which the Company was granted an exclusive license to ATAC-seq. As the Company receives revenue related to products covered by these licenses, the Company is required to pay Stanford a low single-digit royalty percentage based on the net revenue of certain ATAC-seq products during the applicable term of the licensed patents.
In September 2013, the Company and the President and Fellows of Harvard College (“Harvard”) entered into a license agreement pursuant to which the Company was granted a license to certain intellectual property from Harvard. The Company is required to pay Harvard a low single-digit royalty percentage based on the net revenue of certain products covered by certain licensed patents during their applicable term.
The minimum commitments related to the above license arrangements aggregate to $4.9 million as of December 31, 2019 to be paid over the next 14 years.
127
Table of Contents
Leases
The Company leases its facilities under noncancelable lease agreements. Certain of these arrangements have free rent, escalating rent payment provisions and tenant allowances. Under such arrangements, the Company recognizes rent expense on a straight-line basis over the noncancelable lease term and records the difference between cash rent payments and the recognition of rent expense as a deferred rent liability within other current liabilities (current portion) and other liabilities (noncurrent portion).
The Company maintains a letter of credit for the benefit of the landlord related to the Company’s noncancelable operating lease for its corporate headquarters in the amount of $5.0 million.
Rent expense related to noncancelable operating leases was $6.8 million, $3.5 million and $1.0 million for the years ended December 31, 2019, 2018 and 2017, respectively.
Future minimum lease payments under the leases for facilities as of December 31, 2019, are as follows (in thousands):
| Operating Leases |
||||
| 2020 |
$ | 6,247 | ||
| 2021 |
7,581 | |||
| 2022 |
6,794 | |||
| 2023 |
6,947 | |||
| 2024 and thereafter |
45,410 | |||
|
|
|
|||
| Total future minimum lease commitments |
$ | 72,979 | ||
|
|
|
|||
Litigation
The Company is currently a defendant in the lawsuits and proceedings described below. Other than with respect to the 2015 Delaware Action, losses are not probable or estimable for the described below.
The 2015 Delaware Action
In February 2015, Raindance Technologies, Inc. (“Raindance”) and the University of Chicago filed suit against the Company in the U.S. District Court for the District of Delaware, accusing substantially all of the Company’s products of infringing certain patents. In May 2017, Bio-Rad Laboratories, Inc. (“Bio-Rad”) was substituted as the plaintiff following its acquisition of Raindance. In November 2018, a jury found that the accused products willfully infringed one or more of the asserted patents and awarded Bio-Rad approximately $24 million in damages through June 30, 2018. The Company has appealed the jury verdict. Post-trial, Bio-Rad moved for a permanent injunction, treble damages for willful infringement, attorneys’ fees, supplemental damages as well as pre- and post-judgment interest.
In response to the jury award, the Company established an accrual of $30.6 million as of December 31, 2018, which was recorded as an operating expense on the consolidated statement of operations for the year ended December 31, 2018. Additionally, beginning in the fourth quarter of 2018, the Company also began recording an accrual for estimated royalties to Bio-Rad as a cost of revenue on the consolidated statements of operations based on an estimated royalty rate of 15% of sales of the Company’s Chromium instruments operating its GEM microfluidic chips and associated consumables. As a result, the Company recorded $7.4 million of royalties for the fourth quarter of 2018. As of December 31, 2018, the Company recorded a total accrual of $38 million related to this matter which represented the jury award plus the Company’s estimate of additional damages for the period from June 30, 2018 to the trial date in November 2018 and the royalties accrued in the fourth quarter of 2018.
128
Table of Contents
In July 2019, the Court awarded supplemental damages for the period from June 30, 2018 through the end of the trial in November 2018 and established the interest rates for pre- and post-judgment interest, which when combined with the original award, resulted in a $35 million preliminary judgment in favor of Bio-Rad for damages through November 2018 and interest. During the years ended December 31, 2019 and 2018 the Company recorded royalties of $29.2 million and $7.4 million, respectively, as a cost of revenue and an additional $1.5 and $30.6 million during the years ended December 31, 2019 and 2018, respectively, as an operating expense for estimated pre-and post- judgment interest. The Company’s accrual of $68.7 million as of December 31, 2019 is comprised of the preliminary judgment, along with the Company’s estimate of additional royalties and interest for the period from November 2018 through December 31, 2019. To date the Company has not made any payments related to the judgment or royalties. In July 2019, the Court denied Bio-Rad’s other post-trial requests such as attorneys’ fees and enhanced damages for willful infringement.
In July 2019, the Court also granted Bio-Rad a permanent injunction against the Company’s GEM microfluidic chips and associated consumables that were found to infringe the Bio-Rad patents, which have historically constituted a significant amount of the Company’s product sales. Under the injunction, the Company is permitted to continue to sell its GEM microfluidic chips and associated consumables for use with its historical installed base of instruments provided that the Company pay a royalty of 15% into escrow on the Company’s net revenue related to such sales commencing after the injunction effective date. The amounts will be held in escrow until the conclusion of the Company’s appeal. These decisions were entered as a final judgment against the Company in August 2019, and the injunction became effective on August 28, 2019. The Company has appealed the injunction to the Federal Circuit. The Federal Circuit granted an interim order staying the injunction pending resolution of the Company’s motion with respect to the Company’s Single Cell CNV and Linked-Read solutions subject to the 15% royalty payment described above. On September 24, 2019, the Federal Circuit extended the stay with respect to the Single Cell CNV and Linked-Read solutions for the pendency of the appeal, but otherwise denied the Company’s request to stay the injunction. The Company also appealed the judgment to the Federal Circuit, which will hold oral arguments in April 2020.
In August 2019, the Court ordered that the Company may post a bond in the amount of $52 million in lieu of payment of the final judgment. Bio-Rad subsequently asked the Court to increase the amount of the bond to approximately $61 million. The Company also asked the Court to reconsider its ruling and decrease the potential bond to approximately $35 million. On September 13, 2019, the Company posted a $52 million bond (the “Bond”) in lieu of payment of the judgment pending the Company’s ongoing appeal. In connection with the Bond, the Company has deposited $45 million as collateral in a segregated cash account, where it will be held until the conclusion of the appeal.
On October 10, 2019, the Court denied the Company’s motion to decrease the bond amount, and, without addressing Bio-Rad’s request to increase the bond amount, stayed any execution or enforcement of the judgment until the completion of appeal, and for thirty days thereafter.
The ITC 1068 Action
On July 31, 2017, Bio-Rad and Lawrence Livermore National Security, LLC filed a complaint against the Company in the U.S. International Trade Commission (“ITC”) pursuant to Section 337 of the Tariff Act of 1930, accusing substantially all of the Company’s products of infringing certain asserted patents (the “ITC 1068 Action”). In September 2018, the judge found that the Company’s GEM microfluidic chips infringe certain of the asserted patents, but also that the Company’s gel bead manufacturing microfluidic chip and Next GEM microfluidic chip do not infringe any claim asserted against them. The judge recommended entry of an exclusion order preventing the Company from importing its GEM microfluidic chips and a cease and desist order that would prevent the Company from selling such imported chips.
On December 18, 2019, the ITC issued its final determination in the ITC 1068 Action (the “Final Determination”). The Final Determination affirmed the Initial Determination that the Company’s Next GEM
129
Table of Contents
microfluidic chips and gel bead manufacturing microfluidic chips do not infringe any of the claims asserted against them. The Final Determination also affirmed the ruling that the Company’s GEM microfluidic chips infringe the ‘664, ‘682 and ‘635 patents but not the ‘160 patent. The ITC issued (1) a limited exclusion order prohibiting the unlicensed importation of the GEM microfluidic chips into the United States and (2) a cease and desist order preventing the Company from selling such imported GEM microfluidic chips in the United States. The ITC expressly allowed the importation and sale of the GEM microfluidic chips for use by researchers who were using such chips as of December 18, 2019, and who have a documented need to continue receiving such chips for a specific current ongoing research project for which that need cannot be met by any alternative product. The Final Determination was subject to a 60-day presidential review period. During the presidential review period, the Company was permitted to continue importation and sales of the GEM microfluidic chips subject to payment of a bond of three (3) percent of the entered value of the accused microfluidic chips.
The Northern District of California Action
On July 31, 2017, Bio-Rad and Lawrence Livermore National Security, LLC also filed suit against the Company in the U.S. District Court for the Northern District of California, alleging that substantially all of its products infringe certain patents in addition to the patents asserted in the ITC 1068 Action. The complaint seeks injunctive relief, unspecified monetary damages, costs and attorneys’ fees. This litigation is stayed pending resolution of the ITC 1068 Action. The Company believes that this lawsuit is without merit and intends to vigorously defend itself.
The Germany Action
On July 31, 2017, Bio-Rad filed suit against the Company in Germany in the Munich Region Court alleging that the Company infringed a European patent. Bio-Rad dismissed this action in August 2018.
On February 13, 2018, Bio-Rad filed suit against the Company in Germany in the Munich Region Court alleging that its Chromium instruments, GEM microfluidic chips and certain accessories infringe a German utility model. Bio-Rad seeks unspecified damages and an injunction prohibiting sales of these products in Germany and requiring the Company to recall these products sold in Germany subsequent to February 11, 2018. An initial hearing was held on November 27, 2018, and a subsequent hearing was held on May 15, 2019. The Court issued a ruling on November 20, 2019. The Court ruled that the Company’s GEM microfluidic chips, as well as certain Chromium instruments and accessories used with GEM microfluidic chips, infringed the German Utility Model. The Court issued an injunction with respect to such GEM microfluidic chips, Chromium instruments and accessories used with such systems, prohibiting among other things the sale of these products in Germany and the importation of such products into Germany. The Court found that the Company is obligated to compensate Bio-Rad for unspecified damages and required that these products be recalled from distribution channels in Germany. The Court further found that the Company has to bear the statutory costs of the legal dispute in a minimum amount of at least 61,000 Euros. The Company has accrued the 61,000 Euros in statutory costs in the consolidated balance sheet as of December 31, 2019. The Company is unable to estimate any additional potential exposure related to the matter beyond the statutory costs that have been accrued. The remedies, including the injunction, will take effect once enforced upon the posting of a bond by Bio-Rad. The Court’s ruling did not address the Company’s Next GEM products, which were not accused in this action and which constitute substantially all of the Company’s sales in Germany. The Company is currently appealing the Court’s ruling.
The 2018 Delaware Action
On October 25, 2018, Bio-Rad filed suit against the Company in the U.S. District Court for the District of Delaware alleging that the Company infringed certain patents. Bio-Rad seeks injunctive relief, unspecified monetary damages, costs and attorneys’ fees. The Company believes that this lawsuit is without merit and intends to vigorously defend itself.
130
Table of Contents
The Massachusetts Action
On September 11, 2019, Bio-Rad filed suit against the Company in the U.S. District Court for the District of Delaware alleging that the Company’s Next GEM products infringe certain claims of U.S. Patent No. 8,871,444. On November 5, 2019, Bio-Rad amended the complaint to additionally allege that the Company’s Next GEM products infringe certain claims of U.S. Patent Nos. 9,919,277 and 10,190,115. The ‘444 and ‘277 patents are exclusively licensed by Bio-Rad from Harvard University, which subsequently joined the suit as a party plaintiff.
On December 18, 2019, Bio-Rad dismissed this action in the District of Delaware and refiled it in the U.S. District Court for the District of Massachusetts. The case is assigned to Judge William G. Young. On January 14, 2020, the judge consolidated this case with a separate action, Bio-Rad Laboratories Inc. et al. v. Stilla Technologies, Inc., in which Bio-Rad is asserting the ‘444 patent (among other patents) against Stilla Technologies, Inc.’s droplet digital PCR product. On January 23, 2020, the Company filed a motion to dismiss the case and to transfer the ‘115 patent to the Northern District of California, where the related ‘059 patent is stayed. A hearing on the Company’s motion to dismiss and transfer is scheduled in March 2020.
On January 24, 2020, the Company filed antitrust counterclaims against Bio-Rad alleging violations of (a) Section 7 of the Clayton Act, (b) Section 2 of the Sherman Act, and (c) California unfair competition laws, for illegally acquiring Raindance Technologies, Inc. and illegally monopolizing or attempting to monopolize markets relating to droplet digital PCR products, droplet single cell products and droplet genetic analysis technology. On February 19, 2020, Bio-Rad moved to dismiss, or alternatively to stay and sever, the Company’s antitrust claims. A hearing on Bio-Rad’s motion to dismiss is scheduled in March 2020.
On February 5, the Company filed additional counterclaims against Bio-Rad alleging that Bio-Rad’s single cell ATAC-seq products infringe U.S. Patent No. 9,029,085 and 9,850,526 that are exclusively licensed to the Company from Harvard University.
A Markman hearing has been scheduled in June 2020. The judge has ordered the parties to be ready for trial with respect to the Company’s antitrust counterclaims by April 2021. A trial date for Bio-Rad’s patent claims and the Company’s patent counterclaims has not yet been set, but may be set for shortly after the antitrust trial.
The 2019 Becton Dickinson Settlement and Patent Cross License Agreement
On November 15, 2018, Becton, Dickinson and Company (“BD”) and Cellular Research, Inc. filed suit against the Company in the U.S. District Court for the District of Delaware, alleging that the Company infringed certain patents. In September 2019, the Company filed counterclaims alleging that BD and Cellular Research, Inc. (together, the “BD Entities”) infringed a number of the Company’s patents.
In October 2019, the Company entered into a settlement and patent cross license agreement (the “BD Agreement”) with the BD Entities. The BD Agreement resolved all outstanding patent litigation between the parties (the “BD Litigation”), which was dismissed with prejudice on October 21, 2019. Under the terms of the BD Agreement, the BD Entities granted the Company and its affiliates, and the Company granted BD and its affiliates, a worldwide, royalty-free, non-exclusive, fully paid-up license to certain patents and patent applications relating to molecular barcoding and single cell analysis, including to all the patents asserted in the BD Litigation. The Company is required to make an aggregate payment of $25.0 million to BD in annual amounts of $6.25 million over four years beginning in January 2020 in connection with the BD Agreement. Upon execution of the BD Agreement, the fair value of these payments was recognized as a liability and is classified as accrued expenses and other current liabilities and accrued license fee, noncurrent on the Company’s consolidated balance sheet as of December 31, 2019. As part of the BD Agreement, each party, on behalf of itself and its affiliates, has also entered into a covenant not to sue in certain fields related to each company’s products. The companies have also agreed on behalf of themselves and their affiliates to refrain from challenging the patents and patent applications licensed under the BD Agreement. The Company considers this matter closed.
131
Table of Contents
For certain of the Company’s litigation matters, the Company is required to make milestone payments to the Company’s legal counsel based on certain litigation outcomes. Based on the occurrence in the first quarter of 2020 of one such milestone in one of the Company’s litigation matters, a milestone payment to the Company’s legal counsel in the amount of $5 million was triggered in the first quarter of 2020. The Company expects to trigger additional such milestone payments during the pendency of litigation, though the timing and amounts of such payments is uncertain.
| 8. | Capital Stock and Stockholders’ Deficit |
The Company’s Amended and Restated Certificate of Incorporation authorizes it to issue 1,200,000,000 shares of capital stock consisting of 1,000,000,000 shares of Class A common stock, 100,000,000 shares of Class B common stock, and 100,000,000 shares of preferred stock.
Common Stock
Common stock issued and outstanding was 96,241,596 and 14,549,801 as of December 31, 2019 and 2018, respectively. Class A common stock outstanding was 20,972,166 and 6,499,801 as of December 31, 2019 and 2018, respectively. Class B common stock outstanding was 75,269,430 and 8,050,000 as of December 31, 2019 and 2018, respectively. The Company’s Class A common stock and Class B common stock have a par value of $0.00001 per share. Each share of Class B common stock has the right to ten votes and each share of Class A common stock has the right to one vote per share. All other rights and privileges of Class A and Class B common stock are equivalent. Class B common shares are convertible to Class A common shares at any time upon written notification and all Class B common shares will convert upon the date specified by vote or written consent of the holders of a majority of the then outstanding Class B common stock, voting together as a single class. The holders of common stock are also entitled to receive dividends whenever funds are legally available and when declared by the Board of Directors, subject to the prior rights of holders of all classes of stock outstanding having priority rights as to dividends.
Warrants to Purchase Common Stock
In connection with certain debt arrangements, the Company issued lenders the following warrants to purchase shares of Class A common stock which have an exercise term of 10 years:
| Issue Date |
Exercise Price per Share |
Number of Shares |
||||||
| April 2014 |
$ | 0.21 | 43,750 | |||||
| September 2015 |
0.88 | 18,349 | ||||||
| September 2016 |
1.07 | 79,000 | ||||||
| February 2018 |
1.62 | 125,000 | ||||||
In September 2019, the lenders cashless exercised all of the above warrants which resulted in the issuance of an aggregate of 261,024 shares of common stock.
The Company’s common stock warrants were recorded to additional paid-in capital at fair value as of the date of issuance using the Black-Scholes valuation model. The fair value of the warrants for 125,000 shares of Class A common stock issued in February 2018 was estimated at $150,000 using the following assumptions: fair value of shares of Class A common stock on the issuance date of $1.62, risk-free interest rate of 1.54%, contractual term of 10 years, no anticipated dividends, and estimated volatility of 68%. The initial amount allocated to the warrants are accounted for as a discount to the related debt and amortized to interest expense over the loan term using the effective interest method.
132
Table of Contents
| 9. | Equity Incentive Plans |
2012 Stock Plan
In October 2012, the Company adopted the 10x Genomics, Inc. 2012 Stock Plan (the “2012 Stock Plan”) which has been amended in subsequent years for increases in authorized shares, among other changes. The 2012 Stock Plan allowed for the issuance of incentive stock options (“ISOs”), non-statutory stock options (“NSOs”) or restricted shares. ISOs may be granted only to the Company’s employees (including officers and directors who are also considered employees). NSOs and restricted shares may be granted to the Company’s employees and service providers. Unvested options that were not exercised as of an employee’s termination date revert to the 2012 Stock Plan. As of December 31, 2019 and December 31, 2018, the number of shares of Class A common stock issuable under the 2012 Stock Plan, including options available and options outstanding, is 15,225,893 and 24,782,088, respectively. The 2012 Stock Plan did not allow for the issuance of shares of Class B common stock.
Upon the adoption of the 2019 Omnibus Incentive Plan in September 2019, any awards outstanding under the 2012 Stock Plan will continue to be governed by their existing terms but no further awards may be granted under the 2012 Stock Plan.
2019 Omnibus Incentive Plan
In July 2019, in connection with the IPO, the Company’s board of directors adopted the 10x Genomics, Inc. 2019 Omnibus Incentive Plan (the “Omnibus Incentive Plan” and, together with the 2012 Stock Plan, the “Plans”), which was subsequently approved by the Company’s stockholders. The Omnibus Incentive Plan went into effect on September 11, 2019. The Omnibus Incentive Plan allows for the issuance of ISOs, NSOs or restricted shares. ISOs may be granted only to the Company’s employees (including officers and directors who are also considered employees). NSOs and restricted shares may be granted to the Company’s employees and service providers. As of December 31, 2019, the number of shares of Class A common stock issuable upon the exercise of stock options granted under the Omnibus Incentive Plan is 11,000,000. The Omnibus Incentive Plan provides that the total number of shares of the Company’s Class A common stock that may be issued under the Omnibus Incentive Plan, including options authorized and options outstanding, is 11,000,000 (such share limit as increased from time to time, the “Absolute Share Limit”). However, the Absolute Share Limit shall be increased on the first day of each calendar year commencing on January 1, 2021 and ending on January 1, 2029 in an amount equal to the lesser of (i) 5% of the total number of shares of common stock outstanding on the last day of the immediately preceding fiscal year and (ii) such number of shares of the Company’s Class A common stock as determined by the Company’s board of directors. However, if on January 1 of a calendar year, the Company’s board of directors has not either confirmed the 5% increase described in clause (i) or approved a lesser number of shares of the Company’s Class A common stock for such calendar year, then the Company’s board of directors will be deemed to have waived the automatic increase, and no such increase will occur for such calendar year. Of the Absolute Share Limit, no more than 11,000,000 shares of Class A common stock may be issued in the aggregate pursuant to the exercise of incentive stock options granted under the Omnibus Incentive Plan.
Options under the Omnibus Incentive Plan have a contractual term of 10 years. The exercise price of an ISO and NSO shall not be less than 100% of the fair market value of the shares on the date of grant.
133
Table of Contents
A summary of the Company’s stock option activity under the Plans is as follows:
| Outstanding Options |
Weighted- Average Exercise Price |
Weighted- Average Remaining Terms (Years) |
Aggregate Intrinsic Value |
|||||||||||||
| Balance as of December 31, 2018 |
14,264,376 | $ | 1.91 | 8.2 | $ | 71,902,234 | ||||||||||
| Granted |
4,785,842 | $ | 19.05 | |||||||||||||
| Exercised |
(2,226,493 | ) | $ | 1.69 | ||||||||||||
| Cancelled |
(905,482 | ) | $ | 6.71 | ||||||||||||
|
|
|
|||||||||||||||
| Balance as of December 31, 2019 |
15,918,243 | $ | 6.82 | 7.9 | $ | 1,105,222,370 | ||||||||||
|
|
|
|||||||||||||||
| Outstanding Options |
Weighted- Average Exercise Price |
Weighted- Average Remaining Terms (Years) |
Aggregate Intrinsic Value |
|||||||||||||
| Vested and exercisable as of December 31, 2019 |
7,362,304 | $ | 1.96 | 6.9 | $ | 546,973,399 | ||||||||||
|
|
|
|||||||||||||||
| Unvested and exercisable as of December 31, 2019 |
1,138,439 | $ | 5.90 | 8.3 | $ | 80,094,346 | ||||||||||
|
|
|
|||||||||||||||
The weighted-average grant date fair value of options granted during the years ended December 31, 2019, 2018, and 2017 was $13.20, $2.04, and $0.66 per share, respectively. The total intrinsic value of stock options exercised was $30.5 million, $3.3 million, and $0.8 million during the years ended December 31, 2019, 2018, and 2017, respectively. As of December 31, 2019, the total unrecognized stock-based compensation related to stock options was $57.8 million, which will be recognized over a weighted-average period of approximately 3.2 years.
Early Exercise of Options
Stock options granted under the 2012 Stock Plan provide certain employee and director option holders the right to exercise unvested options in exchange for restricted shares of Class A common stock which are subject to repurchase by the Company at the original issuance price in the event the optionee’s employment is terminated either voluntarily or involuntarily prior to the applicable vesting date. The consideration received for the early exercised options is recorded as a liability on the consolidated balance sheets and reclassified to stockholders’ deficit as the shares vest. As of December 31, 2019 and 2018, the total repurchase liability related to the unvested early exercised options was $494,000 and $652,000, respectively, which is included in other current and noncurrent liabilities on the consolidated balance sheets. A summary of these restricted shares issued under the 2012 Stock Plan is as follows:
| Number of Shares |
Weighted- Average Exercise Price |
|||||||
| Outstanding and unvested as of December 31, 2018 |
232,750 | $ | 2.80 | |||||
| Exercised |
29,000 | $ | 11.48 | |||||
| Vested |
(123,500 | ) | $ | 3.98 | ||||
|
|
|
|||||||
| Outstanding and unvested as of December 31, 2019 |
138,250 | $ | 3.57 | |||||
|
|
|
|||||||
134
Table of Contents
Stock Option Valuation Assumptions
The fair value of each employee option grant was estimated on the date of grant using the Black-Scholes option pricing model and the following assumptions for the periods indicated:
| Year Ended December 31, | ||||||
| 2019 | 2018 | 2017 | ||||
| Expected volatility |
40% – 53% | 45% – 46% | 45% – 48% | |||
| Risk-free interest rate |
1.5% – 2.5% | 2.7% – 3.1% | 1.9% – 2.3% | |||
| Expected term |
5.0 – 6.9 years | 5.3 – 6.5 years | 4.2 – 6.5 years | |||
| Expected dividend |
— % | — % | — % | |||
2019 Employee Stock Purchase Plan
In July 2019, the Company’s board of directors adopted the 10x Genomics, Inc. 2019 Employee Stock Purchase Plan (the “ESPP”), which was subsequently approved by the Company’s stockholders. The ESPP went into effect on September 11, 2019. Subject to any limitations contained therein, the ESPP allows eligible employees to contribute, through payroll deductions, up to 15% of their eligible compensation to purchase the Company’s Class A common stock at a discounted price per share. The ESPP generally provides for consecutive, overlapping 6-month offering periods. The initial offering period runs from September 11, 2019 through May 14, 2020. Unless otherwise determined by the administrator of the ESPP, a participant may not sell, transfer or otherwise dispose of any shares of the Company’s Class A common stock purchased under the ESPP for 12 months following the applicable exercise date.
A total of 2,000,000 shares of Class A common stock were reserved for issuance under the ESPP. As of December 31, 2019, no shares of Class A common stock have been purchased under the ESPP. The ESPP provides that the maximum number of shares of the Company’s Class A common stock made available for sale thereunder will be 2,000,000, which number will be automatically increased on the first day of each calendar year commencing on January 1, 2021 and ending on January 1, 2029 in an amount equal to the lesser of (i) 1% of the total number of shares of common stock outstanding on the last day of the immediately preceding fiscal year and (ii) such number of shares of the Company’s Class A common stock as determined by the Company’s board of directors. However, if on January 1 of a calendar year the Company’s board of directors has not either confirmed the 1% described in clause (i) or approved a lesser number of shares of the Company’s Class A common stock for such calendar year, the Company’s board of directors will be deemed to have waived the automatic increase and no such increase will occur for such calendar year. The maximum number of shares available under the ESPP (and any share limitations thereunder, as applicable) will automatically be adjusted upon certain changes to the Company’s capital structure.
The fair value of the ESPP is estimated using the Black-Scholes option pricing model. For the year ended December 31, 2019, the grant date fair value was $12.60.
For the year ended December 31, 2019, the fair value of the ESPP was estimated using the following assumptions.
| Year Ended December 31, | ||
| 2019 | ||
| Expected volatility |
52% | |
| Risk-free interest rate |
1.85% | |
| Expected term |
0.7 years | |
| Expected dividend |
— % |
The ESPP commenced in September 2019. No shares of common stock were purchased pursuant to the ESPP in 2019. As of December 31, 2019, the total unrecognized stock-based compensation related to the ESPP was $1.0 million, which will be recognized over a weighted-average period of approximately 0.4 years.
135
Table of Contents
Stock-based Compensation
The Company recorded stock-based compensation expense in the consolidated statement of operations for the periods presented as follows (in thousands):
| Year Ended December 31, | ||||||||||||
| 2019 | 2018 | 2017 | ||||||||||
| Cost of revenue |
$ | 325 | $ | 85 | $ | 44 | ||||||
| Research and development |
5,721 | 1,030 | 801 | |||||||||
| Selling, general and administrative |
7,287 | 1,543 | 816 | |||||||||
|
|
|
|
|
|
|
|||||||
| Total stock-based compensation expense |
$ | 13,333 | $ | 2,658 | $ | 1,661 | ||||||
|
|
|
|
|
|
|
|||||||
| 10. | Employee Benefit Plans |
The Company has made available to all full-time United States employees a 401(k) retirement savings plan. Under this plan, employee and employer contributions and accumulated plan earnings qualify for favorable tax treatment under Section 401(k) of the Internal Revenue Code. The Company has not contributed to the plan.
| 11. | Net Loss Per Share |
The following table sets forth the computation of basic and diluted net loss per share for the periods indicated (in thousands, except share and per share data):
| Year Ended December 31, | ||||||||||||
| 2019 | 2018 | 2017 | ||||||||||
| Net loss |
$ | (31,251 | ) | $ | (112,485 | ) | $ | (18,762 | ) | |||
| Weighted average shares used in computing net loss per share, basic and diluted |
39,091,366 | 13,392,273 | 11,587,751 | |||||||||
|
|
|
|
|
|
|
|||||||
| Net loss per share, basic and diluted |
$ | (0.80 | ) | $ | (8.40 | ) | $ | (1.62 | ) | |||
|
|
|
|
|
|
|
|||||||
The following outstanding shares of common stock equivalents were excluded from the computation of diluted net loss per share for the periods presented because including them would have had an anti-dilutive effect:
| Year Ended December 31, | ||||||||||||
| 2019 | 2018 | 2017 | ||||||||||
| Convertible preferred stock (on an if-converted basis) |
— | 67,704,278 | 59,730,213 | |||||||||
| Stock-options to purchase common stock |
15,918,243 | 14,264,376 | 11,949,004 | |||||||||
| Shares subject to repurchase |
138,250 | 232,750 | 301,372 | |||||||||
| Common stock warrants |
— | 266,099 | 141,099 | |||||||||
| Shares committed under ESPP |
56,159 | — | — | |||||||||
|
|
|
|
|
|
|
|||||||
| Total |
16,112,652 | 82,467,503 | 72,121,688 | |||||||||
|
|
|
|
|
|
|
|||||||
136
Table of Contents
12. Selected Quarterly Information
The following tables present certain unaudited consolidated quarterly financial information for each of the eight quarters in the two-year period ended December 31, 2019. This quarterly information has been prepared on the same basis as the Consolidated Financial Statements and includes all adjustments necessary to state fairly the information for the periods presented.
| Fiscal 2019 Quarter Ended (Unaudited) | ||||||||||||||||
| March 31 | June 30 | September 30 | December 31 | |||||||||||||
| (in thousands, except per share data) | ||||||||||||||||
| Revenue |
$ | 53,578 | $ | 55,819 | $ | 61,207 | $ | 75,289 | ||||||||
| Gross profit |
$ | 39,613 | $ | 40,813 | $ | 45,727 | $ | 58,707 | ||||||||
| Net loss |
$ | (3,636 | ) | $ | (10,878 | ) | $ | (9,603 | ) | $ | (7,134 | ) | ||||
| Net loss per share, basic and diluted |
$ | (0.25 | ) | $ | (0.70 | ) | $ | (0.33 | ) | $ | (0.07 | ) | ||||
| Fiscal 2018 Quarter Ended (Unaudited) | ||||||||||||||||
| March 31 | June 30 | September 30 | December 31 | |||||||||||||
| (in thousands, except per share data) | ||||||||||||||||
| Revenue |
$ | 27,408 | $ | 31,744 | $ | 36,607 | $ | 50,554 | ||||||||
| Gross profit |
$ | 23,438 | $ | 27,194 | $ | 31,366 | $ | 35,654 | ||||||||
| Net loss |
$ | (15,693 | ) | $ | (5,923 | ) | $ | (15,345 | ) | $ | (75,524 | ) | ||||
| Net loss per share, basic and diluted |
$ | (1.23 | ) | $ | (0.45 | ) | $ | (1.13 | ) | $ | (5.40 | ) | ||||
13. Subsequent Events
On February 20, 2020, the term loan borrowings were prepaid in full. See Note 5.
137
Table of Contents
Item 9. Changes in and Disagreements With Accountants on Accounting and Financial Disclosure.
None.
Item 9A. Controls and Procedures.
Evaluation of Disclosure Controls and Procedures
Under the supervision and with the participation of our management, including our Chief Executive Officer and Chief Financial Officer, we evaluated the effectiveness of the design and operation of our disclosure controls and procedures pursuant to Rule 13a-15(e) and 15d-15(e) under the Securities Exchange Act of 1934, as amended (the “Exchange Act”) as of the end of the period covered by this report. Our disclosure controls and procedures are designed to ensure that information required to be disclosed in the reports we file or submit under the Exchange Act is recorded, processed, summarized and reported within the time periods specified in the SEC’s rules and forms, and that such information is accumulated and communicated to our management, including the Chief Executive Officer and the Chief Financial Officer, to allow timely decisions regarding required disclosures. Any controls and procedures, no matter how well designed and operated, can provide only reasonable assurance of achieving the desired control objective and management necessarily applies its judgment in evaluating the cost-benefit relationship of possible controls and procedures. Based on that evaluation, our Chief Executive Officer and Chief Financial Officer have concluded that our disclosure controls and procedures were effective at a reasonable assurance level as of December 31, 2019.
Management’s Annual Report on Internal Control over Financial Reporting
This Annual Report does not include a report of management’s assessment regarding internal control over financial reporting or an attestation report of our independent registered public accounting firm due to a transition period established by the rules of the SEC for newly public companies.
Changes in Internal Control over Financial Reporting
There was not any change in our internal control over financial reporting (as such term is defined in Rules 13a-15(f) under the Exchange Act) during the quarter ended December 31, 2019 that has materially affected, or is reasonably likely to materially affect, our internal control over financial reporting.
None.
138
Table of Contents
PART III
Item 10. Directors, Executive Officers and Corporate Governance.
We have adopted a written code of business conduct and ethics that applies to our directors, officers and employees, including our principal executive officer, principal financial officer, principal accounting officer, controller, or persons performing similar functions. A current copy of the code is posted on the Governance section of our investor relations website, which is located at www.investors.10xgenomics.com. If we make any substantive amendments to, or grant any waivers from, the code of business conduct and ethics for our principal executive officer, principal financial officer, principal accounting officer, controller or persons performing similar functions, or any officer or director, we will disclose the nature of such amendment or waiver on our website or in a Current Report on Form 8-K.
The remaining information required under this item is incorporated herein by reference to our definitive proxy statement (the “Proxy Statement”) pursuant to Regulation 14A under the Securities Exchange Act of 1934, as amended, which Proxy Statement is expected to be filed with Securities and Exchange Commission not later than 120 days after the close of our fiscal year ended December 31, 2019.
Item 11. Executive Compensation.
The information required by this item will be set forth in the Proxy Statement and is incorporated herein by reference.
Item 12. Security Ownership of Certain Beneficial Owners and Management and Related Stockholder Matters.
The information required by this item will be set forth in the Proxy Statement and is incorporated herein by reference.
Item 13. Certain Relationships and Related Transactions, and Director Independence.
The information required by this item will be set forth in the Proxy Statement and is incorporated herein by reference.
Item 14. Principal Accounting Fees and Services.
The information required by this item will be set forth in the Proxy Statement and is incorporated herein by reference.
139
Table of Contents
PART IV
Item 15. Exhibits, Financial Statement Schedules.
| (a) | The following documents are filed as part of this Annual Report: |
| (1) | Financial Statements |
The financial statements filed as part of this Annual Report are included in Part II, Item 8 of this Annual Report.
| (2) | Financial Statement Schedules |
Financial statement schedules have been omitted in this Annual Report because they are not applicable, not required under the instructions or the information requested is set forth in the financial statements or related notes thereto.
| (3) | List of Exhibits required by Item 601 of Regulation S-K |
140
Table of Contents
141
Table of Contents
| Incorporated by Reference | ||||||||||||||||||
| Exhibit Number |
Exhibit Title |
Form | File No. |
Exhibit | Filing Date |
|||||||||||||
| 31.2 |
Certification of Principal Financial and Accounting Officer Pursuant to Section 302 of the Sarbanes-Oxley Act of 2002. | |||||||||||||||||
| 32.1* |
Certification of Principal Executive Officer Pursuant to Section 906 of the Sarbanes-Oxley Act of 2002. | |||||||||||||||||
| 32.2* |
Certification of Principal Financial and Accounting Officer Pursuant to Section 906 of the Sarbanes-Oxley Act of 2002. | |||||||||||||||||
| 101.INS |
XBRL Instance Document. | |||||||||||||||||
| 101.SCH |
XBRL Taxonomy Extension Schema Document. | |||||||||||||||||
| 101.CAL |
XBRL Taxonomy Extension Calculation Linkbase Document. | |||||||||||||||||
| 101.DEF |
XBRL Taxonomy Extension Definition Linkbase Document. | |||||||||||||||||
| 101.LAB |
XBRL Taxonomy Extension Label Linkbase Document. | |||||||||||||||||
| 101.PRE |
XBRL Taxonomy Extension Presentation Linkbase Document. | |||||||||||||||||
| + | Management contract or compensatory plan or arrangement. |
| # | Portions of this exhibit have been omitted pursuant to Item 601 of Regulation S-K promulgated under the Securities Act because the information (i) is not material and (ii) would be competitively harmful if publicly disclosed. |
| * | This certification is deemed not filed for purposes of Section 18 of the Exchange Act, or otherwise subject to the liability of that section, nor shall it be deemed incorporated by reference into any filing under the Securities Act or the Exchange Act. |
None.
142
Table of Contents
Pursuant to the requirements of Section 13 or 15(d) of the Securities Exchange Act of 1934, the registrant has duly caused this report to be signed on its behalf by the undersigned, thereunto duly authorized.
| 10x Genomics, Inc. | ||||||
| Date: February 27, 2020 | By: |
/s/ Serge Saxonov |
||||
| Serge Saxonov Chief Executive Officer and Director (Principal Executive Officer) |
||||||
KNOW ALL BY THESE PRESENTS, that each person whose signature appears below hereby constitutes and appoints Serge Saxonov and Justin J. McAnear, and each of them, his or her true and lawful agent, proxy and attorney-in-fact, with full power of substitution and resubstitution, for him or her and in his or her name, place and stead, in any and all capacities, to sign any and all amendments to this Annual Report on Form 10-K, and to file the same, with all exhibits thereto, and other documents in connection therewith, with the Securities and Exchange Commission, granting unto said attorneys-in-fact and agents, and each of them, full power and authority to do and perform each and every act and thing requisite and necessary to be done in connection therewith, as fully to all intents and purposes as he or she might or could do in person, hereby ratifying and confirming all that said attorneys-in-fact and agents, or any of them, or their or his substitutes, may lawfully do or cause to be done by virtue thereof.
Pursuant to the requirements of the Securities Exchange Act of 1934, this report has been signed below by the following persons on behalf of the registrant and in the capacities and on the dates indicated.
|
Signature |
Title |
Date | ||
| /s/ Serge Saxonov |
Chief Executive Officer and Director (Principal Executive Officer) |
February 27, 2020 | ||
| Serge Saxonov | ||||
| /s/ Benjamin J. Hindson |
President and Director | February 27, 2020 | ||
| Benjamin J. Hindson | ||||
| /s/ Justin J. McAnear |
Chief Financial Officer (Principal Accounting and Financial Officer) |
February 27, 2020 | ||
| Justin J. McAnear | ||||
| /s/ John R. Stuelpnagel |
Chairman of the board of directors | February 27, 2020 | ||
| John R. Stuelpnagel | ||||
| /s/ Sridhar Kosaraju |
Director | February 27, 2020 | ||
| Sridhar Kosaraju | ||||
| /s/ Mathai Mammen |
Director | February 27, 2020 | ||
| Mathai Mammen | ||||
| /s/ Bryan E. Roberts |
Director | February 27, 2020 | ||
| Bryan E. Roberts | ||||
| /s/ Shehnaaz Suliman |
Director | February 27, 2020 | ||
| Shehnaaz Suliman | ||||
143