Attached files
| file | filename |
|---|---|
| EX-99.1 - EX-99.1 - Extended Stay America, Inc. | exhibit991-earningsrel.htm |
| 8-K - 8-K - Extended Stay America, Inc. | stay-20200226.htm |
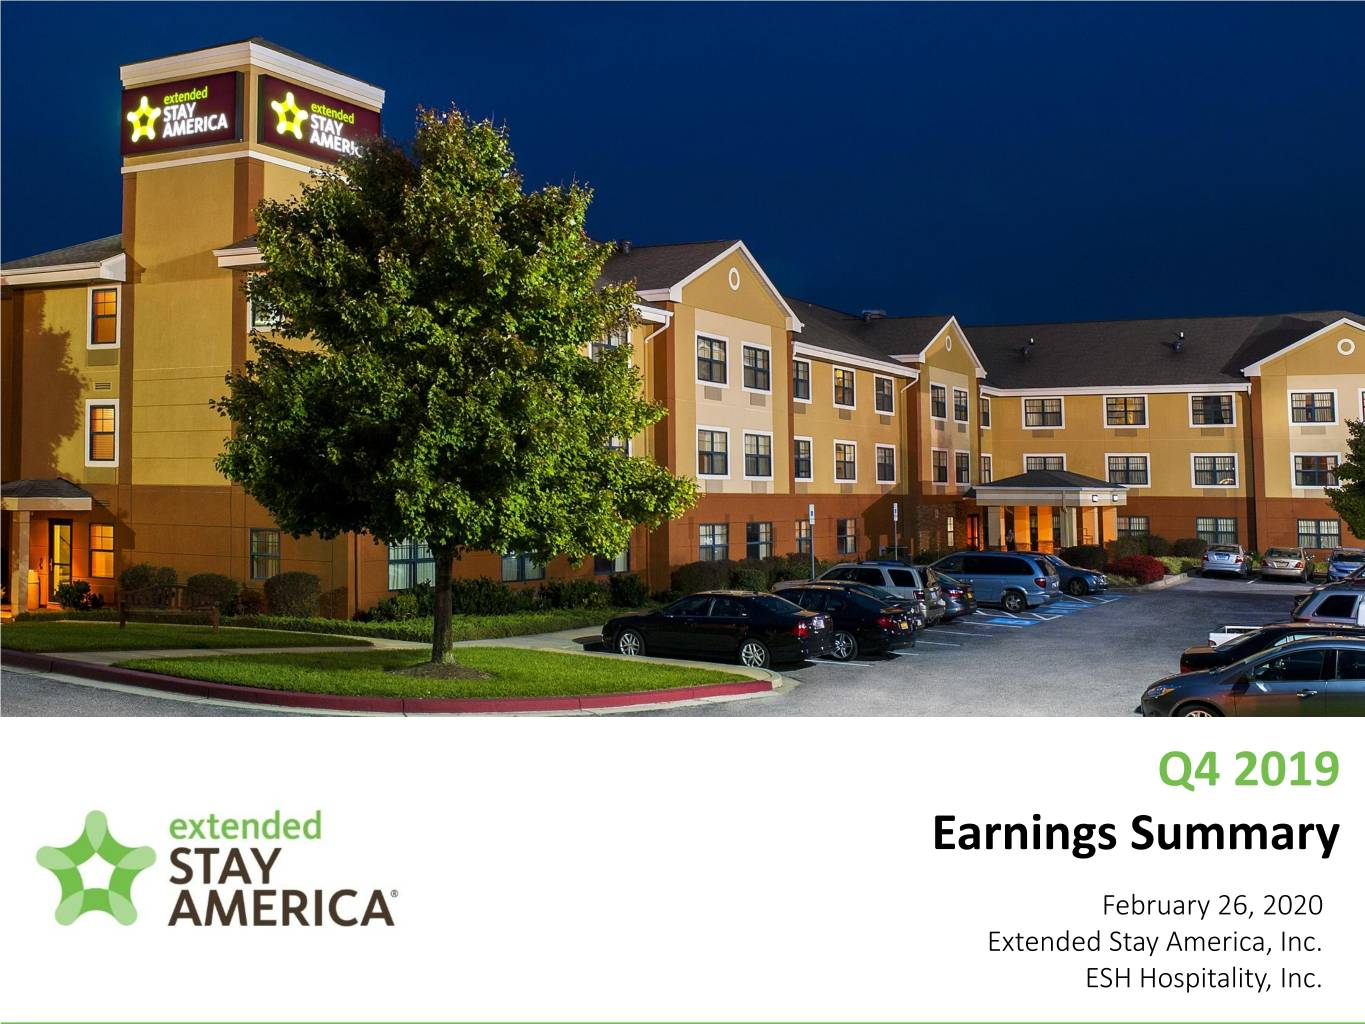
Q4 2019 Earnings Summary February 26, 2020 Extended Stay America, Inc. ESH Hospitality, Inc.
important disclosure information This presentation contains forward-looking statements within the meaning of the federal securities laws. These statements include, but are not limited to, statements related to our expectations regarding our business performance, business strategies, financial results, liquidity and capital resources, capital expenditures, capital returns, distribution policy and other non-historical statements, including the statements in the “2020 Outlook” section of this presentation. Forward looking statements involve known and unknown risks, uncertainties and other factors that may cause Extended Stay America, Inc.’s (“ESA”) and ESH Hospitality, Inc.’s (“ESH REIT,” and together with ESA, the “Company”) actual results or performance to differ from those projected in the forward-looking statements, possibly materially. For a description of factors that may cause the Company’s actual results or performance to differ from projected results or performance implied by forward-looking statements, please review the information under the headings “Cautionary Note Regarding Forward-Looking Statements” and “Risk Factors” included in the Company’s combined annual report on Form 10-K filed with the Securities and Exchange Commission (“SEC”) on February 26, 2020 and other documents of the Company on file with or furnished to the SEC. Any forward-looking statements made in this presentation are qualified by these cautionary statements, and there can be no assurance that the actual results or developments anticipated by the Company will be realized or, even if substantially realized, will have the expected consequences to, or effects on, the Company, its business or operations. Except as required by law, the Company undertakes no obligation to update publicly or revise any forward-looking statement, whether as a result of new information, future developments or otherwise. We caution you that actual results may differ materially from what is expressed, implied or forecasted by the Company’s forward-looking statements. This presentation includes certain non-GAAP financial measures, including Hotel Operating Profit, Hotel Operating Margin, EBITDA, Adjusted EBITDA, Funds from Operations (“FFO”), Adjusted Funds From Operations (“Adjusted FFO”), Adjusted FFO per diluted Paired Share, Paired Share Income, Adjusted Paired Share Income and Adjusted Paired Share Income per diluted Paired Share. These non-GAAP financial measures should be considered only as supplemental to, and not as superior to, financial measures prepared in accordance with U.S. GAAP. Please refer to the Appendix of this presentation for a reconciliation of these non-GAAP financial measures to the most directly comparable financial measures prepared in accordance with U.S. GAAP, and to the Company’s combined annual report on Form 10-K filed with the SEC on February 26, 2020 for definitions of these non-GAAP measures. This presentation includes certain operating metrics presented on a comparable system-wide basis. The term “Comparable system-wide” refers to hotels operated under the Extended Stay America brand, including those owned, franchised or managed by the Company, for the full three and twelve months ended December 31, 2019 and 2018. For franchised or managed hotels, ESA earns certain fees based on a percentage of hotel revenues. 2

Q4 2019 Operating Results and Financial Highlights comparable system-wide revenue per available net income (in millions)1 room (“RevPAR”) $39.4 $47.34 $46.94 $23.8 Q4 2018 Q4 2019 Q4 2018 Q4 2019 hotel operating margin2 adjusted FFO per diluted Paired Share1,2 51.1% 48.3% $0.41 $0.37 Q4 2018 Q4 2019 Q4 2018 Q4 2019 adjusted EBITDA (in millions) 1,2 adjusted Paired Share income per diluted Paired Share1,2 $126.6 $0.21 $108.8 $0.14 Q4 2018 Q4 2019 Q4 2018 Q4 2019 1Net Income, Adjusted EBITDA, Adjusted FFO per diluted Paired Share and Adjusted Paired Shared Income per diluted Paired Share were affected by lost contribution from 14 hotels sold in 4Q 2018. 2 See Appendix for Hotel Operating Margin, Adjusted FFO per diluted Paired Share, Adjusted EBITDA and Adjusted Paired Share Income per diluted Paired Share reconciliations. 3
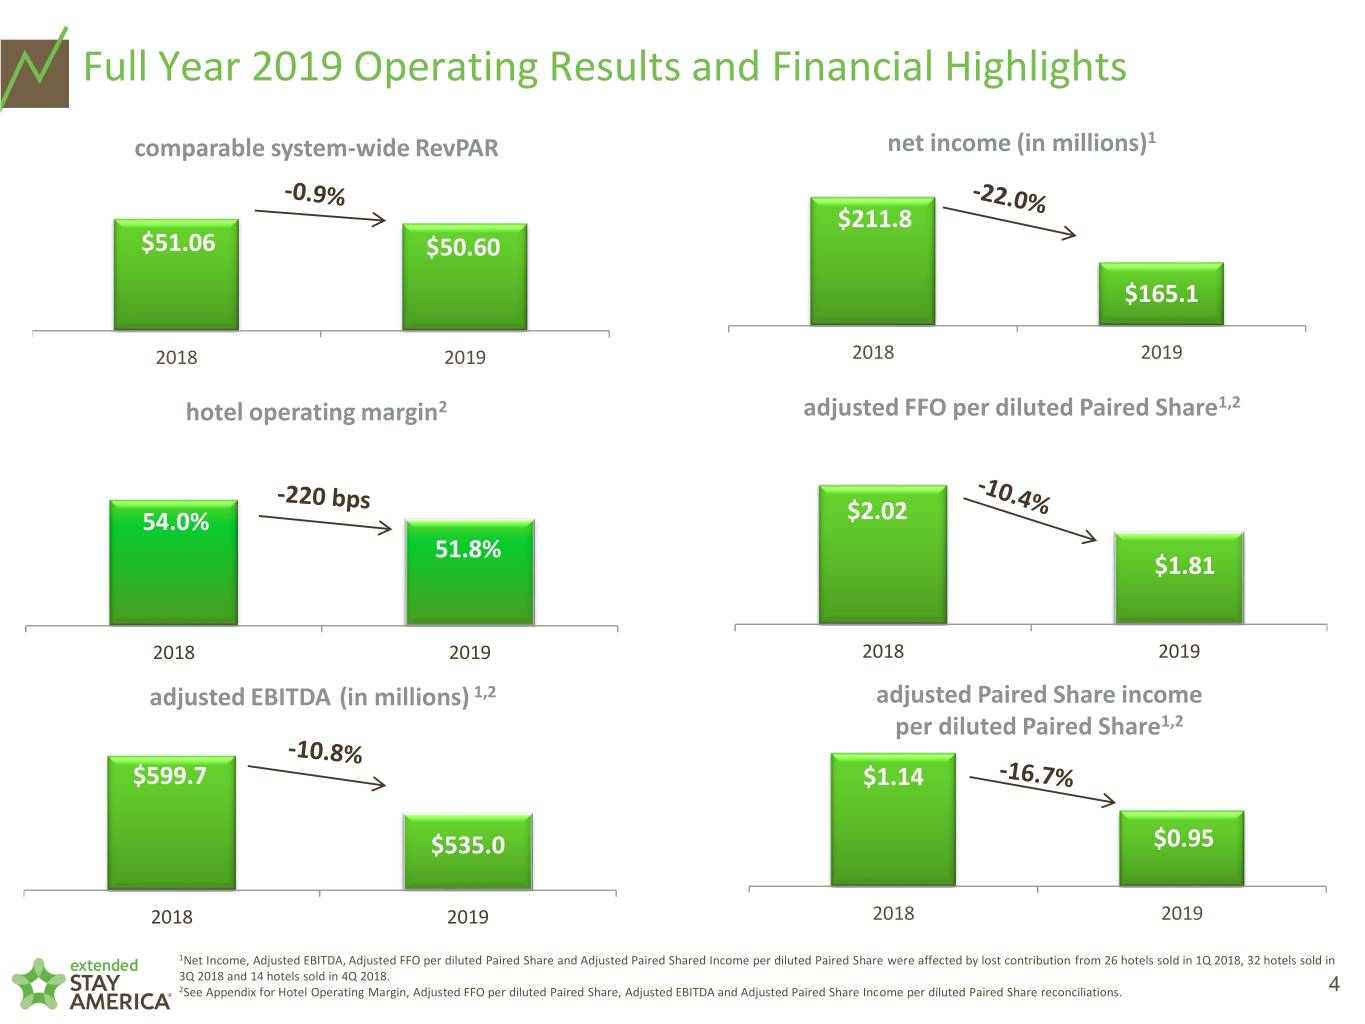
Full Year 2019 Operating Results and Financial Highlights comparable system-wide RevPAR net income (in millions)1 $211.8 $51.06 $50.60 $165.1 2018 2019 2018 2019 hotel operating margin2 adjusted FFO per diluted Paired Share1,2 54.0% $2.02 51.8% $1.81 2018 2019 2018 2019 adjusted EBITDA (in millions) 1,2 adjusted Paired Share income per diluted Paired Share1,2 $599.7 $1.14 $535.0 $0.95 2018 2019 2018 2019 1Net Income, Adjusted EBITDA, Adjusted FFO per diluted Paired Share and Adjusted Paired Shared Income per diluted Paired Share were affected by lost contribution from 26 hotels sold in 1Q 2018, 32 hotels sold in 3Q 2018 and 14 hotels sold in 4Q 2018. 2See Appendix for Hotel Operating Margin, Adjusted FFO per diluted Paired Share, Adjusted EBITDA and Adjusted Paired Share Income per diluted Paired Share reconciliations. 4

Quarterly Distribution and Select Balance Sheet Statistics quarterly distribution cash balance (in millions)2 per Paired Share1 +4.5% $0.23 $0.22 $362 $303 Q4 2018 Q4 2019 Q4 2018 Q4 2019 adjusted net debt / TTM adjusted EBITDA ratio3 debt outstanding (in millions)4 $2,686 4.3X 4.0X $2,444 Q3 2019 Q4 2019 Q4 2018 Q4 2019 ¹ Distribution dates March 28, 2019 and March 26, 2020 respectively. 2 Includes restricted and unrestricted cash. 3 Calculation is (gross debt – total restricted and unrestricted cash) divided by TTM Adjusted EBITDA. 5 4 Gross debt outstanding (excludes discounts and deferred financing costs).

Capital Returns Summary Capital Returns to Shareholders STAY DIVIDEND HISTORY (in millions) REIT Regular C-Corp Regular $340 REIT Special C-Corp Special $301 $0.30 $251 $221 $0.25 $0.20 $135 $0.15 $108 $0.10 $0.05 2014 2015 2016 2017 2018 2019 -STAY has returned more than $1.3 billion to shareholders, more than 55% of our recent market capitalization -STAY has de-levered from 5.4x to 4.3x during that same period 6
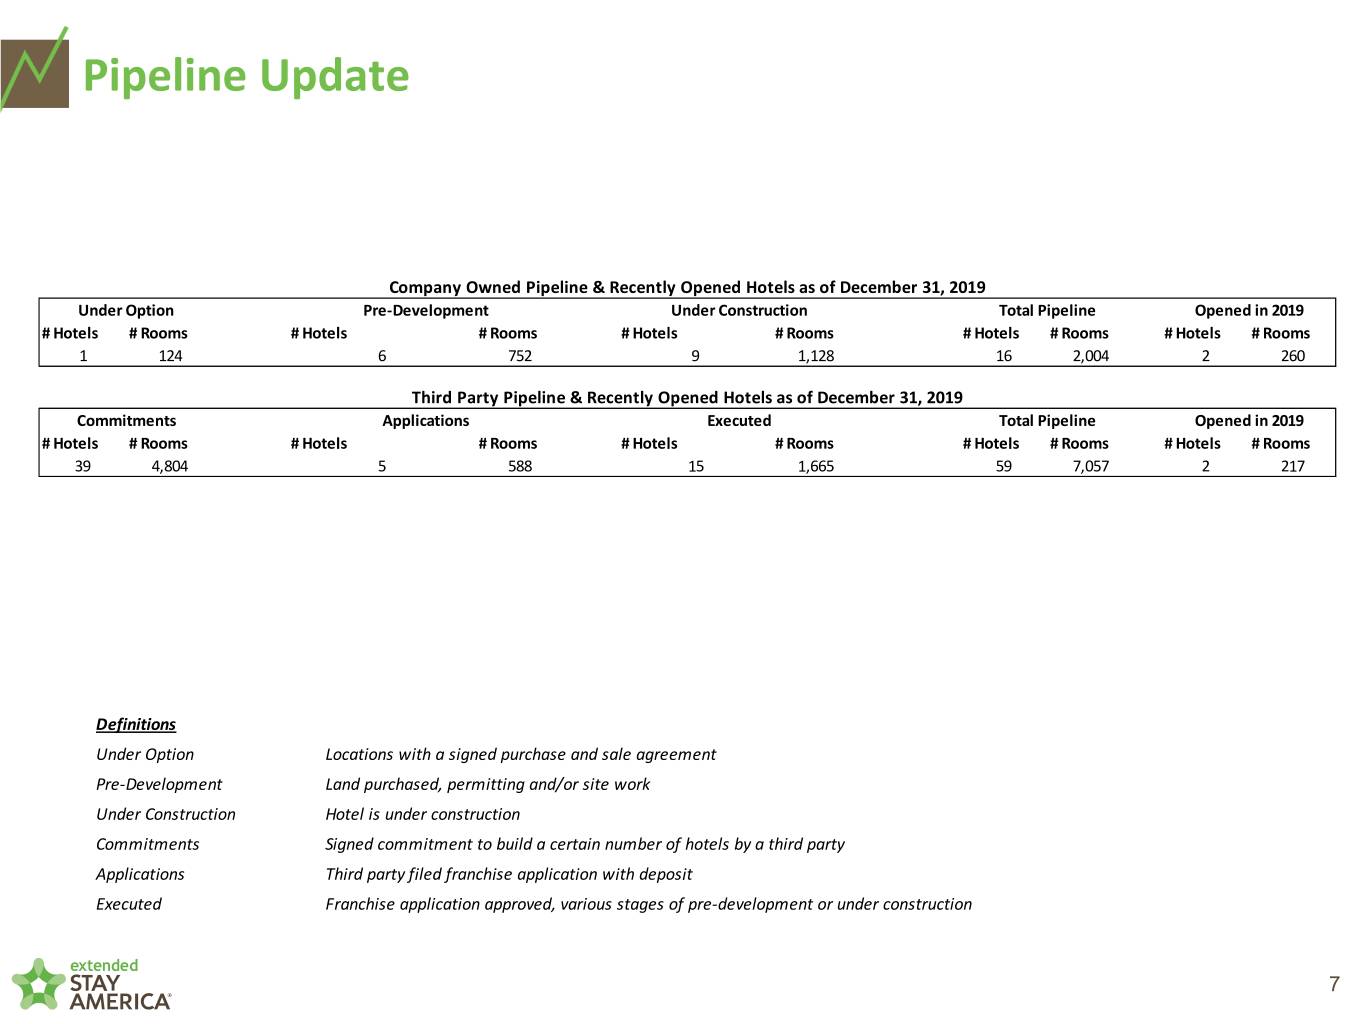
Pipeline Update Company Owned Pipeline & Recently Opened Hotels as of December 31, 2019 Under Option Pre-Development Under Construction Total Pipeline Opened in 2019 # Hotels # Rooms # Hotels # Rooms # Hotels # Rooms # Hotels # Rooms # Hotels # Rooms 1 124 6 752 9 1,128 16 2,004 2 260 Third Party Pipeline & Recently Opened Hotels as of December 31, 2019 Commitments Applications Executed Total Pipeline Opened in 2019 # Hotels # Rooms # Hotels # Rooms # Hotels # Rooms # Hotels # Rooms # Hotels # Rooms 39 4,804 5 588 15 1,665 59 7,057 2 217 Definitions Under Option Locations with a signed purchase and sale agreement Pre-Development Land purchased, permitting and/or site work Under Construction Hotel is under construction Commitments Signed commitment to build a certain number of hotels by a third party Applications Third party filed franchise application with deposit Executed Franchise application approved, various stages of pre-development or under construction 7

Q4 2019 Results, Q1 2020 Outlook1 and Full Year 2020 Outlook1 (in millions, except %) Q4 2019 Outlook Q4 2019 Actual* RevPAR % D -4.5% to -2.0% -0.8% Adjusted EBITDA $109 $119 $108.8 (in millions, except %) Q1 2020 Outlook1 RevPAR % D2 0.0% to 2.0% Adjusted EBITDA $107 $112 (in millions, except %) 2020 Outlook1 Prior Outlook4 RevPAR % D2 -0.5% to 1.5% 1.0% to 2.75% Net income $133 $154 $194 $208 Adjusted EBITDA $505 $525 $595 $610 Depreciation and amortization $195 $200 $213 $213 Net interest expense $135 $135 $130 $130 Effective tax rate 15% 15% 16.5% 17.0% Adjusted Paired Share Income $0.78 $0.90 $1.07 $1.15 per diluted Paired Share Adjusted FFO per diluted Paired $1.68 $1.77 Share Expected capital returns3 $215 $235 $260 $300 Capital expenditures $210 $240 $205 $235 *4Q 2019 results impacted by CEO and related transition costs and unanticipated net legal items totaling approximately $10.0 million compared to our November 7, 2019 guidance. 1 Guidance for Q1 2020 and full year 2020 is as of February 26, 2020. 2 RevPAR % D shown on a Comparable system-wide basis. 8 3 A portion of any proceeds from asset dispositions will be used for incremental Paired Share repurchases.

appendix

NON-GAAP RECONCILIATION OF NET INCOME TO HOTEL OPERATING PROFIT AND HOTEL OPERATING MARGIN FOR THE THREE AND TWELVE MONTHS ENDED DECEMBER 31, 2019 AND 2018 (In thousands) (Unaudited) Three Months Ended Twelve Months Ended December 31, December 31, 2019 2018 Variance 2019 2018 Variance $ 23,846 $ 39,399 (39.5)% Net income $ 165,138 $ 211,756 (22.0)% 1,493 6,858 (78.2)% Income tax expense 29,315 42,076 (30.3)% 31,859 29,798 6.9% Interest expense, net 127,764 124,870 2.3% (143) (813) (82.4)% Other non-operating income (391) (765) (48.9)% (1) (168) (99.4)% Other income (32) (669) (95.2)% - (879) (100.0)% Gain on sale of hotel properties, net - (42,478) (100.0)% - - n/a Impairment of long-lived assets 2,679 43,600 (93.9)% 49,857 49,677 0.4% Depreciation and amortization 197,400 209,329 (5.7)% 27,549 21,384 28.8% General and administrative expenses 95,155 91,094 4.5% 1,035 796 30.0% Loss on disposal of assets (1) 6,072 3,413 77.9% (1,389) (1,171) 18.6% Franchise and management fees (5,412) (3,310) 63.5% Other expenses from franchised and managed 633 308 105.5% properties, net of other revenues 2,154 650 231.4% $ 134,739 $ 145,189 (7.2)% Hotel Operating Profit $ 619,842 $ 679,566 (8.8)% $ 272,397 $ 279,236 (2.4)% Room revenues $1,171,726 $1,237,311 (5.3)% 6,517 5,161 26.3% Other hotel revenues 24,365 21,871 11.4% $ 278,914 $ 284,397 (1.9)% Total room and other hotel revenues $1,196,091 $1,259,182 (5.0)% 48.3% 51.1% (280) bps Hotel Operating Margin 51.8% 54.0% (220) bps (1) Included in hotel operating expenses in the consolidated statements of operations. 10
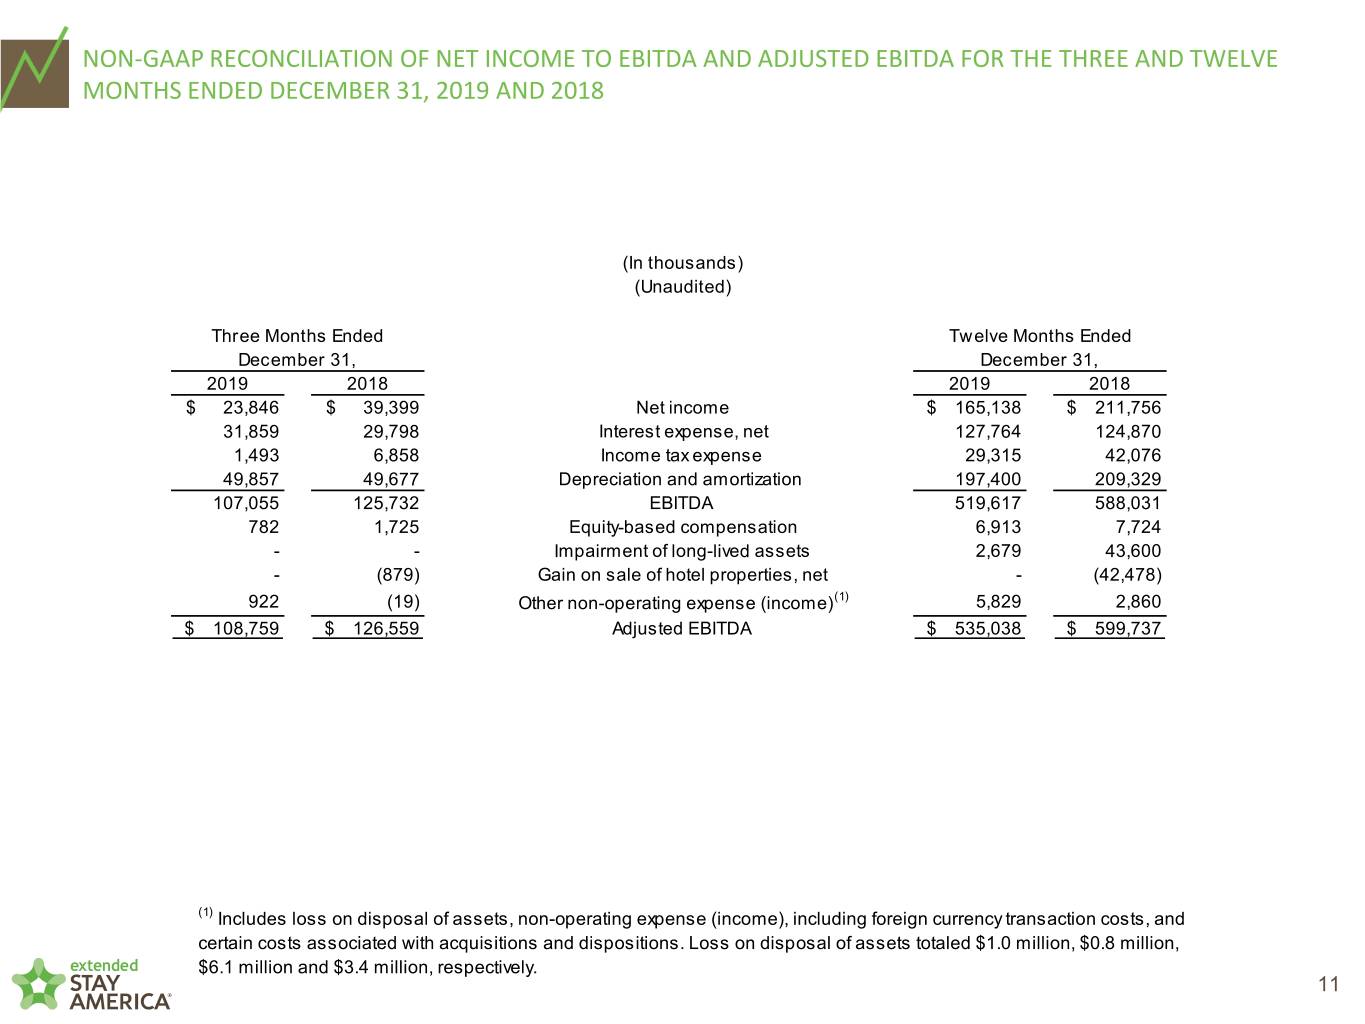
NON-GAAP RECONCILIATION OF NET INCOME TO EBITDA AND ADJUSTED EBITDA FOR THE THREE AND TWELVE MONTHS ENDED DECEMBER 31, 2019 AND 2018 (In thousands) (Unaudited) Three Months Ended Twelve Months Ended December 31, December 31, 2019 2018 2019 2018 $ 23,846 $ 39,399 Net income $ 165,138 $ 211,756 31,859 29,798 Interest expense, net 127,764 124,870 1,493 6,858 Income tax expense 29,315 42,076 49,857 49,677 Depreciation and amortization 197,400 209,329 107,055 125,732 EBITDA 519,617 588,031 782 1,725 Equity-based compensation 6,913 7,724 - - Impairment of long-lived assets 2,679 43,600 - (879) Gain on sale of hotel properties, net - (42,478) 922 (19) Other non-operating expense (income)(1) 5,829 2,860 $ 108,759 $ 126,559 Adjusted EBITDA $ 535,038 $ 599,737 (1) Includes loss on disposal of assets, non-operating expense (income), including foreign currency transaction costs, and certain costs associated with acquisitions and dispositions. Loss on disposal of assets totaled $1.0 million, $0.8 million, $6.1 million and $3.4 million, respectively. 11
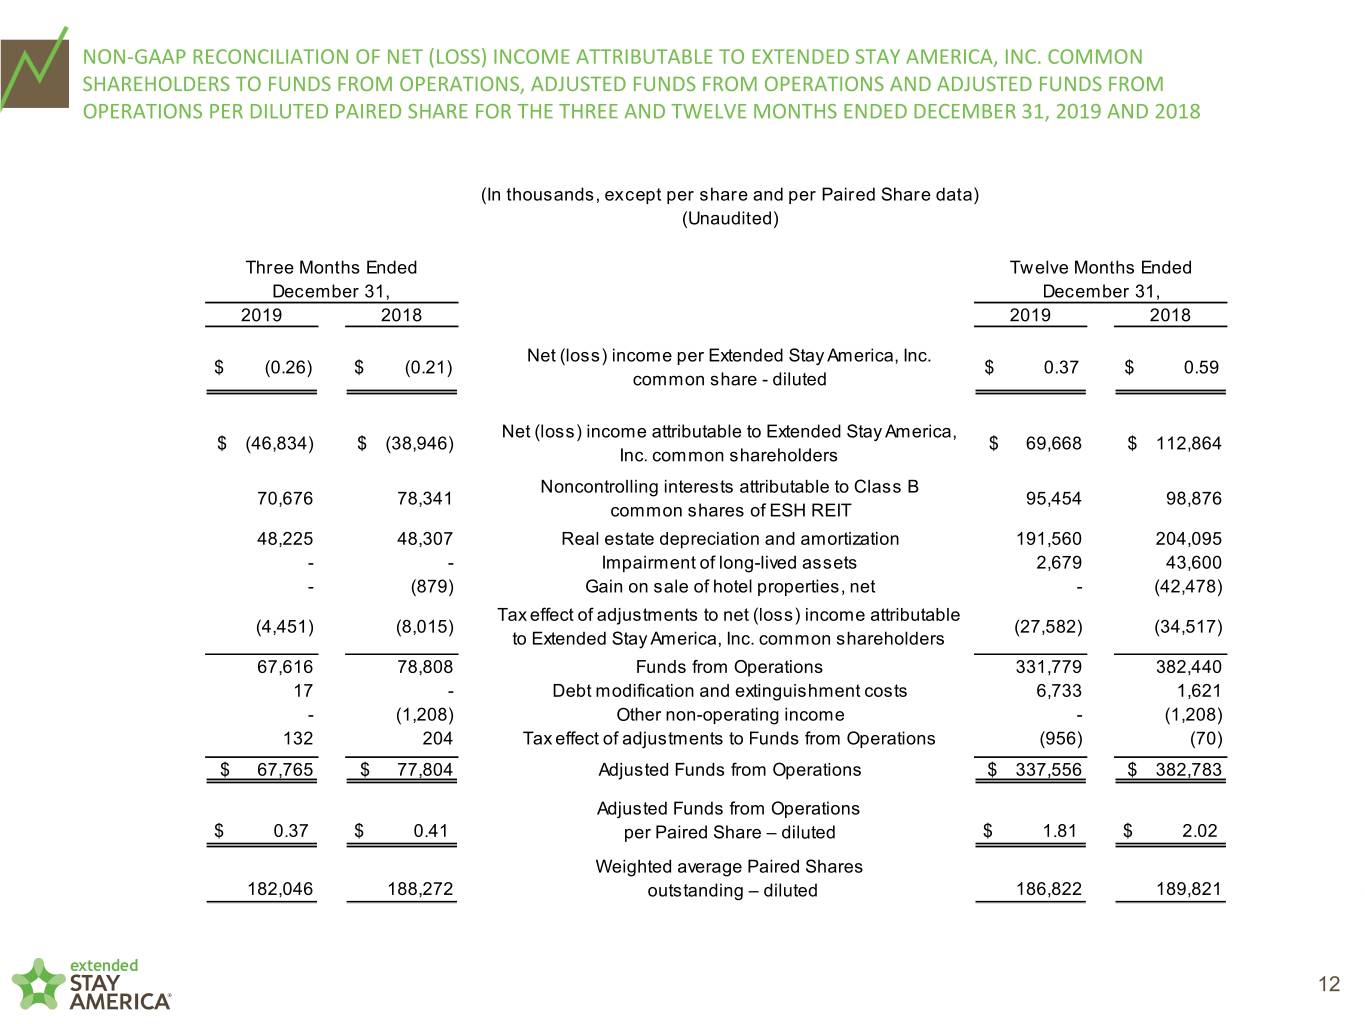
NON-GAAP RECONCILIATION OF NET (LOSS) INCOME ATTRIBUTABLE TO EXTENDED STAY AMERICA, INC. COMMON SHAREHOLDERS TO FUNDS FROM OPERATIONS, ADJUSTED FUNDS FROM OPERATIONS AND ADJUSTED FUNDS FROM OPERATIONS PER DILUTED PAIRED SHARE FOR THE THREE AND TWELVE MONTHS ENDED DECEMBER 31, 2019 AND 2018 (In thousands, except per share and per Paired Share data) (Unaudited) Three Months Ended Twelve Months Ended December 31, December 31, 2019 2018 2019 2018 Net (loss) income per Extended Stay America, Inc. $ (0.26) $ (0.21) $ 0.37 $ 0.59 common share - diluted Net (loss) income attributable to Extended Stay America, $ (46,834) $ (38,946) $ 69,668 $ 112,864 Inc. common shareholders Noncontrolling interests attributable to Class B 70,676 78,341 95,454 98,876 common shares of ESH REIT 48,225 48,307 Real estate depreciation and amortization 191,560 204,095 - - Impairment of long-lived assets 2,679 43,600 - (879) Gain on sale of hotel properties, net - (42,478) Tax effect of adjustments to net (loss) income attributable (4,451) (8,015) (27,582) (34,517) to Extended Stay America, Inc. common shareholders 67,616 78,808 Funds from Operations 331,779 382,440 17 - Debt modification and extinguishment costs 6,733 1,621 - (1,208) Other non-operating income - (1,208) 132 204 Tax effect of adjustments to Funds from Operations (956) (70) $ 67,765 $ 77,804 Adjusted Funds from Operations $ 337,556 $ 382,783 Adjusted Funds from Operations $ 0.37 $ 0.41 per Paired Share – diluted $ 1.81 $ 2.02 Weighted average Paired Shares 182,046 188,272 outstanding – diluted 186,822 189,821 12

NON-GAAP RECONCILIATION OF NET (LOSS) INCOME ATTRIBUTABLE TO EXTENDED STAY AMERICA, INC. COMMON SHAREHOLDERS TO PAIRED SHARE INCOME, ADJUSTED PAIRED SHARE INCOME AND ADJUSTED PAIRED SHARE INCOME PER DILUTED PAIRED SHARE FOR THE THREE AND TWELVE MONTHS ENDED DECEMBER 31, 2019 AND 2018 (In thousands, except per share and per Paired Share data) (Unaudited) Three Months Ended Twelve Months Ended December 31, December 31, 2019 2018 2019 2018 Net (loss) income per Extended Stay America, Inc. $ (0.26) $ (0.21) $ 0.37 $ 0.59 common share - diluted Net (loss) income attributable to Extended Stay America, $ (46,834) $ (38,946) Inc. common shareholders $ 69,668 $ 112,864 Noncontrolling interests attributable to Class B 70,676 78,341 common shares of ESH REIT 95,454 98,876 23,842 39,395 Paired Share Income 165,122 211,740 17 - Debt modification and extinguishment costs 6,733 1,621 - - Impairment of long-lived assets 2,679 43,600 - (879) Gain on sale of hotel properties, net - (42,478) 922 (19) Other non-operating expense (income)(1) 5,829 2,860 136 152 Tax effect of adjustments to Paired Share Income (2,163) (937) $ 24,917 $ 38,649 Adjusted Paired Share Income $ 178,200 $ 216,406 $ 0.14 $ 0.21 Adjusted Paired Share Income per Paired Share – diluted $ 0.95 $ 1.14 182,046 188,272 Weighted average Paired Shares outstanding – diluted 186,822 189,821 (1) Includes loss on disposal of assets, non-operating expense (income), including foreign currency transaction costs, and certain costs associated with acquisitions and dispositions. Loss on disposal of assets totaled $1.0 million, $0.8 million, $6.1 million and $3.4 million, respectively. 13
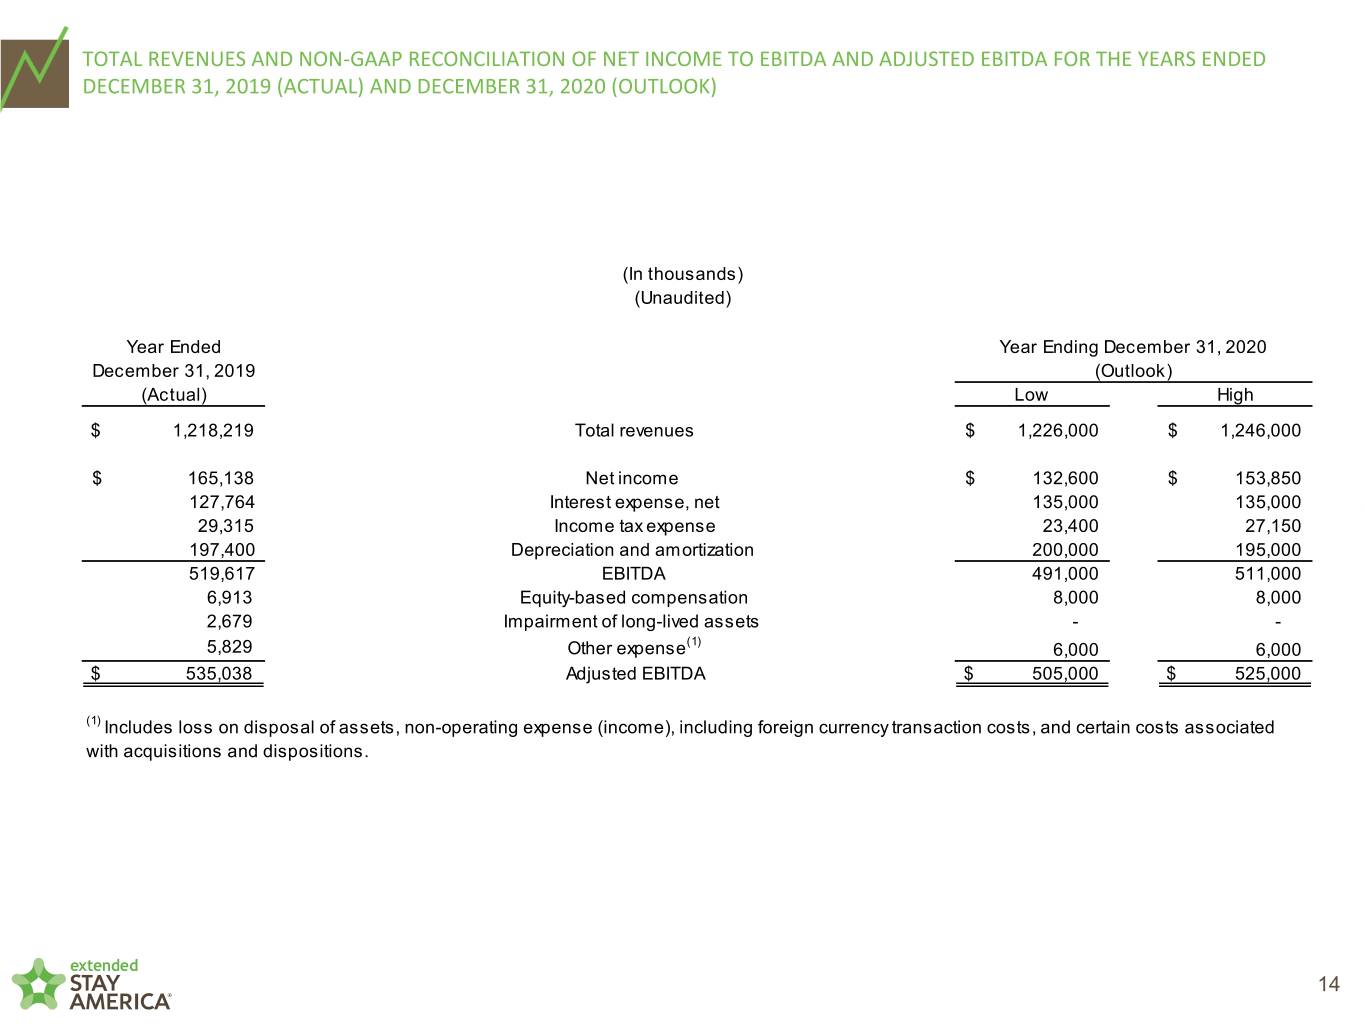
TOTAL REVENUES AND NON-GAAP RECONCILIATION OF NET INCOME TO EBITDA AND ADJUSTED EBITDA FOR THE YEARS ENDED DECEMBER 31, 2019 (ACTUAL) AND DECEMBER 31, 2020 (OUTLOOK) (In thousands) (Unaudited) Year Ended Year Ending December 31, 2020 December 31, 2019 (Outlook) (Actual) Low High $ 1,218,219 Total revenues $ 1,226,000 $ 1,246,000 $ 165,138 Net income $ 132,600 $ 153,850 127,764 Interest expense, net 135,000 135,000 29,315 Income tax expense 23,400 27,150 197,400 Depreciation and amortization 200,000 195,000 519,617 EBITDA 491,000 511,000 6,913 Equity-based compensation 8,000 8,000 2,679 Impairment of long-lived assets - - 5,829 Other expense(1) 6,000 6,000 $ 535,038 Adjusted EBITDA $ 505,000 $ 525,000 (1) Includes loss on disposal of assets, non-operating expense (income), including foreign currency transaction costs, and certain costs associated with acquisitions and dispositions. 14

NON-GAAP RECONCILIATION OF NET INCOME ATTRIBUTABLE TO EXTENDED STAY AMERICA, INC. COMMON SHAREHOLDERS TO FFO, ADJUSTED FFO AND ADJUSTED FFO PER DILUTED PAIRED SHARE FOR THE YEARS ENDED DECEMBER 31, 2019 (ACTUAL) AND DECEMBER 31, 2020 (OUTLOOK) (In thousands, except per share and per Paired Share data) (Unaudited) Year Ended Year Ending December 31, 2020 December 31, 2019 (Outlook) (Actual) Low High $ 0.37 Net income per Extended Stay America, Inc. common share - diluted $ 0.28 $ 0.36 Net income attributable to Extended Stay America, Inc. common $ 69,668 $ 50,424 $ 63,354 shareholders Noncontrolling interests attributable to Class B 95,454 82,160 90,480 common shares of ESH REIT 191,560 Real estate depreciation and amortization 194,000 189,000 2,679 Impairment of long-lived assets - - Tax effect of adjustments to net income attributable to Extended Stay (27,582) (29,100) (28,350) America, Inc. common shareholders 331,779 Funds from Operations 297,484 314,484 6,733 Debt modification and extinguishment costs - - (956) Tax effect of adjustments to Funds from Operations - - $ 337,556 Adjusted Funds from Operations $ 297,484 $ 314,484 Adjusted Funds from Operations $ 1.81 per Paired Share – diluted $ 1.68 $ 1.77 Weighted average Paired Shares 186,822 outstanding – diluted 177,500 177,500 15
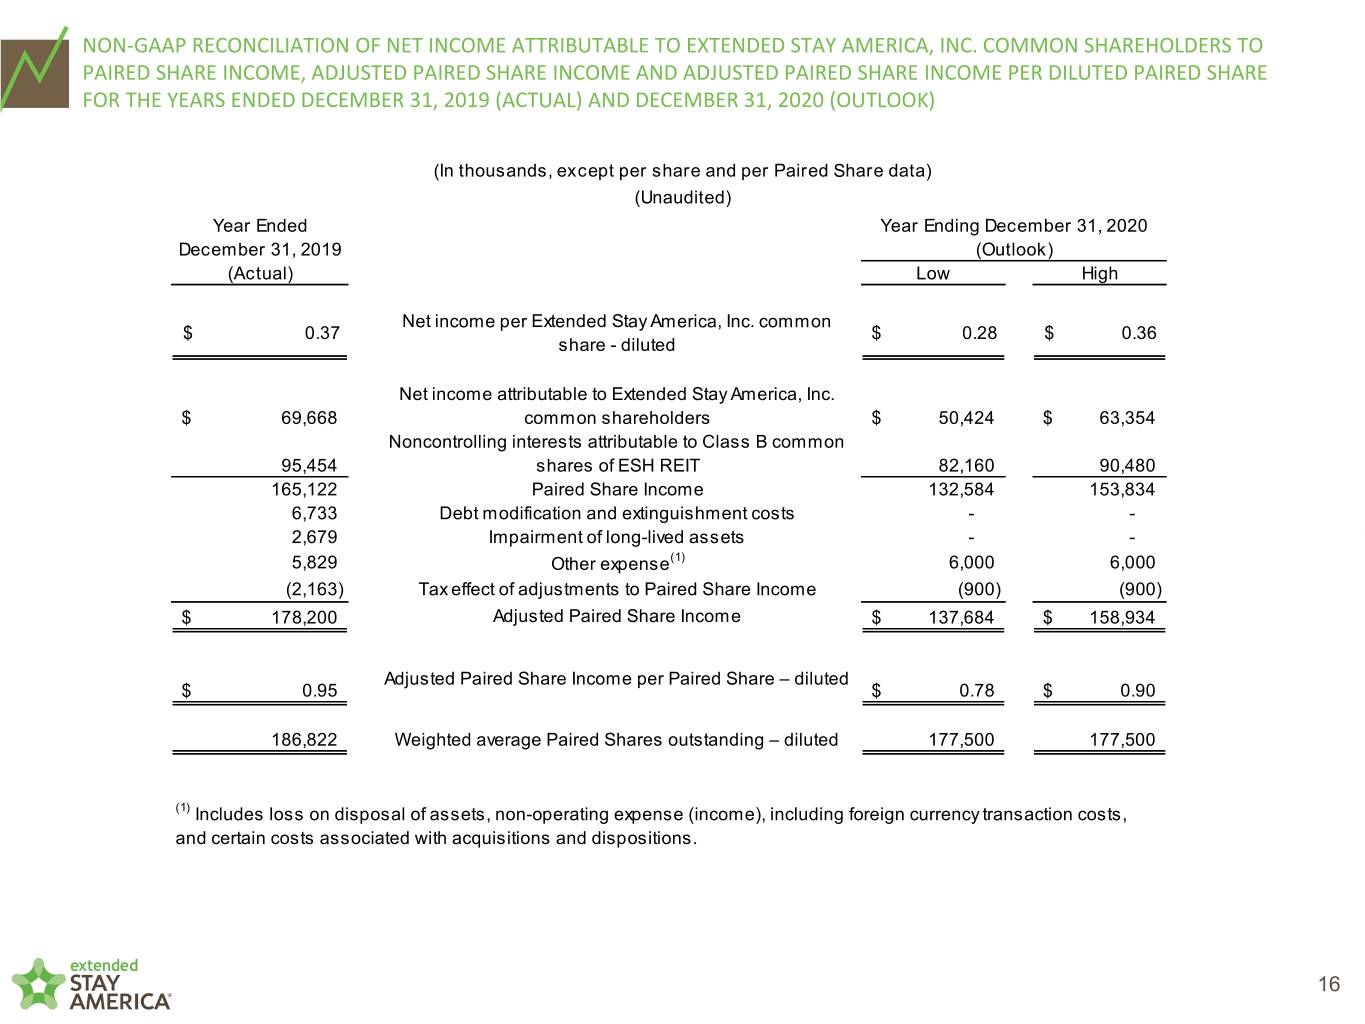
NON-GAAP RECONCILIATION OF NET INCOME ATTRIBUTABLE TO EXTENDED STAY AMERICA, INC. COMMON SHAREHOLDERS TO PAIRED SHARE INCOME, ADJUSTED PAIRED SHARE INCOME AND ADJUSTED PAIRED SHARE INCOME PER DILUTED PAIRED SHARE FOR THE YEARS ENDED DECEMBER 31, 2019 (ACTUAL) AND DECEMBER 31, 2020 (OUTLOOK) (In thousands, except per share and per Paired Share data) (Unaudited) Year Ended Year Ending December 31, 2020 December 31, 2019 (Outlook) (Actual) Low High Net income per Extended Stay America, Inc. common $ 0.37 $ 0.28 $ 0.36 share - diluted Net income attributable to Extended Stay America, Inc. $ 69,668 common shareholders $ 50,424 $ 63,354 Noncontrolling interests attributable to Class B common 95,454 shares of ESH REIT 82,160 90,480 165,122 Paired Share Income 132,584 153,834 6,733 Debt modification and extinguishment costs - - 2,679 Impairment of long-lived assets - - 5,829 Other expense(1) 6,000 6,000 (2,163) Tax effect of adjustments to Paired Share Income (900) (900) $ 178,200 Adjusted Paired Share Income $ 137,684 $ 158,934 Adjusted Paired Share Income per Paired Share – diluted $ 0.95 $ 0.78 $ 0.90 186,822 Weighted average Paired Shares outstanding – diluted 177,500 177,500 (1) Includes loss on disposal of assets, non-operating expense (income), including foreign currency transaction costs, and certain costs associated with acquisitions and dispositions. 16
