Attached files
| file | filename |
|---|---|
| EX-99.1 - EXHIBIT 99.1 EARNINGS RELESE Q4 2019 - Delek US Holdings, Inc. | dk-ex991earningsreleas.htm |
| 8-K - 8-K - Delek US Holdings, Inc. | dkform8-kearningsrelea.htm |
Exhibit 99.2 Delek US Holdings, Inc. Fourth Quarter 2019 Earnings Call February 26, 2020
Disclaimers Forward Looking Statements: Delek US Holdings, Inc. (“Delek US”) and Delek Logistics Partners, LP (“Delek Logistics”; and collectively with Delek US, “we” or “our”) are traded on the New York Stock Exchange in the United States under the symbols “DK” and ”DKL”, respectively. These slides and any accompanying oral and written presentations contain forward-looking statements within the meaning of federal securities laws that are based upon current expectations and involve a number of risks and uncertainties. Statements concerning current estimates, expectations and projections about future results, performance, prospects, opportunities, plans, actions and events and other statements, concerns, or matters that are not historical facts are “forward-looking statements,” as that term is defined under the federal securities laws. These forward-looking statements include, but are not limited to, the statements regarding the following: financial and operating guidance for future and uncompleted financial periods; future crude slates; financial strength and flexibility; potential for and projections of growth; return of cash to shareholders, stock repurchases and the payment of dividends, including the amount and timing thereof; crude oil throughput; crude oil market trends, including production, quality, pricing, demand, imports, exports and transportation costs; light production from shale plays and Permian growth; differentials including increases, trends and the impact thereof on crack spreads and refineries; pipeline takeaway capacity and projects related thereto; refinery complexity, configurations, utilization, crude oil slate flexibility, capacities, equipment limits and margins; the ability to add flexibility and increase margin potential at the Krotz Springs refinery; improved product netbacks; the performance of our joint venture investments, including Red River and Wink to Webster, and the benefits, flexibility, returns and EBITDA therefrom; our ability to execute on the Big Spring Gathering System and the benefits, flexibility, returns and EBITDA therefrom; the potential for, and estimates of cost savings and other benefits from, acquisitions, divestitures, dropdowns and financing activities; divestiture of non-core assets and matters pertaining thereto; the attainment of certain regulatory benefits; retail growth and the opportunities and value derived therefrom; long-term value creation from capital allocation; execution of strategic initiatives and the benefits therefrom; and access to crude oil and the benefits therefrom. Words such as "may," "will," "should," "could," "would," "predicts," "potential," "continue," "expects," "anticipates," "future," "intends," "plans," "believes," "estimates," "appears," "projects" and similar expressions, as well as statements in future tense, identify forward-looking statements. Investors are cautioned that the following important factors, among others, may affect these forward-looking statements: uncertainty related to timing and amount of value returned to shareholders; risks and uncertainties with respect to the quantities and costs of crude oil we are able to obtain and the price of the refined petroleum products we ultimately sell; risks related to Delek US’ exposure to Permian Basin crude oil, such as supply, pricing, production and transportation capacity; gains and losses from derivative instruments; management's ability to execute its strategy of growth through acquisitions and the transactional risks associated with acquisitions and dispositions; acquired assets may suffer a diminishment in fair value as a result of which we may need to record a write-down or impairment in carrying value of the asset; changes in the scope, costs, and/or timing of capital and maintenance projects; the ability of the Wink to Webster joint venture to construct the long-haul pipeline; the ability of the Red River joint venture to expand the Red River pipeline; the ability to grow the Big Spring Gathering System; operating hazards inherent in transporting, storing and processing crude oil and intermediate and finished petroleum products; our competitive position and the effects of competition; the projected growth of the industries in which we operate; general economic and business conditions affecting the geographic areas in which we operate; and other risks contained in Delek US’ and Delek Logistics’ filings with the United States Securities and Exchange Commission. Forward-looking statements should not be read as a guarantee of future performance or results, and will not be accurate indications of the times at, or by which such performance or results will be achieved. Forward-looking information is based on information available at the time and/or management’s good faith belief with respect to future events, and is subject to risks and uncertainties that could cause actual performance or results to differ materially from those expressed in the statements. Neither Delek US nor Delek Logistics undertakes any obligation to update or revise any such forward-looking statements. Non-GAAP Disclosures: Delek US and Delek Logistics believe that the presentation of adjusted net income, adjusted earnings per share (“adjusted EPS”), earnings before interest, taxes, depreciation and amortization ("EBITDA") and adjusted EBITDA provide useful information to investors in assessing their financial condition, results of operations and cash flow their business is generating. Adjusted net income, adjusted EPS, EBITDA and adjusted EBITDA should not be considered as alternatives to net income, operating income, cash from operations or any other measure of financial performance or liquidity presented in accordance with U.S. GAAP. Adjusted net income, adjusted EPS, EBITDA and adjusted EBITDA have important limitations as analytical tools because they exclude some, but not all, items that affect net income. Additionally, because adjusted net income, adjusted EPS, EBITDA and adjusted EBITDA may be defined differently by other companies in its industry, Delek US' and Delek Logistics’ definitions may not be comparable to similarly titled measures of other companies, thereby diminishing their utility. Please see reconciliations of adjusted net income, adjusted EPS, EBITDA and adjusted EBITDA to their most directly comparable financial measures calculated and presented in accordance with U.S. GAAP in the appendix. 2
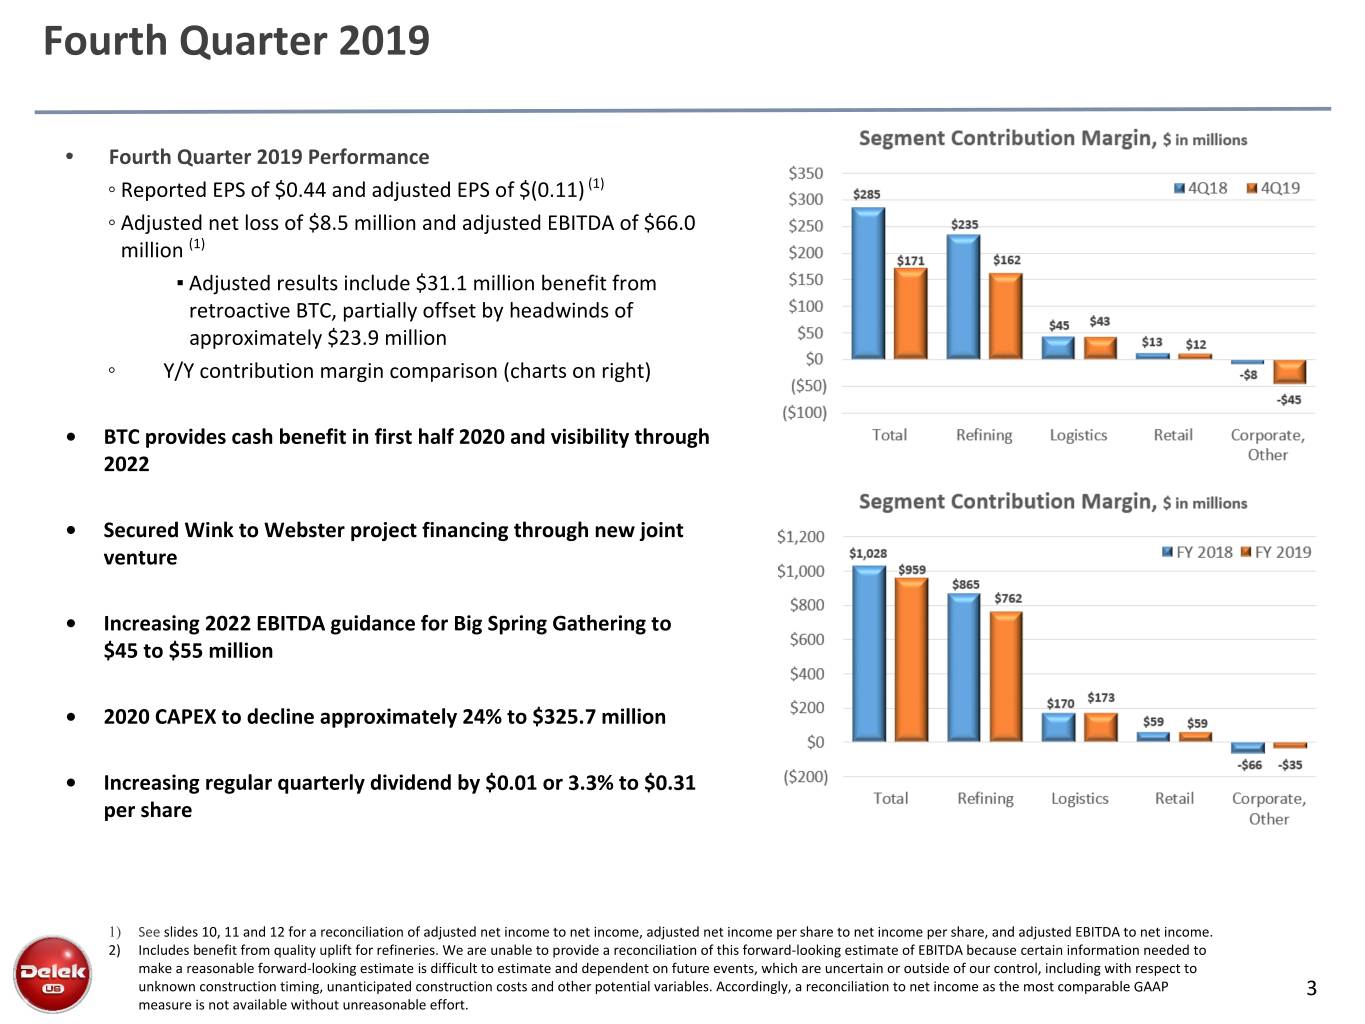
Fourth Quarter 2019 • Fourth Quarter 2019 Performance ◦ Reported EPS of $0.44 and adjusted EPS of $(0.11) (1) ◦ Adjusted net loss of $8.5 million and adjusted EBITDA of $66.0 million (1) ▪ Adjusted results include $31.1 million benefit from retroactive BTC, partially offset by headwinds of approximately $23.9 million ◦ Y/Y contribution margin comparison (charts on right) • BTC provides cash benefit in first half 2020 and visibility through 2022 • Secured Wink to Webster project financing through new joint venture • Increasing 2022 EBITDA guidance for Big Spring Gathering to $45 to $55 million • 2020 CAPEX to decline approximately 24% to $325.7 million • Increasing regular quarterly dividend by $0.01 or 3.3% to $0.31 per share 1) See slides 10, 11 and 12 for a reconciliation of adjusted net income to net income, adjusted net income per share to net income per share, and adjusted EBITDA to net income. 2) Includes benefit from quality uplift for refineries. We are unable to provide a reconciliation of this forward-looking estimate of EBITDA because certain information needed to make a reasonable forward-looking estimate is difficult to estimate and dependent on future events, which are uncertain or outside of our control, including with respect to unknown construction timing, unanticipated construction costs and other potential variables. Accordingly, a reconciliation to net income as the most comparable GAAP 3 measure is not available without unreasonable effort.
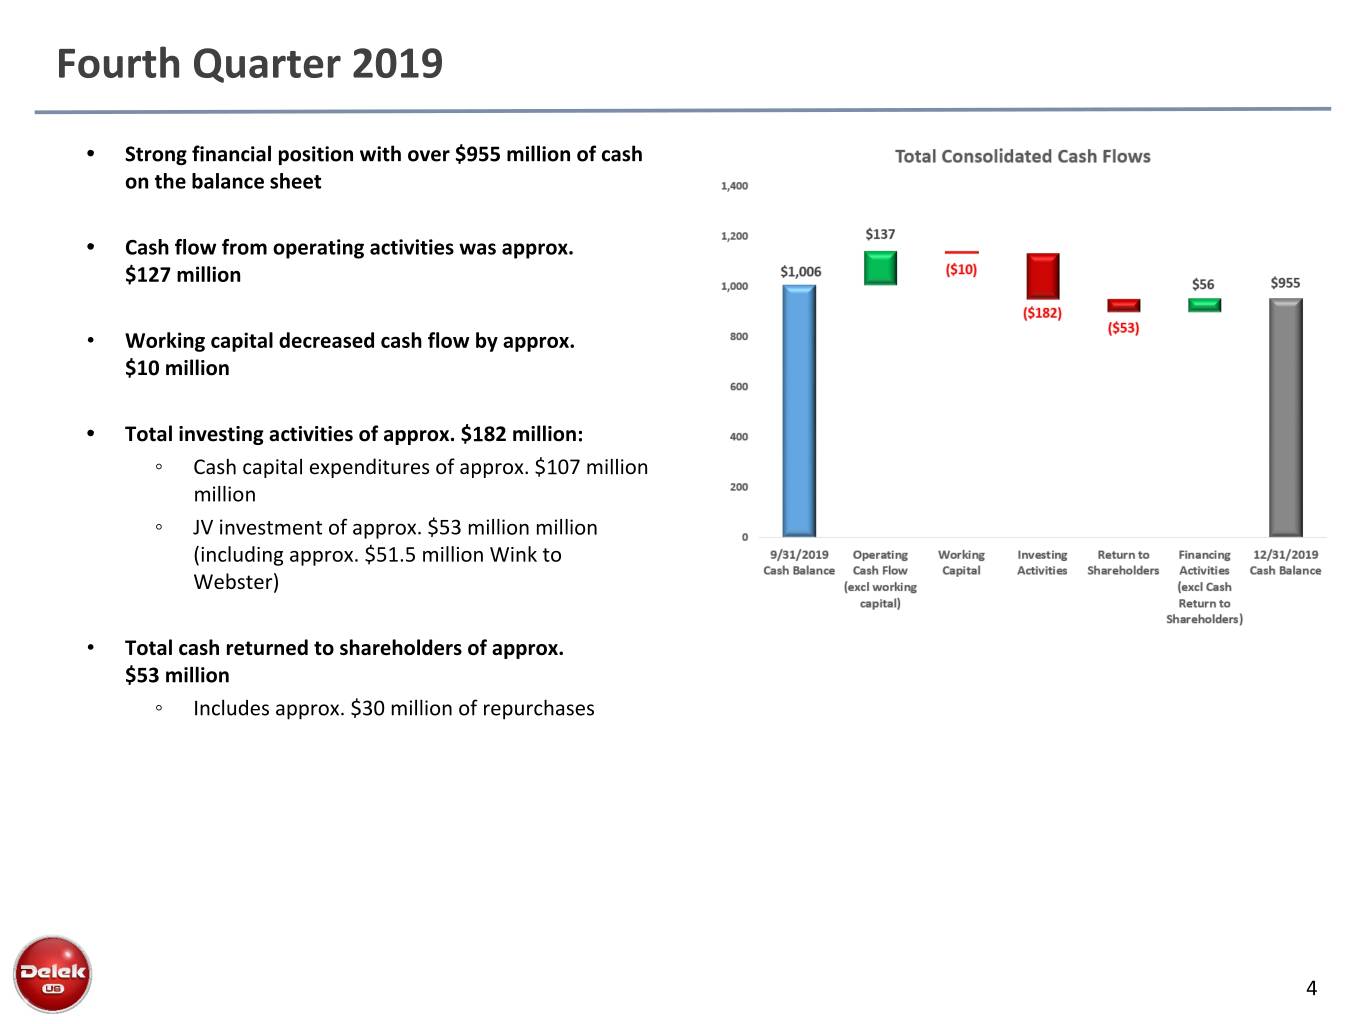
Fourth Quarter 2019 • Strong financial position with over $955 million of cash on the balance sheet • Cash flow from operating activities was approx. $127 million • Working capital decreased cash flow by approx. $10 million • Total investing activities of approx. $182 million: ◦ Cash capital expenditures of approx. $107 million million ◦ JV investment of approx. $53 million million (including approx. $51.5 million Wink to Webster) • Total cash returned to shareholders of approx. $53 million ◦ Includes approx. $30 million of repurchases 4
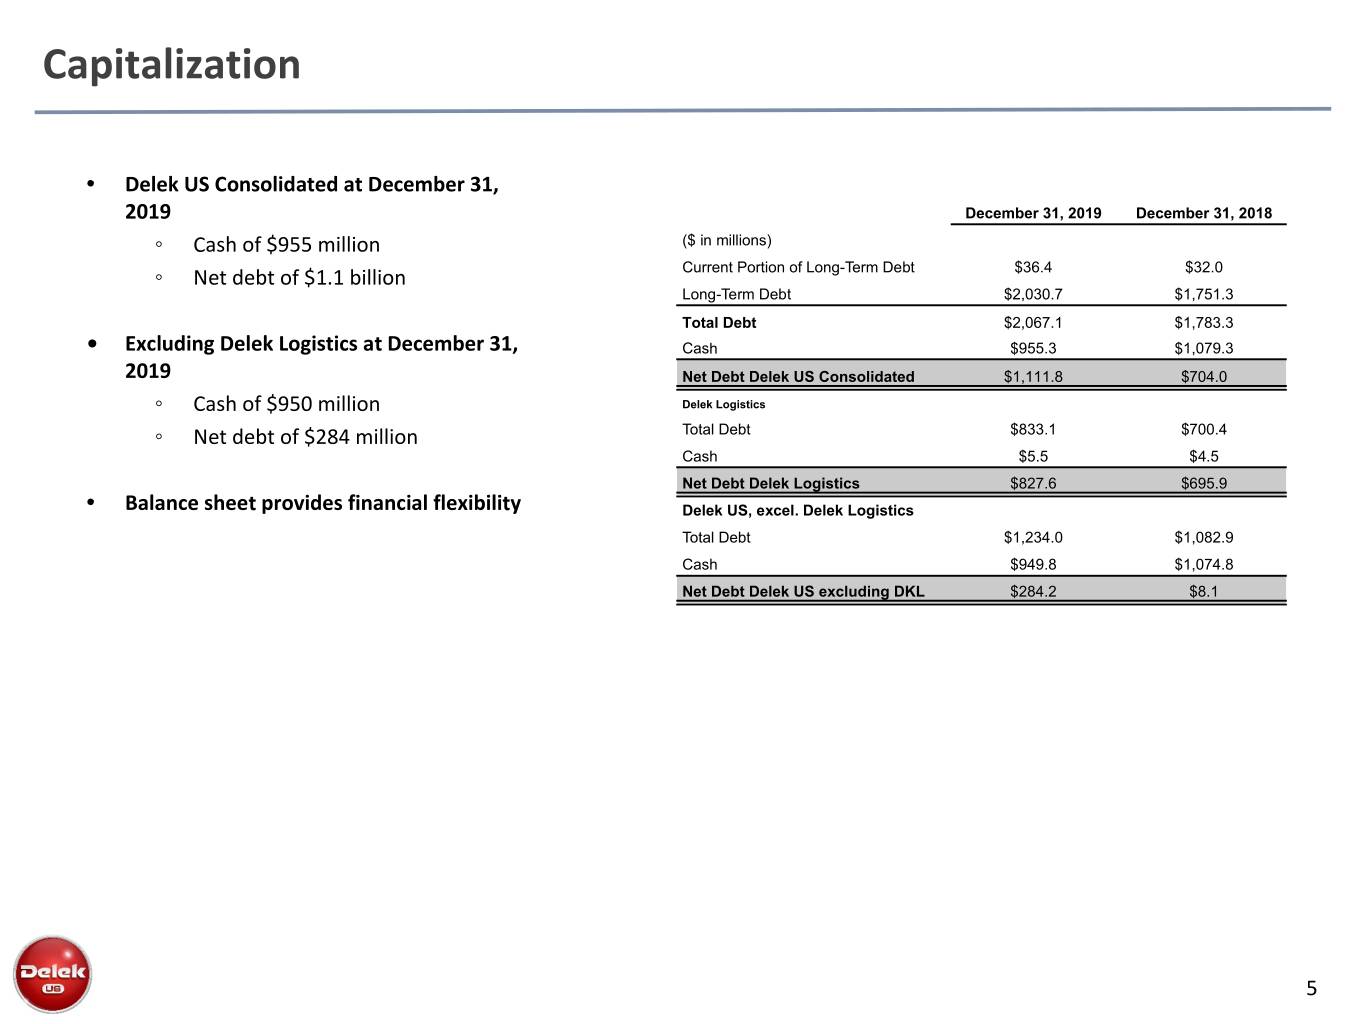
Capitalization • Delek US Consolidated at December 31, 2019 December 31, 2019 December 31, 2018 ◦ Cash of $955 million ($ in millions) Current Portion of Long-Term Debt $36.4 $32.0 ◦ Net debt of $1.1 billion Long-Term Debt $2,030.7 $1,751.3 Total Debt $2,067.1 $1,783.3 • Excluding Delek Logistics at December 31, Cash $955.3 $1,079.3 2019 Net Debt Delek US Consolidated $1,111.8 $704.0 ◦ Cash of $950 million Delek Logistics ◦ Net debt of $284 million Total Debt $833.1 $700.4 Cash $5.5 $4.5 Net Debt Delek Logistics $827.6 $695.9 • Balance sheet provides financial flexibility Delek US, excel. Delek Logistics Total Debt $1,234.0 $1,082.9 Cash $949.8 $1,074.8 Net Debt Delek US excluding DKL $284.2 $8.1 5
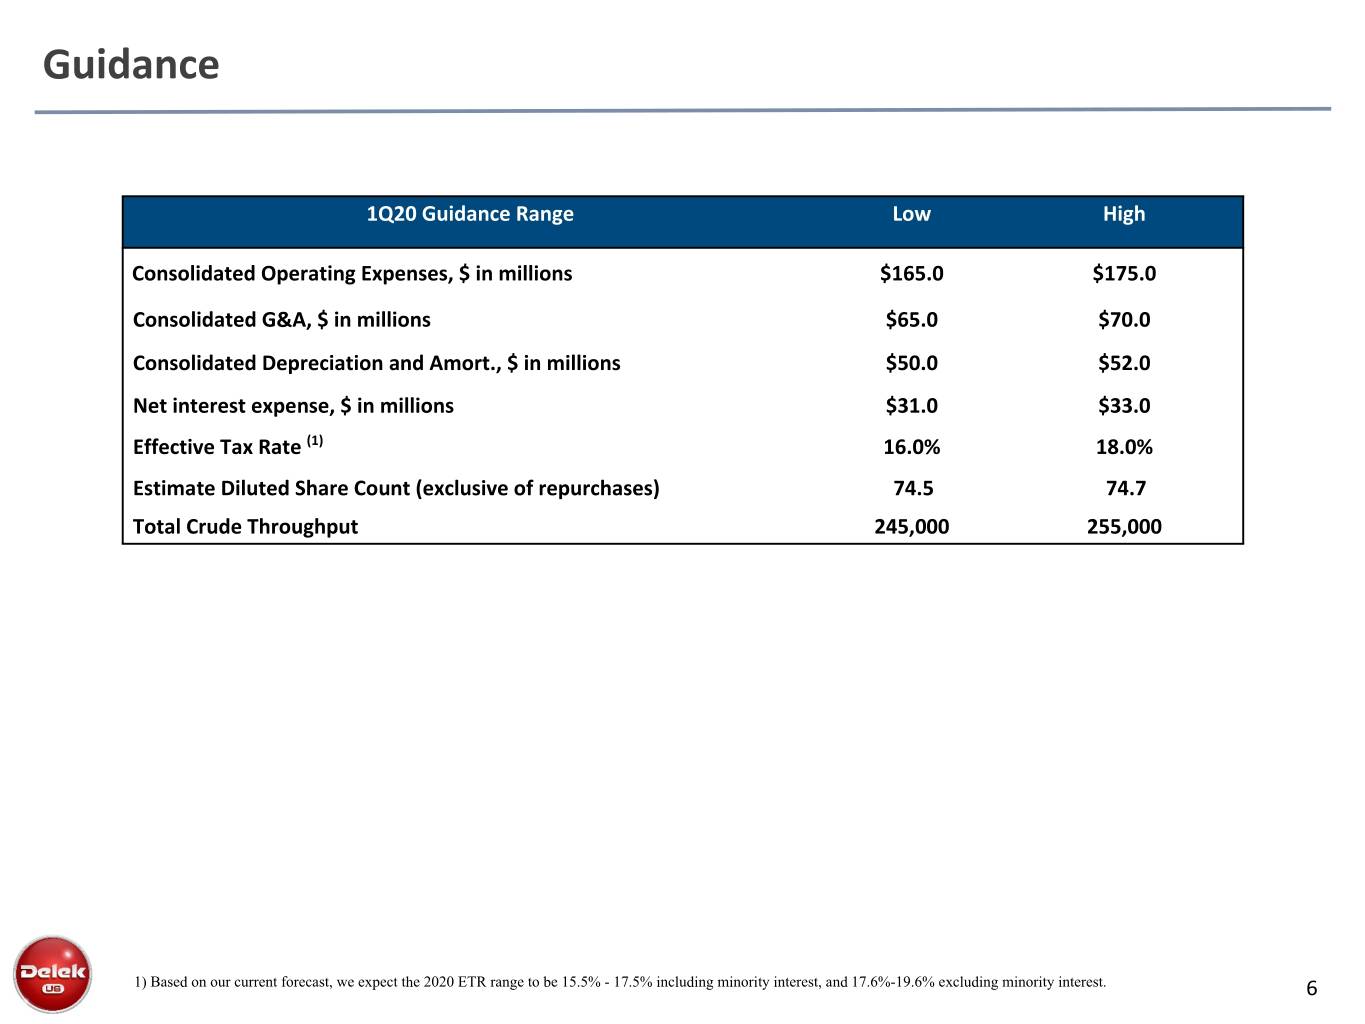
Guidance 1Q20 Guidance Range Low High Consolidated Operating Expenses, $ in millions $165.0 $175.0 Consolidated G&A, $ in millions $65.0 $70.0 Consolidated Depreciation and Amort., $ in millions $50.0 $52.0 Net interest expense, $ in millions $31.0 $33.0 Effective Tax Rate (1) 16.0% 18.0% Estimate Diluted Share Count (exclusive of repurchases) 74.5 74.7 Total Crude Throughput 245,000 255,000 1) Based on our current forecast, we expect the 2020 ETR range to be 15.5% - 17.5% including minority interest, and 17.6%-19.6% excluding minority interest. 6
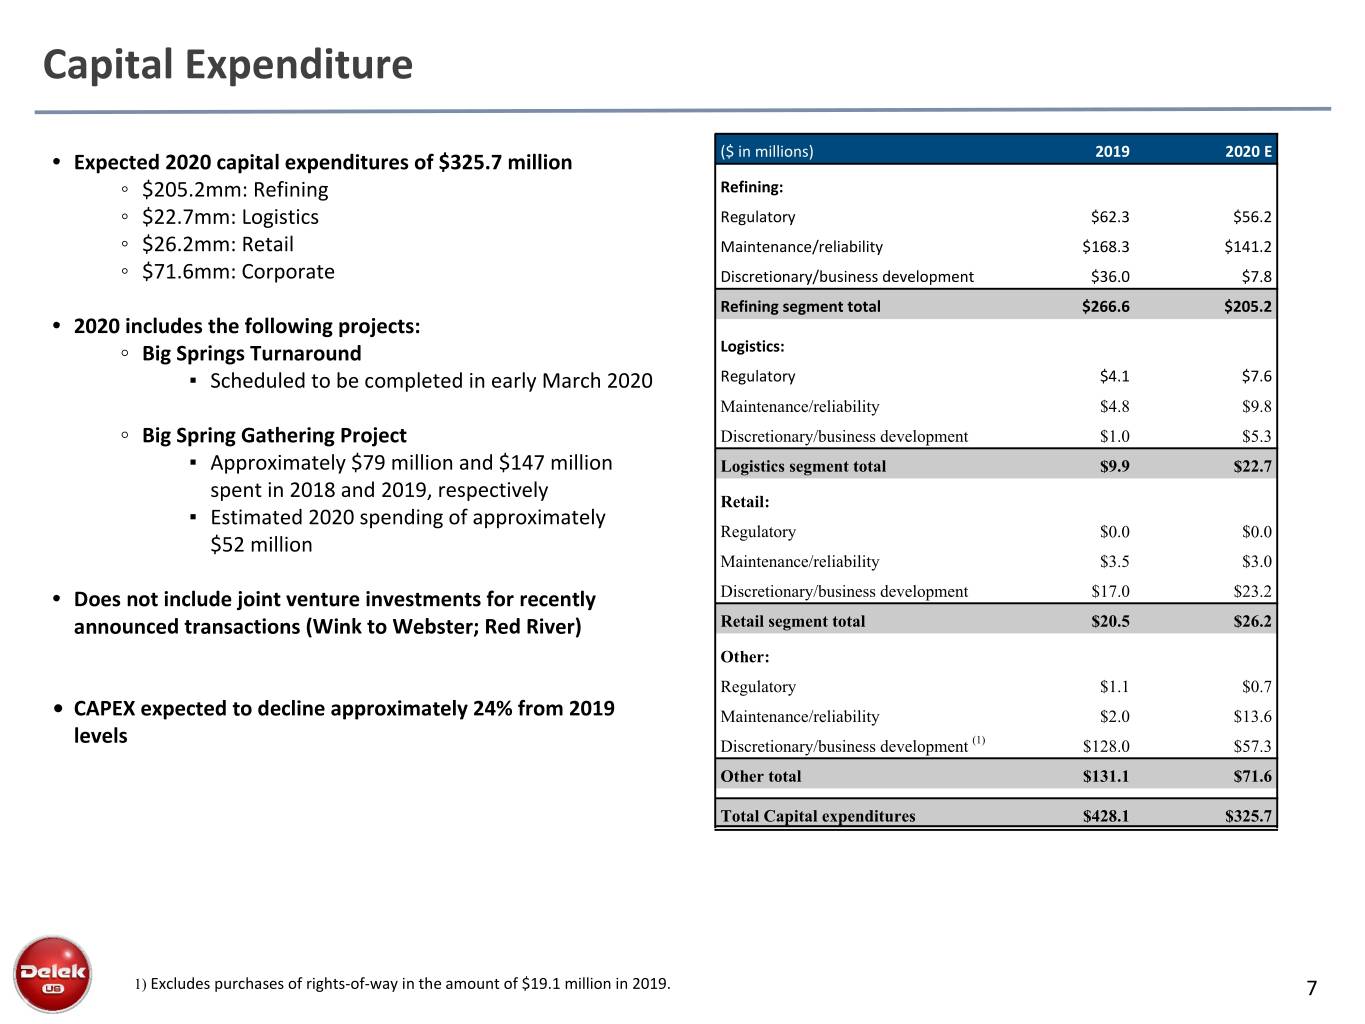
Capital Expenditure • Expected 2020 capital expenditures of $325.7 million ($ in millions) 2019 2020 E ◦ $205.2mm: Refining Refining: ◦ $22.7mm: Logistics Regulatory $62.3 $56.2 ◦ $26.2mm: Retail Maintenance/reliability $168.3 $141.2 ◦ $71.6mm: Corporate Discretionary/business development $36.0 $7.8 Refining segment total $266.6 $205.2 • 2020 includes the following projects: ◦ Big Springs Turnaround Logistics: ▪ Scheduled to be completed in early March 2020 Regulatory $4.1 $7.6 Maintenance/reliability $4.8 $9.8 ◦ Big Spring Gathering Project Discretionary/business development $1.0 $5.3 ▪ Approximately $79 million and $147 million Logistics segment total $9.9 $22.7 spent in 2018 and 2019, respectively Retail: ▪ Estimated 2020 spending of approximately Regulatory $0.0 $0.0 $52 million Maintenance/reliability $3.5 $3.0 • Does not include joint venture investments for recently Discretionary/business development $17.0 $23.2 announced transactions (Wink to Webster; Red River) Retail segment total $20.5 $26.2 Other: Regulatory $1.1 $0.7 • CAPEX expected to decline approximately 24% from 2019 Maintenance/reliability $2.0 $13.6 levels Discretionary/business development (1) $128.0 $57.3 Other total $131.1 $71.6 Total Capital expenditures $428.1 $325.7 1) Excludes purchases of rights-of-way in the amount of $19.1 million in 2019. 7
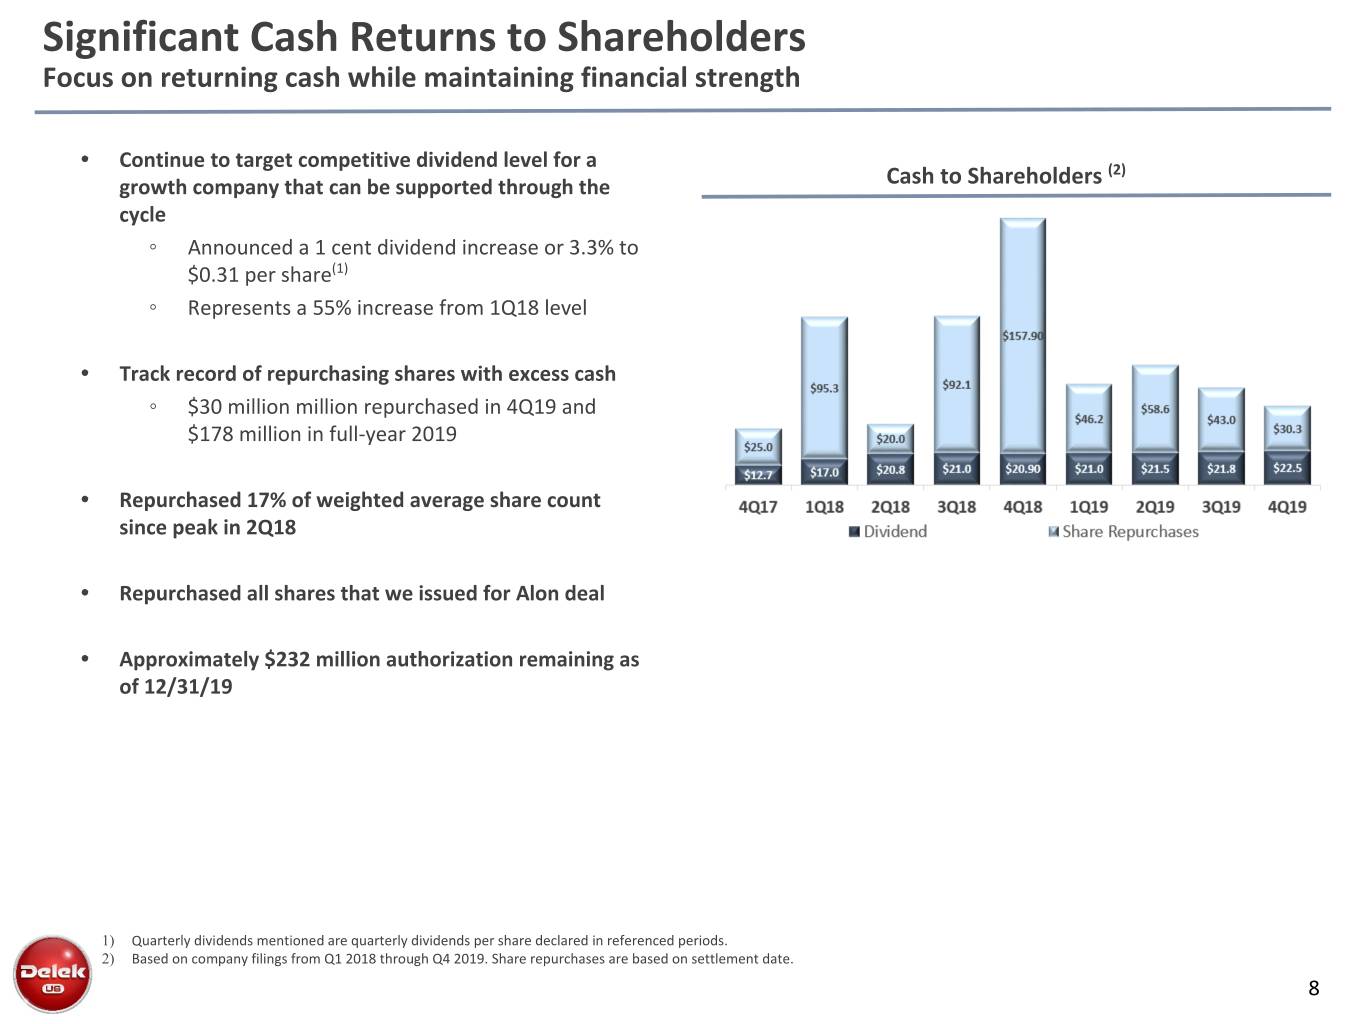
Significant Cash Returns to Shareholders Focus on returning cash while maintaining financial strength • Continue to target competitive dividend level for a (2) growth company that can be supported through the Cash to Shareholders cycle ◦ Announced a 1 cent dividend increase or 3.3% to $0.31 per share(1) ◦ Represents a 55% increase from 1Q18 level • Track record of repurchasing shares with excess cash ◦ $30 million million repurchased in 4Q19 and $178 million in full-year 2019 • Repurchased 17% of weighted average share count since peak in 2Q18 • Repurchased all shares that we issued for Alon deal • Approximately $232 million authorization remaining as of 12/31/19 1) Quarterly dividends mentioned are quarterly dividends per share declared in referenced periods. 2) Based on company filings from Q1 2018 through Q4 2019. Share repurchases are based on settlement date. 8
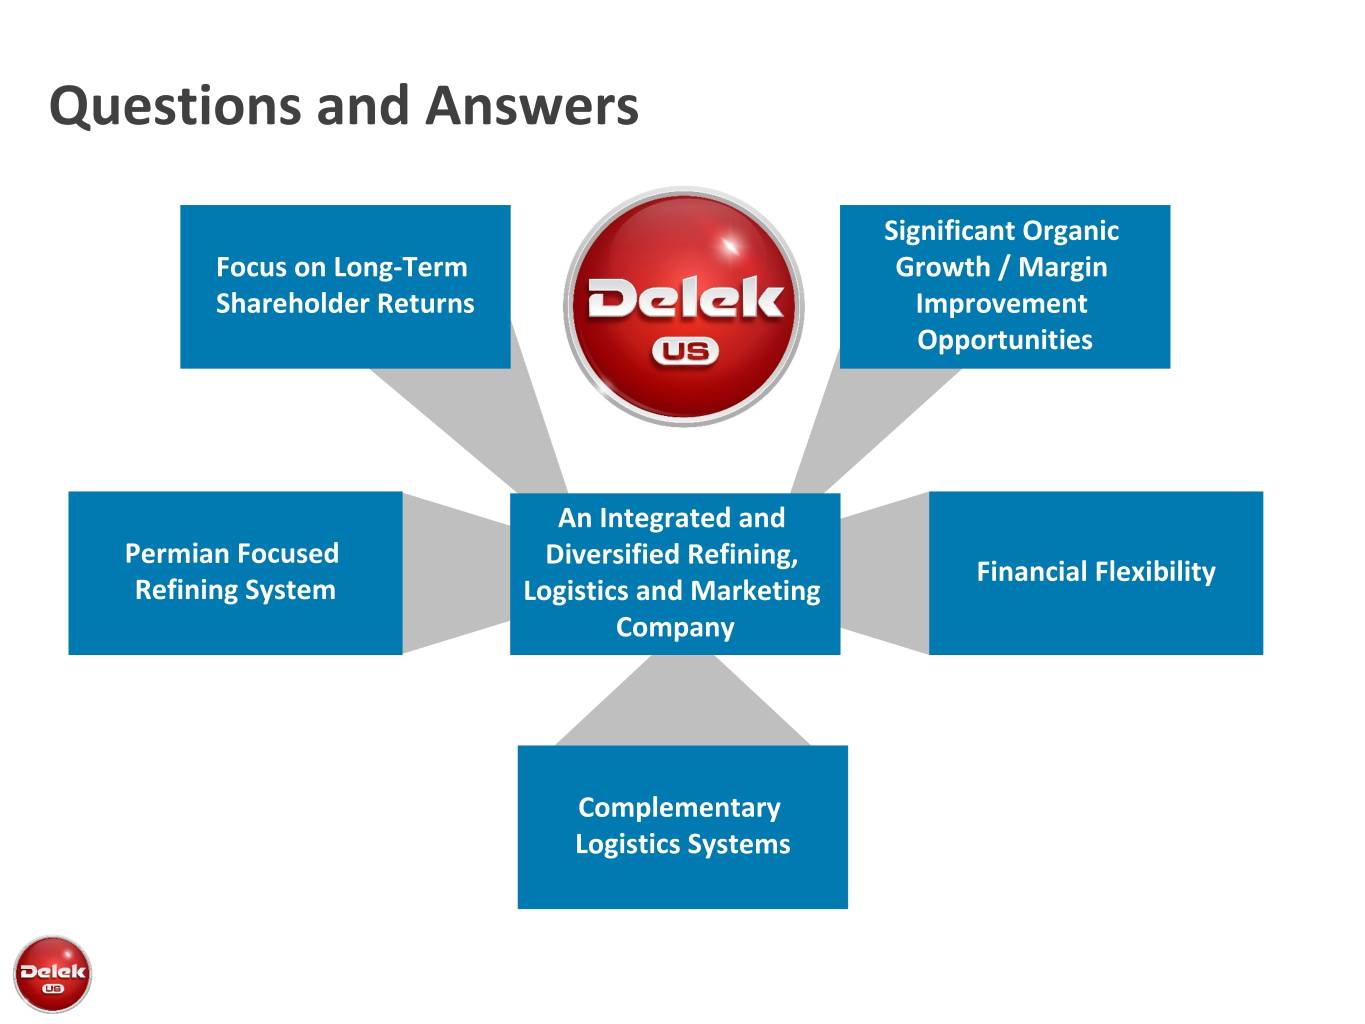
Questions and Answers Significant Organic Focus on Long-Term Growth / Margin Shareholder Returns Improvement Opportunities An Integrated and Permian Focused Diversified Refining, Financial Flexibility Refining System Logistics and Marketing Company Complementary Logistics Systems
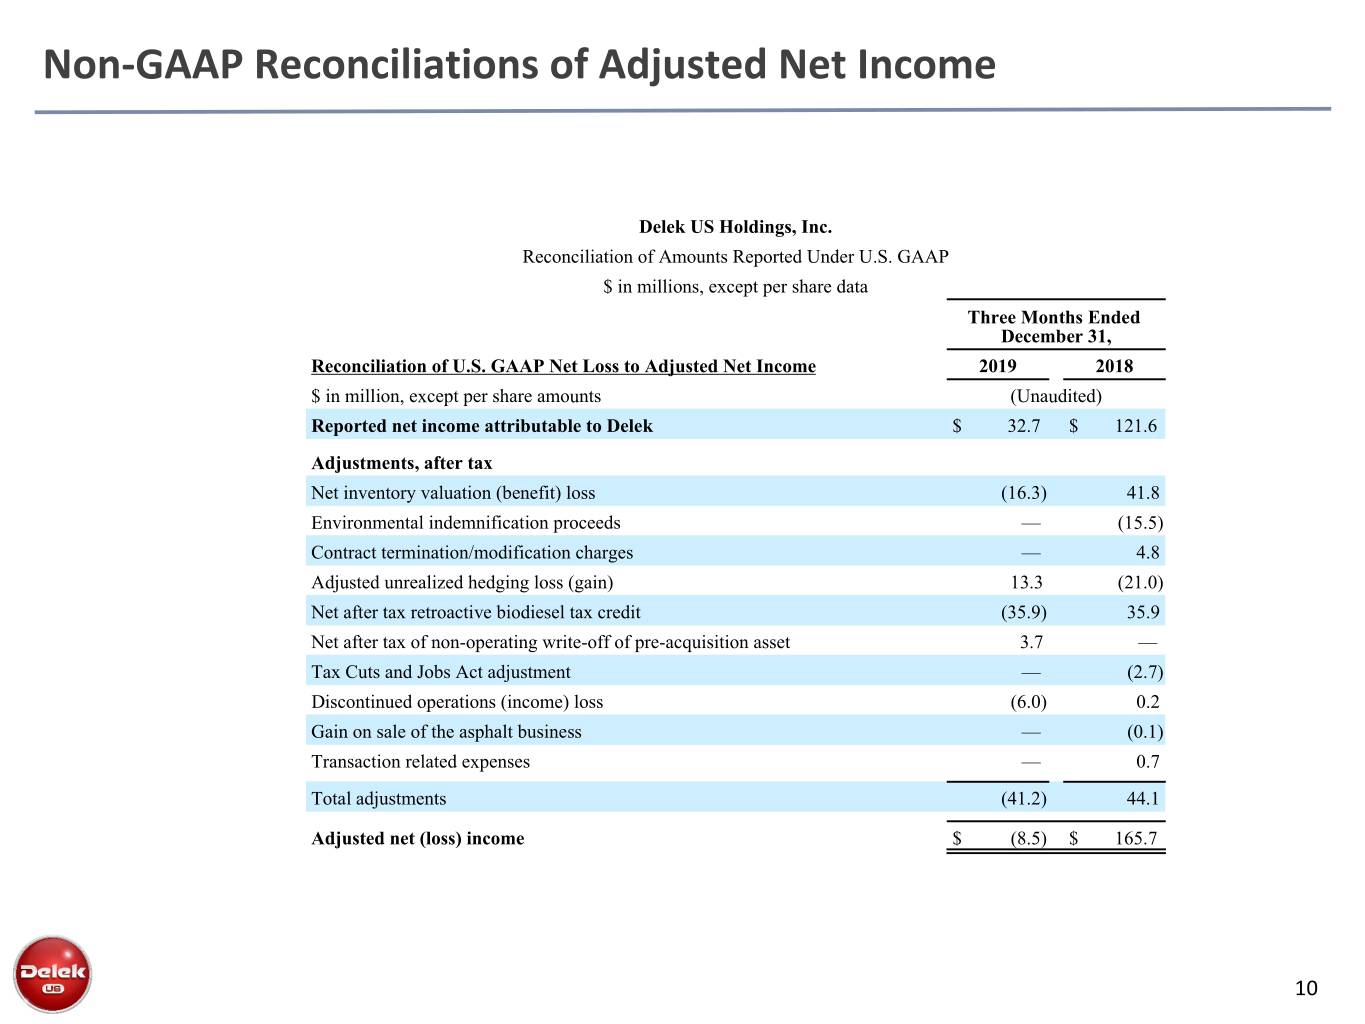
Non-GAAP Reconciliations of Adjusted Net Income Delek US Holdings, Inc. Reconciliation of Amounts Reported Under U.S. GAAP $ in millions, except per share data Three Months Ended December 31, Reconciliation of U.S. GAAP Net Loss to Adjusted Net Income 2019 2018 $ in million, except per share amounts (Unaudited) Reported net income attributable to Delek $ 32.7 $ 121.6 Adjustments, after tax Net inventory valuation (benefit) loss (16.3) 41.8 Environmental indemnification proceeds — (15.5) Contract termination/modification charges — 4.8 Adjusted unrealized hedging loss (gain) 13.3 (21.0) Net after tax retroactive biodiesel tax credit (35.9) 35.9 Net after tax of non-operating write-off of pre-acquisition asset 3.7 — Tax Cuts and Jobs Act adjustment — (2.7) Discontinued operations (income) loss (6.0) 0.2 Gain on sale of the asphalt business — (0.1) Transaction related expenses — 0.7 Total adjustments (41.2) 44.1 Adjusted net (loss) income $ (8.5) $ 165.7 10
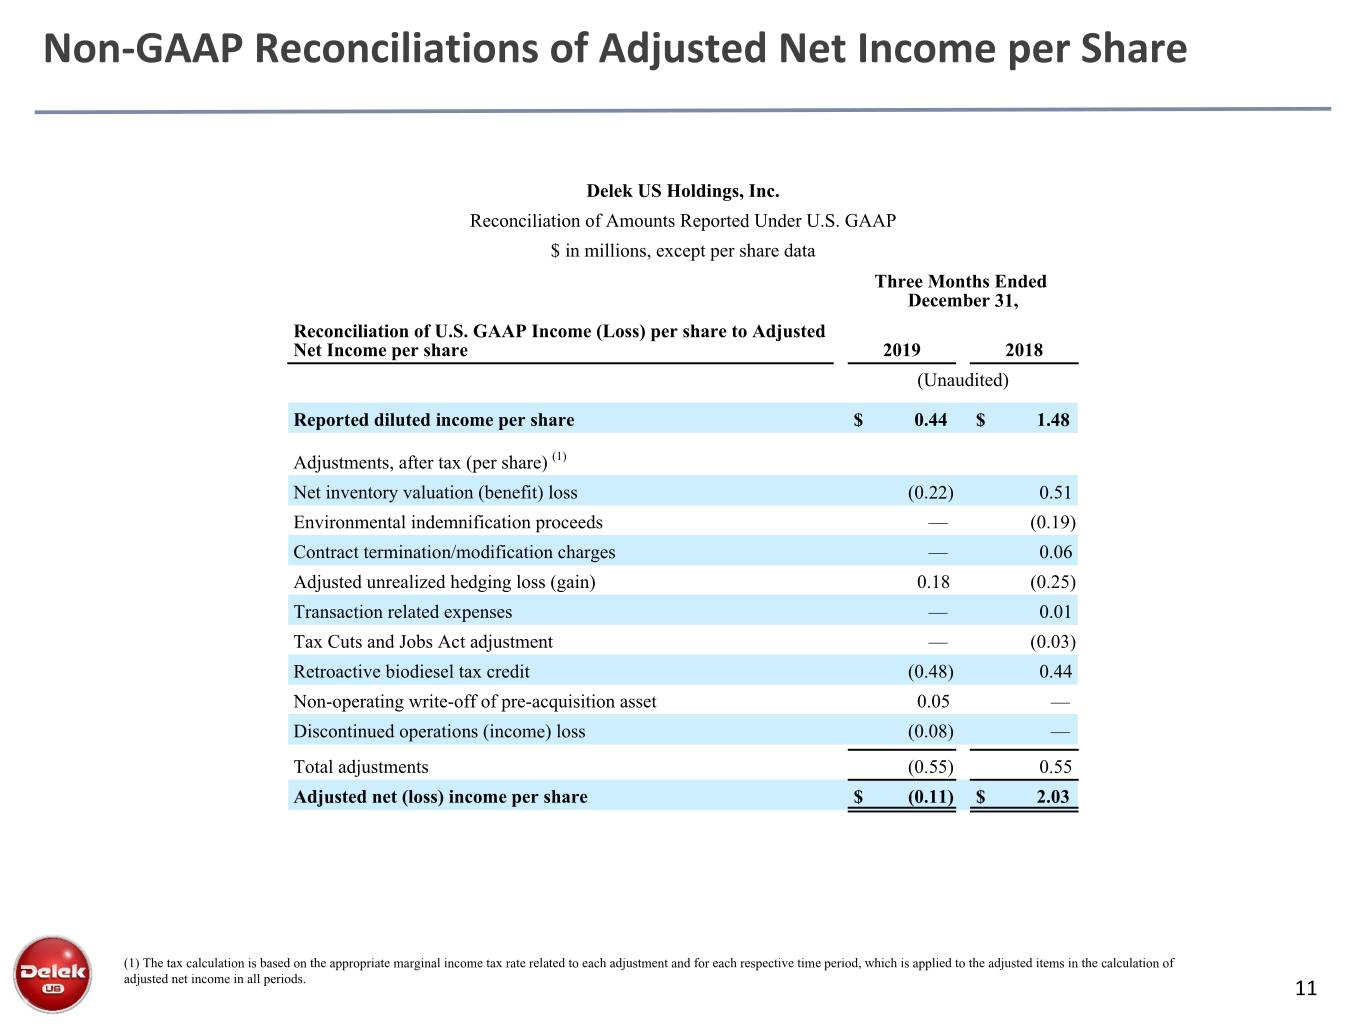
Non-GAAP Reconciliations of Adjusted Net Income per Share Delek US Holdings, Inc. Reconciliation of Amounts Reported Under U.S. GAAP $ in millions, except per share data Three Months Ended December 31, Reconciliation of U.S. GAAP Income (Loss) per share to Adjusted Net Income per share 2019 2018 (Unaudited) Reported diluted income per share $ 0.44 $ 1.48 Adjustments, after tax (per share) (1) Net inventory valuation (benefit) loss (0.22) 0.51 Environmental indemnification proceeds — (0.19) Contract termination/modification charges — 0.06 Adjusted unrealized hedging loss (gain) 0.18 (0.25) Transaction related expenses — 0.01 Tax Cuts and Jobs Act adjustment — (0.03) Retroactive biodiesel tax credit (0.48) 0.44 Non-operating write-off of pre-acquisition asset 0.05 — Discontinued operations (income) loss (0.08) — Total adjustments (0.55) 0.55 Adjusted net (loss) income per share $ (0.11) $ 2.03 (1) The tax calculation is based on the appropriate marginal income tax rate related to each adjustment and for each respective time period, which is applied to the adjusted items in the calculation of adjusted net income in all periods. 11
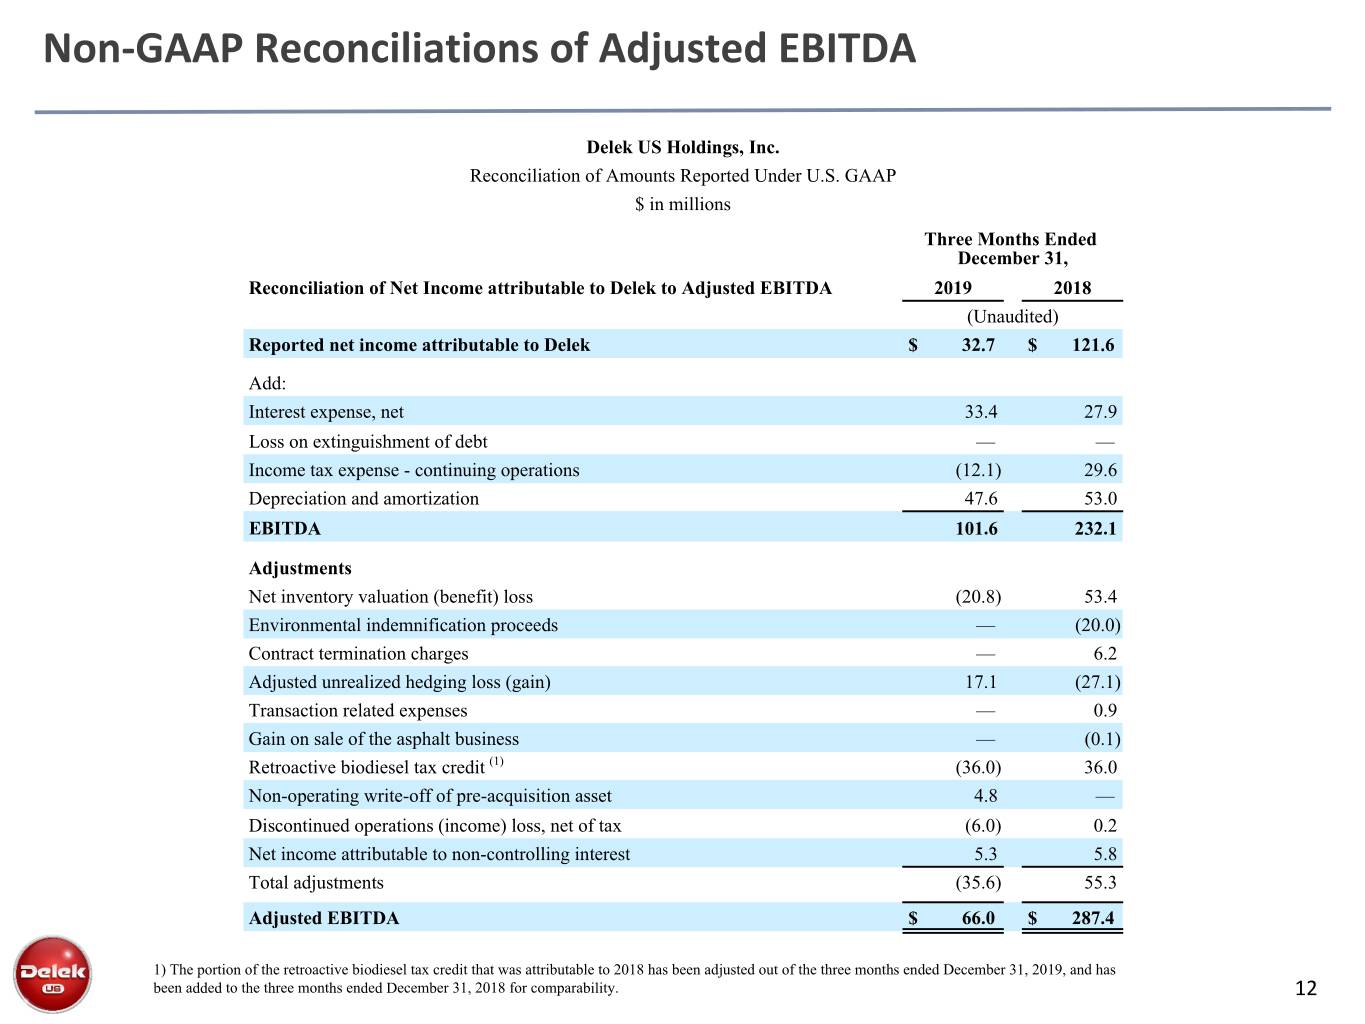
Non-GAAP Reconciliations of Adjusted EBITDA Delek US Holdings, Inc. Reconciliation of Amounts Reported Under U.S. GAAP $ in millions Three Months Ended December 31, Reconciliation of Net Income attributable to Delek to Adjusted EBITDA 2019 2018 (Unaudited) Reported net income attributable to Delek $ 32.7 $ 121.6 Add: Interest expense, net 33.4 27.9 Loss on extinguishment of debt — — Income tax expense - continuing operations (12.1) 29.6 Depreciation and amortization 47.6 53.0 EBITDA 101.6 232.1 Adjustments Net inventory valuation (benefit) loss (20.8) 53.4 Environmental indemnification proceeds — (20.0) Contract termination charges — 6.2 Adjusted unrealized hedging loss (gain) 17.1 (27.1) Transaction related expenses — 0.9 Gain on sale of the asphalt business — (0.1) Retroactive biodiesel tax credit (1) (36.0) 36.0 Non-operating write-off of pre-acquisition asset 4.8 — Discontinued operations (income) loss, net of tax (6.0) 0.2 Net income attributable to non-controlling interest 5.3 5.8 Total adjustments (35.6) 55.3 Adjusted EBITDA $ 66.0 $ 287.4 1) The portion of the retroactive biodiesel tax credit that was attributable to 2018 has been adjusted out of the three months ended December 31, 2019, and has been added to the three months ended December 31, 2018 for comparability. 12
