Attached files
| file | filename |
|---|---|
| 8-K - 8-K - Avaya Holdings Corp. | form8-kinvestorupdate2.htm |

Investor Relations Update February 2020 © 2020 Avaya Inc. All rights reserved. 1

Cautionary Note Regarding Forward-Looking Statements This document contains certain “forward-looking statements.” All statements other than statements of historical fact are “forward- looking” statements for purposes of the U.S. federal and state securities laws. These statements may be identified by the use of forward looking terminology such as "anticipate," "believe," "continue," "could,“ "estimate," "expect," "intend," "may," "might," “our vision,” "plan," "potential," "preliminary," "predict," "should,“ "will," or “would” or the negative thereof or other variations thereof or comparable terminology. The Company has based these forward-looking statements on its current expectations, assumptions, estimates and projections. While the Company believes these expectations, assumptions, estimates and projections are reasonable, such forward-looking statements are only predictions and involve known and unknown risks and uncertainties, many of which are beyond its control. These factors are discussed in the Company's Annual Report on Form 10-K and subsequent quarterly reports on Form 10-Q filed with the Securities and Exchange Commission (the “SEC”), and may cause its actual results, performance or achievements to differ materially from any future results, performance or achievements expressed or implied by these forward-looking statements. For a further list and description of such risks and uncertainties, please refer to the Company’s filings with the SEC that are available at www.sec.gov. The Company cautions you that the list of important factors included in the Company’s SEC filings may not contain all of the material factors that are important to you. In addition, in light of these risks and uncertainties, the matters referred to in the forward-looking statements contained in this report may not in fact occur. The Company undertakes no obligation to publicly update or revise any forward-looking statement as a result of new information, future events or otherwise, except as otherwise required by law. Current and historical financial data are available on our web site at investors.avaya.com. © 2020 Avaya Inc. All rights reserved. 2

Use of non-GAAP (Adjusted) Financial Measures The information furnished in this presentation includes non-GAAP financial measures that differ from measures calculated in accordance with generally accepted accounting principles in the United States of America (“GAAP”). EBITDA is defined as net income (loss) before income taxes, interest expense, interest income and depreciation and amortization. Adjusted EBITDA is EBITDA further adjusted to exclude certain charges and other adjustments described in our SEC filings and the tables below. We believe that including supplementary information concerning adjusted EBITDA is appropriate because it serves as a basis for determining management and employee compensation and it is used as a basis for calculating covenants in our credit agreements. In addition, we believe adjusted EBITDA provides more comparability between our historical results and results that reflect purchase accounting and our current capital structure. We also present adjusted EBITDA because we believe analysts and investors utilize these measures in analyzing our results. Adjusted EBITDA measures our financial performance based on operational factors that management can impact in the short-term, such as our pricing strategies, volume, costs and expenses of the organization, and it presents our financial performance in a way that can be more easily compared to prior quarters or fiscal years. EBITDA and adjusted EBITDA have limitations as analytical tools. EBITDA measures do not represent net income (loss) or cash flow from operations as those terms are defined by GAAP and do not necessarily indicate whether cash flows will be sufficient to fund cash needs. Adjusted EBITDA excludes the impact of earnings or charges resulting from matters that we do not consider indicative of our ongoing operations. In particular, our formulation of adjusted EBITDA allows adjustment for certain amounts that are included in calculating net income (loss), however, these are expenses that may recur, may vary and are difficult to predict. In addition, these terms are not necessarily comparable to other similarly titled captions of other companies due to the potential inconsistencies in the method of calculation. We also present the measures non-GAAP revenue, non-GAAP gross margin, non-GAAP operating income and non-GAAP operating margin as a supplement to our unaudited condensed consolidated financial statements presented in accordance with GAAP. We believe these non-GAAP measures are the most meaningful for period to period comparisons because they exclude the impact of the earnings and charges noted in the applicable tables in the appendix to this presentation that resulted from matters that we consider not to be indicative of our ongoing operations. In addition, we present the liquidity measures of free cash flow and adjusted cash flow. Free cash flow is calculated by subtracting capital expenditures from Net cash provided by operating activities. We believe free cash flow is a measure often used by analysts and investors to compare the cashflow and liquidity of companies in the same industry. The presentation of these non-GAAP financial measures is not intended to be considered in isolation from, as substitute for, or superior to, the financial information prepared and presented in accordance with GAAP and may be different from the non-GAAP financial measures used by other companies. In addition, these non-GAAP measures have limitations in that they do not reflect all of the amounts associated with the Company’s results of operations as determined in accordance with GAAP. We do not provide a forward-looking reconciliation of full year fiscal 2020 non-GAAP revenue, non-GAAP gross margin, non-GAAP operating expenses, non-GAAP operating income, non-GAAP operating margin, adjusted EBITDA or adjusted cash flow guidance as the amount and significance of special items required to develop meaningful comparable GAAP financial measures cannot be estimated at this time without unreasonable efforts. These special items could be meaningful. The appendix to this presentation includes tables that reconcile historical GAAP measures to non-GAAP measures. © 2020 Avaya Inc. All rights reserved. 3

© 2020 Avaya Inc. All rights reserved. 4

© 2020 Avaya Inc. All rights reserved. 5
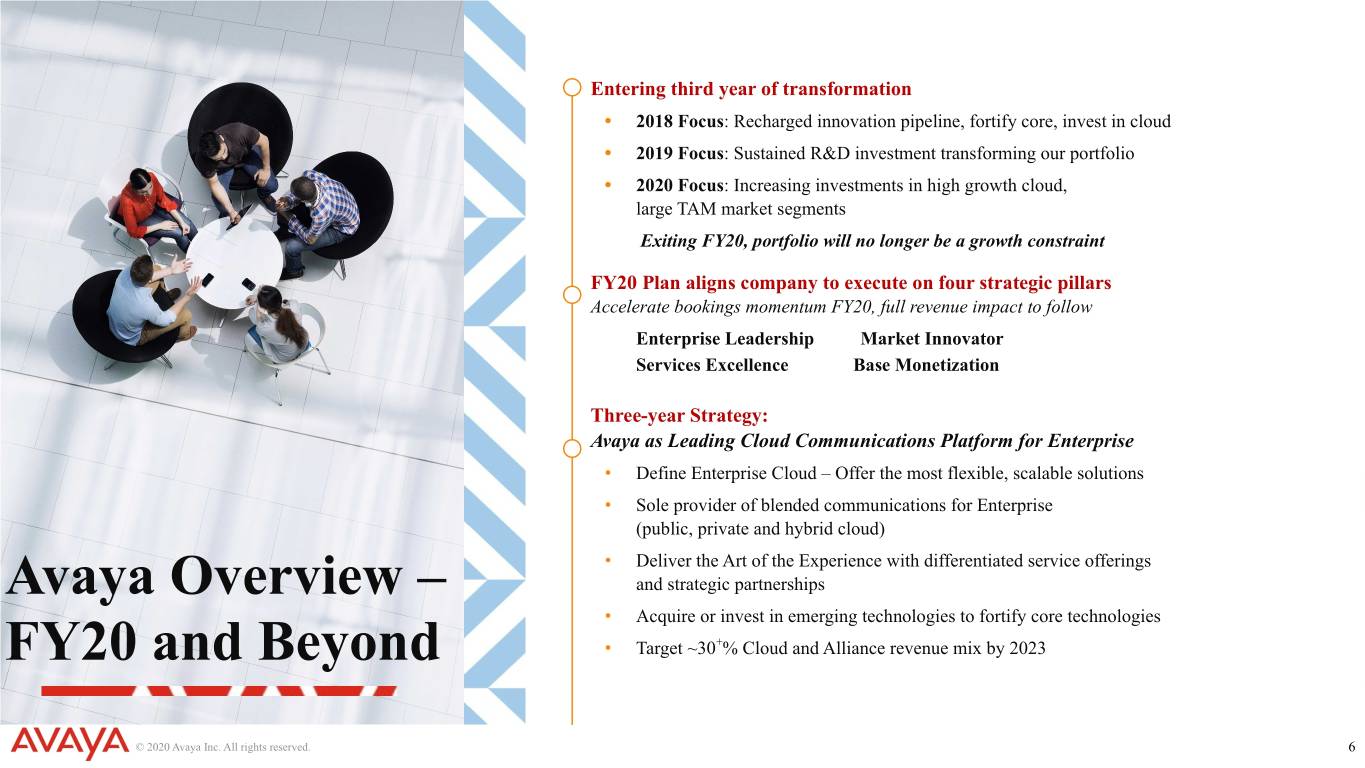
Entering third year of transformation • 2018 Focus: Recharged innovation pipeline, fortify core, invest in cloud • 2019 Focus: Sustained R&D investment transforming our portfolio • 2020 Focus: Increasing investments in high growth cloud, large TAM market segments Exiting FY20, portfolio will no longer be a growth constraint FY20 Plan aligns company to execute on four strategic pillars Accelerate bookings momentum FY20, full revenue impact to follow Enterprise Leadership Market Innovator Services Excellence Base Monetization Three-year Strategy: Avaya as Leading Cloud Communications Platform for Enterprise • Define Enterprise Cloud – Offer the most flexible, scalable solutions • Sole provider of blended communications for Enterprise (public, private and hybrid cloud) • Deliver the Art of the Experience with differentiated service offerings Avaya Overview – and strategic partnerships • Acquire or invest in emerging technologies to fortify core technologies FY20 and Beyond • Target ~30+% Cloud and Alliance revenue mix by 2023 © 2020 Avaya Inc. All rights reserved. 6

Avaya Key Strategic Assets 1 Large global installed base 5 Resources & capacity to invest 2 Blue-chip enterprise customers 6 Profitable business model Enterprise-grade solutions 7 Diverse IP portfolio 3 & services portfolio 4 Immense & loyal channel 8 Rich history of innovation © 2020 Avaya Inc. All rights reserved. 7

© 2020 Avaya Inc. All rights reserved. 8

FY20 Growth Drivers Growth Drivers Description 1 Success through new cloud sales model, insert & expand Avaya technology 1 Avaya Cloud Office content into stack Scale through standardizing sales & implementation & expanded capabilities: 2 ReadyNow global data center coverage, customer portal & automated app install IX-CC Deliver layered innovation for existing premise customers; establish a 3 differentiated customer journey from premise to multi-tenant cloud Collaboration Successful launch @ Avaya Engage, win with low-cost, ease-of-use & bundling 4 strategy (Subscription & ReadyNow offers) CPaaS Deliver differentiated use cases through developer & partner eco-system; 5 expand into Canada, UK, Western Europe Channel Subscription Partnering © 2020 Avaya Inc. All rights reserved. 9
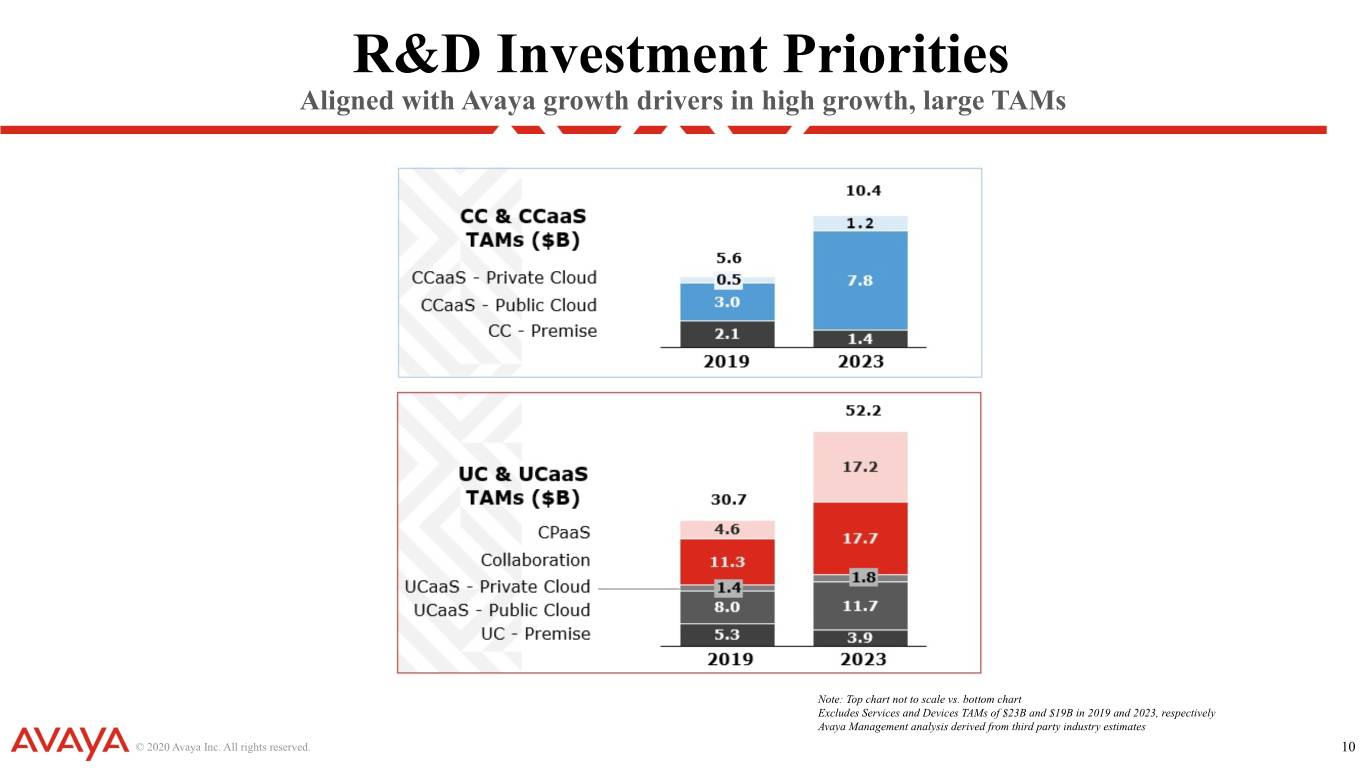
TEXT 0 – 0 – 0 204-0-0 127-127-127 17-114-210 80-200-74 86-183-242 247-150-70 R&D Investment Priorities Aligned with Avaya growth drivers in high growth, large TAMs Note: Top chart not to scale vs. bottom chart Excludes Services and Devices TAMs of $23B and $19B in 2019 and 2023, respectively Avaya Management analysis derived from third party industry estimates © 2020 Avaya Inc. All rights reserved. 10

TEXT 0 – 0 – 0 204-0-0 127-127-127 17-114-210 80-200-74 86-183-242 247-150-70 Strategic Partnership Accelerates Cloud Transformation © 2020 Avaya Inc. All rights reserved. 11

TEXT 0 – 0 – 0 204-0-0 127-127-127 17-114-210 80-200-74 86-183-242 247-150-70 Avaya Cloud Office - Customer Journey © 2020 Avaya Inc. All rights reserved. 12

Financial Overview © 2020 Avaya Inc. All rights reserved. 13
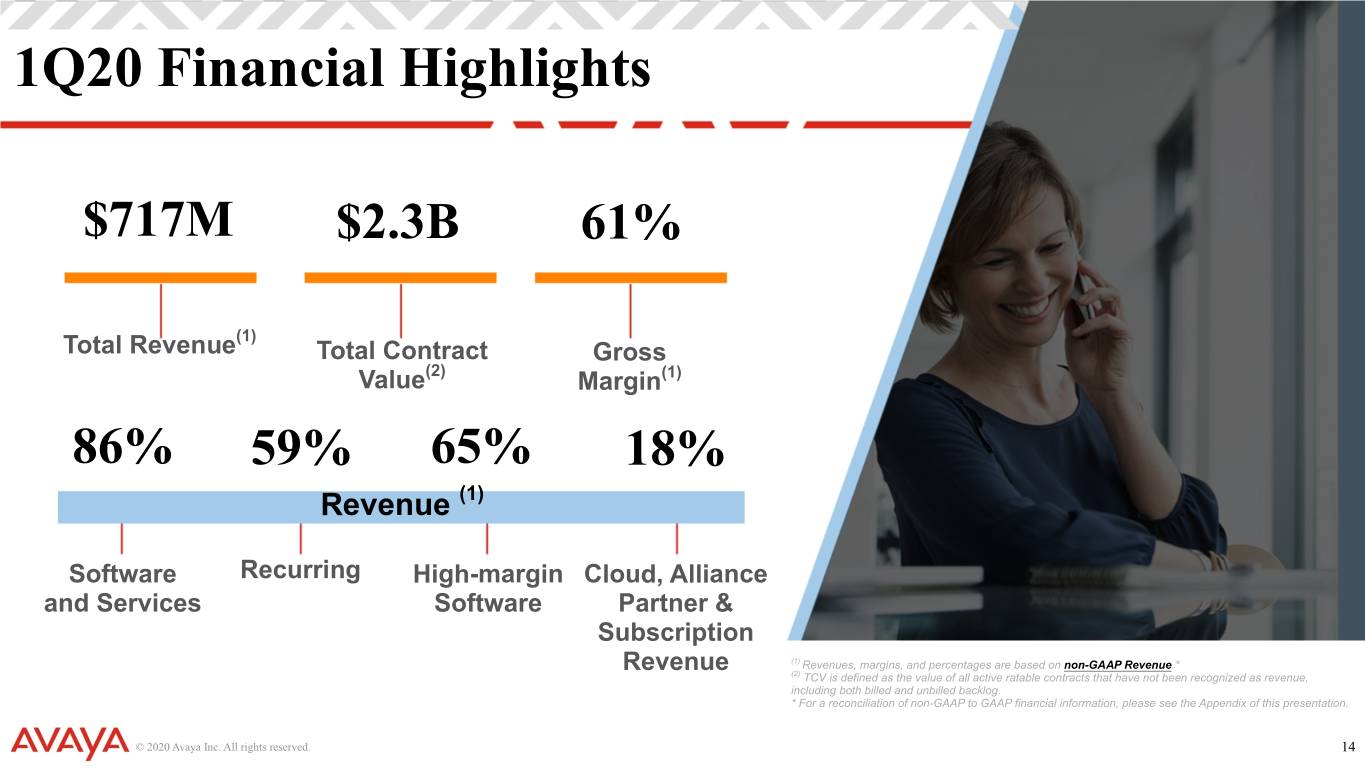
1Q20 Financial Highlights $717M $2.3B 61% (1) Total Revenue Total Contract Gross Value(2) Margin(1) 86% 59% 65% 18% Revenue (1) Software Recurring High-margin Cloud, Alliance and Services Software Partner & Subscription Revenue (1) Revenues, margins, and percentages are based on non-GAAP Revenue.* (2) TCV is defined as the value of all active ratable contracts that have not been recognized as revenue, including both billed and unbilled backlog. * For a reconciliation of non-GAAP to GAAP financial information, please see the Appendix of this presentation. © 2020 Avaya Inc. All rights reserved. 14
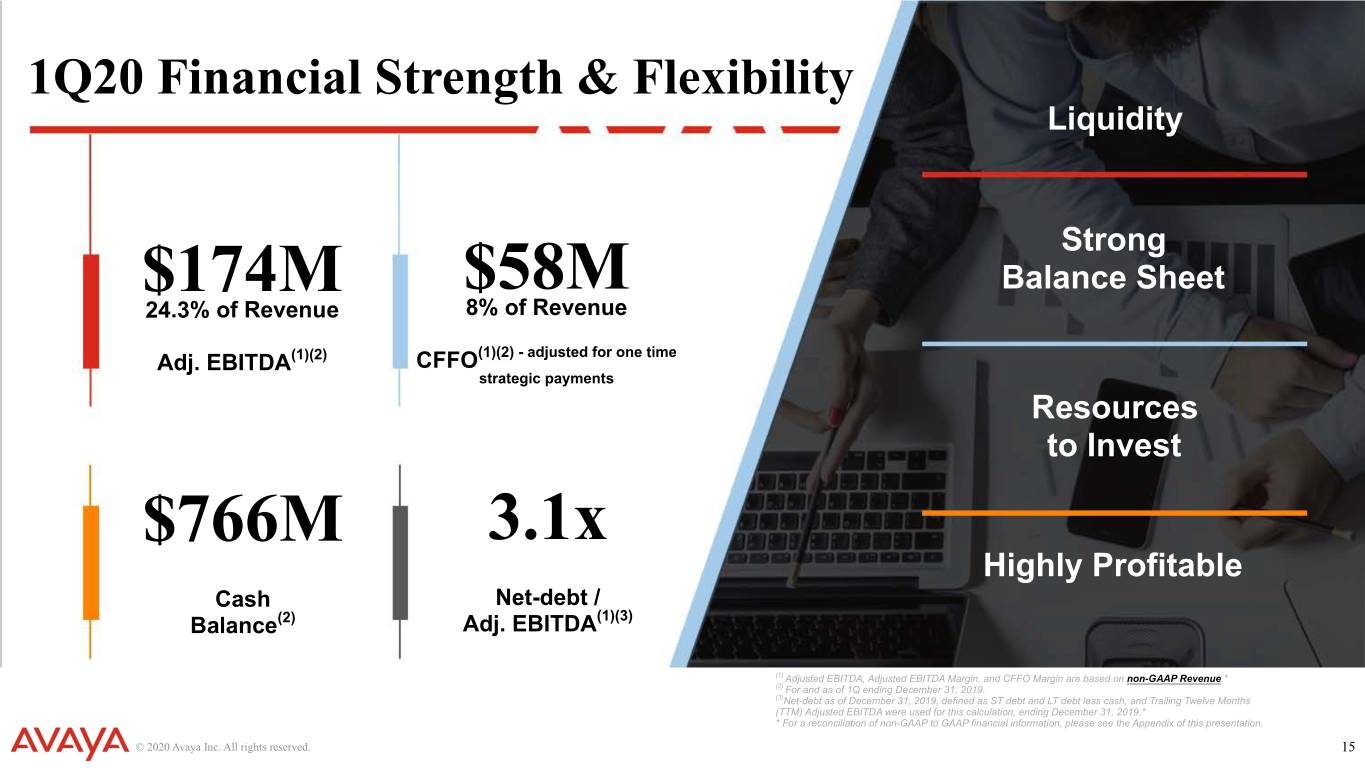
1Q20 Financial Strength & Flexibility Liquidity Strong $174M $58M Balance Sheet 24.3% of Revenue 8% of Revenue Adj. EBITDA(1)(2) CFFO(1)(2) - adjusted for one time strategic payments Resources to Invest $766M 3.1x Highly Profitable Cash Net-debt / Balance(2) Adj. EBITDA(1)(3) (1) Adjusted EBITDA, Adjusted EBITDA Margin, and CFFO Margin are based on non-GAAP Revenue.* (2) For and as of 1Q ending December 31, 2019. (3)Net-debt as of December 31, 2019, defined as ST debt and LT debt less cash, and Trailing Twelve Months (TTM) Adjusted EBITDA were used for this calculation, ending December 31, 2019.* * For a reconciliation of non-GAAP to GAAP financial information, please see the Appendix of this presentation. © 2020 Avaya Inc. All rights reserved. 15

TEXT 0 – 0 – 0 204-0-0 127-127-127 17-114-210 80-200-74 86-183-242 247-150-70 Business Model Transformation (Calculated based on non-GAAP Revenue)* FY15 FY18 FY19 1Q FY20 Revenue fromSoftware - and Services 71% 83% 83% 86% Recurring - Revenue 48% 56% 58% 59% Product Revenue - from Software 42% 58% 60% 65% Revenue fromCAPS - n/a 14% 15% 18% Non-GAAPGross Margin - 61% 63% 61% 61% Adjusted - EBITDA Margin 22% 24% 24% 24% * For a reconciliation of non-GAAP to GAAP financial information, please see the Appendix of this presentation. © 2020 Avaya Inc. All rights reserved. 16

TEXT 0 – 0 – 0 204-0-0 127-127-127 17-114-210 80-200-74 86-183-242 247-150-70 Cash Requirements ▪ All values in $M ▪ Net Cash Interest Payments includes interest payments on long-term debt and payments classified as adequate protection payments in connection with Chapter 11 proceedings, net of interest income ▪ Pension settlement payments to PBGC not included within Pension & Post Retirement payments © 2020 Avaya Inc. All rights reserved. 17

TEXT 0 – 0 – 0 204-0-0 127-127-127 17-114-210 80-200-74 86-183-242 247-150-70 Long-Term Targets Non-GAAP Revenue 2 – 4% CAGR Non-GAAP Gross Margin % 63 – 65% Non-GAAP EBITDA Margin % 27 – 28% Cash from Operations % Revenue 11 – 13% Cloud, Alliance Partner & ~30% Subscription Revenue © 2020 Avaya Inc. All rights reserved. 18

TEXT 0 – 0 – 0 204-0-0 127-127-127 17-114-210 80-200-74 86-183-242 247-150-70 Financial Policy Statement Target Leverage, Liquidity, and Ratings Net Leverage Cash Balance of Minimum Liquidity Senior Secured of 2.5X ~$400M (Cash + Revolver Debt Rating: Availability) Low to Mid BB/ Minimum Cash Required of ~$250-$300M ~$550M Ba © 2020 Avaya Inc. All rights reserved. 19

TEXT 0 – 0 – 0 204-0-0 127-127-127 17-114-210 80-200-74 86-183-242 247-150-70 Capital Allocation Priorities Investing in Technology Leadership Solutions that create Growth Public, private, hybrid, premise customer value Share Repurchase Authorization Return Capital Enhances shareholder returns $500M Strengthen Balance Sheet De-Lever Paid down debt - $250M Improves cash flow © 2020 Avaya Inc. All rights reserved. 20

Thank You. © 2020 Avaya Inc. All rights reserved. 21

Appendix © 2020 Avaya Inc. All rights reserved. 22

TEXT 0 – 0 – 0 204-0-0 127-127-127 17-114-210 80-200-74 86-183-242 247-150-70 Non-GAAP Reconciliation Adjusted EBITDA Three Months Ended (In millions) Dec. 31, Sept. 30, June 30, Mar. 31, Dec. 31, 2019 2019 2019 2019 2018 Net (loss) income $ (54) $ (34) $ (633) $ (13) $ 9 Interest expense 58 60 59 58 60 Interest income (3) (3) (4) (4) (3) Provision for (benefit from) income taxes 25 32 (27) (6) 3 Depreciation and amortization 107 108 110 108 117 EBITDA 133 163 (495) 143 186 Impact of fresh start accounting adjustments — (2) (2) 6 3 Restructuring charges, net of sublease income 1 10 1 4 7 Advisory fees 39 8 1 1 1 Acquisition-related costs — 1 1 4 3 Share-based compensation 6 6 8 5 6 Impairment charges — — 659 — — Change in fair value of Emergence Date Warrants 3 (1) (7) (3) (18) Loss on foreign currency transactions 4 — 1 6 1 Gain on marketable securities (12) (1) — — — Adjusted EBITDA $ 174 $ 184 $ 167 $ 166 $ 189 © 2020 Avaya Inc. All rights reserved. 23

TEXT 0 – 0 – 0 204-0-0 127-127-127 17-114-210 80-200-74 86-183-242 247-150-70 Non-GAAP Reconciliation Revenue by Geography Three Months Ended Three Months Ended Three Months Ended Dec. 31, Adj. for Non-GAAP Sept. 30, Adj. for Non-GAAP Dec. 31, Adj. for Non-GAAP 2019 Fresh Start Dec. 31, 2019 Fresh Start Sept. 30, 2018 Fresh Start Dec. 31, (In millions) Accounting 2019 Accounting 2019 Accounting 2018 U.S. $ 394 $ 1 $ 395 $ 392 $ 1 $ 393 $ 394 $ 7 $ 401 EMEA 186 1 187 183 1 184 199 1 200 APAC 77 — 77 85 1 86 78 1 79 AI 58 — 58 63 — 63 67 1 68 Total revenue $ 715 $ 2 $ 717 $ 723 $ 3 $ 726 $ 738 $ 10 $ 748 © 2020 Avaya Inc. All rights reserved. 24

TEXT 0 – 0 – 0 204-0-0 127-127-127 17-114-210 80-200-74 86-183-242 247-150-70 Non-GAAP Reconciliation Gross Margin and Operating Income Three Months Ended Dec. 31, Sept. 30, June 30, Mar. 31, Dec. 31, (In millions) 2019 2019 2019 2019 2018 Reconciliation of Non-GAAP Gross Profit and Non-GAAP Gross Margin Gross Profit $ 394 $ 392 $ 390 $ 386 $ 407 Items excluded: Adj. for fresh start accounting 3 4 5 9 19 Amortization of technology intangible assets 43 44 43 44 43 Non-cash share-based compensation — — — — — Non-GAAP Gross Profit $ 440 $ 440 $ 438 $ 439 $ 469 GAAP Gross Margin 55.1% 54.2% 54.4 % 54.4% 55.1% Non-GAAP Gross Margin 61.4% 60.6% 60.8 % 61.5% 62.7% Reconciliation of Non-GAAP Operating Income Operating (Loss) Income $ 15 $ 52 $ (613) $ 38 $ 50 Items excluded: Adj. for fresh start accounting 4 4 4 12 20 Amortization of intangible assets 84 84 84 85 83 Impairment charges — — 659 — — Restructuring charges, net 3 10 1 4 7 Acquisition-related costs — 1 1 4 3 Advisory fees 39 8 1 1 1 Share-based compensation 6 6 8 5 6 Non-GAAP Operating Income $ 151 $ 165 $ 145 $ 149 $ 170 GAAP Operating Margin 2.1% 7.2% (85.5)% 5.4% 6.8% Non-GAAP Operating Margin 21.1% 22.7% 20.1 % 20.9% 22.7% © 2020 Avaya Inc. All rights reserved. 25
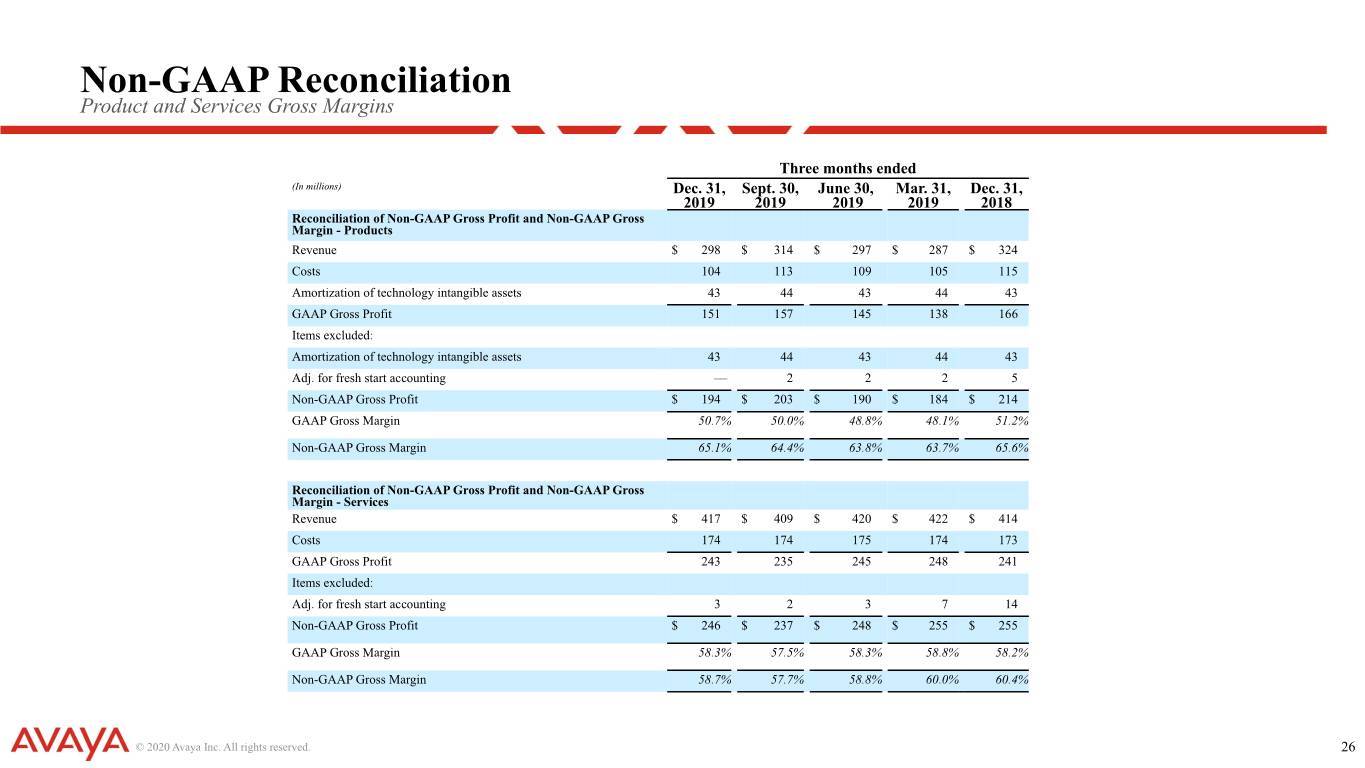
TEXT 0 – 0 – 0 204-0-0 127-127-127 17-114-210 80-200-74 86-183-242 247-150-70 Non-GAAP Reconciliation Product and Services Gross Margins Three months ended (In millions) Dec. 31, Sept. 30, June 30, Mar. 31, Dec. 31, 2019 2019 2019 2019 2018 Reconciliation of Non-GAAP Gross Profit and Non-GAAP Gross Margin - Products Revenue $ 298 $ 314 $ 297 $ 287 $ 324 Costs 104 113 109 105 115 Amortization of technology intangible assets 43 44 43 44 43 GAAP Gross Profit 151 157 145 138 166 Items excluded: Amortization of technology intangible assets 43 44 43 44 43 Adj. for fresh start accounting — 2 2 2 5 Non-GAAP Gross Profit $ 194 $ 203 $ 190 $ 184 $ 214 GAAP Gross Margin 50.7% 50.0% 48.8% 48.1% 51.2% Non-GAAP Gross Margin 65.1% 64.4% 63.8% 63.7% 65.6% Reconciliation of Non-GAAP Gross Profit and Non-GAAP Gross Margin - Services Revenue $ 417 $ 409 $ 420 $ 422 $ 414 Costs 174 174 175 174 173 GAAP Gross Profit 243 235 245 248 241 Items excluded: Adj. for fresh start accounting 3 2 3 7 14 Non-GAAP Gross Profit $ 246 $ 237 $ 248 $ 255 $ 255 GAAP Gross Margin 58.3% 57.5% 58.3% 58.8% 58.2% Non-GAAP Gross Margin 58.7% 57.7% 58.8% 60.0% 60.4% © 2020 Avaya Inc. All rights reserved. 26

TEXT 0 – 0 – 0 204-0-0 127-127-127 17-114-210 80-200-74 86-183-242 247-150-70 Non-GAAP Reconciliation Supplemental Schedules Free Cash Flow Three months ended (In millions) Dec. 31, Sept. 30, June 30, Mar. 31, Dec. 31, 2019 2019 2019 2019 2018 Net cash provided by operating activities $ 12 $ 66 $ 52 $ 37 $ 86 Less: Net-Debt / Adjusted EBITDA Capital expenditures 26 29 37 26 21 Free cash flow $ (14) $ 37 $ 15 $ 11 $ 65 (In millions) Dec. 31, 2019 Debt maturing within one year $ — Non-GAAP Revenue Long-term debt, net of current portion 2,877 Less: Cash and cash equivalents (766) Three months ended Net-debt 2,111 (In millions) Dec. 31, Sept. 30, June 30, Mar. 31, Dec. 31, 2019 2019 2019 2019 2018 Adjusted EBITDA (TTM) $ 691 GAAP Revenue $ 715 $ 723 $ 717 $ 709 $ 738 Net-debt / Adjusted EBITDA 3.1x Adj. for fresh start accounting 2 3 3 5 10 Non-GAAP Revenue $ 717 $ 726 $ 720 $ 714 $ 748 © 2020 Avaya Inc. All rights reserved. 27
