Attached files
| file | filename |
|---|---|
| 8-K/A - FORM 8-K/A - Shake Shack Inc. | tm2010879d1_8ka.htm |
Exhibit 99.2

FOURTH QUARTER 2019 EARNINGS SUPPLEMENTAL CORRECTED COPY FEBRUARY 24, 2020
CAUTIONARY NOTE ON FORWARD - LOOKING STATEMENTS This presentation contains forward - looking statements, within the meaning of the Private Securities Litigation Reform Act of 1995, which are subject to known and unknown risks, uncertainties and other important factors that may cause actual results to be materially different. All statements other than statements of historical fact included in this presentation are forward - looking statements, including, but not limited to, expected financial outlook for fiscal 2020, expected Shack openings, expected same - Shack sales growth and trends in Shake Shack Inc.’s (the “Company’s”) operations. Forward - looking statements discuss the Company's current expectations and projections relating to its financial position, results of operations, plans, objectives, future performance and business. You can identify forward - looking statements by the fact that they do not relate strictly to historical or current facts. These statements may include words such as "aim," "anticipate," "believe," "estimate," "expect," "forecast," "outlook," "potential," "project," "projection," "plan," "intend," "seek," "may," "could," "would," "will," "should," "can," "can have," "likely," the negatives thereof and other similar expressions. All forward - looking statements are expressly qualified in their entirety by these cautionary statements. You should evaluate all forward - looking statements made in this presentation in the context of the risks and uncertainties disclosed in the Company’s Annual Report on Form 10 - K for the fiscal year ended December 25, 2019, filed with the Securities and Exchange Commission ("SEC"). All of the Company's SEC filings are available online at www.sec.gov , www.shakeshack.com or upon request from Shake Shack Inc. The forward - looking statements included in this presentation are made only as of the date hereof. The Company undertakes no obligation to publicly update or revise any forward - looking statement as a result of new information, future events or otherwise, except as otherwise required by law. 2
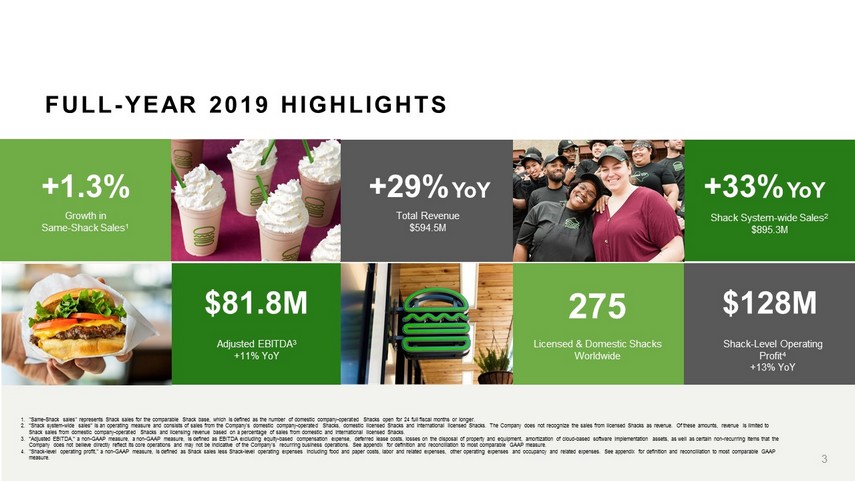
1. "Same - Shack sales" represents Shack sales for the comparable Shack base, which is defined as the number of domestic company - oper ated Shacks open for 24 full fiscal months or longer. 2. “Shack system - wide sales” is an operating measure and consists of sales from the Company's domestic company - operated Shacks, dom estic licensed Shacks and international licensed Shacks. The Company does not recognize the sales from licensed Shacks as rev enu e. Of these amounts, revenue is limited to Shack sales from domestic company - operated Shacks and licensing revenue based on a percentage of sales from domestic and interna tional licensed Shacks. 3. “Adjusted EBITDA,” a non - GAAP measure, a non - GAAP measure, is defined as EBITDA excluding equity - based compensation expense, def erred lease costs, losses on the disposal of property and equipment, amortization of cloud - based software implementation assets, as well as certain non - recurring items that the Company does not believe directly reflect its core operations and may not be indicative of the Company's recurring business operations. See appendix for definition and reconciliation to most comparable GAAP measure. 4. "Shack - level operating profit," a non - GAAP measure, is defined as Shack sales less Shack - level operating expenses including food and paper co sts, labor and related expenses, other operating expenses and occupancy and related expenses. See appendix for definition and reconciliation to most comparable GAAP measure. 3 FULL - YEAR 2019 HIGHLIGHTS Licensed & Domestic Shacks Worldwide Growth in Same - Shack Sales 1 275 +1.3% Total Revenue $594.5M +29% YoY Shack System - wide Sales 2 $895.3M +33% YoY $81.8M Adjusted EBITDA 3 +11% YoY $128M Shack - Level Operating Profit 4 +13% YoY
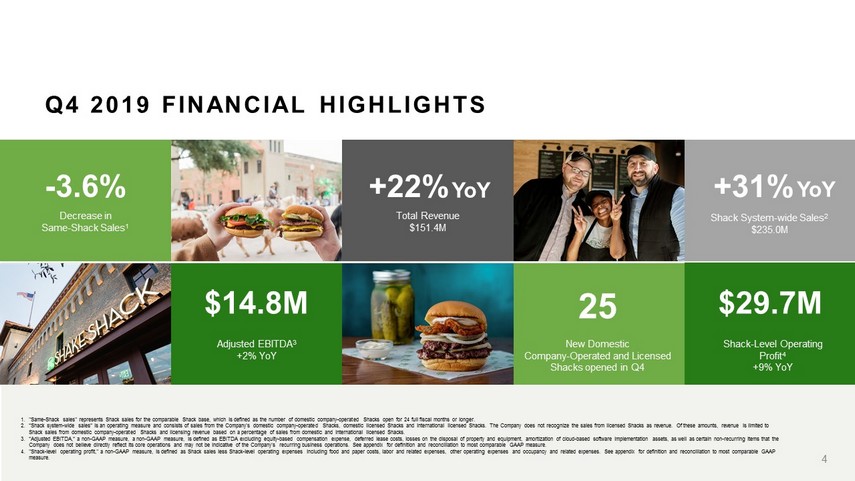
Q4 2019 FINANCIAL HIGHLIGHTS 25 New Domestic Company - Operated and Licensed Shacks opened in Q4 $29.7M Shack - Level Operating Profit 4 +9% YoY +31% Shack System - wide Sales 2 $235.0M +22% Total Revenue $151.4M 4 Adjusted EBITDA 3 +2% YoY $14.8M YoY YoY - 3.6% Decrease in Same - Shack Sales 1 1. "Same - Shack sales" represents Shack sales for the comparable Shack base, which is defined as the number of domestic company - oper ated Shacks open for 24 full fiscal months or longer. 2. “Shack system - wide sales” is an operating measure and consists of sales from the Company's domestic company - operated Shacks, dom estic licensed Shacks and international licensed Shacks. The Company does not recognize the sales from licensed Shacks as rev enu e. Of these amounts, revenue is limited to Shack sales from domestic company - operated Shacks and licensing revenue based on a percentage of sales from domestic and interna tional licensed Shacks. 3. “Adjusted EBITDA,” a non - GAAP measure, a non - GAAP measure, is defined as EBITDA excluding equity - based compensation expense, def erred lease costs, losses on the disposal of property and equipment, amortization of cloud - based software implementation assets, as well as certain non - recurring items that the Company does not believe directly reflect its core operations and may not be indicative of the Company's recurring business operations. See appendix for defini tio n and reconciliation to most comparable GAAP measure. 4. "Shack - level operating profit," a non - GAAP measure, is defined as Shack sales less Shack - level operating expenses including food and paper costs, labor and related expenses, other operating expenses and occupancy and related expenses. See appendix for definition and reconciliation to most comparable GAAP measure.
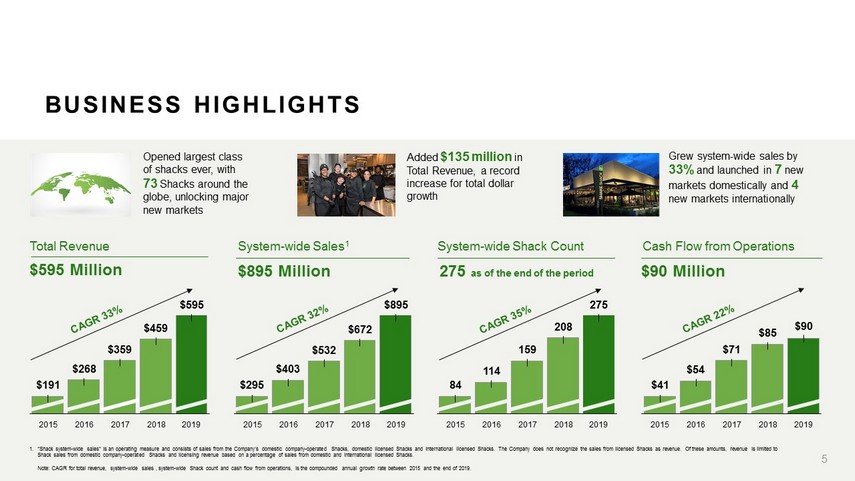
2016 2015 $191 $359 $268 $595 2017 $459 2018 2019 Total Revenue $595 Million System - wide Sales 1 $895 Million System - wide Shack Count 275 as of the end of the period Cash Flow from Operations $90 Million $532 $672 $403 $295 $895 275 114 84 159 208 $85 $71 $41 $54 $90 1. “Shack system - wide sales” is an operating measure and consists of sales from the Company's domestic company - operated Shacks, dom estic licensed Shacks and international licensed Shacks. The Company does not recognize the sales from licensed Shacks as rev enu e. Of these amounts, revenue is limited to Shack sales from domestic company - operated Shacks and licensing revenue based on a percentage of sales from domestic and interna tional licensed Shacks. Note: CAGR for total revenue, system - wide sales , system - wide Shack count and cash flow from operations, is the compounded annual growth rate between 2015 and the end of 20 19 . 5 BUSINESS HIGHLIGHTS 2016 2015 2017 2018 2019 2016 2015 2017 2018 2019 2016 2015 2017 2018 2019 Opened largest class of shacks ever, with 73 Shacks around the globe, unlocking major new markets Added $135 million in Total Revenue, a record increase for total dollar growth Grew system - wide sales by 33% and launched in 7 new markets domestically and 4 new markets internationally
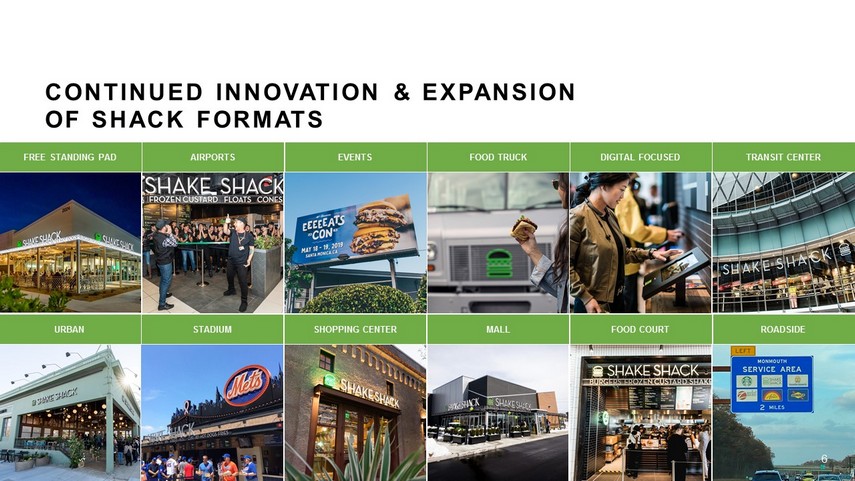
CONTINUED INNOVATION & EXPANSION OF SHACK FORMATS FREE STANDING PAD EVENTS AIRPORTS DIGITAL FOCUSED FOOD TRUCK TRANSIT CENTER URBAN STADIUM SHOPPING CENTER ROADSIDE FOOD COURT MALL 6
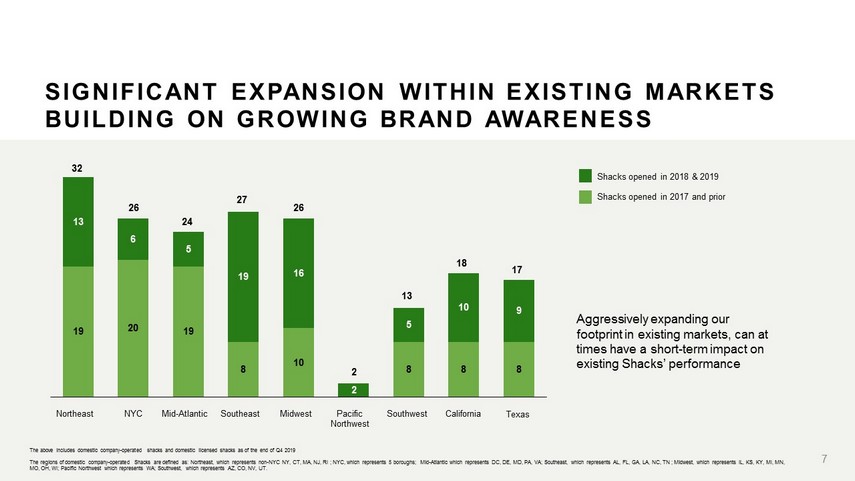
19 20 19 8 10 8 8 8 13 6 5 19 16 2 5 10 9 California 24 Texas 18 17 Northeast 32 NYC 26 Mid - Atlantic Southeast 27 13 Midwest 26 Pacific Northwest 2 Southwest SIGNIFICANT EXPANSION WITHIN EXISTING MARKETS BUILDING ON GROWING BRAND AWARENESS 7 Aggressively expanding our footprint in existing markets, can at times have a short - term impact on existing Shacks’ performance Shacks opened in 2018 & 2019 Shacks opened in 2017 and prior The above includes domestic company - operated shacks and domestic licensed shacks as of the end of Q4 2019 The regions of domestic company - operated Shacks are defined as: Northeast, which represents non - NYC NY, CT, MA, NJ, RI ; NYC, wh ich represents 5 boroughs; Mid - Atlantic which represents DC, DE, MD, PA, VA; Southeast, which represents AL, FL, GA, LA, NC, TN ; Midwest, which represents IL, KS, KY, MI, MN, MO, OH, WI; Pacific Northwest which represents WA; Southwest, which represents AZ, CO, NV, UT.
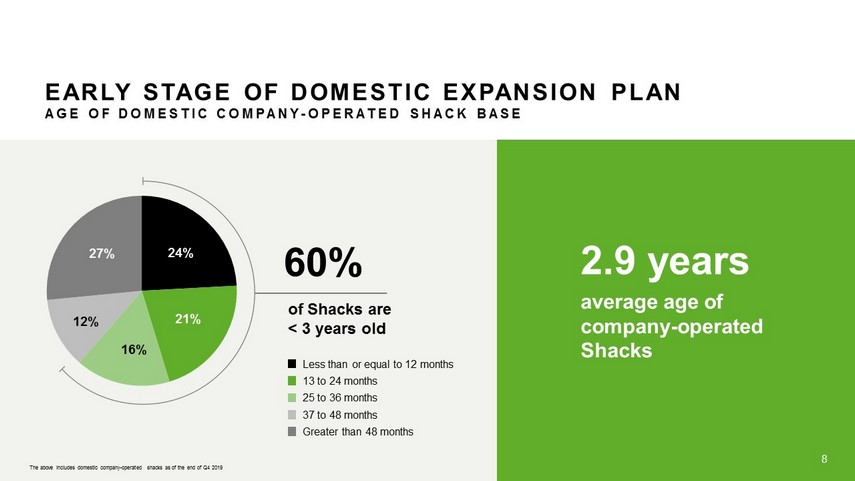
EARLY STAGE OF DOMESTIC EXPANSION PLAN AGE OF DOMESTIC COMPANY - OPERATED SHACK BASE 24% 21% 16% 12% 27% Less than or equal to 12 months Greater than 48 months 13 to 24 months 25 to 36 months 37 to 48 months average age of company - operated Shacks 60% of Shacks are < 3 years old 2.9 years 8 The above includes domestic company - operated shacks as of the end of Q4 2019
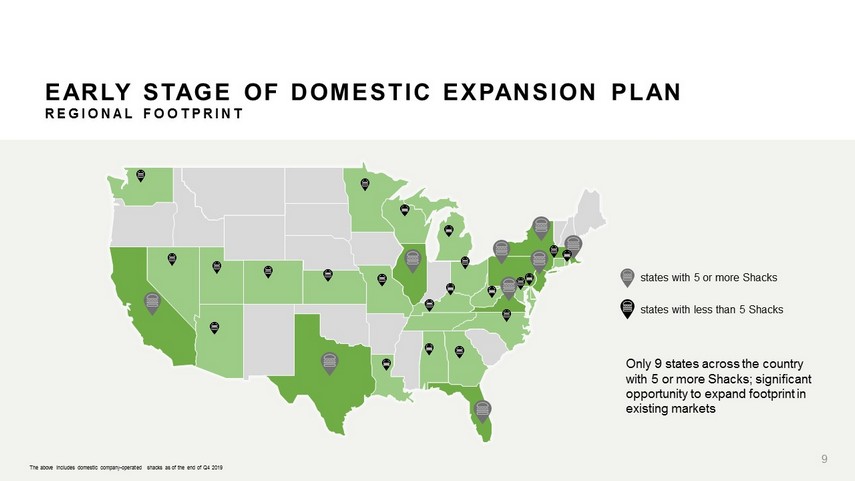
EARLY STAGE OF DOMESTIC EXPANSION PLAN REGIONAL FOOTPRINT states with less than 5 Shacks states with 5 or more Shacks Only 9 states across the country with 5 or more Shacks; significant opportunity to expand footprint in existing markets The above includes domestic company - operated shacks as of the end of Q4 2019 9
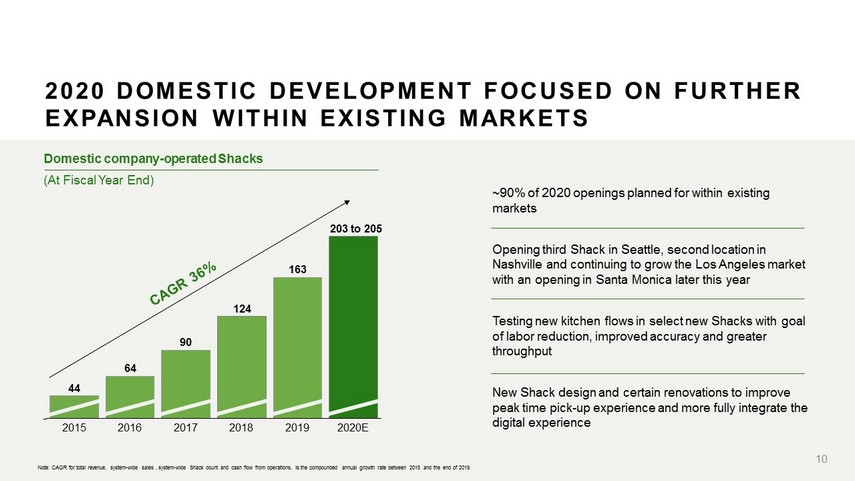
~90% of 2020 openings planned for within existing markets Opening third Shack in Seattle, second location in Nashville and continuing to grow the Los Angeles market with an opening in Santa Monica later this year Testing new kitchen flows in select new Shacks with goal of labor reduction, improved accuracy and greater throughput New Shack design and certain renovations to improve peak time pick - up experience and more fully integrate the digital experience 2020 DOMESTIC DEVELOPMENT FOCUSED ON FURTHER EXPANSION WITHIN EXISTING MARKETS 90 44 64 124 2016 2020 E 2017 163 2015 2018 2019 203 to 205 Domestic company - operated Shacks (At Fiscal Year End) 10 Note: CAGR for total revenue, system - wide sales , system - wide Shack count and cash flow from operations, is the compounded annual growth rate between 2015 and the end of 20 19 .
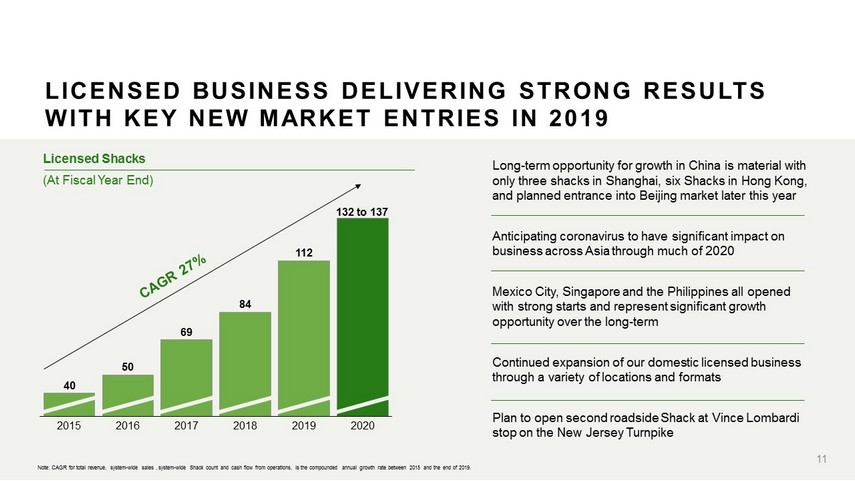
Long - term opportunity for growth in China is material with only three shacks in Shanghai, six Shacks in Hong Kong, and planned entrance into Beijing market later this year Anticipating coronavirus to have significant impact on business across Asia through much of 2020 Mexico City, Singapore and the Philippines all opened with strong starts and represent significant growth opportunity over the long - term Continued expansion of our domestic licensed business through a variety of locations and formats Plan to open second roadside Shack at Vince Lombardi stop on the New Jersey Turnpike 135 69 2019 40 50 84 112 2015 2016 2017 2018 2020 132 to 137 LICENSED BUSINESS DELIVERING STRONG RESULTS WITH KEY NEW MARKET ENTRIES IN 2019 Licensed Shacks (At Fiscal Year End) 11 Note: CAGR for total revenue, system - wide sales , system - wide Shack count and cash flow from operations, is the compounded annual growth rate between 2015 and the end of 20 19 .

12 STRENGTHENING OUR BRAND BY CREATING BUZZ & CONNECTING WITH OUR COMMUNITIES
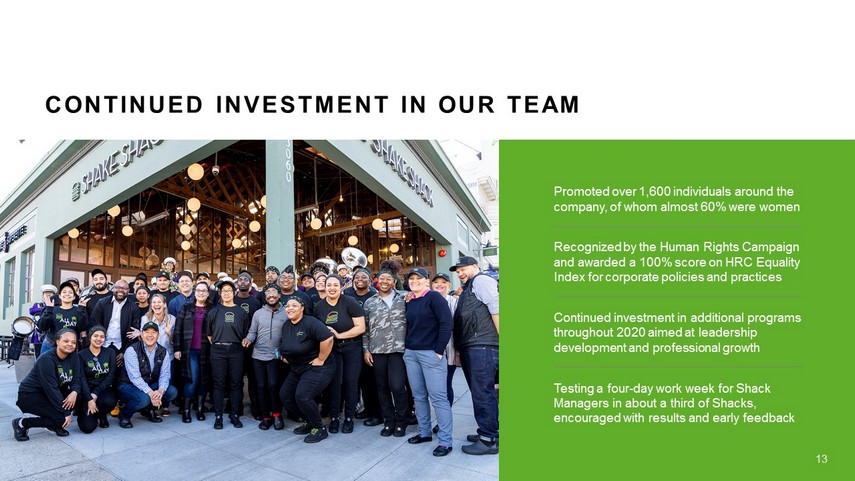
13 CONTINUED INVESTMENT IN OUR TEAM Promoted over 1,600 individuals around the company, of whom almost 60% were women Recognized by the Human Rights Campaign and awarded a 100% score on HRC Equality Index for corporate policies and practices Continued investment in additional programs throughout 2020 aimed at leadership development and professional growth Testing a four - day work week for Shack Managers in about a third of Shacks, encouraged with results and early feedback
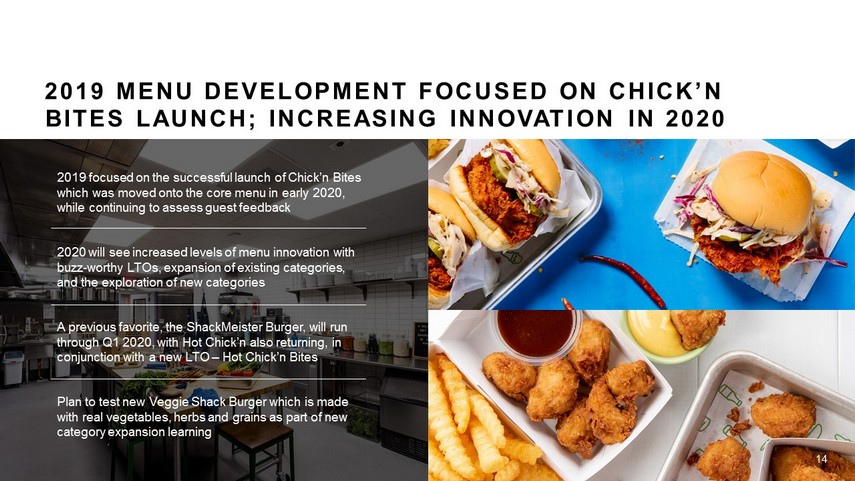
2019 MENU DEVELOPMENT FOCUSED ON CHICK’N BITES LAUNCH; INCREASING INNOVATION IN 2020 2019 focused on the successful launch of Chick’n Bites which was moved onto the core menu in early 2020, while continuing to assess guest feedback 2020 will see increased levels of menu innovation with buzz - worthy LTOs, expansion of existing categories, and the exploration of new categories A previous favorite, the ShackMeister Burger, will run through Q1 2020, with Hot Chick’n also returning, in conjunction with a new LTO – Hot Chick’n Bites Plan to test new Veggie Shack Burger which is made with real vegetables, herbs and grains as part of new category expansion learning 14

©2004 - 2020 SHAKE SHACK. ALL RIGHTS RESERVED. INVESTING TO IMPROVE DIGITAL EXPERIENCE ACROSS ALL OUR CHANNELS Deploying app, kiosk and web enhancements adding loyalty - driving functionality to drive acquisition and frequency Building an integrated digital and data ecosystem, working towards a single view of the guest Expanding personalized marketing - focused capabilities across different channels and regions Aim to remove friction, and add convenience to the guest journey regardless of the channel 15
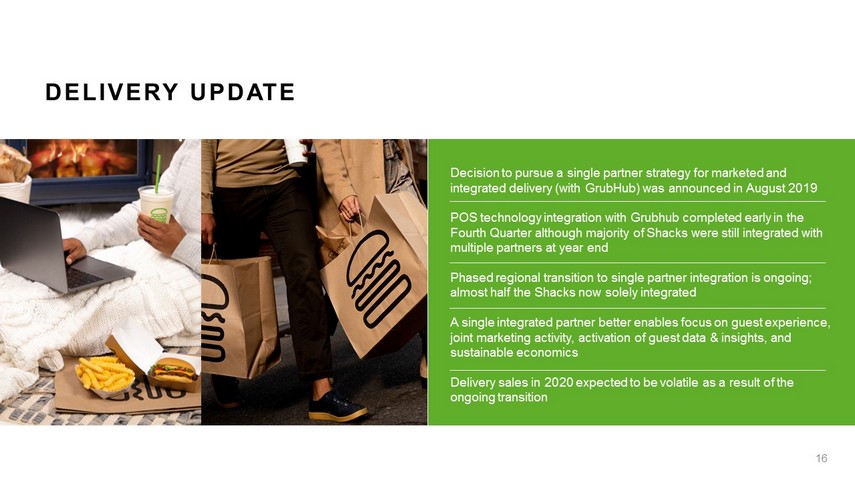
DELIVERY UPDATE Decision to pursue a single partner strategy for marketed and integrated delivery (with GrubHub) was announced in August 2019 POS technology integration with Grubhub completed early in the Fourth Quarter although majority of Shacks were still integrated with multiple partners at year end Phased regional transition to single partner integration is ongoing; almost half the Shacks now solely integrated A single integrated partner better enables focus on guest experience, joint marketing activity, activation of g uest data & insights, and sustainable economics Delivery sales in 2020 expected to be volatile as a result of the ongoing transition 16
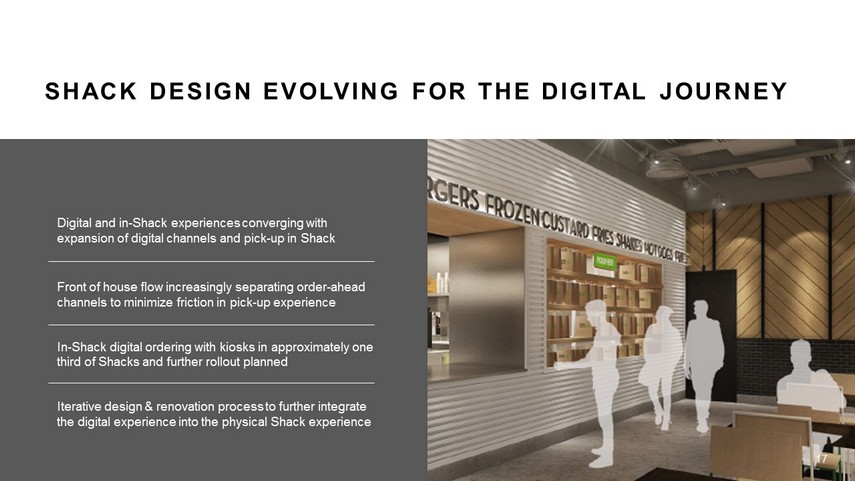
17 ©2004 - 2020 SHAKE SHACK. ALL RIGHTS RESERVED. SHACK DESIGN EVOLVING FOR THE DIGITAL JOURNEY Digital and in - Shack experiences converging with expansion of digital channels and pick - up in Shack Front of house flow increasingly separating order - ahead channels to minimize friction in pick - up experience In - Shack digital ordering with kiosks in approximately one third of Shacks and further rollout planned Iterative design & renovation process to further integrate the digital experience into the physical Shack experience 17
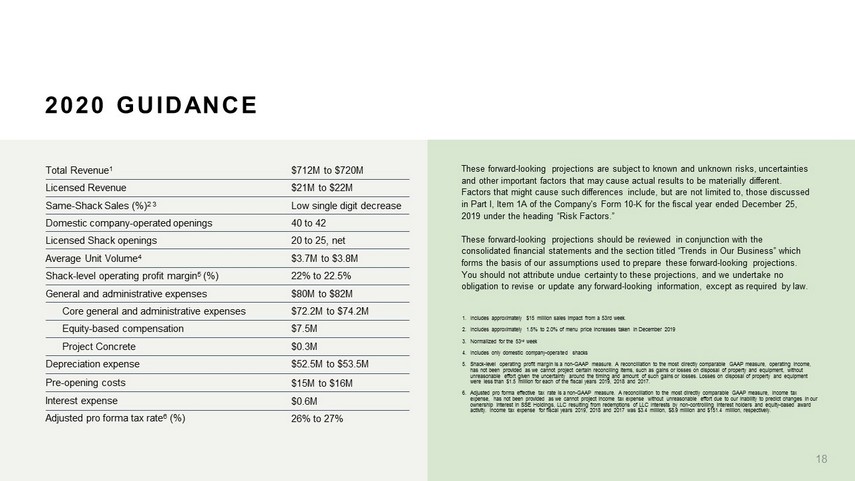
2020 GUIDANCE 1. Includes approximately $15 million sales impact from a 53rd week. 2. Includes approximately 1.5% to 2.0% of menu price increases taken in December 2019 3. Normalized for the 53 rd week 4. Includes only domestic company - operated shacks 5. Shack - level operating profit margin is a non - GAAP measure. A reconciliation to the most directly comparable GAAP measure, operat ing income, has not been provided as we cannot project certain reconciling items, such as gains or losses on disposal of property and equ ipm ent, without unreasonable effort given the uncertainty around the timing and amount of such gains or losses. Losses on disposal of propert y a nd equipment were less than $1.5 million for each of the fiscal years 2019, 2018 and 2017. 6. Adjusted pro forma effective tax rate is a non - GAAP measure. A reconciliation to the most directly comparable GAAP measure, inco me tax expense, has not been provided as we cannot project income tax expense without unreasonable effort due to our inability to pr edi ct changes in our ownership interest in SSE Holdings, LLC resulting from redemptions of LLC Interests by non - controlling interest holders and equi ty - based award activity. Income tax expense for fiscal years 2019, 2018 and 2017 was $3.4 million, $8.9 million and $151.4 million, respecti vel y. These forward - looking projections are subject to known and unknown risks, uncertainties and other important factors that may cause actual results to be materially different. Factors that might cause such differences include, but are not limited to, those discussed in Part I, Item 1A of the Company's Form 10 - K for the fiscal year ended December 25, 2019 under the heading “Risk Factors.” These forward - looking projections should be reviewed in conjunction with the consolidated financial statements and the section titled “Trends in Our Business” which forms the basis of our assumptions used to prepare these forward - looking projections. You should not attribute undue certainty to these projections, and we undertake no obligation to revise or update any forward - looking information, except as required by law. Total Revenue 1 Licensed Revenue Same - Shack Sales (%) 2 3 Domestic company - operated openings Licensed Shack openings Average Unit Volume 4 Shack - level operating profit margin 5 (%) General and administrative expenses Core general and administrative expenses Equity - based compensation Project Concrete Depreciation expense Pre - opening costs Interest expense Adjusted pro forma tax rate 6 (%) $712M to $720M $21M to $22M Low single digit decrease 40 to 42 20 to 25, net $3.7M to $3.8M 22% to 22.5% $80M to $82M $72.2M to $74.2M $7.5M $0.3M $52.5M to $53.5M $15M to $16M $0.6M 26% to 27% 18
APPENDIX INCLUDING GAAP & NON - GAAP MEASURES 19
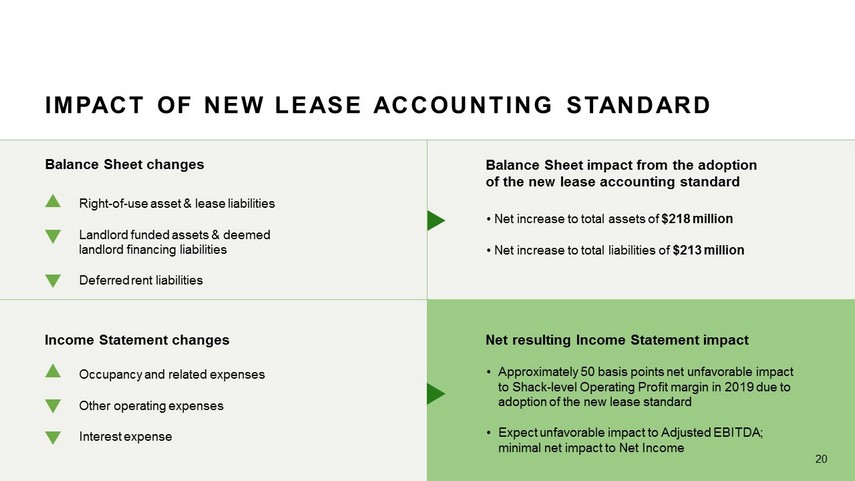
Right - of - use asset & lease liabilities Landlord funded assets & deemed landlord financing liabilities Deferred rent liabilities Occupancy and related expenses Other operating expenses Interest expense • Net increase to total assets of $218 million • Net increase to total liabilities of $213 million IMPACT OF NEW LEASE ACCOUNTING STANDARD 20 Balance Sheet impact from the adoption of the new lease accounting standard Income Statement changes Balance Sheet changes Net resulting Income Statement impact • Approximately 50 basis points net unfavorable impact to Shack - level Operating Profit margin in 2019 due to adoption of the new lease standard • Expect unfavorable impact to Adjusted EBITDA; minimal net impact to Net Income
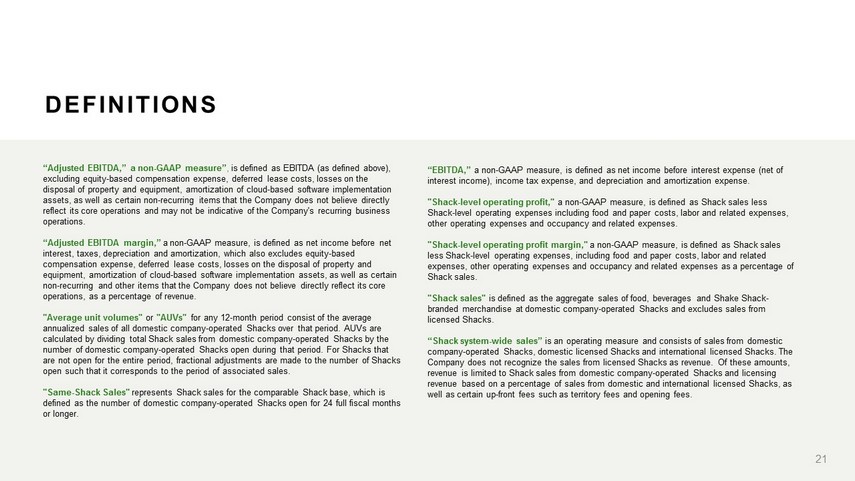
“Adjusted EBITDA,” a non - GAAP measure” , is defined as EBITDA (as defined above), excluding equity - based compensation expense, deferred lease costs, losses on the disposal of property and equipment, amortization of cloud - based software implementation assets, as well as certain non - recurring items that the Company does not believe directly reflect its core operations and may not be indicative of the Company's recurring business operations. “Adjusted EBITDA margin,” a non - GAAP measure, is defined as net income before net interest, taxes, depreciation and amortization, which also excludes equity - based compensation expense, deferred lease costs, losses on the disposal of property and equipment, amortization of cloud - based software implementation assets, as well as certain non - recurring and other items that the Company does not believe directly reflect its core operations, as a percentage of revenue. "Average unit volumes" or "AUVs" for any 12 - month period consist of the average annualized sales of all domestic company - operated Shacks over that period. AUVs are calculated by dividing total Shack sales from domestic company - operated Shacks by the number of domestic company - operated Shacks open during that period. For Shacks that are not open for the entire period, fractional adjustments are made to the number of Shacks open such that it corresponds to the period of associated sales. "Same - Shack Sales" represents Shack sales for the comparable Shack base, which is defined as the number of domestic company - operated Shacks open for 24 full fiscal months or longer. DEFINITIONS “EBITDA,” a non - GAAP measure, is defined as net income before interest expense (net of interest income), income tax expense, and depreciation and amortization expense. "Shack - level operating profit," a non - GAAP measure, is defined as Shack sales less Shack - level operating expenses including food and paper costs, labor and related expenses, other operating expenses and occupancy and related expenses. "Shack - level operating profit margin," a non - GAAP measure, is defined as Shack sales less Shack - level operating expenses, including food and paper costs, labor and related expenses, other operating expenses and occupancy and related expenses as a percentage of Shack sales. "Shack sales" is defined as the aggregate sales of food, beverages and Shake Shack - branded merchandise at domestic company - operated Shacks and excludes sales from licensed Shacks. “Shack system - wide sales” is an operating measure and consists of sales from domestic company - operated Shacks, domestic licensed Shacks and international licensed Shacks. The Company does not recognize the sales from licensed Shacks as revenue. Of these amounts, revenue is limited to Shack sales from domestic company - operated Shacks and licensing revenue based on a percentage of sales from domestic and international licensed Shacks, as well as certain up - front fees such as territory fees and opening fees. 21
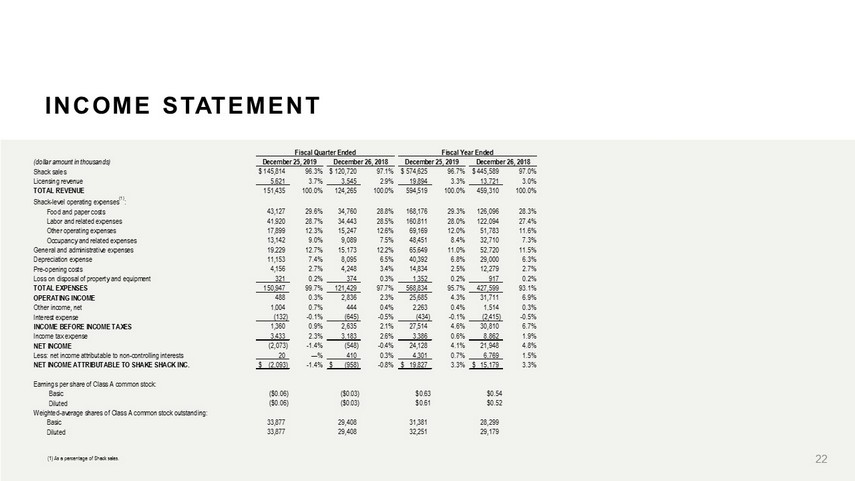
INCOME STATEMENT 22 (1) As a percentage of Shack sales. (dollar amount in thousands) Shack sales $ 145,814 96.3% $ 120,720 97.1% $ 574,625 96.7% $ 445,589 97.0% Licensing revenue 5,621 3.7% 3,545 2.9% 19,894 3.3% 13,721 3.0% TOTAL REVENUE 151,435 100.0% 124,265 100.0% 594,519 100.0% 459,310 100.0% Shack-level operating expenses (1) : Food and paper costs 43,127 29.6% 34,760 28.8% 168,176 29.3% 126,096 28.3% Labor and related expenses 41,920 28.7% 34,443 28.5% 160,811 28.0% 122,094 27.4% Other operating expenses 17,899 12.3% 15,247 12.6% 69,169 12.0% 51,783 11.6% Occupancy and related expenses 13,142 9.0% 9,089 7.5% 48,451 8.4% 32,710 7.3% General and administrative expenses 19,229 12.7% 15,173 12.2% 65,649 11.0% 52,720 11.5% Depreciation expense 11,153 7.4% 8,095 6.5% 40,392 6.8% 29,000 6.3% Pre-opening costs 4,156 2.7% 4,248 3.4% 14,834 2.5% 12,279 2.7% Loss on disposal of property and equipment 321 0.2% 374 0.3% 1,352 0.2% 917 0.2% TOTAL EXPENSES 150,947 99.7% 121,429 97.7% 568,834 95.7% 427,599 93.1% OPERATING INCOME 488 0.3% 2,836 2.3% 25,685 4.3% 31,711 6.9% Other income, net 1,004 0.7% 444 0.4% 2,263 0.4% 1,514 0.3% Interest expense (132) -0.1% (645) -0.5% (434) -0.1% (2,415) -0.5% INCOME BEFORE INCOME TAXES 1,360 0.9% 2,635 2.1% 27,514 4.6% 30,810 6.7% Income tax expense 3,433 2.3% 3,183 2.6% 3,386 0.6% 8,862 1.9% NET INCOME (2,073) -1.4% (548) -0.4% 24,128 4.1% 21,948 4.8% Less: net income attributable to non-controlling interests 20 —% 410 0.3% 4,301 0.7% 6,769 1.5% NET INCOME ATTRIBUTABLE TO SHAKE SHACK INC. $ (2,093) -1.4% $ (958) -0.8% $ 19,827 3.3% $ 15,179 3.3% Earnings per share of Class A common stock: Basic ($0.06) ($0.03) $0.63 $0.54 Diluted ($0.06) ($0.03) $0.61 $0.52 Weighted-average shares of Class A common stock outstanding: Basic 33,877 29,408 31,381 28,299 Diluted 33,877 29,408 32,251 29,179 Fiscal Quarter Ended December 25, 2019 December 26, 2018 Fiscal Year Ended December 25, 2019 December 26, 2018
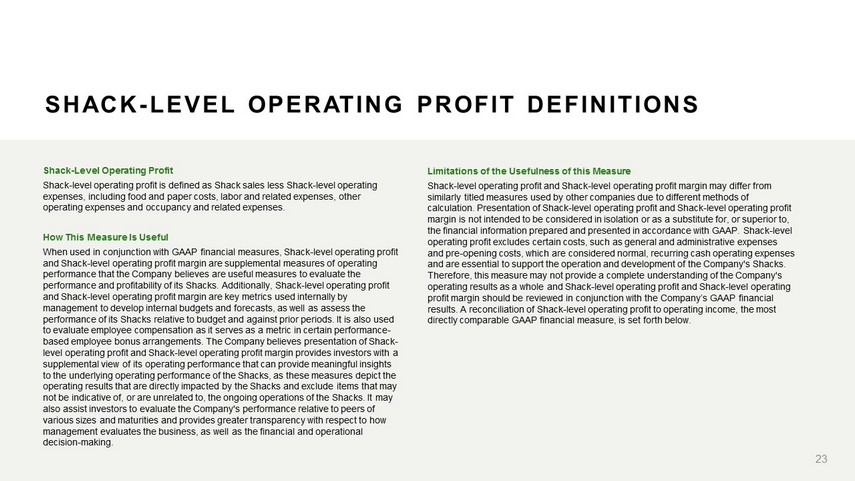
Shack - Level Operating Profit Shack - level operating profit is defined as Shack sales less Shack - level operating expenses, including food and paper costs, labor and related expenses, other operating expenses and occupancy and related expenses. How This Measure Is Useful When used in conjunction with GAAP financial measures, Shack - level operating profit and Shack - level operating profit margin are supplemental measures of operating performance that the Company believes are useful measures to evaluate the performance and profitability of its Shacks. Additionally, Shack - level operating profit and Shack - level operating profit margin are key metrics used internally by management to develop internal budgets and forecasts, as well as assess the performance of its Shacks relative to budget and against prior periods. It is also used to evaluate employee compensation as it serves as a metric in certain performance - based employee bonus arrangements. The Company believes presentation of Shack - level operating profit and Shack - level operating profit margin provides investors with a supplemental view of its operating performance that can provide meaningful insights to the underlying operating performance of the Shacks, as these measures depict the operating results that are directly impacted by the Shacks and exclude items that may not be indicative of, or are unrelated to, the ongoing operations of the Shacks. It may also assist investors to evaluate the Company's performance relative to peers of various sizes and maturities and provides greater transparency with respect to how management evaluates the business, as well as the financial and operational decision - making. Limitations of the Usefulness of this Measure Shack - level operating profit and Shack - level operating profit margin may differ from similarly titled measures used by other companies due to different methods of calculation. Presentation of Shack - level operating profit and Shack - level operating profit margin is not intended to be considered in isolation or as a substitute for, or superior to, the financial information prepared and presented in accordance with GAAP. Shack - level operating profit excludes certain costs, such as general and administrative expenses and pre - opening costs, which are considered normal, recurring cash operating expenses and are essential to support the operation and development of the Company's Shacks. Therefore, this measure may not provide a complete understanding of the Company's operating results as a whole and Shack - level operating profit and Shack - level operating profit margin should be reviewed in conjunction with the Company’s GAAP financial results. A reconciliation of Shack - level operating profit to operating income, the most directly comparable GAAP financial measure, is set forth below. SHACK - LEVEL OPERATING PROFIT DEFINITIONS 23
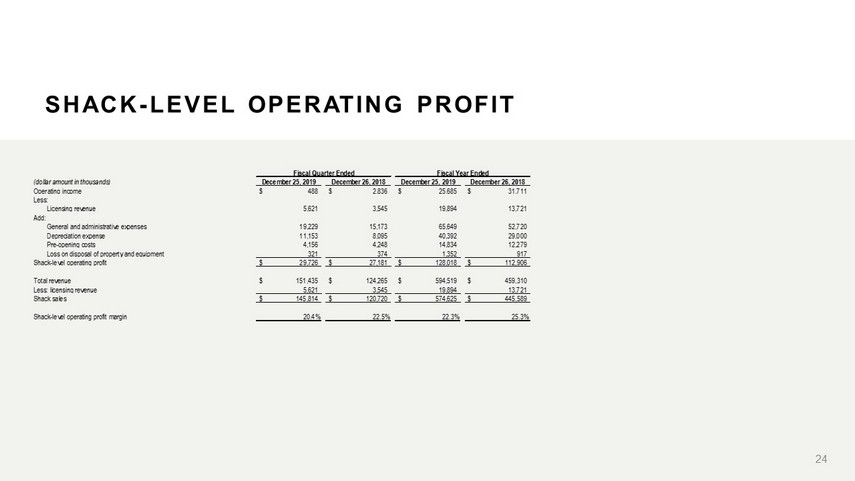
SHACK - LEVEL OPERATING PROFIT 24 (dollar amount in thousands) December 25, 2019 December 26, 2018 December 25, 2019 December 26, 2018 Operating income 488$ 2,836$ 25,685$ 31,711$ Less: Licensing revenue 5,621 3,545 19,894 13,721 Add: General and administrative expenses 19,229 15,173 65,649 52,720 Depreciation expense 11,153 8,095 40,392 29,000 Pre-opening costs 4,156 4,248 14,834 12,279 Loss on disposal of property and equipment 321 374 1,352 917 Shack-level operating profit 29,726$ 27,181$ 128,018$ 112,906$ Total revenue 151,435$ 124,265$ 594,519$ 459,310$ Less: licensing revenue 5,621 3,545 19,894 13,721 Shack sales 145,814$ 120,720$ 574,625$ 445,589$ Shack-level operating profit margin 20.4% 22.5% 22.3% 25.3% Fiscal Quarter Ended Fiscal Year Ended
EBITDA and Adjusted EBITDA EBITDA is defined as net income before interest expense (net of interest income), income tax expense and depreciation and amortization expense. Adjusted EBITDA is defined as EBITDA (as defined above) excluding equity - based compensation expense, deferred lease cost, losses on the disposal of property and equipment, amortization of cloud - based software implementation costs, as well as certain non - recurring items that the Company does not believe directly reflect its core operations and may not be indicative of the Company's recurring business operations. How These Measures Are Useful When used in conjunction with GAAP financial measures, EBITDA and adjusted EBITDA are supplemental measures of operating performance that the Company believes are useful measures to facilitate comparisons to historical performance and competitors' operating results. Adjusted EBITDA is a key metric used internally by management to develop internal budgets and forecasts and also serves as a metric in its performance - based equity incentive programs and certain bonus arrangements. The Company believes presentation of EBITDA and adjusted EBITDA provides investors with a supplemental view of the Company's operating performance that facilitates analysis and comparisons of its ongoing business operations because they exclude items that may not be indicative of the Company's ongoing operating performance. ADJUSTED EBITDA DEFINITIONS Limitations of the Usefulness of These Measures EBITDA and adjusted EBITDA may differ from similarly titled measures used by other companies due to different methods of calculation. Presentation of EBITDA and adjusted EBITDA is not intended to be considered in isolation or as a substitute for, or superior to, the financial information prepared and presented in accordance with GAAP. EBITDA and adjusted EBITDA exclude certain normal recurring expenses. Therefore, these measures may not provide a complete understanding of the Company's performance and should be reviewed in conjunction with the GAAP financial measures. A reconciliation of EBITDA and adjusted EBITDA to net income, the most directly comparable GAAP measure, is set forth below. 25
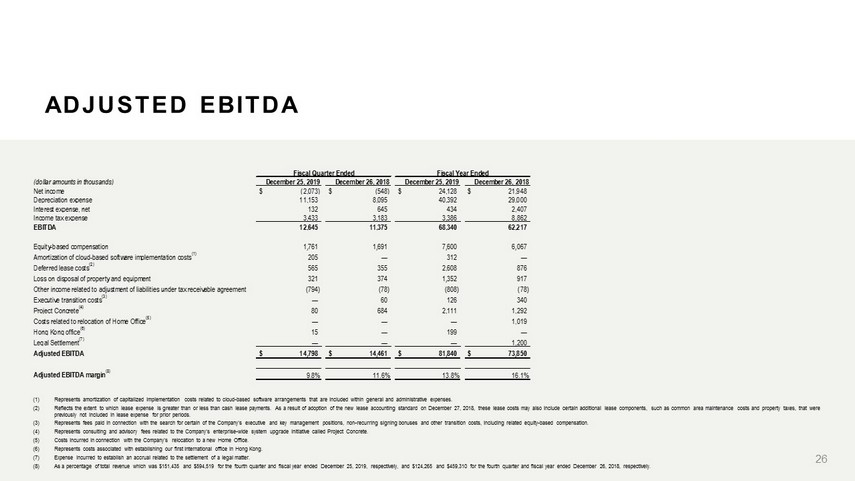
ADJUSTED EBITDA 26 (1) Represents amortization of capitalized implementation costs related to cloud - based software arrangements that are included withi n general and administrative expenses. (2) Reflects the extent to which lease expense is greater than or less than cash lease payments. As a result of adoption of the n ew lease accounting standard on December 27, 2018, these lease costs may also include certain additional lease components, such as common area maintenance costs and property taxes, that were previously not included in lease expense for prior periods. (3) Represents fees paid in connection with the search for certain of the Company's executive and key management positions, non - recu rring signing bonuses and other transition costs, including related equity - based compensation. (4) Represents consulting and advisory fees related to the Company's enterprise - wide system upgrade initiative called Project Concre te. (5) Costs incurred in connection with the Company's relocation to a new Home Office. (6) Represents costs associated with establishing our first international office in Hong Kong. (7) Expense incurred to establish an accrual related to the settlement of a legal matter. (8) As a percentage of total revenue which was $151,435 and $594,519 for the fourth quarter and fiscal year ended December 25, 2019, respectively, and $124,265 and $459,310 for the fourth quarter and fiscal year ended December 26, 2018, respectively. (dollar amounts in thousands) December 25, 2019 December 26, 2018 December 25, 2019 December 26, 2018 Net income (2,073)$ (548)$ 24,128$ 21,948$ Depreciation expense 11,153 8,095 40,392 29,000 Interest expense, net 132 645 434 2,407 Income tax expense 3,433 3,183 3,386 8,862 EBITDA 12,645 11,375 68,340 62,217 Equity-based compensation 1,761 1,691 7,600 6,067 Amortization of cloud-based software implementation costs (1) 205 — 312 — Deferred lease costs (2) 565 355 2,608 876 Loss on disposal of property and equipment 321 374 1,352 917 Other income related to adjustment of liabilities under tax receivable agreement (794) (78) (808) (78) Executive transition costs (3) — 60 126 340 Project Concrete (4) 80 684 2,111 1,292 Costs related to relocation of Home Office (5) — — — 1,019 Hong Kong office (6) 15 — 199 — Legal Settlement (7) — — — 1,200 Adjusted EBITDA 14,798$ 14,461$ 81,840$ 73,850$ Adjusted EBITDA margin (8) 9.8% 11.6% 13.8% 16.1% Fiscal Quarter Ended Fiscal Year Ended
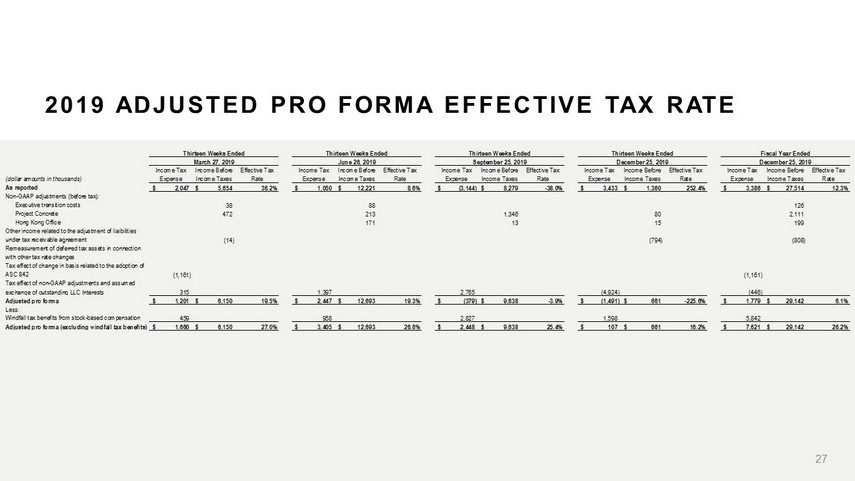
2019 ADJUSTED PRO FORMA EFFECTIVE TAX RATE 27 (dollar amounts in thousands) Income Tax Expense Income Before Income Taxes Effective Tax Rate Income Tax Expense Income Before Income Taxes Effective Tax Rate Income Tax Expense Income Before Income Taxes Effective Tax Rate Income Tax Expense Income Before Income Taxes Effective Tax Rate Income Tax Expense Income Before Income Taxes Effective Tax Rate As reported 2,047$ 5,654$ 36.2% 1,050$ 12,221$ 8.6% (3,144)$ 8,279$ -38.0% 3,433$ 1,360$ 252.4% 3,386$ 27,514$ 12.3% Non-GAAP adjustments (before tax): Executive transition costs 38 88 126 Project Concrete 472 213 1,346 80 2,111 Hong Kong Office 171 13 15 199 Other income related to the adjustment of liaibilities under tax receivable agreement (14) (794) (808) Remeasurement of deferred tax assets in connection with other tax rate changes Tax effect of change in basis related to the adoption of ASC 842 (1,161) (1,161) Tax effect of non-GAAP adjustments and assumed exchange of outstanding LLC Interests 315 1,397 2,765 (4,924) (446) Adjusted pro forma 1,201$ 6,150$ 19.5% 2,447$ 12,693$ 19.3% (379)$ 9,638$ -3.9% (1,491)$ 661$ -225.6% 1,779$ 29,142$ 6.1% Less: Windfall tax benefits from stock-based compensation 459 958 2,827 1,598 5,842 Adjusted pro forma (excluding windfall tax benefits) 1,660$ 6,150$ 27.0% 3,405$ 12,693$ 26.8% 2,448$ 9,638$ 25.4% 107$ 661$ 16.2% 7,621$ 29,142$ 26.2% Thirteen Weeks Ended March 27, 2019 Thirteen Weeks Ended Fiscal Year Ended June 26, 2019 December 25, 2019 Thirteen Weeks Ended December 25, 2019 Thirteen Weeks Ended September 25, 2019
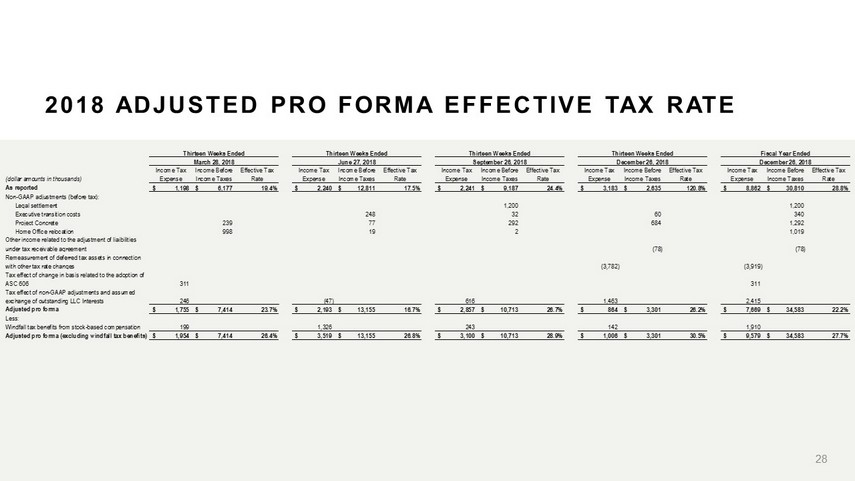
2018 ADJUSTED PRO FORMA EFFECTIVE TAX RATE 28 (dollar amounts in thousands) Income Tax Expense Income Before Income Taxes Effective Tax Rate Income Tax Expense Income Before Income Taxes Effective Tax Rate Income Tax Expense Income Before Income Taxes Effective Tax Rate Income Tax Expense Income Before Income Taxes Effective Tax Rate Income Tax Expense Income Before Income Taxes Effective Tax Rate As reported 1,198$ 6,177$ 19.4% 2,240$ 12,811$ 17.5% 2,241$ 9,187$ 24.4% 3,183$ 2,635$ 120.8% 8,862$ 30,810$ 28.8% Non-GAAP adjustments (before tax): Legal settlement 1,200 1,200 Executive transition costs 248 32 60 340 Project Concrete 239 77 292 684 1,292 Home Office relocation 998 19 2 1,019 Other income related to the adjustment of liaibilities under tax receivable agreement (78) (78) Remeasurement of deferred tax assets in connection with other tax rate changes (3,782) (3,919) Tax effect of change in basis related to the adoption of ASC 606 311 311 Tax effect of non-GAAP adjustments and assumed exchange of outstanding LLC Interests 246 (47) 616 1,463 2,415 Adjusted pro forma 1,755$ 7,414$ 23.7% 2,193$ 13,155$ 16.7% 2,857$ 10,713$ 26.7% 864$ 3,301$ 26.2% 7,669$ 34,583$ 22.2% Less: Windfall tax benefits from stock-based compensation 199 1,326 243 142 1,910 Adjusted pro forma (excluding windfall tax benefits) 1,954$ 7,414$ 26.4% 3,519$ 13,155$ 26.8% 3,100$ 10,713$ 28.9% 1,006$ 3,301$ 30.5% 9,579$ 34,583$ 27.7% Thirteen Weeks Ended March 28, 2018 Fiscal Year Ended December 26, 2018 Thirteen Weeks Ended Thirteen Weeks Ended June 27, 2018 September 26, 2018 Thirteen Weeks Ended December 26, 2018

CONTACT INFORMATION INVESTOR CONTACT Melissa Calandruccio, ICR Michelle Michalski, ICR (844) Shack - 04 (844 - 742 - 2504) investor@shakeshack.com MEDIA CONTACT Kristyn Clark, Shake Shack 646 - 747 - 8776 kclark@shakeshack.com 29