Attached files
| file | filename |
|---|---|
| 8-K - 8-K - Arconic Corp | tm2010856d1_8k.htm |
Exhibit 99.1

Arconic Corporation Global Leader in Aluminum Rolled Products, Extrusions and Building Solutions February 25, 2020

Important Information Forward – Looking Statements This presentation contains statements that relate to future events and expectations and as such constitute forward - looking state ments within the meaning of the Private Securities Litigation Reform Act of 1995. Forward - looking statements include those containing such words as "anticipates," "believes," "could," "estimates," "expects," "forecasts," "g oal ," "guidance," "intends," "may," "outlook," "plans," "projects," "seeks," "sees," "should," "targets," "will," "would," or other words of similar meaning. All statements that reflect expectations, assumptions or projections of Arconic C orp . about the future, other than statements of historical fact, are forward - looking statements, including, without limitation, forecasts and expectations relating to the growth of the aerospace, defense, automotive, indus tri als, commercial transportation and other end markets; statements and guidance regarding future financial results or operating performance; statements regarding future strategic actions; and statements about Arconic Corp. 's strategies, outlook, business and financial prospects. These statements reflect beliefs and assumptions that are based on Arconic Corp.’s perception of historical trends, current conditions and expected future develop men ts, as well as other factors Arconic Corp. believes are appropriate in the circumstances. Forward - looking statements are not guarantees of future performance and are subject to risks, uncertainties and changes in circumstan ces that are difficult to predict, which could cause actual results to differ materially from those indicated by these statements. Such risks and uncertainties include, but are not limited to: (a) deterioration in global econ omi c and financial market conditions generally; (b) unfavorable changes in the markets served by Arconic Corp.; (c) competition from new product offerings, disruptive technologies, industry consolidation or other developments; (d) th e loss of key customers or significant changes in the business or financial condition of customers; (e) manufacturing difficulties or other issues that impact product performance, quality or safety; (f) the inability to meet incr eas ed program demand successfully or to mitigate the impact of program cancellations, reductions or delays; (g) the outcome of product liability, product safety, personal injury, property damage, and recall claims and investi gat ions, which can expose Arconic Corp. to substantial costs, liabilities and reputational harm; (h) political, economic, and regulatory risks relating to Arconic Corp.'s global operations, including compliance with U.S. and foreign trad e a nd tax laws, sanctions, embargoes and other regulations; (i) a material disruption of Arconic Corp.'s operations, particularly at one or more of Arconic Corp.'s manufacturing facilities; (j) the inability to achieve the level o f r evenue growth, cash generation, cost savings, improvement in profitability and margins, fiscal discipline, or strengthening of competitiveness and operations anticipated or targeted; (k) the impact of potential cyber - attacks and informati on technology or data security breaches; (l) the inability to develop innovative new products or implement technology initiatives successfully; (m) challenges to Arconic Corp.’s intellectual property rights; (n) adverse ch ang es in discount rates or investment returns on pension assets; (o) Arconic Corp.'s inability to realize expected benefits, in each case as planned and by targeted completion dates, from acquisitions, divestitures, facility closur es, curtailments, expansions, or joint ventures; (p) increases in the cost of aluminum or volatility in the availability or costs of other raw materials; (q) a significant downturn in the business or financial condition of a signific ant supplier; (r) the impact of changes in foreign currency exchange rates on costs and results; (s) the outcome of contingencies, including legal proceedings, government or regulatory investigations, and environmental compliance and remediation, which can expose Arconic Corp. to substantial costs and liabilities; (t) the expected benefits and timing of the separation, and uncertainties regarding the planned separation, including the risk that c ond itions to the separation will not be satisfied and that it will not be completed pursuant to the targeted timing, asset perimeters, and other anticipated terms, if at all; (u) a determination by the IRS that the distributi on or certain related transactions should be treated as taxable transactions; (v) the possibility that any consents or approvals required in connection with the separation will not be received or obtained within the expected time fr ame , on the expected terms or at all; (w) expected financing transactions undertaken in connection with the separation and risks associated with additional indebtedness; (x) the risk that dissynergy costs, costs of restructu rin g transactions and other costs incurred in connection with the separation will exceed our estimates; and (y) the other risk factors summarized in Arconic Corp.’s registration statement on Form 10 and any reports filed with the U.S . S ecurities and Exchange Commission (SEC). Market projections are subject to the risks discussed above and other risks in the market. The statements in this presentation are made as of the date of this presentation, even if subs equ ently made available by Arconic Corp. on its website or otherwise. Arconic Corp. disclaims any intention or obligation to update publicly or review any forward - looking statements, whether in response to new information, fut ure events, or otherwise, except as required by applicable law. 2

Important Information (continued) 3 References herein to “Arconic Corp.” refer to Arconic Rolled Products Corporation, which will be renamed “Arconic Corporation ” u pon its separation from Arconic Inc. (to be renamed “Howmet Aerospace Inc.” upon the separation). In connection with the separation, Arconic Corp. has filed a registration statement on Form 10 (the “Form 10”) with the U.S. Securities and Exchange Commission, which was dec lar ed effective on February 13, 2020. References to page numbers in the Form 10 herein refers to the corresponding pages in the Information Statement filed as Exhi bit 99.1 to the Form 10. Non - GAAP Financial Measures Some of the information included in this presentation is derived from Arconic Corp.’s and Arconic Inc.’s consolidated financi al information but is not presented in Arconic Corp.’s and Arconic Inc.’s financial statements prepared in accordance with accounting principles generally accepted in the United States of America (GAAP). Certain of these data are considered “non - GAAP financial measures” under SEC rules. These non - GAAP financial measures supplement our GAAP disclosures and should not be considered an alternative to the GAAP measure. Reconciliations to the most directly comparable GAAP financial measures and management’s rationale for the use of t he non - GAAP financial measures can be found in the Appendix to this presentation. Arconic Corp. has not provided reconciliations of any forward - looking non - GAAP financial measure s, such as organic revenue, earnings per share excluding special items, adjusted free cash flow, and adjusted free cash flow conversion, to the most directly comparable GAA P f inancial measures because such reconciliations are not available without unreasonable efforts due to the variability and complexity with respect to the charges and other components ex cluded from the non - GAAP measures, such as the effects of foreign currency movements, equity income, gains or losses on sales of assets, taxes, and any future restructuring or impairment charges. These reconciling items are in addition to the inherent variability already included in the GAAP measures, which includes, but is not limited to, price/mix and volume Arconic Corp. believes such reconciliations would imply a degree of precision that would be confusing or misleading to investors. “Organic revenue” is GAAP revenue adjusted for Tennessee Packaging (which completed its phase - down as of year - end 2018), divesti tures, and changes in aluminum prices and foreign currency exchange rates relative to prior year period. “Adjusted free cash flow” is cash provided from (used for) operations , l ess capital expenditures, plus cash receipts from sold receivables. Any reference to historical EBITDA means adjusted EBITDA for which we have provided calculations and reconcilia tio ns in the Appendix. Arconic Inc.’s Global Rolled Products (“GRP”) Segment Information Arconic Corp.’s audited combined financial statements as of and for the year ended December 31, 2019 are not yet complete and ar e not available as of the date of this presentation. On January 27, 2020, Arconic Inc. reported unaudited financial results for the year ended December 31, 2019 for its GRP segment. A rconic Corp.’s historical combined financial information was prepared from Arconic Inc. historical accounting records, including the underlying financial data derived from the operat ion s that comprise Arconic Inc.’s GRP segment. Certain financial information of Arconic Inc.’s GRP segment included in this presentation is the information of Arconic Inc.’s GRP se gme nt as a reportable segment of Arconic Inc. This financial information was prepared on a different basis than, and may not be directly comparable to, the financial information of Arcon ic Corp. as it is depicted elsewhere in this presentation. Arconic Corp.’s final audited combined financial statements as of and for the year ended December 31, 2019 may differ from Ar con ic Inc.’s GRP segment’s unaudited financial results included in this presentation, and the unaudited financial results for Arconic Inc.’s GRP segment for the year ended December 31 , 2019 are not necessarily indicative of Arconic Corp.’s future results for any subsequent periods. You should not place undue reliance on these unaudited financial results. Arconic In c.’s unaudited financial results included in this presentation should be read in conjunction with Arconic Corp.’s Form 10.

4 Today’s Presenters Tim Myers Chief Executive Officer Arconic Corp. Erick Asmussen Chief Financial Officer Arconic Corp.

Arconic Corp. Competes on Operational Efficiency in Attractive End Markets 5 • Well positioned in attractive end markets • Unique and iconic assets • Strong financial profile with focus on productivity and disciplined capital allocation • A specialty conversion business with ~90% of metal price pass - through • Attractive capital structure with good cash flow characteristics

6 Company Overview Select Customers Select Customers Select Customers 1) The financial information presented is of Arconic Inc.’s GRP segment as a reportable segment of Arconic Inc. and was prepared on a different basis than, and may not be directly comparable to, the financial information of Arconic Corp. as it is depicted elsewhere in this presentation. You should not place undue reliance on this financial information of Arconic Inc. See “Arconic Inc.’s Global Rolled Products Segment Information” under “Important Information” on slide 3 for additional information. 2) Excludes intersegment sales of $183M. Market position data as of FY2019. See appendix for reconciliations. Rolled Products Building & Construction Systems Aluminum Extrusions 77% 7% 16% ▪ Polished fuselage sheet ▪ Wing skins ▪ Armored plate ▪ Auto body sheet ▪ Commercial airframes applications ▪ Land and sea defense applications ▪ Windows ▪ Doors ▪ Store fronts ▪ Curtain walling Select Products Select Products Select Products Global leader in rolled aluminum sheet Global leader in building and architectural solutions Technology leader in aerospace Al extrusions #2 Autobody sheet #1 Aerospace sheet and plate #2 Architectural Systems in North America ▪ Brazing sheet ▪ Mold and tooling plate ▪ Tread plate ▪ Drive shaft extrusions ▪ Aluminum frame rails ▪ Rods and bars ▪ Exterior and interior cladding ▪ Coil coated sheet solutions Arconic Inc. GRP Segment 1 Third - Party Revenue: $7.1B 2 Segment Operating Profit: $625M

7 Leading Global Provider of Aluminum Rolled Products and Building Solutions Select Customers Aerospace Select Customers Industrial, Packaging & Other Select Customers Building & Construction 1) Based on global brazing, North American Industrial and European packaging markets. 2) Based on Kawneer product lines. 3) Market position data as of FY2019. Select Competitors Select Competitors Select Competitors Global market position #1 #2 Global market position 1 #2 Market position in North America 2 Select Customers Automotive & Transportation Select Competitors #2 Market position in North America

8 1) Airline Monitor June 2019 World Airline Passenger Fleet and Cargo Aircraft. Leading Presence on High Growth Platforms Across Aerospace Industry End market diversity on leading programs driving growth Aircraft Participation Robust aerospace growth supported by blue chip customer base World’s only supplier able to produce single - piece aluminum - lithium wing skins for largest commercial aircraft Produce 100% of Boeing commercial wings and fuselages Airlines Fleets Expected to Grow 1.6x in the Next Decade Commercial Aircraft Fleet, In Thousands 1 20 28 44 2008A 2018A 2028E 1.6x 1.4x 5% CAGR

9 Automotive Solutions Found Bumper to Bumper High growth platforms and aluminization will drive greater than automotive growth Automobile Participation North American Autobody Sheet (“ABS”) demand growth is driven by content gains, not increased vehicle sales Automakers are increasingly selecting aluminum as the material of choice • Aluminum aids in meeting greenhouse gas emissions regulations and delivers better performance and higher safety ratings Growth of electric vehicles, which are 15% - 27% more aluminum intensive than combustion vehicles, is expected to drive 10 million gross tonnes of aluminum demand by 2030 1 Liftgate outer Joining solutions RSR TM Engineered surfaces Body inner structure Hood Outer Hood Inner Radiator Crash structure Driveshaft Outer panels Battery case Seat frame B - Pillar Door inner Liftgate inner 2.2 4.1 2019E 2026E North American Autobody Sheet Demand 1) CRU Group. 2) Ducker Worldwide. 9% CAGR Estimated Gross Aluminum Autobody Sheet Shipments, billions of pounds 2

2018 International trade action initiated to counter Chinese imports and support domestic common alloy aluminum prices Tennessee Facility starts transition away from low - margin packaging business toward industrial products 2019 Initiated $100M expansion to enhance cold mill and finishing capabilities in Tennessee Secured price increases and 2020 and beyond industrial and automotive contracts against new capacity 2020 Tennessee facility completing addition of industrial product capacity Expected to reach full utilization by year end 2020 Tennessee Investment 10 Industrial Expansion, Supported by Trade Actions, Drives Further Growth Trade Action Supportive Pricing Shift to More Profitable Industrial Products PRICE MIX + Finishing Line Shift to Industrial

11 Source: Recycling data, Aluminum Association, The Aluminum Can Advantage, Key Sustainability Performance Indicators, Septembe r 2 019. Environmental Benefits of Aluminum are Prompting a Shift to Aluminum Cans Consumer & global beverage producer sustainability focus is prompting increased shift from plastic & glass to aluminum to the benefit of Arconic Corp. international operations. Avg. Recycled Content of Beverage Containers Consumer Recycle Rates of Beverage Containers 73% 3% 23% 0% 10% 20% 30% 40% 50% 60% 70% 80% Aluminum Plastic (PET) Glass 50% 29% 26% 0% 10% 20% 30% 40% 50% 60% Aluminum Plastic (PET) Glass “Ambev to launch Brazil's first canned water by year - end, executive says” Reuters October 22, 2019 “ Danone is latest water brand to take up aluminum cans ” The Canmaker October 21, 2019 “ Coca - Cola will sell Dasani in aluminum cans and bottles ” CNN Business August 13, 2019 “ Pepsi to test selling Aquafina in cans in 2020 ” Bloomberg June 27, 2019 “ This growth has happened so quickly that we're just trying to keep up with demand ... the biggest challenge we have is procur ing the necessary aluminum and having our own production capability." John Hayes, CEO, Ball Corp. October 16th, 2019 Bloomberg, Aluminum is replacing plastic as the greenest bottle

12 Globally Recognized Building & Construction Systems Supported by Secular Tailwinds Inventor of modern storefront 100+ years ago Building & Construction Participation Secular Tailwinds Kawneer Sunshades/ Light Kawneer Balcony / T errace doors Reynobond / Reynolux Kawneer entrances Kawneer Window wall systems Kawneer Framing systems Kawneer curtain wall systems Reynolux Roofing Windows 2.5 4.1 6.1 8.5 1950 - 1955 1975 - 1980 2000 - 2005 2030 - 2035 30% 38% 47% 60% 1950 1975 2000 2030 Urbanization (% world population in cities) 1 1) United Nations DESA / Population division. Population growth driving long - term demand for buildings Urbanization, climate & technology increasing building envelope value • Modularization requires higher quality, sophisticated solutions • Building codes are increasingly demanding and performance heavy • Energy efficiency driving demand for thermally improved products • Climate change driving severe - duty hurricane & tornado product demand • Global security environment driving demand for blast and bullet resistance Global Population Growth (B) 1

13 Environmental, Social, and Governance Automotive lightweighting trends continue as consumer preference for CUVs, SUVs, and light trucks remains strong while fuel efficiency standards become more stringent Advanced building materials reduce heating and cooling needs , protect structures from increasingly severe storm damage, and reduce the cost of rapid urbanization Consumers around the world demanding alternatives to plastic packaging materials as the impact of plastic waste and petrochemical base rising to forefront of consciousness Arconic Corp.’s wide range of offerings help some of the most energy - intensive end markets reduce fuel consumption, cut energy waste, and minimize pollution Ongoing Efforts to Reduce Energy Consumption Aluminum Stewardship Initiative has certified Arconic Corp.’s global headquarters and operations in Russia against ASI Performance Standard • Additional facility certifications are in progress The energy - intensive rolled products business has a stated target of reducing annual energy consumption by 30% from 2005 to 2030 • As of year - end 2018, the business had already reduced energy consumption by 22%

14 Global Rolled Products Facilities Building and Construction Systems Facilities Aluminum Extrusions Facilities Samara, Russia Kunshan, China Székesfehérvár,Hungary Qinhuangdao, China Merxheim, France Runcorn, U.K. Hanover, Germany Davenport Danville Hutchinson Lancaster Tennessee San Antonio Springdale Visalia Eastman Bloomsburg Cranberry Lafayette Halethorpe Chandler Lethbridge, Alberta Birmingham, U.K. Massena Global Footprint Enables In - Region Access for Customers’ Needs Global Strength: • ~15,000 people • 24 manufacturing locations • 8 countries 2018 Revenue by Region Russia 7% Other 10% United States 63% Hungary 9% France 4% China 7%

15 Iconic Davenport Facility is Unique in the Industry Davenport Highlights 6.5M sq. ft. ~2,100 employees Premier aerospace and automotive mill globally 220" mill and Very Thick Plate Stretcher enables production of the thickest and widest plate in the aluminum rolling industry - products only Arconic Corp. can manufacture Over $600M of growth capex completed in the last seven years Estimated replacement cost of $8 - $10 billion High cost plus years of permitting and other regulatory hurdles make it almost impossible to match the scale and capabilities of the Davenport facility

16 Samara Lancaster Tennessee 1.4M sq. ft. ~800 employees North America’s premier commercial transportation and industrial product producer Specializes in aluminum sheet and cast plate – has painting and multi - cut slitter finishing capabilities Industry - leading high strength alloys to support demands of new powertrain technologies on thermal management systems 3.7M sq. ft. ~900 employees Leading automotive sheet producer Recent industrial capacity extension enables significant new revenue opportunities Highly flexible facility able to produce auto, industrial, and packaging Over $400M of growth capex completed in the last five years 1.8M sq. ft. ~3,000 employees Leading position in the Russian aerospace and packaging markets – 4 th largest supplier of packaging products to the EU Specializes in aluminum sheet and cast plate, extrusions and forgings Two of the world’s largest horizontal presses Portfolio of Assets Creates Competitive Advantage with Wide Range of Products

17 1) Based on cross section (combination of thickness times width). Unique Capabilities Unique asset base positions Arconic Corp. to help both identify next generation technologies and manufacture them at scale • Differentiated scale and capabilities at Davenport facility – ~6.5M square feet • World’s only supplier able to produce single - piece aluminum - lithium wing skins for largest commercial aircraft • Produce 100% of Boeing aluminum wings and fuselage • Operate the world’s largest aluminum - lithium plant, delivering weight reductions for aero customers Significant investments largely complete • Tennessee transition from Packaging to Industrial Products and supported by Antidumping and Countervailing Duties against China • Horizontal heat treat press and thick plate stretcher Disciplined focus on asset utilization driving operational efficiency Robust intellectual property portfolio; includes over 900 granted and pending patents Differentiated Asset Base Advanced Aero Alloys (Aero) Largest wing skin worldwide combined with most advance alloys Adhesive Bonding (Auto) Premier adhesive bonding technology (“Arconic 951®”) 9x stronger than predecessor titanium zirconium Thick Plate Stretcher (Aero) 4,200 ton machine; stretches thick aluminum & aluminum lithium plate to produce industry’s largest fuselage frames, wing ribs & bulkheads 1 World - Class Assets Create World - Class Capabilities Fuselage (Aero) Very Wide Fuselage Skin to save Longitudinal and Circumferential Joints at OEM

18 Major Capital Investment Phase Ending as Adj. Free Cash Flow Set to Benefit Major Capital Investment TOTAL SPEND Automotive Davenport autobody sheet expansion ~$600M Tennessee autobody sheet expansion Industrial Tennessee transition/expansion ~$100M Aerospace Very thick plate stretcher ~$400M Horizontal heat - treat furnace Aluminum lithium cast house TOTAL ~$1.1B With this period of expansion nearing completion, run rate capital expenditures are expected to be less than 3% of revenue annually

Diversified Business Mix Focused on Value - Added Products and Complex Building Solutions 2018A Revenue ($M) $7,223 1 $11,189 2 $14,908 3 $1,586 $6,708 $5,958 4 $1,006 5 Product portfolio Aerospace plate x x x x x Packaging x x x x x Autobody sheet x x x x x x Brazing x x x x x x Extrusions x x x x x 2019 Third - Party Revenue by End Market 1 Capabilities span the spectrum of midstream aluminum product types Enable sticky relationships with a diverse customer base Differentiated product portfolio, profitability and exposure to high growth / high margin end markets Product Portfolio and End Market Diversity Limited to no exposure The financial information presented is of Arconic Inc.’s GRP segment as a reportable segment of Arconic Inc. and was prepared on a different basis than, and may not be directly comparable to, the financial information of Arconic Corp. as it is depicted elsewhere in this presentation. You should not place undue reliance on this fi nan cial information of Arconic Inc. See “Arconic Inc.’s Global Rolled Products Segment Information” under “Important Information” on slide 3 for additional information. 1) Excludes intersegment sales of $183M and $205M in 2019 and 2018, respectively; 2) Sum of Rolled Products and Extruded Solutions segment revenue; 3) Pro forma for combination; Represents Aleris FY18A (ended December 2018) plus Novelis FY19A (Ended March 2019); 4) Represents FY19A, which ended March 2019; 5 ) Rolling division. (Russia / China) 19 Aerospace 18% Ground Transportation 34% Industrial 17% Building & Construction 18% Packaging 13%
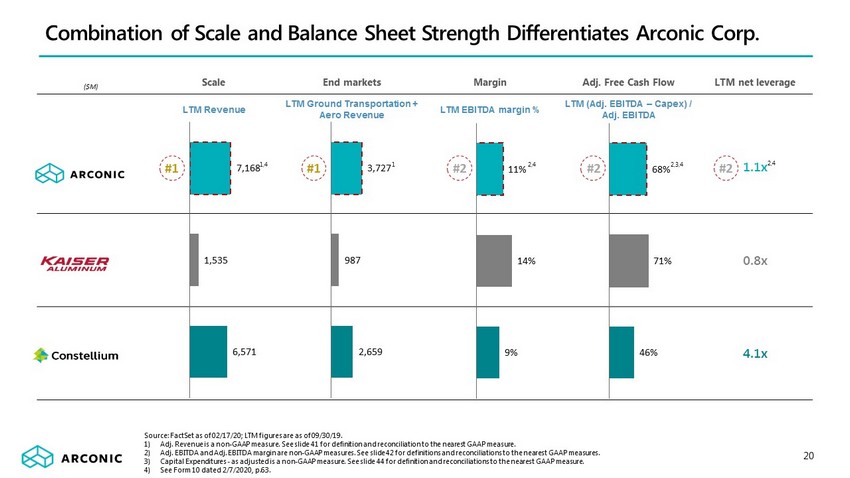
Scale End markets Margin Adj. Free Cash Flow LTM net leverage LTM Revenue LTM Ground Transportation + Aero Revenue LTM EBITDA margin % LTM (Adj. EBITDA – Capex) / Adj. EBITDA 1.1x 0.8x 4.1x 20 Combination of Scale and Balance Sheet Strength Differentiates Arconic Corp. 7,168 1,535 6,571 68% 71% 46% 11% 14% 9% #1 #2 #2 #2 3,727 987 2,659 #1 Source: FactSet as of 02/17/20; LTM figures are as of 09/30/19. 1) Adj. Revenue is a non - GAAP measure. See slide 41 for definition and reconciliation to the nearest GAAP measure. 2) Adj. EBITDA and Adj. EBITDA margin are non - GAAP measures. See slide 42 for definitions and reconciliations to the nearest GAAP m easures. 3) Capital Expenditures - as adjusted is a non - GAAP measure. See slide 44 for definition and reconciliations to the nearest GAAP me asure. 4) See Form 10 dated 2/7/2020, p.63. 1,4 1 2,4 2,3,4 2,4 ($M)

21 Arconic Corp. is a Value - Added Pass - Through Conversion Business Arconic Corp. buys aluminum (primary or scrap) • Primary aluminum is traded on commodity exchanges • Customer contracts reference the price of primary aluminum; ~90%+ of aluminum price exposure is passed along or hedged “Converts" the aluminum into a finished product • Desired customer product produced through heating and mixing aluminum to create the right alloy, followed by rolling, cooling , r eheating and applying necessary surface treatments • Our unique capabilities such as aluminum lithium, adhesive bonding, and thick plate stretcher allow for creation of best in c las s finished products S ells the finished product directly to customers or distributors • Final price of the product incorporates changes in the price of aluminum including regional premiums • Arconic Corp. is paid for the cost of the metal at the primary aluminum price and the value of conversion LME Aluminum Price (Pass - Through to Customer) COMMERCIAL MODEL Value Add / Fabrication Model Arconic Corp. Price

22 The Operating Model is core to Arconic Corp.'s culture and embraced by the leadership team Focused Growth Utilization Cost Reduction Participate in growing markets where we have technological, process, and product - quality leadership Capitalize on technological leadership in automotive body sheet #1 position in the aerospace sheet market poised for growth Recent Tennessee industrial conversion should provide substantial near - term growth North American plants have substantial additional capacity (greater than 600M lbs. / annum in total) Accessing this capacity does not require material incremental capital Potential North American packaging market re - entry can profitably absorb capacity Increased productivity through Overall Equipment Effectiveness (“OEE”) focus Improving scrap utilization with incremental efficiencies attainable Substantial opportunities to reduce indirect spend and drive down costs to offer customers superior value Utilize Six Sigma and other process improvement approaches to manage business and supply chain costs Major area of management focus over the next 12 – 18 months Operating Model Ingrained into Daily Business Activities

23 Capital Model Guides Capital Allocation Process and Decision - Making $308 $189 $150 - $190 2018 2019 2020 Forecast Asset Review prior to Capital request Equipment and plant - level asset utilization must be near peak before new capital expenditures are considered 2019 emphasis on Overall Equipment Effectiveness (OEE) revealed untapped capacity to grow volume without significant capital spend Investment case Target IRR well in excess of cost of capital Emphasis placed on payback period to avoid projects with returns driven by hard to predict terminal value CEO Review Capital allocation is a core responsibility of the CEO and CFO All capital spending above $0.5M is reviewed by the CEO Arconic Corp. expects no material growth capex needs in the near future, but has several low - risk and high - growth opportunities The financial information presented is of Arconic Inc.’s GRP segment as a reportable segment of Arconic Inc. and was prepared on a different basis than, and may not be directly comparable to, the financial information of Arconic Corp. as it is depicted elsewhere in this presentation. You should not place undue reliance on this financial information of Arconic Inc. See “Arconic Inc.’s Global Rolled Products Segment Information” under “Important Information” on slide 3 for additional information. 45% Reduction Capital Expenditures ($M)

$426 $669 2018 2019 $308 $189 2018 2019 $734 $858 2018 2019 24 Initiatives are Producing Improved Operating Performance and Adj. Free Cash Flow Arconic Corp. performance is improving at a rapid rate The financial information presented is of Arconic Inc.’s GRP segment as a reportable segment of Arconic Inc. and was prepared on a different basis than, and may not be directly comparable to, the financial information of Arconic Corp. as it is depicted elsewhere in this presentation. You should not place undue reliance on this financial information of Arconic Inc. See “Arconic Inc.’s Global Rolled Products Segment Information” under “Important Information” on slide 3 for additional information. Does not include corporate costs. Projected corporate costs including depreciation and amortization estimated at $75M - $85M for 2 020. See appendix for reconciliations . Arconic Inc.’s GRP Segment Operating Profit plus Depreciation and Amortization less Capital Expenditures Down 39% Up 57% ($M) Arconic Inc.’s GRP Segment Operating Profit plus Depreciation and Amortization Capital Expenditures ($M) ($M) Up 17%

FY 2018 FY 2019 (YoY) Third - Party Revenue 1 $7,223M $7,082M , down 2% (up 6% organically) Segment Operating Profit 2 $481M $625M , up 30% Segment Operating Profit Margin 2 6.7% 8.8% , up 210 bps Capital Expenditures $308M $189M , down 39% Capital Expenditures as a % of Revenue 4% 3% 25 The financial information presented is of Arconic Inc.’s GRP segment as a reportable segment of Arconic Inc. and was prepared on a different basis than, and may not be directly comparable to, the financial information of Arconic Corp. as it is depicted elsewhere in this presentation. You should not place undue reliance on this financial information of Arconic Inc. See “Arconic Inc.’s Global Rolled Products Segment Information” under “Important Information” on slide 3 for additional information. 1) Excludes intersegment sales of $183M and $205M in 2019 and 2018, respectively. 2) Does not include corporate costs. Projected corporate costs including depreciation and amortization estimated at $75M - $85M for 2 020. See appendix for reconciliations. Arconic Inc.’s Global Rolled Products Segment Year - over - Year Progression

1Q19 vs 1Q18 2Q19 vs 2Q18 3Q19 vs 3Q18 4Q19 vs 4Q18 Down 4% Up 27% Up 50% Up 61% (40) bps +210 bps +330 bps +370 bps Segment Operating Profit 1 Segment Operating Profit Margin 1 26 The financial information presented is of Arconic Inc.’s GRP segment as a reportable segment of Arconic Inc. and was prepared on a different basis than, and may not be directly comparable to, the financial information of Arconic Corp. as it is depicted elsewhere in this presentation. You should not place undue reliance on this financial information of Arconic Inc. See “Arconic Inc.’s Global Rolled Products Segment Information” under “Important Information” on slide 3 for additional information. 1) Does not include corporate costs. Projected corporate costs including depreciation and amortization estimated at $75M - $85M for 2 020. See appendix for reconciliations. Arconic Inc.’s Global Rolled Products Segment Year - over - Year Margin Expansion

Arconic Corp. 27 Arconic Corp. Capital Structure & Financial Policy Arconic Corp. Sources $M Arconic Corp. Uses $M New Debt Raised at Arconic Corp. $1,200 Dividend to Howmet Aerospace $800 Cash to Arconic Corp. B/S 1 400 Total Sources $1,200 Total Uses $1,200 Pro Forma x LTM 9/30/19 Cap Structure Adj. EBITDA 3 Interest rate Cash $400 $1,000 revolver (2025) 0 0.0x L + leveraged - based spread Secured Term Loan B (2027) 600 0.8x L + 275 bps 2nd Lien Secured Notes (2028) 600 0.8x 6.125% Total Debt $1,200 1.6x (+) Tax - Effected P&O Liability 2 1,315 1.7x Total Debt (Incl. P&O Liability) $2,515 3.3x Total Debt Net of Cash $800 1.1x 5 LTM 9/30/19 Adj. EBITDA 3 $755 Investment in business largely complete Focused on improving operational efficiency to drive organic growth No transformative acquisitions currently planned Targeting to pay cash dividends in an aggregate amount of up to ~$50M in the first year following the separation and up to ~$100M per annum thereafter ~5.25% blended interest rate on $1,200M of debt; ~$70M interest expense 4 Robust Financial Position Healthy adj. free cash flow generation Ample liquidity ($1.0B revolver and $400M cash on balance sheet at separation) Active management of pension plan exposure Separation does not trigger incremental cash contribution to pension plans Rigorous Financial Stewardship 1) Opening cash balance has been revised on timing and seasonality of 2020 adj. free cash flow. 2) Represents 9/30/19 pension and other postretirement benefits pro forma balance sheet liability tax - effected at the U.S. federal statutory rate of 21.0%. 3) Adj. EBITDA is a non - GAAP measure. See slide 42 for definitions and reconciliations to the nearest GAAP measures. 4) Based on Form 10 pro forma financials for 12 months representing the company with proposed capital structure; see page 71 of For m 10. Includes amortization of debt financing costs and excludes capitalized interest. 5) See Form 10 dated 2/7/2020, p.61 and p.69.

2Q – 4Q 2020 Assumptions FY 2020 Assumptions Sensitivities and Comments Average Al Price Al prices = $2,100/MT LME Cash = $1,790/MT MWP = $310/MT • +$100/MT increase = +~$115M annual Revenue impact and ~($5M) annual Operating Income impact • +$100/MT increase = ~($25M) annual LIFO non - cash impact Capex $120M - $160M $150M - $190M Pension Cash Contributions & OPEB Payments $255M - $285M $330M - $370M • Separation does not trigger incremental pension cash contributions Pension / OPEB - related Expense ~$75M Total (~$55M Non - Service) ~$100M Total (~$75M Non - Service) Post - Tax Unfunded Pension / OPEB - related Liability ~$1,060M Pension Liability ~$450M OPEB Liability • As of 12/31/2019 • Applied U.S. federal corporate tax rate of 21% to figures Environmental Spend $55M - $65M $75M - $85M Tax Rate Operational tax %= 23.0% - 25.0% Cash tax %= ~10.0% • Excludes the impact of potential transactions Depreciation & Amortization $175M - $205M $235M - $275M Diluted Share Count ~110M 2020 Guidance Assumptions 28 1) LIFO sensitivity includes impact from elements other than aluminum prices such as other raw materials, labor, and energy and is only applicable to inventories at facilities with LIFO elections.

29 Capital Allocation and 2020 Guidance Manage and reduce legacy liabilities Capex <3% of revenue Maintain strong balance sheet Targeting dividend payment of up to $50M - $100M per year 1) Assumes ~110M diluted shares. 2) Defined as Adj. Free Cash Flow ( ÷ ) Net Income excluding special items. 2020 Guidance Revenue EPS ex. Special Items 1 Adj. Free Cash Flow $5.2B – $5.4B $2.17 – $2.49 $325M – $375M FY20 Adj. FCF conversion ~45% 2 2Q – 4Q 2020 $6.9B – $7.1B $2.72 – $3.12 $125M – $175M Organic Revenue Growth: 0% – 2% Full Year 2020

30 Tim Myers , Chief Executive Officer – Designate More than 32 years of industry experience with nearly 30 years at Arconic Inc. and its predecessors From 2017 and until separation, Group President of Global Rolled Products From 2016 – June 2019, Group President of Transportation Products and Construction Solutions Joined the company in 1991 Erick Asmussen , Chief Financial Officer – Designate Most recently served as Chief Financial Officer of Momentive Performance Materials since 2015 Previously served as Chief Financial Officer of Graftech from 2013 to 2015; joined Graftech in 1999 and has served in multipl e r oles, notably Vice President of Strategy, Planning and Corporate Development from 2005 to 2013 Prior to Graftech, worked in various positions with Corning, AT&T and Arthur Anderson Diana Toman , Chief Legal Officer – Designate Most recently served as Senior Vice President, General Counsel and Secretary for Compass Minerals from 2015 to 2019 Previously served as Vice President of Strategy and General Counsel for APAC and Africa at General Cable; joined General Cabl e i n 2006 Prior to joining General Cable, worked in counsel and attorney roles at Waddell & Reed Financial and Levy Craig Melissa Miller , Chief Human Resources Officer – Designate Previously served as Vice President of Human Resources (GRP and TCS) for Arconic Inc. since 2017 Before Alcoa separation, served as Global Director of Human Resources from 2011 to 2016; joined Alcoa in 2005 Prior to joining Alcoa, served in a Human Resources role for Marconi from 1999 to 2005 Mark Vrablec , Senior Vice President and Chief Commercial Officer – Designate Most recently served as Vice President Global Commercial Business Development of Global Rolled Products business segment Previously served as President of Arconic Inc.’s Aerospace, Transportation & Industrial Rolled Products business, since 2011 aft er serving in several leadership roles throughout the organization Joined the company as a metallurgist in 1982 Arconic Corp. Management Team

31 Diana Perreiah , President – Designate, Building and Construction Systems Held this role at Arconic Inc. since 2015 Joined Arconic Inc.’s Building & Construction Systems business in 2009 as Vice President of Business Operations for Kawneer N ort h America Has served at Arconic Inc. for nearly 30 years Kip Wyman, Senior Vice President – Designate, Manufacturing and Supply Chain Excellence Joined Arconic Inc. in June of 2018 as Vice President of Global Operations for Global Rolled Products Previously served as Vice President and General Manager for several Pratt & Whitney business segments Began his career at General Motors in 1985, receiving his BS in Manufacturing Systems from General Motors Institute Nandu Srinivasan , President – Designate, Rolling Most recently served as Director of Manufacturing for Arconic Inc.’s Davenport, Danville, Hutchinson and San Antonio facilities since 2016 Previously served as Director of Operational Excellence for Global Rolled Products at Alcoa; joined Alcoa in 2005 Prior to joining Alcoa, worked as Operations Manager for Caterpillar from 1995 to 2002 Rob Woodall , President – Designate, Global Rolled Products Europe and Asia Most recently served as Director of Global Plant Operations for Global Rolled Products since January of 2018 In 2012, Rob became Manufacturing Director for Arconic Davenport Works and Satellites after serving in several leadership rol es in other plant locations Joined Arconic Inc. over 30 years ago as a mechanical engineer Jack Hall , Vice President and General Manager – Designate, Extrusions Joined Arconic Inc. as Vice President and General Manager of Extrusions in 2019 Previously served as Vice President and General Manager of Ride Performance for Tenneco from 2015 to 2019 Served as Vice President Product Line Lead Acid Batteries for Johnson Controls from 2014 to 2015; joined Johnson Controls in 2004 Arconic Corp. Management Team (continued)

32 Key Investment Highlights Leading global provider of aluminum rolled products and building solutions with unique scale (FY2019) Market leading positions in attractive end markets poised for growth 3 Strong financial profile with a focus on productivity and disciplined capital allocation 30% Industrial, Packaging & Other 18% Building and Construction 34% Ground Transportation 18% Aerospace Market position in North America Automotive & Transportation #2 Market position in North America 2 Building & Construction #2 Global market position 1 Industrial, Packaging & Other #2 Global market position #1 Aerospace Up to $50M - $100M Target annual dividend payout Unique asset base and capabilities with investment cycle largely complete x World’s largest thick plate stretcher x World’s largest aluminum - lithium plant x World’s only supplier able to produce single - piece aluminum - lithium wing skins Diversified business mix focused on value - added products and complex building solutions x Extrusions x Autobody sheet x Building & construction products x Aerospace plate 1) Based on global brazing, North American Industrial and European packaging markets. 2) Across Kawneer and Reynobond product lines. 3) The financial information presented is of Arconic Inc.’s GRP segment as a reportable segment of Arconic Inc. and was prepared on a different basis than, and may not be directly comparable to, the financial information of Arconic Corp. as it is depicted elsewhere in this presentation. You should not place undue reliance on this financial information of Arconic Inc. See “Arconic Inc.’s Global Rolled Products Segment Information” under “Important Information” on slide 3 for additional information. <3% Target capex % of revenue ~$2.72 - $3.12 2020 EPS guidance

33 Questions & Answers Unique opportunity within the midstream aluminum / specialty metals and materials markets Unique Scale Attractive End Market Exposure Diversified Mix with Focus on Value - Added Products One of the largest public midstream aluminum producers across key financial metrics Automotive & Aerospace exposure 1.5x that of the nearest competitors Producer of widest, thickest, and longest plate products #1 in global aero, #2 in North America auto & North America building systems / architectural applications Partner of choice for blue - chip customers across key platforms Megatrends to drive sustained industry growth Unique asset base / capabilities with investment cycle largely complete ~50% of revenue tied to Long - Term Agreements (“LTA”) Leader in innovation in aerospace plate, auto body sheet and large - scale building systems A R C O N I C

34 Appendix

35 Rolled Products Overview and Products ▪ Supplies aluminum sheet and plate to costumers across ground transportation, aerospace, industrial and packaging markets ▪ Leading position in the growing North American automotive aluminum sheet market, and are a leading supplier of aluminum sheet and plate to the aerospace market ▪ Only supplier able to produce single - piece aluminum - lithium wing skins and a holder of vast number of patents and innovations ▪ Newly launched high formable 6000 product to accelerate steel to aluminum product transitions and capture new business from competitors Representative Customers, Platforms and Competitors 77% of 2019 revenue 1) Includes intersegment sales. Adjusted for divestitures. 2) Segment Adj. Revenue is a non - GAAP measure. See page 45 for definition and reconciliation to the nearest GAAP measure. 3) Segment PF Adj. EBITDA and Segment PF Adj. EBITDA margin are non - GAAP measures. See page 46 for definitions and reconciliation t o the nearest GAAP measure. Select Customers Select Competitors Select Platforms F150 F250 F350 A320 B737 Historical Revenue and EBITDA Margin Profile $5,552 $5,533 11% 12% 2018A LTM 9/30/19 Adj. Revenue 1,2 PF Adj. EBITDA Margin % 1,3 Sales Breakdown LTM 09/30/2019 Automotive & transportation 44% Aerospace 18% Industrial, Packaging & Other 35% Building and construction 3% ($M)

36 Aluminum Extrusions Overview and Products Representative Customers, Platforms and Competitors ▪ Arconic Aluminum Extrusions (AEX) produces a variety of metallic profiles for multiple applications in aerospace and automotive ▪ AEX is focused on hard alloy extrusions ▪ Products include: • Structural components for commercial airplanes such as wing stringers, fuselage stringers and seat tracks • Automotive components such as drive shafts • Industrial components such as rod and bar ▪ Significant application overlap between extrusions and rolled products ▪ Advanced alloy and process development ▪ Residual stress and process modeling A320 B737 Select Customers Select Competitors Select Platforms Historical Revenue and EBITDA Margin Profile Sales Breakdown LTM 09/30/2019 $493 $506 5% 2018A LTM 9/30/19 Adj. Revenue 1,2 PF Adj. EBITDA Margin % 1,3 N.M. Automotive & transportation 21% Aerospace 54% Industrial, Packaging & Other 25% ($M) 1) Includes intersegment sales. Adjusted for divestitures. 2) Segment Adj. Revenue is a non - GAAP measure. See page 45 for definition and reconciliation to the nearest GAAP measure. 3) Segment PF Adj. EBITDA and Segment PF Adj. EBITDA margin are non - GAAP measures. See page 46 for definitions and reconciliation t o the nearest GAAP measure. 7% of 2019 revenue

37 Building and Construction Systems Overview and Products Representative Customers and Competitors Select Customers Select Competitors ▪ BCS is a leader in products and solutions for a wide variety of primarily non - residential buildings in North America and Europe • Architectural Systems (Kawneer) produces architectural framing systems, such as curtain walls, doors and window framing, • Architectural Products (Reynobond and Reynolux) provides aluminum composite cladding and aluminum coil coated sheet for exterior and interior applications Historical Revenue and EBITDA Margin Profile Sales Breakdown LTM 09/30/2019 $1,140 $1,129 10% 11% 2018A LTM 9/30/19 Adj. Revenue 1,2 PF Adj. EBITDA Margin % 1,3 Building and construction 100% ($M) 1) Includes intersegment sales. Adjusted for divestitures. 2) Segment Adj. Revenue is a non - GAAP measure. See page 45 for definition and reconciliation to the nearest GAAP measure. 3) Segment PF Adj. EBITDA and Segment PF Adj. EBITDA margin are non - GAAP measures. See page 46 for definitions and reconciliation t o the nearest GAAP measure. 16% of 2019 revenue

38 Contingent Liabilities Overview ▪ Grenfell: Associated with Arconic Inc.’s indirect French subsidiary (AAP SAS) within the Building and Construction Systems business (“BCS”); BCS will be part of Arconic Corp. post - separation • Liabilities associated with businesses responsibility of Arconic Corp. as part of the separation • Howmet Aerospace maintains insurance coverage that extends to Arconic Corp. ▪ Environmental : Grasse River and other environmental liabilities travel with Arconic Corp. • Grasse River remediation already underway and progressing according to plan • Financial profile able to withstand expected cash requirements ▪ Pension and OPEB • Accrued pension and other post - retirement benefits (OPEB) of $1.7B as of 9/30/2019 1 1) See Form 10 p.69. Includes $1.6B long - term and 0.1B of current pension and OPEB obligations.

39 Arconic Inc.’s Global Rolled Products Segment reconciliation ($ in millions) 1Q18 2Q18 3Q18 4Q18 2018 1Q19 2Q19 3Q19 4Q19 2019 Arconic Inc. Global Rolled Products Segment Third - party sales $1,754 $1,875 $1,839 $1,755 $7,223 $1,784 $1,868 $1,763 $1,667 $7,082 Intersegment sales $57 $60 $44 $44 $205 $52 $49 $41 $41 $183 Segment operating profit (1) $140 $141 $107 $93 $481 $135 $179 $161 $150 $625 Segment operating profit margin 8.0% 7.5% 5.8% 5.3% 6.7% 7.6% 9.6% 9.1% 9.0% 8.8% Provision for depreciation and amortization $61 $63 $61 $68 $253 $59 $59 $57 $58 $233 Capital expenditures $43 $68 $77 $120 $308 $39 $37 $35 $78 $189 Arconic Inc.’s Global Rolled Products Segment Information Our audited combined financial statements as of and for the year ended December 31, 2019 are not yet complete and are not ava ila ble as of the date of this presentation. On January 27, 2020, Arconic Inc. reported unaudited financial results for the year ended December 31, 2019 for its Global Rolled Products (“GRP”) segment. Our hi storical combined financial information was prepared from Arconic Inc.’s historical accounting records, including the underlying financial data derived from the operations that comprise Arconic Inc. ’s GRP segment. Certain financial information of Arconic Inc.’s GRP segment included in this presentation is the information of Arconic Inc.’s GRP segment as a reportable segment of Arconic Inc. This financial inf ormation was prepared on a different basis than, and may not be directly comparable to, the financial information of Arconic Corp. as it is depicted elsewhere in this presentation. Our final audited co mbined financial statements as of and for the year ended December 31, 2019 may differ from Arconic Inc.’s GRP segment’s unaudited financial results included in this presentation, and the unaudited financi al results for Arconic Inc.’s GRP segment for the year ended December 31, 2019 are not necessarily indicative of our future results for any subsequent periods. You should not place undue reliance on these una udi ted financial results. Arconic Inc.’s unaudited financial results included in this presentation should be read in conjunction with the Form 10 registration statement (“Form 10”) of Arconic Rolled Products Cor por ation (to be renamed “Arconic Corporation” upon the separation), which was declared effective by the U.S. Securities and Exchange Commission on February 13, 2020. Segment performance under Arconic Inc.’s management reporting system is evaluated based on a number of factors; however, the pri mary measure of performance is Segment operating profit. Arconic Inc.’s definition of Segment operating profit is Operating income excluding Special items. Special items include Restructuring and o the r charges. Segment operating profit includes the impact of LIFO inventory accounting, metal price lag, intersegment profit eliminations, and derivative activities. 1) For 2018, Segment operating profit for Arconic Inc.’s Global Rolled Product segment included the impact of a $23 charge relat ed to a physical inventory adjustment at one plant.

40 Reconciliation of Arconic Inc. Global Rolled Products Segment Organic Revenue ($ in millions) Year ended December 31, 2018 2019 Arconic Inc. Global Rolled Products Segment Third - Party Sales $7,223 $7,082 Less: Sales – Tennessee packaging 144 — Aluminum price impact n/a (351) Foreign currency impact n/a (77) Arconic Inc.’s Global Rolled Products Segment Organic revenue $7,079 $7,510 Arconic Inc.’s Global Rolled Products Segment Information Our audited combined financial statements as of and for the year ended December 31, 2019 are not yet complete and are not ava ila ble as of the date of this presentation. On January 27, 2020, Arconic Inc. reported unaudited financial results for the year ended December 31, 2019 for its Global Rolled Products (“GRP”) segment. Our hi storical combined financial information was prepared from Arconic Inc.’s historical accounting records, including the underlying financial data derived from the operations that comprise Arconic Inc. ’s GRP segment. Certain financial information of Arconic Inc.’s GRP segment included in this presentation is the information of Arconic Inc.’s GRP segment as a reportable segment of Arconic Inc.. This fin ancial information was prepared on a different basis than, and may not be directly comparable to, the financial information of Arconic Corp. as it is depicted elsewhere in this presentation. Our final audited co mbined financial statements as of and for the year ended December 31, 2019 may differ from Arconic Inc.’s GRP segment’s unaudited financial results included in this presentation, and the unaudited financi al results for Arconic Inc.’s GRP segment for the year ended December 31, 2019 are not necessarily indicative of our future results for any subsequent periods. You should not place undue reliance on these una udi ted financial results. Arconic Inc.’s unaudited financial results included in this presentation should be read in conjunction with the Form 10 registration statement (“Form 10”) of Arconic Rolled Products Cor por ation (to be renamed “Arconic Corporation” upon the separation), which was declared effective by the U.S. Securities and Exchange Commission on February 13, 2020. Arconic Inc.’s Global Rolled Products Segment Organic revenue is a non - GAAP financial measure. Management believes this measure is meaningful to investors as it presents revenue on a comparable basis for all periods presented due to the impact of the ramp - down of Arconic Inc.’s North American packaging business at its Tennesse e operations (completed in December 2018), and the impact of changes in aluminum prices and foreign currency fluctuations relative to the prior year periods.

Arconic Corp. Adj. Revenue Reconciliation Adjusted revenue is a non - GAAP financial measure. Arconic Corp. management believes this non - GAAP financial measure is meaningfu l and useful to investors because this measure presents revenue on a comparable basis for all periods presented due to the impact of divestitures. Adjustments for divestitures remove the impact related to previo usl y divested businesses and planned divestitures. Specifically, divestitures pertain to the Fusina (Italy) rolling mill (divested in March 2017), the Latin America extrusions business (divested in April 2018), the Itapissuma (B razil) rolling mill (reached agreement to sell in August 2019), and the hard alloy extrusions plant in South Korea (reached agreement to sell in October 2019). The presentation of non - GAAP financial measures is not intended to be a substitute for, and should not be considered in isolation from, the financial measures reported in accordance with GAAP. Accordingly, Arconic Corp. encourages consideration of non - GAAP measures as a supplement to th e respective GAAP measures. The non - GAAP measures presented may not be comparable to similarly titled measures of other companies. Note: This presentation includes certain financial data for the last twelve months ended September 30, 2019. Such data has be en calculated by adding (a) operating results for the fiscal year ended December 31, 2018, less operating results for the nine months ended September 30, 2018 and (b) operating results for the nine mo nths ended September 30, 2019. See Form 10 dated 2/7/2020, p.63. Adj. Revenue LTM For the nine months ended For the year ended September 30, 2019 September 30, 2019 September 30, 2018 December 31, 2018 Revenue $7,378 $5,569 $5,633 $7,442 Divestitures (210) (154) (201) (257) Revenue - as adjusted (“Adj. Revenue”) $7,168 $5,415 $5,432 $7,185 ($ in millions) 41

Arconic Corp. Adj. EBITDA Reconciliation Adjusted EBITDA and Adjusted EBIT are non - GAAP financial measures. Arconic Corp. management believes these non - GAAP financial m easures are meaningful and useful to investors because these measure provide additional information with respect to Arconic Corp.’s historical operating performance and Arconic Corp.’s ability to meet its current and future financ ial obligations. Special items include restructuring and other charges, discrete income tax items, and other items as deemed appropriate by management. There can be no assurances that additional special items will not occur in future periods. A djustments for divestitures remove the impact related to previously divested businesses and planned divestitures. Specifically, divestitures pertain to the Fusina (Italy) rolling mill (divested in March 2017), the Latin America extrusions business (divested in April 2018), the Itapissuma (Brazil) rolling mill (reached agreement to sell in August 2019), and the hard alloy extrusions plant in South Korea (reached agreement to sell in October 2019). Adjustments for pension/OPEB re flect the pro forma impact related to benefit expenses associated with certain U.S. defined benefit pension and other postretirement plan obligations expected to be transferred to Arconic Corp. in connection with the separation. Accordin gly , certain of the expenses related to these plans previously recognized by Arconic Corp. in its historical combined financial statements would have been recorded in nonoperating income instead of operating income (see note (a) in “Unaudited Pro Forma Condensed Combined Financial Information — Notes to Unaudited Pro Forma Condensed Combined Financial Statements”) on page 70 of the Form 10 dated 2/7/2020. The presentation of non - GAAP financial measures is not intended to be a substitute for, and should not be considered in isolatio n from, the financial measures reported in accordance with GAAP. Accordingly, Arconic Corp. encourages consideration of non - GAAP measures as a supplement to the respective GAAP measures. The non - GAAP measures presented may not be c omparable to similarly titled measures of other companies. Arconic Corp.’s definition of Adjusted EBITDA (Earnings before interest, taxes, depreciation, and amortization) is net margin plus an add - back for depreciation and amo rtization. Net margin is equivalent to Sales minus the following items: Cost of goods sold; Selling, general administrative, and other expenses; Research and development expenses; and Provision for depreciation and amortization. Arcon ic Corp.’s definition of Adjusted EBIT (Earnings before interest and taxes) is equivalent to Net margin. See Form 10 dated 2/7/2020, p.63. Note: This presentation includes certain financial data for the last twelve months ended September 30, 2019. Such data has be en calculated by adding (a) operating results for the fiscal year ended December 31, 2018, less operating results for the nine months ended September 30, 2018 and (b) operating results for the nine months ended September 30, 2019. Note: Adj. EBITDA margins calculated as (a) Further Adj. EBITDA divided by (b) Adj. Revenue. 42 Adj. EBITDA LTM For the nine months ended For the year ended September 30, 2019 September 30, 2019 September 30, 2018 December 31, 2018 Net income attributable to Arconic Rolled Products Corporation $138 $39 $71 $170 Net income attributable to noncontrolling interests – – – – Provision for income taxes 93 55 33 71 Other (income) expenses, net (9) (4) 9 4 Interest expense 116 86 99 129 Restructuring and other charges – 104 – (104) Provision for depreciation and amortization 264 190 198 272 Adjusted EBITDA $602 $470 $410 $542 Adjustments: Other special items 69 63 7 13 Divestitures (6) (6) (8) (8) Pension/OPEB 90 68 63 85 Further Adjusted EBITDA $755 $595 $472 $632 ($ in millions)

Arconic Corp. Adj. EBIT Reconciliation Adjusted EBITDA and Adjusted EBIT are non - GAAP financial measures. Arconic Corp. management believes these non - GAAP financial m easures are meaningful and useful to investors because these measure provide additional information with respect to Arconic Corp.’s historical operating performance and Arconic Corp.’s ability to meet its current and future financ ial obligations. Special items include restructuring and other charges, discrete income tax items, and other items as deemed appropriate by management. There can be no assurances that additional special items will not occur in future periods. Adjustme nts for divestitures remove the impact related to previously divested businesses and planned divestitures. Specifically, divestitures pertain to the Fusina (Italy) rolling mill (divested in March 2017), the Latin America extrusions business (diveste d in April 2018), the Itapissuma (Brazil) rolling mill (reached agreement to sell in August 2019), and the hard alloy extrusions plant in South Korea (reached agreement to sell in October 2019). Adjustments for pension/OPEB reflect the pro forma impact rel ated to benefit expenses associated with certain U.S. defined benefit pension and other postretirement plan obligations expected to be transferred to Arconic Corp. in connection with the separation. Accordingly, certain of the expenses related t o t hese plans previously recognized by Arconic Corp. in its historical combined financial statements would have been recorded in nonoperating income instead of operating income (see note (a) in “Unaudited Pro Forma Condensed Combined Financial I nformation — Notes to Unaudited Pro Forma Condensed Combined Financial Statements”) on page 70 of the Form 10 dated 2/7/2020. The presentation of non - GAAP financial measures is not intended to be a substitute for, and should not be considered in isolati on from, the financial measures reported in accordance with GAAP. Accordingly, Arconic Corp. encourages consideration of non - GAAP measures as a supplement to the respective GAAP measures. The non - GAAP measures presented may not be comparable to s imilarly titled measures of other companies. Arconic Corp.’s definition of Adjusted EBITDA (Earnings before interest, taxes, depreciation, and amortization) is net margin plus an add - back for depreciation and amortization. Net margin is equivalent to Sales minus the following items: Cost of goods sold; Selling, general administrative, and other expenses; Research and development expenses; and Provision for depreciation and amortization. Arconic Corp.’s definition of Adjusted EB IT (Earnings before interest and taxes) is equivalent to Net margin. See Form 10 dated 2/7/2020, p.64. Note: This presentation includes certain financial data for the last twelve months ended September 30, 2019. Such data has be en calculated by adding (a) operating results for the fiscal year ended December 31, 2018, less operating results for the nine months ended September 30, 2018 and (b) operating results for the nine months ended September 30, 2019. Adj. EBIT LTM For the nine months ended For the year ended September 30, 2019 September 30, 2019 September 30, 2018 December 31, 2018 Net income attributable to Arconic Rolled Products Corporation $138 $39 $71 $170 Net income attributable to noncontrolling interests – – – – Provision for income taxes 93 55 33 71 Other (income) expenses, net (9) (4) 9 4 Interest expense 116 86 99 129 Restructuring and other charges – 104 – (104) Adjusted EBIT $338 $280 $212 $270 Adjustments: Other special items 69 63 7 13 Divestitures (4) (4) (5) (5) Pension/OPEB 90 68 63 85 Further Adjusted EBIT $493 $407 $277 $363 ($ in millions) 43

Arconic Corp. Capital Expenditures - as Adjusted Reconciliation Adjusted capital expenditures is a non - GAAP financial measure. Arconic Corp. management believes this non - GAAP financial measure is meaningful and useful to investors because this measure presents capital expenditures on a comparable basis for all periods presented due to the impact of divestitures. Adjustments for divestitures remove the impact related to pre viously divested businesses and planned divestitures. Specifically, divestitures pertain to the Fusina (Italy) rolling mill (divested in March 2017), the Latin America extrusions business (divested in April 2018), the Itapissuma (Brazil) rolling mill ( reached agreement to sell in August 2019), and the hard alloy extrusions plant in South Korea (reached agreement to sell in October 2019). The presentation of non - GAAP financial measures is not intended to be a substitute for, and should not b e considered in isolation from, the financial measures reported in accordance with GAAP. Accordingly, Arconic Corp. encourages consideration of non - GAAP measures as a supplement to the respective GAAP measures. The non - GAAP measures prese nted may not be comparable to similarly titled measures of other companies. See Form 10 dated 2/7/2020, p.64. Note: This presentation includes certain financial data for the last twelve months ended September 30, 2019. Such data has be en calculated by adding (a) operating results for the fiscal year ended December 31, 2018, less operating results for the nine months ended September 30, 2018 and (b) operating results for the nine months ended September 30, 2019. Capital Expenditures LTM For the nine months ended For the year ended September 30, 2019 September 30, 2019 September 30, 2018 December 31, 2018 Capital Expenditures $242 $120 $195 $317 Divestitures (4) (2) (2) (4) Capital Expenditures - as adjusted $238 $118 $193 $313 ($ in millions) 44

Segment Adj. Revenue Reconciliation Global Rolled Products Adj. Revenue LTM For the nine months ended For the year ended September 30, 2019 September 30, 2019 September 30, 2018 December 31, 2018 Revenue $5,692 $4,294 $4,333 $5,731 Divestitures (159) (115) (135) (179) Revenue - as adjusted (“Adj. Revenue”) $5,533 $4,179 $4,198 $5,552 Aluminum Extrusions Adj. Revenue LTM For the nine months ended For the year ended September 30, 2019 September 30, 2019 September 30, 2018 December 31, 2018 Revenue $557 $420 $409 $546 Divestitures (51) (39) (41) (53) Revenue - as adjusted (“Adj. Revenue”) $506 $381 $368 $493 Building & Construction Systems Adj. Revenue LTM For the nine months ended For the year ended September 30, 2019 September 30, 2019 September 30, 2018 December 31, 2018 Revenue $1,129 $855 $866 $1,140 Divestitures – – – – Revenue - as adjusted (“Adj. Revenue”) $1,129 $855 $866 $1,140 ($ in millions) ($ in millions) ($ in millions) 45 Adjusted revenue is a non - GAAP financial measure. Arconic Corp. management believes this non - GAAP financial measure is meaningf ul and useful to investors because this measure provides additional information with respect to Arconic Corp.’s historical operating performance and Arconic Corp.’s ability to meet its current and future financial obligations. Adjustments for divestitures remove the impact related to previously divested businesses and planned divestitures. Specifically, divestitures pertain to the Fusina ( Ita ly) rolling mill (divested in March 2017), the Latin America extrusions business (divested in April 2018), the Itapissuma (Brazil) rolling mill (reached agreement to sell in August 2019), and the hard alloy ex trusions plant in South Korea (reached agreement to sell in October 2019). The presentation of non - GAAP financial measures is not intended to be a substitute for, and should not be consid ered in isolation from, the financial measures reported in accordance with GAAP. Accordingly, Arconic Corp. encourages consideration of non - GAAP measures as a supplement to the respective GAAP measu res. The non - GAAP measures presented may not be comparable to similarly titled measures of other companies. Note: This presentation includes certain financial data for the last twelve months ended September 30, 2019. Such data has be en calculated by adding (a) operating results for the fiscal year ended December 31, 2018, less operating results for the nine months ended September 30, 2018 and (b) operating re sul ts for the nine months ended September 30, 2019. See Form 10 dated 2/7/2020, p.62.

Segment Adj. EBITDA Reconciliation Global Rolled Products Adj. EBITDA LTM For the nine months ended For the year ended September 30, September 30, September 30, December 31, 2019 2019 2018 2018 Segment Operating Profit $406 $346 $268 $328 Provision for depreciation and amortization 197 139 154 212 Adjusted EBITDA $603 $485 $422 $540 Adjustments: Divestitures 2 - (3) (1) Pension / OPEB 46 35 34 45 Further Adjusted EBITDA $651 $520 $453 $584 Aluminum Extrusions Adj. EBITDA LTM For the nine months ended For the year ended September 30, September 30, September 30, December 31, 2019 2019 2018 2018 Segment Operating Profit ($30) ($29) $2 $1 Provision for depreciation and amortization 28 22 17 23 Adjusted EBITDA ($2) ($7) $19 $24 Adjustments: Divestitures (11) (8) (7) (10) Pension / OPEB 13 9 8 12 Further Adjusted EBITDA $ - ($6) $20 $26 Building & Construction Systems Adj. EBITDA LTM For the nine months ended For the year ended September 30, September 30, September 30, December 31, 2019 2019 2018 2018 Segment Operating Profit $106 $89 $74 $91 Provision for depreciation and amortization 18 14 14 18 Adjusted EBITDA $124 $103 $88 $109 Adjustments: Pension / OPEB 2 2 2 2 Further Adjusted EBITDA $126 $105 $90 $111 ($ in millions) ($ in millions) ($ in millions) 46 Adjusted EBITDA and Adjusted EBIT are non - GAAP financial measures. Arconic Corp. management believes these non - GAAP financial m easures are meaningful and useful to investors because these measure provide additional information with respect to Arconic C orp .’s historical operating performance and Arconic Corp.’s ability to meet its current and future financial obligations. Special items include restructuri ng and other charges, discrete income tax items, and other items as deemed appropriate by management. There can be no assurance s that additional special items will not occur in future periods. Adjustments for divestitures remove the impact related to previously divested businesses and planned divestitures. Specifically, divestitures pertain to the Fusina (Italy) rolling mill (divested in March 2017), the Latin America extrusions business (divested in April 2018), the Itapissuma (Brazil) rolling mill (reached agreement to sell in August 2019), and the hard alloy extrusions plan t in South Korea (reached agreement to sell in October 2019). Adjustments for pension/OPEB reflect the pro forma impact related to benefit expenses associated with certain U.S. defined benefit pension and other postretirement plan obligations expected to be transferred to Arconic Corp. in co nnection with the separation. Accordingly, certain of the expenses related to these plans previously recognized by Arconic Co rp. in its historical combined financial statements would have been recorded in nonoperating income instead of operating income (see note (a) in “Unaudited Pro Forma Con densed Combined Financial Information — Notes to Unaudited Pro Forma Condensed Combined Financial Statements”) on page 70 of the Form 10 dated 2/7/2020. The presentation of non - GAAP financial measures is not intended to be a substitute for, and should not be considered in isolatio n from, the financial measures reported in accordance with GAAP. Accordingly, Arconic Corp. encourages consideration of non - GAAP measures as a supplement to the respective GAAP measures. The non - GAAP measures presented may not be comparable to similarly titled measures of other com panies. Arconic Corp.’s definition of Adjusted EBITDA (Earnings before interest, taxes, depreciation, and amortization) is net margin plus an add - back for depreciation and amortization. Net margin is equivalent to Sales minus the following items: Cost of goods sold; Selling, gene ral administrative, and other expenses; Research and development expenses; and Provision for depreciation and amortization. Arcon ic Corp.’s definition of Adjusted EBIT (Earnings before interest and taxes) is equivalent to Net margin. See Form 10 dated 2/7/2020, p.64 - 65. Note: This presentation includes certain financial data for the last twelve months ended September 30, 2019. Such data has be en calculated by adding (a) operating results for the fiscal year ended December 31, 2018, less operating results for the nine m ont hs ended September 30, 2018 and (b) operating results for the nine months ended September 30, 2019. Note: Adj. EBITDA margins calculated as (a) Further Adj. EBITDA divided by (b) Adj. Revenue.
