Attached files
| file | filename |
|---|---|
| EX-32.2 - EX-32.2 - Tradeweb Markets Inc. | tw-20191231ex322c1809a.htm |
| EX-32.1 - EX-32.1 - Tradeweb Markets Inc. | tw-20191231ex32139bd77.htm |
| EX-31.2 - EX-31.2 - Tradeweb Markets Inc. | tw-20191231ex312b504ba.htm |
| EX-31.1 - EX-31.1 - Tradeweb Markets Inc. | tw-20191231ex311027300.htm |
| EX-23.2 - EX-23.2 - Tradeweb Markets Inc. | tw-20191231ex232d50b37.htm |
| EX-23.1 - EX-23.1 - Tradeweb Markets Inc. | tw-20191231ex231989b3e.htm |
| EX-21.1 - EX-21.1 - Tradeweb Markets Inc. | tw-20191231ex21104a517.htm |
| EX-4.2 - EX-4.2 - Tradeweb Markets Inc. | tw-20191231ex42489a05e.htm |
UNITED STATES
SECURITIES AND EXCHANGE COMMISSION
Washington, D.C. 20549
FORM 10-K
|
|
|
|
|
☒ ANNUAL REPORT PURSUANT TO SECTION 13 OR 15(d) OF THE SECURITIES EXCHANGE ACT OF 1934 |
For the fiscal year ended December 31, 2019
or
|
|
|
|
|
☐ TRANSITION REPORT PURSUANT TO SECTION 13 OR 15(d) OF THE SECURITIES EXCHANGE ACT OF 1934 |
Commission File Number: 001-38860
Tradeweb Markets Inc.
(Exact name of registrant as specified in its charter)
|
\Delaware |
|
83-2456358 |
|
(State of other jurisdiction of incorporation or organization) |
|
(I.R.S. Employer Identification No.) |
|
1177 Avenue of the Americas New York, New York |
|
10036 |
|
(Address of principal executive offices) |
|
(Zip Code) |
(646) 430-6000
(Registrant’s telephone number, including area code)
Securities registered pursuant to Section 12(b) of the Act:
|
Title of each class |
|
Trading Symbol(s) |
|
Name of each exchange on which registered |
|
Class A common stock, par value $0.00001 |
|
TW |
|
Nasdaq Global Select Market |
Indicate by check mark if the registrant is a well-known seasoned issuer, as defined in Rule 405 of the Securities Act. ☐ Yes ☒ No
Indicate by check mark if the registrant is not required to file reports pursuant to Section 13 or Section 15(d) of the Act. ☐ Yes ☒ No
Indicate by check mark whether the registrant (1) has filed all reports required to be filed by Section 13 or 15(d) of the Securities Exchange Act of 1934 during the preceding 12 months (or for such shorter period that the registrant was required to file such reports), and (2) has been subject to such filing requirements for the past 90 days. ☒ Yes ☐ No
Indicate by check mark whether the registrant has submitted electronically every Interactive Data File required to be submitted pursuant to Rule 405 of Regulation S-T (§232.405 of this chapter) during the preceding 12 months (or for such shorter period that the registrant was required to submit such files). ☒ Yes ☐ No
Indicate by check mark whether the registrant is a large accelerated filer, an accelerated filer, a non-accelerated filer, a smaller reporting company, or an emerging growth company. See the definitions of “large accelerated filer”, “accelerated filer”, “smaller reporting company” and “emerging growth company” in Rule 12b-2 of the Exchange Act.
|
Large accelerated filer |
☐ |
|
Accelerated filer |
☐ |
|
Non-accelerated filer |
☒ |
|
|
Smaller reporting company |
☐ |
|
Emerging growth company |
☒ |
|
|
|
|
If an emerging growth company, indicate by check mark if the registrant has elected not to use the extended transition period for complying with any new or revised financial accounting standards provided pursuant to Section 13(a) of the Exchange Act. ☒
Indicate by check mark whether the registrant is a shell company (as defined in Rule 12b-2 of the Exchange Act). ☐ Yes ☒ No
The aggregate market value of the voting and non-voting common equity held by non-affiliates of the registrant, based on the closing price of the Class A common stock on the NASDAQ Global Select Market on June 28, 2019, was approximately $4.5 billion
|
Class of Stock |
|
|
Shares Outstanding as of February 14, 2020 |
|
Class A Common Stock, par value $0.00001 per share |
|
|
70,212,713] |
|
Class B Common Stock, par value $0.00001 per share |
|
|
96,933,192 |
|
Class C Common Stock, par value $0.00001 per share |
|
|
7,389,983 |
|
Class D Common Stock, par value $0.00001 per share |
|
|
49,873,346 |
Documents Incorporated by Reference
Part III of this Annual Report on Form 10-K incorporates by reference portions of the Registrant’s Proxy Statement for its 2020 Annual Meeting of Stockholders. The Proxy Statement will be filed with the Securities and Exchange Commission within the 120 days of the registrant’s fiscal year ended December 31, 2019.
TRADEWEB MARKETS INC.
|
|
Page |
|
|
8 |
||
|
|
||
| 10 | ||
| 31 | ||
| 65 | ||
| 66 | ||
| 66 | ||
| 68 | ||
|
|
||
| 69 | ||
| 71 | ||
|
Management’s Discussion and Analysis of Financial Condition and Results of Operations |
76 | |
| 112 | ||
| 114 | ||
|
Changes in and Disagreements with Accountants on Accounting and Financial Disclosure |
155 | |
| 155 | ||
| 155 | ||
|
|
||
| 156 | ||
| 156 | ||
|
Securities Ownership of Certain Beneficial Owners and Management and Related Stockholder Matters |
156 | |
|
Certain Relationships and Related Transactions, and Director Independence |
156 | |
| 156 | ||
|
|
||
| 157 | ||
| 159 | ||
2
The financial statements and other disclosures contained in this Annual Report on Form 10-K include those of Tradeweb Markets Inc., which is the registrant, and those of its consolidating subsidiaries, including Tradeweb Markets LLC, which became the principal operating subsidiary of Tradeweb Markets Inc. on April 4, 2019 in a series of reorganization transactions (the “Reorganization Transactions”) that were completed in connection with Tradeweb Markets Inc.’s initial public offering (the “IPO”), which closed on April 8, 2019. For more information regarding the transactions described above, see Note 1—Organization to our audited consolidated financial statements included elsewhere in this Annual Report on Form 10-K.
The financial statements and other disclosures contained in this Annual Report on Form 10-K relate to periods that ended both prior to and after the completion of the Reorganization Transactions and the IPO. As a result of the Reorganization Transactions completed in connection with the IPO, Tradeweb Markets Inc. became a holding company whose only material assets consist of its equity interest in Tradeweb Markets LLC and related deferred tax assets. As the sole manager of Tradeweb Markets LLC, Tradeweb Markets Inc. operates and controls all of the business and affairs of Tradeweb Markets LLC and, through Tradeweb Markets LLC and its subsidiaries, conducts its business. As a result of this control, and because Tradeweb Markets Inc. has a substantial financial interest in Tradeweb Markets LLC, Tradeweb Markets Inc. consolidates the financial results of Tradeweb Markets LLC and its subsidiaries.
The audited consolidated financial statements and other financial disclosures included elsewhere in this Annual Report on Form 10-K relating to periods prior to and including March 31, 2019, which we sometimes refer to as the “pre-IPO period,” reflect the results of operations, financial position and cash flows of Tradeweb Markets LLC, the predecessor of Tradeweb Markets Inc. for financial reporting purposes, and its subsidiaries. The audited consolidated financial statements and other financial disclosures included elsewhere in this Annual Report on Form 10-K relating to periods beginning on April 1, 2019, and through and including December 31, 2019, which we sometimes refer to as the “post-IPO period,” reflect the results of operations, financial position and cash flows of Tradeweb Markets Inc. and its subsidiaries, including the consolidation of its investment in Tradeweb Markets LLC. As a result, for financial reporting purposes, the pre-IPO period excludes, and the post-IPO period includes, our financial results from April 1, 2019 through April 3, 2019, which are not material. The audited consolidated financial statements and other financial disclosures included elsewhere in this Annual Report on Form 10-K do not reflect what the results of operations, financial position or cash flows would have been had the Reorganization Transactions and the IPO taken place at the beginning of the periods presented.
As used in this Annual Report on Form 10-K, unless the context otherwise requires, references to:
|
" |
“We,” “us,” “our,” the “Company,” “Tradeweb” and similar references refer: (i) on or prior to the completion of the Reorganization Transactions, to Tradeweb Markets LLC, which we refer to as “TWM LLC,” and, unless otherwise stated or the context otherwise requires, all of its subsidiaries and any predecessor entities, and (ii) following the completion of the Reorganization Transactions, to Tradeweb Markets Inc., and, unless otherwise stated or the context otherwise requires, TWM LLC and all of its subsidiaries and any predecessor entities. |
|
" |
“Bank Stockholders” refer collectively to entities affiliated with the following clients: Barclays Capital Inc., BofA Securities, Inc. (a subsidiary of Bank of America Corporation), Citigroup Global Markets Inc., Credit Suisse Securities (USA) LLC, Deutsche Bank Securities Inc., Goldman Sachs & Co. LLC, J.P. Morgan Securities LLC, Morgan Stanley & Co. LLC, RBS Securities Inc., UBS Securities LLC and Wells Fargo Securities, LLC, which, prior to the completion of the IPO, collectively held a 46% ownership interest in Tradeweb. Following the IPO and the application of the net proceeds therefrom, entities affiliated with BofA Securities, Inc., RBS Securities Inc. and UBS Securities LLC no longer hold LLC Interests and, except as otherwise indicated, are not considered Bank Stockholders for post-IPO periods. |
|
" |
“Continuing LLC Owners” refer collectively to (i) those Original LLC Owners, including the Refinitiv LLC Owner (as defined below), certain of the Bank Stockholders and members of management, that continued to own LLC Interests after the completion of the IPO and Reorganization Transactions, that received shares of our Class C common stock, shares of our Class D common stock or a combination of both, as the case may be, in connection with the completion of the Reorganization Transactions, and that may redeem or exchange their LLC Interests for shares of our Class A common stock or Class B common stock and (ii) solely with respect to |
3
the Tax Receivable Agreement (as defined below), also includes those Original LLC Owners, including certain Bank Stockholders, that disposed of all of their LLC Interests for cash in connection with the IPO. |
|
" |
“Investor Group” refer to certain investment funds affiliated with The Blackstone Group Inc. (f/k/a The Blackstone Group L.P.), an affiliate of Canada Pension Plan Investment Board, an affiliate of GIC Special Investments Pte. Ltd. and certain co-investors, which collectively hold indirectly a 55% ownership interest in Refinitiv (as defined below). |
|
" |
“LLC Interests” refer to the single class of common membership interests of TWM LLC issued in connection with the Reorganization Transactions. |
|
" |
“LSEG Transaction” refer to the pending acquisition of the Refinitiv business by London Stock Exchange Group plc in an all share transaction for a total enterprise value of approximately $27 billion. |
|
" |
“Original LLC Owners” refer to the owners of TWM LLC prior to the Reorganization Transactions (including the Refinitiv Owners, the Bank Stockholders and members of management). |
|
" |
“Refinitiv” refer to Refinitiv Holdings Limited, and unless otherwise stated or the context otherwise requires, all of its subsidiaries, which owns substantially all of the former financial and risk business of Thomson Reuters (as defined below), including, prior to and following the completion of the Reorganization Transactions, an indirect majority ownership interest in Tradeweb, and is controlled by the Investor Group. |
|
" |
“Refinitiv Direct Owner” refer (i) prior to June 28, 2019, to a direct subsidiary of Refinitiv that owned interests in an entity that held membership interests of TWM LLC and received shares of our Class B common stock in exchange for the contribution of such entity to Tradeweb Markets Inc., which we refer to as the “Refinitiv Contribution,” in connection with the completion of the Reorganization Transactions and (ii) on and after June 28, 2019, to an indirect subsidiary of Refinitiv that owns shares of our Class B common stock, which shares were contributed by the direct subsidiary of Refinitiv referred to in the foregoing clause (i). |
|
" |
“Refinitiv LLC Owner” refer to an indirect subsidiary of Refinitiv that, prior to the Reorganization Transactions, owned membership interests of TWM LLC and that continues to own LLC Interests after the completion of the IPO and Reorganization Transactions, that received shares of our Class D common stock in connection with the completion of the Reorganization Transactions, and that may redeem or exchange its LLC Interests for shares of our Class A common stock or Class B common stock. |
|
" |
“Refinitiv Owners” refer collectively to the Refinitiv Direct Owner and the Refinitiv LLC Owner. |
|
" |
“Refinitiv Transaction” refer to the transaction pursuant to which Refinitiv indirectly acquired on October 1, 2018 substantially all of the financial and risk business of Thomson Reuters and Thomson Reuters indirectly acquired a 45% ownership interest in Refinitiv. |
|
" |
“Thomson Reuters” refer to Thomson Reuters Corporation, which indirectly holds a 45% ownership interest in Refinitiv. |
As a result of the Refinitiv Transaction, we revalued our assets and liabilities based on their fair values as of the closing date of the Refinitiv Transaction in accordance with the acquisition method of accounting. Certain financial information presented herein, including the allocation of the total purchase price of the Refinitiv Transaction attributable to the purchase of our assets and liabilities, are based on the fair values of our assets and our liabilities, as of the closing date of the Refinitiv Transaction. The values of our assets and liabilities were determined based on assumptions that reasonable market participants would use in the principal (or most advantageous) market for the asset or liability. In determining the fair value of the assets acquired and liabilities assumed, we considered the report of a third-party valuation expert. Our management is responsible for these internal and third-party valuations and appraisals.
4
Due to the change in the basis of accounting resulting from the application of pushdown accounting, we are required to present separately the financial information for the periods beginning on October 1, 2018, and through and including December 31, 2019, which we refer to as the “Successor period,” and the financial information for the periods prior to, and including, September 30, 2018, which we refer to as the “Predecessor period.”
The financial information presented in this Annual Report on Form 10-K and the audited consolidated financial statements included in this Annual Report on Form 10-K include a black line division to indicate that the Successor and Predecessor periods have applied different bases of accounting and are not comparable. Please note that our discussion of certain financial information, specifically revenues and certain expenses, represent the combined results of the Successor and Predecessor periods for the full year ended December 31, 2018. The change in basis resulting from the Refinitiv Transaction did not impact such financial information and, although this presentation of financial information on a combined basis does not comply with generally accepted accounting principles in the United States, or “GAAP,” we believe it provides a meaningful method of comparison to the other periods presented in this Annual Report on Form 10-K. The combined financial information is being presented for informational purposes only and (i) has not been prepared on a pro forma basis as if the Refinitiv Transaction occurred on the first day of the period, (ii) may not reflect the actual results we would have achieved absent the Refinitiv Transaction, (iii) may not be predictive of future results of operations and (iv) should not be viewed as a substitute for the financial results of the Successor and Predecessor periods presented in accordance with GAAP. See Part II, Item 7. – “Management’s Discussion and Analysis of Financial Condition and Results of Operations — Effect of Pushdown Accounting on our Financial Statements.”
References in this Annual Report on Form 10-K to (i) “2018 Successor Period” mean the period from October 1, 2018 to December 31, 2018, (ii) “2018 Predecessor Period” mean the period from January 1, 2018 to September 30, 2018, and (iii) “combined year ended December 31, 2018” or “2018 (Combined)” represent the sum of the results of the 2018 Successor Period and the 2018 Predecessor Period.
Numerical figures included in this Annual Report on Form 10-K have been subject to rounding adjustments. Accordingly, numerical figures shown as totals in various tables may not be arithmetic aggregations of the figures that precede them. In addition, we round certain percentages presented in this Annual Report on Form 10-K to the nearest whole number. As a result, figures expressed as percentages in the text may not total 100% or, when aggregated, may not be the arithmetic aggregation of the percentages that precede them.
MARKET AND INDUSTRY DATA
This Annual Report on Form 10-K includes estimates regarding market and industry data. Unless otherwise indicated, information concerning our industry and the markets in which we operate, including our general expectations, market position, market opportunity and market size, are based on our management’s knowledge and experience in the markets in which we operate, together with currently available information obtained from various sources, including publicly available information, industry reports and publications, surveys, our clients, trade and business organizations and other contacts in the markets in which we operate. Certain information is based on management estimates, which have been derived from third-party sources, as well as data from our internal research, and are based on certain assumptions that we believe to be reasonable. In particular, to calculate our market position, market opportunity and market size we derived the size of the applicable market from a combination of management estimates and public industry sources, including FINRA’s Trade Reporting and Compliance Engine (“TRACE”), the Securities Industry and Financial Markets Association (“SIFMA”), the International Swaps and Derivatives Association (“ISDA”), Clarus Financial Technology, Trax, the Chicago Board Options Exchange (“CBOE”) and the Federal Reserve Bank of New York. In calculating the size of certain markets, we omitted products for which there is no publicly available data, and, as a result, the actual markets for certain of our asset classes may be larger than those presented herein.
In presenting this information, we have made certain assumptions that we believe to be reasonable based on such data and other similar sources and on our knowledge of, and our experience to date in, the markets in which we operate. While we believe the estimated market and industry data included in this Annual Report on Form 10-K are generally reliable, such information, which is derived in part from management’s estimates and beliefs, is inherently uncertain and imprecise. Market and industry data are subject to change and may be limited by the availability of raw data, the
5
voluntary nature of the data gathering process and other limitations inherent in any statistical survey of such data. In addition, projections, assumptions and estimates of the future performance of the markets in which we operate and our future performance are necessarily subject to uncertainty and risk due to a variety of factors, including those described in “Cautionary Note Regarding Forward-Looking Statements” and Item 1A. – “Risk Factors.” These and other factors could cause results to differ materially from those expressed in the estimates made by third parties and by us. Accordingly, you are cautioned not to place undue reliance on such market and industry data or any other such estimates. We cannot guarantee the accuracy or completeness of this information, and we have not independently verified any third-party information and data from our internal research has not been verified by any independent source.
CERTAIN TRADEMARKS, TRADE NAMES AND SERVICE MARKS
This Annual Report on Form 10-K includes trademarks and service marks owned by us. This Annual Report on Form 10-K also contains trademarks, trade names and service marks of other companies, which are the property of their respective owners. Solely for convenience, trademarks, trade names and service marks referred to in this Annual Report on Form 10-K may appear without the ®, ™ or SM symbols, but such references are not intended to indicate, in any way, that we will not assert, to the fullest extent under applicable law, our rights to these trademarks, trade names and service marks. We do not intend our use or display of other parties’ trademarks, trade names or service marks to imply, and such use or display should not be construed to imply, a relationship with, or endorsement or sponsorship of us by, these other parties.
USE OF NON-GAAP FINANCIAL MEASURES
This Annual Report on Form 10-K contains “non-GAAP financial measures,” which are financial measures that are not calculated and presented in accordance with GAAP.
The Securities and Exchange Commission (“SEC”) has adopted rules to regulate the use in filings with the SEC and in other public disclosures of non-GAAP financial measures. These rules govern the manner in which non-GAAP financial measures are publicly presented and require, among other things:
|
" |
a presentation with equal or greater prominence of the most comparable financial measure or measures calculated and presented in accordance with GAAP; and |
|
" |
a statement disclosing the purposes for which the registrant’s management uses the non-GAAP financial measure. |
Specifically, we make use of the non-GAAP financial measures “Free Cash Flow,” “Adjusted EBITDA,” “Adjusted EBITDA margin,” “Adjusted EBIT,” “Adjusted EBIT margin,” “Adjusted Net Income” and “Adjusted Diluted EPS” in evaluating our past results and future prospects. For the definition of Free Cash Flow and a reconciliation to cash flow from operating activities, its most directly comparable financial measure presented in accordance with GAAP, see Part II, Item 7. – “Management’s Discussion and Analysis of Financial Condition and Results of Operations—Non-GAAP Financial Measures.” For the definitions of Adjusted EBITDA, Adjusted EBIT and Adjusted Net Income and reconciliations to net income and net income attributable to Tradeweb Markets Inc., as applicable, their most directly comparable financial measures presented in accordance with GAAP, see Part II, Item 7. – “Management’s Discussion and Analysis of Financial Condition and Results of Operations—Non-GAAP Financial Measures.” Adjusted EBITDA margin and Adjusted EBIT margin are defined as Adjusted EBITDA and Adjusted EBIT, respectively, divided by gross revenue for the applicable period. Adjusted Diluted EPS is defined as Adjusted Net Income divided by the diluted weighted average number of shares of Class A common stock and Class B common stock outstanding for the applicable period, assuming the full exchange of all outstanding LLC Interests held by non-controlling interests for shares of Class A common stock or Class B common stock, for post-IPO periods, and the diluted weighted average number of shares of TWM LLC outstanding for the applicable period, for pre-IPO periods.
We present Free Cash Flow because we believe it is a useful indicator of liquidity that provides information to management and investors about the amount of cash generated from our core operations after expenditures for capitalized software development costs and furniture, equipment and leasehold improvements.
6
We present Adjusted EBITDA, Adjusted EBITDA margin, Adjusted EBIT and Adjusted EBIT margin because we believe they assist investors and analysts in comparing our operating performance across reporting periods on a consistent basis by excluding items that we do not believe are indicative of our core operating performance. Management and our board of directors use Adjusted EBITDA, Adjusted EBITDA margin, Adjusted EBIT and Adjusted EBIT margin to assess our financial performance and believe they are helpful in highlighting trends in our core operating performance, while other measures can differ significantly depending on long-term strategic decisions regarding capital structure, the tax jurisdictions in which we operate and capital investments. Further, our executive incentive compensation is based in part on components of Adjusted EBITDA and Adjusted EBITDA margin.
We use Adjusted Net Income and Adjusted Diluted EPS as supplemental metrics to evaluate our business performance in a way that also considers our ability to generate profit without the impact of certain items. Each of the normal recurring adjustments and other adjustments described in the definition of Adjusted Net Income helps to provide management with a measure of our operating performance over time by removing items that are not related to day-to-day operations or are non-cash expenses.
Free Cash Flow, Adjusted EBITDA, Adjusted EBIT, Adjusted Net Income and Adjusted Diluted EPS have limitations as analytical tools, and you should not consider such measures either in isolation or as substitutes for analyzing our results as reported under GAAP. Some of these limitations include the following:
|
" |
Free Cash Flow, Adjusted EBITDA, Adjusted EBIT, Adjusted Net Income and Adjusted Diluted EPS do not reflect every expenditure, future requirements for capital expenditures or contractual commitments; |
|
" |
Adjusted EBITDA, Adjusted EBIT, Adjusted Net Income and Adjusted Diluted EPS do not reflect changes in our working capital needs; |
|
" |
Adjusted EBITDA and Adjusted EBIT do not reflect any interest expense, or the amounts necessary to service interest or principal payments on any debt obligations; |
|
" |
Adjusted EBITDA and Adjusted EBIT do not reflect income tax expense, which in post-IPO periods is a necessary element of our costs and ability to operate; |
|
" |
although depreciation and amortization are eliminated in the calculation of Adjusted EBITDA, and the depreciation and amortization related to certain acquisitions and the Refinitiv Transaction are eliminated in the calculation of Adjusted EBIT, the assets being depreciated and amortized will often have to be replaced in the future, and Adjusted EBITDA and Adjusted EBIT do not reflect any costs of such replacements; |
|
" |
in post-IPO periods, Adjusted EBITDA, Adjusted EBIT, Adjusted Net Income and Adjusted Diluted EPS do not reflect the noncash component of certain employee compensation expense or payroll taxes associated with certain option exercises; |
|
" |
Adjusted EBITDA, Adjusted EBIT, Adjusted Net Income and Adjusted Diluted EPS do not reflect the impact of earnings or charges resulting from matters we consider not to be indicative, on a recurring basis, of our ongoing operations; and |
|
" |
other companies in our industry may calculate Free Cash Flow, Adjusted EBITDA, Adjusted EBIT, Adjusted Net Income and Adjusted Diluted EPS or similarly titled measures differently than we do, limiting their usefulness as comparative measures. |
We compensate for these limitations by relying primarily on our GAAP results and using Free Cash Flow, Adjusted EBITDA, Adjusted EBIT, Adjusted Net Income and Adjusted Diluted EPS only as supplemental information.
7
CAUTIONARY NOTE REGARDING FORWARD-LOOKING STATEMENTS
This Annual Report on Form 10-K contains forward-looking statements within the meaning of Section 27A of the Securities Act of 1933, as amended (the “Securities Act”), and Section 21E of the Securities Exchange Act of 1934, as amended (the “Exchange Act”). You can generally identify forward-looking statements by our use of forward-looking terminology such as “anticipate,” “believe,” “continue,” “could,” “estimate,” “expect,” “intend,” “may,” “might,” “plan,” “potential,” “predict,” “projection,” “seek,” “should,” “will” or “would,” or the negative thereof or other variations thereon or comparable terminology. In particular, statements about the markets in which we operate, including our expectations about market trends, our market opportunity and the growth of our various markets, our expansion into new markets, any potential tax savings we may realize as a result of our organizational structure, our dividend policy and our expectations, beliefs, plans, strategies, objectives, prospects or assumptions regarding future events, including the pending LSEG Transaction, our performance or otherwise, contained in this Annual Report on Form 10-K under Part I, Item 1. – “Business,” Part I, Item 1A. – “Risk Factors” and Part II, Item 7. – “Management’s Discussion and Analysis of Financial Condition and Results of Operations” are forward-looking statements.
We have based these forward-looking statements on our current expectations, assumptions, estimates and projections. While we believe these expectations, assumptions, estimates and projections are reasonable, such forward-looking statements are only predictions and involve known and unknown risks and uncertainties, many of which are beyond our control. These and other important factors, including those discussed in this Annual Report on Form 10-K under Part I, Item 1. – “Business,” Part I, Item 1A. – “Risk Factors” and Part II, Item 7. – “Management’s Discussion and Analysis of Financial Condition and Results of Operations,” may cause our actual results, performance or achievements to differ materially from those expressed or implied by these forward-looking statements, or could affect our share price. Some of the factors that could cause actual results to differ materially from those expressed or implied by the forward-looking statements include:
|
" |
changes in economic, political, social and market conditions and the impact of these changes on trading volumes; |
|
" |
our failure to compete successfully; |
|
" |
our failure to adapt our business effectively to keep pace with industry changes; |
|
" |
consolidation and concentration in the financial services industry; |
|
" |
our dependence on dealer clients, including those that are also current or former stockholders; |
|
" |
our inability to maintain and grow the capacity of our trading platforms, systems and infrastructure; |
|
" |
design defects, errors, failures or delays with our platforms or solutions; |
|
" |
systems failures, interruptions, delays in services, cybersecurity incidents, catastrophic events and any resulting interruptions; |
|
" |
our dependence on third parties for certain market data and certain key functions; |
|
" |
our ability to implement our business strategies profitably; |
|
" |
our ability to successfully integrate any acquisition or to realize benefits from any strategic alliances, partnerships or joint ventures; |
|
" |
our ability to retain the services of certain members of our management; |
|
" |
inadequate protection of our intellectual property; |
8
|
" |
extensive regulation of our industry; |
|
" |
limitations on operating our business and incurring additional indebtedness as a result of covenant restrictions under our $500.0 million senior secured revolving credit facility (the “Revolving Credit Facility”) with Citibank, N.A., as administrative agent and collateral agent, and the other lenders party thereto, and certain Refinitiv indebtedness; |
|
" |
our dependence on distributions from TWM LLC to fund our expected dividend payments and to pay our taxes and expenses, including payments under the tax receivable agreement (the “Tax Receivable Agreement”) entered into in connection with the IPO; |
|
" |
our ability to realize any benefit from our organizational structure; |
|
" |
Refinitiv’s control of us and our status as a controlled company; and |
|
" |
other risks and uncertainties, including those listed under Part I, Item 1A. – “Risk Factors.” |
Given these risks and uncertainties, you are cautioned not to place undue reliance on such forward-looking statements. The forward-looking statements contained in this Annual Report on Form 10-K are not guarantees of future performance and our actual results of operations, financial condition or liquidity, and the development of the industry and markets in which we operate, may differ materially from the forward-looking statements contained in this Annual Report on Form 10-K. In addition, even if our results of operations, financial condition or liquidity, and events in the industry and markets in which we operate, are consistent with the forward-looking statements contained in this Annual Report on Form 10-K, they may not be predictive of results or developments in future periods.
Any forward-looking statement that we make in this Annual Report on Form 10-K speaks only as of the date of such statement. Except as required by law, we do not undertake any obligation to update or revise, or to publicly announce any update or revision to, any of the forward-looking statements, whether as a result of new information, future events or otherwise.
9
Overview
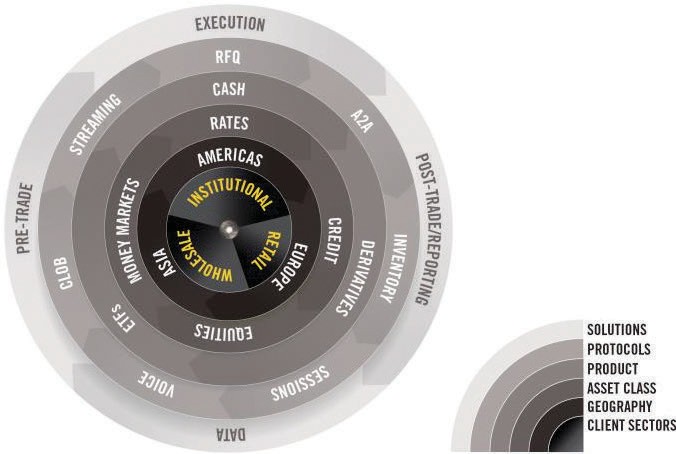
We are a leader in building and operating electronic marketplaces for our global network of clients across the financial ecosystem. Our network is comprised of clients across the institutional, wholesale and retail client sectors, including many of the largest global asset managers, hedge funds, insurance companies, central banks, banks and dealers, proprietary trading firms and retail brokerage and financial advisory firms, as well as regional dealers. Our marketplaces facilitate trading across a range of asset classes, including rates, credit, equities and money markets. We are a global company serving clients in over 65 countries with offices in North America, Europe and Asia. We believe our proprietary technology and culture of collaborative innovation allow us to adapt our offerings to enter new markets, create new platforms and solutions and adjust to regulations quickly and efficiently. We support our clients by providing solutions across the trade lifecycle, including pre-trade, execution, post-trade and data. Our marketplaces provide deep pools of liquidity with average daily trading volume for the year ended December 31, 2019 of over $720 billion across more than 40 products.
There are multiple key dimensions to the electronic marketplaces that we build and operate. Foundationally, these begin with our clients and then expand through and across multiple client sectors, geographic regions, asset classes, product groups, trading protocols and trade lifecycle solutions.
Our markets are large and growing. Electronic trading continues to increase across the markets in which we operate as a result of market demand for greater transparency, higher execution quality, operational efficiency and lower costs, as well as regulatory changes. We believe our deep client relationships, asset class breadth, geographic reach, regulatory knowledge and scalable technology position us to continue to be at the forefront of the evolution of electronic trading. Our platforms provide transparent, efficient, cost-effective and compliant trading solutions across multiple products, regions and regulatory regimes. As market participants seek to trade across multiple asset classes, reduce their costs of trading and increase the effectiveness of their trading, including through the use of data and analytics, we believe the demand for our platforms and electronic trading solutions will continue to grow.
We have a powerful network of over 2,500 clients across the institutional, wholesale and retail client sectors. Our clients include leading global asset managers, hedge funds, insurance companies, central banks, banks and dealers, proprietary trading firms and retail brokerage and financial advisory firms, as well as regional dealers. As our network continues to grow across client sectors, we will generate additional transactions and data on our platforms, driving a virtuous cycle of greater liquidity and value for our clients.
Our technology supports multiple asset classes, trading protocols and geographies, and as a result, we are able to provide a broad spectrum of solutions and cost savings to our clients. We have built, and continue to invest in, a scalable,
10
flexible and resilient proprietary technology architecture that enables us to remain agile and evolve with market structure. This allows us to partner closely with our clients to develop customized solutions for their trading and workflow needs. Our technology is deeply integrated with our clients’ risk and order management systems, clearinghouses, trade repositories, middleware providers and other important links in the trading value chain. These qualities allow us to be quick to market with new offerings, to constantly enhance our existing platforms and solutions and to collect a robust set of data and analytics to support our marketplaces.
We are focused on balancing revenue growth and margin expansion to create long-term value and we have a track record of growth and financial performance. By expanding the scope of our platforms and solutions, building scale and integration across marketplaces and benefiting from broader network effects, we have been able to grow both our transaction volume and subscription-based revenues. Between 2004 and 2019, we had annual compound average daily trading volume growth of 13.7% and annual compound gross revenue growth of 12.3%. For the year ended December 31, 2019 and the combined year ended December 31, 2018, 43.6% and 48.0% of our gross revenues, respectively, were fixed. For the year ended December 31, 2019 our variable revenues and fixed revenues each increased as compared to the combined prior year period.
For the year ended December 31, 2019 and the combined year ended December 31, 2018, respectively, our gross revenue was $775.6 million and $684.4 million, an increase of 13.3%. For the year ended December 31, 2019, the 2018 Successor Period and the 2018 Predecessor Period, respectively, our net income was $173.0 million, $29.3 million and $130.2 million, our Adjusted EBITDA was $353.2 million, $65.3 million and $214.1 million, with an Adjusted EBITDA margin of 45.5%, 36.6% and 42.3%, and our Adjusted Net Income was $230.9 million, $40.8 million and $137.3 million. For the definitions of Adjusted EBITDA, Adjusted EBITDA margin and Adjusted Net Income and reconciliations to their most directly comparable financial measures presented in accordance with GAAP, see Part II, Item 7. – “Management’s Discussion and Analysis of Financial Condition and Results of Operations—Non-GAAP Financial Measures.”
Our Evolution
We were founded in 1996 and set out to solve for inefficiencies in the institutional U.S. treasury trading workflows, including limited price transparency, weak connectivity among market participants and error-prone manual processes. Our first electronic marketplace went live in 1998, and over the next two decades we leveraged our technology and expertise to expand into additional rates products and other asset classes, including credit, equities and money markets. Market demand for better trading workflows globally also was increasing and we initiated a strategy of rolling out our existing products to new geographies and adding local products. We expanded to Europe in 2000, initially offering U.S. fixed income products and soon thereafter added a marketplace for European government bonds. We expanded to Asia in 2004, where our first local product was Japanese government bonds. We have since continued to expand our product and client base in Europe and Asia.
We identified an opportunity to expand our offerings to the wholesale and retail client sectors based on our existing relationships with dealers and our strong market position. We developed our wholesale platform through the acquisitions of Hilliard Farber in 2008 and Rafferty Capital Markets in 2011, and developed technology to facilitate the migration of inefficient wholesale voice markets to more efficient and transparent electronic markets. We entered the retail market through our acquisition of LeverTrade in 2006, scaled our market position through our acquisition of BondDesk in 2013, and have continued to leverage our market and technology expertise to enhance our platform serving that client sector.
Throughout our evolution we have developed many new innovations that have provided greater pre-trade price transparency, better execution quality and seamless post-trade solutions. Such innovations include the introduction of pre-trade composite pricing for multi-dealer-to-customer (“D2C”) trading and the Request-for-Quote (“RFQ”) trading protocol across all of our asset classes. We have also integrated our trading platforms with our proprietary post-trade systems as well as many of our clients’ order management and risk systems for efficient post-trade processing. In addition, because large components of the market remain relationship-driven, we continue to focus on introducing technology solutions to solve inefficiencies in voice markets, such as electronic voice processing, which allows our clients to use Tradeweb technology to process voice trades. We expect to continue to leverage our success to expand into new products, asset classes and geographies, while growing our powerful network of clients.
11
While our cornerstone products continue to be some of the first products we launched, including U.S. treasuries, European government bonds and To-Be-Announced mortgage-backed securities (“TBA MBS”), we have continued to solve trading inefficiencies by adding new products across our rates, credit, equities and money markets asset classes. As a result of expanding our offerings, we have increased our opportunities in related addressable markets, where estimated average daily trading volumes have grown from approximately $0.6 trillion in 1998 to $6.3 trillion through December 31, 2019, according to industry sources and management estimates.
|
PHYSICAL PRESENCE & MAJOR TRANSACTIONS |
1996 Original business plan drafted 1997 Tradeweb formed with investment from 4 banks in the U.S. |
2000 Expanded into Europe with opening of London office 2004 Expanded into Asia with opening of Singapore and Hong Kong offices |
2005 Opened Tokyo office 2006 Acquired LeverTrade to enter Retail client sector 2008 Acquired Hillard Farber & Co. Inc. to enter Wholesale client sector |
2011 Acquired Rafferty Capital Markets 2013 Acquired BondDesk to expand Retail client sector presence |
2018 Opened Amsterdam and Shanghai offices |
2019 Completed IPO |
|||||||||
|
MAJOR LAUNCHES |
1998 Entered Rates and launched first multi- dealer online RFQ marketplace for U.S. Treasuries |
2000 Launched European government bonds 2001 Launched mortgage backed securities Launched market data business 2003 Entered Money Markets with U.S. agency discount notes |
2005 Launched interest rates swaps Entered Credit with CDS indices 2008 Entered Wholesale market |
2010 Entered Equities with European derivatives 2012 Launched European ETFs 2013 Launched session trading in Europe 2014 Launched U.S. corporate bonds |
2016 Launched U.S. ETFs 2017 First to provide international investors access to China bond market through BondConnect Launched Asian ETFs |
2018 Launched APA service |
2019 Launched portfolio trading for corporate bonds Launched fully electronic multi-asset package trading functionality |
||||||||
|
1996 |
2000 |
2005 |
2010 |
2015 |
2018 |
2019 |
|||||||||
Our Market Opportunity
Continued Growth of Global Markets
Based on industry sources and management estimates, the markets in which we participate are actively traded and growing, and we estimate that trading in rates, credit, ETFs and money markets generated average daily trading volumes of approximately $3.7 trillion, $0.1 trillion, $0.1 trillion and $2.3 trillion, respectively, during the year ended December 31, 2019 as compared to $2.1 trillion, $0.1 trillion, $0.1 trillion and $1.6 trillion, respectively, in 2015. As electronic trading in these markets continues to develop, we believe we are well positioned to increase our share of these markets over time. For the year ended December 31, 2019, calculated on the same basis as our calculation of our addressable markets, trading in certain of our rates, credit, ETFs and money markets products generated average daily trading volumes of $487 billion, $14 billion, $4 billion and $195 billion, respectively, and our average daily trading volumes for these product groups have increased by 25%, 32%, 12% and 23%, respectively, since 2015. Major market participants include large asset managers, hedge funds, central banks, banks and dealers, insurance companies, corporations, proprietary trading, brokerage and retail advisory firms, governments and retail investors.
Trading volumes are influenced by, among other things, the amount of notional securities outstanding, new issuances, market volatility, regulation and economic factors such as growth and monetary policy. We believe we are well positioned to benefit from secular and cyclical trends impacting many of the markets in which we operate. For example, the U.S. government bond market has experienced substantial growth in notional value outstanding, growing at 12% annually since 2007, according to SIFMA. The U.S. corporate bond and Chinese bond markets have grown annually at 6% and 19%, respectively, since 2007, according to SIFMA and BIS. The U.S. and European ETF markets have each grown annually at nearly 20% since 2007, according to ETFGI. Continuing growth in these markets is expected to be driven by increasing global trading volumes, resulting from increased economic activity, new government and corporate debt issuances and the continued growth of passive investing. Markets have migrated to electronic trading platforms at different adoption rates — some gradually over time (e.g., government bonds and corporate bonds) and others on a more accelerated basis due to regulation (e.g., interest rate swaps).
12
Advancements in technology, increased connectivity and the evolving business needs of market participants have caused financial markets to become larger and more global. Our platforms operate throughout the 24-hour trading day as market participants have become increasingly global and comprehensive, trading across multiple geographies, asset classes and currencies.
Electronification of Trading
Trading in fixed income and derivative markets historically has been a highly manual process. With traditional methods of trading, buyers lack a centralized source of price discovery and automated post-trade processing solutions, and as a result, are required to telephone multiple dealers to receive price quotes, compare quotes among multiple dealers, confirm orders via telephone and then engage in manual trade settlement via fax. The process is time-consuming and error-prone, leading to poor price transparency and execution quality, limited connectivity among market participants and high levels of operational risk.
Market demand for greater execution efficiency and changing regulations are shifting the paradigm of trading from voice markets to electronic markets across our asset classes. As a result of technological advances, there has been a rising use of electronic trading technologies, referred to as the electronification of markets, which have automated many of the manual processes required by traditional methods of trading, including voice. Electronification has made markets more efficient by improving price transparency and execution, while also reducing operational risk and allowing market participants to create organizational cost efficiencies, by reducing front, middle and back office headcount and eliminating manual errors. However, even as other markets, such as the equity, FX and futures markets, transitioned to the use of electronic trading processes, large components of the fixed income and derivative markets have been slower to migrate to electronic trading because of the diverse and heterogeneous nature of those instruments and because participants in these markets have traditionally operated in a more relationship-driven environment.
Demand for more efficient trading solutions continues to increase, which we believe will further drive the electronification of the markets in which we operate. Over the last 20 years, we have been a leader in the electronification of fixed income and other markets, using proprietary technologies and collaborating hand-in-hand with clients to develop innovative workflow solutions across the trade lifecycle. Our trading platforms and solutions automate and integrate key parts of the trading process, which in turn helps our clients to improve execution quality, manage risk and compliance and account for their trading activities. For example, we have designed our platforms to seamlessly integrate with our clients’ internal and third-party risk and order management systems, as well as with vendor systems, including clearinghouses, confirmation systems and other third-party service providers. These integrations, which include over 375 proprietary client integrations and over 30 vendor integrations, help our clients to improve the efficiency of their front, middle and back offices and provide them with the opportunity to adopt end-to-end straight-through processing.
The process of market electronification is ongoing. Many markets — even in products we already offer — are in the early stages of electronification, such as U.S. corporate bonds, or continue to have meaningful volumes traded manually, with liquidity-taking investors calling multiple dealers for quotes and engaging in manual post-trade processing. For example, for U.S. treasuries, voice trading still accounts for approximately 35% to 40% of overall trading volumes, according to industry sources and management estimates. Certain markets in which we operate have experienced higher rates of electronification, such as ETFs and credit default swaps, and we believe we are well positioned to increase our share in these markets as our network continues to grow. Our innovation will continue to be driven by client demand for efficiencies in additional workflows, products and geographies, which, combined with our entrepreneurial culture and domain expertise, are expected to attract additional market participants to Tradeweb.
Regulatory changes have also driven demand for electronification. The policy objectives of a number of post-2008 crisis reforms, such as the Dodd-Frank Wall Street Reform and Customer Protection Act (the “Dodd-Frank Act”), Basel III and Markets in Financial Instruments Directive II (“MiFID II”), are to increase transparency and reduce systemic risk. These objectives have generally led to increased adoption of electronic trading on regulated markets where price transparency, counterparty credit checks, reporting tools and clearing are essential components. In the United States, for example, swaps are experiencing increased rates of electronification due to mandates in the Dodd-Frank Act that require certain derivatives to trade on CFTC-regulated swap execution facilities (“SEFs”). Tradeweb launched two SEFs in 2013
13
and, in 2019, we had the leading market position in SEF trading for U.S. dollar-denominated interest rate swaps, excluding forward rate agreements, according to Clarus Financial Technology. In addition, higher capital requirements have driven dealers to reduce the size of their balance sheets and utilize the distribution and scale provided by electronic trading venues.
Unlocking the Value of Data for our Network
Traders are increasingly using data for pre-trade analytics, automated execution, transaction cost analysis, predictive insights and post-trade solutions. Greater demand for data and analytics has improved the value proposition of electronic trading relative to other mediums. Our real-time pre-trade data and analytics provide additional value-add to platform users, further entrenching our platforms and solutions among our clients. We provide continuous pre-trade pricing updates across our markets to clients increasing transparency in trading. Additionally, regulations are mandating additional audit trail and reporting requirements, which we help solve with our trading platforms and integrated post-trade settlement solutions. These applications are supported by advancements in technology and the increased prevalence of electronic trading, both of which have made it easier to generate, capture, store and analyze data.
Our Competitive Strengths
Our Network of Clients, Products, Geographies and Protocols
Our clients continue to come to our trading venues because of our large network and deep pools of liquidity, which result in better and more efficient trade execution. We expand our relationships through our integrated technology and new offerings made available to our growing network of clients. As an electronic trading marketplace for key asset classes and products, we benefit from a virtuous cycle of liquidity — trading volumes growing together and re-enforcing each other. We expect our existing clients to trade more volume on our trading venues and to attract new users to our already powerful network, as liquidity on our marketplaces grows and we offer more products and value-added solutions. The breadth of our network, products, global presence and embedded scalable technology offers us unique insights and an established platform to swiftly enter additional markets and offer new value-added solutions. This is supported by more than 20 years of successful innovation and long trusted relationships with our clients.
We are a leader in making trading and the associated workflow more efficient for market participants. Based on industry sources and management estimates, we believe that we are a market leader in electronic trading for the following products: U.S. treasuries, TBA MBS, European government bonds, U.S. dollar-denominated interest rate swaps and euro-denominated interest rate swaps, which are some of our largest products, as well as ETP-traded Yen-denominated interest rate swaps and European ETFs, which are some of our newer products. We cover all major client sectors participating in electronic trading, including the institutional, wholesale and retail client sectors. We are a global business with users accessing our platforms and solutions in over 65 countries. For both the year ended December 31, 2019 and the combined year ended December 31, 2018, we generated approximately 36% of our gross revenue from clients outside of the United States. We have built a business that is diverse across more than 40 products. In addition, we provide the full spectrum of trading protocols from voice to sweeps (session-based trading) through RFQ to CLOB (central limit order book).
We believe the breadth of our offerings, experience and client relationships provides us unique market feedback and enables us to enter new markets with higher probabilities of success and greater speed. Many of our markets are interwoven and we provide participants trading capabilities across multiple products through a single relationship. We cover our global clients through offices in North America, Europe and Asia and a global trading network that is distributed throughout the world.
Culture of Collaborative Innovation
We have developed trusted client relationships through a culture of collaborative innovation where we work alongside our clients to solve their evolving workflow needs. We have a long track record of working with clients to solve both industry-level challenges and client-specific issues. We have had a philosophy of collaboration since our founding, when we worked with certain clients to improve U.S. treasury trading for the institutional client sector.
14
More recently, we helped make trading in credit markets more efficient by partnering with major dealers to improve liquidity and reduce the cost of net spotting the U.S. treasury in connection with a corporate bond trade. This net spotting functionality allows our credit clients to spot multiple bonds at the same time using our multi-dealer net spotting tool to net their interest rate risk simultaneously using one spot price. We have also worked side-by-side with clients and federal agencies to customize solutions for their particular needs in the TBA MBS market. For example, in direct collaboration with our leading TBA MBS clients we developed a functionality (Round Robin) to help resolve the issue of systemic fails on TBA MBS trades and reduce the operational risk and costs associated with delivery failures that often plague the TBA MBS market. In conjunction with Freddie Mac, we developed a direct-to-Freddie Mac exchange path for institutional clients related to the single security initiative, paving the way for a combined Freddie Mac and Fannie Mae TBA market of Uniform Mortgage-Backed Securities. Through collaborative endeavors like these, we have become deeply integrated into our clients’ workflow and become a partner of choice for new innovations.
Scalable and Flexible Technology
We consistently use our proprietary technology to find new ways for our clients to trade more effectively and efficiently. Our core software solutions span multiple components of the trading lifecycle and include pre-trade data and analytics, trade execution and post-trade data, analytics and reporting, integration, connectivity and straight-through processing. Our systems are built to be scalable, flexible and resilient. Our internet-based, thin client technology is readily accessible and enables us to quickly access the market with easily distributed new solutions. For example, we were the first to offer web-based electronic multi-dealer trading to the institutional U.S. treasury market and have subsequently automated the market structure of additional markets globally. We have also created new trading protocols and developed additional solutions for our clients that are translated and built by our highly experienced technology and business personnel working together to solve a client workflow problem. Going forward, we expect our technology platform, and ongoing investments in technology and new product offerings, to help us stay at the forefront of the evolution of electronic trading.
Our Global Regulatory Footprint and Domain Expertise
We are regulated (as necessitated by jurisdiction and applicable law) or have necessary legal clearance to offer our platforms and solutions in major markets globally, and our experience provides us credibility when we enter new markets and facilitates our ability to comply with additional regulatory regimes. With extensive experience in addressing existing and pending regulatory changes in our industry, we offer clients a central source of expertise and thought leadership in our markets and assist them through the myriad of regulatory requirements. We then provide our clients with trading platforms that meet regulatory requirements and enable connectivity to pre-and post-trade systems necessary to comply with their regulatory obligations.
Platforms and Solutions Empowered by Data and Analytics
Our data and analytics enhance the value proposition of our trading venues and improve the trading experience of our clients. We support our clients’ core trading functions by offering trusted pre- and post-trade services, value-added analytics and predictive insights informed by our deep understanding of how market participants interact. Our data and analytics help clients make better trading decisions, benefitting our current clients and attracting new market participants to our network. For example, data powers our Automated Intelligent Execution (“AiEX”) functionality which allows traders to automatically execute trades according to pre-programmed rules and automatically sends completed or rejected order details to internal order management systems. By allowing traders to automate and execute their smaller, low touch trades more efficiently, AiEX helps traders focus their attention on larger, more nuanced trades. During the year ended December 31, 2019, the percentage of trades executed by our institutional clients using our AiEX functionality was 23% of total institutional trades, up from 6% in 2015, and we are seeing demand for AiEX continue to grow across some of our key products, including U.S. treasuries, European government bonds, global swaps, U.S. and European corporate bonds and global ETFs.
Our over 20 year operating history has allowed us to build comprehensive and unique datasets across our markets and, as we add new products to our platforms, we will continue to create new datasets that may be monetized in the future. Our marketplaces generate valuable data, processing over 50,000 trades and over 1.0 billion pre-trade price
15
updates daily, that we collect centrally and use as inputs to our pre-trade indicative pricing and analytics. We maintain a full history of inquiries and transactions, which means, for example, we have 20 years of U.S. treasury data. We will seek to further monetize our data over time both through potential expansion of our existing market data license agreement with Refinitiv and through distributing additional datasets and analytics offerings through our own network or through other third-party networks.
We are continuously developing new offerings and solutions to meet the changing needs of our clients and will benefit from helping them comply with new regulations. For example, in January 2018, we launched our Approved Publication Arrangement (“APA”) reporting service in response to demand by our clients to satisfy new off-venue and over-the-counter (“OTC”) reporting requirements under MiFID II. We now operate one of the largest fixed income APA services with over 100 clients, including 20 leading global banks, and expect to expand our APA service in the coming years.
Experienced Management Team
Our focus and decades of experience have enabled us to accumulate the knowledge and capabilities needed to serve complex, dynamic and highly regulated markets. Our founder-led management team is composed of executives with an average of over 25 years of relevant industry experience including an average of 14 years working together at Tradeweb under different ownership structures and through multiple market cycles. Our stable management team has overseen our expansion into new markets and geographies while managing ongoing strategic initiatives including our significant technology investments. Additionally, management has fostered a culture of collaborative innovation with our clients, which combined with management’s focus and experience, has been an important contributor to our success. We have been thought leaders and contributors to the public dialogue on key issues and regulations affecting our markets and industry, including congressional testimony, public roundtables, regulatory committees and industry panels.
Our Growth Strategies
Throughout our history, we have operated with agility to address the evolving needs of our clients. We have been guided by our core principles, which are to build better marketplaces, to forge new relationships and to create trading solutions that position us as a strategic partner to the clients that we serve. We seek to advance our leadership position by focusing our efforts on the following growth strategies:
Continue to Grow Our Existing Markets
We believe there are significant opportunities to generate additional revenue from secular and cyclical tailwinds in our existing markets:
Growth in Our Underlying Asset Classes
The underlying volumes in our asset classes continue to increase due to expanded government and corporate issuance. In addition, the government bond market is foundational to and correlative to virtually every asset class in the cash and derivatives fixed income markets. Based on industry sources and management estimates, we estimate that the addressable average daily trading volume across the rates, credit, equities and money markets asset classes has grown at a compound annual growth rate of 13% from 2015 through the year ended December 31, 2019. Select products that we believe have a high growth potential due to current market trends include global government bonds, interest rate derivatives, ETFs and credit cash products.
Growth in Our Market Share
Our clients represent most of the largest institutional, wholesale and retail market participants. The global rates, credit, equities and money markets asset classes continue to evolve electronically, and we seek to increase our market share by continuing to innovate to electronify workflows. We intend to continue to increase our market share by growing our client base and increasing the percentage of our clients’ overall trading volume transacted in those asset classes on our platforms, including by leveraging our voice solutions to win more electronic trading business from electronic voice
16
processing clients in our rates and credit asset classes. In particular, across many of our products, we are implementing an integrated approach to grow our market share — serving all three of our client sectors across all trade sizes, from odd-lot to block trades, through a variety of protocols. Many of our asset manager, hedge fund, insurance, central bank/sovereign entity and regional dealer clients actively trade multiple products on our platforms. In addition, our global dealer clients trade in most asset classes across all three client sectors. We also see a growing appetite for multi-asset trading to reduce cost and duration risk. For example, over 90% of our U.S. institutional high grade cash credit trades leverage our U.S. treasury marketplace for spotting. During the year ended December 31, 2019, net spotting accounted for over 25% of our overall U.S. high grade credit notional volume and over 13% of our U.S. high grade electronic credit volume.
Electronification of Our Markets
Market demands and regulation are changing the paradigm of trading and driving the migration to electronic markets. Our clients desire transparency, best execution and choice of trading protocols amidst dynamic and evolving markets. Furthermore, innovations in capital markets have enabled increased automation and process efficiency across our markets. The electronification of our marketplaces varies by product. We typically see meaningful electronification of new products within three to five years of their launch, with certain products experiencing significant revenue growth following that period of time, including as a result of market and regulatory developments. For example, our U.S.- and euro-denominated derivative products experienced increased rates of electronification and related revenue growth following the implementation of mandates under the Dodd-Frank Act in 2013 and MiFID II in 2018. We are well positioned to continue to innovate and provide better electronic markets and solutions that satisfy the needs of our clients and that meet changing market demands and evolving regulatory standards.
We believe that U.S. treasuries, global interest rate swaps, global ETFs, in particular, institutional block ETFs, and U.S. credit products, including corporate high grade and high yield bonds, are key drivers of our potential growth. Our penetration of these markets, and their level of electronification, are at various stages. We are focused on growing our market share for these products by continuing to invest in new technology solutions that will attract new market participants to our platforms and increase the use of our platforms by existing clients.
Expand Our Product Set and Reach
We have grown our business by prudently expanding our offerings to add new products and asset classes, and we expect to continue to invest to add new products and expand into new complementary markets as client demand and market trends evolve. We expanded into China in 2017 and offer our global clients access to the Chinese bond market through our initiative with BondConnect. We continue to focus on that initiative and on other opportunities in China, and on expanding opportunities with clients in the Asia region more broadly. In addition, we have expanded our product set to include wholesale electronic repurchase agreements, as well as U.S. and European bilateral repurchase agreements, European cash equities and U.S. options for our institutional client sector. We also intend to leverage innovation and technology capabilities to develop new solutions that help our clients trade more effectively and efficiently. For example, our swap compression functionality allows clients to reduce their swap positions at the clearinghouse, resulting in significant cost savings. On our institutional U.S. credit platform, our portfolio trading solution allows clients to obtain competitive prices on a full basket of securities and trade on net present value from dealers. In addition, multi-asset package (MAP) trading allows clients to simultaneously execute interest rate swaps, inflations swaps and government bonds in a single electronic package enabling clients to achieve more competitive pricing, reduce manual booking errors and increase execution speed. Net spotting, which links our institutional U.S. credit and U.S. treasury markets allows clients to reduce the operational stress and financial cost of executing offsetting Treasury hedges for corporate bonds that trade at a spread to the U.S. treasury. Given the breadth of expertise of our sales people and management, we have the ability to focus on new client opportunities and on selling additional solutions to existing clients.
In addition, we believe our business model is well suited to serve market participants in other asset classes and geographies where our guiding principles can continue to transform markets and broaden our reach. We currently have clients in over 65 countries, and we plan to expand our platforms and solutions into additional geographies. Our international strategy involves offering our existing products to new geographies and then adding local products. In
17
addition, we believe we can, and will, continue to develop trading models in one product or asset class and deliver those models to other products or asset classes, irrespective of geography. For example, we have leveraged our session-based trading technology in European corporate bonds for session-based trading in U.S. corporate bonds and Off-the-Run U.S. treasuries, and we are focused on growing this newer trading protocol. We have significant scale and breadth across our platforms, which position us well to take advantage of favorable market dynamics when introducing new products or solutions or entering into new markets.
Enhance Underlying Data and Analytics Capabilities to Develop Innovative Solutions
As the demand for data and analytics solutions grows across markets and geographies, we plan to continue to expand the scope of our underlying data, improve our tools and technology and enhance our analytics and trade decision support capabilities to provide innovative solutions that address this demand. As the needs of market participants evolve, we expect to continue to help them meet their challenges, which our continuous investments in data, technology and analytics enable us to do more quickly and efficiently. For example, we enhance our solutions by linking indicative pre-trade data to our clients’ specific trades to create predictive insights from client trading behavior. Our technology architecture reduces the time to market for new data solutions, which allows us to react quickly to client needs.
In November 2018, we extended our long-term agreement with Refinitiv, pursuant to which Refinitiv licenses certain data from us, which provides us with a predictable and growing revenue stream. In addition, we will continue to selectively pursue new strategic partnerships to expand our data and analytics offering over time.
We have also launched a roster of closing prices partnering with FTSE for UK Gilts and ICE for US treasuries in response to the growing demand for trusted reference price data that enables firms to manage investment portfolios, evaluate the fair value of securities, perform compliance monitoring and satisfy general accounting standards.
Pursue Strategic Acquisitions and Alliances
We intend to continue to selectively consider opportunities to grow through strategic acquisitions and alliances. These opportunities should enhance our existing capabilities, accelerate our ability to enter new markets or provide new solutions. For example, in addition to our acquisitions in the wholesale and retail client sectors, we made an acquisition (CodeStreet) in 2016, which bolstered our predictive analytics capabilities. Our focus will be on opportunities that we believe can enhance or benefit from our technology platform and client network, provide significant market share and profitability and are consistent with our corporate culture.
Our Client Sectors
We have a powerful network of over 2,500 clients across the institutional, wholesale and retail client sectors. Our clients include leading global asset managers, hedge funds, insurance companies, central banks, banks and dealers, proprietary trading firms and retail brokerage and financial advisory firms, as well as regional dealers. Since the founding of Tradeweb over 20 years ago, we have developed trusted relationships with many of our clients and have invested to integrate with their capital markets technology infrastructures. This has facilitated the collaborative approach we employ to solve our clients’ evolving workflow needs.
We provide deep liquidity pools to the institutional, wholesale and retail client sectors through our Tradeweb Institutional, Dealerweb and Tradeweb Direct platforms. We facilitated over $720 billion in average daily trading volume for the year ended December 31, 2019 across more than 40 products, and we have multi-year agreements with many of our significant dealer clients.
We are dependent on our dealer clients, some of which are current and former stockholders, to support our marketplaces by providing liquidity on our trading platforms, and certain of our dealer clients may account for a significant portion of our trading volume. For the year ended December 31, 2019, the combined year ended December 31, 2018 and the year ended December 31, 2017, 44.8%, 42.2% and 41.3%, respectively, of our revenues were generated by the pre-IPO Bank Stockholders and their affiliates. Market knowledge and feedback from these dealer clients have also been important factors in the development of many of our offerings and solutions.
18
Our client sectors are continuing to become more interwoven and we believe we are well positioned to deliver the benefits of cross-marketplace network effects. Many of our asset manager, hedge fund, insurance, central bank/sovereign entity and regional dealer clients actively trade multiple products on our platforms. In addition, many of the commercial banks and dealers providing liquidity on Tradeweb Institutional are also active traders on Dealerweb, our wholesale platform, and provide odd-lot inventory for our retail client sector. We believe that this overlapping of client sectors and asset classes will continue and, in the long-term, will eliminate the distinctions across institutional, retail and wholesale channels. For example, in our institutional U.S. credit marketplace, we have integrated over $10 billion of live streaming retail liquidity. Given our technological capabilities, the diversity of our client sectors and the breadth of our products and trading protocols, we believe we are well positioned to capitalize on this emerging trend.
Institutional
Tradeweb Institutional offers dealer-to-client and all-to-all trading and related solutions to over 1,900 liquidity-taking clients. Our clients include leading asset managers, hedge funds, insurance companies, regional dealers and central banks/sovereign entities. The Tradeweb Institutional platform serves over 90% of the world’s largest 100 asset managers, over 80% of the top 25 insurance companies and over 50 central banks/sovereign entities with more than 150 dealers providing liquidity. Tradeweb Institutional offers trading in a wide variety of products, including U.S. treasuries, European government bonds, TBA MBS, global interest rate swaps, global corporate bonds and ETFs. Our trading protocols include RFQ, Request-for-Market, Request-for-Stream, list trading, compression, blast all-to-all, Click-to-Trade, portfolio trading and inventory-based.
Wholesale
We provide fully electronic, hybrid and voice trading for the wholesale community on our Dealerweb platform. Our clients include more than 300 dealers with more than 100 dealers actively trading on our electronic and hybrid markets. Nearly all of our electronic and hybrid dealer clients also trade on the Tradeweb Institutional and Tradeweb Direct platforms. Dealerweb’s leading markets include TBA MBS, global credit products, U.S. treasuries, repurchase agreements and U.S. dollar-denominated swaps. Our electronic trading protocols include directed streams, central limit orderbook and session-based trading. We are well positioned to facilitate and capitalize on the continued transition of wholesale client trading from voice or hybrid trading to fully electronic trading. To that end, we have had over 25% growth in the number of e-participants on our wholesale client sector markets since 2016.
Retail
Tradeweb Direct, our regulated Alternative Trading System (“ATS”), offers financial advisors and their retail clients access to micro-lot liquidity provided by our network of broker-dealers. Tradeweb Direct serves over 45,000 financial advisors at more than 200 retail brokerage and advisory firms. In addition, certain Tradeweb Direct clients provide access to approximately 60,000 retail clients through white-labeled, web-based front ends. Tradeweb Direct also provides access to its ATS to large and middle-market asset managers. Tradeweb Direct offers trading in a range of products, including U.S. corporate bonds, treasuries, municipal bonds and certificates of deposit (CDs), using our Click-to-Trade, inventory-based and RFQ trading protocols. Participants on Tradeweb Direct have the ability to connect to our marketplaces via workstations or APIs or through access to websites that are white-labeled for our clients.
Our Asset Classes and Products
For the year ended December 31, 2019, approximately 88% of our gross revenue was generated from fees and commissions earned from our asset class and product offerings. The primary source of the remainder of our gross revenue was generated from fees earned from our pre- and post-trade data and analytics solutions. See “— Our Solutions.”
We offer efficient and transparent trading across a diverse range of asset classes:
•Rates (56% of 2019 gross revenue): We facilitate trading in a broad range of cash and derivatives rates products, including major government securities, such as U.S. treasury securities and European government
19
bonds, mortgage-backed securities, interest rate swaps and agency/supranational securities and other rates products.
•Credit (21% of 2019 gross revenue): We offer deep pools of liquidity for our clients in cash and derivatives credit products, including U.S. and European high grade and high yield bonds, China bonds, municipal bonds, index, single name and sovereign credit default swaps and other credit products.
•Equities (6% of 2019 gross revenue): We offer trading in a range of cash and derivatives equities products, including global ETFs, equity derivatives and other equities products.
•Money Markets (5% of 2019 gross revenue): We offer trading in a broad range of cash money market products, including commercial paper, agency discount notes, repurchase agreements, certificates of deposit and treasury bills and other money markets products.
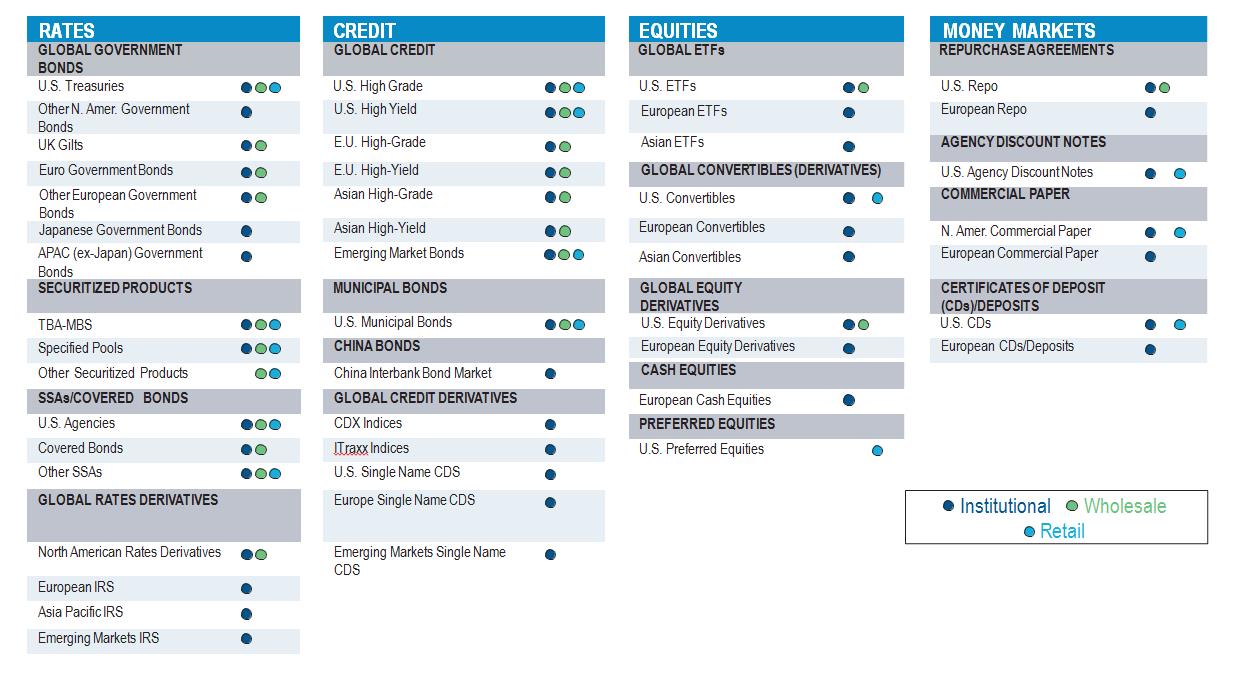
Our Geographies
We have a global footprint, serving clients, including over 1,900 institutional liquidity-taking clients, in over 65 countries across the Americas, EMEA (Europe, Middle East and Africa) and APAC (Asia Pacific) regions and with offices in North America, Europe and Asia. By region:
•We serve over 900 clients in the Americas across North, Central and South America.
•We serve over 700 clients in EMEA across Europe, the Middle East and North Africa.
•We serve over 300 clients in APAC across Asia, the Pacific, Oceania and the Indian sub-continent.
In addition, we currently support trading across 25 currencies globally.
We believe our platforms, technology and solutions have made trading in markets globally more efficient and transparent. Furthermore, our expertise in multiple jurisdictions positions us as a partner of choice as our clients expand
20
their trading operations to new geographies. As the global markets move to electronic trading, we expect to be at the forefront of this change.
Our Solutions
We provide clients with solutions across the trade lifecycle including pre-trade data and analytics, intelligent trade execution, straight-through processing and post-trade data, analytics and reporting.
•Pre-Trade Data and Analytics: We provide clients with accurate, real-time market data and streaming price updates across more than 40 products. Major financial publications across the globe reference our market data. Our real-time market data services include major government bonds, corporate bonds, mortgage-backed securities, fixed income derivatives and money markets. For example, data and analytics power our Automated Intelligent Price, or Ai-Price, functionality, which delivers benchmark pricing and insights for approximately 19,000 U.S. corporate bonds. We integrate directly with order management systems allowing for order entry and pre-trade compliance and risk analysis. Clients are also able to perform credit checks for cleared derivatives trading — either with limits on our system or through connectivity to the futures commission merchants.
In addition, we provide Refinitiv with certain real-time market data feeds for multiple fixed income and derivatives products under an exclusive license pursuant to which Refinitiv redistributes such market data to its customers on its Eikon platform and through direct feeds.
•Trade Execution: Trade execution is at the core of our business. We provide marketplaces and tools that facilitate trading by our clients and streamline their related workflows. Our market specialists and technology team work closely with our clients to continuously innovate and improve their trading practices. The trading protocols we currently offer on our platforms include:
•Request-for-quote. Our multi-dealer request-for-quote, or RFQ, protocol provides institutional clients with the ability to hold a real-time auction with multiple dealers and select the best price. RFQ was pioneered by Tradeweb in 1998 and has been deployed across all of our rate markets, including government bonds, mortgage-backed securities and U.S. agencies, and our other asset classes. The RFQ is a fully-disclosed trading protocol — both buy-side and sell-side names are known prior to execution. Multi-dealer RFQ assists clients with achieving best execution.
•Request-for-market. Our request-for-market, or RFM, protocol provides institutional clients with the ability to request a two-sided market from a particular dealer. This mirrors the approach of a client calling a specific trader for market prices and rates before showing the direction they want to trade. The RFM protocol has been effective in some of our newer markets, including credit default swap indices, where it is integrated with the RFQ and click-to-trade protocols on a single trading screen.
•Request-for-stream. Our request-for-stream, or RFS, protocol allows multiple dealers to show clients continuously updating rates, in line with market movements, during a client’s request window.
•List trading. Used by clients with multiple transactions to complete, our list trading protocol is a highly efficient workflow tool. By executing many trades at once, clients can request prices from multiple dealers to extract the best price and complete the hedging of the trades at one time, saving significant manual effort compared to executing on the telephone.
•Compression. Clients utilize our interest rate swap compression tool as an efficient means to reduce the number of line items they have outstanding at a clearinghouse by netting offsetting positions in a single transaction. This functionality allows clients to submit up to 250 line items to liquidity providers for simultaneous list pricing, which they can execute, clear and report in one transaction, reducing both their
21
risk and clearing costs. The Tradeweb compression tool is flexible and versatile in design allowing clients to adapt the tool to their workflow and customize for granular swaps.
•Blast all-to-all. Our Blast all-to-all, or A2A, protocol allows clients to send RFQ trade inquiries to all market participants in a given market and receive responses for executions. Trades are exposed to all liquidity providers simultaneously to broaden their liquidity sources. Blast A2A is currently used by our institutional clients in our global credit marketplaces, including U.S. high grade, U.S. high yield, European credit products and other corporate bonds. The Blast A2A functionality provides alert and inquiry monitors so participants are notified of trading opportunities. Clients can send single or list trade inquiries and can receive responses for full or partial fills. Clients can also leverage our AiEX tool in conjunction with this trading protocol.
•Click-to-trade. Our click-to-trade, or CTT, protocol enables a liquidity-taking client to view a set of prices in real-time and click on the price and the dealer with whom they wish to execute. This trading protocol is especially popular with clients that are looking to view a range of executable, real-time prices across dealers.
•Portfolio Trading. To support rebalancing of passive portfolios and ETFs, our portfolio trading solution allows clients to obtain competitive prices and trade on net present value on a full basket of securities.
•Session-based. Sweep, our session-based trading protocol, allows clients to manage inventory and balance sheets by entering orders to be matched against opposite orders at a specified time and price, concentrating market liquidity to a particular point in time. This protocol leverages our broker relationships, technology, and pricing from the overall Tradeweb network to fill the gap between voice brokering and fully electronic order book trading.
•Central Limit Order Book. Our central limit order book, or CLOB, is a continuous electronic protocol that allows clients to trade on firm bids and offers from other market participants, as well as enter their own resting bids and offers for display to the market participants, typically anonymously.
•Directed streams. Our directed streams protocol, which is currently used by our wholesale clients in the On-The-Run U.S. treasury marketplace, gives clients an efficient alternative to traditional voice and order book trading. Liquidity-taking and liquidity-providing clients can establish data-driven, customized bilateral trading relationships that deliver real-time price discovery and high quality execution. In this matched principal model, clients can connect to a single platform to transact with multiple pools of directed liquidity.
•Inventory-based. Our inventory-based protocol allows liquidity-providing clients to submit a range of bids and offers for particular securities that a counterparty can then look to execute on. These prices are not necessarily updated in real-time but provide a good indication of where the counterparty is likely to complete the trade. This protocol is most commonly deployed in less liquid, security-specific marketplaces, such as certain credit and money markets marketplaces.
•Voice. Voice-brokered products in our wholesale client sector include, among other products, U.S. treasuries, MBS, municipal bonds and repurchase agreements. Our voice brokers provide anonymity and insight for sell side traders and give us valuable high-touch relationships and market understanding and access.
Tradeweb Automated Intelligent Execution, or AiEX, is an innovative automated trading technology that allows clients to execute large volumes of trade tickets at a high speed using pre-programmed execution rules that are tailored to the client’s trading strategy. Clients use AiEX to efficiently automate high volumes of small, basic trades to free up time and create capacity. In addition, clients apply AiEX to more complex execution strategies to open up new trading opportunities. The trading benefits of AiEX include efficient accelerated execution, better optimization to fine-tune dealer selection and enhanced automated compliance.
22
•Trade Processing: Our trade processing technology allows our clients to increase productivity, reduce risk and improve overall performance. Our post-trade solutions allow clients to allocate their electronic or phone-executed trades electronically, including storing and communicating organizational and sub-account settlement, identity and confirmation preference information for processing trades. Our post-trade solutions also make it easier for clients to communicate trade settlement information to dealers, prime brokers, fund administrators and confirmation vendors. Additionally, clients can send trades to clearinghouses and reporting in real-time through third-party middleware or Tradeweb developed direct links. We work side by side with numerous industry partners to provide direct server-to-server connections. By eliminating manual re-entry of trade and allocation information, our solutions assist clients in reducing failed trades and saving time, effort and money.
•Post-Trade Data, Analytics and Reporting: Our comprehensive post-trade services include transaction cost analysis, or TCA, best execution reporting and client performance reports. These powerful tools provide our clients with ways to measure and optimize their trade performance. Our TCA tools monitor the cost effectiveness and quality of execution of trading activities for trades executed on or off Tradeweb. Our post-trade performance reports provide a summary of trading activity including detailed exception reports, price benchmarking and peer group comparisons. In response to MiFID II, we also launched an APA reporting service to allow clients to meet post-trade transparency requirements for off-venue or OTC trading activity. Our APA service provides regulatory pre-trade and post-trade reporting across multiple asset classes, including for products not offered by Tradeweb. The APA service also provides venue reporting for clients for Refinitiv’s FX trading venues and Forte Securities.
Strategic Alliances
As part of our culture of collaborative innovation, throughout our history we have also initiated several formal strategic alliances. These alliances have taken several forms, including distribution partnerships, technological alliances and revenue sharing and other financial arrangements. The alliances have allowed us to accelerate our entry into certain new markets, leverage scale of other parties or simply maximize opportunities through joint projects.
Sales and Marketing
We sell and promote our offerings and solutions using a variety of sales and marketing strategies. Our sales organization, which is generally not commission based, follows a team-based approach to covering clients, deploying our product and regional expertise as best dictated by evolving market conditions. The team has historically been organized by client sector and then by region, but as markets have converged, we have increasingly leveraged our global and cross-product expertise to drive growth. Our sales team, which works closely with our technology team, is responsible for new client acquisition and the management of ongoing client relationships to increase clients’ awareness, knowledge and usage of our trading platforms, new product launches, information and data services and post-trade services. Our sales team is also responsible for training and supporting new and existing clients on their use of our platforms and solutions and for educating clients more broadly on the benefits of electronic trading, including how to optimize their trading performance and efficiency through our various trading protocols.
Given the breadth of our global client network, trading volume activity and engagement with regulatory bodies, we regularly work to help educate market participants on market trends, the impact of regulatory changes and technology advancements. Our senior executives often provide insight and thought leadership to the industry through conversations with the media, appearances at important industry events, roundtables and forums, submitting authored opinion pieces to media outlets and conducting topical webinars for our clients. We believe this provides a valued service for our constituents and enhances our brand awareness and stature within the financial community.
Additionally, we employ various marketing strategies to strengthen our brand position and explain our offerings, including through our public website, advertising, digital and social media, earned media, direct marketing, promotional mailings, industry conferences and hosted events.
Competition
23
The markets for our solutions continue to evolve and are competitive in the asset classes, products and geographies in which we operate. We compete with a broad range of market participants globally. Some of these market participants compete in a particular market, while select others compete against the entire spectrum of our offerings and solutions. In addition, there are other companies that have the platform breadth and global reach that we provide. We believe that our comprehensive offerings, global reach, culture of collaboration and broad network increasingly differentiate us from other market participants.
We primarily compete on the basis of client network, domain expertise, breadth of offerings and solutions and ease of integration of our platforms with our client’s technology, as well as the quality, reliability, security and ease of our platforms and solutions. We face six main areas of competition:
•Other electronic trading platforms: We compete with a number of other electronic trading venues. These include MarketAxess, Bloomberg, LSEG (MTS BondsPro), Intercontinental Exchange (“ICE”) (Bondpoint, TMC Bonds, Creditex) and others in the credit and municipal markets; Bloomberg, LSEG (MTS BondVision), Nasdaq (Nasdaq Fixed Income), CME Group (NEX Group), BGC Partners (Fenics) and others in the rates and derivatives markets; and ITG (RFQ-hub) that was acquired by Virtu and Bloomberg in the equities and ETF markets. Additionally, new platform providers have entered the market, such as Trumid, LiquidityEdge, which MarketAxess recently acquired, and Liquidnet.
•Exchanges: In recent years, exchanges have pursued acquisitions that have put them in competition with us. For example, ICE acquired BondPoint and TMC Bonds, retail-focused platforms, and Interactive Data Corporation (“IDC”), a provider of fixed income data, in an effort to expand its portfolio of fixed income products and services. CME Group and Nasdaq also operate exchanges that compete with us. Exchanges also have data and analytics relationships with several market participants, which increasingly put their offerings in direct competition with Tradeweb.
•Inter-dealer brokers: We compete with inter-dealer brokers, particularly in our wholesale markets in products such as MBS, U.S. Treasuries, U.S. repo and products traded on SEFs. Major competitors include TP ICAP, BGC Partners and Tradition. Many of these firms also offer voice, electronic and hybrid trading protocols. As larger, full service inter-dealer brokers have consolidated, numerous boutique firms and alternative electronic start-ups are attempting to capture select markets.
•Single-bank systems: Major global and regional investment and commercial banks offer institutional clients electronic trade execution through proprietary trading systems. Many of these banks expend considerable resources on product development, sales and support to promote their single-bank systems.
•Dealers: Many of our markets are still traded through traditional voice-based protocols. Institutional investors have historically purchased fixed-income securities, large blocks of equity securities, or ETFs, or entered into OTC derivative transactions, by telephoning sales professionals at dealers. We face competition from trading conducted over the telephone between dealers and their institutional clients.
•Market data and information vendors: Market data and information providers, such as Bloomberg, IDC (now part of ICE) and IHS Markit, have a pervasive presence across the financial trading community. Their data and pre-and post-trade analytics compete with offerings we provide to support trading on our marketplaces.
We face intense competition, and we expect competition with a broad range of competitors to continue to intensify in the future. See Part I, Item 1A. – “Risk Factors — Risks Relating to Our Business and Industry — Failure to compete successfully could materially adversely affect our business, financial condition and results of operations.”
Proprietary Technology
Over the past 20 years, we have collaborated with our clients to continually innovate and evolve with the structure of our markets. This collaboration enables us to remain agile across client sectors, geographies, asset classes and products providing speed to market and a distinct cost and innovation advantage to our clients. Critical to our ability to
24
collaborate with clients and remain at the forefront of evolving market trends is our team of over 300 technologists, which works closely with our client, product and sales teams and has deep market knowledge and domain expertise. This knowledge and expertise not only allows us to address client demand but also to focus on those solutions that can be scaled across client sectors, asset classes and trading protocols.
Our systems are built to be scalable, flexible and resilient. Our core software solutions span the trading lifecycle and include pre-trade analytics, trade execution and post-trade data, analytics and reporting, connectivity and straight-through processing.
A significant portion of our operating budget is dedicated to system design, development and operations in order to achieve high levels of overall system performance. We continually monitor our performance metrics and upgrade our capacity configurations and requirements to handle anticipated peak trading activity in our highest volume products.
The key aspects of our proprietary technology infrastructure include facilitating client-driven innovation, launching new solutions quickly and investing in talent, machine learning and AI capabilities. These aspects of our technology lead to the following:
•Nimble product development in collaboration with clients: Our approach to product development facilitates continuous releases of important product features. This allows us to be opportunistic in what we decide to release at any point in time and inject newly discovered opportunities into the trade lifecycle. We have designed our platforms to be component-based and modular. New components can be built quickly and have detailed monitoring and command capabilities embedded.
•Scalable architecture: Our scalable architecture was designed to address increased trading activities and evolving market structures in a cost efficient manner. Furthermore, the diversity and breadth of our platforms allow us to expand our capabilities across new markets. We use third-party data centers to more flexibly manage our capacity needs and costs, as well as to leverage security, network and service capabilities.
•Strong disaster recovery and business continuity planning: We maintain redundant networks, hardware, data centers and alternate operational facilities to address interruptions. We have eight datacenters across the United States, the United Kingdom and Japan. Our data center infrastructure is designed to be resilient and responsive with built-in redundancies.
We have put in place business continuity plans in the event of a significant business disruption or disaster recovery situation to ensure the safety of all employees and resilience of critical systems required for normal operations. The plans cover a range of scenarios and adhere to industry standards and regulatory mandates as outlined by the Interagency Paper on Sound Practices to Strengthen the Resilience of the U.S. Financial System, the SEC’s Regulation Systems Compliance and Integrity, Commodity Futures Trading Commission (“CFTC”) rules concerning system safeguards and other agencies and entities. Activities covered by the plans include the primary responsible parties at Tradeweb, actions to restore essential systems and applications with target recovery times to accomplish all stated objectives and communications to staff, partners, clients and regulators. The plans are periodically updated based on the most relevant threats to operations and tested to ensure effectiveness during emergency conditions.
•Ongoing security, system monitoring and alerting: We prioritize security throughout our platforms, operations and software development. We make architectural, design and implementation choices to structurally address security risks, such as logical and physical access controls, perimeter firewall protection and embedded security processes in our systems development lifecycle. Our cyber security program is based on the National Institute of Standards and Technology Cyber Security Framework (the “Framework”). The Framework consists of standards, guidelines and best practices to manage cybersecurity-related risks and promote the protection and resilience of critical infrastructure. Our Global Chief Information Security Officer leads a qualified cyber security team in assessing, managing and reducing the relevant risks to assure critical operations and continuous delivery of service. We constantly monitor connectivity, and our global operations team is alerted if there are any suspect events.
25
Intellectual Property
Like most companies that develop their technology in-house, we rely upon a combination of copyright, patent, trade secret and trademark laws, written agreements and common law to protect our proprietary technology, processes and other intellectual property.
To that end, we have patents or patents pending in the United States and other jurisdictions related to price discovery, order execution and trade workflows, including but not limited to pre-trade activities, market data scenarios, market data distribution, electronic data interchange, financial valuation, detecting trading opportunities, financial matching, order matching, order routing, pool trading, database, search, electronic messaging, prime brokerage, order transmission, electronic trading, tracking and monitoring, net spotting, straight-through-processing and clearing.
In addition, we own, or have filed applications for, the rights to trade names, trademarks, copyrights, domain names and service marks that we use in the marketing of our platforms and solutions to clients. We have registered for trademarks in many of our markets, including our major markets, with registrations pending in others. Trademarks registered include, but are not limited to, “Tradeweb,” “Dealerweb,” and “Tradeweb Direct.”
We also enter into written agreements with third parties, employees, clients, contractors and strategic partners to protect our proprietary technology, processes and other intellectual property, including agreements designed to protect our trade secrets. Examples of these written agreements include third-party non-disclosure agreements, employee non-disclosure and inventions assignment agreements, licensing agreements and restricted use agreements.
Regulation
Many aspects of our business are subject to regulation in a number of jurisdictions, including the United States, the United Kingdom, the Netherlands, Japan, Hong Kong, Singapore and Australia. In these jurisdictions, government regulators and self-regulatory organizations oversee the conduct of our business, and have broad powers to promulgate and interpret laws, rules and regulations that may serve to restrict or limit our business. As a matter of public policy, these regulators are tasked with ensuring the integrity of the financial and securities markets and protecting the interests of investors in those markets generally. Rulemaking by regulators, including resulting market structure changes, has had an impact on our business by directly affecting our method of operation and, at times, our profitability.
As registered trading platforms, broker-dealers, introducing brokers and other types of regulated entities as described below, certain of our subsidiaries are subject to laws, rules and regulations (including the rules of self-regulatory organizations) that cover all aspects of their business, including manner of operation, system integrity, anti-money laundering and financial crimes, handling of material non-public information, safeguarding data, capital requirements, reporting, record retention, market access, licensing of employees and the conduct of officers, employees and other associated persons.
Regulation can impose, and has imposed, obligations on our regulated subsidiaries, including our broker-dealer subsidiaries. These increased obligations require the implementation and maintenance of internal practices, procedures and controls, which have increased our costs. Many of our regulators, as well as other governmental authorities, are empowered to bring enforcement actions and to conduct administrative proceedings, examinations, inspections and investigations, which may result in increased compliance costs, penalties, fines, enhanced oversight, increased financial and capital requirements, additional restrictions or limitations, censure, suspension or disqualification of the entity and/or its officers, employees or other associated persons, or other sanctions, such as disgorgement, restitution or the revocation or limitation of regulatory approvals. Whether or not resulting in adverse findings, regulatory proceedings, examinations, inspections and investigations can require substantial expenditures of time and money and can have an adverse impact on a firm’s reputation, client relationships and profitability. From time to time, we and our associated persons have been and are subject to routine reviews, none of which to date have had a material adverse effect on our businesses, financial
26
condition, results of operations or prospects. As a result of such reviews, we may be required to amend certain internal structures and frameworks, such as our operating procedures, systems and controls.
The regulatory environment in which we operate is subject to constant change. We are unable to predict how certain new laws and proposed rules and regulations will be implemented or in what form, or whether any changes to existing laws, rules and regulations, including the interpretation, implementation or enforcement thereof or a relaxation or amendment thereof, will occur in the future. We believe that uncertainty and potential delays around the final form of certain new rules and regulations may negatively impact our clients and trading volumes in certain markets in which we transact, although a relaxation of or the amendment of existing rules and requirements could potentially have a positive impact in certain markets. While we generally believe the net impact of the laws, rules and regulations may be positive for our business, it is possible that unintended consequences may materially adversely affect us in ways yet to be determined. See Part I, Item 1A. – “Risk Factors — Risks Relating to Our Business and Industry — Our business, and the businesses of many of our clients, could be materially adversely affected by new laws, rules or regulations or changes in existing laws, rules or regulations, including the interpretation and enforcement thereof.”
U.S. Regulation
In the United States, the SEC is the federal agency primarily responsible for the administration of the federal securities laws, including adopting and enforcing rules and regulations applicable to broker-dealers. Two of our broker-dealers operate alternative trading systems subject to the SEC’s Regulation ATS, which includes certain specific requirements and compliance responsibilities in addition to those faced by broker-dealers generally. Broker-dealers are also subject to regulation by state securities administrators in those states in which they conduct business or have registered to do business. We are also subject to the various anti-fraud provisions of the Securities Act, the Exchange Act, the Commodity Exchange Act, certain state securities laws and the rules and regulations promulgated thereunder. We also may be subject to vicarious and controlling person liability for the activities of our subsidiaries and our officers, employees and affiliated persons.
The CFTC is the federal agency primarily responsible for the administration of federal laws governing activities relating to futures, swaps and other derivatives including the adoption of rules applicable to SEFs. Our SEFs are subject to regulations that relate to trading and product requirements, governance and disciplinary requirements, operational capabilities, surveillance obligations and financial information and resource requirements, including the requirement that they maintain sufficient financial resources to cover operating costs for at least one year.
Much of the regulation of broker-dealers’ operations in the United States has been delegated to self-regulatory organizations. These self-regulatory organizations adopt rules (which are generally subject to approval by the SEC) that govern the operations of broker-dealers and conduct periodic inspections and examinations of their operations. In the case of our U.S. broker-dealer subsidiaries, the principal self-regulatory organization is the Financial Industry Regulatory Authority, Inc. (“FINRA”). Accordingly, our U.S. broker-dealer subsidiaries are subject to both scheduled and unscheduled examinations by the SEC and FINRA. In addition, our broker-dealers’ municipal securities-related activities are subject to the rules of the Municipal Securities Rulemaking Board (“MSRB”). In connection with our introducing broker-related activities, we are subject to the oversight of the National Futures Association (“NFA”), a self-regulatory organization that regulates certain CFTC registrants.
Following the 2008 financial crisis, legislators and regulators in the United States adopted new laws and regulations, including the Dodd-Frank Act. Various rules and regulations promulgated following the financial crisis, such as the Volcker Rule and additional bank capital and liquidity requirements, could adversely affect our bank and bank-affiliated dealer clients’ ability to make markets in a variety of products, thereby negatively impacting the level of liquidity and pricing available on our platforms.
In addition, Title VII of the Dodd-Frank Act (“Title VII”) amended the Commodity Exchange Act and the Exchange Act to establish a regulatory framework for swaps, subject to regulation by the CFTC, and security-based swaps, subject to regulation by the SEC. The CFTC has completed the majority of its regulations in this area, most of which are in effect. The SEC has also finalized many of its security-based swap regulations, although a significant number are not yet in effect. Among other things, Title VII rules require certain standardized swaps to be cleared through a central
27
clearinghouse and/or traded on a designated contract market or SEF, subject to various exceptions. Title VII also requires the registration and regulation of certain market participants, including SEFs. As these rules require SEFs to maintain robust front-end and back-office IT capabilities and to make large and ongoing technology investments, and because SEFs may be supported by a variety of voice and auction-based execution methodologies, we expect our hybrid and fully electronic trading capability to perform strongly in such an environment. The SEC has proposed but not yet finalized its rules relating to the registration and regulation of security-based swap execution facilities (“SBSEFs”). If and when the SEC finalizes these rules, we expect that certain of our subsidiaries may be required to register as SBSEFs.
The current administration under President Trump and the Republican Party have sought, and already passed legislation, to roll-back key pieces of the Dodd-Frank Act in an effort to loosen certain regulatory restrictions on financial institutions. Although the current administration has indicated a goal of further reforming aspects of its existing financial services regulations, it is unknown at this time to what extent new legislation will be passed into law or whether pending or new regulatory proposals will be adopted or modified, or what effect such passage, adoption or modification will have, whether positive or negative, on our industry, our clients or us. In particular, there can be no assurance that rules impacting our clients will be amended or repealed.
Non-U.S. Regulation
Outside of the United States, we are currently regulated by: the Financial Conduct Authority (“FCA”) in the United Kingdom, the De Nederlandsche Bank (“DNB”) and the Netherlands Authority for the Financial Markets (“AFM”) in the Netherlands, the Japan Financial Services Agency (the “JFSA”), the Japan Securities Dealers Association (the “JSDA”), the Securities & Futures Commission (the “SFC”) of Hong Kong, the Monetary Authority of Singapore (the “MAS”), the Australian Securities and Investment Commission (the “ASIC”), the Investment Industry Regulatory Organization of Canada and provincial regulators in Canada.
The FCA’s strategic objective is to ensure that the relevant markets function well and its operational objectives are to protect consumers, to protect and enhance the integrity of the UK financial system and to promote effective competition in the interests of consumers. It has investigative and enforcement powers derived from the Financial Services and Markets Act 2000 (“FSMA”) and subsequent legislation and regulations. Subject to section 178 of FSMA, individuals or companies that seek to acquire or increase their control in a firm that the FCA regulates is required to obtain prior approval from the FCA.
The legal framework in the Netherlands for financial undertakings is predominantly included in the Dutch Financial Supervision Act (Wet op het financieel toezicht or “FSA”). The AFM, like the DNB, is an autonomous administrative authority with independent responsibility for fulfilling its supervisory function. Pursuant to section 2:96 of the FSA, the AFM authorizes investment firms. The AFM is legally responsible for business supervision. The DNB is responsible for prudential supervision. The purpose of prudential supervision is to ensure the solidity of financial undertakings and to contribute to the stability of the financial sector. Holders of a qualifying holding (in short, shareholdings or voting rights of 10% or more) must apply to the DNB for a declaration of no objection and satisfy the applicable requirements pursuant to section 3:95 of the FSA. The DNB and the AFM co-operate under the provisions of the FSA and have concluded a covenant on the co-operation and co-ordination of supervision and other related tasks.
Much of our derivatives volumes continue to be executed by non-U.S. based clients outside the United States and is subject to local regulations. In particular, the European Union has enhanced the existing laws and developed new rules and regulations targeted at the financial services industry, including MiFID II and Markets in Financial Instruments Regulation (“MiFIR”), which were implemented in January 2018 and which introduced significant changes to the EU financial markets designed to facilitate more efficient markets and greater transparency for participants.
Among the other aspects of the regulations, MiFID II and MiFIR: (i) require a significant part of the market in certain derivative instruments to trade on regulated trading venues which are subject to transparency regimes, (ii) enhance pre- and post-trade transparency for instruments within the scope of the requirements which have been calibrated for different types of instruments and types of trading, (iii) enhance the transparency of fee structures and access to trading venues, (iv) increase and enhance post-trade reporting obligations with a requirement for “systematic internalisers” to submit certain post-trade data to APAs, (v) provide for the establishment a consolidated tape for certain
28
trade data, (vi) improve technology synchronization and best execution and (vii) enhance investor protection. MiFID II is also intended to help improve the functioning of the EU single market by achieving a greater consistency of regulatory standards. By design, therefore, it is intended that Member States should have very similar regulatory regimes in relation to the matters addressed by MiFID. In addition, the new regulated execution venue category introduced by MiFID II known as the Organized Trading Facility (“OTF”) (in addition to the venue category of Multilateral Trading Facility (“MTF”) for electronic trading) is intended to capture much of the voice and hybrid oriented trading within the EU.
We currently “passport” our UK authorized subsidiary’s FCA regulatory permissions throughout the European Economic Area (“EEA”) and until early 2019 this was our sole MiFID investment firm with such permissions operating in Europe. In March 2017, following the UK’s vote to leave the EU, the UK Prime Minister gave the European Council of the EU formal written notification of the UK’s intention to leave the EU, triggering the withdrawal process under Article 50 of the Lisbon Treaty. Following negotiations, on October 17, 2019 the UK government and the EU Council reached agreement on the terms of the UK’s withdrawal from the EU (the “Withdrawal Agreement”). Following Royal Assent of the European Union (Withdrawal Agreement) Bill and the ratification by the EU Parliament of the Withdrawal Agreement, the UK formally withdrew from the EU on January 31, 2020. The Withdrawal Agreement includes a transitional period, during which the UK continues to be subject to EU laws and remains a member of the single market and customs union, but is not a member state of the EU. The transitional period is due to expire on December 31, 2020, unless extended by the UK/EU Joint Committee established under the Withdrawal Agreement. The maximum possible extension under the Withdrawal Agreement is two years, and the UK has indicated that it does not intend to seek, nor agree to, such an extension.
On October 17, 2019, the UK government and the EU Council also agreed to a political declaration setting out the framework for the future relationship between the UK and the EU. The effects of Brexit will depend on any agreements the UK and EU make, including to retain access to EU markets and vice versa, including for financial services, following the expiry of the transitional period. Negotiations to determine the terms of the future relationship between the UK and the EU, including the terms of access to each other’s financial markets will continue during 2020, will be complex and will be politically uncertain. There is a risk that there is no agreement between the UK and the EU on the terms of their future relationship before the end of the transition period and both the EU and the UK have been preparing for such a “hard” Brexit, or “no-deal” scenario. See Part I, Item 1A. –“Risk Factors — Risks Relating to our Business and Industry —The United Kingdom’s exit from the European Union could have a material adverse effect on our business, financial condition and results of operations.” We are making all reasonable preparations to ensure, in any scenario, that services can continue to be provided in the UK and throughout the EEA, post-Brexit. Accordingly, we have established a legal entity in the Netherlands, Tradeweb EU B.V., which offers services from a new Amsterdam office. We received approval in early 2019 from Dutch regulatory authorities to operate an MTF, an OTF and an APA, essentially replicating our current UK regulatory permissions, including “passports” throughout the EEA. As a result of this approval, since early 2019 we have operated two MTFs, two OTFs and two APAs in Europe, increasing the complexity of the business.
Capital Requirements
Certain of our subsidiaries are subject to jurisdiction specific regulatory capital requirements, designed to maintain the general financial integrity and liquidity of a regulated entity. In general, they require that at least a minimum amount of a regulated entity’s assets be kept in relatively liquid form. Failure to maintain required minimum capital may subject a regulated subsidiary to a fine, requirement to cease conducting business, suspension, revocation of registration or expulsion by the applicable regulatory authorities, and ultimately could require the relevant entity’s liquidation. As of December 31, 2019, each of our regulated subsidiaries had maintained sufficient net capital or financial resources to at least satisfy their minimum requirements. See Note 19—Regulatory Capital Requirements to our audited consolidated financial statements included elsewhere in this Annual Report on Form 10-K.
Regulatory Status of Tradeweb Entities
Our operations span jurisdictions across North America, Europe and Asia, and we operate through various regulated entities. The current regulatory status of our regulated entities is described below.
29
Tradeweb LLC is a SEC-registered broker-dealer and a member of FINRA and MSRB. Tradeweb LLC is also a CFTC-registered introducing broker and a member of NFA. Tradeweb LLC relies on the international dealer exemption in the Canadian provinces of Ontario, Alberta, and Manitoba, and is recognized as a foreign trading venue in Switzerland.
TW SEF LLC is a CFTC-registered SEF. TW SEF LLC is formally exempt from registration as an exchange in the Canadian provinces of Alberta, Ontario and Quebec and is recognized as a foreign trading venue in Switzerland. TW SEF LLC is formally exempt from registration by the ASIC with a pending application with ASIC for an Overseas Australian Market Operator Licensee.
Dealerweb Inc. is an SEC-registered broker-dealer, operates an ATS and is a member of FINRA and MSRB. Dealerweb Inc. is also a CFTC-registered introducing broker and a member of NFA. Dealerweb Inc. is recognized as a foreign trading venue in Switzerland. Dealerweb relies on the international dealer exemption in the Canadian province of Ontario.
DW SEF LLC is a CFTC-registered SEF. DW SEF LLC is formally exempt from registration in the Canadian province of Ontario and is recognized as a foreign trading venue in Switzerland.
Tradeweb Direct LLC is an SEC-registered broker-dealer, operates an ATS and is a member of FINRA and MSRB. Tradeweb Direct LLC relies on the international dealer exemption in the Canadian provinces of Ontario and Quebec.
Tradeweb Europe Limited is authorized and regulated in the United Kingdom by the FCA as a MiFID Investment Firm. It has permissions to operate an MTF, an OTF and an APA. Tradeweb Europe Limited passports its permissions under MiFID and accordingly provides services throughout the EEA. In addition, Tradeweb Europe Limited is also registered with the CFTC as an introducing broker and is a member of NFA. Tradeweb Europe Limited is also regulated by ASIC and holds an Overseas Australian Market Operator License.
The Singapore branch of Tradeweb Europe Limited is regulated by the MAS as a Recognised Market Operator (“RMO”).
The Hong Kong branch of Tradeweb Europe Limited is regulated by the SFC as an Automated Trading Service.
Tradeweb Commercial Information Consulting (Shanghai) Co., Ltd. is a wholly-owned foreign enterprise (WOFE) in China for the purpose of providing consulting and marketing activities in China. The Tradeweb offshore electronic trading platform is recognized by the People’s Bank of China (PBOC) for the provision of Bond Connect.
Tradeweb Japan KK is regulated by the JFSA and is registered as a Type 1 Financial Instruments Exchange Business Operator (reg. Kanto Local Finance Bureau (Kinsho) No.2997) pursuant to which it has been granted a Proprietary Trading System (PTS) Operator License. It is also a notified Electronic Trading Platform (ETP) operator for IRS intermediary business. Tradeweb Japan KK is a member of the JSDA, which is an authorized self-regulatory body under the Financial Instruments and Exchange Law of Japan, the governing law of the financial services industry in Japan.
Tradeweb EU B.V. is authorized and regulated by the DNB and AFM as a MiFID Investment Firm with permissions to operate an MTF and an OTF. Tradeweb EU B.V. passports its permissions under MiFID and accordingly provides services throughout the EU and the EEA. Tradeweb EU B.V. is also regulated by ASIC and holds an Overseas Australian Market Operator License.
Employees
As of December 31, 2019, we had 919 employees, 676 of whom were based in the United States and 243 of whom were based outside of the United States. None of our employees are represented by a labor union. We consider our relationships with our employees to be good and have not experienced any interruptions of operations due to labor disagreements.
30
Our Organizational Structure
Tradeweb Markets Inc. was incorporated in Delaware in November 2018. As a result of the Reorganization Transactions completed in connection with the IPO, Tradeweb Markets Inc. became a holding company whose only material assets consist of its equity interest in Tradeweb Markets LLC and related deferred tax assets. As the sole manager of Tradeweb Markets LLC, Tradeweb Markets Inc. operates and controls all of the business and affairs of Tradeweb Markets LLC and, through Tradeweb Markets LLC and its subsidiaries, conducts its business. As a result of this control, and because Tradeweb Markets Inc. has a substantial financial interest in Tradeweb Markets LLC, Tradeweb Markets Inc. consolidates the financial results of Tradeweb Markets LLC and its subsidiaries. For more information regarding our organizational structure, see Note 1 – Organization and Note 11 – Stockholders’ Equity to our audited consolidated financial statements included elsewhere in this Annual Report on Form 10-K.
LSEG Transaction
On August 1, 2019, London Stock Exchange Group plc announced that it has agreed to definitive terms with a consortium including certain investment funds affiliated with Blackstone as well as Thomson Reuters to acquire the Refinitiv business in an all share transaction for a total enterprise value of approximately $27 billion. The LSEG Transaction is subject to customary regulatory approvals and closing conditions, and is expected to close during the second half of 2020. There can be no assurance that the LSEG Transaction will be consummated on the expected timing or at all.
If the LSEG Transaction is consummated, any change of control of Refinitiv could in turn affect us, because Refinitiv is our controlling shareholder. However, following the consummation of the LSEG Transaction, Tradeweb is expected to remain a standalone, publicly-traded company, and we do not expect the LSEG Transaction to result in any changes to our stockholder voting rights in the near-term, and we do not foresee any material impact on our strategy, day-to-day operations or Tradeweb management as a result of the LSEG Transaction. Our existing market data license agreement with Refinitiv is also expected to remain unchanged immediately following the consummation of the LSEG Transaction, however the non-compete period applicable to Refinitiv in their restrictive covenant agreement with us is expected to terminate immediately following the consummation of the LSEG Transaction.
Available Information
Our internet website address is www.tradeweb.com. Through our internet website, we will make available, free of charge, the following reports as soon as reasonably practicable after electronically filing them with, or furnishing them to, the SEC: our Annual Report on Form 10-K; our Quarterly Reports on Form 10-Q; our Current Reports on Form 8-K; and amendments to those reports filed or furnished pursuant to Section 13(a) of the Exchange Act. Our Proxy Statements for our Annual Meetings are also available through our internet website. Our internet website and the information contained therein or connected thereto are not intended to be incorporated into this Annual Report on Form 10-K.
Investors and others should note that we announce material financial and operational information using our investor relations website, press releases, SEC filings and public conference calls and webcasts. Information about Tradeweb, our business and our results of operations may also be announced by posts on Tradeweb’s accounts on the following social media channels: Instagram, LinkedIn and Twitter. The information that we post through these social media channels may be deemed material. As a result, we encourage investors, the media and others interested in Tradeweb to monitor these social media channels in addition to following our press releases, SEC filings and public conference calls and webcasts. These social media channels may be updated from time to time on our investor relations website.
Investing in our Class A common stock involves a high degree of risk. You should carefully consider the following risks, together with all of the other information contained in this Annual Report on Form 10-K, before deciding to invest in our Class A common stock. Our business, financial condition and results of operations could be materially adversely affected by any of these risks or uncertainties. In that case, the trading price of our Class A common stock could decline, and you may lose all or part of your investment.
31
Risks Relating to Our Business and Industry
Economic, political and market conditions may reduce trading volumes, which could have a material adverse effect on our business, financial condition and results of operations.
The electronic financial services industry is, by its nature, risky and volatile. Our business performance is impacted by a number of global and regional factors that are generally beyond our control. The occurrence of, or uncertainty related to, any one of the following factors may cause a substantial decline in the U.S. and/or global financial markets, which could result in reduced trading volumes and profitability for our business:
|
· |
economic, political and social conditions in the United States, the United Kingdom, the European Union and/or its member states, China or other major economies around the world, including, among other things, the strength and direction of the U.S. and/or global economy, the exit by the United Kingdom from the European Union (“Brexit”), the prolonged shutdown of the U.S. government and the upcoming 2020 U.S. presidential election; |
|
· |
the effect of Federal Reserve Board and other central banks’ monetary policy, increased capital requirements for banks and other financial institutions and other regulatory requirements; |
|
· |
adverse market conditions, including unforeseen market closures or other disruptions in trading; |
|
· |
broad trends in business and finance, including the amount of new issuances and changes in investment patterns and priorities; |
|
· |
the level and volatility of interest rates; |
|
· |
consolidation or contraction in the number, and changes in the financial strength, of market participants; |
|
· |
concerns over a potential recession (in the United States or globally), inflation and weakening consumer and investor confidence levels; |
|
· |
the availability of capital for borrowings and investments by our clients; |
|
· |
liquidity concerns, including concerns over credit default or bankruptcy of one or more sovereign nations or corporate entities; |
|
· |
legislative, regulatory or government policy changes, including changes to financial industry regulations and tax laws that could limit the ability of market participants to engage in a wider array of trading activities; |
|
· |
actual or threatened trade war, including between the United States and China, or other governmental action related to tariffs, international trade agreements or trade policies; and |
|
· |
catastrophic events, such as natural disasters, extreme weather events, actual or threatened acts of war, terrorism or other armed hostilities or outbreaks of pandemic or contagious diseases, such as Ebola, Zika, avian flu, severe acute respiratory syndrome (SARS), H1N1 (swine flu), the coronavirus, and Middle East Respiratory Syndrome (MERS). |
These factors also affect the degree of volatility (the magnitude and frequency of fluctuations) in the U.S. and/or global financial markets, including in the prices and trading volumes of the products traded on our platforms. Volatility increases the need to hedge price risk and creates opportunities for investment and speculative or arbitrage trading, and thus increases trading volumes. Although we generally experience increased trading volumes across our marketplaces during periods of volatility, use of our platforms and demand for our solutions may decline during periods of significant volatility as market participants in rapidly moving markets may seek to negotiate trades and access information directly over the telephone instead of electronically.
In the event of stagnant or deteriorating economic conditions or periods of instability or prolonged stability or decreased activity in the U.S. and/or global financial markets, we could experience lower trading volumes. A general decline in trading volumes across our marketplaces would lower revenues and could materially adversely affect our results of operations if we are unable to offset falling volumes through changes in our fee structure. If trading volumes decline substantially or for a sustained period, the critical mass of transaction volume necessary to support viable markets and generate valuable data could be jeopardized, which, in turn, could further discourage clients to use our platforms and solutions and further accelerate the decline in trading volumes. Additionally, if our total market share decreases relative to our competitors, our trading venues may be viewed as less attractive sources of liquidity. If our
32
marketplaces are perceived to be less liquid, we could lose further trading volumes and our business, financial condition and results of operations could be materially adversely affected.
There have been significant declines in trading volumes in the financial markets generally in the past and there may be similar declines in trading volumes generally or across our marketplaces in particular in the future. During periods of lower trading volumes or during an economic downturn, our clients may become more price sensitive and exert pricing pressure on us, and we may be forced to reduce our fees or to maintain our fees during periods of increased costs. Because our cost structure is largely fixed, if use of our platforms and demand for our solutions decline for any reason or if we are forced to reduce fees, we may not be able to adjust our cost structure to counteract the associated decline in revenues, which would materially harm our profitability.
Failure to compete successfully could materially adversely affect our business, financial condition and results of operations.
We face intense competition in both the financial services industry generally and the markets that we serve in particular, and we expect competition with a broad range of competitors to continue to intensify in the future. Within the electronic financial services industry in which we operate, we compete based on our ability to provide a broad range of solutions, trading venues with a broad network of market participants and deep liquidity, a competitive fee structure and comprehensive pre-trade, trade and post-trade functionality, as well as the reliability, security and ease of use of our platforms and solutions.
We primarily compete with other electronic trading platforms and trading business conducted directly between dealers and their institutional, wholesale and retail client counterparties over telephone, email or instant messaging. We also compete with securities and futures exchanges, other inter-dealer brokers and single bank systems. For example, our trading platforms face existing and potential competition from large exchanges, which have in recent years developed electronic capabilities in-house or through acquisitions. We also face competition from individual banks that offer their own electronic platforms to their institutional clients. In addition, we may face competition from companies with strong market share in specific markets or organizations and businesses that have not traditionally competed with us but that could adapt their products and services or utilize significant financial and information resources, recognized brands, or technological expertise to begin competing with us. We expect that we may compete in the future with a variety of companies with respect to our platforms and solutions. If we are not able to compete successfully in the future, our business, financial condition and results of operations could be materially adversely affected.
Certain of our current and prospective competitors are substantially larger than we are and have substantially greater market presence than we do, as well as greater financial, technological, marketing and other resources. These competitors may be better able to withstand reductions in fees or other adverse economic or market conditions than we can. Some competitors may be able to adopt new or emerging technologies, or incorporate customized features or functions into existing technologies, to address changing market conditions or client preferences at a relatively low cost and/or more quickly than we can. In addition, because we operate in a rapidly evolving industry, start-up companies can enter the market with new and emerging technologies more easily and quickly than they would in more traditional industries. If we are unable or unwilling to reduce our fees or make additional investments in the future, we may lose clients and our competitive position may be adversely affected. In addition, our competitive position may be adversely affected by changes in regulations that have a disproportionately negative affect on us or the products or trading protocols we offer our clients.
Competition in the markets in which we operate has intensified due to consolidation, which has resulted in increasingly large and sophisticated competitors. In recent years, our competitors have made acquisitions and/or entered into joint ventures and consortia to improve the competitiveness of their electronic trading offerings. For example, ICE acquired BondPoint, TMC Bonds and IDC, in an effort to expand its portfolio of fixed income products and services. In addition, in 2018, CME Group completed its acquisition of NEX Group, which expands CME Group’s offerings to include NEX Group’s OTC foreign exchange and rates products and market data. If, as a result of industry consolidation, our competitors are able to offer lower cost (including fixed cost fees compared to our variable fees for certain offerings) and/or a wider range of trading venues and solutions, obtain more favorable terms from third-party providers or
33
otherwise take actions that could increase their market share, our competitive position and therefore our business, financial condition and results of operations may be materially adversely affected.
Our operations also include the sale of pre- and post-trade services, analytics and market data (including through a distribution agreement with Refinitiv). There is a high degree of competition among market data and information vendors in solutions for pre- and post-trade data, analytics and reporting, and such businesses may become more competitive in the future as new competitors emerge. Some of these companies are already in or may enter the electronic trading business. Accordingly, some of our competitors may be able to combine use of their electronic trading platforms with complementary access to market data and analytical tools and/or leverage relationships with existing clients to obtain additional business from such clients, which could preempt use of our platforms or solutions. For example, Bloomberg and ICE have trading platforms that compete with ours and also have data and analytics relationships with the vast majority of institutional, wholesale and retail market participants. If we are not able to compete successfully in this area in the future, our revenues could be adversely impacted and, as a result, our business, financial condition and results of operations would be materially adversely affected.
The industry in which we operate is rapidly evolving. If we are unable to adapt our business effectively to keep pace with industry changes, we may not be able to compete effectively, which could have a material adverse effect on our business, financial condition and results of operations.
The electronic financial services industry is characterized by rapidly changing and increasingly complex technologies and systems, changing and increasingly sophisticated client demands (including access to new technologies and markets), frequent technology and service introductions, evolving industry standards, changing regulatory requirements and new business models. If we are not able to keep pace with changing market conditions or client demands and if our competitors release new technology before we do, our existing platforms, solutions and technologies may become obsolete or our competitive position may be materially harmed, each of which could have a material adverse effect on our business, financial condition and results of operations.
Operating in a rapidly evolving industry involves a high degree of risk and our future success will depend in part on our ability to:
|
· |
enhance and improve the responsiveness, functionality, accessibility and reliability of our existing platforms and solutions; |
|
· |
develop and/or license new platforms, solutions and technologies that address the increasingly sophisticated and varied needs of our existing and prospective clients, and that allow us to grow within our existing markets and to expand into new markets, asset classes and products; |
|
· |
achieve and maintain market acceptance for our platforms and solutions; |
|
· |
adapt our existing platforms and solutions for new markets, asset classes and products; |
|
· |
respond to competitive pressures, technological advances, including new or disruptive technology, emerging industry standards and practices and regulatory requirements and changes on a cost-effective and timely basis; |
|
· |
attract highly-skilled technology, regulatory, sales and marketing personnel; |
|
· |
operate, support, expand, adapt and develop our operations, systems, networks and infrastructure; |
|
· |
manage cybersecurity threats; |
|
· |
take advantage of acquisitions, strategic alliances and other opportunities; and |
|
· |
obtain any applicable regulatory approval for our platforms and solutions. |
Further, the development of new internet, networking, telecommunications or blockchain technologies may require us to devote substantial resources to modify and adapt our marketplaces. In particular, because our platforms and solutions are designed to operate on a variety of electronic systems, we will need to continuously modify and enhance our marketplaces to keep pace with changes in internet-related hardware and other software, communication and browser technologies. We cannot assure you that we will be able to successfully adapt our existing technologies and systems to incorporate new, or changes to existing, technologies.
The success of new platforms or solutions, or new features and versions of existing platforms and solutions, depends on several factors, including the timely and cost-effective completion, introduction and market acceptance of such new or enhanced platform or solution. Development efforts entail significant technical and business risks. We may use new
34
technologies ineffectively, fail to adequately address regulatory requirements, experience design defects or errors or fail to accurately determine market demand for new platforms, solutions and enhancements. Furthermore, development efforts may require substantial expenditures and take considerable time, and we may experience cost overrun, delays in delivery or performance problems and not be successful in realizing a return on these development efforts in a timely manner or at all.
We cannot assure you that we will be able to anticipate or respond in a timely manner to changing market conditions, and new platforms, technologies or solutions, or enhancements to existing platforms, technologies or solutions, may not meet regulatory requirements, address client needs or achieve market acceptance. If we are not able to successfully develop and implement, or face material delays in introducing, new platforms, solutions and enhancements, our clients may forego the use of our platforms and solutions and instead use those of our competitors. Any failure to remain abreast of changing market conditions and to be responsive to market preferences could cause our market share to decline and materially adversely impact our revenues.
Consolidation and concentration in the financial services industry could materially adversely affect our business, financial condition and results of operations.
There has been significant consolidation in the financial services industry over the past several years. Further consolidation in the financial services industry could result in a smaller client base and heightened competition, which may lower our trading volumes. If our clients merge with or are acquired by other companies that are not our clients, or companies that use less of our offerings, such clients may discontinue or reduce their use of our platforms and solutions. Any such developments could materially adversely affect our business, financial condition and results of operations.
The substantial consolidation of market share among companies in the financial services industry has resulted in concentration in markets by some of our largest dealer clients. Because our trading platforms depend on these clients, any event that impacts one or more of these clients or the financial services industry in general could negatively impact our trading volumes and revenues. For example, current financial regulations impose certain capital requirements on, and restrict certain trading activities by, our dealer clients, which could adversely affect such clients’ ability to make markets across a variety of asset classes and products. If our existing dealer clients reduce their trading activity and that activity is not replaced by other market participants, the level of liquidity and pricing available on our trading platforms would be negatively impacted, which could materially adversely affect our business, financial condition and results of operations. In addition, some of our dealer clients have announced plans to reduce their sales and trading businesses in the markets in which we operate. This is in addition to the significant reductions in these businesses already completed by certain of our dealer clients.
The consolidation and concentration of market share, the limitation on the ability of large clients to engage in a wider array of trading activities and the reduction by large clients of certain businesses may lead to increased revenue concentration among our dealer clients, which may further increase our dependency on such clients and reduce our ability to negotiate pricing and other matters with such clients. Additionally, the sales and trading global market share has become increasingly concentrated over the past several years among the top investment banks, which will increase competition for client trades and place additional pricing pressure on us. If we are not able to compete successfully, our business, financial condition and results of operations could be materially adversely affected.
We are dependent on our dealer clients, some of which are also stockholders, to support our marketplaces by transacting with our other institutional, wholesale and retail clients.
We rely on our dealer clients to provide liquidity on our trading platforms by posting prices on our platforms and responding to client inquiries, and some of our dealer clients may account for a significant portion of our total trading volume. In addition, our dealer clients also provide us with data via feeds and through the transactions they execute on our trading platforms, which is an important input for our data and analytics offerings. We have historically earned a substantial portion of our revenues from dealer clients that are also stockholders. For the year ended December 31, 2019, the combined year ended December 31, 2018 and the year ended December 31, 2017, 44.8%, 42.2% and 41.3%, respectively, of our revenues were generated by the pre-IPO Bank Stockholders and their affiliates. Market knowledge
35
and feedback from these stockholders have been important factors in the development of many of our offerings and solutions.
There are inherent risks whenever a significant percentage of our trading volume and revenues are concentrated with a limited number of clients, and these risks are especially heightened for us due to the potential effects of increased industry consolidation and financial regulation on our business. The contractual obligations of our clients to us are non-exclusive and subject to termination rights by such clients. Any failure by us to meet a key dealer client’s or other key client’s expectations could result in cancellation or non-renewal of the contract. In addition, our reliance on any individual dealer client for a significant portion of our trading volume may also give that client a degree of leverage against us when negotiating contracts and terms of services with us.
Our dealer clients also buy and sell through traditional methods, including by telephone, e-mail and instant messaging, and through other trading platforms. Some of our dealer clients have developed electronic trading networks that compete with us or have announced their intention to explore the development of such electronic trading networks, and many of our dealer clients are involved in other ventures, including other trading platforms or other distribution channels, as trading participants and/or as investors. In particular, certain of the pre-IPO Bank Stockholders or their affiliates, as is typical for a large number of major banks, have their own single bank or other competing trading platform and frequently invest in such businesses and may acquire ownership interests in similar businesses, and such businesses may also compete with us. These competing trading platforms may offer some features that we do not currently offer or that we are unable to offer, including customized features or functions. Accordingly, there can be no assurance that such dealer clients’ primary commitments will not be to one of our competitors or that they will not continue to rely on their own trading platforms or traditional methods instead of using our trading platforms.
Although we have established and maintain significant long-term relationships with our key dealer clients, we cannot assure you that all of these relationships will continue or will not diminish. In addition, it is possible that the pre-IPO Bank Stockholders and their affiliates may reduce their use of our trading platforms or their engagement with us in the future due to reductions in the level of their equity ownership following any completed or future offering. Any reduction in the use of our trading platforms by our key dealer clients, including certain of the pre-IPO Bank Stockholders and their affiliates, for any reason, and any associated decrease in the pool of capital and liquidity accessible across our marketplaces, could reduce the volume of trading on our platforms, which could, in turn, reduce the use of our platforms by their counterparty clients. In addition, any decrease in the number of dealer clients competing for trades on our trading platforms, could cause our dealer clients to forego use of our platforms and instead use platforms that provide access to more competitive trading environments and prices. The occurrence of any of the foregoing may have a material adverse effect on our business, financial condition and results of operations.
We do not have long-term contractual arrangements with most of our liquidity taking clients, and our trading volumes and revenues could be reduced if these clients stop using our platforms and solutions.
Our business largely depends on certain of our liquidity taking clients to initiate inquiries on our trading platforms. A limited number of such clients can account for a significant portion of our trading volumes, which in turn, results in a significant portion of our transaction fees. Most of our liquidity taking clients do not have long-term contractual arrangements with us and utilize our platforms and solutions on a transaction-by-transaction basis and may choose not to use our platforms at any time. These clients buy and sell a variety of products within various asset classes using traditional methods, including by telephone, e-mail and instant messaging, and through other trading platforms. Any significant loss of these clients or a significant reduction in their use of our platforms and solutions could have a material negative impact on our trading volumes and revenues, and materially adversely affect our business, financial condition and results of operations.
Our business could be harmed if we are unable to maintain and grow the capacity of our trading platforms, systems and infrastructure.
Our success depends on our clients’ confidence in our ability to provide reliable, secure, real-time access to our trading platforms. If our trading platforms cannot cope, or expand to cope, with demand, or otherwise fail to perform, we could experience disruptions in service, slow delivery times and insufficient capacity. These consequences could result
36
in our clients deciding to stop using or to reduce their use of our trading platforms, either of which would have a material adverse effect on our business, financial condition and results of operations.
We will need to continually improve and upgrade our trading platforms, systems and infrastructure to accommodate increases in trading volumes, trading practices of new and existing clients, irregular or heavy use of our trading platforms, especially during peak trading times or at times of increased market volatility, regulatory changes and the development of new and enhanced trading platform features, functionalities and ancillary solutions. The maintenance and expansion of our trading platforms, systems and infrastructure has required, and will continue to require, substantial financial, operational and technical resources. As our operations grow in both size and scope, these resources will typically need to be committed well in advance of any potential increase in trading volumes. We cannot assure you that our estimates of future trading volumes will be accurate or that our systems will always be able to accommodate actual trading volumes without failure or degradation of performance, especially during periods of abnormally high volumes. If we do not successfully adapt our existing trading platforms, systems and infrastructure to the requirements of our clients or to emerging industry standards, or if our trading platforms otherwise fail to accommodate trading volumes, our business, financial condition and results of operations could be materially adversely affected.
If we experience design defects, errors, failures or delays with our platforms or solutions, our business could suffer serious harm.
Despite testing, our platforms and solutions may contain design defects and errors or fail when first introduced or when major new updates or enhancements are released. In our development of new platforms, platform features and solutions or updates and enhancements to our existing platforms and solutions, we may make a design error that causes the platform or solution to fail or operate incorrectly or less effectively. Many of our solutions also rely on data and services provided by third-party providers over which we have no or limited control and may be provided to us with defects, errors or failures. Our clients may also use our platforms and solutions together with their own software, data or products from other companies. As a result, when problems occur, it might be difficult to identify the source of the problem. In addition, we could experience delays while developing and introducing new or enhanced platforms, platform features and solutions, primarily due to difficulties in technology development, obtaining any applicable regulatory approval, licensing data inputs or adapting to new operating environments.
If design defects, errors or failures are discovered in our current or future platforms or solutions, we may not be able to correct or work around them in a cost-effective or timely manner or at all. The existence of design defects, errors, failures or delays that are significant, or are perceived to be significant, could also result in rejection or delay in market acceptance of our platforms or solutions, damage to our reputation, loss of clients and related revenues, diversion of resources, product liability claims, regulatory actions or increases in costs, any of which could materially adversely affect our business, financial condition or results of operations.
Systems failures, interruptions, delays in service, catastrophic events and resulting interruptions in the availability of our platforms or solutions could materially harm our business and reputation.
Our business depends on the efficient and uninterrupted operation of our systems, networks and infrastructure, in particular those that power our platforms and solutions. From time to time, we have experienced, and we cannot assure you that we, or our third-party providers, will not experience, systems failures, delays in service or business interruptions. Our systems, networks, infrastructure and other operations, in particular our platforms and solutions, are vulnerable to impact or interruption from a wide variety of causes, including: irregular or heavy use of our trading platforms and related solutions during peak trading times or at times of increased market volatility; power, internet or telecommunications failures; hardware failures or software errors; human error, acts of vandalism or sabotage; catastrophic events, such as natural disasters, extreme weather events or acts of war, terrorism or other armed hostilities; malicious cyberattacks or cyber incidents, such as unauthorized access, ransomware, loss or destruction of data, computer viruses or other malicious code; and the loss or failure of systems over which we have no control, such as loss of support services from critical third-party providers. In addition, we may also face significant increases in our use of power and data storage and may experience a shortage of capacity and/or increased costs associated with such usage.
37
Any failure of, or significant interruption, delay or disruption to, or security breaches affecting, our systems, networks or infrastructure could result in: disruption to our operations, including disruptions in service to our clients; slower response times; distribution of untimely or inaccurate market data to clients who rely on this data for their trades; delays in trade execution; incomplete or inaccurate accounting, recording or processing of trades; significant expense to repair, replace or remediate systems, networks or infrastructure; financial losses and liabilities to clients; loss of clients; or legal or regulatory claims, proceedings, penalties or fines. Any system failure or significant interruption, delay or disruption in our operations, or decreases in the responsiveness of our platforms and solutions, could materially harm our reputation and business and lead our clients to decrease or cease their use of our platforms and solutions, particularly our trading platforms.
We internally support and maintain many of our systems and networks, including those underlying our trading platforms; however, we may not have sufficient personnel to properly respond to all systems, networks or infrastructure problems. Our failure to monitor or maintain our systems, networks and infrastructure, including those maintained or supported by our third-party providers, or to find a replacement for defective or obsolete components within our systems, networks and infrastructure in a timely and cost-effective manner when necessary, would have a material adverse effect on our business, financial condition and results of operations. While we generally have disaster recovery and business continuity plans that utilize industry standards and best practices for much of our business, including redundant systems, networks, computer software and hardware and data centers to address interruption to our normal course of business, our systems, networks and infrastructure may not always be fully redundant and our disaster recovery and business continuity plans may not always be sufficient or effective. Similarly, although some contracts with our third-party providers, such as our hosting facility providers, require adequate disaster recovery or business continuity capabilities, we cannot be certain that these will be adequate or implemented properly. Our disaster recovery and business continuity plans are heavily reliant on the availability of the internet and mobile phone technology, so any disruption of those systems would likely affect our ability to recover promptly from a crisis situation. If we are unable to execute our disaster recovery and business continuity plans, or if our plans prove insufficient for a particular situation or take longer than expected to implement in a crisis situation, it could have a material adverse effect on our business, financial condition and results of operations, and our business interruption insurance may not adequately compensate us for losses that may occur.
In addition, high-profile system failures in the electronic financial services industry, whether or not involving us directly, could negatively impact our business. In recent years, U.S. and foreign regulators have imposed new requirements on operations such as ours that have been costly for us to implement and that could result in a decrease in the use of our platforms and demand for some of our solutions or result in regulatory investigations, fines and penalties. For example, the SEC’s Regulation Systems Compliance and Integrity and the system safeguards regulations of the CFTC subject portions of our trading platforms and other technological systems related to our SEFs to more extensive regulation and oversight. Ensuring our compliance with these regulations requires significant ongoing costs and there can be no assurance that government regulators will not impose additional costly obligations on us in the future. If system failures in the industry continue to occur, it is possible that confidence in the electronic financial services industry could diminish, leading to materially decreased trading volumes and revenues.
Actual or perceived security vulnerabilities in our systems, networks and infrastructure, breaches of security controls, unauthorized access to confidential information or cyber-attacks could harm our business, reputation and results of operations.
Our business relies on technology and automation to perform significant functions within our firm. Because of our reliance on technology, we are susceptible to various cyber-threats to our systems, networks and infrastructure, in particular those that power our platforms and solutions. Similar to other financial services companies that provide services online, we have experienced, and likely will continue to experience, cyber-threats, cyber-attacks and attempted security breaches. Cyber-threats and cyber-attacks vary in technique and sources, are persistent, frequently change and increasingly are more sophisticated, targeted and difficult to detect and prevent against. These threats and attacks may come from external sources such as governments, crime organizations, hackers and other third parties or may originate internally from an employee or a third-party provider, and can include unauthorized attempts to access, disable, improperly modify or degrade our information, systems, networks and infrastructure or the introduction of computer viruses and other malicious codes and fraudulent “phishing” emails that seek to misappropriate data and information or
38
install malware onto users’ computers. We carry what we believe are sufficient levels of cyber insurance. However, if one or more cyber-attacks occur, it could jeopardize the confidential, proprietary and other information processed and stored in, and transmitted through, our systems and networks, or cause interruptions, significant delays, failures or malfunctions in our systems, networks, infrastructure and other operations, in particular our platforms and solutions, which could result in reputational damage, financial losses, client dissatisfaction and/or regulatory fines and penalties, which may not in all cases be covered by insurance.
While we have dedicated personnel who are responsible for maintaining our cybersecurity program and training our employees on cybersecurity, and while we utilize third-party technology product and services to help identify, protect and remediate our systems, networks and infrastructure, our defensive measures and security controls may not be adequate or effective to prevent, identify or mitigate cyber-attacks or security breaches. We are also dependent on security measures, if any, that our third-party providers and clients take to protect their own systems, networks and infrastructures. Because techniques used to obtain unauthorized access to, or to sabotage, systems, networks and infrastructures change frequently and generally are not recognized until launched against a target, we may be unable to anticipate these techniques or to implement adequate defensive measures or security controls. Additionally, we may be required in the future to incur significant costs to continue to minimize, mitigate against or alleviate the effects of cyber-attacks, security breaches or other security vulnerabilities and to protect against damage caused by cyber-attacks, security breaches or other disruptions that may occur.
We have a Risk Steering Committee that includes the heads of Risk Management, Information / Cyber Security, Regulatory Compliance and Human Resources. Our information / cyber security program is overseen internally by our Risk Steering Committee (and specifically, our Chief Risk Officer and Chief Information Security Officer), which in turn, is overseen by our board of directors and audit committee. Senior members of the Risk Steering Committee provide regular updates to our audit committee and the board of directors.
There have been an increasing number of cyber-attacks in recent years in various industries, including ours, and cybersecurity risk management has been the subject of increasing focus by U.S. and foreign regulators. As a result, we may be required to devote significant additional financial, operational and technical resources to modify and enhance our defensive measures and security controls and to identify and remediate any security vulnerabilities. In addition, any adverse regulatory actions that may result from a cybersecurity incident or a finding that we have inadequate defensive measures and security controls, could result in reputational harm.
Although we have not been a victim of a cyber-attack or other cybersecurity incident that has had a material impact on our operations or financial condition, we have from time to time experienced cybersecurity incidents, including attempted distributed denial of service attacks, malware infections, phishing and other information technology incidents that are typical for an electronic financial services company of our size. If an actual, threatened or perceived cyber-attack or breach of our security occurs, our clients could lose confidence in our platforms and solutions, security measures and reliability, which would materially harm our ability to retain existing clients and gain new clients. As a result of any such attack or breach, we may be required to expend significant resources to repair system, network or infrastructure damage and to protect against the threat of future cyber-attacks or security breaches. We could also face litigation or other claims from impacted individuals as well as substantial regulatory sanctions or fines.
We rely on third parties to perform certain key functions, and their failure to perform those functions could result in the interruption of our operations and systems and could result in significant costs and reputational damage to us.
We rely on a number of third parties to supply, support and maintain critical elements of our operations, including our trading, information, technology and other systems. In addition, we depend on third parties, such as telephone companies, online service providers, hosting services and software and hardware vendors, for various computer and communications systems, such as our data centers, telecommunications access lines and certain computer software and hardware. Our clients also depend on third-party middleware and clearinghouses for clearing and settlement of certain trades on our trading platforms, which could impact our trading platforms.
39
We cannot assure you that any of these third-party providers will be able or willing to continue to provide these products and services in an efficient, cost-effective or timely manner, or at all, or that they will be able to adequately expand their services to meet our needs. In particular, like us, third-party providers are vulnerable to operational and technological disruptions, and we may have limited remedies against these third parties in the event of product or service disruptions. In addition, we have little control over third-party providers, which increases our vulnerability to errors, failures, interruptions or disruptions or problems with their products or services. Further, the priorities and objectives of third-party providers may differ from ours, which may make us vulnerable to terminations of, or adverse changes to, our arrangements with such providers, and there can be no assurance that we will be able to maintain good relationships or the same terms with such providers. If an existing third-party provider is unable or unwilling to provide a critical product or service, and we are unable to make alternative arrangements for the supply of such product or service on commercially reasonable terms or a timely basis, or at all, our business, financial condition and results of operations could be materially adversely affected.
Further, we also face risks that providers may perform work that deviates from our standards. Moreover, our existing third-party arrangements may bind us for a period of time to terms that become uncompetitive or technology and systems that become obsolete. If we do not obtain the expected benefits from our relationships with third-party providers, we may be less competitive, which could have a material adverse effect on our business, financial condition and results of operations. In the future, if we choose to transition a function previously managed by us to a third party, we may spend significant financial and operational resources and experience delays in completing such transition, and may never realize any of the anticipated benefits of such transition.
We are dependent on third parties for our pre- and post-trade data, analytics and reporting solutions.
The success of our trading platforms depends in part on our pre- and post-trade data, analytics and reporting solutions. We depend upon data and information services from external sources, including data received from certain competitors, clients, self-regulatory organizations and other third-party data providers for information used on our platforms and by our solutions, including our data, analytical tools and other pre- and post-trade services. In particular, we depend on Refinitiv to source certain reference data for products that trade on our platforms. Our data sources and information providers could increase the price for or withdraw their data or information services for a variety of reasons. For example, our clients, the majority of which are not subject to long-term contractual arrangements or purchase commitments, may stop using or reduce their use of our trading platforms at any time, which would decrease our volume of trade data and may diminish the competitiveness of our market data offerings. In addition, data sources or information providers may enter into exclusive contracts with other third parties, including our competitors, which could preclude us from receiving certain data or information services from these providers or restrict our use of such data or information services, which may give our competitors an advantage. Further, our competitors could revise the current terms on which they provide us with data or information services or could cease providing us with data or information services altogether for a variety of reasons, including competition.
If a substantial number of our key data sources and information providers withdraw or are unable to provide us with their data or information services, or if a substantial number of clients no longer trade on our platforms or use our solutions, and we are unable to suitably replace such data sources or information services, or if the collection of data or information becomes uneconomical, our ability to offer our pre- and post-trade data, analytics tools and reporting solutions could be adversely impacted. If any of these factors negatively impact our ability to provide these data-based solutions to our clients, our competitive position could be materially harmed, which could have a material adverse effect on our business, financial condition and results of operations.
In addition, pursuant to a market data license agreement, Refinitiv currently distributes a significant portion of our market data. The cancellation of, or any adverse change to, our arrangement with Refinitiv or the inability of Refinitiv to effectively distribute our data may materially harm our business and competitive position.
We are dependent upon trading counterparties and clearinghouses to perform their obligations.
40
Our business consists of providing consistent two-sided liquidity to market participants across numerous geographies, asset classes and products. In addition, in the normal course of our business we, as an agent, execute transactions with, and on behalf of, other brokers and dealers. See Part II, Item 7A. – “Quantitative and Qualitative Disclosures about Market Risk — Credit Risk.” In the event of a systemic market event resulting from large price movements or otherwise, certain market participants may not be able to meet their obligations to their trading counterparties, who, in turn, may not be able to meet their obligations to their other trading counterparties, which could lead to major defaults by one or more market participants. Many trades in the securities markets, and an increasing number of trades in the over-the-counter derivatives markets, are cleared through central counterparties. These central counterparties assume and specialize in managing counterparty performance risk relating to such trades. However, even when trades are cleared in this manner, there can be no assurance that a clearinghouse’s risk management methodology will be adequate to manage one or more defaults. Given the counterparty performance risk that is concentrated in central clearing parties, any failure by a clearinghouse to properly manage a default could lead to a systemic market failure. If trading counterparties do not meet their obligations, including to us, or if any central clearing parties fail to properly manage defaults by market participants, we could suffer a material adverse effect on our business, financial condition, results of operations and cash flows.
Our ability to conduct our business may be materially adversely impacted by unforeseen or catastrophic events. In addition, our U.S. and European operations are heavily concentrated in particular areas and may be adversely affected by events in those areas.
We may incur losses as a result of unforeseen or catastrophic events, including fire, natural disasters, extreme weather events, global health issues, power loss, telecommunications failure, software or hardware malfunctions, theft, cyber-attacks, acts of war, terrorist attacks or other armed hostilities. In addition, employee misconduct or error could expose us to significant liability, losses, regulatory sanctions and reputational harm. Misconduct or error by employees could include improperly using confidential information or engaging in improper or unauthorized activities or transactions. These unforeseen or catastrophic events could adversely affect our clients’ levels of business activity and precipitate sudden significant changes in regional and global economic conditions and cycles. Certain of these events also pose significant risks to our employees and our physical facilities and operations around the world, whether the facilities are ours or those of our third-party providers or clients. If our systems, networks or infrastructure were to fail or be negatively impacted as a result of an unforeseen or catastrophic event, our business functions could be interrupted, our ability to make our platforms and solutions available to our clients could be impaired and we could lose critical data. If we are unable to develop adequate plans to ensure that our business functions continue to operate during and after an unforeseen or catastrophic event, and successfully execute on those plans should such an event occur, our business, financial condition, results of operations and reputation could be materially harmed.
In addition, our U.S. operations are heavily concentrated in the New York metro area and our European operations are heavily concentrated in London. Any event that affects either of those geographic areas could affect our ability to operate our business. For example, as discussed below, Brexit is expected to have a material impact on our European operations.
If we fail to maintain our current level of business or execute our growth plan, our business, financial condition and results of operations may be materially harmed.
We have experienced significant growth in our operations over the years, including, in part, as a result of favorable industry and market trends, such as the increased electronification of markets, growing global markets and evolving regulatory requirements. However, we cannot assure you that our operations will continue to grow at a similar rate, if at all, or that we will continue to benefit from such favorable industry and market trends. In particular, we cannot assure you that the growth of electronic means of trading will continue at the levels expected or at all. Our future financial performance depends in large part on our ability to successfully execute our growth plan. To effectively manage the expected growth of our operations, we will need to continue to improve our operational, financial and management processes and systems.
The success of our growth plan depends, in part, on our ability to implement our business strategies. In particular, our growth depends on our ability to maintain and expand our network by attracting new clients, increasing the use of
41
our platforms and solutions by existing clients and by integrating them across geographies and a wide range of asset classes, products, trade types and trade sizes within our marketplaces. Our growth also depends on, among other things, our ability to increase our market share, add new products, enhance our existing platforms and solutions, develop new offerings that address client demand and market trends and stay abreast of changing market conditions and regulatory requirements. Our growth may also be dependent on our ability to further diversify our revenue base. We currently derive approximately 56% of our gross revenue from our Rates asset class. Our long-term growth plan includes expanding our asset classes, including the number of products we offer across those asset classes, by investing in our development efforts and increasing our revenues by growing our market share in our existing markets and entering into new markets. Although our long-term growth plan includes entering into new asset classes, we may not enter into new asset classes in the near term. We cannot assure you that we will be able to successfully execute our growth plan or implement our business strategies within our expected timing or at all or be able to maintain or improve our current level of business, and we may decide to alter or discontinue certain aspects of our growth plan at any time.
Execution of our growth plan entails significant risks and may be impacted by factors outside of our control, including competition, general economic, political and market conditions and industry, legal and regulatory changes. Failure to manage our growth effectively could result in our costs increasing at a faster rate than our revenues and distracting management from our core business and operations. For example, we may incur substantial development, sales and marketing expenses and expend significant management effort to create a new platform, platform feature or solution, and the period before such platform, platform feature or solution is successfully developed, introduced and/or adopted may extend over many months or years, if ever. Even after incurring these costs, such platform, platform feature or solution may not achieve market acceptance.
It is possible that our entry into new markets will not be successful, and potential new markets may not develop quickly or at all.
Our long-term growth plan includes expanding our operations by entering into new markets, including new asset classes, products and geographies, including markets where we have little or no operating experience. We may have difficulties identifying and entering into new markets due to established competitors, lack of recognition of our brand and lack of acceptance of our platforms and solutions, as has occurred with certain of our initiatives in the past.
Expansion, particularly in new geographic markets, may require substantial expenditures and take considerable time. In particular, we may need to make additional investments in management and new personnel, infrastructure and compliance systems. Furthermore, our expansion efforts may divert management’s attention or inefficiently utilize our resources. If we are not able to manage our expansion effectively, our expansion costs could increase at a faster rate than our revenues from these new markets. If we cannot successfully implement the necessary processes to support and manage our expansion, our business, financial condition and results of operations may suffer.
We cannot assure you that we will be able to successfully adapt our platforms, solutions and technologies for use in any new markets. Even if we do adapt our products, services and technologies, we cannot assure you that we will be able to attract clients to our platforms and solutions and compete successfully in any such new markets.
These and other factors have led us to scale back our expansion efforts into new markets in the past, and there can be no assurance that we will not experience similar difficulties in the future. For example, following the 2008 financial crisis, we did not continue to actively invest in our operations in Asia, following our entry into that market in 2004. There can be no assurance that we will be able to successfully maintain or grow our operations abroad.
It is possible that our entry into new markets will not be successful, and potential new markets may not develop quickly or at all. If these efforts are not successful, we may realize less than expected earnings, which in turn could result in a material decrease in the market value of our Class A common stock.
Our business, financial condition and results of operations may be materially adversely affected by risks associated with our international operations.
42
We have operations in the United States, China, Japan, Hong Kong, Singapore and the United Kingdom, and recently expanded our international operations to the Netherlands, where we obtained necessary regulatory approvals. We may further expand our international operations in the future. We have invested significant resources in our international operations and expect to continue to do so in the future. However, there are certain risks inherent in doing business in international markets, particularly in the financial services industry, which is heavily regulated in many jurisdictions. These risks include:
|
· |
local economic, political and social conditions, including the possibility of economic slowdowns, hyperinflationary conditions, political instability, social unrest or outbreaks of pandemic or contagious diseases, such as Ebola, Zika, avian flu, severe acute respiratory syndrome (SARS), H1N1 (swine flu), the coronavirus, and Middle East Respiratory Syndrome (MERS); |
|
· |
differing legal and regulatory requirements, and the possibility that any required approvals may impose restrictions on the operation of our business; |
|
· |
changes in laws, government policies and regulations, or in how provisions are interpreted or administered and how we are supervised; |
|
· |
the inability to manage and coordinate the various legal and regulatory requirements of multiple jurisdictions that are constantly evolving and subject to change; |
|
· |
varying tax regimes, including with respect to imposition or increase of taxes on financial transactions or withholding and other taxes on remittances and other payments by subsidiaries; |
|
· |
actual or threatened trade war, including between the United States and China, or other governmental action related to tariffs, international trade agreements or trade policies; |
|
· |
currency exchange rate fluctuations, changes in currency policies or practices and restrictions on currency conversion; |
|
· |
limitations or restrictions on the repatriation or other transfer of funds; |
|
· |
potential difficulties in protecting intellectual property; |
|
· |
the inability to enforce agreements, collect payments or seek recourse under or comply with differing commercial laws; |
|
· |
managing the potential conflicts between locally accepted business practices and our obligations to comply with laws and regulations, including anti-corruption and anti-money laundering laws and regulations; |
|
· |
compliance with economic sanctions laws and regulations; |
|
· |
difficulties in staffing and managing foreign operations; |
|
· |
increased costs and difficulties in developing and managing our global operations and our technological infrastructure; and |
|
· |
seasonal reductions in business activity. |
Our overall success depends, in part, on our ability to anticipate and effectively manage these risks and there can be no assurance that we will be able to do so without incurring unexpected or increased costs. If we are not able to manage the risks related to our international operations, our business, financial condition and results of operations may be materially adversely affected. In certain regions, the degree of these risks may be higher due to more volatile economic, political or social conditions, less developed and predictable legal and regulatory regimes and increased potential for various types of adverse governmental action.
The United Kingdom’s exit from the European Union could have a material adverse effect on our business, financial condition and results of operations.
In March 2017, the United Kingdom government invoked article 50 of the Lisbon Treaty and officially notified the European Union of its decision to withdraw from the European Union. This formally initiated the process of negotiations with the European Union regarding the terms of the United Kingdom’s withdrawal, and the framework of the future relationship between the United Kingdom and the European Union (the “Withdrawal Agreement”). The United Kingdom withdrew from the European Union on January 31, 2020 (the “exit date”). As part of the negotiations with the European Union, a transitional period has been agreed which extends to the United Kingdom the application of European Union
43
law, and provides for continuing access to the European Union market, until the end of 2020. The future relationship between the United Kingdom and the European Union will be negotiated between both parties during 2020 and if an agreement is reached – which may or may not include terms of access to each other’s financial markets – it is anticipated under the Withdrawal Agreement that the terms of any such agreement would apply upon expiry of the transitional period. The transitional period is due to expire on December 31, 2020, unless extended by the UK/EU Joint Committee established under the Withdrawal Agreement. The maximum possible extension under the Withdrawal Agreement is two years and Prime Minister Johnson of the United Kingdom has indicated that he does not intend to seek, nor agree, to such an extension.
The United Kingdom’s departure from the European Union and the terms of the future relationship between the United Kingdom and the European Union could significantly impact the business environment in which we and our clients operate, increase the costs of conducting business in both the European Union and the United Kingdom, impair or prohibit access to European Union clients, affect market liquidity and introduce significant new uncertainties with respect to the legal and regulatory requirements to which we and our clients are subject. In particular, Brexit is expected to significantly affect the fiscal, monetary and regulatory landscape in both the United Kingdom and the European Union, and may have a material impact on their respective economies which could have a materially adverse impact on us despite out international client-base. Until the terms of the future relationship are known, volatility in exchange rates may continue and it will remain unclear how Brexit may ultimately affect liquidity in our marketplaces.
Significantly, the effects of Brexit on our business will depend on any agreements the United Kingdom makes to retain access to the European Union single market and vice versa. Negotiations between the United Kingdom and the European Union on their future relationship will continue during 2020, will be complex and will be politically uncertain. Until such an agreement is reached the post-transitional period conditions of UK and EU market access are not known. With a loss of “passporting” rights, which allow financial services firms to operate throughout the European Union, and with no equivalent agreement in place between the United Kingdom and the European Union, our UK authorized subsidiary will no longer be able to provide services to EU clients other than in limited circumstances. As a result of the uncertainty related to Brexit, we have established a new regulated subsidiary in the Netherlands that has started to serve clients in the European Union, and for which we have incurred, and expect to continue to incur, increased regulatory and operational costs. These costs result from having established a new regulated subsidiary in the European Union and the management of a client and employee base that is less centralized in London.
With Brexit, the United Kingdom has ended the supremacy of EU law in the United Kingdom by repealing the European Communities Act 1972, and by “on-shoring” EU law as it stands at exit into domestic law. With the exception that the United Kingdom has made secondary legislation to enable correction to be made to EU laws as they are on-shored – and where they would otherwise have no longer operated appropriately following Brexit - the UK and EU laws are substantively the same. Over time however, EU and UK laws may diverge, the pace and extent of which will be political and uncertain. The cost and complexity of operating across increasingly divergent regulatory regimes could increase following Brexit, and this could have a material adverse effect on our business, financial condition, and results of operations.
Fluctuations in foreign currency exchange rates may adversely affect our financial results.
Since we operate in several different countries outside the United States, most notably the UK, Japan and Hong Kong, significant portions of our revenues, expenses, assets and liabilities are denominated in non-U.S. dollar currencies, most notably the pound sterling, euros, Japanese Yen and Hong Kong dollars. Because our consolidated financial statements are presented in U.S. dollars, we must translate non-U.S. dollar denominated revenues, income and expenses, as well as assets and liabilities, into U.S. dollars at exchange rates in effect during or at the end of each reporting period. Accordingly, increases or decreases in the value of the U.S. dollar against other currencies may affect our business, financial condition and results of operations. In recent years, external events, such as Brexit, the 2016 U.S. presidential election, uncertainty regarding actual and potential shifts in U.S. and foreign trade, economic and other policies, the passage of U.S. tax reform legislation and concerns over the interest rate environment (particularly with respect to short-term rates), have caused, and may continue to cause, significant volatility in currency exchange rates, especially among the U.S. dollar, the pound sterling and the euro.
44
While we engage in hedging activity to attempt to mitigate currency exchange rate risk, these hedging activities may not fully mitigate the risk. Accordingly, if there are adverse movements in exchange rates, we may suffer significant losses, which would materially adversely affect our financial condition and results of operations.
We may undertake acquisitions or divestitures, which may not be successful, and which could materially adversely affect our business, financial condition and results of operations.
From time to time, we consider acquisitions, which may not be completed or, if completed, may not be ultimately beneficial to us. We have made several acquisitions in the past, including the purchase of the Hilliard Farber & Co. business in 2008, the Rafferty Capital Markets business in 2011, BondDesk in 2013 and CodeStreet in 2016. We also may consider potential divestitures of businesses from time to time. We routinely evaluate potential acquisition and divestiture candidates and engage in discussions and negotiations regarding potential acquisitions and divestitures on an ongoing basis; however, even if we execute a definitive agreement, there can be no assurance that we will consummate the transaction within the anticipated closing timeframe, or at all. Moreover, there is significant competition for acquisition and expansion opportunities in the electronic financial services industry.
Acquisitions involve numerous risks, including (i) failing to properly identify appropriate acquisition targets and to negotiate acceptable terms; (ii) incurring the time and expense associated with identifying and evaluating potential acquisition targets and negotiating potential transactions; (iii) diverting management’s attention from the operation of our existing business; (iv) using inaccurate estimates and judgments to evaluate credit, operations, funding, liquidity, business, management and market risks with respect to the acquisition target or assets; (v) litigation relating to an acquisition, particularly in the context of a publicly held acquisition target, that could require us to incur significant expenses, result in or delay or enjoin the transaction; (vi) failing to properly identify an acquisition target’s significant problems, liabilities or risks; (vii) not receiving required regulatory approvals on the terms expected or such approvals being delayed or restrictively conditional; and (viii) failing to obtain financing on favorable terms, or at all. In addition, in connection with any acquisitions, we must comply with various antitrust requirements, and it is possible that perceived or actual violations of these requirements could give rise to litigation or regulatory enforcement action or result in us not receiving the necessary approvals to complete a desired acquisition.
Furthermore, even if we complete an acquisition, the anticipated benefits from such acquisition may not be achieved unless the operations of the acquired business, platform or technology are integrated in an efficient, cost-effective and timely manner. The integration of any acquisition includes numerous risks, including an acquired business not performing to our expectations, our not integrating it appropriately and failing to realize anticipated synergies and cost savings as a result, and difficulties, inefficiencies or cost overruns in integrating and assimilating the organizational cultures, operations, technologies, data, products and services of the acquired business with ours. The integration of any acquisition will require substantial attention from management and operating personnel to ensure that the acquisition does not disrupt any existing operations, or affect our reputation or our clients’ opinions and perceptions of our platforms and solutions. We may spend time and resources on acquisitions that do not ultimately increase our profitability or that cause loss of, or harm to, relationships with key employees, clients, third-party providers or other business partners.
Divestitures also involve numerous risks, including: (i) failing to properly identify appropriate assets or businesses for divestiture and buyers; (ii) inability to negotiate favorable terms for the divestiture of such assets or businesses; (iii) incurring the time and expense associated with identifying and evaluating potential divestitures and negotiating potential transactions; (iv) management’s attention being diverted from the operation of our existing business, including to provide on-going services to the divested business; (v) encountering difficulties in the separation of operations, platforms, solutions or personnel; (vi) retaining future liabilities as a result of contractual indemnity obligations; and (vii) loss of, or damage to our relationships with, any of our key employees, clients, third-party providers or other business partners.
We cannot readily predict the timing or size of any future acquisition or divestiture, and there can be no assurance that we will realize any anticipated benefits from any such acquisition or divestiture. If we do not realize any such anticipated benefits, our business, financial condition and results of operations could be materially adversely affected.
45
If we enter into strategic alliances, partnerships or joint ventures, we may not realize the anticipated strategic goals for any such transactions.
From time to time, we may enter into strategic alliances, partnerships or joint ventures as a means to accelerate our entry into new markets, provide new solutions or enhance our existing capabilities. Entering into strategic alliances, partnerships and joint ventures entails risks, including: (i) difficulties in developing or expanding the business of newly formed alliances, partnerships and joint ventures; (ii) exercising influence over the activities of joint ventures in which we do not have a controlling interest; (iii) potential conflicts with or among our partners; (iv) the possibility that our partners could take action without our approval or prevent us from taking action; and (v) the possibility that our partners become bankrupt or otherwise lack the financial resources to meet their obligations.
In addition, there may be a long negotiation period before we enter into a strategic alliance, partnership or joint venture or a long preparation period before we commence providing trading venues and solutions and/or begin earning revenues pursuant to such arrangement. We typically incur significant business development expenses, and management’s attention may be diverted from the operation of our existing business, during the discussion and negotiation period with no guarantee of consummation of the proposed transaction. Even if we succeed in developing a strategic alliance, partnership or joint venture with a new partner, we may not be successful in maintaining the relationship, which may have a material adverse effect on our business, financial condition or results of operations.
We cannot assure you that we will be able to enter into strategic alliances, partnerships or joint ventures on terms that are favorable to us, or at all, or that any strategic alliance, partnership or joint venture we have entered into or may enter into will be successful. In particular, these arrangements may not generate the expected number of new clients or increased trading volumes or revenues or other benefits we seek. Unsuccessful strategic alliances, partnerships or joint ventures could harm our reputation and have a material adverse effect on our business, financial condition and results of operations.
Our quarterly results may fluctuate significantly and may not fully reflect the underlying performance of our business.
Our quarterly operating results may vary significantly in the future, and period-to-period comparisons of our operating results may not be meaningful. Accordingly, the results of any one quarter should not be relied upon as an indication of future performance. Our quarterly financial results may fluctuate as a result of a variety of factors and, as a result, may not fully reflect the underlying performance of our business. Fluctuations in quarterly results may negatively impact the price at which our Class A common stock trades. Factors that may cause fluctuations in our quarterly financial results include, but are not limited to:
|
· |
fluctuations in overall trading volumes or our market share for our key products; |
|
· |
the addition or loss of clients; |
|
· |
the unpredictability of the financial services industry; |
|
· |
our ability to drive an increase in the use of our trading platforms by new and existing clients; |
|
· |
the mix of products and volumes traded, changes in fee plans and average variable fees per million; |
|
· |
the amount and timing of expenses, including those related to the maintenance and expansion of our business, operations and infrastructure; |
|
· |
network or service outages, internet disruptions, the availability of our platforms, security breaches or perceived security breaches; |
|
· |
general economic, political, social, industry and market conditions; |
|
· |
changes in our business strategies and pricing policies (or those of our competitors); |
|
· |
the timing and success of our entry into new markets or introductions of new or enhanced platforms or solutions by us or our competitors, including disruptive technology, or any other change in the competitive dynamics of our industry, including consolidation or new entrants among competitors, market participants or strategic alliances; |
|
· |
the timing and success of any acquisitions, divestitures or strategic alliances; |
|
· |
the timing of expenses related to the development or acquisition of platforms, solutions, technologies or businesses and potential future charges for impairment of goodwill from acquired companies; |
46
|
· |
new, or changes to existing, regulations that limit or affect our platforms, solutions and technologies or which increase our regulatory compliance costs; and |
|
· |
the timing and magnitude of any adjustments in our consolidated financial statements driven by changes in the liability under the Tax Receivable Agreement. |
Failure to retain our existing senior management team or the inability to attract and retain qualified personnel could materially adversely impact our ability to operate or grow our business.
The success of our business depends upon the skills, experience and efforts of our executive officers, particularly Lee Olesky, our Chief Executive Officer, and Billy Hult, our President. The terms of Messrs. Olesky’s and Hult’s employment agreements with us do not require them to continue to work for us and allow them to terminate their employment at any time, subject to certain notice requirements and forfeiture of non-vested equity awards. Although we have invested in succession planning, the loss of key members of our senior management team could nevertheless have a material adverse effect on our business, financial condition and results of operations. Should we lose the services of any member of our senior management team, we would have to conduct a search for a qualified replacement. This search may be prolonged, and we may not be able to locate and hire a qualified replacement.
Our business also depends on our ability to continue to attract, motivate and retain a large number of highly qualified personnel in order to support our clients and achieve business results. There is a limited pool of employees who have the requisite skills, training and education. Identifying, recruiting, training, integrating and retaining qualified personnel requires significant time, expense and attention, and the market for qualified personnel, particularly those with experience in technology, clearing and settlement, product management and regulatory compliance, has become increasingly competitive as an increasing number of companies seek to enhance their positions in the markets we serve. In particular, we compete for technology personnel with highly innovative technology companies and large companies focused on technology development. Many of these companies have significant financial resources and recognized brands and are able to offer more attractive employment opportunities and more lucrative compensation packages. Our inability to attract, retain and motivate personnel with the requisite skills could impair our ability to develop new platforms, platform features or solutions, enhance our existing platforms and solutions, grow our client base, enter into new markets, operate under various regulatory frameworks or manage our business effectively.
Damage to our reputation or brand could negatively impact our business, financial condition and results of operations.
Our reputation and the quality of our brand are critical to our business, and we must protect and grow the value of our brand in order for us to continue to be successful. Any incident that erodes client loyalty for our brand could significantly reduce its value and damage our business. We may be adversely affected by any negative publicity, regardless of its accuracy, including with respect to, among other things, the quality and reliability of our platforms and solutions, the accuracy of our market data, our ability to maintain the security of our data and systems, networks and infrastructure and any impropriety, misconduct or fraudulent activity by any person formerly or currently associated with us.
Also, there has been a marked increase in the use of blogs, social media platforms and other forms of Internet-based communications that provide individuals with access to a broad audience of interested persons. The opportunity for dissemination of information, including inaccurate information, is seemingly limitless and readily available. Information may be posted on such sites and platforms at any time. Information posted may be adverse to our interests or may be inaccurate, each of which may harm our business and reputation. The harm may be immediate without affording us an opportunity for redress or correction.
Ultimately, the risks associated with any negative publicity or actual, alleged or perceived issues regarding our business or any person formerly or currently associated with us cannot be completely eliminated or mitigated and may materially harm our reputation, business, financial condition and results of operations.
We may not be able to adequately protect our intellectual property, which, in turn, could materially adversely affect our brand and our business.
47
Our success depends in part on our proprietary technology, processes, methodologies and information and on our ability to further build brand recognition using our tradenames and logos. We rely primarily on a combination of U.S. and foreign patent, copyright, trademark, service mark and trade secret laws and nondisclosure, license, assignment and confidentiality arrangements to establish, maintain and protect our proprietary rights as well as the intellectual property rights of third parties whose content, data, information and other materials we license. We can give no assurances that any such patents, copyrights, trademarks, service marks and other intellectual property rights will protect our business from competition or that any intellectual property rights applied for in the future will be issued. In addition, the steps we take to protect our intellectual property may not adequately protect our rights or prevent third parties from infringing or misappropriating our rights, and third parties may successfully challenge the validity and/or enforceability of our intellectual property rights. Furthermore, we cannot assure you that these protections will be adequate to prevent our competitors from independently developing logos, platforms, solutions or technologies that are substantially equivalent or superior to our logos, platforms, solutions or technologies.
The protection of our intellectual property may require the expenditure of financial and managerial resources. Litigation brought to protect and enforce our intellectual property rights could be costly, time-consuming and distracting to management and may result in the impairment or loss of portions of our intellectual property. In addition, the laws of some countries in which we now or in the future provide our platforms and solutions may not protect intellectual property rights to the same extent as the laws of the United States. If our efforts to secure, protect and enforce our intellectual property rights are inadequate, or if any third party misappropriates, dilutes or infringes on our intellectual property, the value of our brand may be harmed, which could have a material adverse effect on our business.
Third parties may claim that we are infringing or misappropriating their intellectual property rights, which could cause us to suffer competitive injury, expend significant resources defending against such claims or be prevented from offering our platforms and solutions.
Our competitors, as well as other companies and individuals, may have obtained, and may be expected to obtain in the future, intellectual property rights related to the types of platforms and solutions we currently provide or plan to provide. In particular, as the number of trading platforms increases and the functionality of these platforms and related solutions further overlaps, the possibility of intellectual property rights claims against us grows. We cannot assure you that we are or will be aware of all third-party intellectual property rights that may pose a risk of infringement or misappropriation to our platforms, solutions, technologies or the manner in which we operate our business.
We have in the past been, are currently, and may from time to time in the future become subject to legal proceedings and claims relating to the intellectual property rights of others. The costs of supporting legal and dispute resolution proceedings are considerable, and there can be no assurance that a favorable outcome will be obtained. We may need to settle litigation and disputes on terms that are unfavorable to us, or we may be subject to an unfavorable judgment. The terms of any settlement or judgment may require us to cease some or all of our operations, pay substantial amounts to the other party and/or seek a license to continue practices found to be in violation of third-party intellectual property rights, which may not be available on reasonable terms and may significantly increase our operating expenses. A license may not be available to us at all, and we may be required to develop alternative non-infringing platforms, solutions, technologies or practices or discontinue use of such platforms, solutions, technologies or practices. Any development efforts could require significant effort and expense and, as result, our business, results of operations and financial condition could be materially adversely affected.
Extensive regulation of our industry results in ongoing exposure to significant costs and penalties, enhanced oversight and restrictions and limitations on our ability to conduct and grow our business.
The financial services industry, including our business, is subject to extensive regulation by governmental and self-regulatory organizations in the jurisdictions in which we operate. These regulators have broad powers to promulgate and interpret laws, rules and regulations that often serve to restrict or limit our business. The requirements imposed by these regulators are designed to safeguard the integrity of the financial markets and to protect public investors generally rather than the interests of our stockholders, and we could become subject to increased governmental and public scrutiny in the
48
future in response to global conditions and events. The SEC, the CFTC, FINRA, the NFA and other authorities extensively regulate the U.S. financial services industry, including most of our operations in the United States. Much of our international operations are subject to similar regulations in their respective jurisdictions, including regulations overseen by the FCA in the United Kingdom, DNB, the AFM, the MAS, the Hong Kong Securities and Futures Commission, the Investment Industry Regulatory Organization of Canada and provincial regulators in Canada, the Japanese Financial Services Agency, the Japan Securities Dealers Association and the ASIC.
Most aspects of our business, and in particular our broker-dealer, SEF and introducing broker subsidiaries, are subject to laws, rules and regulations that cover all aspects of our business, including manner of operation, system integrity, anti-money laundering and financial crimes, handling of material non-public information, safeguarding data, capital requirements, reporting, record retention, market access, licensing of employees and the conduct of officers, employees and other associated persons. See Part I, Item 1. – “Business — Regulation,” for a further description of the laws, rules and regulations that materially impact our business. There can be no assurance that we and/or our directors, officers and employees will be able to fully comply with these laws, rules and regulations. Any failure to comply with such legal and regulatory requirements could subject us to increased costs, fines, penalties or other sanctions, including suspensions of, or prohibitions on, certain of our activities, revocations of certain of our licenses or registrations, such as our membership in FINRA or our registration as a broker-dealer, or suspension of personnel.
Certain of our subsidiaries are subject to net capital and similar financial resource requirements. For example, our SEF subsidiaries are required to maintain sufficient financial resources to cover operating costs for at least one year. These net capital and related requirements may restrict our ability to withdraw capital from our regulated subsidiaries in certain circumstances, including through the payment of dividends, the redemption of stock or the making of unsecured advances or loans.
Some of our subsidiaries are subject to regulations, including under FINRA, the FCA and the DNB, regarding changes in control of their ownership or organizational structure as defined by the applicable regulatory body. These regulations generally provide that prior regulatory approval must be obtained in connection with any transaction resulting in a change in control or organizational structure of the subsidiary, such as changes in direct and indirect ownership or changes in the composition of the board of directors or similar body or the appointment of new officers, and may include similar changes that occur at Tradeweb Markets Inc. or any of its stockholders that may be deemed to hold a controlling interest as defined by the applicable regulatory body. As a result of these regulations, our future efforts to sell shares or raise additional capital, or to make changes to our organizational structure, may be delayed or prohibited in circumstances in which such a transaction would give rise to a change in control or organizational structure as defined by the applicable regulatory body.
Our ability to operate our trading platforms or offer our solutions in a particular jurisdiction is dependent on continued registration or authorization in that jurisdiction (or the maintenance of a valid exemption from such registration or authorization). In addition, regulatory approval may be required to expand certain of our operations and activities, and we may not be able to obtain the necessary regulatory approvals on a timely or cost-effective basis, or at all. Even if regulatory approvals are obtained, they may limit or impose restrictions on our operations and activities, and we may not be able to continue to comply with the terms of such approvals.
We incur significant costs, and will continue to devote significant financial and operational resources, to develop, implement and maintain policies, systems and processes to comply with our evolving legal and regulatory requirements. Future laws, rules and regulations, or adverse changes to, or more stringent enforcement of, existing laws, rules and regulations, could increase these costs and expose us to significant liabilities.
Our regulators generally require strict compliance with their laws, rules and regulations, and may investigate and enforce compliance and punish non-compliance. Many of our regulators, as well as other governmental authorities, are empowered to bring enforcement actions and to conduct administrative proceedings, examinations, inspections and investigations, which may result in increased compliance costs, penalties, fines, enhanced oversight, increased financial and capital requirements, additional restrictions or limitations, censure, suspension or other sanction, such as disgorgement, restitution or the revocation of regulatory approvals. The risks associated with such actions are difficult to assess or quantify.
49
In the normal course of our business, we have been, and continue to be from time to time, a party to various legal and regulatory proceedings related to compliance with applicable laws, rules and regulations, including audits, examinations and investigations of our operations and activities. Legal and regulatory actions, from subpoenas and other requests for information to potential criminal investigations, may divert management’s attention, cause us to incur significant expenses, including fees for legal representation and costs for remediation efforts, and result in fines, penalties or other sanctions. We may also be required to change or cease aspects of our operations or activities if a legal or regulatory authority determines that we have failed to comply with any laws, rules or regulations applicable to our business and/or otherwise determines to prohibit any of our operations or activities or revoke any of our approvals. In addition, regardless of the outcome, such actions may result in substantial costs and negative publicity, which may damage our reputation and impair our ability to attract and retain clients.
Firms in the financial services industry have experienced increased scrutiny in recent years, and penalties, fines and other sanctions sought by governmental and regulatory authorities, including the SEC, the CFTC, the Department of Justice, state securities administrators and state attorneys general in the United States, the FCA in the United Kingdom and other foreign regulators, have increased accordingly. This trend toward a heightened regulatory oversight and enforcement environment is expected to continue for the foreseeable future, and may create uncertainty and may increase our exposure to scrutiny of our operations and activities, significant penalties and liability and negative publicity.
Our business, and the businesses of many of our clients, could be materially adversely affected by new laws, rules or regulations or changes in existing laws, rules or regulations, including the interpretation and enforcement thereof.
Our business, and the business of many of our clients, is subject to extensive regulation. Governmental and regulatory authorities periodically review legislative and regulatory policies and initiatives, and may promulgate new or revised, or adopt changes in the interpretation and enforcement of existing, laws, rules and regulations at any time. Any such changes in laws, rules or regulations or in governmental policies could create additional regulatory exposure for our business, cause us to incur significant additional costs, require us to change or cease aspects of our business or restrict or limit our ability to grow our business, any of which could have a material adverse effect on our business, financial condition or results of operations. There have been in the past, and could be in the future, significant technological, operational and compliance costs associated with the obligations that derive from compliance with evolving laws, rules and regulations.
Changes in legislation and in the rules and regulations promulgated by domestic and foreign regulators, and how they are applied, often directly affect the method of operation and profitability of dealers and other financial services intermediaries, including our dealer clients, and could result in restrictions in the way we and our clients conduct business. For example, various rules promulgated since the financial crisis, including under the Dodd-Frank Act, could adversely affect our dealer clients’ ability to make markets in a variety of products, thereby negatively impacting the level of liquidity and pricing available on our trading platforms. Our business and that of our clients could also be affected by the monetary policies adopted by the Federal Reserve and foreign central banking authorities, which may affect the credit quality of our clients or increase the cost for our clients to trade certain instruments on our trading platforms. In addition, such changes in monetary policy may directly impact our cost of funds for financing and investment activities and may impact the value of any financial instruments we hold.
Furthermore, many of the underlying markets in which we facilitate trading, and in which our clients trade, are subject to regulation. For example, trading in interest rate swaps has been subject to extensive regulation in the past, and any future regulation could lead to a decline in trading in these markets, which could have a negative impact on our trading volumes and, as a result, our revenues.
In addition, regulatory bodies in Europe have recently developed new rules and regulations targeted at the financial services industry, including MiFID II and the MiFIR, which were implemented in January 2018 and which introduced significant changes to the EU financial markets designed to facilitate more efficient markets and greater transparency for participants. MiFID II and MiFIR may have an adverse effect on our operations and our ability to offer our trading platforms and related solutions in a manner that can successfully compete against other methods of trading and related
50
solutions. Additionally, most of the world’s major economies have introduced and continue to introduce regulations implementing Basel III, a global regulatory standard on bank capital adequacy, stress testing and market liquidity risk. The continued implementation of these and other bank capital standards could restrict the ability of our large bank and dealer customers to raise additional capital or use existing capital for trading purposes, which might cause them to trade less on our trading platforms and diminish transaction velocity. In addition, as regulations are introduced which affect our prudential obligations, the regulatory capital requirements imposed on certain of our subsidiaries may change.
We believe that it remains premature to know conclusively how specific aspects of the regulatory developments described above may directly affect our business. We cannot predict whether additional changes to the laws, rules and regulations that govern our business and operations, including changes to their interpretation, implementation or enforcement, will occur in the future or the extent to which any such changes will impact our business and operations. In addition, we cannot predict how current proposals that have not yet been finalized and/or that remain subject to ongoing debate will be implemented or in what form. We believe that uncertainty and potential delays around the final form of such new laws, rules and regulations may negatively impact our clients and trading volumes in certain markets in which we transact. Additionally, unintended consequences of such new laws, rules and regulations may adversely affect our industry, our clients and us in ways yet to be determined. Any such legal and regulatory changes could affect us in substantial and unpredictable ways, and could have a material adverse effect on our business, financial condition and results of operations.
Our actual or perceived failure to comply with privacy, data protection and information security laws, rules, regulations and obligations could harm our business.
Certain types of information we collect, compile, store, use, transfer and/or publish are subject to numerous federal, state, local and foreign laws and regulations regarding privacy, data protection and information security These laws, rules and regulations govern the storing, sharing, use, processing, transfer, disclosure and protection of personal information and other content. The scope of these laws, rules and regulations are changing, subject to differing interpretations, may be inconsistent among countries or conflict with other law, rules or regulations. We are also subject to the terms of our privacy policies and obligations to third parties related to applicable privacy, data protection and information security.
The regulatory framework for privacy, data protection and information security worldwide is uncertain, and is likely to remain uncertain for the foreseeable future, and we expect that there will continue to be new laws, rules regulations and industry standards concerning privacy, data protection and information security proposed and enacted in the various jurisdictions in which we operate. For example, European legislators adopted the General Data Protection Regulations (“GDPR”) that became effective in May 2018. The GDPR imposes more stringent EU data protection requirements and provides for greater penalties for noncompliance. Further, Brexit has created uncertainty with regard to the regulation of data protection in the United Kingdom. In particular, it is unclear whether the United Kingdom will enact data protection laws or regulations designed to be consistent with the GDPR and how data transfers to and from the United Kingdom will be regulated.
Our efforts to comply with privacy, data protection and information security laws, rules and regulations could entail substantial expenses, may divert resources from other initiatives and could impact our ability to provide certain solutions. Additionally, if our third-party providers violate any of these laws or regulations, such violations may also put our operations at risk. Any failure or perceived failure by us to comply with any of our obligations relating to privacy, data protection or information security may result in governmental investigations or enforcement actions, litigation, claims or negative publicity and could result in significant liability, increased costs or cause our clients to lose trust in us, which could have an adverse effect on our reputation and business.
New U.S. tax legislation may materially adversely affect our financial condition, results of operations and cash flows.
At any time, the U.S. federal income tax laws or the administrative interpretations of those laws may be amended. We cannot predict when or if any new U.S. federal income tax law, regulation or administrative interpretation, or any amendment to any existing U.S. federal income tax law, regulation, or administrative interpretation, will be adopted, promulgated or become effective. Any such law, regulation or interpretation could take effect retroactively, and could
51
adversely affect our business and financial condition, and the impact of any such law, regulation or interpretation on holders of our Class A common stock could be adverse.
Our compliance and risk management programs might not be effective and may result in outcomes that could adversely affect our reputation, business, financial condition and results of operations.
Our ability to comply with all applicable laws, rules and regulations is largely dependent on our establishment and maintenance of compliance and risk management programs, including audit and reporting systems, that can quickly adapt and respond, as well as our ability to attract and retain qualified compliance, audit, legal, cybersecurity and other compliance and risk management personnel. While we have policies and procedures to identify, monitor and manage our risks and regulatory obligations, we cannot assure you that our policies and procedures will always be effective or that we will always be successful in monitoring or evaluating the risks to which we are or may be exposed. Our risk-management programs may prove to be ineffective because of their design, their implementation and maintenance or the lack of adequate, accurate or timely information. If our risk-management programs and efforts are ineffective, we could suffer losses that could have a material adverse effect on our financial condition and results of operations.
As part of our compliance and risk management programs, we must rely upon our analysis of laws, rules, regulations and information regarding our industry, markets, personnel, clients and other matters that are publicly available or otherwise accessible to us. That information may not in all cases be accurate, complete, up-to-date or properly analyzed. Furthermore, we rely on a combination of technical and human controls and supervision that are subject to error and potential failure, the challenges of which are exacerbated by the 24-hour-a-day, global nature of our business, which is subject to various legal and regulatory requirements of multiple jurisdictions that are constantly evolving and subject to change.
In case of non-compliance or alleged non-compliance with applicable laws, rules or regulations by us or third parties on which we may rely, we could be subject to regulatory investigations and proceedings that may be very expensive to defend against and may result in substantial fines and penalties or civil lawsuits, including by clients, for damages which can be significant. Any of these outcomes would adversely affect our reputation, financial condition and results of operations. Further, the implementation of new legislation or regulations, or changes in or unfavorable interpretations of existing legislation or regulations by courts or regulators, could require us to incur significant compliance costs and impede our ability to operate, expand and enhance our platforms and solutions as necessary to remain competitive and grow our business, which could materially adversely affect our business, financial condition and results of operations.
We are exposed to litigation risk.
We are from time to time involved in various litigation matters and claims, including lawsuits regarding employment matters, breach of contract matters and other business and commercial matters. See Part I, Item 3 – “Legal Proceedings.” Many aspects of our business, and the businesses of our clients, involve substantial risks of liability. These risks include, among others, disputes over terms of a trade and claims that a system failure or delay caused monetary loss to a client or that an unauthorized trade occurred. Although we carry insurance that may limit our risk of damages in some matters, we may still sustain uncovered losses or losses in excess of available insurance, and we could incur significant legal expenses defending claims, even those without merit. Due to the uncertain nature of the litigation process, it is not possible to predict with certainty the outcome of any particular litigation matter or claim, and we could in the future incur judgments or enter into settlements that could have a material adverse effect on our business, financial condition and results of operations. The ultimate outcome of litigation matters and claims against us may require us to change or cease certain operations and may result in higher operating costs. An adverse resolution of any litigation matter or claim could cause damage to our reputation and could have a material adverse effect on our business, financial condition and results of operations.
Our use of open source software could result in litigation or impose unanticipated restrictions on our ability to commercialize our platforms and solutions.
We use open source software in our technology, most often as small components within a larger solution. Open source code is also contained in some third-party software we rely on. The terms of many open source licenses are ambiguous
52
and have not been interpreted by U.S. or other courts, and these licenses could be construed in a manner that imposes unanticipated conditions or restrictions on our ability to commercialize our platforms and solutions, license the software on unfavorable terms, require us to re-engineer our platforms and solutions or take other remedial actions, any of which could have a material adverse effect on our business.
The credit agreement that governs the Revolving Credit Facility imposes significant operating and financial restrictions on us and our restricted subsidiaries, which may prevent us from capitalizing on business opportunities, and we may incur additional debt in the future that may include similar or additional restrictions.
We are party to the Revolving Credit Facility, a $500.0 million senior secured revolving credit facility, with a syndicate of banks. The credit agreement that governs the Revolving Credit Facility imposes significant operating and financial restrictions. These restrictions, which are subject to a number of qualifications and exceptions, could limit our ability and the ability of our restricted subsidiaries to, among other things:
|
· |
incur additional indebtedness and guarantee indebtedness; |
|
· |
create or incur liens; |
|
· |
pay dividends and distributions or repurchase capital stock; |
|
· |
make investments, loans and advances; and |
|
· |
enter into certain transactions with affiliates. |
In addition, the credit agreement that governs our Revolving Credit Facility requires us to maintain a maximum total net leverage ratio and a minimum cash interest coverage ratio. See Part II, Item 7. – “Management’s Discussion and Analysis of Financial Condition and Results of Operations — Liquidity and Capital Resources.”
These covenants could materially adversely affect our ability to finance our future operations or capital needs. Furthermore, they may restrict our ability to expand and pursue our business strategies and otherwise conduct our business. Our ability to comply with these covenants may be affected by circumstances and events beyond our control, such as prevailing economic conditions and changes in regulations, and we cannot assure you that we will be able to comply with such covenants. These restrictions could also limit our ability to obtain future financings to withstand a future downturn in our business or the economy in general. In addition, complying with these covenants may also cause us to take actions that make it more difficult for us to successfully execute our business strategies and compete against companies that are not subject to such restrictions.
Our failure to comply with the covenants and other terms of the Revolving Credit Facility and/or the terms of any future indebtedness could result in an event of default. If any such event of default occurs and is not waived, the lenders under the Revolving Credit Facility could elect to declare all amounts outstanding and accrued and unpaid interest, if any, under the Revolving Credit Facility to be immediately due and payable, and could foreclose on the assets securing the Revolving Credit Facility. The lenders would also have the right in these circumstances to terminate any commitments they have to provide further credit extensions. If we are forced to refinance any borrowings under the Revolving Credit Facility on less favorable terms or if we cannot refinance these borrowings, our financial condition and results of operations could be materially adversely affected.
In addition, although the credit agreement that governs the Revolving Credit Facility contains restrictions on the incurrence of additional indebtedness, these restrictions are subject to a number of qualifications and exceptions, and we and our subsidiaries may be able to incur substantial additional indebtedness in compliance with these restrictions in the future. The terms of any future indebtedness we may incur could include more restrictive covenants.
Any borrowings under the Revolving Credit Facility will subject us to interest rate risk, which could cause our debt service obligations to increase significantly.
Any borrowings under the Revolving Credit Facility will be at variable rates of interest and expose us to interest rate risk. Although there is uncertainty concerning the current interest rate environment, interest rates are still near historically low levels. If interest rates rise, our debt service obligations on any borrowings under the Revolving Credit Facility will increase even though the amount borrowed may remain the same, and our net income and cash flows will correspondingly decrease. Assuming that the $500.0 million Revolving Credit Facility was fully drawn, each 0.125%
53
change in interest rates would result in an approximate change of $0.6 million in annual interest expense on the borrowings under the Revolving Credit Facility.
The phase-out, replacement or unavailability of LIBOR and/or other interest rate benchmarks could adversely affect our indebtedness.
The interest rates applicable to the Revolving Credit Facility are based on, and the interest rates applicable to certain debt obligations we may incur in the future may be based on, a fluctuating rate of interest determined by reference to the London Interbank Offered Rate (“LIBOR”). In July 2017, the U.K.’s Financial Conduct Authority, which regulates LIBOR, announced that it intends to stop persuading or compelling banks to submit rates for the calculation of LIBOR after 2021. In response to concerns regarding the future of LIBOR, the Board of Governors of the Federal Reserve System and the Federal Reserve Bank of New York convened the Alternative Reference Rates Committee (the “ARRC”) to identify alternatives to LIBOR. The ARRC has recommended a benchmark replacement waterfall to assist issuers in continued capital market entry while safeguarding against LIBOR’s discontinuation. The initial steps in the ARRC’s recommended provision reference variations of the Secured Overnight Financing Rate (“SOFR”), calculated using short-term repurchase agreements backed by Treasury securities. At this time, it is not possible to predict whether SOFR will attain market traction as a LIBOR replacement. Additionally, it is uncertain if LIBOR will cease to exist after calendar year 2021, or whether additional reforms to LIBOR may be enacted, or whether alternative reference rates will gain market acceptance as a replacement for LIBOR. In anticipation of LIBOR’s phase-out, the credit agreement governing the Revolving Credit Facility provides for alternative base rates as well as a transition mechanism for selecting a benchmark replacement rate for LIBOR, with such benchmark replacement rate to be mutually agreed with the administrative agent and subject to the majority lenders not objecting to such benchmark replacement. There can be no assurance that we will be able to reach any agreement on a replacement benchmark, and there can be no assurance that any agreement we reach will result in effective interest rates at least as favorable to us as our current effective interest rates. The failure to reach an agreement on a replacement benchmark, or the failure to reach an agreement that results in an effective interest rate at least as favorable to us as our current effective interest rates, could result in a significant increase in our debt service obligations, which could adversely affect our financial condition and results of operations. In addition, the overall financing market may be disrupted as a result of the phase-out or replacement of LIBOR, which could have an adverse impact on our ability to refinance, reprice or amend the Revolving Credit Facility, or incur additional indebtedness, on favorable terms, or at all.
We are a restricted subsidiary under Refinitiv’s credit facility and the indentures governing its senior notes, which may limit Refinitiv’s ability to permit us to take certain actions.
We are a “restricted subsidiary” under Refinitiv’s credit facility and the indentures governing its senior notes. While we are not a guarantor of Refinitiv’s indebtedness, or a party to the agreements governing Refinitiv’s indebtedness, the restrictions applicable to “restricted subsidiaries” contained in such agreements will nevertheless be applicable to us for so long as we are consolidated within Refinitiv’s financial statements in accordance with GAAP. Among these restrictions are limitations on Refinitiv’s ability to permit us to incur or guarantee indebtedness, issue certain preferred stock, repurchase subordinated indebtedness, make certain investments, transfer or sell certain assets, enter into restrictions affecting our ability to make distributions or loans or advances to Refinitiv, and enter into certain transactions with affiliates. As a result of these restrictions, we may be unable to take certain actions and, accordingly, limited in our ability to expand and pursue our business strategies and otherwise conduct our business.
We may incur impairment charges for our goodwill and other indefinite-lived intangible assets which would negatively impact our operating results.
As of December 31, 2019, we had goodwill of $2,694.8 million and indefinite-lived intangible assets of $323.1 million, which relate to the Refinitiv Transaction. The carrying value of goodwill represents the fair value of an acquired business in excess of identifiable assets and liabilities as of the acquisition date. The carrying value of indefinite-lived intangible assets represents the fair value of licenses and trade names as of the acquisition date. Determining the fair value of certain assets acquired and liabilities assumed is judgmental in nature and requires management to use significant estimates and assumptions, including assumptions with respect to future cash flows, discount rates, growth rates and asset lives. We do not amortize goodwill and indefinite-lived intangible assets that we expect to contribute
54
indefinitely to our cash flows, but instead we evaluate these assets for impairment at least annually, or more frequently if changes in circumstances indicate that a potential impairment could exist. Significant negative industry or economic trends, disruptions to our business, inability to effectively integrate acquired businesses, unexpected significant changes or planned changes in use of the acquired assets, divestitures and market capitalization declines may impair our goodwill and other indefinite-lived intangible assets. Any charges relating to such impairments could materially adversely affect our financial condition and results of operations.
Risks Relating to the Company and Our Organizational Structure
Our principal asset is our equity interest in TWM LLC, and, accordingly, we depend on distributions from TWM LLC to pay our taxes and expenses, including payments under the Tax Receivable Agreement.
We are a holding company and our principal asset is our equity interest in TWM LLC. We have no independent means of generating revenue or cash flow, and our ability to pay our taxes and operating expenses or declare and pay dividends, if any, in accordance with our dividend policy will be dependent upon the financial results and cash flows of TWM LLC and its subsidiaries and distributions we receive from TWM LLC. There can be no assurance that TWM LLC and its subsidiaries will generate sufficient cash flow to distribute funds to us or that applicable state law and contractual restrictions will permit such distributions.
We also incur expenses related to our operations, including payments under the Tax Receivable Agreement, which we expect could be significant. See Note 10 — Tax Receivable Agreement to our audited consolidated financial statements included elsewhere in this Annual Report on Form 10-K. We intend, as its sole manager, to cause TWM LLC to continue to make cash distributions to the owners of LLC Interests, including us, in an amount sufficient to (i) fund all or part of their tax obligations in respect of taxable income allocated to them and (ii) cover our operating expenses, including payments under the Tax Receivable Agreement. When TWM LLC makes distributions, the Continuing LLC Owners will be entitled to receive proportionate distributions based on their economic interests in TWM LLC at the time of such distributions. TWM LLC’s ability to make such distributions may be subject to various limitations and restrictions, such as restrictions on distributions that would either violate any contract or agreement to which TWM LLC is then a party, or any applicable law, or that would have the effect of rendering TWM LLC insolvent. If we do not have sufficient funds to pay tax or other liabilities or to fund our operations, we may have to borrow funds, including under the Revolving Credit Facility, which could materially adversely affect our liquidity and financial condition and subject us to various restrictions imposed by any such indebtedness. To the extent that we are unable to make payments under the Tax Receivable Agreement for any reason, such payments generally will be deferred and will accrue interest until paid; provided, however, that nonpayment for a specified period may constitute a material breach of a material obligation under the Tax Receivable Agreement and therefore accelerate payments due under the Tax Receivable Agreement. In addition, if TWM LLC does not have sufficient funds to make distributions, our ability to declare and pay cash dividends will also be restricted or impaired. See “— Risks Relating to Ownership of Our Class A Common Stock” and Part II, Item 5 – “Market for Registrant’s Common Equity, Related Stockholder Matters and Issuer Purchases of Equity Securities — Dividend Policy.”
In certain circumstances, TWM LLC will be required to make distributions to us and the other holders of LLC Interests, and the distributions that TWM LLC will be required to make may be substantial and in excess of our tax liabilities and obligations under the Tax Receivable Agreement. To the extent we do not distribute such excess cash, the Continuing LLC Owners would benefit from any value attributable to such cash balances as a result of their ownership of Class A common stock or Class B common stock following an exchange of their LLC Interests.
TWM LLC is treated as a partnership for U.S. federal income tax purposes and, as such, is not subject to any entity-level U.S. federal income tax. Instead, taxable income is allocated to holders of LLC Interests, including us. Accordingly, we incur income taxes on our allocable share of any net taxable income of TWM LLC. Under the TWM LLC Agreement, TWM LLC is generally required from time to time to make pro rata distributions in cash to us and the other holders of LLC Interests in amounts that are intended to be sufficient to cover the taxes on our and the other LLC
55
Interests holders’ respective allocable shares of the taxable income of TWM LLC. As a result of (i) potential differences in the amount of net taxable income allocable to us and the other LLC Interest holders, (ii) the lower tax rate applicable to corporations as compared to individuals and (iii) the favorable tax benefits that we anticipate receiving from (a) acquisitions of LLC Interests in connection with future taxable redemptions or exchanges of LLC Interests for shares of our Class A common stock or Class B common stock, as applicable, and (b) payments under the Tax Receivable Agreement, we expect that these tax distributions will be in amounts that exceed our tax liabilities and obligations to make payments under the Tax Receivable Agreement. Our board of directors will determine the appropriate uses for any excess cash so accumulated, which may include, among other uses, any potential dividends, the payment of obligations under the Tax Receivable Agreement and the payment of other expenses. We have no obligation to distribute such cash (or other available cash other than any declared dividend) to our stockholders. No adjustments to the redemption or exchange ratio of LLC Interests for shares of Class A common stock or Class B common stock, as applicable, will be made as a result of either (i) any cash distribution by TWM LLC or (ii) any cash that we retain and do not distribute to our stockholders. To the extent that we do not distribute such excess cash as dividends on our Class A common stock and Class B common stock and instead, for example, hold such cash balances or lend them to TWM LLC, the Continuing LLC Owners would benefit from any value attributable to such cash balances as a result of their ownership of Class A common stock or Class B common stock, as applicable, following a redemption or exchange of their LLC Interests.
The Tax Receivable Agreement with the Continuing LLC Owners requires us to make cash payments to them in respect of certain tax benefits to which we may become entitled, and we expect that the payments we will be required to make will be substantial.
We are a party to the Tax Receivable Agreement with TWM LLC and the Continuing LLC Owners. Under the Tax Receivable Agreement, we are required to make cash payments to a Continuing LLC Owner equal to 50% of the U.S. federal, state and local income or franchise tax savings, if any, that we actually realize, or in certain circumstances are deemed to realize, as a result of (i) increases in the tax basis of TWM LLC’s assets resulting from (a) the purchase of LLC Interests from such Continuing LLC Owner, including with the net proceeds from the IPO, the October 2019 follow-on offering and any future offerings or (b) redemptions or exchanges by such Continuing LLC Owner of LLC Interests for shares of our Class A common stock or Class B Common Stock or for cash, as applicable, and (ii) certain other tax benefits related to our making payments under the Tax Receivable Agreement. We expect that the amount of the cash payments that we will be required to make under the Tax Receivable Agreement will be substantial. Any payments made by us to the Continuing LLC Owners under the Tax Receivable Agreement will generally reduce the amount of overall cash flow that might have otherwise been available to us. Furthermore, our obligation to make payments under the Tax Receivable Agreement could make us a less attractive target for an acquisition, particularly in the case of an acquirer that cannot use some or all of the tax benefits that are the subject of the Tax Receivable Agreement.
The actual increase in tax basis, as well as the amount and timing of any payments under the Tax Receivable Agreement, will vary depending on a number of factors, including, but not limited to, the timing of any future redemptions, exchanges or purchases of the LLC Interests held by Continuing LLC Owners, the price of our Class A common stock at the time of the redemption, exchange or purchase, the extent to which redemptions or exchanges are taxable, the amount and timing of the taxable income that we generate in the future, the timing and amount of any earlier payments we make under the Tax Receivable Agreement itself, the tax rates then applicable and the portion of our payments under the Tax Receivable Agreement constituting imputed interest. We expect that, as a result of the increases in the tax basis of the tangible and intangible assets of TWM LLC attributable to the redeemed or exchanged LLC Interests, the payments that we may make to the existing Continuing LLC Owners could be substantial. For example, as of December 31, 2019, we recorded a liability of $240.8 million related to our projected obligations under the Tax Receivable Agreement with respect to LLC Interests that were purchased by Tradeweb Markets Inc. using the net proceeds from the IPO and the October 2019 follow-on offering and LLC Interests that were exchanged by Continuing LLC Owners during the year ended December 31, 2019. Payments under the Tax Receivable Agreement are not conditioned on any Continuing LLC Owner’s continued ownership of LLC Interests or our Class A common stock or Class B common stock. There may be a material negative effect on our liquidity if, as described below, the payments under the Tax Receivable Agreement exceed the actual benefits we receive in respect of the tax attributes subject to the
56
Tax Receivable Agreement and/or distributions to us by TWM LLC are not sufficient to permit us to make payments under the Tax Receivable Agreement.
Our organizational structure, including the Tax Receivable Agreement, confers certain benefits upon the Continuing LLC Owners that will not benefit Class A common stockholders or Class B common stockholders to the same extent as it will benefit the Continuing LLC Owners.
Our organizational structure, including the Tax Receivable Agreement, confers certain benefits upon the Continuing LLC Owners that will not benefit the holders of our Class A common stock or Class B common stock to the same extent as it will benefit the Continuing LLC Owners. The Tax Receivable Agreement with TWM LLC and the Continuing LLC Owners provides for the payment by us to the Continuing LLC Owners of 50% of the tax benefits, if any, that we actually realize, or in certain circumstances are deemed to realize, as a result of (i) increases in the tax basis of TWM LLC’s assets resulting from (a) the purchase of LLC Interests from such Continuing LLC Owner, including with the net proceeds from the IPO, the October 2019 follow-on offering and any future offerings or (b) redemptions or exchanges by the Continuing LLC Owners of LLC Interests for shares of our Class A common stock or Class B Common Stock or for cash, as applicable, and (ii) certain other tax benefits related to our making payments under the Tax Receivable Agreement. Although we will retain 50% of the amount of such tax benefits, this and other aspects of our organizational structure may adversely impact the future trading market for the Class A common stock.
In certain cases, payments under the Tax Receivable Agreement to the Continuing LLC Owners may be accelerated or significantly exceed the actual benefits we realize in respect of the tax attributes subject to the Tax Receivable Agreement.
The Tax Receivable Agreement provides that upon certain changes of control or if, at any time, we elect an early termination of the Tax Receivable Agreement, then our obligations, or our successor’s obligations, to make payments under the Tax Receivable Agreement would be accelerated and calculated based on certain assumptions, including an assumption that we would have sufficient taxable income to fully utilize all potential future tax benefits that are subject to the Tax Receivable Agreement.
As a result of the foregoing, (i) we could be required to make payments under the Tax Receivable Agreement that are greater than the specified percentage of the actual benefits we ultimately realize in respect of the tax benefits that are subject to the Tax Receivable Agreement (for example, if we do not end up having any income in the relevant period) and (ii) we would be required to make an immediate cash payment equal to the present value of the anticipated future tax benefits that are the subject of the Tax Receivable Agreement, which payment may be made significantly in advance of the actual realization, if any, of such future tax benefits. In these situations, our obligations under the Tax Receivable Agreement could have a substantial negative impact on our liquidity and could have the effect of delaying, deferring or preventing certain change of control transactions. There can be no assurance that we will be able to fund or finance our obligations under the Tax Receivable Agreement.
We will not be reimbursed for any payments made to the Continuing LLC Owners under the Tax Receivable Agreement in the event that any tax benefits are disallowed.
Payments under the Tax Receivable Agreement are based on the tax reporting positions that we determine, and the Internal Revenue Service or another tax authority may challenge all or part of the tax basis increases, as well as other related tax positions we take, and a court could sustain such challenge. We will not be reimbursed for any cash payments previously made to the Continuing LLC Owners under the Tax Receivable Agreement in the event that any tax benefits initially claimed by us and for which payment has been made to a Continuing LLC Owner are subsequently challenged by a taxing authority and are ultimately disallowed. Instead, any excess cash payments made by us to a Continuing LLC Owner will be netted against any future cash payments that we might otherwise be required to make to such Continuing LLC Owner under the terms of the Tax Receivable Agreement. However, we might not determine that we have effectively made an excess cash payment to a Continuing LLC Owner for a number of years following the initial time of such payment and, if any of our tax reporting positions are challenged by a taxing authority, we will not be permitted to reduce any future cash payments under the Tax Receivable Agreement until any such challenge is finally settled or determined. As a result, payments could be made under the Tax Receivable Agreement in excess of the tax savings that
57
we realize in respect of the tax attributes with respect to a Continuing LLC Owner that are the subject of the Tax Receivable Agreement.
Unanticipated changes in effective tax rates or adverse outcomes resulting from examination of our income or other tax returns could materially adversely affect our results of operations and financial condition.
We are subject to taxation by U.S. federal, state, local and foreign tax authorities, and our tax liabilities will be affected by the allocation of expenses to differing jurisdictions. Our future effective tax rates could be subject to volatility or adversely affected by a number of factors, including:
|
· |
changes in the valuation of our deferred tax assets and liabilities; |
|
· |
expected timing and amount of the release of any tax valuation allowances; |
|
· |
tax effects of stock-based compensation; |
|
· |
changes in tax laws, regulations or interpretations thereof; or |
|
· |
future earnings being lower than anticipated in countries where we have lower statutory tax rates and higher than anticipated in countries where we have higher statutory tax rates. |
In addition, we may be subject to audits of our income, sales and other transaction taxes by U.S. federal, state, local and foreign taxing authorities. Outcomes from these audits could have an adverse effect on our results of operations and financial condition.
In certain circumstances, liability for adjustments to a partnership’s tax return may be imputed to the partnership itself absent an election to the contrary. TWM LLC may be subject to material liabilities if, for example, its calculations of taxable income are incorrect.
If we are deemed to be an investment company under the Investment Company Act of 1940, as amended (the “1940 Act”), as a result of our ownership of TWM LLC, applicable restrictions could make it impractical for us to continue our business as contemplated and could have a material adverse effect on our business.
Under Sections 3(a)(1)(A) and (C) of the 1940 Act, a company generally will be deemed to be an “investment company” for purposes of the 1940 Act if (i) it is, or holds itself out as being, engaged primarily, or proposes to engage primarily, in the business of investing, reinvesting or trading in securities or (ii) it engages, or proposes to engage, in the business of investing, reinvesting, owning, holding or trading in securities and it owns or proposes to acquire investment securities having a value exceeding 40% of the value of its total assets (exclusive of U.S. government securities and cash items) on an unconsolidated basis. We do not believe that we are an “investment company,” as such term is defined in either of those sections of the 1940 Act.
As the sole manager of TWM LLC, we control and operate TWM LLC. On that basis, we believe that our interest in TWM LLC is not an “investment security” as that term is used in the 1940 Act. However, if we were to cease participation in the management of TWM LLC, our interest in TWM LLC could be deemed an “investment security” for purposes of the 1940 Act.
We and TWM LLC intend to continue to conduct our operations so that we will not be deemed an investment company. However, if we are deemed to be an investment company, restrictions imposed by the 1940 Act, including limitations on our capital structure and our ability to transact with affiliates, could make it impractical for us to continue our business as contemplated and could have a material adverse effect on our business.
Risks Relating to Ownership of Our Class A Common Stock
The Refinitiv Owners and their affiliates control us and their interests may conflict with ours or yours in the future.
The Refinitiv Owners and their affiliates currently control approximately 77.1% of the combined voting power of our common stock as a result of their ownership of our Class B common stock and Class D common stock, each share of which is entitled to 10 votes on all matters submitted to a vote of our stockholders. Moreover, under our amended and restated bylaws and the Stockholders Agreement, for so long as the Refinitiv Owners and their affiliates together
58
continue to beneficially own at least 10% of the combined voting power of our common stock, we will agree to nominate to our board of directors a certain number of individuals designated by the Refinitiv Owners. Even when the Refinitiv Owners and their affiliates cease to own shares of our common stock representing a majority of the combined voting power, for so long as the Refinitiv Owners continue to own a significant percentage of our common stock, the Refinitiv Owners will still be able to significantly influence the composition of our board of directors and the approval of actions requiring stockholder approval through their combined voting power. Accordingly, for such period of time, the Refinitiv Owners and their affiliates will continue to have significant influence with respect to our management, business plans and policies. In particular, the Refinitiv Owners and their affiliates are able to cause or prevent a change of control of our company or a change in the composition of our board of directors and could preclude any unsolicited acquisition of our company. The concentration of voting power could deprive you of an opportunity to receive a premium for your shares of Class A common stock as part of a sale of our company and ultimately might affect the market price of our Class A common stock.
The Refinitiv Owners and their affiliates engage in a broad spectrum of activities. In the ordinary course of their business activities, the Refinitiv Owners and their affiliates may engage in activities where their interests conflict with our interests or those of our stockholders. Our amended and restated certificate of incorporation provides that none of the Refinitiv Owners, any of their affiliates or any director who is not employed by us (including any non-employee director who serves as one of our officers in both his director and officer capacities) or his or her affiliates has any duty to refrain from engaging, directly or indirectly, in the same business activities or similar business activities or lines of business in which we operate. The Refinitiv Owners and their affiliates also may pursue acquisition opportunities that may be complementary to our business, and, as a result, those acquisition opportunities may not be available to us. In addition, the Refinitiv Owners and their affiliates may have an interest in us pursuing acquisitions, divestitures and other transactions that, in their judgment, could enhance their investment, even though such transactions might involve risks to you.
The Refinitiv Direct Owner and the Continuing LLC Owners may require us to issue additional shares of our Class A common stock.
As of January 31, 2020, we have an aggregate of 931,056,956 shares of Class A common stock authorized but unissued, including 154,244,233 shares of Class A common stock issuable upon the redemption or exchange of LLC Interests that are held by the Continuing LLC Owners or the exchange of shares of Class B common stock that are held by the Refinitiv Direct Owner and any other future holders of Class B common stock. Subject to certain restrictions set forth in the TWM LLC Agreement, the Continuing LLC Owners are entitled to have their LLC Interests redeemed for newly issued shares of our Class A common stock or Class B common stock, in each case, on a one-for-one basis (in which case such holders’ shares of Class C common stock or Class D common stock, as the case may be, will be cancelled on a one-for-one basis upon any such issuance). Shares of our Class B common stock may also be exchanged at any time, at the option of the holder, for newly issued shares of Class A common stock (in which case such holders’ shares of Class B common stock will be cancelled on a one-for-one basis upon any such issuance).
We cannot predict the size of future issuances of our Class A common stock or the effect, if any, that future issuances and sales of shares of our Class A common stock may have on the market price of our Class A common stock. Sales or distributions of substantial amounts of our Class A common stock, including shares issued in connection with an acquisition, or the perception that such sales or distributions could occur, may cause the market price of our Class A common stock to decline.
We are a “controlled company” within the meaning of the corporate governance standards of Nasdaq and, as a result, qualify for, and rely on, exemptions from certain corporate governance requirements.
Refinitiv owns a majority of the combined voting power in us. As a result, we are a “controlled company” within the meaning of the corporate governance standards of Nasdaq. A company of which more than 50% of the voting power is held by an individual, a group or another company is a “controlled company” within the meaning of the corporate governance standards of Nasdaq and may elect not to comply with certain corporate governance requirements of Nasdaq, including:
|
· |
the requirement that a majority of our board of directors consist of independent directors; |
59
|
· |
the requirement that director nominations be made, or recommended to the full board of directors, by its independent directors or by a nominations committee that is composed entirely of independent directors; and |
|
· |
the requirement that we have a compensation committee that is composed entirely of independent directors with a written charter addressing the committee’s purpose and responsibilities. |
We intend to continue to rely on all of the exemptions listed above. If we continue to utilize the exemptions, we will not have a majority of independent directors and our nominating and corporate governance and compensation committees will not consist entirely of independent directors. As a result, our board of directors and those committees may have more directors who do not meet Nasdaq independence standards than they would if those standards were to apply. The independence standards are intended to ensure that directors who meet those standards are free of any conflicting interest that could influence their actions as directors. Accordingly, you will not have the same protections afforded to stockholders of companies that are subject to all of the corporate governance requirements of Nasdaq.
The market price of our Class A common stock may be highly volatile, and you may not be able to resell your shares at or above the public offering price.
Prior to the IPO, there was no public market for our Class A common stock. Given our limited trading history, an active trading market for our Class A common stock may not be sustained, which could adversely affect your ability to sell your shares and the market price for your shares. Further, the market price and trading volumes of our Class A common stock could be volatile, and you could lose all or part of your investment. Stock markets have experienced extreme price and volume fluctuations that have affected and continue to affect the market prices of equity securities of many companies in our industry. The following factors, in addition to other factors described in this “Risk Factors” section, may have a significant impact on the market price and trading volume of our Class A common stock:
|
· |
negative trends in global economic conditions or activity levels in our industry; |
|
· |
changes in our relationship with our clients or in client needs or expectations or trends in the markets in which we operate; |
|
· |
announcements concerning or by our competitors or concerning our industry or the markets in which we operate in general; |
|
· |
announcements of investigations or regulatory scrutiny of our operations or lawsuits filed against us; |
|
· |
our ability to implement our business strategy; |
|
· |
our ability to complete and integrate acquisitions; |
|
· |
actual or anticipated fluctuations in our quarterly or annual operating results or failure to meet guidance given by us or any change in guidance given by us or in our guidance practices; |
|
· |
trading volume of our Class A common stock; |
|
· |
the failure of securities analysts to cover the Company or changes in financial estimates by the analysts who cover us, our competitors or our industry in general; |
|
· |
economic, political, social, legal and regulatory factors unrelated to our performance; |
|
· |
changes in accounting principles; |
|
· |
the loss of any of our management or key personnel; |
|
· |
sales of our Class A common stock by us, our executive officers, directors or our stockholders in the future; |
|
· |
investor perception of us, our competitors and our industry; |
|
· |
any adverse consequences related to our multi-class capital structure, such as stock index providers excluding companies with multi-class capital structures from certain indices; and |
|
· |
overall fluctuations in the U.S. equity markets generally. |
In addition, broad market and industry factors may negatively affect the market price of our Class A common stock, regardless of our actual operating performance, and factors beyond our control may cause our stock price to decline rapidly and unexpectedly.
Sales, or the potential for sales, of a substantial number of shares of our Class A common stock in the public market could cause our stock price to drop significantly.
60
Sales of a substantial number of shares of our Class A common stock in the public market or the perception that these sales might occur, could depress the market price of our Class A common stock and could impair our ability to raise capital through the sale of additional equity securities. As of January 31, 2020, we have 68,943,044 outstanding shares of Class A common stock and 931,056,956 shares of Class A common stock that are authorized but unissued that would be issuable upon redemption or exchange of LLC Interests or exchange of shares of our Class B common stock.
We entered into the Registration Rights Agreement in connection with the IPO pursuant to which the shares of Class A common stock that may be issued upon redemption or exchange of LLC Interests held by the Refinitiv LLC Owner and the Bank Stockholders and the shares of Class A common stock that may be issued upon exchange of shares of Class B common stock held by the Refinitiv Direct Owner are subject to certain transfer restrictions. Sales of a substantial number of Class A common stock upon expiration of such above-described agreement, the perception that such sales may occur, or early release of such agreement, could cause the market price of our shares of Class A common stock to fall or make it more difficult for you to sell your Class A common stock at a time and price that you deem appropriate.
All of our shares of Class A common stock outstanding as of the date of this Annual Report on Form 10-K (and shares of Class A common stock issuable upon redemption or exchange of LLC Interests or exchange of shares of our Class B common stock) may be sold in the public market by existing stockholders following the expiration or early release of the extended lock-up period in the Registration Rights Agreement, subject to applicable limitations imposed under federal securities laws. Sales of shares of our Class A common stock following the expiration or early release of the extended lock-up period in the Registration Rights Agreement could have a material adverse effect on the trading price of our Class A common stock.
In addition, shares of Class A common stock issued or issuable upon exercise of options that have currently vested are eligible for sale. We have filed a registration statement on Form S-8 under the Securities Act covering 31,819,860 shares of Class A common stock issued or issuable under our equity incentive plans. Accordingly, shares registered under such registration statement are available for sale in the open market following the vesting of awards, as applicable, expiration of any applicable lockup period and subject to Rule 144 limitations applicable to affiliates.
In addition, pursuant to the Registration Rights Agreement, we granted the Refinitiv Owners, the Bank Stockholders, their affiliates and certain of their transferees the right, under certain circumstances and subject to certain restrictions, to require us to register under the Securities Act shares of Class A common stock. Registration of these shares under the Securities Act would result in the shares becoming freely tradable without restriction under the Securities Act, except for shares held by our affiliates as defined in Rule 144 under the Securities Act.
If securities or industry analysts cease publishing research or reports about us, our business, our industry or markets or our competitors, or if they adversely change their recommendations or publish negative reports regarding our business or our Class A common stock, our stock price and trading volume could materially decline.
The trading market for our Class A common stock will be influenced by the research and reports that industry or securities analysts may publish about us, our business, our industry or markets or our competitors. We do not have any control over these analysts and we cannot provide any assurance that analysts will continue to cover us or provide favorable coverage. If any of the analysts who cover us adversely change their recommendation regarding our Class A common stock, or provide more favorable relative recommendations about our competitors, our stock price could materially decline. If any analyst who covers us were to cease coverage of our company or fail to regularly publish reports on us, we could lose visibility in the financial markets, which in turn could cause our stock price or trading volumes to materially decline.
We intend to continue to pay regular dividends on our Class A common stock and Class B common stock, but our ability to do so may be limited.
We intend to continue to pay cash dividends on our Class A common stock and Class B common stock on a quarterly basis, subject to the discretion of our board of directors and our compliance with applicable law, and depending on our and our subsidiaries’ results of operations, capital requirements, financial condition, business prospects,
61
contractual restrictions, restrictions imposed by applicable laws and other factors that our board of directors deems relevant.
Because we are a holding company and all of our business is conducted through our subsidiaries, we expect to pay dividends, if any, only from funds we receive from our subsidiaries. Accordingly, our ability to pay dividends to our stockholders is dependent on the earnings and distributions of funds from our subsidiaries. As the sole manager of TWM LLC, we intend to cause, and will rely on, TWM LLC to make distributions in respect of LLC Interests to fund our dividends. When TWM LLC makes such distributions, the Continuing LLC Owners will be entitled to receive equivalent distributions pro rata based on their economic interests in TWM LLC at the time of such distributions. In order for TWM LLC to make distributions, it may need to receive distributions from its subsidiaries. Certain of these subsidiaries are or may in the future be subject to regulatory capital requirements that limit the size or frequency of distributions. If TWM LLC is unable to cause these subsidiaries to make distributions, it may have inadequate funds to distribute to us and we may be unable to fund our dividends. Our ability to pay dividends may also be restricted by the terms of the Revolving Credit Facility, any future credit agreement or any future debt or preferred equity securities of Tradeweb or its subsidiaries.
Our dividend policy entails certain risks and limitations, particularly with respect to our liquidity. By paying cash dividends rather than investing that cash in our business or repaying any outstanding debt, we risk, among other things, slowing the expansion of our business, having insufficient cash to fund our operations or make capital expenditures or limiting our ability to incur borrowings. Our board of directors will periodically review the cash generated from our business and the capital expenditures required to finance our growth plans and determine whether to modify the amount of regular dividends and/or declare any periodic special dividends. There can be no assurance that our board of directors will not reduce the amount of regular cash dividends or cause us to cease paying dividends altogether.
Anti-takeover provisions in our organizational documents and Delaware law might discourage or delay acquisition attempts for us that you might consider favorable.
Our amended and restated certificate of incorporation and amended and restated bylaws contain provisions that may make the merger or acquisition of our company more difficult without the approval of our board of directors.
Among other things, these provisions:
|
· |
provide for a multi-class common stock structure with a 10 vote per share feature of our Class B common stock and Class D common stock; |
|
· |
allow us to authorize the issuance of undesignated preferred stock in connection with a stockholder rights plan or otherwise, the terms of which may be established and the shares of which may be issued without stockholder approval, and which may include super voting, special approval, dividend, or other rights or preferences superior to the rights of the holders of our common stock; |
|
· |
prohibit stockholder action by written consent from and after the date on which the Refinitiv Owners cease to beneficially own at least 50% of the total voting power of all then outstanding shares of our capital stock unless such action is recommended by all directors then in office; |
|
· |
provide that the board of directors is expressly authorized to make, alter or repeal our bylaws and that our stockholders may only amend our bylaws with the approval of 662∕3% or more in voting power of all outstanding shares of our capital stock, if the Refinitiv Owners and their respective affiliates beneficially own less than 50% in voting power of our stock entitled to vote generally in the election of directors; and |
|
· |
establish advance notice requirements for nominations for elections to our board or for proposing matters that can be acted upon by stockholders at stockholder meetings. |
In addition, while we have opted out of Section 203 of the DGCL, our amended and restated certificate of incorporation contains similar provisions providing that we may not engage in certain “business combinations” with any “interested stockholder” for a three-year period following the time that the stockholder became an interested stockholder, unless:
|
· |
prior to such time, our board of directors approved either the business combination or the transaction which resulted in the stockholder becoming an interested stockholder; |
62
|
· |
upon consummation of the transaction that resulted in the stockholder becoming an interested stockholder, the interested stockholder owned at least 85% of our voting stock outstanding at the time the transaction commenced, excluding certain shares; or |
|
· |
at or subsequent to that time, the business combination is approved by our board of directors and by the affirmative vote of holders of at least 662∕3% of our outstanding voting stock that is not owned by the interested stockholder. |
Our amended and restated certificate of incorporation provides that the Refinitiv Owners and their affiliates, and any of their respective direct or indirect transferees and any group as to which such persons are a party, do not constitute “interested stockholders” for purposes of this provision.
Further, as a Delaware corporation, we are also subject to provisions of Delaware law, which may impair a takeover attempt that our stockholders may find beneficial. These anti-takeover provisions and other provisions under Delaware law could discourage, delay or prevent a transaction involving a change in control of our company, including actions that our stockholders may deem advantageous, or negatively affect the market price of our Class A common stock. These provisions could also discourage proxy contests and make it more difficult for you and other stockholders to elect directors of your choosing and to cause us to take other corporate actions you desire. See Exhibit 4.2 to this Annual Report on Form 10-K for a description of our capital stock.
Our amended and restated certificate of incorporation designates the Court of Chancery of the State of Delaware as the sole and exclusive forum for certain types of actions and proceedings that may be initiated by our stockholders, which could limit our stockholders’ ability to obtain what such stockholders believe to be a favorable judicial forum for disputes with us or our directors, officers or other employees.
Our amended and restated certificate of incorporation provides that, unless we consent to the selection of an alternative forum, any (i) derivative action or proceeding brought on behalf of our company, (ii) action asserting a claim of breach of a fiduciary duty owed by any director, officer or other employee of our company to our company or our stockholders, (iii) action asserting a claim against us or any director or officer arising pursuant to any provision of the Delaware General Corporation Law (“DGCL”) or our amended and restated certificate of incorporation or our amended and restated bylaws or (iv) action asserting a claim against us or any director or officer of our company governed by the internal affairs doctrine, shall, to the fullest extent permitted by law, be exclusively brought in the Court of Chancery of the State of Delaware or, if such court does not have subject matter jurisdiction thereof, the federal district court of the State of Delaware. Notwithstanding the foregoing, the exclusive forum provision does not apply to suits brought to enforce any liability or duty created by the Exchange Act, the Securities Act or any other claim for which the federal courts have exclusive jurisdiction. Any person or entity purchasing or otherwise acquiring an interest in any shares of our capital stock shall be deemed to have notice of and to have consented to the forum provisions in our amended and restated certificate of incorporation. These choice-of-forum provisions may limit a stockholder’s ability to bring a claim in a judicial forum that he, she or it believes to be favorable for disputes with us or our directors, officers or other employees, which may discourage such lawsuits. Alternatively, if a court were to find these provisions of our amended and restated certificate of incorporation inapplicable or unenforceable with respect to one or more of the specified types of actions or proceedings, we may incur additional costs associated with resolving such matters in other jurisdictions, which could materially adversely affect our business, financial condition and results of operations and result in a diversion of the time and resources of our management and board of directors.
Taking advantage of the reduced disclosure requirements applicable to “emerging growth companies” may make our Class A common stock less attractive to investors.
The JOBS Act provides that, so long as a company qualifies as an “emerging growth company,” it will, among other things:
63
|
· |
be exempt from the provisions of Section 404(b) of the Sarbanes-Oxley Act requiring that its independent registered public accounting firm provide an attestation report on the effectiveness of its internal control over financial reporting; |
|
· |
be exempt from the “say on pay” and “say on golden parachute” advisory vote requirements of the Dodd-Frank Act; |
|
· |
be exempt from certain disclosure requirements of the Dodd-Frank Act relating to compensation of its executive officers and be permitted to omit the detailed compensation discussion and analysis from proxy statements and reports filed under the Exchange Act; and |
|
· |
be exempt from any rules that may be adopted by the Public Company Accounting Oversight Board requiring mandatory audit firm rotations or a supplement to the auditor’s report on the financial statements. |
We intend to continue to take advantage of each of the exemptions described above. In addition, the JOBS Act permits an emerging growth company like us to take advantage of an extended transition period to comply with new or revised accounting standards applicable to public companies. We have irrevocably elected not to take advantage of the extension of time to comply with new or revised financial accounting standards available under Section 107(b) of the JOBS Act.
We could be an emerging growth company for up to five years after the IPO. We cannot predict if investors will find our Class A common stock less attractive because we rely on these exemptions, or if taking advantage of these exemptions will result in less active trading or more volatility in the market price of our Class A common stock.
Failure to establish and maintain effective internal controls in accordance with Section 404 of the Sarbanes-Oxley Act could have a material adverse effect on our business and stock price.
We are not currently required to make a formal assessment of the effectiveness of our internal control over financial reporting for purposes of the rules of the SEC implementing Section 404 of the Sarbanes Oxley-Act. We are required to comply with the SEC’s rules implementing Sections 302 and 906 of the Sarbanes-Oxley Act, which require management to certify financial and other information in our quarterly and annual reports and provide an annual management report on the effectiveness of control over financial reporting. Although we are required to disclose changes made in our internal controls and procedures on a quarterly basis, we are not required to make our first annual assessment of our internal control over financial reporting pursuant to Section 404 until our annual report on Form 10-K for the year ending December 31, 2020. As an emerging growth company, our independent registered public accounting firm will not be required to formally attest to the effectiveness of our internal control over financial reporting in our annual report on Form 10-K at the later of the year following our first annual report required to be filed with the SEC or the date on which we are no longer an emerging growth company. At such time, our independent registered public accounting firm may issue a report that is adverse in the event that in its opinion we have not maintained effective internal control over financial reporting based on criteria established under in Internal Control – Integrated Framework (2013) issued by the Committee of Sponsoring Organizations of the Treadway Commission.
As a private company, we did not have any internal audit function. To comply with the requirements of being a public company, we have undertaken various actions, and will need to take additional actions, such as implementing new internal controls and procedures and hiring additional accounting or internal audit staff or consultants. Testing and maintaining internal control can divert our management’s attention from other matters that are important to the operation of our business. Additionally, when evaluating our internal control over financial reporting, we may identify material weaknesses that we may not be able to remediate in time to meet the applicable deadline imposed upon us for compliance with the management assessment and auditor attestation requirements of Section 404. If we identify any material weaknesses in our internal control over financial reporting or are unable to comply with the requirements of Section 404 or assert that our internal control over financial reporting is effective, or if our independent registered public accounting firm is unable to express an opinion as to the effectiveness of our internal control over financial reporting once we are no longer an emerging growth company, investors may lose confidence in the accuracy and completeness of our financial reports and the market price of our Class A common stock could be negatively affected, and we could become subject to investigations by the stock exchange on which our securities are listed, the SEC or other regulatory authorities, which could require additional financial and management resources. In addition, if we fail to remedy any material weakness, our financial statements could be inaccurate and we could face restricted access to capital markets.
64
The requirements of being a public company, including compliance with the reporting requirements of the Exchange Act and the requirements of the Sarbanes-Oxley Act and Nasdaq, may strain our resources, increase our costs and divert management’s attention, and we may be unable to comply with these requirements in a timely or cost-effective manner.
As a public company, we are subject to the reporting requirements of the Exchange Act, and the corporate governance standards of the Sarbanes-Oxley Act and Nasdaq. We have a limited history operating as a public company, and these requirements may place a strain on our management, systems and resources. In addition, we have incurred, and expect to continue to incur significant legal, accounting, insurance and other expenses that we did not incur as a private company. The Exchange Act requires us to file annual, quarterly and current reports with respect to our business and financial condition within specified time periods and to prepare a proxy statement with respect to our annual meeting of stockholders. The Sarbanes-Oxley Act requires that we maintain effective disclosure controls and procedures and internal control over financial reporting. Nasdaq requires that we comply with various corporate governance requirements. To maintain and improve the effectiveness of our disclosure controls and procedures and internal control over financial reporting and comply with the Exchange Act and Nasdaq requirements, significant resources and management oversight are required. This may divert management’s attention from other business concerns and lead to significant costs associated with compliance, which could have a material adverse effect on us and the market price of our Class A common stock.
The expenses incurred by public companies generally for reporting and corporate governance purposes have been increasing. We expect these rules and regulations to continue to increase our legal and financial compliance costs and to make some activities more time-consuming and costly. These laws and regulations could also make it more difficult or costly for us to obtain certain types of insurance, including director and officer liability insurance, and we may be forced to accept reduced policy limits and coverage or incur substantially higher costs to obtain the same or similar coverage. These laws and regulations could also make it more difficult for us to attract and retain qualified persons to serve on our board of directors or its committees or as our executive officers. Advocacy efforts by stockholders and third parties may also prompt even more changes in governance and reporting requirements. We cannot predict or estimate the amount of additional costs we may incur or the timing of these costs. Furthermore, if we are unable to satisfy our obligations as a public company, we could be subject to delisting of our Class A common stock, fines, sanctions and other regulatory action and potentially civil litigation.
We may be subject to securities litigation, which is expensive and could divert management attention.
Our stock price may be volatile and, in the past, companies that have experienced volatility in the market price of their stock have been subject to securities class action litigation. We may be the target of this type of litigation in the future. Litigation of this type could result in substantial costs and diversion of management’s attention and resources, which could have a material adverse effect on our business, financial condition and results of operations. Any adverse determination in litigation could also subject us to significant liabilities.
ITEM 1B. UNRESOLVED STAFF COMMENTS
None.
65
Our corporate headquarters is located in New York, New York. As of December 31, 2019, our principal offices consisted of the following properties:
|
Location |
|
Square Feet |
|
Lease Expiration Date |
|
Use |
|
New York, New York(1) |
|
41,062 |
|
5/31/2021 |
|
Office Space |
|
Jersey City, New Jersey |
|
65,242 |
|
12/31/2027 |
|
Office Space |
|
London, United Kingdom |
|
16,259 |
|
9/30/2024 |
|
Office Space |
|
(1) |
We currently anticipate that in 2020 we will likely enter into a new lease to increase the size of our corporate headquarters in or near New York, New York, which may result in increased operating expenses. |
We also lease offices in Los Angeles, California, Boca Raton, Florida, Chicago, Illinois and Garden City, New York. Through a shared services agreement with Refinitiv, we lease office space in Amsterdam, Netherlands.
Our infrastructure operates out of third-party data centers in Secaucus, New Jersey, Weehawken, New Jersey, Piscataway, New Jersey, Chicago, Illinois and Elk Grove, Illinois and, outside the United States, in Hounslow, United Kingdom, Slough, United Kingdom, Saitama, Japan and Tokyo, Japan.
We believe that our facilities are in good operating condition and adequately meet our current needs, and that additional or alternative space to support future use and expansion will be available on reasonable commercial terms.
From time to time, we are subject to various claims, lawsuits and other legal proceedings, including reviews, investigations and proceedings by governmental and self-regulatory agencies regarding our business. Set forth below is a summary of our currently pending material legal proceedings. While the ultimate resolution of these matters cannot presently be determined, we do not believe that, taking into account any applicable insurance coverage, any of our pending legal proceedings, including the matters set forth below, could reasonably be expected to have a material adverse effect on our business, financial condition or results of operations. However, legal matters are inherently unpredictable and subject to significant uncertainties, some of which are beyond our control. As such, there can be no assurance that the final outcome of any of our pending or future legal proceedings will not have a material adverse effect on our business, financial condition or results of operations, including for any particular reporting period. In addition, regardless of the outcome, legal proceedings may have an adverse impact on us because of defense and settlement costs, diversion of management resources, reputational loss and other factors.
We record our best estimate of a loss, including estimated defense costs, when the loss is considered probable and the amount of such loss can be reasonably estimated. Based on our experience, we believe that the amount of damages claimed in a legal proceeding is not a meaningful indicator of the potential liability. At this time, we cannot reasonably predict the timing or outcomes of, or estimate the amount of loss, or range of loss, if any, related to, our pending legal proceedings, including the matters described below, and therefore we do not have any contingency reserves established for any of these matters.
IDC Matter
In September 2015, IDC Financial Publishing, Inc. (“IDC”) filed a lawsuit in the United States District Court for the Eastern District of Wisconsin against BondDesk Group LLC and Tradeweb Markets LLC (together, the “Tradeweb Parties”), and Fidelity Global Brokerage Group, Inc., Fidelity Brokerage Services, LLC, and National Financial Services, LLC (collectively, “Fidelity”), captioned IDC Financial Publishing Inc. v. BondDesk Group LLC, et al., Case No. 2:15-cv-01085-PP, relating to the distribution of IDC’s financial strength ratings over Tradeweb’s trading platform to Fidelity, its registered investment advisors and Fidelity’s correspondent banks. IDC alleges that while certain business units of Fidelity were licensed to receive its data via Tradeweb’s platform, the IDC data was also distributed without authorization to Fidelity’s institutional customers for approximately five years. The complaint, as amended, asserts
66
claims for breach of contract and intentional misrepresentation against all of the defendants (as well as a claim of tortious interference with contract against Fidelity). IDC claims to have suffered approximately $80 million in damages and also seeks punitive damages, attorneys’ fees and costs. The defendants answered the complaint denying the claims and asserting various affirmative defenses.
Treasuries Matter
In December 2015, more than 40 substantially similar putative class action complaints filed by individual investors, pension funds, retirement funds, insurance companies, municipalities, hedge funds and banks were consolidated in the United States District Court for the Southern District of New York under the caption In re Treasuries Securities Auction Antitrust Litigation, No. 1:15-md-2673 (S.D.N.Y.) (PGG). In November 2017, the plaintiffs in these consolidated actions filed a consolidated amended complaint in which they allege (a) an “Auction Conspiracy” among primary dealers of United States Treasury securities in auctions for Treasury securities and in the “when-issued” and secondary markets for such securities and other derivative financial products; and (b) a “Boycott Conspiracy” among certain primary dealers and Tradeweb Markets LLC, Tradeweb IDB Markets, Inc. and Dealerweb Inc. (collectively, the “Tradeweb Parties”). The plaintiffs purport to represent two putative classes: an “Auction Class” consisting of all persons who purchased Treasuries in an auction, transacted in Treasuries with a dealer defendant or through an exchange from January 1, 2007 through June 8, 2015, and a “Boycott Class” consisting of all persons who transacted in Treasury securities in the secondary market with a dealer defendant from November 15, 2013 to the present.
The consolidated amended complaint alleges that the Tradeweb Parties participated in the alleged “Boycott Conspiracy” through which certain primary dealers are alleged to have boycotted trading platforms permitting “all-to-all” trading of Treasury securities. The complaint asserts claims against the Tradeweb Parties under Section 1 of the Sherman Antitrust Act and for unjust enrichment under state law and seeks to permanently enjoin the Tradeweb Parties and the dealer defendants from maintaining the alleged “Boycott Conspiracy” and an award of treble damages, costs and expenses.
Defendants filed motions to dismiss in February 2018, including a separate motion to dismiss filed by the Tradeweb Parties. The motions to dismiss are pending. We believe that we have meritorious defenses to the claims set forth in the complaint and intend to continue to vigorously defend our position.
Interest Rate Swaps Matter
In November 2015, Public School Teachers’ Pension and Retirement Fund of Chicago, on behalf of itself and a putative class of other similar purchasers of interest rate swaps (“IRS”), filed a lawsuit in the United States District Court for the Southern District of New York against Tradeweb Markets LLC, ICAP Capital Markets LLC and several investment banks and their affiliates (the “Dealer Defendants”), captioned Public School Teachers’ Pension and Retirement Fund of Chicago v. Bank of America Corporation, Case No. 15-cv-09219 (S.D.N.Y.). Additional plaintiffs, including Tera Group Inc. and Javelin Capital Markets LLC, filed lawsuits and, ultimately, the cases were consolidated under the caption In re Interest Rate Swaps Antitrust Litigation, No. 1:16-md-2704.
The plaintiffs allege that defendants conspired to forestall the emergence of exchange style trading for IRS and seek treble damages and declaratory and injunctive relief under federal antitrust laws with respect to Tradeweb Markets LLC. Plaintiffs allege that Tradeweb agreed with the Dealer Defendants to shutter its plans to launch an exchange-like trading platform for IRS in furtherance of the conspiracy and provided a forum where the Dealer Defendants carried out their alleged collusion.
Tradeweb Markets LLC and certain other entities were dismissed from the lawsuit in July 2017, following the court’s order and opinion on defendants’ motions to dismiss. In May 2018, the court denied plaintiffs’ request for leave to amend their complaint to reinstate Tradeweb Markets LLC as a defendant, but granted leave to amend to include additional allegations. In October 2018, plaintiffs filed a motion seeking leave to file a proposed fourth amended complaint. They did not seek to name Tradeweb Markets LLC as a defendant but instead purported to reserve all rights with respect to Tradeweb Markets LLC. While Tradeweb Markets LLC is not a party to the litigation, it was actively engaged in third-party discovery and responded to the parties’ data and document requests. Additionally, in June 2018,
67
the plaintiffs notified the court that they are likely to move for entry of judgment of the dismissed claims. We believe that we have meritorious defenses to any allegations asserted against us in this litigation and, if necessary, intend to vigorously defend our position.
ITEM 4. MINE SAFETY DISCLOSURES
Not applicable.
68
ITEM 5. MARKET FOR REGISTRANT’S COMMON EQUITY, RELATED STOCKHOLDER MATTERS AND ISSUER PURCHASES OF EQUITY SECURITIES.
Market Information
Our Class A common stock trades on the Nasdaq Global Select Market under the ticker symbol “TW.” There is no established public trading market for our Class B common stock, Class C common stock or Class D common stock.
Holders
As of December 31, 2019, there is one holder of record of our Class A common stock, Cede & Co., a nominee for The Depository Trust Company, one holder of record of our Class B common stock, two holders of record of our Class C common stock and 29 holders of record of our Class D common stock. A substantially greater number of holders of our Class A common stock are “street name” or beneficial owners, whose shares of Class A common stock are held of record by banks, brokerage firms and other financial institutions. Shares of Class A common stock held by banks, brokerage firms and other financial institutions as nominees for beneficial owners is considered to be held of record by Cede & Co., who is considered to be one holder of record.
Dividend Policy
Subject to legally available funds, we intend to continue to pay quarterly cash dividends on our Class A common stock and Class B common stock equal to $0.08 per share. The declaration, amount and payment of any dividends will be at the sole discretion of our board of directors and will depend on our and our subsidiaries’ results of operations, capital requirements, financial condition, business prospects, contractual restrictions, restrictions imposed by applicable laws and other factors that our board of directors may deem relevant. Because we are a holding company and all of our business is conducted through our subsidiaries, we expect to pay dividends, if any, from funds we receive from our subsidiaries. Accordingly, our ability to pay dividends to our stockholders is dependent on the earnings and distributions of funds from our subsidiaries. As the sole manager of TWM LLC, we intend to cause, and will rely on, TWM LLC to make distributions in respect of LLC Interests to fund our dividends. When TWM LLC makes such distributions, the Continuing LLC Owners will be entitled to receive equivalent distributions pro rata based on their economic interests in TWM LLC at the time of such distributions. Because Tradeweb must pay taxes and make payments under the Tax Receivable Agreement, amounts ultimately distributed as dividends to holders of our Class A common stock or Class B common stock are expected to be less than the amounts distributed by TWM LLC to its members on a per LLC Interest basis. In order for TWM LLC to make distributions, it may need to receive distributions from its subsidiaries. If TWM LLC is unable to cause these subsidiaries to make distributions, it may have inadequate funds to distribute to us and we may be unable to fund our dividends. Our ability to pay dividends may also be restricted by the terms of the Revolving Credit Facility or any future credit agreement or any future debt or preferred equity securities of Tradeweb or its subsidiaries.
Our board of directors will periodically review the cash generated from our business and the capital expenditures required to finance our growth plans and determine whether to modify the amount of regular dividends and/or declare any periodic special dividends. Any future determination to change the amount of dividends and/or declare special dividends will be at the discretion of our board of directors and will be dependent upon then-existing conditions and other factors that our board of directors considers relevant.
See Part I, Item 1A. – “Risk Factors — Risks Relating to the Company and Our Organizational Structure — Our principal asset is our equity interest in TWM LLC, and, accordingly, we depend on distributions from TWM LLC to pay our taxes and expenses, including payments under the Tax Receivable Agreement” and Part I, Item 1A. – “Risk Factors — Risks Relating to Ownership of our Class A Common Stock — We intend to continue to pay regular dividends on our Class A common stock and Class B common stock, but our ability to do so may be limited.”
69
In June, September and December 2019, Tradeweb Markets Inc. paid quarterly cash dividends to the holders of Class A common stock and Class B common stock in aggregate amounts of $11.4 million, $11.4 million and $13.1 million, respectively.
Securities Authorized for Issuance Under Equity Compensation Plans
The following table provides information about shares of Class A common stock authorized for issuance under all of our equity compensation plans as of December 31, 2019:
|
|
|
|
|
|
|
|
|
|||
|
|
|
|
|
|
|
|
|
|||
|
|
|
|
|
|
|
|
|
|||
|
Plan Category |
|
Number of securities to |
|
Weighted-average |
|
Number of securities remaining available for future |
|
|||
|
Equity compensation plans approved by security holders |
|
|
21,301,477 |
(1) |
$ |
21.61 | (2) |
|
9,312,374 |
(3) |
|
Equity compensation plans not approved by security holders |
|
|
- |
|
|
- |
|
|
- |
|
|
Total |
|
|
21,301,477 |
|
|
- |
|
|
9,312,374 |
|
|
(1) |
Includes 11,112 shares of common stock that may be issued pursuant to outstanding restricted stock units (“RSUs”) under the Tradeweb Markets Inc. 2019 Omnibus Equity Incentive Plan; 17,775,944 shares of common stock that may be issued pursuant to outstanding stock options under the Amended and Restated Tradeweb Markets Inc. 2018 Share Option Plan; and 3,514,421 shares of common stock that may be issued pursuant to outstanding performance-based restricted share units (“PRSUs”) under the Amended and Restated Tradeweb Markets Inc. PRSU Plan. The number of PRSUs set forth above includes 1,976,569 PRSUs for which performance has already been measured but, as of December 31, 2019, remain subject to time-based vesting and 1,537,852 PRSUs for which performance has not yet been measured and have been included for this purpose at the potential maximum payout level. |
|
(2) |
The weighted average exercise price does not take into account RSU or PRSU awards. |
|
(3) |
Includes 8,830,752 shares of common stock that remain available for issuance under the Tradeweb Markets Inc. 2019 Omnibus Equity Incentive Plan; and 481,622 shares of common stock that remain available for issuance under the Amended and Restated Tradeweb Markets Inc. 2018 Share Option Plan. As of December 31, 2019, no additional awards were permitted to be issued under the Amended and Restated Tradeweb Markets Inc. PRSU Plan. |
Unregistered Sales of Equity Securities
In connection with the Reorganization Transactions, Tradeweb Markets Inc., among other things, issued an aggregate of 96,933,192 shares of Class B common stock to Refinitiv Parent Limited. In addition, in connection with the Reorganization Transactions, Tradeweb Markets Inc. issued 20,000,000 shares of Class C common stock and 105,289,005 shares of Class D common stock to the Continuing LLC Owners. These equityholders also received 125,289,005 LLC Interests and an immaterial amount of cash in lieu of the issuance of any fractional interests. Holders of Class B common stock may from time to time exchange all or a portion of their shares of Class B common stock for newly issued shares of Class A common stock on a one-for-one basis. In addition, the LLC Interests are redeemable for newly issued shares of Class A common stock or Class B common stock on a one-for-one basis. For further information, see Note 1 –Organization and Note 11 – Stockholders’ Equity to our audited consolidated financial statements included elsewhere in this Annual Report on Form 10-K. The issuances of the Class B common stock, Class C common stock and Class D common stock described in this paragraph were made in reliance on Section 4(a)(2) of the Securities Act. The Company relied on this exemption from registration based in part on the nature of the transactions and the various representations made by the parties thereto.
Stock Performance Graph
The following graph shows a comparison from April 4, 2019 (the date our Class A common stock commenced trading on Nasdaq) through December 31, 2019 of the cumulative total return for (i) our Class A common stock, (ii) the S&P 500 Index and (iii) the Dow Jones U.S. Financials Index. The graph assumes an initial investment of $100 in our
70
Class A common stock and in each index on April 4, 2019, and that all dividends were reinvested. Historical stock price performance should not be relied upon as an indication of future stock price performance.
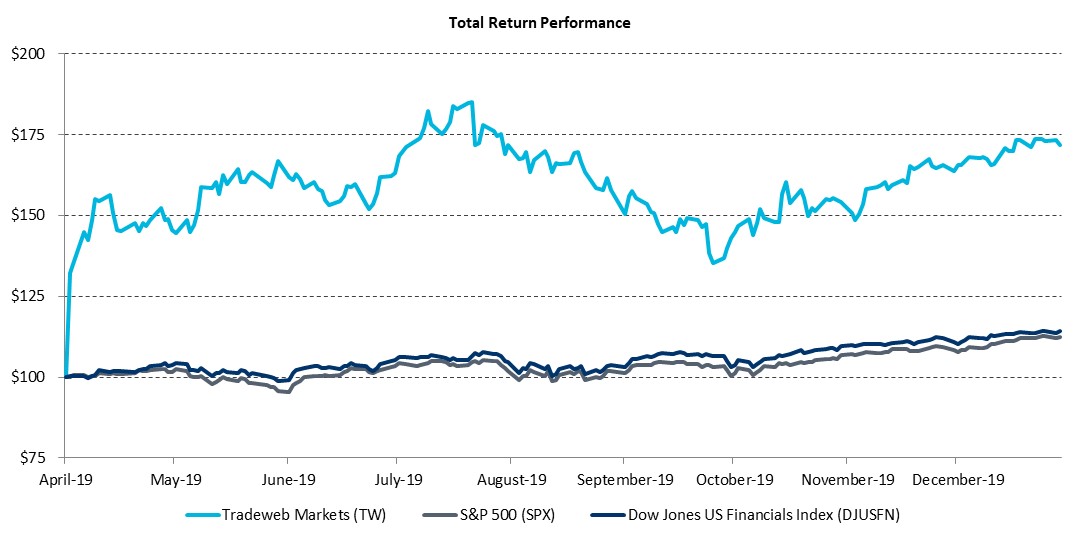
The stock performance graph and related information shall not be deemed “soliciting material” or to be “filed” for purposes of Section 18 of the Exchange Act or otherwise subject to the liabilities under that Section, and shall not be deemed to be incorporated by reference into any future filing under the Securities Act or Exchange Act, except to the extent that we specifically incorporate it by reference into such filing.
Purchase of Equity Securities by the Issuer and Affiliated Purchasers
The following table provides information regarding purchases of shares of our Class A common stock by us and our “affiliated purchasers” (as defined in Rule 10b-18(a)(3) under the Exchange Act) during the three months ended December 31, 2019.
|
|
|
|
|
|
|
|
Total Number of |
|
Dollar Value of |
|
|
|
|
|
|
|
|
Shares |
|
Shares That May |
|
|
|
|
|
|
|
|
Purchased as |
|
Yet Be |
|
|
|
Total Number of |
|
|
|
|
Part of Publicly |
|
Purchased Under |
|
|
|
Shares |
|
Average Price |
|
Announced Plans |
|
the Plans and |
|
|
Period |
|
Purchased(1) |
|
Paid Per Share |
|
and Programs |
|
Programs |
|
|
October 1, 2019 - October 31, 2019 |
|
27,917 |
|
$ |
40.74 |
|
— |
|
— |
|
November 1, 2019 - November 30, 2019 |
|
17,476 |
|
$ |
40.74 |
|
— |
|
— |
|
December 1, 2019 - December 31, 2019 |
|
— |
|
|
— |
|
— |
|
— |
|
|
|
45,393 |
|
$ |
40.74 |
|
|
|
|
|
(1) |
We used a portion of the net proceeds that we received from the October 2019 follow-on offering to purchase 45,393 shares of Class A common stock from certain of our executive officers (and canceled such shares of Class A common stock), at a purchase price per share equal to the public offering price per share of our Class A common stock, less the underwriting discounts and commissions payable thereon. |
ITEM 6. SELECTED FINANCIAL DATA
The following tables present selected historical consolidated financial and other data for the periods indicated below. Tradeweb Markets LLC is the predecessor of the registrant, Tradeweb Markets Inc., for financial reporting purposes. Prior to the consummation of the Reorganization Transactions, Tradeweb Markets Inc. did not conduct any activities other than those incident to its formation and the IPO. As a result of the Reorganization Transactions completed in connection with the IPO, Tradeweb Markets Inc. became the sole manager of Tradeweb Markets LLC
71
whose only material assets consist of its equity interest in Tradeweb Markets LLC and related deferred tax assets. As a result, Tradeweb Markets Inc. consolidates the financial results of Tradeweb Markets LLC and its subsidiaries. Accordingly, the historical consolidated financial data presented below relating to periods prior to and including March 31, 2019 reflect the results of operations, financial position and cash flows of Tradeweb Markets LLC and its subsidiaries. The historical consolidated financial data presented below relating to periods beginning on April 1, 2019, and through and including December 31, 2019 reflect the results of operations, financial position and cash flows of Tradeweb Markets Inc. and its subsidiaries, including the consolidation of its investment in Tradeweb Markets LLC. See “Basis of Presentation.”
The selected consolidated statement of income data for the year ended December 31, 2019, the 2018 Successor Period, the 2018 Predecessor Period and the year ended December 31, 2017 and the selected consolidated statement of financial condition data as of December 31, 2019 and 2018 are derived from our audited consolidated financial statements included elsewhere in this Annual Report on Form 10-K. The selected consolidated statement of income data for the year ended December 31, 2016 and the selected consolidated statement of financial condition data as of December 31, 2017 and 2016 are derived from the audited consolidated financial statements of Tradeweb Markets LLC not included elsewhere in this Annual Report on Form 10-K.
As discussed elsewhere in this Annual Report on Form 10-K, as a result of the Refinitiv Transaction, we revalued our assets and liabilities based on their fair values as of the closing date of the Refinitiv Transaction in accordance with the acquisition method of accounting. Due to the change in the basis of accounting resulting from the application of pushdown accounting, we are required to present separately the financial information for the period beginning on October 1, 2018, and through and including December 31, 2019, which we refer to as the “Successor period,” and the financial information for the periods prior to, and including, September 30, 2018, which we refer to as the “Predecessor period.” Certain financial information of the Successor period is not comparable to that of the Predecessor period. For a discussion of our Successor and Predecessor periods, see “Basis of Presentation” and Part II, Item 7. – “Management’s Discussion and Analysis of Financial Condition and Results of Operations — Effects of Pushdown Accounting on our Financial Statements.”
The results of operations for the periods presented below are not necessarily indicative of the results to be expected for any future period. The information set forth below should be read together with “Basis of Presentation,” Part II, Item 7. – “Management’s Discussion and Analysis of Financial Condition and Results of Operations” and our audited consolidated financial statements and related notes thereto appearing elsewhere in this Annual Report on Form 10-K.
72
|
|
|
|
|
|
|
|
|
|
|
|
|
|
|
|
|
|
|
|
|
Tradeweb Markets, In. |
|
Tradeweb Markets LLC |
|
|||||||||||
|
|
|
Successor |
|
Successor |
|
Predecessor |
|
Predecessor |
|
Predecessor |
|
|||||
|
|
|
Year Ended |
|
October 1, 2018 to |
|
January 1, 2018 to |
|
Year Ended |
|
Year Ended |
|
|||||
|
|
|
December 31, |
|
December 31, |
|
September 30, |
|
December 31, |
|
December 31, |
|
|||||
|
|
|
2019 |
|
2018 |
|
2018 |
|
2017 |
|
2016 |
|
|||||
|
Statement of Income Data: |
|
(in thousands, except share and per share amounts) |
||||||||||||||
|
Revenues |
|
|
|
|
|
|
|
|
|
|
|
|
|
|
|
|
|
Transaction fees |
|
$ |
423,583 |
|
$ |
97,130 |
|
$ |
273,751 |
|
$ |
267,020 |
|
$ |
230,171 |
|
|
Subscription fees (1) |
|
|
194,366 |
|
|
46,519 |
|
|
143,981 |
|
|
194,534 |
|
|
191,983 |
|
|
Commissions |
|
|
149,365 |
|
|
32,840 |
|
|
79,830 |
|
|
96,745 |
|
|
91,663 |
|
|
Other |
|
|
8,252 |
|
|
2,148 |
|
|
8,209 |
|
|
4,669 |
|
|
4,587 |
|
|
Gross revenue |
|
|
775,566 |
|
|
178,637 |
|
|
505,771 |
|
|
562,968 |
|
|
518,404 |
|
|
Contingent consideration(2) |
|
|
— |
|
|
— |
|
|
(26,830) |
|
|
(58,520) |
|
|
(26,224) |
|
|
Net revenue |
|
|
775,566 |
|
|
178,637 |
|
|
478,941 |
|
|
504,448 |
|
|
492,180 |
|
|
Expenses |
|
|
|
|
|
|
|
|
|
|
|
|
|
|
|
|
|
Employee compensation and benefits |
|
|
329,457 |
|
|
80,436 |
|
|
209,053 |
|
|
248,963 |
|
|
228,584 |
|
|
Depreciation and amortization |
|
|
139,330 |
|
|
33,020 |
|
|
48,808 |
|
|
68,615 |
|
|
80,859 |
|
|
Technology and communications |
|
|
39,285 |
|
|
9,907 |
|
|
26,598 |
|
|
30,013 |
|
|
28,239 |
|
|
General and administrative |
|
|
34,960 |
|
|
11,837 |
|
|
23,056 |
|
|
33,973 |
|
|
27,392 |
|
|
Professional fees |
|
|
28,029 |
|
|
8,194 |
|
|
20,360 |
|
|
19,351 |
|
|
18,158 |
|
|
Occupancy |
|
|
14,686 |
|
|
3,308 |
|
|
10,732 |
|
|
14,441 |
|
|
15,817 |
|
|
Total expenses |
|
|
585,747 |
|
|
146,702 |
|
|
338,607 |
|
|
415,356 |
|
|
399,049 |
|
|
Operating income |
|
|
189,819 |
|
|
31,935 |
|
|
140,334 |
|
|
89,092 |
|
|
93,131 |
|
|
Tax receivable agreement liability adjustment |
|
|
33,134 |
|
|
— |
|
|
— |
|
|
— |
|
|
— |
|
|
Net interest income |
|
|
2,373 |
|
|
787 |
|
|
1,726 |
|
|
685 |
|
|
(695) |
|
|
Income before taxes |
|
|
225,326 |
|
|
32,722 |
|
|
142,060 |
|
|
89,777 |
|
|
92,436 |
|
|
Provision for income taxes |
|
|
(52,302) |
|
|
(3,415) |
|
|
(11,900) |
|
|
(6,129) |
|
|
725 |
|
|
Net income |
|
$ |
173,024 |
|
$ |
29,307 |
|
$ |
130,160 |
|
$ |
83,648 |
|
$ |
93,161 |
|
|
Less: Pre-IPO net income attributable to Tradeweb Markets LLC |
|
|
42,352 |
|
|
|
|
|
|
|
|
|
|
|
|
|
|
Net income attributatble to Tradeweb Markets Inc. and non-controlling interests |
|
|
130,672 |
|
|
|
|
|
|
|
|
|
|
|
|
|
|
Less: Net income attributable to non-controlling interests |
|
|
46,903 |
|
|
|
|
|
|
|
|
|
|
|
|
|
|
Net income attributable to Tradeweb Markets Inc. |
|
$ |
83,769 |
|
|
|
|
|
|
|
|
|
|
|
|
|
|
|
|
|
|
|
|
|
|
|
|
|
|
|
|
|
|
|
|
EPS calculations for pre-IPO and post-IPO periods (3) |
|
|
|
|
|
|
|
|
|
|
|
|
|
|
|
|
|
Basic |
|
$ |
0.19 |
(a) |
$ |
0.13 |
(a) |
$ |
0.60 |
(a) |
$ |
0.39 |
(a) |
$ |
0.44 |
(a) |
|
Diluted |
|
$ |
0.19 |
(a) |
$ |
0.13 |
(a) |
$ |
0.60 |
(a) |
$ |
0.39 |
(a) |
$ |
0.44 |
(a) |
|
Weighted average shares outstanding |
|
|
|
|
|
|
|
|
|
|
|
|
|
|
|
|
|
Basic |
|
|
222,222,197 |
(a) |
|
222,221,628 |
(a) |
|
215,365,920 |
(a) |
|
212,568,635 |
(a) |
|
210,979,704 |
(a) |
|
Diluted |
|
|
223,320,457 |
(a) |
|
222,243,851 |
(a) |
|
215,365,920 |
(a) |
|
212,568,635 |
(a) |
|
210,979,704 |
(a) |
|
|
|
|
|
|
|
|
|
|
|
|
|
|
|
|
|
|
|
Dividends per share |
|
$ |
0.24 |
|
$ |
— |
|
$ |
— |
|
$ |
— |
|
$ |
— |
|
|
|
|
Tradeweb Markets, In. |
|
Tradeweb Markets LLC |
|
|||||||||
|
|
|
Successor |
|
Successor |
|
|
Predecessor |
|
Predecessor |
|
||||
|
|
|
As of |
|
As of |
|
|
As of |
|
As of |
|
||||
|
|
|
December 31, |
|
December 31, |
|
|
December 31, |
|
December 31, |
|
||||
|
|
|
2019 |
|
2018 |
|
|
2017 |
|
2016 |
|
||||
|
Statement of Income Data: |
|
(in thousands, except share and per share amounts) |
||||||||||||
|
Cash and cash equivalents |
|
$ |
460,711 |
|
$ |
410,104 |
|
|
$ |
352,598 |
|
$ |
324,074 |
|
|
Total assets |
|
$ |
5,085,300 |
|
$ |
4,997,139 |
|
|
$ |
1,316,887 |
|
$ |
1,320,732 |
|
|
Total liabilities |
|
$ |
502,589 |
|
$ |
410,626 |
|
|
$ |
317,118 |
|
$ |
283,319 |
|
|
Non-controlling interests |
|
$ |
1,214,157 |
|
$ |
— |
|
|
$ |
— |
|
$ |
— |
|
|
Total equity/members' capital |
|
$ |
4,582,711 |
|
$ |
4,572,334 |
|
|
$ |
986,468 |
|
$ |
1,024,759 |
|
|
|
|
Successor |
|
Successor |
|
|
Predecessor |
|
Predecessor |
|
Predecessor |
|
|||||
|
|
|
Year Ended |
|
October 1, 2018 to |
|
|
January 1, 2018 to |
|
Year Ended |
|
Year Ended |
|
|||||
|
|
|
December 31, |
|
December 31, |
|
|
September 30, |
|
December 31, |
|
December 31, |
|
|||||
|
|
|
2019 |
|
2018 |
|
|
2018 |
|
2017 |
|
2016 |
|
|||||
|
Other Financial Data: |
|
(in thousands, except share and per share amounts) |
|||||||||||||||
|
Cash Flow from Operating Activities |
|
$ |
311,003 |
|
$ |
112,556 |
|
|
$ |
164,828 |
|
$ |
224,580 |
|
$ |
171,845 |
|
|
Free Cash Flow(4) |
|
$ |
266,541 |
|
$ |
96,310 |
|
|
$ |
138,978 |
|
$ |
183,962 |
|
$ |
136,496 |
|
|
Adjusted EBITDA(5) |
|
$ |
353,162 |
|
$ |
65,308 |
|
|
$ |
214,091 |
|
$ |
215,185 |
|
$ |
200,771 |
|
|
Adjusted EBITDA margin(5) |
|
|
45.5 |
% |
|
36.6 |
% |
|
|
42.3 |
% |
|
38.2 |
% |
|
38.7 |
% |
|
Adjusted EBIT(5) |
|
$ |
311,397 |
|
$ |
54,701 |
|
|
$ |
184,859 |
|
$ |
177,806 |
|
$ |
161,037 |
|
|
Adjusted EBIT margin(5) |
|
|
40.2 |
% |
|
30.6 |
% |
|
|
36.5 |
% |
|
31.6 |
% |
|
31.1 |
% |
|
Adjusted Net Income(5) |
|
$ |
230,935 |
|
$ |
40,839 |
|
|
$ |
137,327 |
|
$ |
131,369 |
|
$ |
118,012 |
|
|
Adjusted Diluted EPS(5) |
|
$ |
0.23 |
(a) (b) |
$ |
0.18 |
(a) |
|
$ |
0.64 |
(a) |
$ |
0.62 |
(a) |
$ |
0.56 |
(a) |
73
|
|
|
Year Ended |
|
Year Ended |
|
|
Year Ended |
|
Year Ended |
|
||||
|
|
|
December 31, |
|
December 31, |
|
|
December 31, |
|
December 31, |
|
||||
|
|
|
2019 |
|
2018 |
|
|
2017 |
|
2016 |
|
||||
|
Operating Data: |
|
(in millions) |
||||||||||||
|
Average Daily Volumes: |
|
|
|
|
|
|
|
|
|
|
|
|
|
|
|
Rates |
|
$ |
489,645 |
|
$ |
354,023 |
|
|
$ |
253,432 |
|
$ |
219,130 |
|
|
Credit |
|
|
14,777 |
|
|
12,658 |
|
|
|
7,554 |
|
|
5,954 |
|
|
Equities |
|
|
7,795 |
|
|
7,798 |
|
|
|
4,817 |
|
|
4,523 |
|
|
Money markets |
|
|
213,209 |
|
|
173,743 |
|
|
|
132,105 |
|
|
94,324 |
|
|
Total |
|
$ |
725,426 |
|
$ |
548,222 |
|
|
$ |
397,908 |
|
$ |
323,931 |
|
|
(1) |
Subscription fees for the year ended December 31, 2019, the 2018 Successor Period, the 2018 Predecessor Period and the years ended December 31, 2017 and 2016 include $55.6 million, $13.5 million, $36.9 million, $50.1 million and $50.6 million, respectively, of Refinitiv (formerly Thomson Reuters) market data fees. |
|
(2) |
In 2014, we issued equity to certain of the Bank Stockholders and management as a result of a capital contribution to facilitate our expansion into new credit products. The equity vested on July 31, 2018 upon the achievement of specific revenue earnout milestones related to the new credit products. Prior to the July 31, 2018 vesting, we recognized contingent consideration as a contra-revenue adjustment, which partially offset gross revenues for the periods present. |
|
(3) |
In April 2019, we completed the Reorganization Transactions and the IPO, which, among other things, resulted in Tradeweb Markets Inc. becoming the successor of Tradeweb Markets LLC for financial reporting purposes. As a result, earnings per share information for the pre-IPO period is not comparable to the earnings per share information for the post-IPO period. Therefore, earnings per share information is being presented separately for the pre-IPO and post-IPO periods. See “Basis of Presentation,” and “Note 18 — Earnings Per Share” to our audited consolidated financial statements included elsewhere in this Annual Report on Form 10-K, for additional information. |
|
(a) |
Presents information for Tradeweb Markets LLC (pre-IPO period). |
|
(b) |
Presents information for Tradeweb Markets Inc. (post-IPO period). |
|
(4) |
In addition to cash flow from operating activities presented in accordance with GAAP, we use Free Cash Flow to measure liquidity. See Part II, Item 7. – “Management’s Discussion and Analysis of Financial Condition and Results of Operations—Non-GAAP Financial Measures” for a definition and discussion of Free Cash Flow and “Use of Non-GAAP Financial Measures” for a discussion of the limitations of Free Cash Flow. |
The table set forth below presents a reconciliation of our cash flow from operating activities to Free Cash Flow for the year ended December 31, 2019, the 2018 Successor Period, the 2018 Predecessor Period and the years ended December 31, 2017 and 2016:
|
|
|
Successor |
|
Successor |
|
|
Predecessor |
|
Predecessor |
|
Predecessor |
|
|||||
|
|
|
Year Ended |
|
October 1, 2018 to |
|
|
January 1, 2018 to |
|
Year Ended |
|
Year Ended |
|
|||||
|
|
|
December 31, |
|
December 31, |
|
|
September 30, |
|
December 31, |
|
December 31, |
|
|||||
|
|
|
2019 |
|
2018 |
|
|
2018 |
|
2017 |
|
2016 |
|
|||||
|
|
|
(in thousands) |
|||||||||||||||
|
Cash flow from operating activities |
|
$ |
311,003 |
|
$ |
112,556 |
|
|
$ |
164,828 |
|
$ |
224,580 |
|
$ |
171,845 |
|
|
Less: Capitalization of software development costs |
|
|
(28,681) |
|
|
(7,156) |
|
|
|
(19,523) |
|
|
(27,157) |
|
|
(25,351) |
|
|
Less: Purchases of furniture, equipment and leasehold improvements |
|
|
(15,781) |
|
|
(9,090) |
|
|
|
(6,327) |
|
|
(13,461) |
|
|
(9,998) |
|
|
Free Cash Flow |
|
$ |
266,541 |
|
$ |
96,310 |
|
|
$ |
138,978 |
|
$ |
183,962 |
|
$ |
136,496 |
|
|
(5) |
In addition to net income and net income attributable to Tradeweb Markets Inc., each presented in accordance with GAAP, we use Adjusted EBITDA, Adjusted EBITDA margin, Adjusted EBIT and Adjusted EBIT margin as measures of our operating performance and Adjusted Net Income and Adjusted Diluted EPS as measures of our profitability. See Part II, Item 7. – “Management’s Discussion and Analysis of Financial Condition and Results of Operations—Non-GAAP Financial Measures” for definitions and discussions of Adjusted EBITDA, Adjusted EBITDA margin, Adjusted EBIT, Adjusted EBIT margin, Adjusted Net Income and Adjusted Diluted |
74
EPS and “Use of Non-GAAP Financial Measures” for a discussion of the limitations of these non-GAAP financial measures. |
The table set forth below presents a reconciliation of net income to Adjusted EBITDA, Adjusted EBITDA margin, Adjusted EBIT and Adjusted EBIT margin for the year ended December 31, 2019, the 2018 Successor Period, the 2018 Predecessor Period and the years ended December 31, 2017 and 2016:
|
|
|
|
|
|
|
|
|
|
|
|
|
|
|
|
|
|
|
|
|
|
Successor |
|
Successor |
|
|
Predecessor |
|
Predecessor |
|
Predecessor |
|
|||||
|
|
|
Year |
|
October 1, 2018 |
|
|
January 1, 2018 |
|
Year |
|
Year |
|
|||||
|
|
|
Ended |
|
to |
|
|
to |
|
Ended |
|
Ended |
|
|||||
|
|
|
December 31, |
|
December 31, |
|
|
September 30, |
|
December 31, |
|
December 31, |
|
|||||
|
|
|
2019 |
|
2018 |
|
|
2018 |
|
2017 |
|
2016 |
|
|||||
|
|
|
(in thousands) |
|
||||||||||||||
|
Net income |
|
$ |
173,024 |
|
$ |
29,307 |
|
|
$ |
130,160 |
|
$ |
83,648 |
|
$ |
93,161 |
|
|
Contingent consideration |
|
|
— |
|
|
— |
|
|
|
26,830 |
|
|
58,520 |
|
|
26,224 |
|
|
Interest income, net |
|
|
(2,373) |
|
|
(787) |
|
|
|
(1,726) |
|
|
(685) |
|
|
695 |
|
|
Depreciation and amortization |
|
|
139,330 |
|
|
33,020 |
|
|
|
48,808 |
|
|
68,615 |
|
|
80,859 |
|
|
Stock-based compensation expense |
|
|
25,098 |
|
|
— |
|
|
|
— |
|
|
— |
|
|
— |
|
|
Provision for income taxes |
|
|
52,302 |
|
|
3,415 |
|
|
|
11,900 |
|
|
6,129 |
|
|
(725) |
|
|
Unrealized foreign exchange (gains) / losses |
|
|
(2,310) |
|
|
263 |
|
|
|
(960) |
|
|
(364) |
|
|
1,872 |
|
|
(Gain) / loss from revaluation of foreign denominated cash |
|
|
1,225 |
|
|
90 |
|
|
|
(921) |
|
|
(678) |
|
|
(1,315) |
|
|
Tax receivable agreement liability adjustment |
|
|
(33,134) |
|
|
— |
|
|
|
— |
|
|
— |
|
|
— |
|
|
Adjusted EBITDA |
|
$ |
353,162 |
|
$ |
65,308 |
|
|
$ |
214,091 |
|
$ |
215,185 |
|
$ |
200,771 |
|
|
Less: Depreciation and amortization |
|
|
(139,330) |
|
|
(33,020) |
|
|
|
(48,808) |
|
|
(68,615) |
|
|
(80,859) |
|
|
Add: Acquisition and Refinitiv Transaction related D&A |
|
|
97,565 |
|
|
22,413 |
|
|
|
19,576 |
|
|
31,236 |
|
|
41,125 |
|
|
Adjusted EBIT |
|
$ |
311,397 |
|
$ |
54,701 |
|
|
$ |
184,859 |
|
$ |
177,806 |
|
$ |
161,037 |
|
|
Adjusted EBITDA margin |
|
|
45.5 |
% |
|
36.6 |
% |
|
|
42.3 |
% |
|
38.2 |
% |
|
38.7 |
% |
|
Adjusted EBIT margin |
|
|
40.2 |
% |
|
30.6 |
% |
|
|
36.5 |
% |
|
31.6 |
% |
|
31.1 |
% |
The table set forth below presents a reconciliation of net income attributable to Tradeweb Markets Inc. and net income, as applicable, to Adjusted Net Income and Adjusted Diluted EPS for the year ended December 31, 2019, the 2018 Successor Period, the 2018 Predecessor Period and the years ended December 31, 2017 and 2016:
|
|
|
Successor |
|
Successor |
|
|
Predecessor |
|
Predecessor |
|
Predecessor |
|
|||||
|
|
|
|
|
|
|
|
|
|
|
|
|
|
|||||
|
|
|
Year |
|
October 1, 2018 |
|
|
January 1, 2018 |
|
Year |
|
Year |
|
|||||
|
|
|
Ended |
|
to |
|
|
to |
|
Ended |
|
Ended |
|
|||||
|
|
|
December 31, |
|
December 31, |
|
|
September 30, |
|
December 31, |
|
December 31, |
|
|||||
|
|
|
2019 |
|
2018 |
|
|
2018 |
|
2017 |
|
2016 |
|
|||||
|
|
|
|
|
||||||||||||||
|
Earnings per diluted share(1) |
|
$ |
0.190.54 |
(a) / |
$ |
0.13 |
(a) |
|
$ |
0.60 |
(a) |
$ |
0.39 |
(a) |
$ |
0.44 |
(a) |
|
Pre-IPO net income attributable to Tradeweb Markets LLC (1) |
|
|
42,352 |
(a) |
|
29,307 |
(a) |
|
|
130,160 |
(a) |
|
83,648 |
(a) |
|
93,161 |
(a) |
|
Add: Net income attributable to Tradeweb Markets Inc. (1) |
|
|
83,769 |
(b) |
|
— |
|
|
|
— |
|
|
— |
|
|
— |
|
|
Add: Net income attributable to non-controlling interests (1)(2) |
|
|
46,903 |
(b) |
|
— |
|
|
|
— |
|
|
— |
|
|
— |
|
|
Net income |
|
$ |
173,024 |
(a)(b) |
$ |
29,307 |
(a) |
|
$ |
130,160 |
(a) |
$ |
83,648 |
(a) |
$ |
93,161 |
(a) |
|
Provision for income taxes |
|
|
52,302 |
|
|
3,415 |
|
|
|
11,900 |
|
|
6,129 |
|
|
(725) |
|
|
Contingent consideration |
|
|
— |
|
|
— |
|
|
|
26,830 |
|
|
58,520 |
|
|
26,224 |
|
|
Acquisition and Refinitiv Transaction related D&A |
|
|
97,565 |
|
|
22,413 |
|
|
|
19,576 |
|
|
31,236 |
|
|
41,125 |
|
|
Stock-based compensation expense |
|
|
25,098 |
|
|
— |
|
|
|
— |
|
|
— |
|
|
— |
|
|
Unrealized foreign exchange (gains) / losses |
|
|
(2,310) |
|
|
263 |
|
|
|
(960) |
|
|
(364) |
|
|
1,872 |
|
|
(Gain) / loss from revaluation of foreign denominated cash |
|
|
1,225 |
|
|
90 |
|
|
|
(921) |
|
|
(678) |
|
|
(1,315) |
|
|
Tax receivable agreement liability adjustment |
|
|
(33,134) |
|
|
— |
|
|
|
— |
|
|
— |
|
|
— |
|
|
Adjusted Net Income before income taxes |
|
|
313,770 |
|
|
55,488 |
|
|
|
186,585 |
|
|
178,491 |
|
|
160,342 |
|
|
Adjusted income taxes |
|
|
(82,835) |
|
|
(14,649) |
|
|
|
(49,258) |
|
|
(47,122) |
|
|
(42,330) |
|
|
Adjusted Net Income |
|
$ |
230,935 |
|
$ |
40,839 |
|
|
$ |
137,327 |
|
$ |
131,369 |
|
$ |
118,012 |
|
|
Adjusted Diluted EPS (1)(3) |
|
$ |
0.23 |
(a) / |
$ |
0.18 |
(a) |
|
$ |
0.64 |
(a) |
$ |
0.62 |
(a) |
$ |
0.56 |
(a) |
|
(1) |
In April 2019, we completed the Reorganization Transactions and the IPO. Therefore, certain earnings information is being presented separately for Tradeweb Markets LLC and Tradeweb Markets Inc. |
|
i. |
Presents information for Tradeweb Markets LLC (pre-IPO period). |
|
ii. |
Presents information for Tradeweb Markets Inc. (post-IPO period). |
See “Basis of Presentation” and Note 18 – Earnings Per Share to our audited consolidated financial statements included elsewhere in this Annual Report on Form 10-K.
75
|
(2) |
For post-IPO periods, represents the reallocation of net income attributable to non-controlling interests from the assumed exchange of all outstanding LLC Interests held by non-controlling interests for shares of Class A or Class B common stock. |
|
(3) |
Due to the Reorganization Transactions and the IPO completed in April 2019, shares outstanding during the year ended December 31, 2019 represent shares of TWM LLC (pre-IPO period) and shares of Class A and Class B common stock of Tradeweb Markets Inc. (post-IPO period). |
The table set forth below presents the calculation of Adjusted Diluted EPS for the periods presented above:
|
|
|
Successor |
|
|
Predecessor |
||||||||||||||
|
|
|
Pre-IPO Period |
|
Post-IPO Period |
|
|
|
|
|
|
|
|
|
|
|
|
|
||
|
|
|
Year |
|
Year |
|
October 1, 2018 |
|
|
January 1, 2018 |
|
Year |
|
Year |
||||||
|
Reconciliation of Diluted Weighted Average Shares |
|
Ended |
|
Ended |
|
to |
|
|
to |
|
Ended |
|
Ended |
||||||
|
Outstanding to Adjusted Diluted Weighted |
|
December 31, |
|
December 31, |
|
December 31, |
|
|
September 30, |
|
December 31, |
|
December 31, |
||||||
|
Average Shares Outstanding |
|
2019 |
|
2019 |
|
2018 |
|
|
2018 |
|
2017 |
|
2016 |
||||||
|
Diluted weighted average TWM LLC shares outstanding |
|
|
223,320,457 |
|
|
— |
|
|
222,243,851 |
|
|
|
215,365,920 |
|
|
212,568,635 |
|
|
210,979,704 |
|
Diluted weighted average shares of Class A and Class B common stock outstanding |
|
|
— |
|
|
156,540,246 |
|
|
— |
|
|
|
— |
|
|
— |
|
|
— |
|
Assumed exchange of LLC interests for shares of Class A or Class B common stock (1) |
|
|
— |
|
|
74,279,741 |
|
|
— |
|
|
|
— |
|
|
— |
|
|
— |
|
Adjusted diluted weighted average shares outstanding |
|
|
223,320,457 |
|
|
230,819,987 |
|
|
222,243,851 |
|
|
|
215,365,920 |
|
|
212,568,635 |
|
|
210,979,704 |
|
Adjusted Net Income (in thousands) |
|
$ |
52,190 |
|
$ |
178,745 |
|
$ |
40,839 |
|
|
$ |
137,327 |
|
$ |
131,369 |
|
$ |
118,012 |
|
Adjusted Diluted EPS |
|
$ |
0.23 |
|
$ |
0.77 |
|
$ |
0.18 |
|
|
$ |
0.64 |
|
$ |
0.62 |
|
$ |
0.56 |
|
(1) |
Assumes the full exchange of all outstanding LLC Interests held by non-controlling interests for shares of Class A or Class B common stock, resulting in the elimination of the non-controlling interests and recognition of the net income attributable to non-controlling interests. |
ITEM 7. — MANAGEMENT’S DISCUSSION AND ANALYSIS OF FINANCIAL CONDITION AND RESULTS OF OPERATIONS
The following discussion and analysis of our financial condition and results of operations should be read in conjunction with the sections titled “Basis of Presentation” and “Selected Historical Consolidated Financial and Other Data” and our audited consolidated financial statements and related notes and other information included elsewhere in this Annual Report on Form 10-K. This discussion contains forward-looking statements that involve risks and uncertainties. Our actual results could differ materially from the results described in or implied by the forward-looking statements. Factors that could cause or contribute to those differences include, but are not limited to, those identified below and those discussed in the sections titled “Risk Factors” and “Cautionary Note Regarding Forward-Looking Statements” included elsewhere in this Annual Report on Form 10-K.
Overview
We are a leader in building and operating electronic marketplaces for our global network of clients across the financial ecosystem. Our network is comprised of clients across the institutional, wholesale and retail client sectors, including many of the largest global asset managers, hedge funds, insurance companies, central banks, banks and dealers, proprietary trading firms and retail brokerage and financial advisory firms as well as regional dealers. Our marketplaces facilitate trading across a range of asset classes, including rates, credit, equities and money markets. We are a global company serving clients in over 65 countries with offices in North America, Europe and Asia. We believe our proprietary technology and culture of collaborative innovation allow us to adapt our offerings to enter new markets, create new platforms and solutions and adjust to regulations quickly and efficiently. We support our clients by providing solutions across the trade lifecycle, including pre-trade, execution, post-trade and data.
Our institutional client sector serves institutional investors in over 40 markets across 25 currencies, and in over 65 countries around the globe. We connect institutional investors with pools of liquidity using our flexible order and trading systems. Our clients trust the integrity of our markets and recognize the value they get by trading electronically: enhanced transparency, competitive pricing, efficient trade execution and regulatory compliance.
In our wholesale client sector, we provide a broad range of electronic, voice and hybrid platforms to more than 300 dealers and financial institutions with more than 100 actively trading on our electronic or hybrid markets with our Dealerweb platform. This platform was launched in 2008 following the acquisition of inter-dealer broker Hilliard Farber
76
& Co., Inc. In 2011, we acquired the brokerage assets of Rafferty Capital Markets. Today, Dealerweb actively competes across a range of rates, credit, derivatives and equity markets.
In our retail client sector, we provide advanced trading solutions for financial advisory firms and traders with our Tradeweb Direct platform. We entered the retail sector in 2006 and launched our Tradeweb Direct platform following the 2013 acquisition of BondDesk Group LLC, which was built to bring innovation and efficiency to the wealth management community. Tradeweb Direct has provided financial advisory firms access to live offerings, accurate pricing in the marketplace and fast execution.
Our markets are large and growing. Electronic trading continues to increase across the markets in which we operate as a result of market demand for greater transparency, higher execution quality, operational efficiency and lower costs, as well as regulatory changes. We believe our deep client relationships, asset class breadth, geographic reach, regulatory knowledge and scalable technology position us to continue to be at the forefront of the evolution of electronic trading. Our platforms provide transparent, efficient, cost-effective and compliant trading solutions across multiple products, regions and regulatory regimes. As market participants seek to trade across multiple asset classes, reduce their costs of trading and increase the effectiveness of their trading, including through the use of data and analytics, we believe the demand for our platforms and electronic trading solutions will continue to grow.
Trends and Other Factors Impacting Our Performance
Economic Environment
Our business is impacted by the overall market activity and, in particular, trading volumes and market volatility. Lower volatility is correlated to lower liquidity, which may result in lower trading volume for our clients and may negatively impact our operating performance. Factors that may impact market activity in 2020 include, among other things, economic, political and social conditions, legislative, regulatory or government policy changes and health concerns associated with the coronavirus. As a result, our business is sensitive to slow trading environments and the continuity of conservative monetary policies of central banks internationally, which tend to lessen volatility.
While our business is impacted by the overall activity of the market and market volatility, our revenues consist of a mix of fixed and variable fees that partially mitigates this impact. More importantly, we are actively engaged in the further electronification of trading activities, which will help mitigate this impact as we believe secular growth trends can partially offset market volatility risk.
Regulatory Environment
Our business is subject to extensive regulations in the United States and internationally, which may expose us to significant regulatory risk and cause additional legal costs to ensure compliance. See “Business — Regulation.” The existing legal framework that governs the financial markets is periodically reviewed and amended, resulting in enforcement of new laws and regulations that apply to our business. The current regulatory environment in the United States may be subject to future legislative changes driven by the current administration and could be further impacted, depending on the results of the upcoming U.S. 2020 elections. The impact of any reform efforts on us and our operations remains uncertain. In addition, as a result of the referendum in favor of the United Kingdom’s withdrawal from the European Union (“Brexit”) in June 2016, which occurred on January 31, 2020, we have incurred additional costs to address the potential effects of Brexit, including costs associated with establishing a new regulated subsidiary in the Netherlands. Compliance with regulations may require us to dedicate additional financial and operational resources, which may adversely affect our profitability. In addition, compliance with regulations may require our clients to dedicate significant financial and operational resources, which may negatively affect their ability to pay our fees and use our platforms and, as a result, our profitability. However, under certain circumstances regulation may increase demand for our platforms and solutions, and we believe we are well positioned to benefit from any potential increased electronification due to regulatory changes as market participants seek platforms that meet regulatory requirements and solutions that help them comply with their regulatory obligations. For example, our 2018 revenue increased due in part to higher trading volumes as a result of, and the introduction of our new APA service in connection with, the implementation of MiFID II in January 2018.
77
Competitive Environment
We and our competitors compete to introduce innovations in market structure and new electronic trading capabilities. While we endeavor to be a leader in innovation, new trading capabilities of our competitors are also adopted by market participants. On the one hand, this increases liquidity and electronification for all participants, but it also puts pressure on us to further invest in our technology and to innovate to ensure the continued growth of our network of clients and continued improvement of liquidity, electronic processing and pricing on our platforms. Our ability to compete is influenced by key factors such as (i) developments in trading platforms and solutions, (ii) the liquidity we provide on transactions, (iii) the transaction costs we incur in providing our solutions, (iv) the efficiency in execution of transactions on our platforms, (v) our ability to hire and retain talent and (vi) our ability to maintain the security of our platforms and solutions. Our competitive position is also influenced by the familiarity and integration of our clients with our electronic, voice and hybrid systems. When either a client wants to trade in a new product or we want to introduce a new product, trading protocol or other solution, we believe we benefit from our clients’ familiarity with our offerings as well as our integration into their order management systems and back offices. See “Business — Competition” for more detail on our competitors.
Technology and Cybersecurity Environment
Our business and its success are largely impacted by the introduction of increasingly complex and sophisticated technology systems and infrastructures and new business models. Offering specialized trading venues and solutions through the development of new and enhanced platforms is essential to maintaining our level of competitiveness in the market and attracting new clients seeking platforms that provide advanced automation and better liquidity. We believe we will continue to increase demand for our platforms and solutions and the volume of transactions on our platforms, and thereby enhance our client relationships, by responding to new trading and information requirements by utilizing technological advances and emerging industry standards and practices in an effective and efficient way. We plan to continue to focus on and invest in technology infrastructure initiatives and continually improve and expand our platforms and solutions to further enhance our market position. We experience cyber-threats and attempted security breaches. If these were successful, these cyber security incidents could impact revenue and operating income and increase costs. We therefore continue to make investments, which may result in increased costs, to strengthen our cybersecurity measures.
Foreign Currency Exchange Rate Environment
We earn revenues, pay expenses, hold assets and incur liabilities in currencies other than the U.S. dollar. Accordingly, fluctuations in foreign currency exchange rates can affect our results of operations from period to period. In particular, fluctuations in exchange rates for non-U.S. dollar currencies may reduce the U.S. dollar value of revenues, earnings and cash flows we receive from non-U.S. markets, increase our operating expenses (as measured in U.S. dollars) in those markets, negatively impact our competitiveness in those markets or otherwise adversely impact our results of operations or financial condition. Future fluctuations of foreign currency exchange rates and their impact on our results of operations and financial condition are inherently uncertain. As we continue to grow the size of our global operations, these fluctuations may be material. See Part II, Item 7A – “Quantitative and Qualitative Disclosures About Market Risk — Foreign Currency and Derivative Risk” elsewhere in this Annual Report on Form 10-K.
Effect of Pushdown Accounting on our Financial Statements
As a result of the Refinitiv Transaction, and the application of pushdown accounting, our assets and liabilities were adjusted to their estimated fair values as of October 1, 2018, the closing date of the Refinitiv Transaction. These adjusted valuations resulted in an increase in depreciation and amortization expense, due to the increased carrying value of our assets and the related increase in depreciation of tangible assets and amortization of our intangible assets, and a decrease in occupancy expense as a result of the recognition of a leasehold interest liability. Additionally, the excess of the portion of the total purchase price of the Refinitiv Transaction attributable to the purchase of our assets and liabilities over their estimated fair value as of the closing date of the Refinitiv Transaction was allocated to goodwill. Goodwill is subject to annual impairment testing. Amounts allocated to intangible assets with definite lives are subject to amortization over the estimated useful life of the asset. See “Note 3 — Pushdown Accounting” to our audited
78
consolidated financial statements included elsewhere in this Annual Report on Form 10-K and “— Critical Accounting Policies and Estimates — Pushdown Accounting.”
Due to the change in the basis of accounting resulting from the application of pushdown accounting, the financial information for the period beginning on October 1, 2018, and through and including December 31, 2019, which we refer to as the “Successor period,” and the financial information for the periods prior to, and including, September 30, 2018, which we refer to as the “Predecessor period,” are not necessarily comparable. As discussed above, the new basis of accounting primarily impacted the values of our long-lived and indefinite-lived intangible assets and resulted in increased depreciation and amortization expense and decreased occupancy expense. However, the change in basis resulting from the Refinitiv Transaction and the application of pushdown accounting did not impact revenues or certain expenses, including employee compensation and benefits expense, general and administrative expense, technology and communications expense, professional fees and net interest income (expense), and, for these metrics, we believe combining the results for the 2018 Successor and 2018 Predecessor periods provides meaningful information. Accordingly, certain discussions below for revenues and certain expenses represent the combined results of the 2018 Successor and 2018 Predecessor periods for the full year ended December 31, 2018. Such combination was performed by mathematical addition and is not a presentation made in accordance with GAAP, although we believe it provides a meaningful method of comparison for these metrics. The combined data is being presented for informational purposes only. The combined results for these metrics for the full year ended December 31, 2018 (i) have not been prepared on a pro forma basis, as if the Refinitiv Transaction occurred on the first day of the period, (ii) may not reflect the actual results we would have achieved absent the Refinitiv Transaction, (iii) may not be predictive of our future results of operations and (iv) should not be viewed as a substitute for the financial results of the Successor and Predecessor periods presented in accordance with GAAP. For all other metrics, to the extent that the change in basis had a material impact on our results, we have disclosed such impact under “— Results of Operations.”
Taxation and Public Company Expenses
In connection with the Reorganization Transactions, we became the sole manager of TWM LLC. As a result, beginning with the second quarter of 2019, we became subject to U.S. federal, state and local income taxes with respect to our allocable share of any taxable income of TWM LLC and are taxed at prevailing corporate tax rates. Our actual effective tax rate is impacted by our ownership share of TWM LLC, which will increase over time as the Continuing LLC Owners redeem or exchange their LLC Interests for shares of Class A common stock or Class B common stock, as applicable, or as we purchase LLC Interests from the Continuing LLC Owners. In addition to tax expenses, we also incur expenses related to our operations. Furthermore, in connection with the IPO, we entered into the Tax Receivable Agreement pursuant to which we will be required to make payments that we expect to be significant. We intend to cause TWM LLC to make distributions in an amount sufficient to allow us to pay our tax obligations, operating expenses, including payments under the Tax Receivable Agreement, and our quarterly cash dividends, as and when declared by our board of directors.
In addition, as a public company, we have started to implement additional procedures and processes for the purpose of addressing the standards and requirements applicable to public companies. In particular, we expect our accounting, legal and personnel-related expenses and directors’ and officers’ insurance costs to continue to increase as we establish more comprehensive compliance and governance functions, establish, maintain and review internal control over financial reporting in accordance with the Sarbanes-Oxley Act and prepare and distribute periodic reports in accordance with SEC rules.
Components of our Results of Operations
Revenues
Our gross revenue is derived primarily from transaction fees, subscription fees, commissions and market data fees. For the 2018 Predecessor Period and the year ended December 31, 2017, our gross revenue is offset by contingent consideration recognized as a contra-revenue adjustment related to the achievement of specific revenue earnout milestones, as further described below. This contingent consideration vested on, and has no additional impacts on our
79
results of operations after, July 31, 2018. We believe that gross revenue is the key driver of our operating performance and therefore is the revenue measure we utilize to assess our business on a period by period basis.
Transaction Fees
We earn transaction fees from transactions executed on our trading platforms through various fee plans. Transaction fees are generated on both a variable and fixed price basis and vary by geographic region, product type and trade size. For most of our products, clients pay both fixed minimum monthly transaction fees and variable transaction fees on a per transaction basis in excess of the monthly minimum. For certain of our products, clients also pay a subscription fee in addition to the minimum monthly transaction fee. For other products, instead of a minimum monthly transaction fee, clients pay a subscription fee and variable or fixed transaction fees on a per transaction basis. For variable transaction fees, we charge clients fees based on the mix of products traded and the volume of transactions executed.
Transaction volume is determined by using either a measure of the notional volume of the products traded or a count of the number of trades. We typically charge higher fees for products that are less actively traded. In addition, because transaction fees are sometimes subject to fee plans with tiered pricing based on product mix, volume, monthly minimums and monthly maximum fee caps, average transaction fees per million generated for a client may vary each month depending on the mix of products and volume traded. Furthermore, because transaction fees vary by geographic region, product type and trade size, our revenues may not correlate with volume growth.
Subscription Fees
We earn subscription fees primarily for granting clients access to our markets for trading and market data. For a limited number of products, we only charge subscription fees and no transaction fees. Subscription fees are generally generated on a fixed price basis.
For purposes of our discussion of our results of operations, we include Refinitiv (formerly Thomson Reuters) market data fees in subscription fees. We earn fixed license fees from our market data license agreement with Refinitiv. We also earn royalties from Refinitiv for referrals of new Eikon (a Refinitiv data platform) customers based on customer conversion rates. Royalties may fluctuate from period to period depending on the numbers of customer conversions achieved by Refinitiv during the applicable royalty fee earning period, which is typically five years from the date of the initial referral.
Commissions
We earn commission revenue from our electronic and voice brokerage services on a riskless principal basis. Riskless principal revenues are derived on matched principal transactions where revenues are earned on the spread between the buy and sell price of the transacted product. For TBA-MBS, U.S. treasury and repurchase agreement transactions executed by our wholesale clients, we also generate revenue from fixed commissions that are generally invoiced monthly.
Contingent Consideration
In 2014, we issued Class A Shares and unvested Class P1-(A) Shares to some of the Bank Stockholders as a result of a $120.0 million capital contribution to facilitate our expansion into new credit products. In connection with this investment, certain employees also invested $5.3 million in us and were issued Class C Shares and unvested Class P1-(C) Shares. The Class P1-(A) Shares vested on July 31, 2018 upon the achievement of specific revenue earnout milestones related to the growth of specified credit products (the “Credit Initiative Earnout”). Prior to the July 31, 2018 vesting, we recognized contingent consideration with respect to the Credit Initiative Earnout as a contra-revenue adjustment, which partially offset gross revenue for the 2018 Predecessor Period and the year ended December 31, 2017. See “— Critical Accounting Policies and Estimates — Contingent Consideration” for a discussion of the calculation of contingent consideration. The value of the contingent consideration of $156.2 million was finalized and contributed to members’ capital or employee equity compensation payable on July 31, 2018 and we therefore no longer recognize any contra-revenue adjustments from the Credit Initiative Earnout subsequent to that date. In connection with the
80
Reorganization Transactions, the Class A Shares, Class P1-(A) Shares, Class C Shares and Class P1-(C) Shares were exchanged for LLC Interests.
Operating Expenses
Employee Compensation and Benefits
Employee compensation and benefits expense consists of wages, employee benefits, bonuses, commissions, stock-based compensation cost and related taxes. Factors that influence employee compensation and benefits expense include revenue and earnings growth, hiring new employees and trading activity which generates broker commissions. We expect employee compensation and benefits expense to increase as we hire additional employees and as our revenues and earnings grow. As a result, employee compensation and benefits can vary from period to period.
Depreciation and Amortization
Depreciation and amortization expense consists of costs relating to the depreciation and amortization of other intangible assets, acquired and internally developed software, leasehold improvements, furniture and equipment. As discussed in “— Effect of Pushdown Accounting on our Financial Statements,” we applied pushdown accounting as a result of the Refinitiv Transaction and therefore depreciation and amortization expense in Successor reporting periods will differ from amounts reported in Predecessor periods.
General and Administrative
General and administrative expense consists of travel and entertainment, marketing, value-added taxes, state use taxes, foreign currency transaction gains and losses, charitable contributions, other administrative expenses and bad debt expense. We expect general and administrative expense to increase as we expand the number of our employees and product offerings and grow our operations.
Technology and Communications
Technology and communications expense consists of costs relating to software and hardware maintenance, our internal network connections, data center costs, clearance costs and data feeds provided by third-party service providers, including Refinitiv pursuant to a shared services agreement. Factors that influence technology and communications expense include the growth of our client base and product offerings.
Professional Fees
Professional fees consist primarily of accounting, tax and legal fees and fees paid to technology and software consultants to maintain our trading platforms and infrastructure. Accounting, tax and legal fees are expected to increase as a result of expanding public company and compliance requirements. Factors that influence technology and software consulting expense include the growth of our client base and product offerings.
Occupancy
Occupancy expense consists of operating lease rent and related costs for office space and data centers leased in North America, Europe and Asia. Fees incurred by us under a shared services agreement with Refinitiv for office space are also included in occupancy expense. We expect occupancy expense to increase as we expand the number of our employees and grow our operations. In addition, we currently anticipate that in 2020 we will likely enter into a new lease to increase the size of our corporate headquarters in or near New York, New York, which may result in increased operating expenses. As discussed in “— Effect of Pushdown Accounting on our Financial Statements,” we applied pushdown accounting as a result of the Refinitiv Transaction and therefore occupancy expense in Successor reporting periods will differ from amounts reported in Predecessor periods.
81
Net Interest Income (Expense)
Interest income consists of interest earned from our cash deposited with large commercial banks and money market funds. Beginning with the second quarter of 2019, interest expense consists of commitment fees payable on, and, if applicable, interest payable on any borrowings outstanding under, the Revolving Credit Facility. Historically, interest expense consisted of interest payable to Thomson Reuters under a convertible term note. Thomson Reuters converted all outstanding borrowings under this note to equity of the Company in May 2017.
Income Taxes
Beginning with the second quarter of 2019, we became subject to U.S. federal, state and local income taxes with respect to our taxable income, including our allocable share of any taxable income of TWM LLC, and are taxed at prevailing corporate tax rates. TWM LLC is a multiple member limited liability company taxed as a partnership and accordingly any taxable income generated by TWM LLC is passed through to and included in the taxable income of its members, including to us. Income taxes also include unincorporated business taxes on income earned or losses incurred for conducting business in certain state and local jurisdictions, income taxes on income earned or losses incurred in foreign jurisdictions on certain operations and federal and state income taxes on income earned or losses incurred, both current and deferred, on subsidiaries that are taxed as corporations for U.S. tax purposes.
Net Income Attributable to Non-Controlling Interests
We are the sole manager of TWM LLC. As a result of this control, and because we have a substantial financial interest in TWM LLC, we began consolidating the financial results of TWM LLC and reporting a non-controlling interest on our consolidated financial statements, representing the economic interests of TWM LLC held by the Continuing LLC Owners. Income or loss is attributed to the non-controlling interests based on the relative ownership percentages of LLC Interests held during the period by us and the Continuing LLC Owners.
In connection with the Reorganization Transactions, the TWM LLC Agreement was amended and restated to, among other things, (i) provide for LLC Interests and (ii) exchange all of the then existing membership interests in TWM LLC for LLC Interests. LLC Interests held by the Continuing LLC Owners are redeemable in accordance with the TWM LLC Agreement, at the election of such holders, for newly issued shares of Class A common stock or Class B common stock, as the case may be, on a one-for-one basis. In the event of such election by a Continuing LLC Owner, we may, at our option, effect a direct exchange of Class A common stock or Class B common stock for such LLC Interests of such Continuing LLC Owner in lieu of such redemption. In connection with any redemption or exchange, we will receive a corresponding number of LLC Interests, increasing our total ownership interest in TWM LLC. Following the completion of the Reorganization Transactions and the IPO, we owned 64.3% of TWM LLC and the Continuing LLC Owners owned the remaining 35.7% of TWM LLC. As of December 31, 2019, we owned 73.4% of TWM LLC and the Continuing LLC Owners owned the remaining 26.6% of TWM LLC.
The result of the foregoing is that, during the second quarter of 2019, we began reporting net income attributable to non-controlling interests. For the year ended December 31, 2019, net income attributable to non-controlling interests totaled $46.9 million, which represents the Continuing LLC Owners’ pro rata share of the net income of TWM LLC subsequent to the Reorganization Transactions and the IPO. For pre-IPO periods, there were no non-controlling interests.
Results of Operations
For the Year Ended December 31, 2019 (Successor), October 1, 2018 to December 31, 2018 (Successor) and January 1, 2018 to September 30, 2018 (Predecessor)
The following table sets forth a summary of our statements of income for the year ended December 31, 2019, the 2018 Successor Period and the 2018 Predecessor Period:
|
|
|
Successor |
|
Successor |
|
|
Predecessor |
|||
|
|
|
Year Ended |
|
October 1, 2018 to |
|
|
January 1, 2018 to |
|||
82
|
|
|
December 31, 2019 |
|
December 31, 2018 |
|
|
September 30, 2018 |
|||
|
|
|
(dollars in thousands) |
||||||||
|
Gross revenue |
|
$ |
775,566 |
|
$ |
178,637 |
|
|
$ |
505,771 |
|
Contingent consideration |
|
|
— |
|
|
— |
|
|
|
(26,830) |
|
Net revenue |
|
|
775,566 |
|
|
178,637 |
|
|
|
478,941 |
|
Total expenses |
|
|
585,747 |
|
|
146,702 |
|
|
|
338,607 |
|
Operating income |
|
|
189,819 |
|
|
31,935 |
|
|
|
140,334 |
|
Tax receivable agreement liability adjustment |
|
|
33,134 |
|
|
— |
|
|
|
— |
|
Net interest income |
|
|
2,373 |
|
|
787 |
|
|
|
1,726 |
|
Income before taxes |
|
|
225,326 |
|
|
32,722 |
|
|
|
142,060 |
|
Provision for Income taxes |
|
|
(52,302) |
|
|
(3,415) |
|
|
|
(11,900) |
|
Net income |
|
$ |
173,024 |
|
$ |
29,307 |
|
|
$ |
130,160 |
|
Less: Pre-IPO net income attributable to Tradeweb Markets LLC |
|
|
42,352 |
|
|
|
|
|
|
|
|
Net income attributable to Tradeweb Markets Inc. and non-controlling interests |
|
|
130,672 |
|
|
|
|
|
|
|
|
Less: Net income attributable to non-controlling interests |
|
|
46,903 |
|
|
|
|
|
|
|
|
Net income attributable to Tradeweb Markets Inc. |
|
$ |
83,769 |
|
|
|
|
|
|
|
Overview
During the year ended December 31, 2019, our revenue grew due to a number of factors. Higher client trading activity drove revenue increases in our rates, credit, equities and money markets asset classes. Our market data business also grew due to the expansion of our market data license agreement with Refinitiv in November 2018. Our expenses were impacted by higher depreciation and amortization expense as a result of the application of pushdown accounting and non-cash stock-based compensation expense related to the Special Option Award as a result of the completion of the IPO during the second quarter of 2019.
Gross revenue increased by $91.2 million or 13.3% to $775.6 million for the year ended December 31, 2019 from $684.4 million for the combined year ended December 31, 2018. This increase in gross revenue was mainly due to higher trading volumes, resulting in a $52.7 million increase in transaction fees and a $36.7 million increase in commission revenue. Net revenue increased by $118.0 million or 17.9% to $775.6 million for the year ended December 31, 2019 from $657.6 million for the combined year ended December 31, 2018. Non-cash contingent consideration decreased by $26.8 million for the year ended December 31, 2019 as a result of the vesting of the Credit Initiative Earnout at July 31, 2018.
Total expenses for the year ended December 31, 2019 were $585.7 million. Total expenses for the 2018 Successor Period and the 2018 Predecessor Period were $146.7 million and $338.6 million, respectively. Total expenses for the year ended December 31, 2019 were impacted by higher depreciation and amortization expense as a result of the application of pushdown accounting and higher employee compensation and benefits expense, including the impact of non-cash stock-based compensation expense related to the Special Option Award, which, as a result of the completion of the IPO, we began to expense during the second quarter of 2019 (with $18.9 million recognized as compensation expense related to these options immediately upon the completion of the IPO).
The tax receivable agreement liability adjustment of $33.1 million during the year ended December 31, 2019 was primarily due to changes in the tax receivable agreement liability recorded in our consolidated statement of financial condition as a result of changes in the mix of earnings, tax legislation and tax rates in various jurisdictions, which impacted our tax savings.
Income before taxes for the year ended December 31, 2019 was $225.3 million. Income before taxes for the 2018 Successor Period and the 2018 Predecessor Period was $32.7 million and $142.1 million, respectively. Net income for the year ended December 31, 2019 was $173.0 million. Net income for the 2018 Successor Period and the 2018 Predecessor Period was $29.3 million and $130.2 million, respectively. Net income attributable to Tradeweb Markets Inc. for the year ended December 31, 2019 was $83.8 million. Income before taxes, net income and net income
83
attributable to Tradeweb Markets Inc. for the year ended December 31, 2019 were negatively impacted by higher depreciation and amortization expense as a result of the application of pushdown accounting, resulting in acquisition and Refinitiv related depreciation and amortization expense of $97.6 million, and by $24.4 million of stock-based compensation expense related to the Special Option Award and post-IPO options awarded in the second half of 2019, partially offset by higher revenue.
Revenues
Our revenues for the year ended December 31, 2019, the combined year ended December 31, 2018, the 2018 Successor Period and the 2018 Predecessor Period, and the resulting dollar and percentage changes, were as follows:
|
|
|
Successor |
|
|
Combined(1) |
|
|
Successor |
|
|
Predecessor |
|
|
|
|
|
|
||||||||||||
|
|
|
Year Ended |
|
|
Year Ended |
|
|
October 1, 2018 to |
|
|
January 1, 2018 to |
|
Year Ended December 31, 2019 vs |
|
|||||||||||||||
|
|
|
December 31, 2019 |
|
|
December 31, 2018 |
|
|
December 31, 2018 |
|
|
September 30, 2018 |
|
Combined Year Ended December 31, 2018 |
|
|||||||||||||||
|
|
|
|
|
|
% of Gross |
|
|
|
|
|
% of Gross |
|
|
|
|
|
% of Gross |
|
|
|
|
|
% of Gross |
|
|
|
|
|
|
|
|
|
$ |
|
Revenue |
|
|
$ |
|
Revenue |
|
|
$ |
|
Revenue |
|
|
$ |
|
Revenue |
|
$ Change |
|
% Change |
|
|||||
|
|
|
(dollars in thousands) |
|
|
|
|
|
||||||||||||||||||||||
|
Revenues |
|
|
|
|
|
|
|
|
|
|
|
|
|
|
|
|
|
|
|
|
|
|
|
|
|
|
|
|
|
|
Transaction fees |
|
$ |
423,583 |
|
54.6 |
% |
|
$ |
370,881 |
|
54.2 |
% |
|
$ |
97,130 |
|
54.4% |
|
|
$ |
273,751 |
|
54.1 |
% |
$ |
52,702 |
|
14.2 |
% |
|
Subscription fees(2) |
|
|
194,366 |
|
25.1 |
% |
|
|
190,500 |
|
27.8 |
% |
|
|
46,519 |
|
26.0% |
|
|
|
143,981 |
|
28.5 |
% |
|
3,866 |
|
2.0 |
% |
|
Commissions |
|
|
149,365 |
|
19.3 |
% |
|
|
112,670 |
|
16.5 |
% |
|
|
32,840 |
|
18.4% |
|
|
|
79,830 |
|
15.8 |
% |
|
36,695 |
|
32.6 |
% |
|
Other |
|
|
8,252 |
|
1.1 |
% |
|
|
10,357 |
|
1.5 |
% |
|
|
2,148 |
|
1.2% |
|
|
|
8,209 |
|
1.6 |
% |
|
(2,105) |
|
(20.3) |
% |
|
Gross revenue |
|
|
775,566 |
|
100.0 |
% |
|
|
684,408 |
|
100.0 |
% |
|
|
178,637 |
|
100.0% |
|
|
|
505,771 |
|
100.0 |
% |
|
91,158 |
|
13.3 |
% |
|
Contingent consideration |
|
|
— |
|
|
|
|
|
(26,830) |
|
|
|
|
|
— |
|
|
|
|
|
(26,830) |
|
|
|
|
26,830 |
|
(100.0) |
% |
|
Net revenue |
|
$ |
775,566 |
|
|
|
|
$ |
657,578 |
|
|
|
|
$ |
178,637 |
|
|
|
|
$ |
478,941 |
|
|
|
$ |
117,988 |
|
17.9 |
% |
|
Components of gross revenue growth: |
|
|
|
|
|
|
|
|
|
|
|
|
|
|
|
|
|
|
|
|
|
|
|
|
|
|
|
|
|
|
Constant currency growth(3) |
|
|
|
|
|
|
|
|
|
|
|
|
|
|
|
|
|
|
|
|
|
|
|
|
|
|
|
15.1 |
% |
|
Foreign currency impact |
|
|
|
|
|
|
|
|
|
|
|
|
|
|
|
|
|
|
|
|
|
|
|
|
|
|
|
(1.8) |
% |
|
Total gross revenue growth |
|
|
|
|
|
|
|
|
|
|
|
|
|
|
|
|
|
|
|
|
|
|
|
|
|
|
|
13.3 |
% |
|
(1) |
Represents the combined results of the Successor and Predecessor periods for the full year ended December 31, 2018. This combination was performed by mathematical addition and is not a presentation made in accordance with GAAP. However, we believe it provides a meaningful method of comparison of revenues for the year ended December 31, 2019 to the combined year ended December 31, 2018. Revenue accounts were not impacted by the Refinitiv Transaction or the application of pushdown accounting. |
|
(2) |
Subscription fees for the year ended December 31, 2019, the combined year ended December 31, 2018 the 2018 Successor Period and the 2018 Predecessor Period, include $55.6 million, $50.3 million, $13.4 million and $36.8 million, respectively, of Refinitiv (formerly Thomson Reuters) market data fees. |
|
(3) |
Constant currency growth, which is a non-GAAP financial measure, is defined as gross revenue growth excluding the effects of foreign currency fluctuations. Gross revenue excluding the effects of foreign currency fluctuations is calculated by translating the current period and prior period’s gross revenue using the average exchange rates for 2018. We use constant currency growth as a supplemental metric to evaluate our underlying gross revenue performance between periods by removing the impact of foreign currency fluctuations. We believe that providing constant currency growth provides a useful comparison of our gross revenue performance and trends between periods. |
Transaction fees. Transaction fees increased by $52.7 million or 14.2% to $423.6 million for the year ended December 31, 2019 from $370.9 million for the combined year ended December 31, 2018 primarily due to higher trading volumes for rates derivatives, rates cash, credit cash and money markets products and European ETFs.
Subscription fees. Subscription fees increased by $3.9 million or 2.0% to $194.4 million for the year ended December 31, 2019 from $190.5 million for the combined year ended December 31, 2018 primarily due to higher market data and Institutional MBS fees, partially offset by lower Retail fees.
Commissions. Commissions increased by $36.7 million or 32.6% to $149.4 million for the year ended December 31, 2019 from $112.7 million for the combined year ended December 31, 2018 primarily due to higher trading volumes for U.S. corporate bonds and U.S. government bonds.
Other. Other revenue decreased by $2.1 million or (20.3)% to $8.3 million for the year ended December 31, 2019 from $10.4 million for the combined year ended December 31, 2018 primarily as a result of decreased fees from a third party for certain licensing and development in Canada.
84
Contingent consideration. There was no contingent consideration for the year ended December 31, 2019 due to the vesting of the Credit Initiative Earnout at July 31, 2018. Contingent consideration for the combined year ended December 31, 2018 was $26.8 million.
Our gross revenue by client sector for the year ended December 31, 2019, the combined year ended December 31, 2018, the 2018 Successor Period and the 2018 Predecessor Period, and the resulting dollar and percentage changes, were as follows:
|
|
|
Successor |
|
|
Combined (1) |
|
|
Successor |
|
|
Predecessor |
|
Year Ended December 31, 2019 vs |
|
|||||||
|
|
|
Year Ended |
|
|
Year Ended |
|
|
October 1, 2018 to |
|
|
January 1, 2018 to |
|
|
|
|||||||
|
|
|
December 31, 2019 |
|
|
December 31, 2018 |
|
|
December 31, 2018 |
|
|
September 30, 2018 |
|
$ Change |
|
% Change |
|
|||||
|
|
|
(dollars in thousands) |
|
|
|
|
|
|
|||||||||||||
|
Revenues |
|
|
|
|
|
|
|
|
|
|
|
|
|
|
|
|
|
|
|
|
|
|
Institutional |
|
$ |
453,379 |
|
|
$ |
405,889 |
|
|
$ |
103,971 |
|
|
$ |
301,918 |
|
$ |
47,490 |
|
11.7 |
% |
|
Wholesale |
|
|
171,096 |
|
|
|
137,181 |
|
|
|
38,153 |
|
|
|
99,028 |
|
|
33,915 |
|
24.7 |
% |
|
Retail |
|
|
80,368 |
|
|
|
77,546 |
|
|
|
19,780 |
|
|
|
57,766 |
|
|
2,822 |
|
3.6 |
% |
|
Market Data |
|
|
70,723 |
|
|
|
63,792 |
|
|
|
16,733 |
|
|
|
47,059 |
|
|
6,931 |
|
10.9 |
% |
|
Gross revenue |
|
$ |
775,566 |
|
|
$ |
684,408 |
|
|
$ |
178,637 |
|
|
$ |
505,771 |
|
$ |
91,158 |
|
13.3 |
% |
|
(1) |
Represents the combined results of the Successor and Predecessor periods for the full year ended December 31, 2018. This combination was performed by mathematical addition and is not a presentation made in accordance with GAAP. However, we believe it provides a meaningful method of comparison of revenues for the year ended December 31, 2019 to the combined year ended December 31, 2018. Revenue accounts were not impacted by the Refinitiv Transaction or the application of pushdown accounting. |
Institutional. Revenues from our Institutional client sector increased by $47.5 million or 11.7% to $453.4 million for the year ended December 31, 2019 from $405.9 million for the combined year ended December 31, 2018. The increase was derived primarily from higher trading volumes for rates derivatives products, mortgages, credit cash products, ETFs and repurchase agreements, partially offset by the impact of foreign exchange, mainly the weakening of the euro.
Wholesale. Revenues from our Wholesale client sector increased by $33.9 million or 24.7% to $171.1 million for the year ended December 31, 2019 from $137.2 million for the combined year ended December 31, 2018. The increase was derived primarily from higher trading volumes for U.S. corporates and U.S. government bonds.
Retail. Revenues from our Retail client sector increased by $2.8 million or 3.6% to $80.4 million for the year ended December 31, 2019 from $77.6 million for the combined year ended December 31, 2018. The increase was derived primarily from higher trading volumes for certificates of deposit, credit cash products, and U.S. government bonds partially offset by lower revenues from software development and implementation on behalf of certain clients.
Market Data. Revenues from our Market Data client sector increased by $6.9 million or 10.9% to $70.7 million for the year ended December 31, 2019 from $63.8 million for the combined year ended December 31, 2018 primarily as a result of an increase in the number of market data feeds provided to Refinitiv (formerly Thomson Reuters) and revenue from our APA reporting service.
Our gross revenue by asset class for the year ended December 31, 2019, the combined year ended December 31, 2018, the 2018 Successor Period and the 2018 Predecessor Period, and the resulting dollar and percentage changes, were as follows:
|
|
|
Successor |
|
|
Combined (1) |
|
|
Successor |
|
|
Predecessor |
|
Year Ended December 31, 2019 vs |
|
|||||||
|
|
|
Year Ended |
|
|
Year Ended |
|
|
October 1, 2018 to |
|
|
January 1, 2018 to |
|
Combined Year Ended December 31, 2018 |
|
|||||||
|
|
|
December 31, 2019 |
|
|
December 31, 2018 |
|
|
December 31, 2018 |
|
|
September 30, 2018 |
|
$ Change |
|
% Change |
|
|||||
|
|
|
(dollars in thousands) |
|
|
|
|
|
|
|||||||||||||
|
Revenues |
|
|
|
|
|
|
|
|
|
|
|
|
|
|
|
|
|
|
|
|
|
|
Rates |
|
$ |
434,197 |
|
|
$ |
379,233 |
|
|
$ |
97,592 |
|
|
$ |
281,641 |
|
$ |
54,964 |
|
14.5 |
% |
|
Credit |
|
|
162,154 |
|
|
|
139,656 |
|
|
|
37,204 |
|
|
|
102,452 |
|
|
22,498 |
|
16.1 |
% |
|
Equities |
|
|
46,912 |
|
|
|
40,939 |
|
|
|
12,592 |
|
|
|
28,347 |
|
|
5,973 |
|
14.6 |
% |
|
Money Markets |
|
|
40,392 |
|
|
|
34,741 |
|
|
|
9,493 |
|
|
|
25,248 |
|
|
5,651 |
|
16.3 |
% |
|
Market Data |
|
|
70,723 |
|
|
|
63,792 |
|
|
|
16,733 |
|
|
|
47,059 |
|
|
6,931 |
|
10.9 |
% |
|
Other Fees |
|
|
21,188 |
|
|
|
26,047 |
|
|
|
5,023 |
|
|
|
21,024 |
|
|
(4,859) |
|
(18.7) |
% |
|
Gross revenue |
|
$ |
775,566 |
|
|
$ |
684,408 |
|
|
$ |
178,637 |
|
|
$ |
505,771 |
|
$ |
91,158 |
|
13.3 |
% |
|
(1) |
Represents the combined results of the Successor and Predecessor periods for the full year ended December 31, 2018. This combination was performed by mathematical addition and is not a presentation made in accordance with GAAP. However, we believe it provides a |
85
meaningful method of comparison of revenues for the year ended December 31, 2019 to the combined year ended December 31, 2018. Revenue accounts were not impacted by the Refinitiv Transaction or the application of pushdown accounting. |
Our variable and fixed revenues by asset class for the year ended December 31, 2019, the combined year ended December 31, 2018, the 2018 Successor Period and the 2018 Predecessor Period, and the resulting dollar and percentage changes, were as follows:
|
|
|
Successor |
|
|
Combined(1) |
|
|
Successor |
|
|
Predecessor |
|
|
Year Ended December 31, 2019 vs |
|
|||||||||||||||||||||||
|
|
|
Year Ended |
|
|
Year Ended |
|
|
October 1, 2018 to |
|
|
January 1, 2018 to |
|
|
Combined Year Ended December 31, 2018 |
|
|||||||||||||||||||||||
|
|
|
December 31, 2019 |
|
|
December 31, 2018 |
|
|
December 31, 2018 |
|
|
September 30, 2018 |
|
$ Change |
|
% Change |
|
||||||||||||||||||||||
|
|
|
Variable |
|
Fixed |
|
|
Variable |
|
Fixed |
|
|
Variable |
|
Fixed |
|
|
Variable |
|
Fixed |
|
Variable |
|
Fixed |
|
Variable |
|
Fixed |
|
||||||||||
|
|
|
(dollars in thousands) |
|
|
|
|
|
|
|
|
|
|
|
|||||||||||||||||||||||||
|
Revenues |
|
|
|
|
|
|
|
|
|
|
|
|
|
|
|
|
|
|
|
|
|
|
|
|
|
|
|
|
|
|
|
|
|
|
|
|
|
|
|
Rates |
|
$ |
232,423 |
|
$ |
201,774 |
|
|
$ |
181,051 |
|
$ |
198,182 |
|
|
$ |
47,868 |
|
$ |
49,724 |
|
|
$ |
133,183 |
|
$ |
148,458 |
|
$ |
51,372 |
|
$ |
3,592 |
|
28.4 |
% |
1.8 |
% |
|
Credit |
|
|
141,343 |
|
|
20,811 |
|
|
|
119,217 |
|
|
20,439 |
|
|
|
31,976 |
|
|
5,228 |
|
|
|
87,241 |
|
|
15,211 |
|
|
22,126 |
|
|
372 |
|
18.6 |
% |
1.8 |
% |
|
Equities |
|
|
38,515 |
|
|
8,397 |
|
|
|
34,443 |
|
|
6,496 |
|
|
|
10,949 |
|
|
1,643 |
|
|
|
23,494 |
|
|
4,853 |
|
|
4,072 |
|
|
1,901 |
|
11.8 |
% |
29.3 |
% |
|
Money Markets |
|
|
25,461 |
|
|
14,931 |
|
|
|
20,843 |
|
|
13,898 |
|
|
|
6,040 |
|
|
3,453 |
|
|
|
14,803 |
|
|
10,445 |
|
|
4,618 |
|
|
1,033 |
|
22.2 |
% |
7.4 |
% |
|
Market Data |
|
|
— |
|
|
70,723 |
|
|
|
— |
|
|
63,792 |
|
|
|
— |
|
|
16,733 |
|
|
|
— |
|
|
47,059 |
|
|
— |
|
|
6,931 |
|
— |
% |
10.9 |
% |
|
Other |
|
|
— |
|
|
21,188 |
|
|
|
40 |
|
|
26,007 |
|
|
|
— |
|
|
5,023 |
|
|
|
40 |
|
|
20,984 |
|
|
(40) |
|
|
(4,819) |
|
(100.0) |
% |
(18.5) |
% |
|
Gross revenue |
|
$ |
437,742 |
|
$ |
337,824 |
|
|
$ |
355,594 |
|
$ |
328,814 |
|
|
$ |
96,833 |
|
$ |
81,804 |
|
|
$ |
258,761 |
|
$ |
247,010 |
|
$ |
82,148 |
|
$ |
9,010 |
|
23.1 |
% |
2.7 |
% |
|
(1) |
Represents the combined results of the Successor and Predecessor periods for the full year ended December 31, 2018. This combination was performed by mathematical addition and is not a presentation made in accordance with GAAP. However, we believe it provides a meaningful method of comparison of revenues for the year ended December 31, 2019 to the combined year ended December 31, 2018. Revenue accounts were not impacted by the Refinitiv Transaction or the application of pushdown accounting. |
Rates. Revenues from our Rates asset class increased by $55.0 million or 14.5% to $434.2 million for the year ended December 31, 2019 from $379.2 million for the combined year ended December 31, 2018 primarily due to higher trading volumes for derivatives products, U.S. government bonds and mortgages.
Credit. Revenues from our Credit asset class increased by $22.5 million or 16.1% to $162.2 million for the year ended December 31, 2019 from $139.7 million for the combined year ended December 31, 2018 primarily due to higher trading volumes for U.S. corporate bonds and Chinese bonds.
Equities. Revenues from our Equities asset class increased by $6.0 million or 14.6% to $46.9 million for the year ended December 31, 2019 from $40.9 million for the combined year ended December 31, 2018 primarily due to higher trading volumes for European ETFs and derivatives products, as well as higher revenues from U.S. ETFs.
Money Markets. Revenues from our Money Markets asset class increased by $5.7 million or 16.3% to $40.4 million for the year ended December 31, 2019 from $34.7 million for the combined year ended December 31, 2018 primarily due to higher trading volumes for repurchase agreements and certificates of deposit.
Market Data. Revenues from Market Data increased by $6.9 million or 10.9% to $70.7 million for the year ended December 31, 2019 from $63.8 million for the combined year ended December 31, 2018 as a result of an increase in the number of market data feeds provided to Refinitiv (formerly Thomson Reuters) and revenue from our APA reporting service.
Other Fees. Revenues from Other Fees decreased by $4.9 million or (18.7)% to $21.2 million for the year ended December 31, 2019 from $26.1 million for the combined year ended December 31, 2018 primarily due to lower fees from a third party for certain licensing and development in Canada and lower Retail revenues from software development and implementation on behalf of certain clients.
A significant percentage of our revenues are tied directly to overall trading volumes in the rates, credit, equities and money markets asset classes. The average daily volumes and total volumes on our trading platforms by asset class for the years ended December 31, 2019 and 2018 were as follows:
|
|
|
Year Ended |
|
|
|
||||||||||
|
|
|
December 31, 2019 |
|
December 31, 2018 |
|
ADV |
|
||||||||
|
|
|
ADV |
|
Volume |
|
ADV |
|
Volume |
|
% Change |
|
||||
|
|
|
(dollars in millions) |
|
|
|
||||||||||
|
Rates |
|
$ |
489,645 |
|
$ |
122,871,725 |
|
$ |
354,023 |
|
$ |
88,625,615 |
|
38.3 |
% |
86
|
Credit |
|
|
14,777 |
|
|
3,721,199 |
|
|
12,658 |
|
|
3,186,209 |
|
16.7 |
% |
|
Equities |
|
|
7,795 |
|
|
1,972,767 |
|
|
7,798 |
|
|
1,962,566 |
|
— |
% |
|
Money Markets |
|
|
213,209 |
|
|
53,706,377 |
|
|
173,743 |
|
|
43,462,916 |
|
22.7 |
% |
|
Total |
|
$ |
725,426 |
|
$ |
182,272,068 |
|
$ |
548,222 |
|
$ |
137,237,306 |
|
32.3 |
% |
We believe the increases in average daily volumes for our rates, credit and money markets asset classes in the year ended December 31, 2019 can be attributed to various factors, including further electronification of trading activities across our asset classes, increase in market share, new products, new clients and volatility. Rates ADV increased due mainly to higher trading activity in long and short-tenor interest rate swaps and swaptions, mortgages and U.S. treasuries. Credit ADV increased due to higher trading activity in U.S. high-grade and high-yield credit products, derivatives products and Chinese bonds. Equities ADV was flat, as an increase in European ETFs and derivatives products was offset by lower U.S. ETF notional volumes. Money Markets ADV increased mainly due to bilateral electronic trading in repurchase agreements.
The average variable fees per million dollars of volume traded on our trading platforms by asset class for the years ended December 31, 2019 and 2018 are summarized below. There are three potential drivers of quarterly fluctuations in our average variable fees per million: (1) volume discounts, (2) the mix of cash and derivatives products traded, and (3) the mix of protocols underpinning cash and derivatives products. Average variable fees per million should be reviewed in conjunction with our trading volumes and gross revenue by asset class. Since variable fees are sometimes subject to fee plans with tiered pricing based on product mix and volume, average variable fees per million for a specific asset class may not correlate with volumes or revenue growth. For example, average variable fees per million dollars of volume for our Rates asset class decreased 7.4% for the year ended December 31, 2019 while gross revenue for our Rates asset class increased 14.5% over the same period.
|
|
|
Year Ended |
|
|
|
|
|
|
||||
|
|
|
December 31, |
|
|
|
|
|
|
||||
|
|
|
2019 |
|
2018 |
|
$ Change |
|
% Change |
|
|||
|
Rates |
|
$ |
1.89 |
|
$ |
2.04 |
|
$ |
(0.15) |
|
(7.4) |
% |
|
Rates - excluding short-tenor swaps (less than 1 year) |
|
$ |
2.21 |
|
$ |
2.15 |
|
$ |
0.06 |
|
2.8 |
% |
|
Credit |
|
$ |
37.98 |
|
$ |
37.42 |
|
$ |
0.56 |
|
1.5 |
% |
|
Equities |
|
$ |
19.52 |
|
$ |
17.55 |
|
$ |
1.97 |
|
11.2 |
% |
|
Money Markets |
|
$ |
0.47 |
|
$ |
0.48 |
|
$ |
(0.01) |
|
(2.1) |
% |
|
Total Fees per Million |
|
$ |
2.40 |
|
$ |
2.59 |
|
$ |
(0.19) |
|
(7.3) |
% |
|
Total Fees per Million - excluding short-tenor swaps (less than 1 year) |
|
$ |
2.66 |
|
$ |
2.68 |
|
$ |
(0.02) |
|
(0.7) |
% |
Rates average variable fees per million was impacted by the growth in short tenor swap volumes, a product which has a lower variable fee capture compared to other rates products. Credit average variable fees per million was impacted by the growth in credit cash volumes, products which have a higher variable fee capture compared to credit derivative products. Equities average variable fees per million was impacted by a mix shift in volumes towards Institutional ETFs and away from Wholesale products. Money Markets average variable fees per million was impacted by a mix shift in volumes towards repurchase agreements and away from other lower variable fee capture Money Markets products.
Our gross revenue by geography (based on client location) for the year ended December 31, 2019, the combined year ended December 31, 2018, the 2018 Successor Period and the 2018 Predecessor Period, and the resulting dollar and percentage changes, were as follows:
|
|
|
Successor |
|
|
Combined (1) |
|
|
Successor |
|
|
Predecessor |
|
Year Ended December 31, 2019 vs |
|
||||||
|
|
|
Year Ended |
|
|
Year Ended |
|
|
October 1, 2018 to |
|
|
January 1, 2018 to |
|
Combined Year Ended December 31, 2018 |
|
||||||
|
|
|
December 31, 2019 |
|
|
December 31, 2018 |
|
|
December 31, 2018 |
|
|
September 30, 2018 |
|
$ Change |
|
% Change |
|
||||
|
|
|
(dollars in thousands) |
|
|
|
|
|
|||||||||||||
|
Revenues |
|
|
|
|
|
|
|
|
|
|
|
|
|
|
|
|
|
|
|
|
|
U.S. |
|
$ |
497,316 |
|
|
$ |
440,211 |
|
|
$ |
115,907 |
|
|
$ |
324,304 |
|
57,105 |
|
13.0 |
% |
|
International |
|
|
278,250 |
|
|
|
244,197 |
|
|
|
62,730 |
|
|
|
181,467 |
|
34,053 |
|
13.9 |
% |
|
Gross revenue |
|
$ |
775,566 |
|
|
$ |
684,408 |
|
|
$ |
178,637 |
|
|
$ |
505,771 |
|
91,158 |
|
13.3 |
% |
87
|
(1) |
Represents the combined results of the Successor and Predecessor periods for the full year ended December 31, 2018. This combination was performed by mathematical addition and is not a presentation made in accordance with GAAP. However, we believe it provides a meaningful method of comparison of revenues for the year ended December 31, 2019 to the combined year ended December 31, 2018. Revenue accounts were not impacted by the Refinitiv Transaction or the application of pushdown accounting. |
U.S. Revenues from U.S. clients increased by $57.1 million or 13.0% to $497.3 million for the year ended December 31, 2019 from $440.2 million for the combined year ended December 31, 2018 primarily due to higher trading volumes for U.S. credit products, U.S. government bonds, mortgages and rates derivatives products.
International. Revenues from International clients increased by $34.1 million or 13.9% to $278.3 million for the year ended December 31, 2019 from $244.2 million for the combined year ended December 31, 2018 primarily due to higher trading volumes for rates derivatives products, European equities products, Chinese bonds and repurchase agreements. Compared to 2018 average rates, fluctuations in foreign currency rates throughout 2019 decreased our International gross revenue by $11.8 million.
Operating Expenses
Our expenses for the year ended December 31, 2019, the 2018 Successor Period and the 2018 Predecessor Period were as follows:
|
|
|
Successor |
|
|
Successor |
|
|
Predecessor |
|||
|
|
|
Year Ended |
|
|
October 1, 2018 to |
|
|
January 1, 2018 to |
|||
|
|
|
December 31, 2019 |
|
|
December 31, 2018 |
|
|
September 30, 2018 |
|||
|
|
|
(in thousands) |
|||||||||
|
Employee compensation and benefits(1) |
|
$ |
329,457 |
|
|
$ |
80,436 |
|
|
$ |
209,053 |
|
Depreciation and amortization |
|
|
139,330 |
|
|
|
33,020 |
|
|
|
48,808 |
|
Technology and communications(1) |
|
|
39,285 |
|
|
|
9,907 |
|
|
|
26,598 |
|
General and administrative(1) |
|
|
34,960 |
|
|
|
11,837 |
|
|
|
23,056 |
|
Professional fees(1) |
|
|
28,029 |
|
|
|
8,194 |
|
|
|
20,360 |
|
Occupancy |
|
|
14,686 |
|
|
|
3,308 |
|
|
|
10,732 |
|
Total Expenses |
|
$ |
585,747 |
|
|
$ |
146,702 |
|
|
$ |
338,607 |
|
(1) |
The change in basis resulting from the Refinitiv Transaction and the application of pushdown accounting did not impact these operating expense accounts. |
Employee Compensation and Benefits. Employee compensation and benefits expense increased by $40.0 million or 13.8% to $329.5 million for the year ended December 31, 2019 from $289.5 million for the combined year ended December 31, 2018. The increase was primarily due to $24.4 million of non-cash stock-based compensation expense related to the Special Option Award, which, as a result of the completion of the IPO, we began to expense during the second quarter of 2019 (with $18.9 million recognized as compensation expense related to these options immediately upon the completion of the IPO), and post-IPO options awarded in the second half of 2019, an increase in commission related expenses of $9.9 million related to higher Wholesale revenues and an increase in salaries, bonus and benefits of $3.9 million.
Depreciation and Amortization. Depreciation and amortization expense for the year ended December 31, 2019 was $139.3 million. Depreciation and amortization expense for the 2018 Successor Period and the 2018 Predecessor Period was $33.0 million and $48.8 million, respectively. As a result of the Refinitiv Transaction and the application of pushdown accounting, we adjusted our assets and liabilities to their estimated fair values as of October 1, 2018, which resulted in an increase in depreciation of tangible assets and amortization of our intangible assets. For the year ended December 31, 2019, acquisition and Refinitiv related depreciation and amortization was $97.6 million. For the 2018 Successor Period, and the 2018 Predecessor Period, acquisition and Refinitiv related depreciation and amortization was $22.4 million and $19.6 million, respectively.
88
Technology and Communications. Technology and communications expense increased by $2.8 million or 7.6% to $39.3 million for the year ended December 31, 2019 from $36.5 million for the combined year ended December 31, 2018. The increase was primarily due to increased clearance and data fees as a result of higher trading volumes.
General and Administrative. General and administrative expense increased by $0.1 million or 0.2% to $35.0 million for the year ended December 31, 2019 from $34.9 million for the combined year ended December 31, 2018. The increase was primarily a result of an increase in insurance costs of $2.2 million associated with being a public company, and foreign exchange losses of $1.1 million, partially offset by lower bad debt expenses of $1.5 million associated with an evaluation of the reserve, sales and use taxes of $1.2 million, and lower recruiting fees of $0.6 million.
Professional Fees. Professional fees decreased by $0.5 million or (1.8)% to $28.0 million for the year ended December 31, 2019 from $28.6 million for the combined year ended December 31, 2018. The decrease was primarily due to lower legal and consulting fees, as well as lower advisory fees in 2019, as 2018 included higher fees incurred in connection with the IPO, partially offset by higher audit and tax advisory fees associated with being a public company.
Occupancy. Occupancy expense for the year ended December 31, 2019 was $14.7 million. Occupancy expense for the 2018 Successor Period and the 2018 Predecessor Period was $3.3 million and $10.7 million, respectively. As a result of the Refinitiv Transaction and the application of pushdown accounting, at October 1, 2018, we established a leasehold interest liability, which resulted in contra expense of $0.4 million during the year ended December 31, 2019. Occupancy expense for the year ended December 31, 2019 also was impacted by an increase in costs associated with our Europe and Asia offices.
Net Interest Income (Expense)
Net interest income for the year ended December 31, 2019 decreased by $0.1 million, or (5.5)% to $2.4 million from $2.5 million for the combined year ended December 31, 2018. The decrease was due to higher interest expense associated with credit facility fees related to the Revolving Credit Facility of $1.3 million, partially offset by higher interest income from cash investments. The change in basis resulting from the Refinitiv Transaction and the application of pushdown accounting did not impact net interest income (expense).
Tax Receivable Agreement Liability Adjustment
The tax receivable agreement liability adjustment for the year ended December 31, 2019 was $33.1 million, which represents income recognized during the year ended December 31, 2019 primarily due to changes in the tax receivable agreement liability recorded in our consolidated statement of financial condition as a result of changes in the mix of earnings, tax legislation and tax rates in various jurisdictions which impacted our tax savings.
Income Taxes
Provision for income taxes for the year ended December 31, 2019 was $52.3 million. Provision for income taxes for the 2018 Successor Period and the 2018 Predecessor Period was $3.4 million and $11.9 million, respectively. Provision for income taxes for the year ended December 31, 2019 was impacted by the Reorganization Transactions and the IPO, which resulted in Tradeweb Markets Inc. becoming subject to U.S. federal, state and local income taxes with respect to its taxable income, including its allocable share of any taxable income of TWM LLC, and being taxed at prevailing corporate tax rates. Prior to the Reorganization Transactions, income taxes consisted only of business taxes incurred by TWM LLC and certain subsidiaries for business conducted in certain state, local and foreign jurisdictions as well as federal, state and local taxes for certain subsidiaries that are taxed as corporations for U.S. tax purposes. The provision for income taxes for the year ended December 31, 2019 was also impacted by an increase in Tradeweb Market Inc.’s ownership interest in TWM LLC following the completion of the October 2019 follow-on offering and the application of the use of proceeds therefrom.
89
For October 1, 2018 to December 31, 2018 (Successor), January 1, 2018 to September 30, 2018 (Predecessor) and the Year Ended December 31, 2017 (Predecessor)
The following table sets forth a summary of our statements of income for the 2018 Successor Period, the 2018 Predecessor Period and the year ended December 31, 2017:
|
|
|
Successor |
|
|
Predecessor |
|
Predecessor |
|||
|
|
|
October 1, 2018 to |
|
|
January 1, 2018 to |
|
Year Ended |
|||
|
|
|
December 31, 2018 |
|
|
September 30, 2018 |
|
December 31, 2017 |
|||
|
|
|
(dollars in thousands) |
||||||||
|
Gross revenue |
|
$ |
178,637 |
|
|
$ |
505,771 |
|
$ |
562,968 |
|
Contingent consideration |
|
|
— |
|
|
|
(26,830) |
|
|
(58,520) |
|
Net revenue |
|
|
178,637 |
|
|
|
478,941 |
|
|
504,448 |
|
Total expenses |
|
|
146,702 |
|
|
|
338,607 |
|
|
415,356 |
|
Operating income |
|
|
31,935 |
|
|
|
140,334 |
|
|
89,092 |
|
Net interest income |
|
|
787 |
|
|
|
1,726 |
|
|
685 |
|
Income before taxes |
|
|
32,722 |
|
|
|
142,060 |
|
|
89,777 |
|
Provision for Income taxes |
|
|
(3,415) |
|
|
|
(11,900) |
|
|
(6,129) |
|
Net income |
|
$ |
29,307 |
|
|
$ |
130,160 |
|
$ |
83,648 |
Overview
During the combined year ended December 31, 2018, our business was impacted by a number of factors, including higher client trading activity, driving revenue increases in rates, credit, equities and money markets trading. Our market data business also grew due to the expansion of our market data license agreement with Refinitiv. Our expenses were impacted by higher employee compensation and benefits expense and higher professional fees, as well as higher depreciation and amortization expense as a result of the application of pushdown accounting.
Gross revenue increased by $121.4 million or 21.6% to $684.4 million for the combined year ended December 31, 2018 from $563.0 million for the year ended December 31, 2017. This increase in gross revenue was mainly due to higher trading volumes resulting in a $103.9 million increase in transaction fees and a $15.9 million increase in commissions. Net revenue increased by $153.1 million or 30.4% to $657.6 million for the combined year ended December 31, 2018 from $504.4 million for the year ended December 31, 2017. Non-cash contingent consideration decreased by $31.7 million to $26.8 million for the combined year ended December 31, 2018 from $58.5 million for the year ended December 31, 2017 as a result of changes in projected and actual revenues related to the Credit Initiative Earnout during the periods.
Total expenses for the 2018 Successor Period and the 2018 Predecessor Period were $146.7 million and $338.6 million, respectively. Total expenses for the year ended December 31, 2017 were $415.4 million. Total expenses for the 2018 Successor Period and the 2018 Predecessor Period were impacted by higher employee compensation and benefits expense and higher professional fees. The 2018 Successor Period was also impacted by higher depreciation and amortization expense as a result of the application of pushdown accounting.
Income before taxes for the 2018 Successor Period and the 2018 Predecessor Period was $32.7 million and $142.1 million, respectively. Income before taxes for the year ended December 31, 2017 was $89.8 million. Net income for the 2018 Successor Period and the 2018 Predecessor Period was $29.3 million and $130.2 million, respectively. Net income for the year ended December 31, 2017 was $83.6 million. Income before taxes and net income for the 2018 Successor Period and the 2018 Predecessor Period were positively impacted by higher revenues partially offset by higher compensation costs.
Revenues
90
Our revenues for the 2018 Successor Period, the 2018 Predecessor Period, the combined year ended December 31, 2018 and the year ended December 31, 2017, and the resulting dollar and percentage changes, were as follows:
|
|
|
Successor |
|
|
Predecessor |
|
Combined(1) |
|
|
Predecessor |
|
|
|
|
|
|
|
||||||||
|
|
|
October 1, 2018 to |
|
|
January 1, 2018 to |
|
Year Ended |
|
|
Year Ended |
|
|
Combined Year Ended December 31, 2018 vs |
|
|||||||||||
|
|
|
December 31, 2018 |
|
|
September 30, 2018 |
|
December 31, 2018 |
|
|
December 31, 2017 |
|
|
Year Ended December 31, 2017 |
|
|||||||||||
|
|
|
|
|
|
|
|
|
|
|
|
|
% of Gross |
|
|
|
|
|
% of Gross |
|
|
|
|
|
|
|
|
|
|
$ |
|
|
$ |
|
|
$ |
|
Revenue |
|
|
|
$ |
|
Revenue |
|
|
$ Change |
|
% Change |
|
|||
|
|
|
|
|
|
|
|
|
|
|
|
|
|
|
|
|
|
|
|
|
|
|
|
|
|
|
|
Revenues |
|
|
|
|
|
|
|
|
|
|
|
|
|
|
|
|
|
|
|
|
|
|
|
|
|
|
Transaction fees |
|
$ |
97,130 |
|
|
$ |
273,751 |
|
|
370,881 |
|
54.2 |
% |
|
$ |
267,020 |
|
47.4 |
% |
|
$ |
103,861 |
|
38.9 |
% |
|
Subscription fees(2) |
|
|
46,519 |
|
|
|
143,981 |
|
|
190,500 |
|
27.8 |
% |
|
|
194,534 |
|
34.6 |
% |
|
|
(4,034) |
|
(2.1) |
% |
|
Commissions |
|
|
32,840 |
|
|
|
79,830 |
|
|
112,670 |
|
16.5 |
% |
|
|
96,745 |
|
17.2 |
% |
|
|
15,925 |
|
16.5 |
% |
|
Other |
|
|
2,148 |
|
|
|
8,209 |
|
|
10,357 |
|
1.5 |
% |
|
|
4,669 |
|
0.8 |
% |
|
|
5,688 |
|
121.8 |
% |
|
Gross revenue |
|
|
178,637 |
|
|
|
505,771 |
|
|
684,408 |
|
100.0 |
% |
|
|
562,968 |
|
100.0 |
% |
|
|
121,440 |
|
21.6 |
% |
|
Contingent consideration |
|
|
— |
|
|
|
(26,830) |
|
|
(26,830) |
|
|
|
|
|
(58,520) |
|
|
|
|
|
31,690 |
|
(54.2) |
% |
|
Net revenue |
|
$ |
178,637 |
|
|
$ |
478,941 |
|
|
657,578 |
|
|
|
|
$ |
504,448 |
|
|
|
|
$ |
153,130 |
|
30.4 |
% |
|
Components of gross revenue growth: |
|
|
|
|
|
|
|
|
|
|
|
|
|
|
|
|
|
|
|
|
|
|
|
|
|
|
Constant currency growth(3) |
|
|
|
|
|
|
|
|
|
|
|
|
|
|
|
|
|
|
|
|
|
|
|
19.7 |
% |
|
Foreign currency impact |
|
|
|
|
|
|
|
|
|
|
|
|
|
|
|
|
|
|
|
|
|
|
|
1.8 |
% |
|
Total gross revenue growth |
|
|
|
|
|
|
|
|
|
|
|
|
|
|
|
|
|
|
|
|
|
|
|
21.6 |
% |
|
(1) |
Represents the combined results of the Successor and Predecessor periods for the full year ended December 31, 2018. This combination was performed by mathematical addition and is not a presentation made in accordance with GAAP. However, we believe it provides a meaningful method of comparison of revenues for the combined year ended December 31, 2018 to the year ended December 31, 2017. Revenue accounts were not impacted by the Refinitiv Transaction or the application of pushdown accounting. |
|
(1) |
Subscription fees for the combined year ended December 31, 2018, the 2018 Successor Period, the 2018 Predecessor Period and the year ended December 31, 2017 include $50.3 million, $13.5 million, $36.8 million and $50.1 million, respectively, of Refinitiv (formerly Thomson Reuters) market data fees. |
|
(1) |
Constant currency growth, which is a non-GAAP financial measure, is defined as gross revenue growth excluding the effects of foreign currency fluctuations. Gross revenue excluding the effects of foreign currency fluctuations is calculated by translating the current period and prior period’s gross revenue using the average exchange rates for 2017. We use constant currency growth as a supplemental metric to evaluate our underlying gross revenue performance between periods by removing the impact of foreign currency fluctuations. We believe that providing constant currency growth provides a useful comparison of our gross revenue performance and trends between periods. |
Transaction Fees. Transaction fees increased by $103.9 million or 38.9% to $370.9 million for the combined year ended December 31, 2018 from $267.0 million for the year ended December 31, 2017 from increased Institutional transactional volumes for U.S. credit products, derivative products (led by Dollar swaps, European interest rate swaps and U.S. and European credit default indexes), U.S. and European ETF, European repurchase agreements and U.S. treasury, as well as adjustments to contracts as a result of MiFID II pursuant to which annual subscription fees were replaced with monthly minimum transaction fees and the product launch of China bonds.
Subscription fees. Subscription fees decreased by $4.0 million or (2.1)% to $190.5 million for the combined year ended December 31, 2018 from $194.5 million for the year ended December 31, 2017 due primarily to a $10.3 million decline from MiFID II contract adjustments where certain annual subscription fees were replaced with monthly minimum transaction fees, partially offset by a $2.5 million increase in market data fees, a $1.4 million increase in Retail fees and a $2.6 million increase in Institutional fees.
Commissions. Commissions increased by $15.9 million or 16.5% to $112.7 million for the combined year ended December 31, 2018 from $96.7 million for the year ended December 31, 2017 primarily due to higher trading volumes in our Wholesale client sector for U.S. credit products, repurchase agreements, U.S. ETF and U.S. treasury. The revenue increase was partially offset by lower municipal bond, ARM and specified pool trading volumes.
Other. Other revenue increased by $5.7 million or 121.8% to $10.4 million for the combined year ended December 31, 2018 from $4.7 million for the year ended December 31, 2017 primarily as a result of revenue from our APA reporting service launched in January 2018 in response to MiFID II. Other fees also consisted of fees from a third party for certain licensing and development in Canada.
Contingent consideration. Contingent consideration decreased by $31.7 million or (54.2)% to $26.8 million for the combined year ended December 31, 2018 from $58.5 million for the year ended December 31, 2017. The decrease was a
91
result of changes in projected and actual revenues related to the Credit Initiative Earnout during the periods and the vesting of the Credit Initiative Earnout at July 31, 2018.
Our gross revenue by client sector for the 2018 Successor Period, the 2018 Predecessor Period, the combined year ended December 31, 2018 and the year ended December 31, 2017, and the resulting dollar and percentage changes, were as follows:
|
|
|
Successor |
|
|
Predecessor |
|
Combined (1) |
|
Predecessor |
|
Combined Year Ended December 31, 2018 vs |
|
|||||||
|
|
|
October 1, 2018 to |
|
|
January 1, 2018 to |
|
Year Ended |
|
Year Ended |
|
|
|
|||||||
|
|
|
December 31, 2018 |
|
|
September 30, 2018 |
|
December 31, 2018 |
|
December 31, 2017 |
|
$ Change |
|
% Change |
|
|||||
|
|
|
(dollars in thousands) |
|
|
|
|
|
|
|||||||||||
|
Revenues |
|
|
|
|
|
|
|
|
|
|
|
|
|
|
|
|
|
|
|
|
Institutional |
|
$ |
103,971 |
|
|
$ |
301,918 |
|
$ |
405,889 |
|
$ |
318,038 |
|
$ |
87,851 |
|
27.6 |
% |
|
Wholesale |
|
|
38,153 |
|
|
|
99,028 |
|
|
137,181 |
|
|
118,451 |
|
|
18,730 |
|
15.8 |
% |
|
Retail |
|
|
19,780 |
|
|
|
57,766 |
|
|
77,546 |
|
|
70,857 |
|
|
6,689 |
|
9.4 |
% |
|
Market Data |
|
|
16,733 |
|
|
|
47,059 |
|
|
63,792 |
|
|
55,622 |
|
|
8,170 |
|
14.7 |
% |
|
Gross revenue |
|
$ |
178,637 |
|
|
$ |
505,771 |
|
$ |
684,408 |
|
$ |
562,968 |
|
$ |
121,440 |
|
21.6 |
% |
|
(1) |
Represents the combined results of the Successor and Predecessor periods for the full year ended December 31, 2018. This combination was performed by mathematical addition and is not a presentation made in accordance with GAAP. However, we believe it provides a meaningful method of comparison of revenues for the combined year ended December 31, 2018 to the year ended December 31, 2017. Revenue accounts were not impacted by the Refinitiv Transaction or the application of pushdown accounting. |
Institutional. Revenues from our Institutional client sector increased by $87.9 million or 27.6% to $405.9 million for the combined year ended December 31, 2018 from $318.0 million for the year ended December 31, 2017. The increase was derived primarily from increased Institutional transactional volumes for U.S. and European credit products, derivative products (led by European interest rate swaps, Dollar swaps and U.S. and European credit default indexes), U.S. and European ETF, European government bonds, U.S. treasury, European repurchase agreements and the product launch of China bonds.
Wholesale. Revenues from our Wholesale client sector increased by $18.7 million or 15.8% to $137.2 million for the combined year ended December 31, 2018 from $118.5 million for the year ended December 31, 2017. Revenue increased primarily due to higher trading volumes in U.S. credit products, repurchase agreements, U.S. ETF and U.S. treasury. The revenue increase was partially offset by lower municipal bond, ARM and specified pool trading volumes.
Retail. Revenues from our Retail client sector increased by $6.7 million or 9.4% to $77.5 million for the combined year ended December 31, 2018 from $70.9 million for the year ended December 31, 2017 primarily due to strong middle markets trading volumes.
Market Data. Revenues from our Market Data client sector increased by $8.2 million or 14.7% to $63.8 million for the combined year ended December 31, 2018 from $55.6 million for the year ended December 31, 2017 as a result of revenue from our APA reporting service launched in January 2018 in response to MiFID II, increased Refinitiv (formerly Thomson Reuters) license fees due to an increase in the number of market data feeds provided to Refinitiv and increased Gilt closing price revenues.
Our gross revenue by asset class for the 2018 Successor Period, the 2018 Predecessor Period, the combined year ended December 31, 2018 and the year ended December 31, 2017, and the resulting dollar and percentage changes, were as follows:
|
|
|
Successor |
|
|
Predecessor |
|
Combined (1) |
|
Predecessor |
|
Combined Year Ended December 31, 2018 vs |
|
|||||||
|
|
|
October 1, 2018 to |
|
|
January 1, 2018 to |
|
Year Ended |
|
Year Ended |
|
|
|
|||||||
|
|
|
December 31, 2018 |
|
|
September 30, 2018 |
|
December 31, 2018 |
|
December 31, 2017 |
|
$ Change |
|
% Change |
|
|||||
|
|
|
(dollars in thousands) |
|
|
|
|
|
|
|||||||||||
|
Revenues |
|
|
|
|
|
|
|
|
|
|
|
|
|
|
|
|
|
|
|
|
Rates |
|
$ |
97,592 |
|
|
$ |
281,641 |
|
$ |
379,233 |
|
$ |
324,302 |
|
$ |
54,931 |
|
16.9 |
% |
|
Credit |
|
|
37,204 |
|
|
|
102,452 |
|
|
139,656 |
|
|
105,336 |
|
|
34,320 |
|
32.6 |
% |
|
Equities |
|
|
12,592 |
|
|
|
28,347 |
|
|
40,939 |
|
|
23,681 |
|
|
17,258 |
|
72.9 |
% |
|
Money Markets |
|
|
9,493 |
|
|
|
25,248 |
|
|
34,741 |
|
|
28,633 |
|
|
6,108 |
|
21.3 |
% |
|
Market Data |
|
|
16,733 |
|
|
|
47,059 |
|
|
63,792 |
|
|
55,622 |
|
|
8,170 |
|
14.7 |
% |
|
Other Fees |
|
|
5,023 |
|
|
|
21,024 |
|
|
26,047 |
|
|
25,394 |
|
|
653 |
|
2.6 |
% |
|
Total gross revenue |
|
$ |
178,637 |
|
|
$ |
505,771 |
|
$ |
684,408 |
|
$ |
562,968 |
|
$ |
121,440 |
|
21.6 |
% |
92
|
(1) |
Represents the combined results of the Successor and Predecessor periods for the full year ended December 31, 2018. This combination was performed by mathematical addition and is not a presentation made in accordance with GAAP. However, we believe it provides a meaningful method of comparison of revenues for the combined year ended December 31, 2018 to the year ended December 31, 2017. Revenue accounts were not impacted by the Refinitiv Transaction or the application of pushdown accounting. |
Our variable and fixed revenues by asset class for the 2018 Successor Period, the 2018 Predecessor Period, the combined year ended December 31, 2018 and the year ended December 31, 2017, and the resulting dollar and percentage changes, were as follows:
|
|
|
Successor |
|
|
Predecessor |
|
|
Combined(1) |
|
|
Predecessor |
|
|
Combined Year Ended December 31, 2018 vs |
|
|||||||||||||||||||||||
|
|
|
October 1, 2018 to |
|
|
January 1, 2018 to |
|
|
Year Ended |
|
|
Year Ended |
|
|
Year Ended December 31, 2017 |
|
|||||||||||||||||||||||
|
|
|
December 31, 2018 |
|
|
September 30, 2018 |
|
|
December 31, 2018 |
|
|
December 31, 2017 |
|
$ Change |
|
% Change |
|
||||||||||||||||||||||
|
|
|
Variable |
|
Fixed |
|
|
Variable |
|
Fixed |
|
|
Variable |
|
Fixed |
|
|
Variable |
|
Fixed |
|
Variable |
|
Fixed |
|
Variable |
|
Fixed |
|
||||||||||
|
|
|
(dollars in thousands) |
|
|
|
|
|
|
|
|
|
|
|
|||||||||||||||||||||||||
|
Revenues |
|
|
|
|
|
|
|
|
|
|
|
|
|
|
|
|
|
|
|
|
|
|
|
|
|
|
|
|
|
|
|
|
|
|
|
|
|
|
|
Rates |
|
$ |
47,868 |
|
$ |
49,724 |
|
|
$ |
133,183 |
|
$ |
148,458 |
|
|
$ |
181,051 |
|
$ |
198,182 |
|
|
$ |
143,840 |
|
$ |
180,462 |
|
$ |
37,211 |
|
$ |
17,720 |
|
25.9 |
% |
9.8 |
% |
|
Credit |
|
|
31,976 |
|
|
5,228 |
|
|
|
87,241 |
|
|
15,211 |
|
|
|
119,217 |
|
|
20,439 |
|
|
|
90,846 |
|
|
14,490 |
|
|
28,371 |
|
|
5,949 |
|
31.2 |
% |
41.1 |
% |
|
Equities |
|
|
10,949 |
|
|
1,643 |
|
|
|
23,494 |
|
|
4,853 |
|
|
|
34,443 |
|
|
6,496 |
|
|
|
19,150 |
|
|
4,531 |
|
|
15,293 |
|
|
1,965 |
|
79.9 |
% |
43.4 |
% |
|
Money Markets |
|
|
6,040 |
|
|
3,453 |
|
|
|
14,803 |
|
|
10,445 |
|
|
|
20,843 |
|
|
13,898 |
|
|
|
15,055 |
|
|
13,578 |
|
|
5,788 |
|
|
320 |
|
38.4 |
% |
2.4 |
% |
|
Market Data |
|
|
— |
|
|
16,733 |
|
|
|
— |
|
|
47,059 |
|
|
|
— |
|
|
63,792 |
|
|
|
— |
|
|
55,622 |
|
|
— |
|
|
8,170 |
|
— |
% |
14.7 |
% |
|
Other |
|
|
— |
|
|
5,023 |
|
|
|
40 |
|
|
20,984 |
|
|
|
40 |
|
|
26,007 |
|
|
|
36 |
|
|
25,358 |
|
|
4 |
|
|
649 |
|
11.1 |
% |
2.6 |
% |
|
Gross revenue |
|
$ |
96,833 |
|
$ |
81,804 |
|
|
$ |
258,761 |
|
$ |
247,010 |
|
|
$ |
355,594 |
|
$ |
328,814 |
|
|
$ |
268,927 |
|
$ |
294,041 |
|
$ |
86,667 |
|
$ |
34,773 |
|
32.2 |
% |
11.8 |
% |
|
(1) |
Represents the combined results of the Successor and Predecessor periods for the full year ended December 31, 2018. This combination was performed by mathematical addition and is not a presentation made in accordance with GAAP. However, we believe it provides a meaningful method of comparison of revenues for the combined year ended December 31, 2018 to the year ended December 31, 2017. Revenue accounts were not impacted by the Refinitiv Transaction or the application of pushdown accounting. |
Rates. Revenues from our Rates asset class increased by $54.9 million or 16.9% to $379.2 million for the combined year ended December 31, 2018 from $324.3 million for the year ended December 31, 2017 primarily due to increased Institutional transactional volumes in European interest rate swaps, Dollar swaps, U.S. treasury and European governments.
Credit. Revenues from our Credit asset class increased by $34.3 million or 32.6% to $139.7 million for the combined year ended December 31, 2018 from $105.3 million for the year ended December 31, 2017 primarily due to increased Institutional and Wholesale transactional volumes for U.S. credit products, increased Institutional transaction volumes for U.S. and European credit default indexes, European credit products and the product launch of China bonds. The revenue increase was partially offset by lower Wholesale municipal bond volumes.
Equities. Revenues from our Equities asset class increased by $17.3 million or 72.9% to $40.9 million for the combined year ended December 31, 2018 from $23.7 million for the year ended December 31, 2017 primarily due to increased Institutional transactional volumes for U.S. and European ETF.
Money Markets. Revenues from our Money Markets asset class increased by $6.1 million or 21.3% to $34.7 million for the combined year ended December 31, 2018 from $28.6 million for the year ended December 31, 2017 primarily due to increased Wholesale transactional volumes for repurchase agreements and higher Institutional transactional volumes for European repurchase agreements.
Market Data. Revenues from Market Data increased by $8.2 million or 14.7% to $63.8 million for the combined year ended December 31, 2018 from $55.6 million for the year ended December 31, 2017 as a result of revenue from our APA reporting service launched in January 2018 in response to MiFID II, increased Refinitiv (formerly Thomson Reuters) license fees due to an increase in the number of market data feeds provided to Refinitiv and increased Gilt closing price revenues.
Other Fees. Revenues from Other Fees increased by $0.7 million or 2.6% to $26.0 million for the combined year ended December 31, 2018 from $25.4 million for the year ended December 31, 2017 primarily due to increased Retail fees for software development and implementation.
93
A significant percentage of our revenues are tied directly to overall trading volumes in the rates, credit, money markets and equities asset classes. The average daily volumes and total volumes on our trading platforms by asset class for the years ended December 31, 2018 and 2017 were as follows:
|
|
|
Year Ended |
|
|
|
||||||||||
|
|
|
December 31, 2018 |
|
December 31, 2017 |
|
ADV |
|
||||||||
|
|
|
ADV |
|
Volume |
|
ADV |
|
Volume |
|
% Change |
|
||||
|
|
|
(dollars in millions) |
|
|
|
||||||||||
|
Rates |
|
$ |
354,023 |
|
$ |
88,625,615 |
|
$ |
253,432 |
|
$ |
63,475,383 |
|
39.7 |
% |
|
Credit |
|
|
12,658 |
|
|
3,186,209 |
|
|
7,554 |
|
|
1,864,700 |
|
67.6 |
% |
|
Equities |
|
|
7,798 |
|
|
1,962,566 |
|
|
4,817 |
|
|
1,214,081 |
|
61.9 |
% |
|
Money Markets |
|
|
173,743 |
|
|
43,462,916 |
|
|
132,105 |
|
|
33,060,749 |
|
31.5 |
% |
|
Total |
|
$ |
548,222 |
|
$ |
137,237,306 |
|
$ |
397,908 |
|
$ |
99,614,913 |
|
37.8 |
% |
We believe the increases in average daily volumes in the year ended December 31, 2018 can be attributed to various factors, including increased volatility, further electronification of trading activities, increase in market share, new products and new clients. In addition, we believe that certain trading volumes increased in the year ended December 31, 2018 as customers adapted to electronic trading in order to comply with obligations pursuant to MiFID II, which was implemented by regulatory bodies in Europe in January 2018. Rates ADV increased due mainly to higher trading activity in interest rate swaps, U.S. treasuries and mortgages. Credit ADV increased due mainly to higher trading activity in credit default swaps, U.S. high-grade credit, European credit and Chinese bonds. Equities ADV increased due mainly to higher trading activity in U.S. and European ETFs and equity futures. Money Markets ADV increased due to the continued growth of bilateral electronic trading in repurchase agreements.
The average variable fees per million dollars of volume traded on our trading platforms by asset class for the years ended December 31, 2018 and 2017 are summarized below. There are three potential drivers of quarterly fluctuations in our average variable fees per million: (1) volume discounts, (2) the mix of cash and derivatives products traded, and (3) the mix of protocols underpinning cash and derivatives products. Average variable fees per million should be reviewed in conjunction with our trading volumes and gross revenue by asset class. Since variable fees are sometimes subject to fee plans with tiered pricing based on product mix and volume, average variable fees per million for a specific asset class may not correlate with volumes or revenue growth. For example, average variable fees per million dollars of volume for our Credit asset class decreased 23.2% for the year ended December 31, 2018 while gross revenue for our Credit asset class increased 32.6% over the same period.
|
|
|
Year Ended |
|
|
|
|
|
|
||||
|
|
|
December 31, |
|
|
|
|
|
|
||||
|
|
|
2018 |
|
2017 |
|
$ Change |
|
% Change |
|
|||
|
Rates |
|
$ |
2.04 |
|
$ |
2.27 |
|
$ |
(0.23) |
|
(10.1) |
% |
|
Rates - excluding short-tenor swaps (less than 1 year) |
|
$ |
2.15 |
|
$ |
2.34 |
|
$ |
(0.19) |
|
(8.1) |
% |
|
Credit |
|
$ |
37.42 |
|
$ |
48.72 |
|
$ |
(11.30) |
|
(23.2) |
% |
|
Equities |
|
$ |
17.55 |
|
$ |
15.77 |
|
$ |
1.78 |
|
11.3 |
% |
|
Money Markets |
|
$ |
0.48 |
|
$ |
0.46 |
|
$ |
0.02 |
|
4.3 |
% |
|
Total Fees per Million |
|
$ |
2.59 |
|
$ |
2.70 |
|
$ |
(0.11) |
|
(4.1) |
% |
|
Total Fees per Million - excluding short-tenor swaps (less than 1 year) |
|
$ |
2.68 |
|
$ |
2.75 |
|
$ |
(0.07) |
|
(2.5) |
% |
Rates average variable fees per million was impacted by volume discounts in both cash and derivatives products. Credit average variable fees per million was impacted by a mix shift in volumes towards derivatives products and away from cash products, as well as a shift in volumes towards electronically processed institutional cash products. Equities average variable fees per million was impacted by a mix shift towards institutional derivatives protocols and away from wholesale derivatives protocols. Money Markets average variable fees per million was impacted by a mix shift towards repurchase agreements and away from other lower variable fee capture Money Markets products.
94
Our gross revenue by geography (based on client location) for the 2018 Successor Period, the 2018 Predecessor Period, the combined year ended December 31, 2018 and the year ended December 31, 2017, and the resulting dollar and percentage changes, were as follows:
|
|
|
Successor |
|
|
Predecessor |
|
Combined (1) |
|
Predecessor |
|
Combined Year Ended December 31, 2018 vs |
|
|||||||
|
|
|
October 1, 2018 to |
|
|
January 1, 2018 to |
|
Year Ended |
|
Year Ended |
|
|
|
|||||||
|
|
|
December 31, 2018 |
|
|
September 30, 2018 |
|
December 31, 2018 |
|
December 31, 2017 |
|
$ Change |
|
% Change |
|
|||||
|
|
|
(dollars in thousands) |
|
|
|
|
|
|
|||||||||||
|
Revenues |
|
|
|
|
|
|
|
|
|
|
|
|
|
|
|
|
|
|
|
|
U.S. |
|
$ |
115,907 |
|
|
$ |
324,304 |
|
$ |
440,211 |
|
$ |
385,176 |
|
$ |
55,035 |
|
14.3 |
% |
|
International |
|
|
62,730 |
|
|
|
181,467 |
|
|
244,197 |
|
|
177,792 |
|
|
66,405 |
|
37.3 |
% |
|
Gross revenue |
|
$ |
178,637 |
|
|
$ |
505,771 |
|
$ |
684,408 |
|
$ |
562,968 |
|
$ |
121,440 |
|
21.6 |
% |
|
(1) |
Represents the combined results of the Successor and Predecessor periods for the full year ended December 31, 2018. This combination was performed by mathematical addition and is not a presentation made in accordance with GAAP. However, we believe it provides a meaningful method of comparison of revenues for the combined year ended December 31, 2018 to the year ended December 31, 2017. Revenue accounts were not impacted by the Refinitiv Transaction or the application of pushdown accounting. |
U.S. Revenues from U.S. clients increased by $55.0 million or 14.3% to $440.2 million for the combined year ended December 31, 2018 from $385.2 million for the year ended December 31, 2017 primarily due to increased transactional volumes from our Institutional client sector for U.S. credit products, U.S. ETF and U.S. treasury, higher trading volumes from our Wholesale client sector, which saw an increase in volumes for U.S. credit, U.S. treasury and repurchase agreements and higher trading volumes for our Retail client sector, which saw an increase in middle markets trading volumes.
International. Revenues from International clients increased by $66.4 million or 37.3% to $244.2 million for the combined year ended December 31, 2018 from $177.8 million for the year ended December 31, 2017 primarily due to increased transactional volumes from our Institutional client sector for European interest rate swaps, European credit default indexes, European ETF, European governments and European credit products. Fluctuations in foreign currency rates increased our International gross revenue by $9.1 million.
Operating Expenses
Our expenses for the 2018 Successor Period, the 2018 Predecessor Period and the year ended December 31, 2017 were as follows:
|
|
|
Successor |
|
|
Predecessor |
|
Predecessor |
|||
|
|
|
October 1, 2018 to |
|
|
January 1, 2018 to |
|
Year Ended |
|||
|
|
|
December 31, 2018 |
|
|
September 30, 2018 |
|
December 31, 2017 |
|||
|
|
|
(in thousands) |
||||||||
|
Employee compensation and benefits(1) |
|
$ |
80,436 |
|
|
$ |
209,053 |
|
$ |
248,963 |
|
Depreciation and amortization |
|
|
33,020 |
|
|
|
48,808 |
|
|
68,615 |
|
Technology and communications(1) |
|
|
9,907 |
|
|
|
26,598 |
|
|
33,973 |
|
General and administrative(1) |
|
|
11,837 |
|
|
|
23,056 |
|
|
30,013 |
|
Professional fees(1) |
|
|
8,197 |
|
|
|
20,360 |
|
|
19,351 |
|
Occupancy |
|
|
3,308 |
|
|
|
10,732 |
|
|
14,441 |
|
Total Expenses |
|
$ |
146,705 |
|
|
$ |
338,607 |
|
$ |
415,356 |
|
(1) |
The change in basis resulting from the Refinitiv Transaction and the application of pushdown accounting did not impact these operating expense accounts. |
Employee Compensation and Benefits. Employee compensation and benefits expense for the 2018 Successor Period and the 2018 Predecessor Period was $80.4 million and $209.1 million, respectively. Employee compensation and benefits expense increased by $40.5 million or 16.3% to $289.5 million for the combined year ended December 31, 2018 from $249.0 million for the year ended December 31, 2017. The increase was due to a $14.1 million increase in salaries and benefits, due to an increase in employee headcount, and an increase in annual incentive compensation of $26.0 million, which is based on operating performance, primarily due to our financial results. Total employee headcount increased to 919 as of December 31, 2018 from 857 as of December 31, 2017.
95
Depreciation and Amortization. Depreciation and amortization expense for the 2018 Successor Period and the 2018 Predecessor Period was $33.0 million and $48.8 million, respectively. Depreciation and amortization expense was $68.6 million for the year ended December 31, 2017. As a result of the Refinitiv Transaction and the application of pushdown accounting, we adjusted our assets and liabilities to their estimated fair market values as of October 1, 2018, which resulted in an increase in depreciation of tangible assets and amortization of our intangible assets. The impact of such adjustments increased depreciation and amortization expense during the 2018 Successor Period by $15.9 million.
General and Administrative. General and administrative expense for the 2018 Successor Period and the 2018 Predecessor Period was $11.8 million and $23.1 million, respectively. General and administrative expense increased by $0.9 million or 2.7% to $34.9 million for the combined year ended December 31, 2018 from $34.0 million for the year ended December 31, 2017. The increase was primarily a result of $1.0 million in recruiting and expatriate expense, $0.9 million increase in marketing expense due to increased marketing efforts for key growth, client acquisition and regulatory initiatives, $0.5 million increase in value-added taxes and $0.8 million increase in other administrative fees, partially offset by a reduction in foreign exchange losses of $2.4 million.
Technology and Communications. Technology and communications expense for the 2018 Successor Period and the 2018 Predecessor Period was $9.9 million and $26.6 million, respectively. Technology and communications expense increased by $6.5 million or 21.6% to $36.5 million for the combined year ended December 31, 2018 from $30.0 million for the year ended December 31, 2017. The increase was primarily due to an increase in third-party software and technology maintenance and support as a result of certain cybersecurity and infrastructure initiatives and increased clearance fees as a result of higher trading volumes.
Professional Fees. Professional fees for the 2018 Successor Period and the 2018 Predecessor Period was $8.2 million and $20.4 million, respectively. Professional fees increased by $9.2 million or 47.6% to $28.6 million for the combined year ended December 31, 2018 from $19.4 million for the year ended December 31, 2017. The increase was primarily due to higher investment banking advisory, legal and audit fees, including fees incurred in connection with the IPO.
Occupancy. Occupancy expense for the 2018 Successor Period and the 2018 Predecessor Period was $3.3 million and $10.7 million, respectively. Occupancy expense for the year ended December 31, 2017 was $14.4 million. As a result of the Refinitiv Transaction and the application of pushdown accounting, at October 1, 2018, we established a leasehold interest liability, which resulted in a $0.1 million decrease in occupancy expense in the 2018 Successor Period.
Net Interest Income (Expense)
Net interest income for the 2018 Successor Period and the 2018 Predecessor Period was $0.8 million and $1.7 million, respectively. Net interest income for the year ended December 31, 2017 was $0.7 million. Net interest income for the 2018 Successor Period and the 2018 Predecessor Period was impacted by an increase in interest rates. Net interest income for the year ended December 31, 2017 was impacted by the conversion of our former convertible notes into equity in May 2017.
Income Taxes
Provision for income taxes for the 2018 Successor Period and the 2018 Predecessor Period was $3.4 million and $11.9 million, respectively. Provision for income taxes for the year ended December 31, 2017 was $6.1 million. Provision for income taxes for the 2018 Successor Period and the 2018 Predecessor Period was impacted by increased earnings which resulted in higher tax expense in certain jurisdictions. Provision for income taxes for the 2018 Predecessor Period was also impacted by a $3.3 million adjustment related to an uncertain tax position during the period.
Quarterly Results of Operations
96
Our quarterly results have been and will continue to be affected by changes in trading volumes due to market conditions, changes in the number of trading days during certain quarters and seasonal effects caused by slow-downs in trading activity during certain periods. As a result of these and other factors, our financial results for any single quarter or for periods of less than a year are not necessarily indicative of the results that may be achieved for a full fiscal year or any future periods. For our quarterly results of operations for the years ended December 31, 2019 and 2018, see Note 21—Quarterly Results of Operations to our audited consolidated financial statements included elsewhere in this Annual Report on Form 10-K.
Liquidity and Capital Resources
Overview
Liquidity describes the ability of a company to generate sufficient cash flows to meet the cash requirements of its business operations, including working capital needs to meet operating expenses, debt service, acquisitions, other commitments and contractual obligations. We consider liquidity in terms of cash flows from operations and availability under the Revolving Credit Facility and their sufficiency to fund our operating and investing activities.
Historically, we have generated significant cash flows from operations and have funded our business operations through cash on hand and cash flows from operations.
Our primary cash needs are for day to day operations, working capital requirements, capital expenditures, primarily for software and equipment, and our expected dividend payments. In addition, we are obligated to make payments under the Tax Receivable Agreement. Although the actual timing and amount of any payments that may be made under the Tax Receivable Agreement will vary, we expect that the payments that we will be required to make under the Tax Receivable Agreement will be significant. Any payments made by us under the Tax Receivable Agreement will generally reduce the amount of overall cash flows that might have otherwise been available to us or to TWM LLC. These payments will offset some of the tax benefits that we expect to realize as a result of the ownership structure of TWM LLC. To the extent that we are unable to make payments under the Tax Receivable Agreement for any reason, the unpaid amounts generally will be deferred and will accrue interest until paid by us. Total amounts due to the Continuing LLC Owners as of December 31, 2019 under the Tax Receivable Agreement were $240.8 million.
We expect to fund our liquidity requirements through cash and cash equivalents and cash flows from operations. While historically we have generated significant and adequate cash flows from operations, in the event of an unexpected event in the future or otherwise, we may fund our liquidity requirements through borrowings under the Revolving Credit Facility.
We believe that our projected cash position, cash flows from operations and, if necessary, borrowings under the Revolving Credit Facility, will be sufficient to fund our liquidity requirements for at least the next 12 months. However, our future liquidity requirements could be higher than we currently expect as a result of various factors. For example, any future investments, acquisitions, joint ventures or other similar transactions, which we consider from time to time, may require additional capital. In addition, our ability to continue to meet our future liquidity requirements will depend on, among other things, our ability to achieve anticipated levels of revenues and cash flows from operations and our ability to manage costs and working capital successfully, all of which are subject to general economic, financial, competitive and other factors beyond our control. In the event we require any additional capital, it will take the form of equity or debt financing, or both, and there can be no assurance that we will be able to raise any such financing on terms acceptable to us or at all.
As of December 31, 2019 and 2018, we had cash and cash equivalents of approximately $460.7 million and $410.1 million, respectively. All cash and cash equivalents were held in accounts with banks such that the funds are immediately available or in fixed term deposits with a maximum maturity of three months.
97
Factors Influencing Our Liquidity and Capital Resources
Dividend Policy
Subject to legally available funds, we intend to continue to pay quarterly cash dividends on our Class A common stock and Class B common stock equal to $0.08 per share. As discussed below, our ability to pay these quarterly cash dividends on our Class A common stock and Class B common stock will depend on distributions to us from TWM LLC. Dividends declared and paid to Class A and B common stockholders during the year ended December 31, 2019 amounted to $35.9 million.
The declaration, amount and payment of any dividends will be at the sole discretion of our board of directors and will depend on our and our subsidiaries’ results of operations, capital requirements, financial condition, business prospects, contractual restrictions, restrictions imposed by applicable laws and other factors that our board of directors deem relevant. Because we are a holding company and all of our business is conducted through our subsidiaries, we expect to pay dividends, if any, only from funds we receive from our subsidiaries. Accordingly, our ability to pay dividends to our stockholders is dependent on the earnings and distributions of funds from our subsidiaries. As the sole manager of TWM LLC, we intend to cause, and will rely on, TWM LLC to make distributions in respect of LLC Interests to fund our dividends. If TWM LLC is unable to cause these subsidiaries to make distributions, it may have inadequate funds to distribute to us and we may be unable to fund our dividends. In addition, when TWM LLC makes distributions to us, the other holders of LLC Interests will be entitled to receive proportionate distributions based on their economic interests in TWM LLC at the time of such distributions.
Our board of directors will periodically review the cash generated from our business and the capital expenditures required to finance our growth plans and determine whether to modify the amount of regular dividends and/or declare any periodic special dividends. Any future determination to change the amount of dividends and/or declare special dividends will be at the discretion of our board of directors and will be dependent upon then-existing conditions and other factors that our board of directors considers relevant. See “Risk Factors — Risks Relating to the Company and Our Organizational Structure — Our principal asset is our equity interest in TWM LLC, and, accordingly, we depend on distributions from TWM LLC to pay our taxes and expenses, including payments under the Tax Receivable Agreement” and “Risk Factors — Risks Relating to Ownership of our Class A common stock — We intend to pay regular dividends on our Class A common stock and Class B common stock, but our ability to do so may be limited.”
Cash Distributions
In March and April 2019, TWM LLC made pre-IPO cash distributions to the Original LLC Owners in aggregate amounts of $20.0 million and $100.0 million, respectively.
In May, September and December 2019, TWM LLC made quarterly cash distributions to its equityholders, including Tradeweb Markets Inc., in aggregate amounts of $33.4 million, $33.0 million and $45.8 million, respectively.
Cash Dividends
In June, September and December 2019, Tradeweb Markets Inc. paid quarterly cash dividends to the holders of Class A common stock and Class B common stock in aggregate amounts of $11.4 million, $11.4 million and $13.1 million, respectively.
On February 11, 2020, our board of directors declared a cash dividend of $0.08 per share of Class A common stock and Class B common stock for the first quarter of 2020. This dividend will be payable on March 16, 2020 to stockholders of record as of March 2, 2020.
Indebtedness
As of December 31, 2019 and 2018, we had no outstanding indebtedness.
98
Historically, the Company has only issued debt in connection with significant investment transactions and all debt issued by the Company has been issued to subsidiaries of Thomson Reuters. In 2013, we issued $29.3 million of convertible notes to a subsidiary of Thomson Reuters in connection with the acquisition of BondDesk Group LLC and subsidiaries. During 2017, Thomson Reuters converted all outstanding convertible notes into equity.
On April 8, 2019, TWM LLC entered into the Revolving Credit Facility with a syndicate of banks. The Revolving Credit Facility provides borrowing capacity to be used to fund our ongoing working capital needs, letters of credit and for general corporate purposes, including potential future acquisitions and expansions.
On November 7, 2019, TWM LLC entered into an amendment to the Revolving Credit Facility among TWM LLC and the lenders party thereto, which revised the Revolving Credit Facility to permit the pending LSEG Transaction. The amendment did not otherwise impact the terms of the Revolving Credit Facility and did not impact the amount of borrowings available to TWM LLC under the Revolving Credit Facility.
TWM LLC is the borrower under the Revolving Credit Facility. The Revolving Credit Facility permits borrowings of up to $500.0 million by TWM LLC. Subject to the satisfaction of certain conditions, we will be able to increase the Revolving Credit Facility by $250.0 million with the consent of lenders participating in the increase. The Revolving Credit Facility provides for the issuance of up to $5.0 million of letters of credit as well as borrowings on same-day notice, referred to as swingline loans, in an amount of up to $30.0 million. The Revolving Credit Facility will mature on April 8, 2024.
As of December 31, 2019, there were no amounts outstanding under the Revolving Credit Facility and we had availability of $500.0 million.
Under the terms of the credit agreement that governs the Revolving Credit Facility, borrowings under the Revolving Credit Facility bear interest at a rate equal to, at our option, either (a) a base rate equal to the greatest of (i) the administrative agent’s prime rate, (ii) the federal funds effective rate plus ½ of 1.0% and (iii) one month LIBOR plus 1.0%, in each case plus 0.75%, or (b) LIBOR plus 1.75%, subject to a 0.00% floor. The credit agreement also requires that we pay a commitment fee of 0.25% for available but unborrowed amounts. We are also required to pay customary letter of credit fees and agency fees.
We have the option to voluntarily repay outstanding loans at any time without premium or penalty other than customary “breakage” costs with respect to LIBOR loans.
There will be no scheduled amortization under the Revolving Credit Facility. The principal amount outstanding will be due and payable in full at maturity.
Obligations under the Revolving Credit Facility are guaranteed by our existing and future direct and indirect material wholly-owned domestic subsidiaries, subject to certain exceptions. The Revolving Credit Facility is secured by a first-priority security interest in substantially all of the assets of TWM LLC and the guarantors under the facility, subject to certain exceptions.
The credit agreement that governs the Revolving Credit Facility contains a number of covenants that, among other things and subject to certain exceptions, restrict the ability of TWM LLC and the ability of its restricted subsidiaries to:
|
· |
incur additional indebtedness and guarantee indebtedness; |
|
· |
create or incur liens; |
|
· |
pay dividends and distributions or repurchase capital stock; |
|
· |
make investments, loans and advances; and |
|
· |
enter into certain transactions with affiliates. |
99
The Revolving Credit Facility contains a financial covenant requiring compliance with a (i) maximum total net leverage ratio tested on the last day of each fiscal quarter not to exceed 3.5 to 1.0 (increasing to 4.0 to 1.0 for the four-quarter period following a material acquisition and the fiscal quarter in which such material acquisition is consummated) and (ii) minimum cash interest coverage ratio tested on the last day of each fiscal quarter not less than 3.0 to 1.0.
The credit agreement that governs the Revolving Credit Facility also contains certain affirmative covenants and events of default customary for facilities of this type, including relating to a change of control. If an event of default occurs, the lenders under the Revolving Credit Facility will be entitled to take various actions, including the acceleration of amounts due under the Revolving Credit Facility and all actions permitted to be taken by secured creditors under applicable law.
As of December 31, 2019, we were in compliance with all the covenants set forth in the Revolving Credit Facility.
Capital Requirements
Certain of our U.S. subsidiaries are registered as broker-dealers, SEFs or introducing brokers and are subject to the applicable rules and regulations of the SEC and CFTC. These rules contain minimum net capital or other financial resource requirements, as defined in the applicable regulations. These rules may also require a significant part of the registrants’ assets be kept in relatively liquid form. Certain of our foreign subsidiaries are regulated by the Financial Conduct Authority in the U.K., the Nederlandsche Bank in the Netherlands, the Japanese Financial Services Agency, the Japanese Securities Dealers Association and other foreign regulators, and must maintain financial resources, as defined in the applicable regulations, in excess of the applicable financial resources requirement. As of December 31, 2019 and 2018, each of our regulated subsidiaries had maintained sufficient net capital or financial resources to at least satisfy their minimum requirements which in aggregate were $53.2 million and $41.7 million, respectively. We maintain capital balances in these subsidiaries in excess of our minimum requirements in order to satisfy working capital needs and to ensure that we have enough cash on hand to satisfy margin requirements and credit risk, including the excess capital expectations of our clients.
Fails to Deliver/Fails to Receive
At times, transactions executed on our wholesale platform fail to settle due to the inability of a transaction party to deliver or receive the transacted security. Until the failed transaction settles, we will recognize a receivable from (and a matching payable to) brokers and dealers and clearing organizations for the proceeds from the unsettled transaction. The impact on our liquidity and capital resources is minimal as receivables and payables for failed transactions are usually recognized simultaneously and predominantly offset.
Working Capital
Working capital is defined as current assets minus current liabilities. Current assets consist of cash and cash equivalents, restricted cash, receivable from brokers and dealers and clearing organizations, deposits with clearing organizations, accounts receivable and receivable from affiliates. Current liabilities consist of payable to brokers and dealers and clearing organizations, accrued compensation, deferred revenue, accounts payable, accrued expenses and other liabilities, employee equity compensation payable, lease liability, payable to affiliates and tax receivable agreement liability. Changes in working capital, which impact our cash flows provided by operating activities, can vary depending on factors such as delays in the collection of receivables, changes in our operating performance, changes in trading
100
patterns, changes in client billing terms and other changes in the demand for our platforms and solutions. Our working capital was as follows:
|
|
|
December 31, |
|
December 31, |
||
|
|
|
2019 |
|
2018 |
||
|
|
|
(dollars in thousands) |
||||
|
Cash and cash equivalents |
|
$ |
460,711 |
|
$ |
410,104 |
|
Restricted cash |
|
|
1,000 |
|
|
1,200 |
|
Receivable from brokers and dealers and clearing organizations |
|
|
30,641 |
|
|
174,591 |
|
Deposits with clearing organizations |
|
|
9,724 |
|
|
11,427 |
|
Accounts receivable |
|
|
92,814 |
|
|
87,192 |
|
Receivable from affiliates |
|
|
2,525 |
|
|
3,243 |
|
Current assets |
|
|
597,415 |
|
|
687,757 |
|
Payable to brokers and dealers and clearing organizations |
|
|
30,452 |
|
|
171,214 |
|
Accrued compensation |
|
|
119,415 |
|
|
120,158 |
|
Deferred revenue |
|
|
23,990 |
|
|
27,883 |
|
Accounts payable, accrued expenses and other liabilities |
|
|
32,834 |
|
|
42,548 |
|
Employee equity compensation payable |
|
|
1,048 |
|
|
24,187 |
|
Lease liability |
|
|
8,516 |
|
|
— |
|
Payable to affiliates |
|
|
1,506 |
|
|
5,009 |
|
Tax receivable agreement liability |
|
|
6,949 |
|
|
— |
|
Current liabilities |
|
|
224,710 |
|
|
390,999 |
|
Working capital |
|
$ |
372,705 |
|
$ |
296,758 |
Current assets
Current assets decreased to $597.4 million as of December 31, 2019 from $687.8 million as of December 31, 2018 due to a decrease in receivable from brokers and dealers and clearing organizations resulting from a lower number of fails to deliver from unsettled wholesale platform transactions, offset by higher cash and cash equivalents as a result of an increase in gross revenues.
Current liabilities
Current liabilities decreased to $224.7 million as of December 31, 2019 from $391.0 million as of December 31, 2018 due to a decrease in payable to brokers and dealers and clearing organizations resulting from a lower number of fails to receive from unsettled wholesale platform transactions and a decrease in employee equity compensation payable as a result of payments of cash-settled PRSUs.
See “— Liquidity and Capital Resources — Factors Influencing Our Liquidity and Capital Resources — Capital Requirements.”
Cash Flows
Our cash flows for the year ended December 31, 2019, the 2018 Successor Period, the 2018 Predecessor Period and the year ended December 31, 2017 were as follows:
|
|
|
Successor |
|
Successor |
|
Predecessor |
|
Predecessor |
||||
|
|
|
Year Ended |
|
October 1, 2018 |
|
January 1, 2018 |
|
Year Ended |
||||
|
|
|
December 31, |
|
To |
|
to |
|
December 31, |
||||
|
|
|
2019 |
|
December 31, 2018 |
|
September 30, 2018 |
|
2017 |
||||
|
|
|
(in thousands) |
||||||||||
|
Net cash flows provided by operating activities |
|
$ |
311,003 |
|
$ |
112,556 |
|
$ |
164,828 |
|
$ |
224,580 |
|
Net cash flows (used in) investing activities |
|
|
(44,462) |
|
|
(16,246) |
|
|
(25,850) |
|
|
(45,552) |
|
Net cash flows (used in) financing activities |
|
|
(218,142) |
|
|
(36,000) |
|
|
(139,350) |
|
|
(153,461) |
|
Effect of exchange rate changes on cash and cash equivalents |
|
|
2,008 |
|
|
(389) |
|
|
(2,043) |
|
|
3,157 |
|
Net increase (decrease) in cash and cash equivalents |
|
$ |
50,407 |
|
$ |
59,921 |
|
$ |
(2,415) |
|
$ |
28,724 |
101
Operating Activities
Operating activities consist primarily of net income adjusted for noncash items that include depreciation and amortization, stock-based compensation expense and contingent consideration. Cash flows from operating activities can fluctuate significantly from period-to-period as working capital needs and the timing of payments for accrued compensation (primarily in the first quarter) and other items impact reported cash flows.
Net cash provided by operating activities for the year ended December 31, 2019 was $311.0 million and primarily driven by an increase in gross revenue.
Net cash provided by operating activities for the 2018 Successor Period and the 2018 Predecessor Period was $112.6 million and $164.8 million, respectively, which was primarily driven by increased gross revenue partially offset in the 2018 Predecessor Period by an increase in accounts receivable due to changes to the billing process associated with MiFID II resulting in less billings annually in advance and more billings monthly in arrears.
Net cash provided by operating activities for the year ended December 31, 2017 was $224.6 million, which was primarily driven by an increase in gross revenue and an improvement in working capital.
Investing Activities
Investing activities consist of software development costs, investments in technology hardware, purchases of equipment and other tangible assets, business acquisitions and investments.
Net cash used in investing activities was $44.5 million for the year ended December 31, 2019, which consisted of $28.7 million of capitalized software development costs and $15.8 million of purchases of furniture, equipment, purchased software and leasehold improvements. For the year ending December 31, 2020, we expect capital expenditures and capitalization of software of $45 million to $50 million.
Net cash used in investing activities was $16.2 million for the 2018 Successor Period, which consisted of $7.2 million of capitalized software development costs and $9.1 million of purchases of furniture, equipment, purchased software and leasehold improvements. Net cash used in investing activities was $25.9 million for the 2018 Predecessor Period, which consisted of $19.5 million of capitalized software development costs and $6.3 million of purchases of furniture, equipment, purchased software and leasehold improvements.
Net cash used in investing activities was $45.6 million for the year ended December 31, 2017, which consisted of $27.2 million of capitalized software development costs, $13.5 million of purchase of furniture, equipment, purchased software and leasehold improvements and $5.0 million of purchase of investments.
Financing Activities
Financing activities consist of purchases of LLC Interests, cash dividends to our Class A common stockholders and Class B common stockholders during the post-IPO period and cash distributions from TWM LLC to the Original LLC Owners during the pre-IPO period.
Net cash used in financing activities for the year ended December 31, 2019 was $218.1 million, which consisted of purchases of LLC Interests and shares of Class A common stock of $1,971.2 million from certain of the Bank Stockholders and members of management using the net proceeds from the IPO and the October 2019 follow-on offering, as applicable, cash dividends to our Class A and Class B common stockholders of $35.9 million, capital distributions to non-controlling interests of $38.3 million and pre-IPO capital distributions of $120.0 million, which includes a one-time distribution of $100.0 million paid to the Original LLC Owners in connection with the IPO.
Net cash used in financing activities for the 2018 Successor Period and the 2018 Predecessor Period was $36.0 million and $139.4 million, respectively, which consisted of capital distributions to the Original LLC Owners.
102
Net cash used in financing activities was $153.5 million for the year ended December 31, 2017, which consisted of capital distributions to the Original LLC Owners.
Non-GAAP Financial Measures
Free Cash Flow
In addition to cash flow from operating activities presented in accordance with GAAP, we use Free Cash Flow to measure liquidity. Free Cash Flow is defined as cash flow from operating activities less expenditures for capitalized software development costs and furniture, equipment and leasehold improvements.
We present Free Cash Flow because we believe it is a useful indicator of liquidity that provides information to management and investors about the amount of cash generated from our core operations after expenditures for capitalized software development costs and furniture, equipment and leasehold improvements.
Free Cash Flow has limitations as an analytical tool, and you should not consider Free Cash Flow in isolation or as an alternative to cash flow from operating activities or any other liquidity measure determined in accordance with GAAP. You are encouraged to evaluate each adjustment. In addition, in evaluating Free Cash Flow, you should be aware that in the future, we may incur expenditures similar to the adjustments in the presentation of Free Cash Flow. In addition, Free Cash Flow may not be comparable to similarly titled measures used by other companies in our industry or across different industries.
The table set forth below presents a reconciliation of our cash flow from operating activities to Free Cash Flow for the year ended December 31, 2019, the 2018 Successor Period, the 2018 Predecessor Period and the year ended December 31, 2017:
|
|
|
Successor |
|
|
Successor |
|
|
Predecessor |
|
Predecessor |
||||||
|
|
|
Year |
|
|
October 1, 2018 |
|
|
January 1, 2018 |
|
Year |
||||||
|
|
|
Ended |
|
|
to |
|
|
to |
|
Ended |
||||||
|
|
|
December 31, |
|
|
December 31, |
|
|
September 30, |
|
December 31, |
||||||
|
|
|
2019 |
|
|
2018 |
|
|
2018 |
|
2017 |
||||||
|
Cash flow from operating activities |
|
$ |
311,003 |
|
|
$ |
112,556 |
|
|
$ |
164,828 |
|
$ |
224,580 |
||
|
Less: Capitalization of software development costs |
|
|
(28,681) |
|
|
|
(7,156) |
|
|
|
(19,523) |
|
|
(27,157) |
||
|
Less: Purchases of furniture, equipment and leasehold improvements |
|
|
(15,781) |
|
|
|
(9,090) |
|
|
|
(6,327) |
|
|
(13,461) |
||
|
Free Cash Flow |
|
$ |
266,541 |
|
|
$ |
96,310 |
|
|
$ |
138,978 |
|
$ |
183,962 |
||
Adjusted EBITDA, Adjusted EBITDA margin, Adjusted EBIT, Adjusted EBIT margin, Adjusted Net Income and In addition to net income and net income attributable to Tradeweb Markets Inc., each presented in accordance with GAAP, we present Adjusted EBITDA, Adjusted EBITDA margin, Adjusted EBIT and Adjusted EBIT margin as measures of our operating performance and Adjusted Net Income and Adjusted Diluted EPS as measures of our profitability.
Adjusted EBITDA, Adjusted EBITDA margin, Adjusted EBIT and Adjusted EBIT margin
Adjusted EBITDA is defined as net income before contingent consideration, net interest income, provision for income taxes and depreciation and amortization, adjusted for the impact of certain other items, including certain stock-based compensation expense and payroll taxes associated with certain option exercises, tax receivable agreement liability adjustments and gains and losses from outstanding foreign exchange forward contracts and the revaluation of foreign denominated cash. Adjusted EBIT is defined as net income before contingent consideration, net interest income and provision for income taxes, adjusted for the impact of certain other items, including certain stock-based compensation expense and payroll taxes associated with certain option exercises, tax receivable agreement liability adjustments, acquisition and Refinitiv Transaction-related depreciation and amortization and gains and losses from outstanding foreign exchange forward contracts and the revaluation of foreign denominated cash. Adjusted EBITDA margin and Adjusted EBIT margin are defined as Adjusted EBITDA and Adjusted EBIT, respectively, divided by gross revenue for the applicable period. We present Adjusted EBITDA, Adjusted EBITDA margin, Adjusted EBIT and Adjusted EBIT margin because we believe they assist investors and analysts in comparing our operating performance
103
across reporting periods on a consistent basis by excluding items that we do not believe are indicative of our core operating performance. For example, we exclude contingent consideration because it is equity settled and its balance is based on our value at a certain time and may not reflect our actual operating performance. We also exclude non-cash stock-based compensation expense associated with the Special Option Award discussed below under “— Critical Accounting Policies and Estimates — Stock-Based Compensation” and options awarded to management and other employees following the IPO during 2019 as well as payroll taxes associated with exercises of such options during the applicable period. We believe it is useful to exclude this stock-based compensation expense and associated payroll taxes because the amount of expense associated with the Special Option Award and the post-IPO option awards in 2019 may not directly correlate to the underlying performance of our business and will vary across periods. We do not expect to exclude any non-cash stock-based compensation expense associated with options that may be awarded to management and other employees during 2020. In addition, we exclude the tax receivable agreement liability adjustments discussed below under “— Critical Accounting Policies and Estimates — Tax Receivable Agreement.” We believe it is useful to exclude the tax receivable agreement liability adjustment because the recognition of income during a period due to changes in the tax receivable agreement liability recorded in our consolidated statement of financial condition as a result of changes in the mix of earnings, tax legislation and tax rates in various jurisdictions, or other factors that may impact our tax savings, may not directly correlate to the underlying performance of our business and will vary across periods. With respect to Adjusted EBIT and Adjusted EBIT margin, we believe it is useful to exclude the depreciation and amortization of acquisition related tangible and intangible assets resulting from certain acquisitions, the Refinitiv Transaction and the application of pushdown accounting in order to facilitate a period-over-period comparison of our financial performance.
Management and our board of directors use Adjusted EBITDA, Adjusted EBITDA margin, Adjusted EBIT and Adjusted EBIT margin to assess our financial performance and believe it is helpful in highlighting trends in our core operating performance, while other measures can differ significantly depending on long-term strategic decisions regarding capital structure, the tax jurisdictions in which we operate and capital investments. Further, our executive incentive compensation is based in part on components of Adjusted EBITDA and Adjusted EBITDA margin.
Adjusted Net Income and Adjusted Diluted EPS
We present Adjusted Net Income and Adjusted Diluted EPS for Tradeweb Markets Inc. for post-IPO periods and Tradeweb Markets LLC for pre-IPO periods. As discussed below, because Adjusted Net Income and Adjusted Diluted EPS give effect to certain tax related adjustments to reflect an assumed effective tax rate for all periods presented and, for post-IPO periods, assumes all LLC Interests held by non-controlling interests are exchanged for shares of Class A or Class B common stock, we believe that Adjusted Net Income and Adjusted Diluted EPS for Tradeweb Markets Inc. and Tradeweb Markets LLC are comparable.
Adjusted Net Income is defined as net income attributable to Tradeweb Markets Inc. assuming the full exchange of all outstanding LLC Interests held by non-controlling interests for shares of Class A common stock or Class B common stock of Tradeweb Markets Inc., for post-IPO periods, and net income, for pre-IPO periods, in each case adjusted for contingent consideration, certain stock-based compensation expense and payroll taxes associated with certain option exercises, tax receivable liability adjustments, acquisition and Refinitiv Transaction related depreciation and amortization and gains and losses from outstanding foreign exchange forward contracts and the revaluation of foreign denominated cash. Adjusted Net Income also gives effect to certain tax related adjustments to reflect an assumed effective tax rate and, for pre-IPO periods, assumes TWM LLC was subject to a corporate tax rate for the periods presented. Adjusted Diluted EPS is defined as Adjusted Net Income divided by the diluted weighted average number of shares of Class A common stock and Class B common stock outstanding for the applicable period, assuming the full exchange of all outstanding LLC Interests held by non-controlling interests for shares of Class A common stock or Class B common stock, for post-IPO periods, and the diluted weighted average number of shares of TWM LLC outstanding for the applicable period, for pre-IPO periods. The diluted weighted average number of shares outstanding for the pre-IPO periods and post-IPO periods give effect to potentially dilutive securities using the treasury stock method.
We use Adjusted Net Income and Adjusted Diluted EPS as supplemental metrics to evaluate our business performance in a way that also considers our ability to generate profit without the impact of certain items. We exclude contingent consideration, stock-based compensation expense associated with the Special Option Award and the post-IPO
104
option awards in 2019 and payroll taxes associated with exercises of such options, tax receivable liability adjustments and acquisition and Refinitiv Transaction-related depreciation and amortization for the reasons described above. Each of the normal recurring adjustments and other adjustments described in the definition of Adjusted Net Income helps to provide management with a measure of our operating performance over time by removing items that are not related to day-to-day operations or are non-cash expenses. In addition to excluding items that are non-recurring or may not be indicative of our ongoing operating performance, by assuming the full exchange of all outstanding LLC Interests held by non-controlling interests, we believe that Adjusted Net Income and Adjusted Diluted EPS for Tradeweb Markets Inc. facilitate comparisons with other companies that have different organizational and tax structures, as well as comparisons period over period, because it eliminates the effect of any changes in net income attributable to Tradeweb Markets Inc. driven by increases in our ownership of TWM LLC, which are unrelated to our operating performance.
Adjusted EBITDA, Adjusted EBITDA margin, Adjusted EBIT, Adjusted EBIT margin, Adjusted Net Income and Adjusted Diluted EPS have limitations as analytical tools, and you should not consider these non-GAAP financial measures in isolation or as alternatives to net income attributable to Tradeweb Markets Inc., net income, operating income, gross margin, earnings per share or any other financial measure derived in accordance with GAAP. You are encouraged to evaluate each adjustment and, as applicable, the reasons we consider it appropriate for supplemental analysis. In addition, in evaluating Adjusted EBITDA, Adjusted EBITDA margin, Adjusted EBIT, Adjusted EBIT margin, Adjusted Net Income and Adjusted Diluted EPS you should be aware that in the future, we may incur expenses similar to the adjustments in the presentation of these non-GAAP financial measures. Our presentation of Adjusted EBITDA, Adjusted EBITDA margin, Adjusted EBIT, Adjusted EBIT margin, Adjusted Net Income and Adjusted Diluted EPS should not be construed as an inference that our future results will be unaffected by unusual or non-recurring items. In addition, Adjusted EBITDA, Adjusted EBITDA margin, Adjusted EBIT, Adjusted EBIT margin, Adjusted Net Income and Adjusted Diluted EPS may not be comparable to similarly titled measures used by other companies in our industry or across different industries.
The table set forth below presents a reconciliation of net income to Adjusted EBITDA, Adjusted EBITDA margin, Adjusted EBIT and Adjusted EBIT margin for the year ended December 31, 2019, the 2018 Successor Period, the 2018 Predecessor Period and the year ended December 31, 2017:
|
|
|
Successor |
|
|
Successor |
|
Predecessor |
|
Predecessor |
|
|||||||||
|
|
|
Year |
|
|
October 1, 2018 |
|
January 1, 2018 |
|
Year |
|
|||||||||
|
|
|
Ended |
|
|
to |
|
to |
|
Ended |
|
|||||||||
|
|
|
December 31, |
|
|
December 31, |
|
September 30, |
|
December 31, |
|
|||||||||
|
|
|
2019 |
|
|
2018 |
|
2018 |
|
2017 |
|
|||||||||
|
|
|
|
|||||||||||||||||
|
Net income |
|
$ |
173,024 |
|
|
$ |
29,307 |
|
$ |
130,160 |
|
$ |
83,648 |
|
|||||
|
Contingent consideration |
|
|
— |
|
|
|
— |
|
|
26,830 |
|
|
58,520 |
|
|||||
|
Interest income, net |
|
|
(2,373) |
|
|
|
(787) |
|
|
(1,726) |
|
|
(685) |
|
|||||
|
Depreciation and amortization |
|
|
139,330 |
|
|
|
33,020 |
|
|
48,808 |
|
|
68,615 |
|
|||||
|
Stock-based compensation expense(1) |
|
|
25,098 |
|
|
|
— |
|
|
— |
|
|
— |
|
|||||
|
Provision for income taxes |
|
|
52,302 |
|
|
|
3,415 |
|
|
11,900 |
|
|
6,129 |
|
|||||
|
Unrealized foreign exchange (gains) / losses |
|
|
(2,310) |
|
|
|
263 |
|
|
(960) |
|
|
(364) |
|
|||||
|
(Gain) / loss from revaluation of foreign denominated cash(2) |
|
|
1,225 |
|
|
|
90 |
|
|
(921) |
|
|
(678) |
|
|||||
|
Tax receivable agreement liability adjustment(3) |
|
|
(33,134) |
|
|
|
— |
|
|
— |
|
|
— |
|
|||||
|
Adjusted EBITDA |
|
$ |
353,162 |
|
|
$ |
65,308 |
|
$ |
214,091 |
|
$ |
215,185 |
|
|||||
|
Less: Depreciation and amortization |
|
|
(139,330) |
|
|
|
(33,020) |
|
|
(48,808) |
|
|
(68,615) |
|
|||||
|
Add: Acquisition and Refinitiv Transaction related D&A(4) |
|
|
97,565 |
|
|
|
22,413 |
|
|
19,576 |
|
|
31,236 |
|
|||||
|
Adjusted EBIT |
|
$ |
311,397 |
|
|
$ |
54,701 |
|
$ |
184,859 |
|
$ |
177,806 |
|
|||||
|
Adjusted EBITDA margin |
|
|
45.5 |
% |
|
|
36.6 |
% |
|
42.3 |
% |
|
38.2 |
% |
|||||
|
Adjusted EBIT margin |
|
|
40.2 |
% |
|
|
30.6 |
% |
|
36.5 |
% |
|
31.6 |
% |
|||||
|
(1) |
Represents non-cash stock-based compensation expense associated with the Special Option Award and post-IPO options awarded in 2019 and payroll taxes associated with exercises of such options during the applicable period. |
|
(2) |
Represents foreign exchange gain or loss from the revaluation of cash denominated in a different currency than the entity’s functional currency. |
|
(3) |
Represents income recognized during the applicable period due to changes in the tax receivable agreement liability recorded in the statement of financial condition as a result of changes in the mix of earnings, tax legislation and tax rates in various jurisdictions which impacted our tax savings. |
105
|
(4) |
Represents acquisition-related intangibles amortization and increased tangible asset and capitalized software depreciation and amortization resulting from the Refinitiv Transaction and the application of pushdown accounting (where all assets were marked to fair value as of the closing date of the Refinitiv Transaction). |
The table set forth below presents a reconciliation of net income attributable to Tradeweb Markets Inc. and net income, as applicable, to Adjusted Net Income and Adjusted Diluted EPS for the year ended December 31, 2019, the 2018 Successor Period and the 2018 Predecessor Period:
|
|
|
Successor |
|
Successor |
|
Predecessor |
|
Predecessor |
|
|||||||||||
|
|
|
|
|
|
|
|
|
|
|
|
||||||||||
|
|
|
Year |
|
|
October 1, 2018 |
|
January 1, 2018 |
|
Year |
|
||||||||||
|
|
|
Ended |
|
|
to |
|
to |
|
Ended |
|
||||||||||
|
|
|
December 31, |
|
|
December 31, |
|
September 30, |
|
December 31, |
|
||||||||||
|
|
|
2019 |
|
|
2018 |
|
2018 |
|
2017 |
|
||||||||||
|
|
|
|
||||||||||||||||||
|
Earnings per diluted share(1) |
|
$ |
0.190.54 |
(a) / |
|
$ |
0.13 |
(a) |
$ |
0.60 |
(a) |
$ |
0.39 |
(a) |
||||||
|
Pre-IPO net income attributable to Tradeweb Markets LLC (1) |
|
|
42,352 |
|
|
|
29,307 |
(a) |
|
130,160 |
(a) |
|
83,648 |
(a) |
||||||
|
Add: Net income attributable to Tradeweb Markets Inc. (1) |
|
|
83,769 |
|
|
|
— |
|
|
— |
|
|
— |
|
||||||
|
Add: Net income attributable to non-controlling interests (1)(2) |
|
|
46,903 |
|
|
|
— |
|
|
— |
|
|
— |
|
||||||
|
Net income |
|
$ |
173,024 |
(a)(b) |
|
$ |
29,307 |
(a) |
$ |
130,160 |
(a) |
$ |
83,648 |
(a) |
||||||
|
Provision for income taxes |
|
|
52,302 |
|
|
|
3,415 |
|
|
11,900 |
|
|
6,129 |
|
||||||
|
Contingent consideration |
|
|
— |
|
|
|
— |
|
|
26,830 |
|
|
58,520 |
|
||||||
|
Acquisition and Refinitiv Transaction related D&A(3) |
|
|
97,565 |
|
|
|
22,413 |
|
|
19,576 |
|
|
31,236 |
|
||||||
|
Stock-based compensation expense(4) |
|
|
25,098 |
|
|
|
— |
|
|
— |
|
|
— |
|
||||||
|
Unrealized foreign exchange (gains) / losses |
|
|
(2,310) |
|
|
|
263 |
|
|
(960) |
|
|
(364) |
|
||||||
|
(Gain) / loss from revaluation of foreign denominated cash(5) |
|
|
1,225 |
|
|
|
90 |
|
|
(921) |
|
|
(678) |
|
||||||
|
Tax receivable agreement liability adjustment(6) |
|
|
(33,134) |
|
|
|
— |
|
|
— |
|
|
— |
|
||||||
|
Adjusted Net Income before income taxes |
|
|
313,770 |
|
|
|
55,488 |
|
|
186,585 |
|
|
178,491 |
|
||||||
|
Adjusted income taxes(7) |
|
|
(82,835) |
|
|
|
(14,649) |
|
|
(49,258) |
|
|
(47,122) |
|
||||||
|
Adjusted Net Income |
|
$ |
230,935 |
|
|
$ |
40,839 |
|
$ |
137,327 |
|
$ |
131,369 |
|
||||||
|
Adjusted Diluted EPS (1)(8) |
|
$ |
0.23 |
(a) / |
|
$ |
0.18 |
(a) |
$ |
0.64 |
(a) |
$ |
0.62 |
(a) |
||||||
|
(1) |
In April 2019, we completed the Reorganization Transactions and the IPO. Therefore, certain earnings information is being presented separately for Tradeweb Markets LLC and Tradeweb Markets Inc. |
|
a) |
Presents information for Tradeweb Markets LLC (pre-IPO period). |
|
a) |
Presents information for Tradeweb Markets Inc. (post-IPO period). |
See “Basis of Presentation” and Note 18 – Earnings Per Share to our audited consolidated financial statements included elsewhere in this Annual Report on Form 10-K.
|
(1) |
For post-IPO periods, represents the reallocation of net income attributable to non-controlling interests from the assumed exchange of all outstanding LLC Interests held by non-controlling interests for shares of Class A or Class B common stock. |
|
(1) |
Represents acquisition-related intangibles amortization and increased tangible asset and capitalized software depreciation and amortization resulting from the Refinitiv Transaction and the application of pushdown accounting (where all assets were marked to fair value as of the closing date of the Refinitiv Transaction). |
|
(1) |
Represents non-cash stock-based compensation expense associated with the Special Option Award and post-IPO options awarded in 2019 and payroll taxes associated with exercises of such options during the applicable period. |
|
(1) |
Represents foreign exchange gain or loss from the revaluation of cash denominated in a different currency than the entity’s functional currency. |
|
(1) |
Represents income recognized during the applicable period due to changes in the tax receivable agreement liability recorded in the statement of financial condition as a result of changes in the mix of earnings, tax legislation and tax rates in various jurisdictions which impacted our tax savings. |
|
(1) |
Represents corporate income taxes at an assumed effective tax rate of 26.4% for all periods presented applied to Adjusted Net Income before income taxes. For pre-IPO periods, this adjustment assumes Tradeweb Markets LLC was subject to a corporate tax rate for the periods presented. |
|
(1) |
Due to the Reorganization Transactions and the IPO completed in April 2019, shares outstanding during the year ended December 31, 2019 represent shares of TWM LLC (pre-IPO period) and shares of Class A and Class B common stock of Tradeweb Markets Inc. (post-IPO period). |
106
The table set forth below summarizes the calculation of Adjusted Diluted EPS for the periods presented above:
|
|
|
Pre-IPO Period |
|
Post-IPO Period |
|
Successor |
|
Predecessor |
|
Predecessor |
|||||||||||||||||||||||||||
|
|
|
|
|
|
|
|
|
|
|
|
|||||||||||||||||||||||||||
|
|
|
Three Months |
|
Nine Months |
|
October 1, 2018 |
|
January 1, 2018 |
|
Year |
|||||||||||||||||||||||||||
|
|
|
Ended |
|
Ended |
|
to |
|
to |
|
Ended |
|||||||||||||||||||||||||||
|
|
|
March 31, |
|
December 31, |
|
December 31, |
|
September 30, |
|
December 31, |
|||||||||||||||||||||||||||
|
|
|
2019 |
|
2019 |
|
2018 |
|
2018 |
|
2017 |
|||||||||||||||||||||||||||
|
Diluted weighted average TWM LLC shares outstanding |
|
|
|
223,320,457 |
|
|
— |
|
|
222,243,851 |
|
|
215,365,920 |
|
|
212,568,635 |
|||||||||||||||||||||
|
Diluted weighted average shares of Class A and Class B common stock outstanding |
|
|
|
— |
|
|
156,540,246 |
|
|
— |
|
|
— |
|
|
— |
|||||||||||||||||||||
|
Assumed exchange of LLC interests for shares of Class A or Class B common stock (1) |
|
|
|
— |
|
|
74,279,741 |
|
|
— |
|
|
— |
|
|
— |
|||||||||||||||||||||
|
Adjusted diluted weighted average shares outstanding |
|
|
|
223,320,457 |
|
|
230,819,987 |
|
|
222,243,851 |
|
|
215,365,920 |
|
|
212,568,635 |
|||||||||||||||||||||
|
Adjusted Net Income (in thousands) |
|
|
$ |
52,190 |
|
$ |
178,745 |
|
$ |
40,839 |
|
$ |
137,327 |
|
$ |
131,369 |
|||||||||||||||||||||
|
Adjusted Diluted EPS |
|
|
$ |
0.23 |
|
$ |
0.77 |
|
$ |
0.18 |
|
$ |
0.64 |
|
$ |
0.62 |
|||||||||||||||||||||
|
(1) |
Assumes the full exchange of all outstanding LLC Interests held by non-controlling interests for shares of Class A or Class B common stock, resulting in the elimination of the non-controlling interests and recognition of the net income attributable to non-controlling interests. |
Contractual Obligations
As of December 31, 2019, we had the following contractual obligations:
|
|
|
|
|
|
Payments due by period |
||||||||||
|
|
|
Total |
|
Less than 1 year |
|
1 to 3 years |
|
3 to 5 years |
|
More than 5 years |
|||||
|
|
|
(in thousands) |
|||||||||||||
|
Lease obligations |
|
$ |
33,752 |
|
$ |
8,516 |
|
$ |
10,089 |
|
$ |
7,514 |
|
$ |
7,633 |
|
Tax receivable agreement liability |
|
|
240,817 |
|
|
6,949 |
|
|
49,000 |
|
|
14,316 |
|
|
170,552 |
|
Total |
|
$ |
274,569 |
|
$ |
15,465 |
|
$ |
59,089 |
|
$ |
21,830 |
|
$ |
178,185 |
Our operating lease obligations are primarily related to rental payments under lease agreements for office space in the United States and United Kingdom through December 2027.
Liabilities under the Tax Receivable Agreement include amounts to be paid to Continuing LLC Owners, assuming we will have sufficient taxable income over the term of the Tax Receivable Agreement to utilize the related tax benefits.
In the normal course of business, we enter into user agreements with our dealer clients which indemnify such clients from third parties in the event that our network infringes upon the intellectual property or other proprietary right of a third party. Our exposure under these user agreements is unknown as this would involve estimating future claims against the Company that have not yet occurred. However, based on our experience, we expect the risk of a material loss to be remote.
Off-Balance Sheet Arrangements
As of December 31, 2019, we did not have any off-balance sheet arrangements.
Critical Accounting Policies and Estimates
Our consolidated financial statements are prepared in accordance with U.S. GAAP which requires us to make estimates and assumptions about future events that affect the reported amounts of assets, liabilities, revenues and expenses, and disclosure of contingent assets and liabilities. Management evaluates its accounting policies, estimates and judgments on an on-going basis.
Management evaluated the development and selection of its critical accounting policies and estimates and believes that the following policies are most critical to the portrayal of our financial condition and results of operations, and that require our most difficult, subjective or complex judgments in estimating the effect of inherent uncertainties. With respect to critical accounting policies, even a relatively minor variance between actual and expected experience can potentially have a materially favorable or unfavorable impact on subsequent results of operations. More information on all of our significant accounting policies can be found in “Note 2 — Summary of Significant Accounting Policies” to our audited consolidated financial statements included elsewhere in this Annual Report on Form 10-K.
107
Use of Estimates
The preparation of financial statements in conformity with U.S. GAAP requires management to make estimates and assumptions that affect the reported amounts and disclosures in our consolidated financial statements and accompanying notes. These estimates and assumptions are based on judgment and the best available information at the time. Management bases its estimates on historical experience, observance of trends in particular areas, information available from outside sources and various other assumptions that are believed to be reasonable under the circumstances. Information from these sources form the basis for making judgments about the carrying values of assets and liabilities that may not be readily apparent from other sources. Therefore, actual results could differ materially from those estimates. Such estimates include pushdown accounting, intangible assets, goodwill, software development costs, stock based compensation, contingent consideration payable and current and deferred income taxes.
Pushdown Accounting
The Refinitiv Transaction was accounted for by Refinitiv in accordance with the acquisition method of accounting pursuant to ASC 805 “Business Combinations” and pushdown accounting was applied to Refinitiv to record the fair value of the assets and liabilities of Refinitiv on the date of the Refinitiv Transaction. We, as a consolidating subsidiary of Refinitiv, also accounted for the Refinitiv Transaction using pushdown accounting. Under pushdown accounting, the excess of our fair value above the fair value accounting basis of our net assets and liabilities is recorded as goodwill. The fair value of assets acquired and liabilities assumed was determined based on assumptions that reasonable market participants would use in the principal (or most advantageous) market for the asset or liability.
In determining the fair value of the assets acquired and the liabilities assumed, we considered a report of a third-party valuation expert. Management is responsible for these internal and third-party valuations and appraisals.
Intangible Assets
We amortize our intangible assets over the estimated useful lives and test for impairment whenever events or changes in circumstances suggest that an asset’s or asset group’s carrying value may not be fully recoverable. We test our intangible assets with an indefinite useful life for impairment at least annually. An impairment loss is recognized if the sum of the estimated discounted cash flows relating to the asset or asset group is less than the corresponding carrying value. Intangible assets are amortized over their estimated useful lives of seven to sixteen years.
Goodwill
Goodwill arises out of pushdown accounting and business combinations and is the cost of acquired companies in excess of the fair value of identifiable net assets at acquisition date. We test our goodwill at least annually for impairment and recognize an impairment loss if the estimated fair value of a reporting unit is less than its net book value. The Company is one reporting unit for goodwill impairment testing purposes. The fair value of a reporting unit is calculated based on the fair market value of our Class A common stock and Class B common stock. We calculate such loss as the difference between the estimated fair value of goodwill and its carrying value. If future events or results differ adversely from the estimates and assumptions made at acquisition or as part of subsequent impairment tests, we may record increased impairment charges in the future.
Software Development Costs
We capitalize certain costs associated with the development of internal use software at the point at which the conceptual formulation, design and testing of possible software project alternatives have been completed, including among other items, employee compensation and related benefits and third-party consulting costs incurred during the application development stage which directly contribute to such development. Such costs are amortized on a straight-line basis over three years. Costs capitalized as part of the pushdown accounting allocation are amortized over nine years. We review the amounts capitalized for impairment whenever events or changes in circumstances indicate that the
108
carrying amounts of the assets may not be fully recoverable, or that their useful lives are shorter than originally expected. Due to rapidly changing technology and the uncertainty of the software development process itself, future results could be affected if management’s current assessment of its software projects differs from actual performance.
Revenue Recognition
We earn transaction fees from transactions executed on our trading platforms through various fee plans. Transaction fees are generated on both a variable and fixed price basis and vary by geographic region, product type and trade size. For variable transaction fees, we charge clients fees based on the mix of products traded and the volume of transactions executed.
We earn subscription fees primarily for granting clients access to our markets for trading and market data. Subscription fees are generally generated on a fixed price basis.
We earn commission revenue from our electronic and voice brokerage services on a riskless principal basis. Riskless principal revenues are derived on matched principal transactions where revenues are earned on the spread between the buy and sell price of the transacted product.
We earn fees from Refinitiv relating to the sale of market data to Refinitiv, which redistributes that data. Included in these fees are real-time market data fees which are recognized in the period that the data is provided, generally on a monthly basis, and fees for historical data sets which are recognized when the historical data set is provided to Refinitiv.
On January 1, 2018, we adopted ASU 2014-09, Revenue from Contracts with Customers, using the modified retrospective approach. The adoption of ASU 2014-09 did not have a material impact on the measurement or timing of recognition of revenue in any prior reporting periods. However, we are required to make significant judgements for the Refinitiv market data fees. Significant judgements used in accounting for this contract include:
•The provision of real-time market data feeds and annual historical data sets are distinct performance obligations.
•The performance obligations under this contract are recognized over time from the initial delivery of the data feeds or each historical data set until the end of the contract term.
•Determining the transaction price for the performance obligations by using a market assessment analysis. Inputs in this analysis include a consultant study which determined the overall value of our market data and pricing information for historical data sets provided by other companies.
Stock-Based Compensation
The stock-based compensation that our employees receive is accounted for as equity or liability awards. As a stock-based equity award, the Company measures and recognizes the cost of employee services received in exchange for awards of equity instruments based on their estimated fair values measured as of the grant date. These costs are recognized as an expense over the requisite service period, with an offsetting increase to additional paid-in capital and members’ capital in our audited consolidated financial statements included elsewhere in this Annual Report on Form 10-K). As a stock-based liability award, the cost of the employee services received in exchange for an award of equity instruments is generally measured based on the grant-date fair value of the award. The fair value of that award is remeasured subsequently at each reporting date through to settlement. Changes in the fair value of the equity instrument are recognized as compensation cost over that period in our consolidated statements of income. For grants made during the post-IPO period, the fair value of the equity instruments is determined based on the price of our Class A common stock on the grant date. For grants made during the pre-IPO period, the fair value of the equity instruments was determined in accordance with the American Institute of Certified Public Accountants Practice Aid, Valuation of Privately Held Company Securities Issued as Compensation. Factors that were considered in determining the fair value include forecasted future cash flows, the weighted average cost of capital, and the performance multiples of comparable companies.
109
On December 31, 2018, certain PRSUs, which previously were cash-settled, were converted to equity-settled PRSUs. The conversion was at fair value, using a unit price consistent with the share price of the Company. As a result of the modification, an additional $19.1 million was recorded in equity.
Prior to the IPO, we awarded options to management and other employees (collectively, the “Special Option Award”) under the Amended and Restated Tradeweb Markets Inc. Option Plan. In accounting for the options issued under this plan, we measure and recognize compensation expense for all awards based on their estimated fair values measured as of the grant date. Costs related to these options are recognized as an expense in our consolidated statements of income over the requisite service period, with an offsetting increase to additional paid-in capital. We expect the non-cash stock-based compensation expense associated with the Special Option Award to be between approximately $33.5 million and $35.7 million, which we started to expense beginning in the second quarter of 2019, with a charge of $20.4 million during the second quarter of 2019 ($18.9 million of which was charged immediately upon the completion of the IPO), and will continue to expense over the following three years.
We use the Black-Scholes pricing model to value some of our stock-based awards. Determining the appropriate fair value model and calculating the fair value of the stock-based awards requires the input of highly subjective assumptions, including the expected life of the stock-based awards, the number of expected stock-based awards that will be forfeited prior to the completion of the vesting requirements, and the stock price volatility.
Income Taxes
Tradeweb Markets Inc. is subject to U.S. federal, state and local income taxes with respect to its taxable income, including its allocable share of any taxable income of TWM LLC, and is taxed at prevailing corporate tax rates. TWM LLC is a multiple member limited liability company taxed as a partnership and accordingly any taxable income generated by TWM LLC is passed through to and included in the taxable income of its members, including us for the post-IPO period. TWM LLC records taxes for conducting business in certain state, local and foreign jurisdictions and records U.S. federal taxes for subsidiaries that are taxed as corporations for U.S. tax purposes. We currently record deferred tax assets and liabilities for the expected future tax consequences of temporary differences between the financial reporting and tax bases of assets and liabilities and measure the deferred taxes using the enacted tax rates and laws that will be in effect when such temporary differences are expected to reverse. We believe that it is more likely than not that the Company will be able to realize its deferred tax assets in the future; therefore, no valuation allowance is necessary.
We recognize interest and penalties related to unrecognized tax benefits within the provision for income taxes in our consolidated statements of income. Accrued interest and penalties are included within accounts payable, accrued expenses and other liabilities in our consolidated statements of financial condition.
On December 22, 2017, the President signed into law the Tax Cuts and Jobs Act (“TCJA”) effective for tax years ending after December 31, 2017. This legislation replaces the prior corporate tax rate structure with a flat 21% rate, effective in 2018. There were many other impacts of the tax reform such as the repeal of the corporate alternative minimum tax rate, tax loss carryback and carryforward limitations effective in 2019.
A U.S. shareholder of a controlled foreign corporation (“CFC”) is required to include in income, as a deemed dividend, the global intangible low-taxed income (“GILTI”) of the CFC. We have elected to treat taxes due on future U.S. inclusions in taxable income of GILTI as a current period expense when incurred.
Tax Receivable Agreement
Tradeweb Markets Inc. entered into a Tax Receivable Agreement with TWM LLC and the Continuing LLC Owners which provides for the payment by Tradeweb Markets Inc. to a Continuing LLC Owner of 50% of the amount of U.S. federal, state and local income or franchise tax savings, if any, that Tradeweb Markets Inc. actually realizes (or in some circumstances is deemed to realize) as a result of (i) increases in the tax basis of TWM LLC’s assets resulting from (a) the purchase of LLC Interests from such Continuing LLC Owner, including with the net proceeds from the IPO, the October 2019 follow-on offering and any future offering or (b) redemptions or exchanges by such Continuing LLC
110
Owner of LLC Interests for shares of Class A common stock or Class B common stock or for cash, as applicable, and (ii) certain other tax benefits related to Tradeweb Markets Inc. making payments under the Tax Receivable Agreement.
We recorded an initial liability of $171.4 million related to our projected obligations under the Tax Receivable Agreement with respect to LLC Interests that were purchased by us using the net proceeds from the IPO. The impact of any changes in the projected obligations under the Tax Receivable Agreement as a result of changes in the geographic mix of the our earnings, changes in tax legislation and tax rates or other factors that may impact our tax savings will be reflected in income before taxes in the period in which the change occurs. During 2019, the liability increased to $240.8 million primarily due to the purchase of additional LLC Interests using the net proceeds from the October 2019 follow-on offering, as well as exchanges of LLC Interests by Continuing LLC owners during the year ended December 31, 2019, partially offset by changes in tax rates of $33.1 million recorded in our consolidated income statement as tax receivable agreement liability adjustment.
Contingent Consideration
In 2014, we issued Class A Shares and unvested Class P-1(A) Shares to some of the Bank Stockholders as a result of a capital contribution to facilitate our expansion into new credit products. The proceeds from the issuance of the shares were included in members’ capital. In connection with the investment, certain employees also invested in the Company and were issued Class C Shares and unvested Class P-1(C) Shares. The proceeds from the issuance of these shares were included in members’ capital. The Class A Shares and Class C Shares issued in connection with the investment equally participated in the earnings of the Company together with the other Class A Shares, Class P(A) Shares, Class C Shares and Class P(C) Shares of the Company. Most of the holders of Class A shares had the right to appoint members to the board of managers of the Company. The Class P-1(A) Shares and Class P-1(C) Shares did not have any earnings participation rights, nor did any of the Class P-1(A) Shares have the right to appoint members to the former board of managers, until they vested. The Class P-1(A) Shares and Class P-1(C) Shares vested in July 2018 upon the achievement of specific revenue earnout milestones related to the growth of our credit products, as defined by the agreement, from August 2014 through the vesting date of July 2018.
Prior to the July 2018 vesting, we recognized contingent consideration with respect to the potential vesting of Class P-1(A) Shares and Class P-1(C) Shares as a contra-revenue adjustment in accordance with ASC 605-50-45-2 because the vesting could be viewed as a sales incentive to participating Bank Stockholders since they are also customers of the Company. The contingent consideration for each reporting period was calculated by estimating the final contingent consideration value using a monte carlo simulation and recognizing that value on a straightline basis over the 48 month period of the agreement, adjusting at each reporting period for any changes in the final value estimate. The revenue milestones provided that shares would vest only if certain credit revenue milestones would be achieved in the twelve months ended July 2016, 2017 and 2018.
As a result of achieving these milestones, the final earnout amount was calculated based on the credit revenues during the twelve months ended July 31, 2018. On July 31, 2018, members’ capital increased by $150.5 million as a result of the vesting of the Class P-1(A) Shares and employee equity compensation payable increased by $5.7 million as a result of the vesting of the Class P-1(C) Shares. The value of the vested Class P-1(C) Shares was included in employee equity compensation payable because the Class P-1(C) were owned for less than six months by employees who had the ability to exercise a put option of those shares under certain conditions under their control.
Recent Accounting Pronouncements
See “Note 2 — Summary of Significant Accounting Policies” to our audited consolidated financial statements included elsewhere in this Annual Report on Form 10-K for a discussion of recent accounting pronouncements (adopted and not yet adopted).
111
Effects of Inflation
While inflation may impact our revenues and operating expenses, we believe the effects of inflation, if any, on our results of operations and financial condition have not been significant. However, there can be no assurance that our results of operations and financial condition will not be materially impacted by inflation in the future.
Jumpstart Our Business Startups Act of 2012
The JOBS Act permits us, as an “emerging growth company,” to take advantage of an extended transition period to comply with new or revised accounting standards applicable to public companies. We have elected to “opt out” of this provision and, as a result, we will comply with new or revised accounting standards on the relevant dates on which adoption of such standards is required for public companies that are not emerging growth companies. This decision to opt out of the extended transition period under the JOBS Act is irrevocable.
Internal Control over Financial Reporting
The process of improving our internal controls has required and will continue to require us to expend resources to design, implement and maintain a system of internal controls that is adequate to satisfy our reporting obligations as a public company. There can be no assurance that any actions we take will be completely successful. We will continue to evaluate the effectiveness of our disclosure controls and procedures and internal control over financial reporting on an on-going basis. As part of this process, we may identify specific internal controls as being deficient.
We continue to evaluate our internal control procedures in order to comply with the requirements of Section 404 of the Sarbanes-Oxley Act. Section 404 requires annual management assessments of the effectiveness of our internal control over financial reporting and a report by our independent auditors addressing these assessments; however, for so long as we qualify as an emerging growth company, we will not be required to engage an auditor to report on our internal control over financial reporting. We will be required to comply with the management certification requirements of Section 404 in our annual report on Form 10-K for the year ending December 31, 2020 (subject to any change in applicable SEC rules). We will be required to comply with Section 404 in full (including an auditor attestation on management’s internal controls report) in our annual report on Form 10-K at the later of the year following our first annual report required to be filed with the SEC or the date on which we are no longer an emerging growth company (subject to any change in applicable SEC rules).
ITEM 7A. QUANTITATIVE AND QUALITATIVE DISCLOSURES ABOUT MARKET RISKS
Foreign Currency and Derivative Risk
We have global operations and substantial portions of our revenues, expenses, assets and liabilities are generated and denominated in non-U.S. dollar currencies.
The following table shows the percentage breakdown of our gross revenue and operating expenses denominated in currencies other than the U.S. dollar for the year ended December 31, 2019, the 2018 Successor Period and the 2018 Predecessor Period:
|
|
|
Successor |
|
|
Successor |
|
|
Predecessor |
|
|||
|
|
|
Year Ended |
|
|
October 1, 2018 |
|
|
January 1, 2018 |
|
|||
|
|
|
December 31, |
|
|
to |
|
|
to |
|
|||
|
|
|
2019 |
|
|
December 31, 2018 |
|
|
September 30, 2018 |
|
|||
|
% of revenue denominated in foreign currencies (1) |
|
|
29 |
% |
|
|
29 |
% |
|
|
29 |
% |
|
% of operating expenses denominated in foreign currencies (2) |
|
|
14 |
% |
|
|
15 |
% |
|
|
17 |
% |
|
(1) |
Gross revenue in foreign currencies is primarily denominated in Euros. |
|
(2) |
Operating expenses in foreign currencies are primarily denominated in British pounds. |
Since our consolidated financial statements are presented in U.S. dollars, we must translate revenues and expenses, as well as assets and liabilities, into U.S. dollars. Accordingly, increases or decreases in the value of the U.S. dollar
112
against the other currencies will affect our net operating revenues, operating income and the value of balance sheet items denominated in foreign currencies. Revenues and expenses denominated in currencies other than the U.S. dollar are translated at the rate of exchange prevailing at the transaction date. Assets and liabilities denominated in foreign currencies are translated at the rate prevailing at the end of the reporting period. Any gain or loss resulting from the translation of assets and liabilities is included as a component of comprehensive income.
The following table shows the change in gross revenue and operating income caused by fluctuations in foreign currency rates during the year ended December 31, 2019, the 2018 Successor Period and the 2018 Predecessor Period:
|
|
|
Successor |
|
|
Successor |
|
|
Predecessor |
|||
|
|
|
Year Ended |
|
|
October 1, 2018 |
|
|
January 1, 2018 |
|||
|
Impact of Foreign Currency Rate Fluctuations |
|
December 31, |
|
|
to |
|
|
to |
|||
|
(amounts in thousands) |
|
2019 |
|
|
December 31, 2018 |
|
|
September 30, 2018 |
|||
|
Increase (decrease) in gross revenue |
|
$ |
(11,800) |
|
|
$ |
500 |
|
|
$ |
9,600 |
|
Increase (decrease) in operating income |
|
$ |
(8,600) |
|
|
$ |
2,200 |
|
|
$ |
11,200 |
The following table shows the impact a hypothetical 10% increase or decrease in the U.S. dollar against all other currencies would have on actual gross revenue and operating income for the year ended December 31, 2019, the 2018 Successor Period and the 2018 Predecessor Period:
|
|
|
Successor |
|
|
Successor |
|
|
Predecessor |
|||
|
|
|
Year Ended |
|
|
October 1, 2018 |
|
|
January 1, 2018 |
|||
|
Hypothetical 10% Change in Value of U.S. Dollar |
|
December 31, |
|
|
to |
|
|
to |
|||
|
(amounts in thousands) |
|
2019 |
|
|
December 31, 2018 |
|
|
September 30, 2018 |
|||
|
Effect of 10% change on gross revenue |
|
+/- |
$ 25,300 |
|
|
+/- |
$ 5,100 |
|
|
+/- |
$ 14,300 |
|
Effect of 10% change on operating income |
|
+/- |
$ 16,000 |
|
|
+/- |
$ 2,800 |
|
|
+/- |
$ 8,600 |
We have derivative risk relating to our foreign currency forward contracts. We enter into foreign currency forward contracts to mitigate our U.S. dollar and British pound sterling versus Euro exposure, generally with a duration of less than twelve months. We do not use derivative instruments for trading or speculative purposes. As of December 31, 2019 and December 31, 2018, the notional amount of our foreign currency forward contracts was $83.9 million and $1.7 million, respectively.
By using derivative instruments to hedge exposures to foreign currency fluctuations, we are exposed to credit risk. Credit risk is the failure of the counterparty to perform under the terms of the derivative contract. When the fair value of a derivative contract is positive, the counterparty owes us, which creates credit risk for us. When the fair value of a derivative contract is negative, we owe the counterparty and, therefore, we are not exposed to the counterparty’s credit risk in those circumstances. We attempt to minimize counterparty credit risk in derivative instruments by entering into transactions with high-quality counterparties whose credit rating is at least upper-medium investment grade.
113
114
Report of Independent Registered Public Accounting Firm
To the Shareholders and the Board of Directors of Tradeweb Markets Inc.
Opinion on the Financial Statements
We have audited the accompanying consolidated statements of financial condition of Tradeweb Markets Inc. and subsidiaries (the "Company") as of December 31, 2019 and 2018, the related consolidated statements of income, comprehensive income, changes in equity, and cash flows for the year ended December 31, 2019 and the period from October 1, 2018 to December 31, 2018, and the related notes (collectively referred to as the "financial statements"). In our opinion, the financial statements present fairly, in all material respects, the financial position of the Company as of December 31, 2019 and 2018, and the results of its operations and its cash flows for the year ended December 31, 2019 and the period from October 1, 2018 to December 31, 2018, in conformity with accounting principles generally accepted in the United States of America.
Emphasis of a Matter
As discussed in Notes 1 and 3 to the financial statements, on October 1, 2018, a majority interest in
King (Cayman) to Holdings Ltd., was acquired by BCP York Holdings, a company owned by certain
investment funds affiliated with The Blackstone Group Inc. As a result of the application of pushdown
accounting, the Company’s financial statements for the Successor Period are not comparable to the
Predecessor Periods, which are from January 1, 2018 to September 30, 2018, and for the year ended
December 31, 2017.
As discussed in Note 1 to the financial statements, the Company completed a series of reorganization transactions and an initial public offering in April 2019.
Basis for Opinion
These financial statements are the responsibility of the Company's management. Our responsibility is to express an opinion on the Company's financial statements based on our audits. We are a public accounting firm registered with the Public Company Accounting Oversight Board (United States) (PCAOB) and are required to be independent with respect to the Company in accordance with the U.S. federal securities laws and the applicable rules and regulations of the Securities and Exchange Commission and the PCAOB.
We conducted our audits in accordance with the standards of the PCAOB. Those standards require that we plan and perform the audit to obtain reasonable assurance about whether the financial statements are free of material misstatement, whether due to error or fraud. The Company is not required to have, nor were we engaged to perform, an audit of its internal control over financial reporting. As part of our audits, we are required to obtain an understanding of internal control over financial reporting but not for the purpose of expressing an opinion on the effectiveness of the Company’s internal control over financial reporting. Accordingly, we express no such opinion.
Our audits included performing procedures to assess the risks of material misstatement of the financial statements, whether due to error or fraud, and performing procedures that respond to those risks. Such procedures included examining, on a test basis, evidence regarding the amounts and disclosures in the financial statements. Our audits also included evaluating the accounting principles used and significant estimates made by management, as well as evaluating the overall presentation of the financial statements. We believe that our audits provide a reasonable basis for our opinion.
/s/ Deloitte & Touche LLP
February 21, 2020
New York, New York
We have served as the Company's auditor since 2018.
115
Report of Independent Registered Public Accounting Firm
To the Management and Members of Tradeweb Markets LLC (Predecessor):
Opinion on the Financial Statements
We have audited the accompanying consolidated statements of income, of comprehensive income, of changes in equity, and of cash flows of Tradeweb Markets LLC and its Subsidiaries (Predecessor) (the “Company”) for the nine months ended September 30, 2018 and for the year ended December 31, 2017, including the related notes (collectively referred to as the “consolidated financial statements”). In our opinion, the consolidated financial statements present fairly, in all material respects, the results of the Company’s operations and its cash flows for the nine months ended September 30, 2018 and for the year ended December 31, 2017, in conformity with accounting principles generally accepted in the United States of America.
Basis for Opinion
These consolidated financial statements are the responsibility of the Company’s management. Our responsibility is to express an opinion on the Company’s consolidated financial statements based on our audits. We are a public accounting firm registered with the Public Company Accounting Oversight Board (United States) (PCAOB) and are required to be independent with respect to the Company in accordance with the U.S. federal securities laws and the applicable rules and regulations of the Securities and Exchange Commission and the PCAOB.
We conducted our audits of these consolidated financial statements in accordance with the standards of the PCAOB. Those standards require that we plan and perform the audit to obtain reasonable assurance about whether the consolidated financial statements are free of material misstatement, whether due to error or fraud.
Our audits included performing procedures to assess the risks of material misstatement of the consolidated financial statements, whether due to error or fraud, and performing procedures that respond to those risks. Such procedures included examining, on a test basis, evidence regarding the amounts and disclosures in the consolidated financial statements. Our audits also included evaluating the accounting principles used and significant estimates made by management, as well as evaluating the overall presentation of the consolidated financial statements. We believe that our audits provide a reasonable basis for our opinion.
/s/ PricewaterhouseCoopers LLP
New York, New York
December 17, 2018, except for the impact of the amendment to the LLC agreement discussed in Note 2 to the consolidated financial statements, as to which the date is May 20, 2019
We have served as the Company's auditor from 2008 to 2018.
116
Tradeweb Markets Inc. and Subsidiaries
Consolidated Statements of Financial Condition
(in thousands, except share data)
|
|
|
Successor |
|
Successor |
||
|
|
|
December 31, |
|
December 31, |
||
|
|
|
2019 |
|
2018 |
||
|
Assets |
|
|
|
|
|
|
|
Cash and cash equivalents |
|
$ |
460,711 |
|
$ |
410,104 |
|
Restricted cash |
|
|
1,000 |
|
|
1,200 |
|
Receivable from brokers and dealers and clearing organizations |
|
|
30,641 |
|
|
174,591 |
|
Deposits with clearing organizations |
|
|
9,724 |
|
|
11,427 |
|
Accounts receivable, net of allowance |
|
|
92,814 |
|
|
87,192 |
|
Furniture, equipment, purchased software and leasehold improvements, net of accumulated depreciation and amortization |
|
|
40,405 |
|
|
38,128 |
|
Right-of-use assets |
|
|
24,504 |
|
|
— |
|
Software development costs, net of accumulated amortization |
|
|
173,086 |
|
|
170,582 |
|
Goodwill |
|
|
2,694,797 |
|
|
2,694,797 |
|
Intangible assets, net of accumulated amortization |
|
|
1,281,441 |
|
|
1,380,848 |
|
Receivable from affiliates |
|
|
2,525 |
|
|
3,243 |
|
Deferred tax asset |
|
|
256,450 |
|
|
— |
|
Other assets |
|
|
27,236 |
|
|
25,027 |
|
Total assets |
|
$ |
5,095,334 |
|
$ |
4,997,139 |
|
|
|
|
|
|
|
|
|
Liabilities and Stockholders' Equity/Members' Capital |
|
|
|
|
|
|
|
Liabilities |
|
|
|
|
|
|
|
Payable to brokers and dealers and clearing organizations |
|
$ |
30,452 |
|
$ |
171,214 |
|
Accrued compensation |
|
|
119,415 |
|
|
120,158 |
|
Deferred revenue |
|
|
23,990 |
|
|
27,883 |
|
Accounts payable, accrued expenses and other liabilities |
|
|
32,834 |
|
|
42,548 |
|
Employee equity compensation payable |
|
|
1,048 |
|
|
24,187 |
|
Lease liability |
|
|
30,955 |
|
|
— |
|
Payable to affiliates |
|
|
1,506 |
|
|
5,009 |
|
Deferred tax liability |
|
|
21,572 |
|
|
19,627 |
|
Tax receivable agreement liability |
|
|
240,817 |
|
|
— |
|
Total liabilities |
|
|
502,589 |
|
|
410,626 |
|
|
|
|
|
|
|
|
|
Commitments and contingencies (Note 17) |
|
|
|
|
|
|
|
|
|
|
|
|
|
|
|
Mezzanine Capital |
|
|
|
|
|
|
|
Class C Shares and Class P(C) Shares |
|
|
— |
|
|
14,179 |
|
|
|
|
|
|
|
|
|
Stockholders' Equity/Members' Capital |
|
|
|
|
|
|
|
Members' capital |
|
|
— |
|
|
4,573,200 |
|
Preferred stock, $.00001 par value; 250,000,000 shares authorized; none issued or outstanding |
|
|
— |
|
|
— |
|
Class A common stock, $.00001 par value; 1,000,000,000 shares authorized; 66,408,328 shares outstanding as of December 31, 2019 |
|
|
1 |
|
|
— |
|
Class B common stock, $.00001 par value; 450,000,000 shares authorized; 96,933,192 shares outstanding as of December 31, 2019 |
|
|
1 |
|
|
— |
|
Class C common stock, $.00001 par value; 350,000,000 shares authorized; 8,328,983 shares outstanding as of December 31, 2019 |
|
|
— |
|
|
— |
|
Class D common stock, $.00001 par value; 300,000,000 shares authorized; 50,853,172 shares outstanding as of December 31, 2019 |
|
|
1 |
|
|
— |
|
Additional paid-in capital |
|
|
3,329,386 |
|
|
— |
|
Accumulated other comprehensive income (loss) |
|
|
1,366 |
|
|
(866) |
|
Retained earnings |
|
|
47,833 |
|
|
— |
|
Total stockholders' equity attributable to Tradeweb Markets Inc./members' capital |
|
|
3,378,588 |
|
|
4,572,334 |
|
Non-controlling interests |
|
|
1,214,157 |
|
|
— |
|
Total equity |
|
|
4,592,745 |
|
|
4,572,334 |
|
Total liabilities and stockholders' equity/members' capital |
|
$ |
5,095,334 |
|
$ |
4,997,139 |
The accompanying notes are an integral part of these consolidated financial statements.
117
Tradeweb Markets Inc. and Subsidiaries
Consolidated Statements of Income
(in thousands, except share and per share data)
|
|
|
Successor |
|
Successor |
|
|
Predecessor |
|
|
Predecessor |
|
||||
|
|
|
Year Ended |
|
October 1, 2018 to |
|
|
January 1, 2018 to |
|
|
Year Ended |
|
||||
|
|
|
December 31, |
|
December 31, |
|
|
September 30, |
|
|
December 31, |
|
||||
|
|
|
2019 |
|
2018 |
|
|
2018 |
|
|
2017 |
|
||||
|
Revenues |
|
|
|
|
|
|
|
|
|
|
|
|
|
|
|
|
Transaction fees |
|
$ |
423,583 |
|
$ |
97,130 |
|
|
$ |
273,751 |
|
|
$ |
267,020 |
|
|
Subscription fees |
|
|
138,731 |
|
|
33,052 |
|
|
|
107,130 |
|
|
|
144,409 |
|
|
Commissions |
|
|
149,365 |
|
|
32,840 |
|
|
|
79,830 |
|
|
|
96,745 |
|
|
Refinitiv market data fees |
|
|
55,635 |
|
|
13,467 |
|
|
|
36,851 |
|
|
|
50,125 |
|
|
Other |
|
|
8,252 |
|
|
2,148 |
|
|
|
8,209 |
|
|
|
4,669 |
|
|
Gross revenue |
|
|
775,566 |
|
|
178,637 |
|
|
|
505,771 |
|
|
|
562,968 |
|
|
Contingent consideration |
|
|
— |
|
|
— |
|
|
|
(26,830) |
|
|
|
(58,520) |
|
|
Net revenue |
|
|
775,566 |
|
|
178,637 |
|
|
|
478,941 |
|
|
|
504,448 |
|
|
|
|
|
|
|
|
|
|
|
|
|
|
|
|
|
|
|
Expenses |
|
|
|
|
|
|
|
|
|
|
|
|
|
|
|
|
Employee compensation and benefits |
|
|
329,457 |
|
|
80,436 |
|
|
|
209,053 |
|
|
|
248,963 |
|
|
Depreciation and amortization |
|
|
139,330 |
|
|
33,020 |
|
|
|
48,808 |
|
|
|
68,615 |
|
|
Technology and communications |
|
|
39,285 |
|
|
9,907 |
|
|
|
26,598 |
|
|
|
30,013 |
|
|
General and administrative |
|
|
34,960 |
|
|
11,837 |
|
|
|
23,056 |
|
|
|
33,973 |
|
|
Professional fees |
|
|
28,029 |
|
|
8,194 |
|
|
|
20,360 |
|
|
|
19,351 |
|
|
Occupancy |
|
|
14,686 |
|
|
3,308 |
|
|
|
10,732 |
|
|
|
14,441 |
|
|
Total expenses |
|
|
585,747 |
|
|
146,702 |
|
|
|
338,607 |
|
|
|
415,356 |
|
|
Operating income |
|
|
189,819 |
|
|
31,935 |
|
|
|
140,334 |
|
|
|
89,092 |
|
|
Tax receivable agreement liability adjustment (1) |
|
|
33,134 |
|
|
— |
|
|
|
— |
|
|
|
— |
|
|
Net interest income |
|
|
2,373 |
|
|
787 |
|
|
|
1,726 |
|
|
|
685 |
|
|
Income before taxes |
|
|
225,326 |
|
|
32,722 |
|
|
|
142,060 |
|
|
|
89,777 |
|
|
Provision for income taxes |
|
|
(52,302) |
|
|
(3,415) |
|
|
|
(11,900) |
|
|
|
(6,129) |
|
|
Net income |
|
$ |
173,024 |
|
$ |
29,307 |
|
|
$ |
130,160 |
|
|
$ |
83,648 |
|
|
Less: Pre-IPO net income attributable to Tradeweb Markets LLC |
|
|
42,352 |
|
|
|
|
|
|
|
|
|
|
|
|
|
Net income attributable to Tradeweb Markets Inc. and non-controlling interests |
|
|
130,672 |
|
|
|
|
|
|
|
|
|
|
|
|
|
Less: Net income attributable to non-controlling interests |
|
|
46,903 |
|
|
|
|
|
|
|
|
|
|
|
|
|
Net income attributable to Tradeweb Markets Inc. |
|
$ |
83,769 |
|
|
|
|
|
|
|
|
|
|
|
|
|
|
|
|
|
|
|
|
|
|
|
|
|
|
|
|
|
|
EPS calculations for pre-IPO and post-IPO periods (2) |
|
|
|
|
|
|
|
|
|
|
|
|
|
|
|
|
Earnings per share |
|
|
|
|
|
|
|
|
|
|
|
|
|
|
|
|
Basic |
|
$ |
0.19 |
(a) / |
$ |
0.13 |
(a) |
|
$ |
0.60 |
|
(a) |
$ |
0.39 |
(a) |
|
Diluted |
|
$ |
0.19 |
(a) / |
$ |
0.13 |
(a) |
|
$ |
0.60 |
|
(a) |
$ |
0.39 |
(a) |
|
Weighted average shares outstanding |
|
|
|
|
|
|
|
|
|
|
|
|
|
|
|
|
Basic |
|
|
222,222,197 |
(a) / |
|
222,221,628 |
(a) |
|
|
215,365,920 |
|
(a) |
|
215,568,635 |
(a) |
|
Diluted |
|
|
223,320,457 |
(a) / |
|
222,243,851 |
(a) |
|
|
215,365,920 |
|
(a) |
|
215,568,635 |
(a) |
|
(1) |
See Note 10 – Tax Receivable Agreement. |
|
(2) |
In April 2019, the Company completed the Reorganization Transactions and the IPO, which, among other things, resulted in Tradeweb Markets Inc. becoming the successor of Tradeweb Markets LLC for financial reporting purposes. As a result, earnings per share information for the pre-IPO period is not comparable to the earnings per share information for the post-IPO period. Therefore, earnings per share information is being presented separately for the pre-IPO and post-IPO periods. See Note 18 – Earnings Per Share for additional information. |
|
a) |
Presents information for Tradeweb Markets LLC (pre-IPO period). |
|
b) |
Presents information for Tradeweb Markets Inc. (post-IPO period). |
The accompanying notes are an integral part of these consolidated financial statements.
118
Tradeweb Markets Inc. and Subsidiaries
Consolidated Statements of Comprehensive Income
(in thousands)
|
|
|
Successor |
|
Successor |
|
|
Predecessor |
|
|
Predecessor |
||||
|
|
|
Year Ended |
|
October 1, 2018 to |
|
|
January 1, 2018 to |
|
|
Year Ended |
||||
|
|
|
December 31, |
|
December 31, |
|
|
September 30, |
|
|
December 31, |
||||
|
|
|
2019 |
|
2018 |
|
|
2018 |
|
|
2017 |
||||
|
Comprehensive income - Pre-IPO attributable to Tradeweb Markets LLC |
|
|
|
|
|
|
|
|
|
|
|
|
|
|
|
Pre-IPO net income attributable to Tradeweb Markets LLC |
|
$ |
42,352 |
|
$ |
29,307 |
|
|
$ |
130,160 |
|
|
$ |
83,648 |
|
Other comprehensive income: |
|
|
|
|
|
|
|
|
|
|
|
|
|
|
|
Foreign currency translation adjustments attributable to Tradeweb Markets LLC |
|
|
988 |
|
|
(866) |
|
|
|
(3,064) |
|
|
|
2,885 |
|
Pre-IPO comprehensive income attributable to Tradeweb Markets LLC |
|
$ |
43,340 |
|
$ |
28,441 |
|
|
$ |
127,096 |
|
|
$ |
86,533 |
|
|
|
|
|
|
|
|
|
|
|
|
|
|
|
|
|
Comprehensive income - Tradeweb Markets Inc. |
|
|
|
|
|
|
|
|
|
|
|
|
|
|
|
Net income attributable to Tradeweb Markets Inc. |
|
$ |
83,769 |
|
|
|
|
|
|
|
|
|
|
|
|
Other comprehensive income: |
|
|
|
|
|
|
|
|
|
|
|
|
|
|
|
Foreign currency translation adjustments attributable to Tradeweb Markets Inc. |
|
|
1,441 |
|
|
|
|
|
|
|
|
|
|
|
|
Comprehensive income attributable to Tradeweb Markets Inc. |
|
$ |
85,210 |
|
|
|
|
|
|
|
|
|
|
|
|
|
|
|
|
|
|
|
|
|
|
|
|
|
|
|
|
Comprehensive income - Non-controlling interests |
|
|
|
|
|
|
|
|
|
|
|
|
|
|
|
Net income attributable to non-controlling interests |
|
$ |
46,903 |
|
|
|
|
|
|
|
|
|
|
|
|
Other comprehensive income: |
|
|
|
|
|
|
|
|
|
|
|
|
|
|
|
Foreign currency translation adjustments attributable to non-controlling interests |
|
|
298 |
|
|
|
|
|
|
|
|
|
|
|
|
Comprehensive income attributable to non-controlling interests |
|
$ |
47,201 |
|
|
|
|
|
|
|
|
|
|
|
The accompanying notes are an integral part of these consolidated financial statements.
119
Tradeweb Markets Inc. and Subsidiaries
Consolidated Statements of Changes in Equity
(in thousands, except share and per share amounts)
|
|
|
Members' |
|
Class A |
|
Class B |
|
Class C |
|
Class D |
|
Additional |
Accumulated |
|
Retained |
|
Non-Controlling |
|
Total |
||||||||||||||
|
Successor |
|
|
|
|
Shares |
|
Amount |
|
Shares |
|
Amount |
|
Shares |
|
Amount |
|
Shares |
|
Amount |
|
|
|
|
|
|
|
|
|
|
|
|
|
|
|
Balance at December 31, 2018 |
|
$ |
4,573,200 |
|
— |
|
— |
|
— |
|
— |
|
— |
|
— |
|
— |
|
— |
|
$ |
— |
$ |
(866) |
|
$ |
— |
|
$ |
— |
|
$ |
4,572,334 |
|
Adjustment to Class C Shares and Class P(C) shares in mezzanine capital |
|
|
(2,369) |
|
— |
|
— |
|
— |
|
— |
|
— |
|
— |
|
— |
|
— |
|
|
— |
|
— |
|
|
— |
|
|
— |
|
|
(2,369) |
|
Capital distributions |
|
|
(20,000) |
|
— |
|
— |
|
— |
|
— |
|
— |
|
— |
|
— |
|
— |
|
|
— |
|
— |
|
|
— |
|
|
— |
|
|
(20,000) |
|
Stock-based compensation |
|
|
4,674 |
|
— |
|
— |
|
— |
|
— |
|
— |
|
— |
|
— |
|
— |
|
|
— |
|
— |
|
|
— |
|
|
— |
|
|
4,674 |
|
Net income |
|
|
42,352 |
|
— |
|
— |
|
— |
|
— |
|
— |
|
— |
|
— |
|
— |
|
|
— |
|
— |
|
|
— |
|
|
— |
|
|
42,352 |
|
Foreign currency translation adjustments |
|
|
— |
|
— |
|
— |
|
— |
|
— |
|
— |
|
— |
|
— |
|
— |
|
|
— |
|
988 |
|
|
— |
|
|
— |
|
|
988 |
|
Balance at March 31, 2019 (Pre-IPO Period) |
|
$ |
4,597,857 |
|
— |
|
— |
|
— |
|
— |
|
— |
|
— |
|
— |
|
— |
|
$ |
— |
$ |
122 |
|
$ |
— |
|
$ |
— |
|
$ |
4,597,979 |
|
Capital distributions |
|
|
(100,000) |
|
— |
|
— |
|
— |
|
— |
|
— |
|
— |
|
— |
|
— |
|
|
— |
|
— |
|
|
— |
|
|
— |
|
|
(100,000) |
|
Effect of the reorganization transactions |
|
|
(4,497,857) |
|
|
|
|
|
|
|
|
|
|
|
|
|
|
|
|
|
|
4,521,132 |
|
— |
|
|
— |
|
|
— |
|
|
23,275 |
|
Issuance of common stock, net of offering costs and cancellations |
|
|
— |
|
46,000,000 |
|
— |
|
96,933,192 |
|
1 |
|
10,006,269 |
|
— |
|
69,282,736 |
|
1 |
|
|
(18,492) |
|
— |
|
|
— |
|
|
— |
|
|
(18,490) |
|
Activities related to the follow-on offering and other exchanges of LLC Interests, net of offering costs and cancellations |
|
|
|
|
20,106,850 |
|
1 |
|
— |
|
— |
|
(1,677,286) |
|
— |
|
(18,429,564) |
|
— |
|
|
|
|
|
|
|
— |
|
|
— |
|
|
1 |
|
Issuance of common stock from equity incentive plans |
|
|
— |
|
301,478 |
|
— |
|
— |
|
— |
|
— |
|
— |
|
— |
|
— |
|
|
— |
|
— |
|
|
— |
|
|
— |
|
|
— |
|
Tax receivable agreement liability and deferred taxes arising from the reorganization transactions, IPO and follow-on offering and other LLC Interest ownership changes |
|
|
— |
|
— |
|
— |
|
— |
|
— |
|
— |
|
— |
|
— |
|
— |
|
|
(4,382) |
|
— |
|
|
— |
|
|
— |
|
|
(4,382) |
|
Allocation of equity to non-controlling interests |
|
|
— |
|
— |
|
— |
|
— |
|
— |
|
— |
|
— |
|
— |
|
— |
|
|
(1,607,529) |
|
— |
|
|
— |
|
|
1,607,529 |
|
|
— |
|
Adjustments to non-controlling interests |
|
|
— |
|
— |
|
— |
|
— |
|
— |
|
— |
|
— |
|
— |
|
— |
|
|
402,424 |
|
(197) |
|
|
— |
|
|
(402,227) |
|
|
— |
|
Distributions to non-controlling interests |
|
|
— |
|
— |
|
— |
|
— |
|
— |
|
— |
|
— |
|
— |
|
— |
|
|
— |
|
— |
|
|
— |
|
|
(38,346) |
|
|
(38,346) |
|
Dividends ($0.24 per share) |
|
|
— |
|
— |
|
— |
|
— |
|
— |
|
— |
|
— |
|
— |
|
— |
|
|
— |
|
— |
|
|
(35,936) |
|
|
— |
|
|
(35,936) |
|
Stock-based compensation expense under the PRSU Plan |
|
|
— |
|
— |
|
— |
|
— |
|
— |
|
— |
|
— |
|
— |
|
— |
|
|
20,718 |
|
— |
|
|
— |
|
|
— |
|
|
20,718 |
|
Stock-based compensation expense under the Option Plan |
|
|
— |
|
— |
|
— |
|
— |
|
— |
|
— |
|
— |
|
— |
|
— |
|
|
24,432 |
|
— |
|
|
— |
|
|
— |
|
|
24,432 |
|
Payroll taxes paid for stock-based compensation exercises |
|
|
— |
|
|
|
|
|
|
|
|
|
|
|
|
|
|
|
|
|
|
(8,917) |
|
— |
|
|
— |
|
|
— |
|
|
(8,917) |
|
Net income |
|
|
— |
|
— |
|
— |
|
— |
|
— |
|
— |
|
— |
|
— |
|
— |
|
|
— |
|
— |
|
|
83,769 |
|
|
46,903 |
|
|
130,672 |
|
Foreign currency translation adjustments |
|
|
— |
|
— |
|
— |
|
— |
|
— |
|
— |
|
— |
|
— |
|
— |
|
|
— |
|
1,441 |
|
|
— |
|
|
298 |
|
|
1,739 |
|
Balance at December 31, 2019 (Post-IPO Period) |
|
$ |
— |
|
66,408,328 |
|
1 |
|
96,933,192 |
|
1 |
|
8,328,983 |
|
— |
|
50,853,172 |
|
1 |
|
$ |
3,329,386 |
$ |
1,366 |
|
$ |
47,833 |
|
$ |
1,214,157 |
|
$ |
4,592,745 |
|
|
|
|
|
|
|
|
|
|
|
|
|
|
|
|
|
|
|
|
|
|
|
|
|
|
|
|
|
|
|
|
|
|
|
The accompanying notes are an integral part of these consolidated financial statements.
120
Tradeweb Markets Inc. and Subsidiaries
Consolidated Statements of Changes in Equity – (Continued)
(in thousands)
(Unaudited)
|
|
|
|
|
|
Accumulated |
|
|
|
|
|
|
|
|
|
|
Other |
|
Total |
||
|
|
|
Members' |
|
Comprehensive |
|
Members' |
|||
|
|
|
Capital |
|
Loss |
|
Capital |
|||
|
Successor |
|
|
|
|
|
|
|
|
|
|
Members' capital at October 1, 2018 |
|
$ |
4,562,154 |
|
|
— |
|
$ |
4,562,154 |
|
Comprehensive income: |
|
|
|
|
|
|
|
|
|
|
Net income |
|
|
29,307 |
|
|
— |
|
|
29,307 |
|
Foreign currency translation adjustments |
|
|
— |
|
|
(866) |
|
|
(866) |
|
Total comprehensive income |
|
|
29,307 |
|
|
(866) |
|
|
28,441 |
|
Adjustment to Class C Shares and Class P(C) Shares in mezzanine capital |
|
|
(1,333) |
|
|
— |
|
|
(1,333) |
|
Conversion of certain cash-settled PRSUs to equity-settled PRSUs |
|
|
19,072 |
|
|
— |
|
|
19,072 |
|
Capital distributions |
|
|
(36,000) |
|
|
— |
|
|
(36,000) |
|
Members' capital at December 31, 2018 |
|
$ |
4,573,200 |
|
$ |
(866) |
|
$ |
4,572,334 |
|
|
|
|
|
|
Accumulated |
|
|
|
|
|
|
|
|
|
|
Other |
|
Total |
||
|
|
|
Members' |
|
Comprehensive |
|
Members' |
|||
|
|
|
Capital |
|
Loss |
|
Capital |
|||
|
Predecessor |
|
|
|
|
|
|
|
|
|
|
Members' capital at December 31, 2016 |
|
$ |
1,040,911 |
|
|
(16,152) |
|
$ |
1,024,759 |
|
Comprehensive income: |
|
|
|
|
|
|
|
|
|
|
Net income |
|
|
83,648 |
|
|
— |
|
|
83,648 |
|
Foreign currency translation adjustments |
|
|
— |
|
|
2,885 |
|
|
2,885 |
|
Total comprehensive income |
|
|
83,648 |
|
|
2,885 |
|
|
86,533 |
|
Adjustment to Class C Shares and Class P(C) Shares in mezzanine capital |
|
|
(2,109) |
|
|
— |
|
|
(2,109) |
|
Capital contributions |
|
|
29,285 |
|
|
— |
|
|
29,285 |
|
Capital distributions |
|
|
(152,000) |
|
|
— |
|
|
(152,000) |
|
Members' capital at December 31, 2017 |
|
$ |
999,735 |
|
|
(13,267) |
|
$ |
986,468 |
|
Comprehensive income: |
|
|
|
|
|
|
|
|
|
|
Net income |
|
|
130,160 |
|
|
— |
|
|
130,160 |
|
Foreign currency translation adjustments |
|
|
— |
|
|
(3,064) |
|
|
(3,064) |
|
Total comprehensive income |
|
|
130,160 |
|
|
(3,064) |
|
|
127,096 |
|
Capital distributions |
|
|
(139,350) |
|
|
— |
|
|
(139,350) |
|
Adjustment to Class C Shares and Class P(C) Shares in mezzanine capital |
|
|
456 |
|
|
— |
|
|
456 |
|
Vesting of contingent consideration |
|
|
150,495 |
|
|
— |
|
|
150,495 |
|
Members' capital at September 30, 2018 |
|
$ |
1,141,496 |
|
$ |
(16,331) |
|
$ |
1,125,165 |
The accompanying notes are an integral part of these consolidated financial statements.
121
Tradeweb Markets Inc. and Subsidiaries
Consolidated Statements of Cash Flows
(in thousands)
|
|
|
Successor |
|
Successor |
|
|
Predecessor |
|
Predecessor |
||||
|
|
|
|
|
|
|
|
|
|
|
||||
|
|
|
Year Ended |
|
October 1, 2018 to |
|
|
January 1, 2018 to |
|
Year Ended |
||||
|
|
|
December 31, |
|
December 31, |
|
|
September 30, |
|
December 31, |
||||
|
|
|
2019 |
|
2018 |
|
|
2018 |
|
2017 |
||||
|
Cash flows from operating activities |
|
|
|
|
|
|
|
|
|
|
|
|
|
|
Net income |
|
$ |
173,024 |
|
$ |
29,307 |
|
|
$ |
130,160 |
|
$ |
83,648 |
|
Adjustments to reconcile net income to net cash provided by operating activities: |
|
|
|
|
|
|
|
|
|
|
|
|
|
|
Depreciation and amortization |
|
|
139,330 |
|
|
33,020 |
|
|
|
48,808 |
|
|
68,615 |
|
Contingent consideration |
|
|
— |
|
|
— |
|
|
|
26,830 |
|
|
58,520 |
|
Vesting of P-1 (C) Shares |
|
|
— |
|
|
— |
|
|
|
(5,728) |
|
|
— |
|
Stock-based compensation expense |
|
|
49,824 |
|
|
— |
|
|
|
— |
|
|
— |
|
Deferred taxes |
|
|
15,024 |
|
|
968 |
|
|
|
2,602 |
|
|
(950) |
|
Tax receivable agreement liability adjustment |
|
|
(33,134) |
|
|
— |
|
|
|
— |
|
|
— |
|
(Increase) decrease in operating assets: |
|
|
|
|
|
|
|
|
|
|
|
|
|
|
Receivable from/Payable to brokers and dealers and clearing organizations, net |
|
|
3,188 |
|
|
1,265 |
|
|
|
(4,640) |
|
|
(2) |
|
Deposits with clearing organizations |
|
|
1,789 |
|
|
(2,248) |
|
|
|
726 |
|
|
606 |
|
Accounts receivable |
|
|
(4,283) |
|
|
8,085 |
|
|
|
(28,434) |
|
|
11,196 |
|
Receivable from/Payable to affiliates, net |
|
|
(2,461) |
|
|
(1,102) |
|
|
|
(1,850) |
|
|
(135) |
|
Other assets |
|
|
(5,648) |
|
|
(4,695) |
|
|
|
(6,371) |
|
|
4,719 |
|
Increase (decrease) in operating liabilities: |
|
|
|
|
|
|
|
|
|
|
|
|
|
|
Accrued compensation |
|
|
(1,783) |
|
|
38,368 |
|
|
|
(7,568) |
|
|
12,364 |
|
Deferred revenue |
|
|
(3,905) |
|
|
(396) |
|
|
|
(1,396) |
|
|
(12,555) |
|
Accounts payable, accrued expenses and other liabilities |
|
|
(3,550) |
|
|
639 |
|
|
|
8,793 |
|
|
(3,826) |
|
Employee equity compensation payable |
|
|
(16,412) |
|
|
9,345 |
|
|
|
2,896 |
|
|
2,380 |
|
Net cash provided by operating activities |
|
|
311,003 |
|
|
112,556 |
|
|
|
164,828 |
|
|
224,580 |
|
Cash flows from investing activities |
|
|
|
|
|
|
|
|
|
|
|
|
|
|
Purchase of furniture, equipment, software and leasehold improvements |
|
|
(15,781) |
|
|
(9,090) |
|
|
|
(6,327) |
|
|
(13,461) |
|
Capitalized software development costs |
|
|
(28,681) |
|
|
(7,156) |
|
|
|
(19,523) |
|
|
(27,157) |
|
Business acquisitions |
|
|
— |
|
|
— |
|
|
|
— |
|
|
66 |
|
Purchase of investments |
|
|
— |
|
|
— |
|
|
|
— |
|
|
(5,000) |
|
Net cash used in investing activities |
|
|
(44,462) |
|
|
(16,246) |
|
|
|
(25,850) |
|
|
(45,552) |
|
Cash flows from financing activities |
|
|
|
|
|
|
|
|
|
|
|
|
|
|
Mezzanine capital contributions |
|
|
— |
|
|
— |
|
|
|
— |
|
|
82 |
|
Mezzanine capital distributions |
|
|
— |
|
|
— |
|
|
|
— |
|
|
(1,543) |
|
Pre-IPO capital distributions |
|
|
(120,000) |
|
|
(36,000) |
|
|
|
(139,350) |
|
|
(152,000) |
|
Proceeds from issuance of Class A common stock in the IPO, net of underwriting discounts |
|
|
1,161,270 |
|
|
— |
|
|
|
— |
|
|
— |
|
Purchase of LLC Interests in connection with the IPO |
|
|
(1,161,270) |
|
|
— |
|
|
|
— |
|
|
— |
|
Proceeds from issuance of Class A common stock in the follow-on offering |
|
|
809,954 |
|
|
— |
|
|
|
— |
|
|
— |
|
Purchase of LLC Interests and Class A common stock in connection with the follow-on offering |
|
|
(809,954) |
|
|
— |
|
|
|
— |
|
|
— |
|
Offering costs from IPO and follow-on offering |
|
|
(14,943) |
|
|
— |
|
|
|
— |
|
|
— |
|
Dividends |
|
|
(35,936) |
|
|
— |
|
|
|
— |
|
|
— |
|
Distributions to non-controlling interests |
|
|
(38,346) |
|
|
— |
|
|
|
— |
|
|
— |
|
Payroll taxes paid for stock-based compensation exercises |
|
|
(8,917) |
|
|
— |
|
|
|
— |
|
|
— |
|
Net cash used in financing activities |
|
|
(218,142) |
|
|
(36,000) |
|
|
|
(139,350) |
|
|
(153,461) |
|
Effect of exchange rate changes on cash and cash equivalents |
|
|
2,008 |
|
|
(389) |
|
|
|
(2,043) |
|
|
3,157 |
|
Net increase (decrease) in cash and cash equivalents |
|
|
50,407 |
|
|
59,921 |
|
|
|
(2,415) |
|
|
28,724 |
|
Cash and cash equivalents and restricted cash |
|
|
|
|
|
|
|
|
|
|
|
|
|
|
Beginning of period |
|
|
411,304 |
|
|
351,383 |
|
|
|
353,798 |
|
|
325,074 |
|
End of period |
|
$ |
461,711 |
|
$ |
411,304 |
|
|
$ |
351,383 |
|
$ |
353,798 |
|
|
|
|
|
|
|
|
|
|
|
|
|
|
|
|
Supplemental disclosure of cash flow information |
|
|
|
|
|
|
|
|
|
|
|
|
|
|
Interest paid |
|
$ |
— |
|
$ |
— |
|
|
$ |
— |
|
$ |
455 |
|
Income taxes paid |
|
$ |
43,842 |
|
$ |
2,659 |
|
|
$ |
5,500 |
|
$ |
6,312 |
|
|
|
|
|
|
|
|
|
|
|
|
|
|
|
|
Non-cash financing activities |
|
|
|
|
|
|
|
|
|
|
|
|
|
|
Items arising from the reorganization transactions, IPO, follow-on offering and other LLC Interest ownership changes: |
|
|
|
|
|
|
|
|
|
|
|
|
|
|
Establishment of liabilities under tax receivable agreement |
|
$ |
273,951 |
|
$ |
— |
|
|
$ |
— |
|
$ |
— |
|
Deferred tax asset |
|
$ |
269,569 |
|
$ |
— |
|
|
$ |
— |
|
$ |
— |
|
Vesting of contingent consideration |
|
$ |
— |
|
$ |
— |
|
|
$ |
150,495 |
|
$ |
— |
|
Conversion of convertible term note payable to Thomson Reuters to Class A Shares |
|
$ |
— |
|
$ |
— |
|
|
$ |
— |
|
$ |
29,285 |
|
Conversion of certain cash-settled PRSUs to equity-settled PRSUs |
|
$ |
— |
|
$ |
19,072 |
|
|
$ |
— |
|
$ |
— |
|
Reconciliation of cash, cash equivalents and restricted cash as shown on the statements of financial condition: |
|
December 31, |
|
December 31, |
|
|
|
|
|
|
|
||
|
Cash and cash equivalents |
|
|
460,711 |
|
|
410,104 |
|
|
|
|
|
|
|
|
Restricted cash |
|
|
1,000 |
|
|
1,200 |
|
|
|
|
|
|
|
|
Cash, cash equivalents and restricted cash shown in the statement of cash flows |
|
$ |
461,711 |
|
$ |
411,304 |
|
|
|
|
|
|
|
The accompanying notes are an integral part of these consolidated financial statements.
122
Notes to Consolidated Financial Statements
(Unaudited)
|
|
|
|
Page |
|
|
124 | ||
|
|
127 | ||
|
|
133 | ||
|
|
134 | ||
|
|
134 | ||
|
|
136 | ||
|
|
136 | ||
|
|
136 | ||
|
|
136 | ||
|
|
139 | ||
|
|
140 | ||
|
|
143 | ||
|
|
143 | ||
|
|
146 | ||
|
|
148 | ||
|
|
148 | ||
|
|
149 | ||
|
|
150 | ||
|
|
151 | ||
|
|
152 | ||
|
|
153 | ||
|
|
154 |
123
Tradeweb Markets Inc. and Subsidiaries
Notes to Consolidated Financial Statements
Tradeweb Markets Inc. (the “Corporation”) was incorporated as a Delaware corporation on November 7, 2018 for the purpose of completing certain reorganization transactions in order to carry on the business of Tradeweb Markets LLC (“TWM LLC”) and conducting an initial public offering (“IPO”) as described below under “—Initial Public Offering” and “—Reorganization Transactions.”
The Corporation is a consolidating subsidiary of BCP York Holdings, (“BCP”) a company owned by certain investment funds affiliated with The Blackstone Group Inc. (f/k/a The Blackstone Group L.P.) (“Blackstone”), through BCP’s majority ownership interest in Refinitiv Holdings Limited (the “Parent” and, unless otherwise stated or the context otherwise requires, together with all of its subsidiaries, “Refinitiv”). Refinitiv owns a majority ownership interest in the Company (as defined below).
The Corporation is a holding company whose principal asset is LLC Interests (as defined below) of TWM LLC. As the sole manager of TWM LLC, the Corporation operates and controls all of the business and affairs of TWM LLC and, through TWM LLC and its subsidiaries, conducts the Corporation’s business. As a result of this control, and because the Corporation has a substantial financial interest in TWM LLC, the Corporation consolidates the financial results of TWM LLC and reports a non-controlling interest in the Corporation’s consolidated financial statements. As of December 31, 2019, Tradeweb Markets Inc. owns 73.4% of TWM LLC and the non-controlling interest holders own the remaining 26.6% of TWM LLC.
Unless the context otherwise requires, references to the “Company” refer to Tradeweb Markets Inc. and its consolidated subsidiaries, including TWM LLC, following the completion of the Reorganization Transactions (as defined below), and TWM LLC and its consolidated subsidiaries prior to the completion of the Reorganization Transactions.
The Company is a leader in building and operating electronic marketplaces for a global network of clients across the institutional, wholesale and retail client sectors. The Company’s principal subsidiaries include:
|
· |
Tradeweb LLC (“TWL”), a registered broker-dealer under the Securities Exchange Act of 1934, a member of the Financial Industry Regulatory Authority (“FINRA”), a registered independent introducing broker with the Commodities Future Trading Commission (“CFTC”) and a member of the National Futures Association (“NFA”). |
|
· |
Dealerweb Inc. (“DW”) (formerly known as Hilliard Farber & Co., Inc.). DW is a registered broker-dealer under the Securities Exchange Act of 1934 and a member of FINRA. DW is also registered as an introducing broker with the CFTC and NFA. |
|
· |
Tradeweb Direct LLC (“TWD”) (formerly known as BondDesk Trading LLC), a registered broker-dealer under the Securities Exchange Act of 1934 and a member of FINRA. |
|
· |
Tradeweb Europe Limited (“TEL”), a Multilateral Trading Facility regulated by the Financial Conduct Authority (the “FCA”) in the UK, which maintains branches in Asia which are regulated by certain Asian securities regulators. |
|
· |
TW SEF LLC (“TW SEF”), a Swap Execution Facility (“SEF”) regulated by the CFTC. |
|
· |
DW SEF LLC (“DW SEF”), a SEF regulated by the CFTC. |
|
· |
Tradeweb Japan K.K. (“TWJ”), a security house regulated by the Japanese Financial Services Agency (“JFSA”) and the Japan Securities Dealers Association (“JSDA”). |
124
|
· |
Tradeweb EU B.V. (“TWEU”), a Trading Venue and Approved Publication Arrangement regulated by the Netherlands Authority for the Financial Markets (“AFM”). |
Acquisition of Parent Company and Presentation of Financial Statements
A majority interest of Refinitiv (formerly the Thomson Reuters Financial & Risk Business) was acquired by BCP on October 1, 2018 (the “Refinitiv Transaction”) from Thomson Reuters Corporation (“TR”). The accompanying consolidated financial statements are presented for two periods: predecessor and successor, which relate to the periods preceding and succeeding the Refinitiv Transaction, respectively. The Refinitiv Transaction results in a new basis of accounting beginning on October 1, 2018 and the financial reporting periods are presented as follows:
|
· |
The successor period of the Company, reflecting the Refinitiv Transaction, as of and for the year ended December 31, 2019 and as of December 31, 2018 and for the period from October 1, 2018 to December 31, 2018 (the “2018 Successor Period”). |
|
· |
The predecessor period of the Company for the period from January 1, 2018 to September 30, 2018 (the “2018 Predecessor Period”) and the year ended December 31, 2017. |
See Note 3 – Pushdown Accounting.
Initial Public Offering
On April 8, 2019, the Corporation completed its IPO of 46,000,000 shares of Class A common stock, par value $0.00001 per share, of the Corporation (the “Class A common stock”) at a public offering price of $27.00, which included 6,000,000 shares of Class A common stock issued pursuant to the underwriters’ option to purchase additional shares of Class A common stock. The Corporation received $1.2 billion in net proceeds, after deducting underwriting discounts and commissions but before deducting offering expenses, which were used to purchase membership interests of TWM LLC from certain existing equity holders of TWM LLC (and the corresponding shares of common stock were cancelled as described below), at a purchase price per interest equal to the public offering price of $27.00, less the underwriting discounts and commissions payable thereon. See Note 11 – Stockholders’ Equity.
Reorganization Transactions
Prior to the closing of the IPO, a series of reorganization transactions (the “Reorganization Transactions”) was completed among the Corporation, TWM LLC and the owners of TWM LLC prior to the Reorganization Transactions (collectively, the “Original LLC Owners”), including the following parties:
certain investment and commercial banks (collectively, the “Bank Stockholders”);
members of management;
the Refinitiv Direct Owner, (i) prior to June 28, 2019, a direct subsidiary of Refinitiv that owned interests in an entity that held membership interests of TWM LLC prior to the Reorganization Transactions and contributed such entity to the Corporation (the “Refinitiv Contribution”) in exchange for shares of Class B common stock, par value $0.00001 per share, of the Corporation (the “Class B common stock”) in connection with the completion of the Reorganization Transactions and (ii) on and after June 28, 2019, an indirect subsidiary of Refinitiv that owns shares of the Corporation’s Class B common stock which shares were contributed by the direct subsidiary of Refinitiv referred to in the foregoing clause (i); and
an indirect subsidiary (the “Refinitiv LLC Owner” and, together with the Refinitiv Direct Owner, the “Refinitiv Owners”) of Refinitiv.
125
As used herein, references to “Continuing LLC Owners” refer collectively to (i) those Original LLC Owners, including the Refinitiv LLC Owner, certain Bank Stockholders and members of management, that continued to own LLC Interests (as defined below) after the completion of the IPO and Reorganization Transactions, that received shares of Class C common stock, par value $0.00001 per share, of the Corporation (the “Class C common stock”), shares of the Corporation’s Class D common stock or a combination of both, as the case may be, in connection with the completion of the Reorganization Transactions, and that may redeem or exchange their LLC Interests for shares of Class A common stock or Class B common stock and (ii) solely with respect to the Tax Receivable Agreement (as defined below), also includes those Original LLC Owners, including certain Bank Stockholders, that disposed of all of their LLC Interests for cash in connection with the IPO.
The following Reorganization Transactions occurred:
TWM LLC’s limited liability company agreement (the “TWM LLC Agreement”) was amended and restated to, among other things, (i) provide for a new single class of common membership interests in TWM LLC (“LLC Interests”), (ii) exchange all of the then existing membership interests in TWM LLC for LLC Interests and (iii) appoint the Corporation as the sole manager of TWM LLC. See Note 11 – Stockholders’ Equity.
The Corporation’s certificate of incorporation was amended and restated to, among other things, provide for Class A common stock, Class B common stock, Class C common stock and Class D common stock. See Note 11 – Stockholders’ Equity.
|
· |
The Corporation issued 20,000,000 shares of Class C common stock and 105,289,005 shares of Class D common stock to the Original LLC Owners that received LLC Interests on a one-to-one basis with the number of LLC Interests they owned immediately following the amendment and restatement of the TWM LLC Agreement for nominal consideration (and the Corporation subsequently cancelled 9,993,731 shares of such Class C common stock and 36,006,269 shares of such Class D common stock in connection with the Corporation’s purchase of LLC Interests from certain of the Bank Stockholders using the net proceeds of the IPO). |
|
· |
As a result of the Refinitiv Contribution (described above), the Corporation received 96,933,192 LLC Interests and the Refinitiv Direct Owner received 96,933,192 shares of Class B common stock. See Note 11 – Stockholders’ Equity. |
The Corporation’s board of directors adopted a new omnibus equity incentive plan, under which equity awards may be made in respect of shares of Class A common stock. It also assumed sponsorship of an option plan and PRSU plan formerly sponsored by TWM LLC. See Note 13 – Stock-Based Compensation Plans.
The Corporation entered into a tax receivable agreement (the “Tax Receivable Agreement”) with TWM LLC and the Continuing LLC Owners. See Note 10 – Tax Receivable Agreement.
LSEG Transaction
On August 1, 2019, London Stock Exchange Group plc announced that it has agreed to definitive terms with a consortium including certain investment funds affiliated with Blackstone as well as TR to acquire the Refinitiv business in an all share transaction (the “LSEG Transaction”). The LSEG Transaction is subject to customary regulatory approvals and closing conditions, and is expected to close during the second half of 2020..
126
2. Significant Accounting Policies
The following is a summary of significant accounting policies:
Basis of Accounting
The consolidated financial statements have been presented in conformity with accounting principles generally accepted in the United States of America.
Use of Estimates
The preparation of financial statements in conformity with accounting principles generally accepted in the United States of America requires management to make estimates and assumptions that affect the reported amounts of assets and liabilities and disclosures of contingent assets and liabilities at the date of the consolidated financial statements and the reported amounts of revenues and expenses during the reporting period. Actual results could differ from those estimates and the difference may be material to the consolidated financial statements.
Basis of Presentation and Consolidation
The consolidated financial statements include the accounts of the Company and its subsidiaries. All intercompany transactions and balances have been eliminated in consolidation.
As discussed in Note 1—Organization, as a result of the Reorganization Transactions, Tradeweb Markets Inc. consolidates TWM LLC and TWM LLC is considered to be the predecessor to Tradeweb Markets Inc. for financial reporting purposes. As a result, the consolidated financial statements for periods prior to the Reorganization Transactions have been adjusted to combine the previously separate entities for presentation purposes. However, Tradeweb Markets Inc. had no business transactions or activities and no substantial assets or liabilities prior to the Reorganization Transactions. As such, for periods prior to the completion of the Reorganization Transactions, the consolidated financial statements represent the historical financial condition and results of operations of TWM LLC and its subsidiaries. For periods after the completion of the Reorganization Transactions, the consolidated financial statements represent the financial condition and results of operations of the Company and report a non-controlling interest related to the LLC Interests held by the other members of TWM LLC.
Cash and Cash Equivalents
Cash and cash equivalents consists of cash and highly liquid investments (such as short-term money market instruments) with original maturities of less than three months.
Allowance for Doubtful Accounts
The Company continually monitors collections and payments from its clients and maintains an allowance for doubtful accounts. The allowance for doubtful accounts is based upon the historical collection experience and specific collection issues that have been identified. Additions, if any, to the allowance for doubtful accounts are charged to bad debt expense, which is included in general and administrative expenses on the consolidated statements of income.
Receivable from and Payable to Brokers and Dealers and Clearing Organizations
Receivable from and payable to brokers and dealers and clearing organizations consists of proceeds from transactions which failed to settle due to the inability of a transaction party to deliver or receive the transacted security. These securities transactions are generally collateralized by those securities.
At times, transactions executed on the Company’s wholesale platform fail to settle due to the inability of a transaction party to deliver or receive the transacted security. Until the failed transaction settles, a receivable from (and a matching payable to) brokers and dealers and clearing organizations is recognized for the proceeds from the unsettled transaction.
127
Deposits with Clearing Organizations
Deposits with clearing organizations are comprised of cash deposits. Due to the short-term nature of these deposits, the recorded value has been determined to approximate fair value.
Furniture, Equipment, Purchased Software and Leasehold Improvements
Furniture, equipment, purchased software and leasehold improvements are carried at cost less accumulated depreciation. Depreciation for furniture, equipment and purchased software, including the allocated fair value of assets as a result of pushdown accounting (see Note 3 – Pushdown Accounting), is computed on a straight-line basis over the estimated useful lives of the related assets, ranging from three to seven years. Leasehold improvements are amortized over the lesser of the estimated useful lives of the leasehold improvements or the remaining term of the lease for office space.
Furniture, equipment, purchased software and leasehold improvements are tested for impairment whenever events or changes in circumstances suggest that an asset’s carrying value may not be fully recoverable in accordance with Accounting Standards Codification (“ASC”) 360, Property, Plant and Equipment.
Software Development Costs
The Company capitalizes costs associated with the development of internal use software at the point at which the conceptual formulation, design and testing of possible software project alternatives have been completed, in accordance with ASC 350. The Company capitalizes employee compensation and related benefits and third party consulting costs incurred during the application development stage which directly contribute to such development. Such costs are amortized on a straight-line basis over three years. Costs capitalized as part of the pushdown accounting allocation (see Note 3 – Pushdown Accounting) are amortized over nine years. The Company reviews the amounts capitalized for impairment whenever events or changes in circumstances indicate that the carrying amounts of the assets may not be fully recoverable, or that their useful lives are shorter than originally expected. Non-capitalized software costs and routine maintenance costs are expensed as incurred.
Goodwill
Goodwill is the excess of the fair value of the Company above the fair value accounting basis of the net assets and liabilities of the Company under pushdown accounting. Goodwill is also the cost of acquired companies in excess of the fair value of identifiable net assets at the acquisition date. Goodwill is not amortized, but in accordance with ASC 350, goodwill is tested for impairment annually and between annual tests whenever events or changes in circumstances indicate that the carrying amount may not be fully recoverable. Goodwill is tested at the reporting unit level, which is defined as an operating segment or one level below the operating segment. An impairment loss is recognized if the estimated fair value of a reporting unit is less than its net book value. Such loss is calculated as the difference between the estimated fair value of goodwill and its carrying value.
In 2019, the Company changed the annual date on which goodwill is tested for impairment from July 1st to October 1st to align with the annual impairment testing date of the Company’s Parent. This change did not accelerate, delay, avoid or cause an impairment charge, nor did this change result in adjustments to any previously issued financial statements. Goodwill was last assessed on October 1, 2019.
Intangible Assets
Intangible assets with a finite life are amortized over the estimated lives, ranging from seven to sixteen years, in accordance with ASC 350. Intangible assets subject to amortization are tested for impairment whenever events or changes in circumstances suggest that an asset's or asset group's carrying value may not be fully recoverable in accordance with ASC 360. Intangible assets with an indefinite useful life are tested for impairment at least annually. An impairment loss is recognized if the sum of the estimated discounted cash flows relating to the asset or asset group is less than the corresponding book value.
128
IPO and Follow-On Offering Costs
The Company began incurring costs in connection with the filing of a Registration Statement on Form S-1 for an IPO and a Registration Statement on Form S-1 for a follow-on offering in 2018 and in the third quarter of 2019, respectively. IPO and follow-on offering costs consist of legal, accounting, and other costs directly related to the Company’s efforts to raise capital. In accordance with ASC 505-10-25, Equity, these costs are recognized in additional paid-in capital within the consolidated statements of financial condition when the offering is effective. As of December 31, 2019, $15.9 million of deferred costs related to the IPO and $2.6 million of deferred costs related to the follow-on offering were recognized in additional paid-in capital in the consolidated statements of financial condition. See Note 11 – Stockholders’ Equity.
Translation of Foreign Currency
Revenues and expenses denominated in foreign currencies are translated at the rate of exchange prevailing at the transaction date. Assets and liabilities denominated in foreign currencies are translated at the rate prevailing at the consolidated statements of financial condition date. Foreign currency re-measurement gains or losses on transactions in nonfunctional currencies are recognized in the consolidated statements of income. Gains or losses on translation in the financial statements of a non-U.S. operation, when the functional currency is other than the U.S. dollar, are included as a component of comprehensive income.
Income Tax
The Corporation is subject to U.S. federal, state and local income taxes with respect to its taxable income, including its allocable share of any taxable income of TWM LLC, and is taxed at prevailing corporate tax rates. TWM LLC is a multiple member limited liability company taxed as a partnership and accordingly any taxable income generated by TWM LLC is passed through to and included in the taxable income of its members, including the Corporation, on a pro rata basis. Income taxes also include unincorporated business taxes on income earned or losses incurred for conducting business in certain state and local jurisdictions, income taxes on income earned or losses incurred in foreign jurisdictions on certain operations and federal and state income taxes on income earned or losses incurred, both current and deferred, on subsidiaries that are taxed as corporations for U.S. tax purposes.
The Company records deferred tax assets and liabilities for the expected future tax consequences of temporary differences between the financial reporting and tax bases of assets and liabilities. The Company measures deferred taxes using the enacted tax rates and laws that will be in effect when such temporary differences are expected to reverse. Based on the weight of the positive and negative evidence considered, management believes that it is more likely than not that the Company will be able to realize its deferred tax assets in the future, therefore, no valuation allowance is necessary.
The Company records uncertain tax positions in accordance with ASC 740, Income Taxes on the basis of a two-step process whereby (i) the Company determines whether it is more likely than not that the tax positions will be sustained on the basis of the technical merits of the position and (ii) for those tax positions that meet the more-likely-than-not recognition threshold, the Company recognizes the amount of tax benefit that is more than 50 percent likely to be realized upon ultimate settlement with the related tax authority.
The Company recognizes interest and penalties related to income taxes within the provision for income taxes in the consolidated statements of income. Accrued interest and penalties are included within accounts payable, accrued expenses and other liabilities in the consolidated statements of financial condition.
The Company has elected to treat taxes due on future U.S. inclusions in taxable income under the global intangible low-taxed income (“GILTI”) provision of the Tax Cuts and Jobs Act as a current period expense when incurred.
Deferred Tax Asset Correction
129
During the fourth quarter of 2019, the Company identified and corrected immaterial errors in the calculation of the deferred tax asset associated with the Reorganization Transactions that reduced additional paid-in-capital by $10.2 million and, reduced the deferred tax asset by $10.2 million. This correction relates to immaterial errors associated with inputs (including estimates) used in the calculation of the deferred tax balances related to the Refinitiv Contribution. This correction, if it had been recorded in the interim periods of 2019, would have reduced additional paid-in capital by $10.2 million and reduced the deferred tax asset by $10.2 million at June 30, 2019 and September 30, 2019 and would not have had a material impact on our net assets and would not have had a material impact on our consolidated results of operations or cash flows.
Revenue Recognition
The Company earns transaction fees from transactions executed on the Company’s trading platforms through various fee plans. Transaction fees are generated both on a variable and fixed price basis and vary by geographic region, product type and trade size. For variable transaction fees, the Company charges clients fees based on the mix of products traded and the volume of transactions executed. Transaction fee revenue is recorded at a point in time when the trade occurs and is generally billed monthly.
The Company earns subscription fees from granting access to institutional investors to the Company's electronic marketplaces. Subscription fees are recognized into income in the period that access is provided. Also included in subscription fees are viewer fees from institutional investors accessing fixed income market data. The frequency of subscription fee billings varies from monthly to annually, depending on contract terms. Fees received by the Company which are not yet earned are included in deferred revenue on the consolidated statements of financial condition until the revenue recognition criteria has been met.
The Company earns commission revenue from its electronic and voice brokerage services on a riskless principal basis. Riskless principal revenues are derived on matched principal transactions where revenues are earned on the spread between the buy and sell price of the transacted product. Securities transactions and related commission revenue for brokerage transactions are recognized and recorded on a trade-date basis. Commission revenue is collected by the Company when the trade settles or is billed monthly.
The Company earns fees from Refinitiv, formerly TR in the predecessor periods, relating to the sale of market data to Refinitiv, which redistributes that data. Included in these fees, which are billed quarterly, are real-time market data fees which are recognized in the period that the data is provided, generally on a monthly basis and historical data sets which are recognized when the historical data set is provided to Refinitiv.
On January 1, 2018, the Company adopted ASU 2014-09, Revenue from Contracts with Customers, using the modified retrospective approach. The adoption of ASU 2014-09 did not have a material impact on the measurement or recognition of revenue in any prior reporting periods. However, subsequent to the adoption, the Company was required to make significant judgements for the Refinitiv market data fees. Significant judgements used in accounting for this contract include:
|
· |
The provision of real-time market data feeds and annual historical data sets are distinct performance obligations. |
|
· |
The performance obligations under this contract are recognized over time from the initial delivery of the data feeds or each historical data set until the end of the contract term. |
|
· |
Determining the transaction price for the performance obligations by using a market assessment analysis. Inputs in this analysis include a consultant study which determined the overall value of the Company's market data and pricing information for historical data sets provided by other companies. |
Some revenues earned by the Company have fixed fee components, such as monthly minimums or fixed monthly fees, and variable components, such as transaction-based fees. The breakdown of revenues between fixed and variable
130
revenues, in thousands, for the year ended December 31, 2019, the 2018 Successor Period and the 2018 Predecessor Period is as follows:
|
|
|
Successor |
|
Successor |
|
|
Predecessor |
||||||||||||
|
|
|
Year Ended |
|
October 1, 2018 to |
|
|
January 1, 2018 to |
||||||||||||
|
|
|
December 31, 2019 |
|
December 31, 2018 |
|
|
September 30, 2018 |
||||||||||||
|
|
|
|
|
|
|
|
|
(in thousands) |
|||||||||||
|
|
|
Variable |
|
Fixed |
|
Variable |
|
Fixed |
|
|
Variable |
|
Fixed |
||||||
|
Revenues |
|
|
|
|
|
|
|
|
|
|
|
|
|
|
|
|
|
|
|
|
Transaction fees |
|
$ |
325,178 |
|
$ |
98,405 |
|
$ |
73,800 |
|
$ |
23,330 |
|
|
$ |
208,049 |
|
$ |
65,702 |
|
Subscription Fees including Refinitiv market data fees |
|
|
1,736 |
|
|
192,630 |
|
|
425 |
|
|
46,094 |
|
|
|
1,305 |
|
|
142,676 |
|
Commissions |
|
|
109,995 |
|
|
39,370 |
|
|
22,608 |
|
|
10,232 |
|
|
|
49,367 |
|
|
30,463 |
|
Other |
|
|
834 |
|
|
7,418 |
|
|
— |
|
|
2,148 |
|
|
|
40 |
|
|
8,169 |
|
Gross revenue |
|
$ |
437,743 |
|
$ |
337,823 |
|
$ |
96,833 |
|
$ |
81,804 |
|
|
$ |
258,761 |
|
$ |
247,010 |
Stock-Based Compensation
The Company accounts for stock-based compensation in accordance with ASC 718, Compensation – Stock Compensation. ASC 718 focuses primarily on accounting for a transaction in which an entity obtains employee services in exchange for stock-based payments. Under ASC 718, the stock-based payments received by the employees of the Company are accounted for either as equity awards or as liability awards.
As an equity award, the Company measures and recognizes the cost of employee services received in exchange for awards of equity instruments based on their estimated fair values measured as of the grant date. These costs are recognized as an expense over the requisite service period, with an offsetting increase to additional paid-in capital.
As a liability award, the cost of employee services received in exchange for an award of equity instruments is generally measured based on the grant-date fair value of the award. The fair value of that award is remeasured subsequently at each reporting date through the settlement in accordance with ASC 505. Changes in the equity instrument's fair value during the requisite service period are recognized as compensation cost over that period.
For periods following the Reorganization Transactions and the IPO, the fair value of new equity instrument grants is determined based on the price of the Company’s Class A common stock on the grant date.
Under ASC 718, the grant-date fair value of stock-based awards that do not require future service (i.e., vested awards) are expensed immediately. The grant-date fair value of stock-based awards that require future service, and are graded-vesting awards, are amortized over the relevant service period on a straight-line basis, with each tranche separately measured. The grant-date fair value of stock-based awards that require both future service and the achievement of Company performance-based conditions, are amortized over the relevant service period for the performance-based condition. If in a reporting period it is determined that the achievement of a performance target for a performance-based tranche is not probable, then no expense is recognized for that tranche and any expenses already recognized relating to that tranche in prior reporting periods are reversed in the current reporting period.
Prior to the IPO, the Company awarded options to management and other employees (collectively, the “Special Option Award”) under the Amended and Restated Tradeweb Markets Inc. Option Plan (the “Option Plan”). In accounting for the options issued under the Option Plan, or which may be issued under the Tradeweb Markets Inc. 2019 Omnibus Equity Incentive Plan (the “Omnibus Equity Plan”) in the future, compensation expense is measured and recognized for all awards based on their estimated fair values measured as of the grant date. Costs related to these options are recognized as an expense in the consolidated statements of income over the requisite service period, with an offsetting increase to additional paid-in capital. In conjunction with the IPO, the non-cash stock-based compensation expense associated with the Special Option Award began being expensed in the second quarter of 2019 and will continue to be expensed over the following three years.
131
Determining the appropriate fair value model and calculating the fair value of the stock-based awards requires the input of highly subjective assumptions, including the expected life of the stock-based awards and the stock price volatility. The Company uses the Black-Scholes pricing model to value some of its stock-based awards. Application of alternative assumptions could produce significantly different estimates of the fair value of stock-based compensation and consequently, the related amounts recognized in the Company’s consolidated statements of income.
Earnings Per Share
Basic earnings per share is computed by dividing the net income attributable to the Company's shares by the weighted-average number of the Company's shares outstanding during the period. For purposes of computing diluted earnings per share, the weighted-average number of the Company’s shares reflects the dilutive effect that could occur if securities that qualify as participating securities were converted into or exchanged or exercised for TWM LLC’s shares, in the pre-IPO period, and the Class A or Class B common stock, in the post-IPO period, using the treasury stock method, as applicable.
Shares of Class C and Class D common stock do not have economic rights in Tradeweb Markets Inc. and, therefore, are not included in the calculation of basic earnings per share and are not participating securities for purposes of the computation of diluted earnings per share.
Fair Value Measurement
The fair value of a financial instrument is the amount that would be received to sell an asset or paid to transfer a liability in an orderly transaction between market participants at the measurement date (the exit price). Instruments that the Company owns (long positions) are marked to bid prices, and instruments that the Company has sold, but not yet purchased (short positions) are marked to offer prices. Fair value measurements do not include transaction costs.
The fair value hierarchy under ASC 820, Fair Value Measurements prioritizes the inputs to valuation techniques used to measure fair value. The hierarchy gives the highest priority to unadjusted quoted prices in active markets for identical assets or liabilities (level 1 measurements) and the lowest priority to unobservable inputs (level 3 measurements). The three levels of the fair value hierarchy under ASC 820 are described below:
Basis of Fair Value Measurement
Level 1:Unadjusted quoted prices in active markets that are accessible at the measurement date for identical, unrestricted assets or liabilities;
Level 2: Quoted prices in markets that are not considered to be active or financial instruments for which all significant inputs are observable, either directly or indirectly;
Level 3: Prices or valuations that require inputs that are both significant to the fair value measurement and unobservable.
A financial instrument's level within the fair value hierarchy is based on the lowest level of any input that is significant to the fair value measurement.
Recent Accounting Pronouncements –Adopted
In June 2016, the Financial Accounting Standards Board (“FASB”) issued ASU 2016‑13, Financial Instruments – Credit Losses. The ASU provides new guidance for estimating credit losses on certain types of financial instruments by introducing an approach based on expected losses. This requires a modified retrospective method of adoption. ASU 2017-04 was adopted on January 1, 2020. The adoption of this ASU did not have a material impact on the Company’s consolidated financial statements.
In January 2017, the FASB issued ASU 2017‑04, Intangibles – Goodwill and Other. The ASU simplifies the quantitative goodwill impairment test by eliminating the second step of the test. Under this ASU, impairment will be measured by
132
comparing the estimated fair value of the reporting unit with its carrying value. The new guidance does not amend the optional qualitative assessment of goodwill impairment. This new guidance was adopted on January 1, 2020 and had no impact on the Company’s financial statements.
In December 2019, the FASB issued ASU 2019-12, Income Taxes (Topic 740): Simplifying the Accounting for Income Taxes. The amendments in this ASU simplify the accounting for income taxes by removing certain exceptions for investments, intraperiod allocations and interim calculations and include additional guidance in order to reduce complexity in accounting for income taxes. ASU 2019-12 is effective for annual periods beginning after December 15, 2020, with early adoption permitted. This new guidance was early adopted on January 1, 2020 and the adoption of this ASU did not have a material impact on the Company’s consolidated financial statements.
In February 2016, the FASB issued ASU 2016-02, Leases (Topic 842), which requires lessees to recognize a right-of-use asset and a lease liability for all leases with an initial term in excess of twelve months. The asset reflects the present value of unpaid lease payments coupled with initial direct costs, prepaid lease payments and lease incentives. The amount of the lease liability is calculated as the present value of unpaid lease payments. ASU 2016-02 was adopted on January 1, 2019 using the modified retrospective method of adoption. Upon adoption, the Company:
|
· Recorded right-of-use assets of $34.8 million, |
|
· Recorded a lease liability of $39.6 million, |
|
· Eliminated deferred rent of $4.9 million, |
|
· Eliminated leasehold interests of $2.9 million, |
|
· |
Elected to take the optional package of practical expedients, which allows for no reassessment of |
|
i. |
whether any expired or existing contracts are or contain leases, |
|
ii. |
the lease classification for any expired or existing leases, and |
|
iii. |
initial direct costs for any existing leases. |
The Refinitiv Transaction was accounted for by Refinitiv in accordance with the acquisition method of accounting pursuant to ASC 805, and pushdown accounting was applied to Refinitiv to record the fair value of the assets and liabilities of Refinitiv as of October 1, 2018, the date of the Refinitiv Transaction. The Company, as a consolidating subsidiary of Refinitiv, also accounted for the Refinitiv Transaction using pushdown accounting. Under pushdown accounting, the excess of the fair value of the Company above the fair value accounting basis of the net assets and liabilities of the Company is recorded as goodwill. The fair value of assets acquired and liabilities assumed was determined based on assumptions that reasonable market participants would use in the principal (or most advantageous) market for the asset or liability.
The adjusted valuations resulted in an increase in depreciation and amortization expense, due to the increased carrying value of the Company’s assets and the related increase in depreciation of tangible assets and amortization of intangible assets, and a decrease in occupancy expense as a result of the recognition of a leasehold interest liability.
A fair value of $168.5 million was also assigned to software development costs of the Company. The excess of the fair value of the Company above the fair value accounting basis of the net assets and liabilities of the Company was recorded as goodwill.
The allocation applying pushdown accounting as of October 1, 2018 is summarized in the table below (in thousands):
|
Fair Value of the Company's Net Assets |
|
$ |
4,575,000 |
|
Carrying Value of the Company's Net Assets |
|
|
1,880,203 |
|
Goodwill |
|
$ |
2,694,797 |
At December 31, 2019 and December 31, 2018, goodwill amounted to $2.7 billion.
133
4. Intangible Assets and Goodwill
Intangible assets and goodwill relate to the allocation of purchase price associated with the Refinitiv Transaction (see Note 3 – Pushdown Accounting).
The following is a summary of intangible assets which have an indefinite useful life at both December 31, 2019 and 2018 (in thousands):
|
|
|
Amount |
|
|
Licenses |
|
$ |
168,800 |
|
Tradename |
|
|
154,300 |
|
Total |
|
$ |
323,100 |
Intangible assets that are subject to amortization, including the related accumulated amortization, are comprised as follows (in thousands):
|
|
|
|
|
Successor |
|
Successor |
||||||||||||||
|
|
|
|
|
December 31, 2019 |
|
December 31, 2018 |
||||||||||||||
|
|
|
Amortization |
|
|
|
|
Accumulated |
|
Net Carrying |
|
|
|
|
Accumulated |
|
Net Carrying |
||||
|
|
|
Period |
|
Cost |
|
Amortization |
|
Amount |
|
Cost |
|
Amortization |
|
Amount |
||||||
|
Customer relationships |
|
12 Years |
|
$ |
928,200 |
|
$ |
(96,687) |
|
$ |
831,513 |
|
$ |
928,200 |
|
$ |
(19,338) |
|
$ |
908,862 |
|
Content and data |
|
7 Years |
|
|
154,400 |
|
|
(27,572) |
|
|
126,828 |
|
|
154,400 |
|
|
(5,514) |
|
|
148,886 |
|
|
|
|
|
$ |
1,082,600 |
|
$ |
(124,259) |
|
$ |
958,341 |
|
$ |
1,082,600 |
|
$ |
(24,852) |
|
$ |
1,057,748 |
Amortization expense relating to intangible assets was $99.4 million year ended December 31, 2019. Amortization expense relating to intangible assets for the 2018 Successor Period and the 2018 Predecessor Period was $24.9 million and $19.6 million, respectively.
The estimated annual future amortization for existing intangible assets through December 31, 2024 is as follows (in thousands):
|
|
|
Amount |
|
|
2020 |
|
$ |
99,408 |
|
2021 |
|
|
99,408 |
|
2022 |
|
|
99,408 |
|
2023 |
|
|
99,408 |
|
2024 |
|
|
99,408 |
Effective January 1, 2019, the Company adopted ASC 842, Leases. This standard requires the Company to recognize a right-of-use asset and a lease liability for all leases with an initial term in excess of twelve months. The Company includes the term covered by an option to extend a lease when the option is reasonably certain to be exercised. The asset reflects the present value of unpaid lease payments coupled with initial direct costs, prepaid lease payments and lease incentives. The amount of the lease liability is calculated as the present value of unpaid lease payments. The Company adopted ASC 842 using a modified retrospective approach and did not restate comparative periods. The Company elected to take the package of practical expedients allowing the Company to not reassess (i) whether any expired or existing contracts are or contain leases, (ii) the lease classification for any expired or existing leases and (iii) initial direct costs for any existing leases. The Company has elected to account for nonlease components in a contract as part of the single lease component to which they are related.
Significant assumptions and judgements in calculating the right-of-use assets and lease liability include the determination of the applicable borrowing rate for each lease.
134
On January 1, 2019, upon the adoption of ASC 842, the Company recorded, for office space and data center leases in the U.S. and U.K., right-of-use assets of $31.8 million, lease liabilities of $39.6 million and eliminated deferred rent of $4.9 million and leasehold interests of $2.9 million. The leases have initial lease terms ranging from three to 11 years.
Activity related to the Company's leases for the year ended December 31, 2019 is as follows (in thousands):
|
|
|
Year Ended |
|
|
|
|
December 31, |
|
|
|
|
2019 |
|
|
Operating lease expense |
|
$ |
10,265 |
|
Cash for amounts included in the measurement of operating liability |
|
$ |
11,667 |
|
Right-of-use assets obtained in exchange for operating liabilities |
|
$ |
— |
At December 31, 2019, the weighted average borrowing rate and weighted average lease term are as follows:
|
|
|
Amount |
|
|
Weighted average borrowing rate |
|
2.9 |
% |
|
Weighted average remaining lease term (years) |
|
5.9 |
|
The following table presents the maturity of lease liabilities as of December 31, 2019 (in thousands):
|
|
|
Amount |
|
|
2020 |
|
$ |
8,516 |
|
2021 |
|
|
5,946 |
|
2022 |
|
|
4,143 |
|
2023 |
|
|
3,956 |
|
2024 |
|
|
3,558 |
|
Thereafter |
|
|
7,633 |
|
Total future lease payments |
|
|
33,752 |
|
Less imputed interest |
|
|
(2,797) |
|
Lease liability |
|
$ |
30,955 |
At December 31, 2019, the future minimum lease payments were as follows (in thousands):
|
|
|
Amount |
|
|
2020 |
|
$ |
8,516 |
|
2021 |
|
|
5,946 |
|
2022 |
|
|
4,143 |
|
2023 |
|
|
3,956 |
|
2024 |
|
|
3,558 |
|
Thereafter |
|
|
7,633 |
|
Total |
|
$ |
33,752 |
At December 31, 2018, the future minimum lease payments were as follows (in thousands):
|
|
|
Amount |
|
|
2019 |
|
$ |
11,393 |
|
2020 |
|
|
7,580 |
|
2021 |
|
|
5,317 |
|
2022 |
|
|
4,051 |
|
2023 |
|
|
3,877 |
|
Thereafter |
|
|
11,156 |
|
Total |
|
$ |
43,374 |
135
Rent expense amounted to $2.7 million, $9.0 million and $11.8 million for the 2018 Successor Period, 2018 Predecessor Period and the year ended December 31, 2017, respectively.
One U.S. lease is secured by a letter of credit in the amount of $1.2 million, which is guaranteed by Refinitiv.
Cash has been segregated in a special reserve bank account for the benefit of brokers and dealers under SEC Rule 15c3-3. The Company computes the proprietary accounts of other broker-dealers (“PAB”) reserve, which requires the Company to maintain minimum segregated cash in the amount of total credits per the reserve computation. As of December 31, 2019 and December 31, 2018, cash in the amount of $1.0 million and $1.2 million, respectively, has been segregated in the PAB reserve account exceeding the requirements pursuant to SEC Rule 15c3-3.
The Company records deferred revenue when cash payments are received or due in advance of services to be performed. The recognized revenue and remaining balance is shown below (in thousands):
|
|
|
Amount |
|
|
Deferred revenue balance - December 31, 2018 |
|
$ |
27,883 |
|
New billings |
|
|
106,153 |
|
Revenue recognized |
|
|
(110,046) |
|
Deferred revenue balance - December 31, 2019 |
|
$ |
23,990 |
The components of Software development costs, net of accumulated amortization are as follows (in thousands):
|
|
|
Successor |
|
Successor |
||
|
|
|
|
Year Ended |
|
|
Year Ended |
|
|
|
|
December 31, |
|
|
December 31, |
|
|
|
|
2019 |
|
|
2018 |
|
Software development costs |
|
$ |
204,336 |
|
$ |
175,656 |
|
Accumulated amortization |
|
|
(31,250) |
|
|
(5,074) |
|
Software development costs, net of accumulated amortization |
|
$ |
173,086 |
|
$ |
170,582 |
Capitalized software development costs and non-capitalized software costs and routine maintenance costs are as follows (in thousands):
|
|
|
Successor |
|
Successor |
|
Predecessor |
|
Predecessor |
||||
|
|
|
|
Year Ended |
|
|
October 1, 2018 |
|
|
January 1, 2018 |
|
|
Year Ended |
|
|
|
|
December 31, |
|
|
to |
|
|
to |
|
|
December 31, |
|
|
|
|
2019 |
|
|
December 31, 2018 |
|
|
September 30, 2018 |
|
|
2017 |
|
Software development costs capitalized |
|
$ |
26,681 |
|
$ |
7,156 |
|
$ |
19,523 |
|
$ |
27,157 |
|
Amortization expense related to capitalized software development costs |
|
$ |
26,176 |
|
$ |
5,074 |
|
$ |
19,962 |
|
$ |
25,420 |
Non-capitalized software costs and routine maintenance costs are expensed as incurred and are included in employee compensation and benefits and professional fees on the consolidated statements of income.
For the year ended December 31, 2019, total income before the provision for income taxes amounted to $225.3 million, consisting of $207.7 million in the United States and $17.6 million in foreign locations.
136
The provision for income taxes consists of the following (in thousands):
|
|
|
Successor |
|
Successor |
|
|
Predecessor |
|
Predecessor |
||||
|
|
|
Year Ended |
|
October 1, 2018 to |
|
|
January 1, 2018 to |
|
Year Ended |
||||
|
|
|
December 31, |
|
December 31, |
|
|
September 30, |
|
December 31, |
||||
|
|
|
2019 |
|
2018 |
|
|
2018 |
|
2017 |
||||
|
Current: |
|
|
|
|
|
|
|
|
|
|
|
|
|
|
Federal |
|
$ |
21,373 |
|
$ |
— |
|
|
$ |
— |
|
$ |
— |
|
State and Local |
|
|
11,537 |
|
|
1,235 |
|
|
|
5,739 |
|
|
4,331 |
|
Foreign |
|
|
4,368 |
|
|
1,212 |
|
|
|
3,559 |
|
|
2,748 |
|
Total current tax expense |
|
|
37,278 |
|
|
2,447 |
|
|
|
9,298 |
|
|
7,079 |
|
Deferred: |
|
|
|
|
|
|
|
|
|
|
|
|
|
|
Federal |
|
|
(88) |
|
|
680 |
|
|
|
1,085 |
|
|
(433) |
|
State and local |
|
|
18,194 |
|
|
288 |
|
|
|
1,517 |
|
|
(517) |
|
Foreign |
|
|
(3,082) |
|
|
— |
|
|
|
— |
|
|
— |
|
Total deferred tax expense |
|
|
15,024 |
|
|
968 |
|
|
|
2,602 |
|
|
(950) |
|
Total provision for income taxes |
|
$ |
52,302 |
|
$ |
3,415 |
|
|
$ |
11,900 |
|
$ |
6,129 |
A reconciliation of the statutory tax rate to the effective rate is as follows:
|
|
|
Successor |
|
Successor |
|
|
Predecessor |
|
Predecessor |
|
||||
|
|
|
Year Ended |
|
October 1, 2018 to |
|
|
January 1, 2018 to |
|
Year Ended |
|
||||
|
|
|
December 31, |
|
December 31, |
|
|
September 30, |
|
December 31, |
|
||||
|
|
|
2019 |
|
2018 |
|
|
2018 |
|
2017 |
|
||||
|
Statutory U.S. federal income tax rate |
|
|
21.0 |
% |
|
21.0 |
% |
|
|
21.0 |
% |
|
35.0 |
% |
|
State and local income taxes, net of federal income tax benefit |
|
|
3.9 |
|
|
4.7 |
|
|
|
5.1 |
|
|
2.8 |
|
|
Foreign tax rate differential |
|
|
(1.1) |
|
|
3.7 |
|
|
|
2.5 |
|
|
3.1 |
|
|
Tax Cuts and Jobs Act Provisional Tax Charge |
|
|
— |
|
|
— |
|
|
|
— |
|
|
2.2 |
|
|
LLC flow-through structure |
|
|
— |
|
|
(19.0) |
|
|
|
(20.2) |
|
|
(36.3) |
|
|
Non-Controlling Interest |
|
|
(7.2) |
|
|
— |
|
|
|
— |
|
|
— |
|
|
Tax Receivable Agreement adjustment |
|
|
(3.1) |
|
|
— |
|
|
|
— |
|
|
— |
|
|
Rate Change |
|
|
10.2 |
|
|
— |
|
|
|
— |
|
|
— |
|
|
Other |
|
|
(0.5) |
|
|
— |
|
|
|
— |
|
|
— |
|
|
Effective income tax rate |
|
$ |
23.2 |
% |
$ |
10.4 |
% |
|
$ |
8.4 |
% |
$ |
6.8 |
% |
The Company’s consolidated effective tax rate for the year-ended December 31, 2019 was 23.2% as compared to 10.4% in the 2018 Successor Period and 8.4% in the 2018 Predecessor period. The effective tax rate increased from prior periods due to the Reorganization Transactions. Prior to the Reorganization Transactions, income taxes consisted only of business taxes incurred by TWM LLC and certain subsidiaries for business conducted in certain state, local and foreign jurisdictions as well as federal, state and local taxes for certain subsidiaries that are taxed as corporations for U.S. tax purposes. As a result of the Reorganization Transactions, the Corporation is subject to U.S. federal, state and local income taxes with respect to its taxable income, including its allocable share of any taxable income of TWM LLC, and is taxed at prevailing corporate tax rates. The Company’s actual effective tax rate will be impacted by the Corporation’s ownership share of TWM LLC, which is expected to increase over time as the Continuing LLC Owners redeem or exchange their LLC Interests for shares of Class A common stock or Class B common stock, as applicable, or the Corporation purchases LLC Interests from the Continuing LLC Owners. In addition to the Reorganization Transactions, the tax impact of rate changes on total tax expense was 10.2% in 2019 due to the reduction of the Company’s net deferred tax asset.
The Company's consolidated effective tax rate will also vary from period to period depending on changes in the geographic mix of its earnings and changes in tax legislation and tax rates.
137
The components of the Company’s net deferred tax asset (liability) are as follows (in thousands):
|
|
|
Successor |
|
Successor |
||
|
|
|
Year Ended |
|
Year Ended |
||
|
|
|
December 31, |
|
December 31, |
||
|
|
|
2019 |
|
2018 |
||
|
Deferred tax assets: |
|
|
|
|
|
|
|
Investment in partnership |
|
$ |
226,241 |
|
$ |
— |
|
Net operating losses |
|
|
1,753 |
|
|
6,810 |
|
Tax Receivable Agreement - Interest |
|
|
10,395 |
|
|
— |
|
Employee compensation |
|
|
9,888 |
|
|
— |
|
Credits |
|
|
8,342 |
|
|
— |
|
Other |
|
|
4,088 |
|
|
2,362 |
|
Deferred tax assets, gross |
|
|
260,707 |
|
|
9,172 |
|
Valuation Allowance |
|
|
— |
|
|
— |
|
Total deferred tax assets, net |
|
|
260,707 |
|
|
9,172 |
|
|
|
|
|
|
|
|
|
Deferred tax liabilities |
|
|
|
|
|
|
|
Goodwill and Intangibles |
|
|
(25,829) |
|
|
(28,799) |
|
Total deferred tax liabilities |
|
|
(25,829) |
|
|
(28,799) |
|
|
|
|
|
|
|
|
|
Total net deferred tax asset (liability) |
|
$ |
234,878 |
|
$ |
(19,627) |
The Company expects to obtain an increase in its share of the tax basis of the assets of TWM LLC when LLC Interests are redeemed or exchanged by the Continuing LLC Owners and in connection with certain other qualifying transactions. This increase in tax basis may have the effect of reducing the amounts that the Corporation would otherwise pay in the future to various tax authorities. Pursuant to the Tax Receivable Agreement, the Corporation is required to make cash payments to the Continuing LLC Owners equal to 50% of the amount of U.S. federal, state and local income or franchise tax savings, if any, that the Corporation actually realizes (or in some circumstances are deemed to realize) as a result of certain future tax benefits to which we may become entitled. The Corporation expects to benefit from the remaining 50% of tax benefits, if any, that the Corporation may actually realize. See Note 10 – Tax Receivable Agreement. As a result of the reorganization transactions, the IPO, the October 2019 follow-on offering and LLC Interest ownership changes during the year ended December 31, 2019, the Company assumed a deferred tax benefit of $216.2 million, primarily due to an increase in amortizable tax basis that will be amortized primarily over 15 years pursuant to Section 197 of the Internal Revenue Code of 1986, as amended, offset by other factors. The tax benefit has been recognized in deferred tax asset on the December 31, 2019 consolidated statement of financial condition.
As of December 31, 2019, the Company had New York State and New York City net operating loss carryforwards for income tax purposes of $15.7 million and $13.9 million, respectively. If not utilized, the state and local net operating loss carryforwards will begin to expire in 2035.
The components of the Company’s uncertain tax positions are as follows (dollars in thousands):
|
|
|
Successor |
|
|
|
|
|
December 31, |
|
|
|
|
|
2019 |
|
|
|
Gross unrecognized tax benefits as of January 1 |
|
$ |
3,348 |
|
|
Increase in current year tax positions |
|
|
2,162 |
|
|
Increase in prior year tax positions |
|
|
- |
|
|
Acquired tax positions |
|
|
1,789 |
|
|
Settlements |
|
|
(787) |
|
|
Gross unrecognized tax benefits as of December 31 |
|
$ |
6,512 |
|
The Company recognizes interest and penalties related to income taxes within the provision for income taxes in the consolidated statements of income. Accrued interest and penalties are included within accounts payable, accrued expenses and other liabilities in the consolidated statements of financial condition. The total amount of interest and penalties accrued as of December 31, 2019 are $2.3 million and $0.5 million respectively.
138
In 2019, TWM LLC settled its audits with the City of New York related to New York City Unincorporated Business Tax for years 2009 – 2011. Through the settlement, the Company reduced its uncertain tax positions by $1.3 million. TWM LLC is still under audit by the City of New York for the tax years 2012 – 2014.
As a result of the Refinitiv Contribution, the Company assumed the tax liabilities of the contributed entity. The contributed entity is under audit by the State of New Jersey for the tax years 2012 - 2015 and is appealing a tax assessment from an audit by the State of New Jersey for the tax years 2008 - 2011. At December 31, 2019 the tax liability, interest and penalties related to the Refinitiv Contribution is $2.7 million and is included within accounts payable, accrued expenses and other liabilities on the consolidated statement of financial condition. The Company is indemnified by Refinitiv for tax liabilities that were assumed by the Company as a result of the Refinitiv Contribution. An indemnification asset has been recorded for this item. See Note 14 – Related Party Transactions.
The above tax positions were recognized using the best estimate of the amount expected to be paid based on available information and assessment of all relevant factors. Due to the uncertainty associated with tax audits, it is possible that at some future date liabilities resulting from these audit could vary significantly from these positions. Nevertheless, based on currently enacted legislation and information currently known to us, the Company believes that the ultimate resolution of these audits will not have a material adverse impact on the Company’s financial condition taken as a whole.
In connection with the Reorganization Transactions, the Corporation entered into the Tax Receivable Agreement with TWM LLC and the Continuing LLC Owners, which provides for the payment by the Corporation to a Continuing LLC Owner of 50% of the amount of U.S. federal, state and local income or franchise tax savings, if any, that the Corporation actually realizes (or in some circumstances is deemed to realize) as a result of (i) increases in the tax basis of TWM LLC’s assets resulting from (a) the purchase of LLC Interests from such Continuing LLC Owner, including with the net proceeds from the IPO, the October 2019 follow-on offering and any future offering or (b) redemptions or exchanges by such Continuing LLC Owner of LLC Interests for shares of Class A common stock or Class B common stock or for cash, as applicable, and (ii) certain other tax benefits related to the Corporation making payments under the Tax Receivable Agreement. Payments under the Tax Receivable Agreement are made annually based on the actual tax savings realized by the Corporation in its previous tax year.
In connection with the IPO, the Company recorded an initial liability of $171.4 million related to its projected obligations under the Tax Receivable Agreement with respect to LLC Interests that were purchased by the Corporation using the net proceeds of the IPO. During 2019, the liability increased to $240.8 million primarily due to the purchase of LLC Interests by the Corporation using the net proceeds of the October 2019 follow-on offering as well as additional exchanges of LLC Interests by Continuing LLC Owners during the year ended December 31, 2019 partially offset by changes in tax rates.
The Corporation accounts for the income tax effects resulting from taxable redemptions or exchanges of LLC Interests by the Continuing LLC Owners for shares of Class A common stock or Class B common stock or cash, as the case may be, and purchases by the Corporation of LLC Interests from the Continuing LLC Owners by recognizing an increase in deferred tax assets, based on enacted tax rates at the date of each redemption, exchange or purchase, as the case may be. Further, the Corporation evaluates the likelihood that it will realize the benefit represented by the deferred tax asset, and, to the extent that the Corporation estimates that it is more likely than not that it will not realize the benefit, it reduces the carrying amount of the deferred tax asset with a valuation allowance.
The impact of any changes in the projected obligations under the Tax Receivable Agreement as a result of changes in the mix of the Company’s earnings, tax legislation and tax rates in various jurisdictions, or other factors that may impact the Corporation’s tax savings, are reflected in income before taxes on the consolidated statement of income in the period in which the change occurs. During the year ended December 31, 2019, the Company recognized a Tax Receivable Agreement liability adjustment of $33.1 million in the consolidated statement of income.
139
Initial Public Offering and Reorganization Transactions
As described in Note 1 – Organization, in April 2019, the Corporation completed its IPO of 46,000,000 shares of Class A common stock at a public offering price of $27.00, which included 6,000,000 shares of Class A common stock issued pursuant to the underwriters’ option to purchase additional shares of Class A common stock. The Corporation received $1.2 billion in net proceeds, after deducting underwriting discounts and commissions but before deducting offering expenses, which were used to purchase LLC Interests from certain of the Bank Stockholders (and the corresponding shares of common stock were cancelled as described below), at a purchase price per interest equal to the public offering price of $27.00, less the underwriting discounts and commissions payable thereon.
In connection with the IPO, the Reorganization Transactions described below were completed.
Amendment and Restatement of Certificate of Incorporation
On April 3, 2019, the certificate of incorporation of Tradeweb Markets Inc. was amended and restated to, among other things, provide for the authorization of (i) 250,000,000 shares of preferred stock with a par value of $0.00001 per share (ii) 1,000,000,000 shares of Class A common stock with a par value of $0.00001 per share; (iii) 450,000,000 shares of Class B common stock with a par value of $0.00001 per share; (iv) 350,000,000 shares of Class C common stock with a par value of $0.00001 per share; and (v) 300,000,000 shares of Class D common stock with a par value of $0.00001 per share.
Each share of Class A common stock and Class C common stock entitles its holder to one vote on all matters presented to the Corporation’s stockholders generally. Each share of Class B common stock and Class D common stock entitles its holder to ten votes on all matters presented to the Corporation’s stockholders generally. The holders of Class C common stock and Class D common stock have no economic interests in the Corporation (where “economic interests” means the right to receive any dividends or distributions, whether cash or stock, in connection with common stock). These attributes are summarized in the following table:
|
Class of |
|
Par |
|
Votes |
|
Economic |
|
|
Class A common stock |
|
$ |
0.00001 |
|
1 |
|
Yes |
|
Class B common stock |
|
$ |
0.00001 |
|
10 |
|
Yes |
|
Class C common stock |
|
$ |
0.00001 |
|
1 |
|
No |
|
Class D common stock |
|
$ |
0.00001 |
|
10 |
|
No |
Holders of outstanding shares of Class A common stock, Class B common stock, Class C common stock and Class D common stock will vote together as a single class on all matters presented to the Corporation’s stockholders for their vote or approval, except as otherwise required by applicable law.
Holders of Class B common stock may from time to time exchange all or a portion of their shares of Class B common stock for newly issued shares of Class A common stock on a one-for-one basis (in which case their shares of Class B common stock will be cancelled on a one-for-one basis upon any such issuance). The Continuing LLC Owners that hold shares of Class D common stock may also from time to time exchange all or a portion of their shares of Class D common stock for newly issued shares of Class C common stock on a one-for-one basis (in which case their shares of Class D common stock will be cancelled on a one-for-one basis upon such issuance). In addition, with respect to each Bank Stockholder that holds shares of Class D common stock, immediately prior to the occurrence of any event that would cause the combined voting power held by such Bank Stockholder to exceed 4.9%, the minimum number of shares of Class D common stock of such Bank Stockholder that would need to convert into shares of Class C common stock such that the combined voting power held by such Bank Stockholder would not exceed 4.9% will automatically convert into shares of Class C common stock.
140
Each share of Class B common stock will automatically convert into one share of Class A common stock and each share of Class D common stock will automatically convert into one share of Class C common stock (i) immediately prior to any sale or other transfer of such share by a holder or its permitted transferees to a non-permitted transferee or (ii) once the Refinitiv Owners and their affiliates together no longer beneficially own a number of shares of common stock and LLC Interests that together entitle them to at least 10% of TWM LLC’s economic interest. Holders of LLC Interests that receive shares of Class C common stock upon any such conversion may continue to elect to have their LLC Interests redeemed for newly issued shares of Class A common stock as described below (in which case their shares of Class C common stock will be cancelled on a one-for-one basis upon such issuance).
In addition, the Corporation’s board of directors adopted the Omnibus Equity Plan, under which equity awards may be made in respect of shares of Class A common stock. It also assumed sponsorship of the Option Plan and a PRSU plan formerly sponsored by TWM LLC. See Note 13 – Stock-Based Compensation Plans.
Recapitalization of Tradeweb Markets LLC
On April 4, 2019, the TWM LLC Agreement was amended and restated to, among other things, (i) provide for the LLC Interests, (ii) exchange all of the then existing membership interests in TWM LLC for LLC Interests and (iii) appoint the Corporation as the sole manager of TWM LLC.
All of the shares of TWM LLC outstanding prior to the Reorganization Transactions were exchanged for 222,222,197 LLC Interests. TWM LLC’s outstanding shares prior to the Reorganization Transactions consisted of the following classes of shares:
|
|
|
Shares |
|
Class A |
|
146,333 |
|
Class C |
|
447 |
|
Class P (A) |
|
6,887 |
|
Class P (C) |
|
2 |
|
Class P-1(A) |
|
6,094 |
|
Class P-1 (C) |
|
232 |
The TWM LLC Agreement requires that TWM LLC at all times maintain (i) a one-to-one ratio between the number of shares of Class A common stock and Class B common stock issued by the Corporation and the number of LLC Interests owned by the Corporation and (ii) a one-to-one ratio between the number of shares of Class C common stock and Class D common stock issued by the Corporation and the number of LLC Interests owned by the holders of such Class C common stock and Class D common stock.
LLC Interests held by Continuing LLC Owners are redeemable in accordance with the TWM LLC Agreement, at the election of such holders, for newly issued shares of Class A common stock or Class B common stock, as the case may be, on a one-for-one basis (and such holders’ shares of Class C common stock or Class D common stock, as the case may be, will be cancelled on a one-for-one basis upon any such issuance). In the event of such election by a Continuing LLC Owner, the Corporation may, at its option, effect a direct exchange of Class A common stock or Class B common stock for such LLC Interests of such Continuing LLC Owner in lieu of such redemption. In addition, the Corporation’s board of directors may, at its option, instead of the foregoing redemptions or exchanges of LLC Interests, cause the Corporation to make a cash payment equal to the volume weighted average market price of one share of Class A common stock for each LLC Interest redeemed or exchanged (subject to customary adjustments, including for stock splits, stock dividends and reclassifications) in accordance with the terms of the TWM LLC Agreement.
Issuance and Cancellation of Common Stock
|
· |
As a result of the Refinitiv Contribution, the Corporation received 96,933,192 LLC Interests and the Refinitiv Direct Owner received 96,933,192 shares of Class B common stock. |
141
|
· |
The Corporation issued 20,000,000 shares of Class C common stock and 105,289,005 shares of Class D common stock to the Original LLC Owners that received LLC Interests on a one-to-one basis with the number of LLC Interests they owned immediately following the amendment and restatement of the TWM LLC Agreement for nominal consideration (the Corporation subsequently cancelled 9,993,731 shares of such Class C common stock and 36,006,269 shares of such Class D common stock in connection with the Corporation’s purchase of LLC Interests from certain of the Bank Stockholders using the net proceeds of the IPO). |
Following the completion of the Reorganization Transactions, including the IPO and the application of the proceeds therefrom as described above, (i) the investors in the IPO collectively owned 46,000,000 shares of Class A common, representing 2.7% of the combined voting power of all of the Corporation’s common stock and, through the Corporation’s ownership of LLC Interests, 20.7% of the economic interest in TWM LLC; (ii) the Refinitiv Direct Owner owned 96,933,192 shares of Class B common stock, representing 56.4% of the combined voting power of all of the Corporation’s common stock and, through the Corporation’s ownership of LLC Interests, 43.6% of the economic interest in TWM LLC; (iii) the Refinitiv LLC Owner owned 22,988,329 shares of Class D common stock, representing 13.4% of the combined voting power of all of the Corporation’s common stock, and 22,988,329 LLC Interests, representing 10.3% of the economic interest in TWM LLC, (iv) the Continuing LLC Owners (other than the Refinitiv LLC Owner) collectively owned 10,006,269 shares of Class C common stock and 46,294,407 shares of Class D common stock, representing 27.5% of the combined voting power of all of the Corporation’s common stock, and 56,300,676 LLC Interests, representing 25.3% of the economic interest in TWM LLC; and (v) the Corporation owned 142,933,192 LLC Interests, representing 64.3% of the economic interest in TWM LLC.
October 2019 Follow-On Offering
In the fourth quarter of 2019, Tradeweb Markets Inc. completed an underwritten follow-on offering of 19,881,059 shares of Class A Common stock at a public offering price of $42.00 per share, which included 2,593,181 shares of Class A common stock issued pursuant to the underwriters’ option to purchase additional shares of Class A common stock. Tradeweb Markets Inc. received net proceeds of $810.0 million, after deducting underwriting discounts and commissions but before deducting estimated offering expenses, which were used to purchase (i) 19,835,666 issued and outstanding LLC Interests from certain of the Bank Stockholders and certain of our executive officers (and the corresponding shares of Class C common stock and/or Class D common stock held by such holders were cancelled) and (ii) 45,393 issued and outstanding shares of Class A common stock from certain of our executive officers (which shares of) and (ii) 45,393 issued and outstanding shares of Class A common stock from certain of our executive officers (which shares of Class A common stock were cancelled), at a purchase price per interest and share equal to the public offering price of $42.00, less the underwriting discounts and commissions payable thereon.
Redemptions and Exchanges of LLC Interests
In addition to the IPO and the October 2019 follow-on offering transactions described above, during the year ended December 31, 2019, certain Continuing LLC Owners exercised their redemption rights under the TWM LLC Agreement, pursuant to which 271,184 LLC Interests were exchanged for 271,184 newly-issued shares of Class A common stock. Simultaneously, and in connection with these exchanges, 271,184 shares of Class D common stock were surrendered by these Continuing LLC Owners and cancelled. Additionally, in connection with these exchanges, Tradeweb Markets Inc. received 271,184 LLC Interests, increasing its total ownership interest in TWM LLC.
As a result of the Reorganization Transactions, the IPO, the October 2019 follow-on offering and other exchanges and equity activity, as of December 31, 2019:
|
" |
The public investors collectively owned 66,408,328 shares of our Class A common stock, representing 4.3% of the combined voting power of Tradeweb Markets Inc.’s issued and outstanding common stock and indirectly, through Tradeweb Markets Inc., owned 29.8% of the economic interest in TWM LLC; |
|
" |
Refinitiv collectively owned 96,933,192 shares of our Class B common stock and 22,988,329 shares of our Class D common stock, representing 77.2% of the combined voting power of Tradeweb Markets Inc.’s issued |
142
and outstanding common stock and directly and indirectly, through Tradeweb Markets Inc., owned 53.9% of the economic interest in TWM LLC; |
|
" |
The Bank Stockholders that continue to own LLC Interests collectively owned 8,328,983 shares of our Class C common stock and 27,662,354 shares of our Class D common stock, representing 18.4% of the combined voting power of Tradeweb Markets Inc.’s issued and outstanding common stock and directly and indirectly, through Tradeweb Markets Inc., owned 16.2% of the economic interest in TWM LLC. |
In connection with the Reorganization Transactions, Tradeweb Markets Inc. became the sole manager of TWM LLC and, as a result of this control, and because Tradeweb Markets Inc. has a substantial financial interest in TWM LLC, consolidates the financial results of TWM LLC into its consolidated financial statements. The non-controlling interests balance reported on the consolidated statements of financial condition represents the economic interests of TWM LLC held by the holders of LLC Interests other than Tradeweb Markets Inc. Income or loss is attributed to the non-controlling interests based on the relative ownership percentages of LLC Interests held during the period by Tradeweb Markets Inc. and the other holders of LLC Interests.
The following table summarizes the ownership interest in Tradeweb Markets LLC:
|
|
|
December 31, 2019 |
||
|
|
|
LLC |
|
Ownership |
|
|
|
Interests |
|
% |
|
Number of LLC Interests held by Tradeweb Markets Inc. |
|
163,341,520 |
|
73.4% |
|
Number of LLC Interests held by non-controlling interests |
|
59,182,155 |
|
26.6% |
|
Total LLC Interests outstanding |
|
222,523,675 |
|
100% |
LLC Interests held by the Continuing LLC Owners are redeemable in accordance with the TWM LLC Agreement at the election of the members for shares of Class A common stock or Class B common stock, on a one-for-one basis or, at the Company's option, a cash payment in accordance with the terms of the TWM LLC Agreement. See Note 11 – Stockholders’ Equity.
The following table summarizes the impact on equity due to changes in the Corporation’s ownership interest in TWM LLC (in thousands):
|
|
|
Successor |
|
|
|
|
Year Ended |
|
|
|
|
December 31, |
|
|
Net Income Attributable to Tradeweb Markets Inc. and Transfers (to) from the Non-Controlling Interests |
|
2019 |
|
|
Net income attributable to Tradeweb Markets Inc. |
|
$ |
83,769 |
|
Transfers (to) from non-controlling interests: |
|
|
|
|
Allocation of equity to non-controlling interests arising from the reorganization transactions and IPO |
|
|
(1,607,529) |
|
Change in non-controlling interests as a result of the October 2019 follow-on offering and other ownership changes |
|
|
402,227 |
|
Net transfers (to) from non-controlling interests |
|
|
(1,205,302) |
|
Change from net income attributable to Tradeweb Markets Inc. and transfers (to) from non-controlling interests |
|
$ |
(1,121,533) |
13. Stock-Based Compensation Plans
Under the Omnibus Equity Plan, the Company is authorized to issue up to 8,841,864 new shares of the Company’s common stock to employees, officers and non-employee directors. Under this plan, the Company may grant awards based on shares of its common stock, including performance-based restricted share units (“PRSUs”), stock options, restricted stock units (“RSUs”) and dividend equivalent rights. The awards may have performance-based and time-based vesting conditions. Stock options have a maximum contractual term of 10 years.
143
PRSUs (Equity-Settled)
PRSUs are promises to issue actual shares of Class A common stock at the end of a three-year cliff vesting period. The fair value of the equity-settled PRSUs is calculated on the grant date using the stock price of the Class A common stock. The number of shares a participant will receive upon vesting is determined by a performance modifier, which is adjusted as a result of the financial performance of the Company in the grant year. The performance modifier can vary between 0% (minimum) and 200% (maximum) of the target (100%) award amount.
On December 31, 2018, certain PRSUs, which were previously cash-settled, were converted to equity-settled PRSUs. No equity-settled PRSUs were granted by the Company prior to December 31, 2018. The conversion was at fair value, using a unit price consistent with the share price of the Company, and as a result of the impact of the performance modifier on PRSUs value. 1,033.2 cash-settled PRSUs were converted into the equivalent value of 2,000,384 equity-settled PRSUs, adjusted retroactively for the Recapitalization of TWM LLC described in Note 11 – Stockholders’ Equity, having vesting terms similar to the cash-settled PRSUs. As a result of the modification, which impacted 54 employees, the Company reclassified $19.1 million from employee equity compensation payable to members’ capital in the December 31, 2018 statement of financial condition.
A summary of the Company’s outstanding equity-settled PRSUs is presented below:
|
|
|
|
|
Weighted |
|
|
|
|
|
|
Average |
|
|
|
|
Equity-Settled |
|
Grant-Date |
|
|
|
|
PRSUs |
|
Fair Value |
|
|
Equity-settled PRSUs outstanding at December 31, 2018 |
|
2,000,384 |
|
$ |
9.53 |
|
Grants |
|
781,026 |
|
$ |
21.08 |
|
Vests |
|
— |
|
$ |
— |
|
Performance adjustment |
|
762,326 |
|
$ |
21.08 |
|
Forfeitures |
|
(53,070) |
|
$ |
13.48 |
|
Equity-settled PRSUs outstanding at December 31, 2019 |
|
3,490,666 |
|
$ |
14.59 |
The following table shows a summary of equity-settled PRSU activity during the year ended December 31, 2019 (in thousands):
|
|
|
Successor |
|
|
|
|
Year Ended |
|
|
|
|
December 31, |
|
|
|
|
2019 |
|
|
Equity-settled PRSU compensation expense |
|
$ |
25,392 |
|
Income tax benefit |
|
$ |
(4,781) |
PRSUs (Cash-Settled)
The Company previously granted cash-settled PRSUs, some of which are still outstanding and are accounted for as liability awards. The Company measures the cost of employee services received in exchange for the award based on the fair value of the Company and the value of accumulated dividend rights associated with each award. The fair value of that award is remeasured subsequently at each reporting date through to settlement. Changes in the award's fair value during the requisite service period are recognized as compensation cost over that period.
144
A summary of the Company’s outstanding cash-settled PRSUs is presented below:
|
|
|
|
|
Weighted |
|
|
|
|
Cash-Settled |
|
Average |
|
|
|
|
PRSUs |
|
Fair Value |
|
|
Cash-settled PRSUs outstanding at December 31, 2018 |
|
522 |
|
$ |
34,221 |
|
Grants |
|
— |
|
$ |
— |
|
Vests (1) |
|
(507) |
|
$ |
33,842 |
|
Forfeitures |
|
— |
|
$ |
— |
|
Cash-settled PRSUs outstanding at December 31, 2019 |
|
15 |
|
$ |
94,997 |
(1) The total fair value of cash-settled PRSUs vested was $17.2 million for the year ended December 31, 2019.
Options
Prior to the IPO, the Company awarded options to management and other employees under the Option Plan. Each option award vests one half based solely on the passage of time and one half only if the Company achieves certain performance targets. The time vesting portion of the options has a four-year graded vesting schedule, with accelerated vesting for time-based options with vesting dates of January 1, 2021 and 2022 upon the completion of an initial public offering. The Company can elect to net-settle exercised options by reducing the shares of Class A common stock to be issued upon such exercise by the number of shares of Class A common stock having a fair market value on the date of exercise equal to the aggregate option price and withholding taxes payable in respect of the number of options exercised. The Company can also elect, upon exercise, to reduce the shares to be issued by the number of shares having a fair market value on the date of exercise equal to employee payroll taxes. The Company may then pay these employee payroll taxes from the Company’s cash.
In accounting for options issued under the Option Plan, or which may be issued under the Omnibus Equity Plan in the future, the Company measures and recognizes compensation expense for all awards based on their estimated fair values measured as of the grant date. Options issued under the Option Plan are exercisable following the closing of an initial public offering or during a 15‑day period following a change in control of the Company (and certain other sales of equity by the Company’s shareholders). Costs related to these options are recognized as an expense in the consolidated statements of income over the requisite service period, when exercisability is considered probable, with an offsetting increase to additional paid-in capital. As a result, expense recognition commenced upon the completion of the IPO, with $18.9 million recognized as compensation expense related to options issued under the Option Plan immediately upon the completion of the IPO.
The fair value of options is calculated on the grant date using the Black-Scholes model. The significant assumptions used to estimate the fair value as of grant date of the options awarded prior to the IPO did not reflect changes that would have occurred to these assumptions as a result of the IPO.
A summary of the Company’s outstanding options is presented below:
|
|
|
|
|
Weighted |
|
|
|
|
|
|
Average |
|
|
|
|
|
|
Grant-Date |
|
|
|
|
Options |
|
Fair Value |
|
|
Options outstanding at December 31, 2018 |
|
18,091,793 |
|
$ |
1.85 |
|
Grants |
|
886,115 |
|
$ |
8.83 |
|
Exercises |
|
(984,585) |
|
$ |
1.80 |
|
Forfeitures and adjustments |
|
(253,579) |
|
$ |
2.67 |
|
Options outstanding at December 31, 2019 |
|
17,739,744 |
|
$ |
2.19 |
|
Vested options outstanding at December 31, 2019 |
|
8,061,312 |
|
$ |
1.80 |
The total intrinsic value of options exercised in 2019 was $21.3 million. At December 31, 2018, no options were vested or exercisable.
145
The following table shows a summary options activity during the year ended December 31, 2019 (in thousands):
|
|
|
Successor |
|
|
|
|
Year Ended |
|
|
|
|
December 31, |
|
|
|
|
2019 |
|
|
Options compensation expense |
|
$ |
24,432 |
|
Income tax benefit |
|
$ |
(8,556) |
The significant assumptions used to estimate the fair value of the options as of the grant date were as follows:
|
Weighted Average Expected Life (years) |
|
|
5.7 |
|
|
Weighted Average Risk-Free Interest Rate |
|
|
2.9 |
% |
|
Weighted Average Expected Volatility |
|
|
20.0 |
% |
|
Weighted Average Expected Dividend Yield |
|
|
3.9 |
% |
|
Weighted Average Share Price |
|
$ |
21.62 |
|
|
Weighted Average Exercise Price |
|
$ |
21.62 |
|
Compensation Expense
The Company records stock-based compensation expense for employees and directors in the consolidated statements of income.
The total stock-based compensation expense for the year ended December 31, 2019, the 2018 Successor Period, the 2018 Predecessor Period and the year ended December 31, 2017 is $50.7 million, $9.4 million, $15.9 million and $26.1 million, respectively.
As of December 31, 2019, total unrecognized compensation expense related to unvested stock-based compensation arrangements and the expected recognition period are as follows (dollars in thousands):
|
|
|
Cash-Settled |
|
Equity-Settled |
|
|
|||
|
|
|
PRSUs |
|
PRSUs |
|
Options |
|||
|
Total unrecognized compensation cost |
|
$ |
383 |
|
$ |
31,283 |
|
$ |
4,068 |
|
Weighted-average recognition period |
|
|
1.0 years |
|
|
1.7 years |
|
|
2.8 years |
14. Related Party Transactions
The Company enters into transactions with its affiliates from time to time which are considered to be related party transactions. Prior to the Reorganization Transactions, the Bank Stockholders were collectively considered to be related parties of the Company. As a result of the Reorganization Transactions, they are no longer considered to be related
146
parties. As a result, the related party transactions listed below include transactions with the Bank Stockholders or their respective affiliates for pre-IPO periods only.
At December 31, 2019 and 2018, the following balances with such affiliates were included in the consolidated statements of financial condition in the following line items (in thousands):
|
|
|
Successor |
|
Successor |
||
|
|
|
December 31, 2019 |
|
December 31, 2018 |
||
|
Cash and cash equivalents |
|
$ |
— |
|
$ |
283,790 |
|
Receivables from brokers and dealers and clearing organizations |
|
|
— |
|
|
3,332 |
|
Deposits with clearing organizations |
|
|
— |
|
|
500 |
|
Accounts receivable |
|
|
— |
|
|
40,730 |
|
Receivable from affiliates |
|
|
2,525 |
|
|
3,243 |
|
Other assets |
|
|
— |
|
|
9 |
|
Payable to brokers and dealers and clearing organizations |
|
|
— |
|
|
2,404 |
|
Deferred revenue |
|
|
4,733 |
|
|
9,151 |
|
Payable to affiliates |
|
|
1,506 |
|
|
5,009 |
The following balances with such affiliates were included in the consolidated statements of income in the following line items (in thousands):
|
|
|
Successor |
|
Successor |
|
|
Predecessor |
|
Predecessor |
||||
|
|
|
Year Ended |
|
October 1, 2018 |
|
|
January 1, 2018 |
|
Year Ended |
||||
|
|
|
December 31, |
|
to |
|
|
to |
|
December 31, |
||||
|
|
|
2019 |
|
December 31, 2018 |
|
|
September 30, 2018 |
|
2017 |
||||
|
Revenue: |
|
|
|
|
|
|
|
|
|
|
|
|
|
|
Transaction fees (1) |
|
$ |
59,643 |
|
$ |
59,259 |
|
|
$ |
159,663 |
|
$ |
151,695 |
|
Subscription fees (1) |
|
|
5,670 |
|
|
5,718 |
|
|
|
16,627 |
|
|
37,426 |
|
Commissions (1) |
|
|
16,186 |
|
|
12,401 |
|
|
|
34,944 |
|
|
43,315 |
|
Refinitiv market data fees (2) |
|
|
55,635 |
|
|
13,467 |
|
|
|
36,851 |
|
|
50,125 |
|
Operating Income:(3) |
|
|
|
|
|
|
|
|
|
|
|
|
|
|
Net interest income (expense) |
|
|
858 |
|
|
17 |
|
|
|
34 |
|
|
(415) |
|
|
|
|
|
|
|
|
|
|
|
|
|
|
|
|
Shared Services Fees (4) : |
|
|
|
|
|
|
|
|
|
|
|
|
|
|
Technology and communications |
|
|
2,960 |
|
|
740 |
|
|
|
2,220 |
|
|
2,960 |
|
General and administrative |
|
|
430 |
|
|
180 |
|
|
|
539 |
|
|
719 |
|
Occupancy |
|
|
481 |
|
|
155 |
|
|
|
466 |
|
|
621 |
|
(1) |
For pre-IPO periods, represents fees and commissions from affiliates of the Bank Stockholders. |
|
(2) |
The Company maintains a market data license agreement with Refinitiv (TR in the predecessor period). Under the agreement, the Company delivers to Refinitiv certain market data feeds which Refinitiv redistributes to its customers. The Company earns license fees and royalties for these feeds. |
|
(3) |
For pre-IPO periods, represents interest income from money market funds invested with and savings accounts deposited with affiliates of the Bank Stockholders. |
|
(4) |
The Company maintains a shared services agreement with Refinitiv (TR in the predecessor period). Under the terms of the agreement, Refinitiv provides the Company with certain real estate, payroll, benefits administration, insurance, content, financial reporting and tax support. |
The Company reimburses affiliates of Refinitiv (TR in the predecessor period) for expenses paid on behalf of the Company for various services including salaries and bonuses, marketing, professional fees, communications, data costs and certain other administrative services. For the year ended December 31, 2019, the 2018 Successor Period, the 2018
147
Predecessor Period and the year ended December 31, 2017, the Company reimbursed such affiliates approximately $6.7 million, $3.8 million, $28.7 million, and $38.4 million, respectively, for these expenses.
The Company is indemnified by Refinitiv for any tax liabilities that existed in the entity contributed by Refinitiv as a result of the Refinitiv Contribution. $2.7 million is included in other assets on the December 31, 2019 consolidated statement of financial condition related to this indemnification.
The Company engaged Blackstone Advisory Partners L.P., an affiliate of Blackstone, to provide certain financial consulting services in connection with the IPO and the October 2019 follow-on offering for a fee of $1.0 million and $0.5 million, respectively, which fee, with respect to the October 2019 follow-on offering, was reimbursed by the underwriters of the October 2019 follow-on offering. $1.5 million is included in additional paid-in capital on the December 31, 2019 consolidated statement of financial condition related to these offering costs.
During 2014, the Company issued Class A Shares and unvested Class P-1(A) Shares to some of the Bank Stockholders as a result of a $120.0 million capital contribution. In connection with this investment, employees invested $5.3 million in the Company and were issued Class C Shares and unvested Class P-1(C) Shares. Certain Class P-1(A) Shares and Class P-1(C) Shares vested on July 31, 2018, based on a formula determined by the Company’s new credit platforms’ revenues and any remaining unvested Class P-1(A) Shares and Class P-1(C) Shares were cancelled and as a result no contingent consideration has been recognized related to these shares subsequent to that date. The Company recognized contingent consideration for the 2018 Predecessor Period and for the year ended December 31, 2017 of $26.8 million and $58.5 million, respectively, relating to these shares, which is included in net revenue on the consolidated statements of income.
15. Fair Value of Financial Instruments
Certain financial instruments that are carried on the consolidated statements of financial condition are carried at amounts that approximate fair value. These instruments include receivable from/payable to brokers and dealers and clearing organizations, deposits with clearing organizations and accounts receivable.
The Company's money market funds are classified within level 1 of the fair value hierarchy because they are valued using quoted market prices in active markets.
The Company has no instruments that are classified within level 2 or level 3 of the fair value hierarchy.
The fair value measurements are as follows (in thousands):
|
|
|
Quoted Prices in |
|
|
|
|
|
|
|
|
|
|
|
|
|
active Markets |
|
Significant |
|
Significant |
|
|
|
|||
|
|
|
for Identical |
|
Observable |
|
Unobservable |
|
|
|
|||
|
|
|
Assets |
|
Inputs |
|
Inputs |
|
|
|
|||
|
Successor |
|
(Level 1) |
|
(Level 2) |
|
(Level 3) |
|
Total |
||||
|
As of December 31, 2019 |
|
|
|
|
|
|
|
|
|
|
|
|
|
Assets |
|
|
|
|
|
|
|
|
|
|
|
|
|
Money market funds |
|
$ |
219,158 |
|
$ |
— |
|
$ |
— |
|
$ |
219,158 |
|
|
|
$ |
219,158 |
|
$ |
— |
|
$ |
— |
|
$ |
219,158 |
|
As of December 31, 2018 |
|
|
|
|
|
|
|
|
|
|
|
|
|
Assets |
|
|
|
|
|
|
|
|
|
|
|
|
|
Money market funds |
|
$ |
127,927 |
|
$ |
— |
|
$ |
— |
|
$ |
127,927 |
|
|
|
$ |
127,927 |
|
$ |
— |
|
$ |
— |
|
$ |
127,927 |
The Company may be exposed to credit risk regarding its receivables, which are primarily receivables from financial institutions, including investment managers and broker-dealers. At December 31, 2019 and December 31, 2018, the
148
Company established an allowance for doubtful accounts of $0.2 million and $1.2 million, respectively, with regard to these receivables.
In the normal course of business the Company, as agent, executes transactions with, and on behalf of, other broker-dealers. If the agency transactions do not settle because of failure to perform by either counterparty, the Company may be obligated to discharge the obligation of the non-performing party and, as a result, may incur a loss if the market value of the security is different from the contract amount of the transaction.
A substantial number of the Company's transactions are collateralized and executed with, and on behalf of, a limited number of broker-dealers. The Company's exposure to credit risk associated with the nonperformance of these clients in fulfilling their contractual obligations pursuant to securities transactions can be directly impacted by volatile trading markets which may impair the clients' ability to satisfy their obligations to the Company.
From time to time, the Company enters into agreements to repurchase to facilitate the clearance of securities. Credit exposure related to these agreements to repurchase, including the risk related to a decline in market value of collateral (pledged or received), is managed by entering into agreements to repurchase with overnight or short-term maturity dates and only entering into repurchase transactions with netting members of the Fixed Income Clearing Corporation (“FICC”). The FICC requires dealer netting members to maintain a minimum of $25 million in equity capital and $10 million in excess net capital. The FICC operates a continuous net settlement system, whereby as trades are submitted and compared the FICC becomes the counterparty. The FICC also marks to market collateral on a daily basis, requiring member firms to pay or receive margin amounts as part of their daily funds settlement.
The Company does not expect nonperformance by counterparties in the above situations. However, the Company's policy is to monitor its market exposure and counterparty risk. In addition, the Company has a policy of reviewing, as considered necessary, the credit standing of each counterparty with which it conducts business.
17. Commitments and Contingencies
In the normal course of business, the Company enters into user agreements with its dealers which provide the dealers with indemnification from third parties in the event that the electronic marketplaces of the Company infringe upon the intellectual property or other proprietary right of a third party. The Company's exposure under these user agreements is unknown as this would involve estimating future claims against the Company which have not yet occurred. However, based on its experience, the Company expects the risk of a material loss to be remote.
The Company has been named as a defendant, along with other financial institutions, in antitrust class actions (consolidated into two actions) relating to trading practices in United States Treasury securities auctions. The Company has filed a motion to dismiss the actions, believes it has substantial defenses to the other plaintiff's claims and intends to defend itself vigorously. Additionally, the Company was dismissed from a class action relating to an interest rate swaps matter in 2017, but that matter continues against the remaining defendant financial institutions.
The Company is a co-defendant in a matter relating to the distribution of financial strength ratings over the Company's trading platform to one of its customers. The matter alleges that while certain business units of the client were licensed to receive the data via the Company's platform, the data was also distributed without authorization to certain end clients of the customer. The plaintiff claims to have suffered approximately $80 million in damages and also seeks punitive damages, attorneys' fees and costs. In September 2019, the Court dismissed some, but not all, of plaintiff’s claims, and rejected plaintiff’s damages theory on which it relied to support its claims for approximately $80 million in damages for its breach of contract claim. The defendants are still challenging with pre-trial motions whether the plaintiff’s $80 million damage theory is viable with respect to its tort claims, and the plaintiff has in parallel offered an alternative theory quantifying its damages at $4 million to $8 million, which it will pursue if the $80 million theory is disallowed. The matter is now scheduled for trial in October 2020 with respect to the tort claims that survived. The Company intends to continue to vigorously defend what the Company believes to be meritless claims.
The Company records its best estimate of a loss, including estimated defense costs, when the loss is considered probable and the amount of such loss can be reasonably estimated. Based on its experience, the Company believes that the amount
149
of damages claimed in a legal proceeding is not a meaningful indicator of the potential liability. At this time, the Company cannot reasonably predict the timing or outcomes of, or estimate the amount of loss, or range of loss, if any, related to its pending legal proceedings, including the matters described above, and therefore does not have any contingency reserves established for any of these matters.
Revolving Credit Facility
On April 8, 2019, the Company entered into a five year, $500 million senior secured revolving credit facility (“Credit Facility”) with a syndicate of banks. The Credit Facility provides additional borrowing capacity to be used to fund ongoing working capital needs, letters of credit and for general corporate purposes, including potential future acquisitions and expansions.
On November 7, 2019, TWM LLC entered into an amendment to the Revolving Credit Facility among TWM LLC and the lenders party thereto, which revised the Revolving Credit Facility to permit the pending LSEG Transaction. The amendment did not otherwise impact the terms of the Revolving Credit Facility and did not impact the amount of borrowings available to TWM LLC under the Revolving Credit Facility.
Under the terms of the credit agreement that governs the Credit Facility, borrowings under the Credit Facility bear interest at a rate equal to, at the Company’s option, either (a) a base rate equal to the greatest of (i) the administrative agent’s prime rate, (ii) the federal funds effective rate plus ½ of 1.0% and (iii) one month LIBOR plus 1.0%, in each case plus 0.75%, or (b) LIBOR plus 1.75%, subject to a 0.00% floor. The credit agreement also includes a commitment fee of 0.25% for available but unborrowed amounts and other administrative fees that are payable quarterly. The Credit Facility is available until April 2024, provided the Company is in compliance with all covenants. Financial covenant requirements include maintaining minimum ratios related to interest coverage and leverage.
As of December 31, 2019, there were no amounts outstanding under the Credit Facility.
In April 2019, the Company completed the Reorganization Transactions and the IPO, which, among other things, resulted in the Corporation becoming the successor of TWM LLC for financial reporting purposes. As a result, earnings per share information for the pre-IPO period is not comparable to earnings per share information for the post-IPO period. Thus, earnings per share information is being presented separately for the pre-IPO and post-IPO periods.
The following table summarizes the basic and diluted earnings per share calculations for Tradeweb Markets LLC (pre-IPO period):
|
|
|
Successor |
|
Successor |
|
|
Predecessor |
|
Predecessor |
||||
|
|
|
Three Months Ended |
|
October 1, 2018 to |
|
|
January 1, 2018 to |
|
Year Ended |
||||
|
|
|
March 31, |
|
December 31, |
|
|
September 30, |
|
December 31, |
||||
|
EPS: Pre-IPO net income attributable to Tradeweb Markets LLC(1) |
|
2019 |
|
2018 |
|
|
2018 |
|
2017 |
||||
|
|
|
|
(in thousands, except share and per share amounts) |
||||||||||
|
Numerator: |
|
|
|
|
|
|
|
|
|
|
|
|
|
|
Pre-IPO net income attributable to Tradeweb Markets LLC |
|
$ |
42,352 |
|
$ |
29,307 |
|
|
$ |
130,160 |
|
$ |
83,648 |
|
|
|
|
|
|
|
|
|
|
|
|
|
|
|
|
Denominator: |
|
|
|
|
|
|
|
|
|
|
|
|
|
|
Weighted average LLC Interests outstanding - Basic |
|
|
222,222,197 |
|
|
222,221,628 |
|
|
|
215,365,920 |
|
|
212,568,635 |
|
Dilutive effect of equity-settled PRSUs |
|
|
1,098,260 |
|
|
22,223 |
|
|
|
— |
|
|
— |
|
Weighted average LLC Interests outstanding - Diluted |
|
|
223,320,457 |
|
|
222,243,851 |
|
|
|
215,365,920 |
|
|
212,568,635 |
|
|
|
|
|
|
|
|
|
|
|
|
|
|
|
|
Earnings per share - Basic |
|
$ |
0.19 |
|
$ |
0.13 |
|
|
$ |
0.60 |
|
$ |
0.39 |
|
Earnings per share - Diluted |
|
$ |
0.19 |
|
$ |
0.13 |
|
|
$ |
0.60 |
|
$ |
0.39 |
|
(1) |
Earnings per share and weighted average shares outstanding for the pre-IPO periods have been computed to give effect to the Reorganization Transactions, including the amendment and restatement of the TWM LLC Agreement to, among other things, (i) provide for LLC Interests and (ii) exchange all of the then existing membership interests in TWM LLC for LLC interests. |
150
The following table summarizes the basic and diluted earnings per share calculations for Tradeweb Markets Inc. (post-IPO period):
|
|
|
Successor |
|
|
|
|
|
Nine Months Ended |
|
|
|
EPS: Post-IPO net income attributable to Tradeweb Markets Inc. |
|
December 31, |
|
|
|
(in thousands, except share and per share amounts) |
|
2019 |
|
|
|
Numerator: |
|
|
|
|
|
Post-IPO net income attributable to Tradeweb Markets Inc. |
|
$ |
83,769 |
|
|
|
|
|
|
|
|
Denominator: |
|
|
|
|
|
Weighted average shares of Class A and Class B common stock outstanding - Basic |
|
|
148,013,274 |
|
|
Dilutive effect of equity-settled PRSUs |
|
|
2,464,137 |
|
|
Dilutive effect of options |
|
|
6,062,835 |
|
|
Weighted average shares of Class A and Class B common stock outstanding - Diluted |
|
|
156,540,246 |
|
|
|
|
|
|
|
|
Earnings per share - Basic |
|
$ |
0.57 |
|
|
Earnings per share - Diluted |
|
$ |
0.54 |
|
For the year ended December 31, 2019, there were approximately 128,125 average shares underlying equity-settled PRSUs and options that were anti-dilutive. As a result, these shares, which are still outstanding, were excluded from the computation of diluted earnings per share. For the 2018 Predecessor Period, there were approximately 5,444,566 average shares related to the contingent consideration payable that were anti-dilutive and thus excluded from the computation of diluted earnings per share.
LLC Interests held by the Continuing LLC Owners are redeemable in accordance with the TWM LLC Agreement, at the election of such holders, for shares of Class A or Class B common stock of Tradeweb Markets Inc. After evaluating the potential dilutive effect under the if-converted method, the 59,182,155 LLC Interests for the assumed exchange of non-controlling interests were determined to be anti-dilutive and thus were excluded from the computation of diluted earnings per share for the post-IPO periods.
Shares of Class C and Class D common stock do not have economic rights in Tradeweb Markets Inc. and, therefore, are not included in the calculation of basic earnings per share and are not participating securities for purposes of the computation of diluted earnings per share.
19. Regulatory Capital Requirements
TWL, DW and TWD are subject to the Uniform Net Capital Rule 15c3‑1 under the Securities Exchange Act of 1934. TEL is subject to certain financial resource requirements with the FCA in the UK, TWJ is subject to certain financial resource requirements with the FCA in Japan and TWEU is subject to certain finance resource requirements with the AFM in the Netherlands.
At December 31, 2019 and 2018, the regulatory capital requirements and regulatory capital for TWL, DW, TWD, TEL, TWJ and TWEU are as follows (in thousands):
|
As of December 31, 2019 |
|
TWL |
|
DW |
|
TWD |
|
TEL |
|
TWJ |
|
TWEU |
||||||
|
Regulatory Capital |
|
$ |
42,317 |
|
$ |
52,016 |
|
$ |
33,807 |
|
$ |
49,611 |
|
$ |
11,851 |
|
$ |
6,217 |
|
Regulatory Capital Requirement |
|
|
2,396 |
|
|
2,026 |
|
|
664 |
|
|
21,856 |
|
|
8,565 |
|
|
1,701 |
|
Excess Regulatory Capital |
|
$ |
39,921 |
|
$ |
49,990 |
|
$ |
33,143 |
|
$ |
27,755 |
|
$ |
3,286 |
|
$ |
4,516 |
|
As of December 31, 2018 |
|
TWL |
|
DW |
|
TWD |
|
TEL |
|
TWJ |
|||||
|
Regulatory Capital |
|
$ |
18,986 |
|
$ |
41,164 |
|
$ |
24,042 |
|
$ |
46,157 |
|
$ |
10,592 |
|
Regulatory Capital Requirement |
|
|
2,698 |
|
|
1,803 |
|
|
599 |
|
|
17,493 |
|
|
3,413 |
|
Excess Regulatory Capital |
|
$ |
16,288 |
|
$ |
39,361 |
|
$ |
23,443 |
|
$ |
28,664 |
|
$ |
7,179 |
151
As SEFs, TW SEF and DW SEF are required to maintain adequate financial resources and liquid financial assets in accordance with CFTC regulations. The required and maintained financial resources and liquid financial assets at December 31, 2019 and 2018 are as follows (in thousands):
|
|
|
As of December 31, 2019 |
|
As of December 31, 2018 |
||||||||
|
|
|
TW SEF |
|
DW SEF |
|
TW SEF |
|
DW SEF |
||||
|
Financial Resources |
|
$ |
21,303 |
|
$ |
13,707 |
|
$ |
31,232 |
|
$ |
17,837 |
|
Required Financial Resources |
|
|
10,500 |
|
|
5,505 |
|
|
10,500 |
|
|
5,169 |
|
Excess Financial Resources |
|
$ |
10,803 |
|
$ |
8,202 |
|
$ |
20,732 |
|
$ |
12,668 |
|
|
|
|
|
|
|
|
|
|
|
|
|
|
|
Liquid Financial Assets |
|
$ |
18,168 |
|
$ |
7,583 |
|
$ |
16,662 |
|
$ |
11,888 |
|
Required Liquid Financial Assets |
|
|
5,250 |
|
|
2,753 |
|
|
5,250 |
|
|
2,585 |
|
Excess Liquid Financial Assets |
|
$ |
12,918 |
|
$ |
4,830 |
|
$ |
11,412 |
|
$ |
9,303 |
20. Business Segment and Geographic Information
The Company operates electronic marketplaces for the trading of products across the rates, credit, equities and money markets asset classes and provides related pre-trade and post-trade services. The Company’s operations constitute a single business segment because of the integrated nature of these marketplaces and services. Information regarding revenue by client sector is as follows (in thousands):
|
|
|
Successor |
|
|
Successor |
|
Predecessor |
|
Predecessor |
||||
|
|
|
|
|
|
|
|
|
|
|
||||
|
|
|
Year Ended |
|
|
October 1, 2018 to |
|
January 1, 2018 to |
|
Year Ended |
||||
|
|
|
December 31, |
|
|
December 31, |
|
September 30, |
|
December 31, |
||||
|
|
|
2019 |
|
|
2018 |
|
2018 |
|
2017 |
||||
|
Net revenue: |
|
|
|
|
|
|
|
|
|
|
|
|
|
|
Institutional |
|
$ |
453,379 |
|
|
$ |
103,971 |
|
$ |
301,918 |
|
$ |
318,038 |
|
Wholesale |
|
|
171,096 |
|
|
|
38,153 |
|
|
99,028 |
|
|
118,451 |
|
Retail |
|
|
80,368 |
|
|
|
19,780 |
|
|
57,766 |
|
|
70,857 |
|
Market Data |
|
|
70,723 |
|
|
|
16,733 |
|
|
47,059 |
|
|
55,622 |
|
Contingent consideration |
|
|
— |
|
|
|
— |
|
|
(26,830) |
|
|
(58,520) |
|
Net revenue |
|
|
775,566 |
|
|
|
178,637 |
|
|
478,941 |
|
|
504,448 |
|
Operating expenses |
|
|
585,747 |
|
|
|
146,702 |
|
|
338,607 |
|
|
415,356 |
|
Operating income |
|
$ |
189,819 |
|
|
$ |
31,935 |
|
$ |
140,334 |
|
$ |
89,092 |
The Company operates in the U.S. and internationally, primarily in the Europe and Asia regions. Revenues are attributed to geographic area based on the jurisdiction where the underlying transactions take place. The results by geographic region are not meaningful in understanding the Company's business. Long-lived assets are attributed to the geographic area based on the location of the particular subsidiary.
152
The following table provides a breakdown of revenue by geographic area for the year ended December 31, 2019, the 2018 Successor Period, the 2018 Predecessor Period and the year ended December 31, 2017 (in thousands):
|
|
|
Successor |
|
|
Successor |
|
Predecessor |
|
Predecessor |
||||
|
|
|
|
|
|
|
|
|
|
|
||||
|
|
|
Year Ended |
|
|
October 1, 2018 to |
|
January 1, 2018 to |
|
Year Ended |
||||
|
|
|
December 31, |
|
|
December 31, |
|
September 30, |
|
December 31, |
||||
|
|
|
2019 |
|
|
2018 |
|
2018 |
|
2017 |
||||
|
Net Revenue: |
|
|
|
|
|
|
|
|
|
|
|
|
|
|
U.S. |
|
$ |
497,316 |
|
|
$ |
115,907 |
|
$ |
324,304 |
|
$ |
385,176 |
|
International |
|
|
278,250 |
|
|
|
62,730 |
|
|
181,467 |
|
|
177,792 |
|
Gross revenue |
|
|
775,566 |
|
|
|
178,637 |
|
|
505,771 |
|
|
562,968 |
|
Contingent consideration |
|
|
— |
|
|
|
— |
|
|
(26,830) |
|
|
(58,520) |
|
Total |
|
$ |
775,566 |
|
|
$ |
178,637 |
|
$ |
478,941 |
|
$ |
504,448 |
The following table provides information on the attribution of long-lived assets by geographic area (in thousands):
|
|
|
Successor |
|
Successor |
||
|
|
|
December 31, |
|
December 31, |
||
|
|
|
2019 |
|
2018 |
||
|
Long-lived assets |
|
|
|
|
|
|
|
U.S. |
|
$ |
4,200,133 |
|
$ |
4,276,568 |
|
International |
|
|
14,100 |
|
|
7,787 |
|
Total |
|
$ |
4,214,233 |
|
$ |
4,284,355 |
21. Quarterly Results of Operations (Unaudited)
The following tables set forth certain unaudited financial data for the Company’s quarterly operations in 2019 and 2018. The following information has been prepared on the same basis as the annual information presented elsewhere in this report and, in the opinion of management, includes all adjustments, consisting only of normal recurring adjustments,
153
necessary for a fair presentation of the information for the quarterly periods presented. The operating results for any quarter are not necessarily indicative of results for any future period.
|
|
|
Tradeweb Markets Inc. (post-IPO) |
|
Tradeweb Markets LLC (pre-IPO) |
|||||||||||||||||||||
|
|
|
Successor |
|
Successor |
|
Successor |
|
Successor |
|
Successor |
|
Predecessor |
|
Predecessor |
|
|
Predecessor |
||||||||
|
|
|
Three Months Ended |
|||||||||||||||||||||||
|
|
|
December 31, |
|
September 30, |
|
June 30, |
|
March 31, |
|
December 31, |
|
September 30, |
|
June 30, |
|
|
March 31, |
||||||||
|
|
|
2019 |
|
2019 |
|
2019 |
|
2019 |
|
2018 |
|
2018 |
|
2018 |
|
|
2018 |
||||||||
|
Revenues |
|
(in thousands, except share and per share data) |
|||||||||||||||||||||||
|
Transaction fees |
|
$ |
104,245 |
|
$ |
112,746 |
|
$ |
103,952 |
|
$ |
102,640 |
|
$ |
97,130 |
|
$ |
92,582 |
|
$ |
91,030 |
|
|
$ |
90,139 |
|
Subscription fees |
|
|
34,333 |
|
|
35,387 |
|
|
34,566 |
|
|
34,445 |
|
|
33,052 |
|
|
33,157 |
|
|
37,647 |
|
|
|
36,326 |
|
Commissions |
|
|
41,165 |
|
|
37,590 |
|
|
36,413 |
|
|
34,197 |
|
|
32,840 |
|
|
24,394 |
|
|
27,553 |
|
|
|
27,883 |
|
Refinitiv market data fees |
|
|
15,383 |
|
|
13,251 |
|
|
13,385 |
|
|
13,616 |
|
|
13,467 |
|
|
12,533 |
|
|
12,081 |
|
|
|
12,237 |
|
Other |
|
|
2,182 |
|
|
2,007 |
|
|
2,169 |
|
|
1,894 |
|
|
2,148 |
|
|
2,587 |
|
|
2,704 |
|
|
|
2,918 |
|
Gross revenue |
|
|
197,308 |
|
|
200,981 |
|
|
190,485 |
|
|
186,792 |
|
|
178,637 |
|
|
165,253 |
|
|
171,015 |
|
|
|
169,503 |
|
Contingent consideration |
|
|
— |
|
|
— |
|
|
— |
|
|
— |
|
|
— |
|
|
2,537 |
|
|
(19,297) |
|
|
|
(10,070) |
|
Net revenue |
|
|
197,308 |
|
|
200,981 |
|
|
190,485 |
|
|
186,792 |
|
|
178,637 |
|
|
167,790 |
|
|
151,718 |
|
|
|
159,433 |
|
Expenses |
|
|
|
|
|
|
|
|
|
|
|
|
|
|
|
|
|
|
|
|
|
|
|
|
|
|
Employee compensation and benefits |
|
|
76,545 |
|
|
79,644 |
|
|
95,995 |
|
|
77,273 |
|
|
80,436 |
|
|
69,076 |
|
|
68,407 |
|
|
|
71,570 |
|
Depreciation and amortization |
|
|
36,402 |
|
|
35,133 |
|
|
34,292 |
|
|
33,503 |
|
|
33,020 |
|
|
16,362 |
|
|
16,178 |
|
|
|
16,268 |
|
Technology and communications |
|
|
10,199 |
|
|
9,527 |
|
|
9,519 |
|
|
10,040 |
|
|
9,907 |
|
|
9,112 |
|
|
9,023 |
|
|
|
8,463 |
|
General and administrative |
|
|
8,999 |
|
|
7,507 |
|
|
9,365 |
|
|
9,089 |
|
|
11,837 |
|
|
9,386 |
|
|
7,153 |
|
|
|
6,517 |
|
Professional fees |
|
|
7,048 |
|
|
7,272 |
|
|
6,738 |
|
|
6,971 |
|
|
8,194 |
|
|
7,546 |
|
|
7,276 |
|
|
|
5,538 |
|
Occupancy |
|
|
3,786 |
|
|
3,640 |
|
|
3,621 |
|
|
3,639 |
|
|
3,308 |
|
|
3,491 |
|
|
3,519 |
|
|
|
3,722 |
|
Total expenses |
|
|
142,979 |
|
|
142,723 |
|
|
159,530 |
|
|
140,515 |
|
|
146,702 |
|
|
114,973 |
|
|
111,556 |
|
|
|
112,078 |
|
Operating income |
|
|
54,329 |
|
|
58,258 |
|
|
30,955 |
|
|
46,277 |
|
|
31,935 |
|
|
52,817 |
|
|
40,162 |
|
|
|
47,355 |
|
Tax receivable agreement liability adjustment |
|
|
33,134 |
|
|
— |
|
|
— |
|
|
— |
|
|
— |
|
|
— |
|
|
— |
|
|
|
— |
|
Net interest income |
|
|
704 |
|
|
636 |
|
|
175 |
|
|
858 |
|
|
787 |
|
|
673 |
|
|
582 |
|
|
|
471 |
|
Income before taxes |
|
|
88,167 |
|
|
58,894 |
|
|
31,130 |
|
|
47,135 |
|
|
32,722 |
|
|
53,490 |
|
|
40,744 |
|
|
|
47,826 |
|
Provision for income taxes |
|
|
(30,889) |
|
|
(10,316) |
|
|
(6,314) |
|
|
(4,783) |
|
|
(3,415) |
|
|
(7,535) |
|
|
(1,847) |
|
|
|
(2,518) |
|
Net income |
|
$ |
57,278 |
|
$ |
48,578 |
|
$ |
24,816 |
|
$ |
42,352 |
|
$ |
29,307 |
|
$ |
45,955 |
|
$ |
38,897 |
|
|
$ |
45,308 |
|
Net income attributable to non-controlling interests |
|
$ |
15,949 |
|
$ |
18,966 |
|
$ |
11,988 |
|
|
|
|
|
|
|
|
|
|
|
|
|
|
|
|
|
Net income attributable to Tradeweb Markets Inc. |
|
$ |
41,329 |
|
$ |
29,612 |
|
$ |
12,828 |
|
|
|
|
|
|
|
|
|
|
|
|
|
|
|
|
|
Earnings per share (1) |
|
|
|
|
|
|
|
|
|
|
|
|
|
|
|
|
|
|
|
|
|
|
|
|
|
|
Basic |
|
$ |
0.26 |
|
$ |
0.21 |
|
$ |
0.09 |
|
$ |
0.19 |
|
$ |
0.13 |
|
$ |
0.21 |
|
$ |
0.18 |
|
|
$ |
0.21 |
|
Diluted |
|
$ |
0.25 |
|
$ |
0.20 |
|
$ |
0.09 |
|
$ |
0.19 |
|
$ |
0.13 |
|
$ |
0.21 |
|
$ |
0.18 |
|
|
$ |
0.21 |
|
Weighted average shares outstanding |
|
|
|
|
|
|
|
|
|
|
|
|
|
|
|
|
|
|
|
|
|
|
|
|
|
|
Basic |
|
|
157,950,550 |
|
|
142,935,206 |
|
|
142,933,192 |
|
|
222,222,197 |
|
|
222,221,628 |
|
|
219,165,997 |
|
|
213,435,314 |
|
|
|
213,435,321 |
|
Diluted |
|
|
167,323,520 |
|
|
151,362,643 |
|
|
150,847,183 |
|
|
223,320,457 |
|
|
222,243,851 |
|
|
219,165,997 |
|
|
213,435,314 |
|
|
|
213,435,321 |
|
(1) |
In April 2019, the Company completed the Reorganization Transactions and the IPO, which, among other things, resulted in Tradeweb Markets Inc. becoming the successor of Tradeweb Markets LLC for financial reporting purposes. As a result, earnings per share information for the pre-IPO period is not comparable to the earnings per share information for the post-IPO period. See Note 18 — Earnings Per Share for additional information. |
Earnings per share for quarterly periods are based on the weighted average common shares outstanding in individual quarters; thus, the sum of earnings per share of the quarters may not equal the amounts reported for the full year.
On February 11, 2020, the board of directors of Tradeweb Markets Inc. declared a cash dividend of $0.08 per share of Class A common stock and Class B common stock for the first quarter of 2020. This dividend will be payable on March 16, 2020 to stockholders of record as of March 2, 2020.
154
ITEM 9. CHANGES IN AND DISAGREEMENTS WITH ACCOUNTANTS ON ACCOUNTING AND FINANCIAL DISCLOSURE
ITEM 9A. CONTROLS AND PROCEDURES
Evaluation of Disclosure Controls and Procedures
Our management has evaluated, under the supervision of our Chief Executive Officer and Chief Financial Officer, the effectiveness of our disclosure controls and procedures, as defined in Rule 13(a)‑15(e) of the Exchange Act, as of the end of the period covered by this Annual Report on Form 10‑K. Based on that evaluation, our Chief Executive Officer and Chief Financial Officer have concluded that our disclosure controls and procedures as of the end of the period covered by this Annual Report on Form 10‑K are effective at a reasonable assurance level in ensuring that information required to be disclosed in our Exchange Act reports is (1) recorded, processed, summarized and reported in a timely manner and (2) accumulated and communicated to our management, including our Chief Executive Officer and Chief Financial Officer, as appropriate to allow timely decisions regarding required disclosure. Our management, including our Chief Executive Officer and Chief Financial Officer, does not expect that our disclosure controls and procedures will prevent or detect all errors and all fraud. While our disclosure controls and procedures are designed to provide reasonable assurance of their effectiveness, because of the inherent limitations in all control systems, no evaluation of controls can provide absolute assurance that all control issues and instances of fraud, if any, within the Company have been detected.
Management’s Report on Internal Control Over Financial Reporting
This Annual Report on Form 10-K does not include a report of management’s assessment regarding internal control over financial reporting due to a transition period established by the rules of the SEC for newly public companies. In addition, because we are an “emerging growth company” under the JOBS Act, our independent registered public accounting firm will not be required to attest to the effectiveness of our internal control over financial reporting for so long as we are an emerging growth company.
Changes in Internal Control over Financial Reporting
There were no changes to our internal control over financial reporting during the quarter ended December 31, 2019 that have materially affected, or that are reasonably likely to materially affect, our internal control over financial reporting.
We are providing the following disclosure in lieu of filing a Current Report on Form 8-K relating to Item 5.02—Departure of Directors or Certain Officers; Election of Directors; Appointment of Certain Officers; Compensatory Arrangements of Certain Officers of Form 8-K.
On February 14, 2020, James Spencer notified the board of directors of his intent to retire from the Company. Mr. Spencer will continue to serve as our Chief Technology Officer until a later date in April 2020, at which time the new Chief Technology Officer, Justin Peterson, will assume the role. Mr. Spencer will continue to serve as an employee of the Company until October 1, 2020 and will assist with the transition of his responsibilities and duties to Mr. Peterson. Mr. Spencer’s retirement will be effective as of October 1, 2020.
The Company intends to provide Mr. Spencer with a discretionary cash payment at the time of his retirement in recognition of his service to the Company, the amount of which will be determined at a later date.
155
ITEM 10. DIRECTORS, EXECUTIVE OFFICERS AND CORPORATE GOVERNANCE.
The information required by this item will be included in our definitive proxy statement for the 2020 Annual Meeting of Stockholders and is incorporated herein by reference. We will file such definitive proxy statement with the SEC pursuant to Regulation 14A within 120 days after the fiscal year ended December 31, 2019.
ITEM 11. – EXECUTIVE COMPENSATION.
The information required by this item will be included in our definitive proxy statement for the 2020 Annual Meeting of Stockholders and is incorporated herein by reference. We will file such definitive proxy statement with the SEC pursuant to Regulation 14A within 120 days after the fiscal year ended December 31, 2019.
ITEM 12. – SECURITY OWNERSHIP OF CERTAIN BENEFICIAL OWNERS AND MANAGEMENT AND RELATED STOCKHOLDER MATTERS.
The information required by this item will be included in our definitive proxy statement for the 2020 Annual Meeting of Stockholders and is incorporated herein by reference. We will file such definitive proxy statement with the SEC pursuant to Regulation 14A within 120 days after the fiscal year ended December 31, 2019.
ITEM 13. – CERTAIN RELATIONSHIPS AND RELATED TRANSACTIONS, AND DIRECTOR INDEPENDENCE.
The information required by this item will be included in our definitive proxy statement for the 2020 Annual Meeting of Stockholders and is incorporated herein by reference. We will file such definitive proxy statement with the SEC pursuant to Regulation 14A within 120 days after the fiscal year ended December 31, 2019.
ITEM 14. – PRINCIPAL ACCOUNTING FEES AND SERVICES.
The information required by this item will be included in our definitive proxy statement for the 2020 Annual Meeting of Stockholders and is incorporated herein by reference. We will file such definitive proxy statement with the SEC pursuant to Regulation 14A within 120 days after the fiscal year ended December 31, 2019.
156
ITEM 15. – EXHIBITS, FINANCIAL STATEMENT SCHEDULES.
|
(a) |
1. Financial Statements. |
The financial statements are set forth under Part II, Item 8. – “Financial Statements and Supplementary Data” of this Annual Report.
2. Financial Statement Schedules.
Financial statement schedules have been omitted because they are not required, are not applicable or the required information is included in the financial statements or the notes thereto in Part II, Item 8. – “Financial Statements and Supplementary Data.”
3. Exhibits.
The following exhibits are filed or furnished as a part of this Annual Report on Form 10-K:
|
Exhibit Number |
|
Description of Exhibit |
||
|
3.1 |
|
|||
|
3.2 |
|
|||
|
4.1 |
|
|||
|
4.2* |
|
Description of Securities Registered Pursuant to Section 12 of the Securities Exchange Act of 1934. |
||
|
10.1 |
|
|||
|
10.2 |
|
|||
|
10.3 |
|
|||
|
10.4 |
|
|||
157
|
Exhibit Number |
|
Description of Exhibit |
||
|
10.5 |
|
|||
|
10.6 |
|
|||
|
10.6.1 |
|
|||
|
10.7 |
|
|||
|
10.8† |
|
|||
|
10.9† |
|
|||
|
10.10† |
|
|||
|
10.11† |
|
|||
|
10.12† |
|
|||
|
10.13† |
|
|||
|
10.14† |
|
|||
158
|
Exhibit Number |
|
Description of Exhibit |
|||
|
10.15† |
|
||||
|
10.16† |
|
||||
|
10.17+ |
|
||||
|
21.1* |
|
||||
|
23.1* |
|
||||
|
23.2* |
|
||||
|
31.1* |
|
||||
|
31.2* |
|
||||
|
32.1** |
|
||||
|
32.2** |
|
||||
|
101.INS* |
|
XBRL Instance Document. |
|||
|
101.SCH* |
|
XBRL Taxonomy Extension Schema Document. |
|||
|
101.CAL* |
|
XBRL Taxonomy Extension Calculation Linkbase Document. |
|||
|
101.DEF* |
|
XBRL Taxonomy Extension Definition Linkbase Document. |
|||
|
101.LAB* |
|
XBRL Taxonomy Extension Label Linkbase Document. |
|||
|
101.PRE* |
|
XBRL Taxonomy Extension Presentation Linkbase Document. |
|||
None.
159
SIGNATURES
Pursuant to the requirements of Section 13 or 15(d) of the Securities Exchange Act of 1934, the registrant has duly caused this report to be signed on its behalf by the undersigned, thereunto duly authorized.
|
|
TRADEWEB MARKETS INC. |
|
|
|
|
|
|
|
|
|
|
February 21, 2020 |
/s/ Lee Olesky |
|
|
|
By: |
Lee Olesky |
|
|
|
Chief Executive Officer (Principal Executive Officer) |
Pursuant to the requirements of Section 13 or 15(d) of the Securities Exchange Act of 1934, this report has been signed below by the following persons on behalf of the registrant and in the capacities and on the dates indicated.
|
Signature |
Title |
Date |
|
|
|
|
|
/s/Lee Olesky Lee Olesky |
Chief Executive Officer (Principal Executive Officer) and Director |
February 21, 2020 |
|
/s/Robert Warshaw Robert Warshaw |
Chief Financial Officer (Principal Financial Officer and Principal Accounting Officer) |
February 21, 2020 |
|
/s/ Martin Brand Martin Brand |
Director |
February 21, 2020 |
|
/s/ John G. Finley John G. Finley |
Director |
February 21, 2020 |
|
/s/ Scott C. Ganeles Scott C. Ganeles |
Director |
February 21, 2020 |
|
/s/ William Hult William Hult |
Director |
February 21, 2020 |
|
/s/ Paula B. Madoff Paula B. Madoff |
Director |
February 21, 2020 |
|
/s/ Thomas Pluta Thomas Pluta |
Director |
February 21, 2020 |
|
/s/ Debra Walton Debra Walton |
Director |
February 21, 2020 |
|
/s/ Brian West Brian West |
Director |
February 21, 2020 |
160