Attached files
| file | filename |
|---|---|
| 8-K - FORM 8-K - VALMONT INDUSTRIES INC | tm209405-1_8k.htm |
| EX-99.1 - EXHIBIT 99.1 - VALMONT INDUSTRIES INC | tm209405d1_ex99-1.htm |
Exhibit 99.2
Valmont Industries, Inc. Fourth Quarter and Full Year 2019 Earnings Presentation February 20, 20203

Forward - looking Statement Disclosure These slides contain (and the accompanying oral discussion will contain) “forward - looking statements” within the meaning of the Private Securities Litigation Reform Act of 1995. Such statements involve known and unknown risks, uncertainties and other factors that could cause the actual results of the Company to differ materially from the results expressed or implied by such statements, including general economic and business conditions, conditions affecting the industries served by the Company and its subsidiaries, conditions affecting the Company’s customers and suppliers, competitor responses to the Company’s products and services, the overall market acceptance of such products and services, the integration of acquisitions and other factors disclosed in the Company’s periodic reports filed with the Securities and Exchange Commission. Consequently such forward - looking statements should be regarded as the Company’s current plans, estimates and beliefs. The Company does not undertake and specifically declines any obligation to publicly release the results of any revisions to these forward - looking statements that may be made to reflect any future events or circumstances after the date of such statements or to reflect the occurrence of anticipated or unanticipated events. 2 | February 20, 2020 | Valmont Industries, Inc. | 4Q 2019 Earnings Presentation
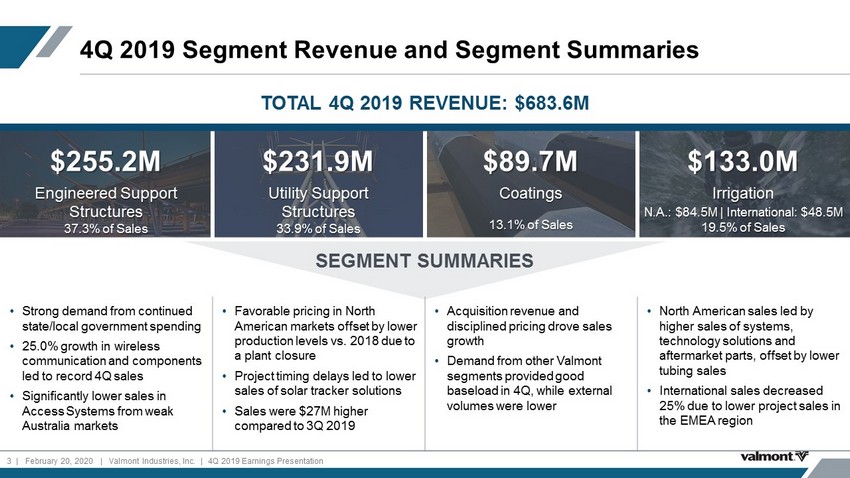
4 Q 2019 Segment Revenue and Segment Summaries 3 | February 20, 2020 | Valmont Industries, Inc. | 4Q 2019 Earnings Presentation $255.2M Engineered Support Structures 37.3% of Sales $231.9M Utility Support Structures 33.9% of Sales $89.7M Coatings 13.1% of Sales $ 133.0M Irrigation N.A .: $84.5M | International: $48.5M 19.5% of Sales SEGMENT SUMMARIES • Strong demand from continued state/local government spending • 25.0% growth in wireless communication and components led to record 4Q sales • Significantly lower sales in Access Systems from weak Australia markets • Favorable pricing in North American markets offset by lower production levels vs. 2018 due to a plant closure • Project timing delays led to lower sales of solar tracker solutions • Sales were $27M higher compared to 3Q 2019 • Acquisition revenue and disciplined pricing drove sales growth • Demand from other Valmont segments provided good baseload in 4Q, while external volumes were lower • North American sales led by higher sales of systems, technology solutions and aftermarket parts, offset by lower tubing sales • International sales decreased 25% due to lower project sales in the EMEA region TOTAL 4Q 2019 REVENUE: $683.6M
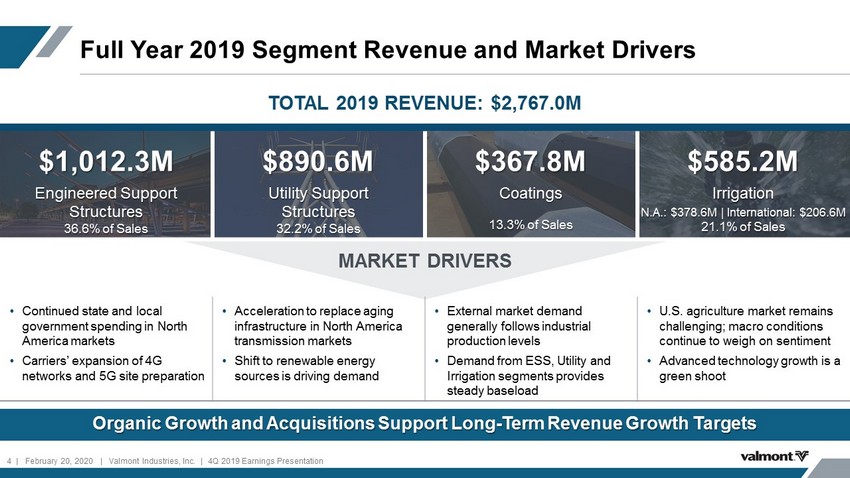
Full Year 2019 Segment Revenue and Market Drivers Organic Growth and Acquisitions Support Long - Term Revenue Growth Targets 4 | February 20, 2020 | Valmont Industries, Inc. | 4Q 2019 Earnings Presentation $1,012.3M Engineered Support Structures 36.6% of Sales $890.6M Utility Support Structures 32.2% of Sales $367.8M Coatings 13.3% of Sales $585.2M Irrigation N.A.: $378.6M | International: $206.6M 21.1% of Sales MARKET DRIVERS • Continued state and local government spending in North America markets • Carriers’ expansion of 4G networks and 5G site preparation • Acceleration to replace aging infrastructure in North America transmission markets • Shift to renewable energy sources is driving demand • External market demand generally follows industrial production levels • Demand from ESS, Utility and Irrigation segments provides steady baseload • U.S. agriculture market remains challenging; macro conditions continue to weigh on sentiment • Advanced technology growth is a green shoot TOTAL 2019 REVENUE: $ 2,767.0M
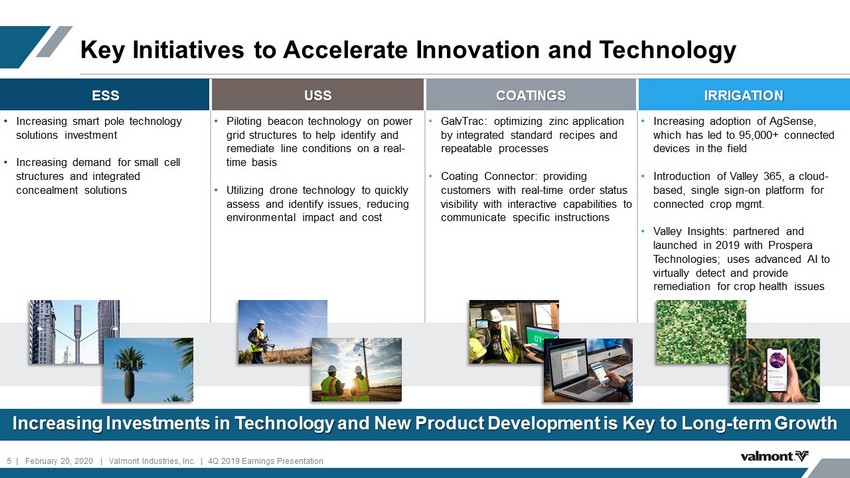
Key Initiatives to Accelerate Innovation and Technology Increasing Investments in Technology and New Product Development is Key to Long - term Growth 5 | February 20, 2020 | Valmont Industries, Inc. | 4Q 2019 Earnings Presentation ESS USS COATINGS IRRIGATION • Increasing smart pole technology solutions investment • Increasing demand for small cell structures and integrated concealment solutions • Piloting beacon technology on power grid structures to help identify and remediate line conditions on a real - time basis • Utilizing drone technology to quickly assess and identify issues, reducing environmental impact and cost • GalvTrac: optimizing zinc application by integrated standard recipes and repeatable processes • Coating Connector: providing customers with real - time order status visibility with interactive capabilities to communicate specific instructions • Increasing adoption of AgSense, which has led to 95,000+ connected devices in the field • Introduction of Valley 365, a cloud - based, single sign - on platform for connected crop mgmt. • Valley Insights: partnered and launched in 2019 with Prospera Technologies; uses advanced AI to virtually detect and provide remediation for crop health issues
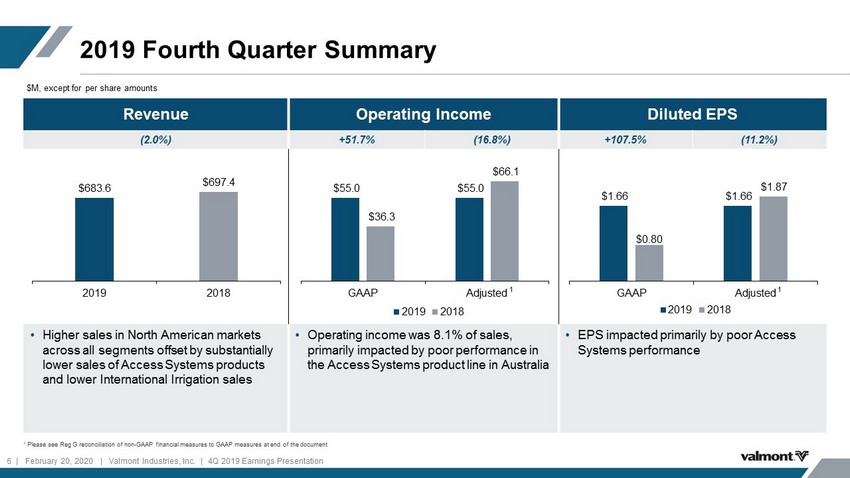
2019 Fourth Quarter Summary Revenue Operating Income Diluted EPS ( 2.0%) +51.7% (16.8%) +107.5% ( 11.2%) • Higher sales in North American markets across all segments offset by substantially lower sales of Access Systems products and lower International Irrigation sales • Operating income was 8.1% of sales , primarily impacted by poor performance in the Access Systems product line in Australia • EPS impacted primarily by poor Access Systems performance $M, except for per share amounts 1 Please see Reg G reconciliation of non - GAAP financial measures to GAAP measures at end of the document $683.6 $697.4 2019 2018 $55.0 $55.0 $36.3 $66.1 GAAP Adjusted 2019 2018 $1.66 $1.66 $0.80 $1.87 GAAP Adjusted 2019 2018 1 1 6 | February 20, 2020 | Valmont Industries, Inc. | 4Q 2019 Earnings Presentation
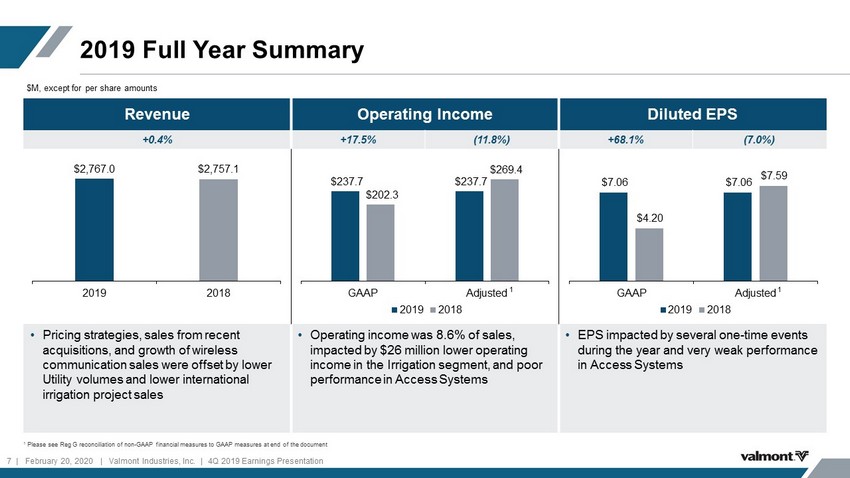
2019 Full Year Summary Revenue Operating Income Diluted EPS +0.4% +17.5% (11.8%) +68.1% (7.0%) • Pricing strategies, sales from recent acquisitions, and growth of wireless communication sales were offset by lower Utility volumes and lower international irrigation project sales • Operating income was 8.6% of sales, impacted by $26 million lower operating income in the Irrigation segment, and poor performance in Access Systems • EPS impacted by several one - time events during the year and very weak performance in Access Systems $M, except for per share amounts 1 Please see Reg G reconciliation of non - GAAP financial measures to GAAP measures at end of the document $2,767.0 $2,757.1 2019 2018 $237.7 $237.7 $202.3 $269.4 GAAP Adjusted 2019 2018 $7.06 $7.06 $4.20 $7.59 GAAP Adjusted 2019 2018 1 1 7 | February 20, 2020 | Valmont Industries, Inc. | 4Q 2019 Earnings Presentation
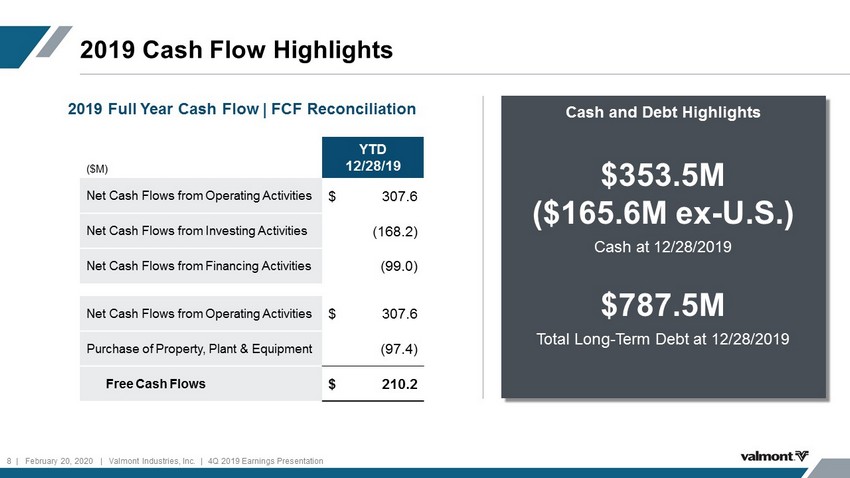
2019 Cash Flow Highlights 8 | February 20 , 2020 | Valmont Industries, Inc. | 4Q 2019 Earnings Presentation ($M) YTD 12/28/19 Net Cash Flows from Operating Activities $ 307.6 Net Cash Flows from Investing Activities ( 168.2) Net Cash Flows from Financing Activities (99.0) Net Cash Flows from Operating Activities $ 307.6 Purchase of Property, Plant & Equipment (97.4) Free Cash Flows $ 210.2 2019 Full Year Cash Flow | FCF Reconciliation Cash and Debt Highlights $353.5M ($165.6M ex - U.S.) Cash at 12/28/2019 $ 787.5M Total Long - Term Debt at 12/28/2019

Capital Allocation | A Balanced Approach Aligned with Capital Allocation Commitments Announced in 2014 ($M) $97 $82 $63 $33 Capital Expenditures Acquisitions Share Repurchases Dividends 2019 Capital Deployment: $275M Capital Expenditures • Working capital investment to support investments in people, technology and systems • CapEx of $97 M in 2019 Acquisitions • Strategic fit + market expansion • Returns exceeding cost of capital within 3 years Share Repurchases • Opportunistic approach • Supported by FCF • $204M remains on current authorization as of 12/28/19 Dividends • Payout ratio target: 15% of earnings • Current payout: 21% 9 | February 20, 2020 | Valmont Industries, Inc. | 4Q 2019 Earnings Presentation Growing Our Business Returning Cash to Shareholders
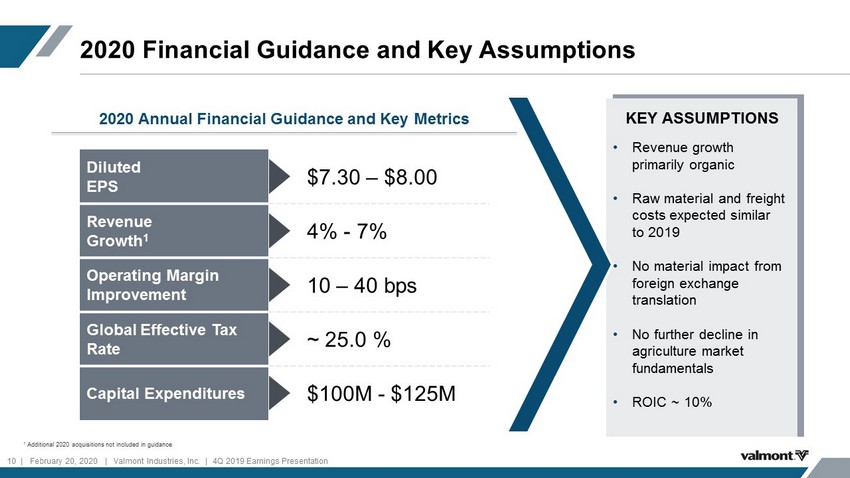
2020 Financial Guidance and Key Assumptions KEY ASSUMPTIONS • Revenue growth primarily organic • Raw material and freight costs expected similar to 2019 • No material impact from foreign exchange translation • No further decline in agriculture market fundamentals • ROIC ~ 10% 2020 Annual Financial Guidance and Key Metrics Diluted EPS $7.30 – $8.00 Revenue Growth 1 4% - 7% Operating Margin Improvement 10 – 40 bps Global Effective Tax Rate ~ 25.0 % Capital Expenditures $100M - $125M 1 Additional 2020 acquisitions not included in guidance 10 | February 20, 2020 | Valmont Industries, Inc. | 4Q 2019 Earnings Presentation

2020 Market Drivers and Outlook by Segment 11 | February 20, 2020 | Valmont Industries, Inc. | 4Q 2019 Earnings Presentation ESS • Continued government investments in infrastructure development (i.e., lighting and traffic) • Continued growth of wireless communication products and components; anticipate 5G investments to accelerate in 2H20 • Accelerating the strategic evaluation of Access Systems business to determine a path to profitability and improved returns on invested capital USS • Record 2020 global backlog of ~$500M, supported by increased demand across all substrates from investments in grid hardening and renewables • Adding capacity to North American plants with associated revenue to ramp during the year COATINGS • 2020 sales expected to be similar to 2019 assuming current U.S. industrial production levels remain unchanged IRRIGATION • Expect 2020 sales to be flat to - 3 %; grower sentiment stabilizing but U.S. net farm income not expected to substantially improve • International sales growth in Brazil – strategic dealer network expansion to meet increased demand
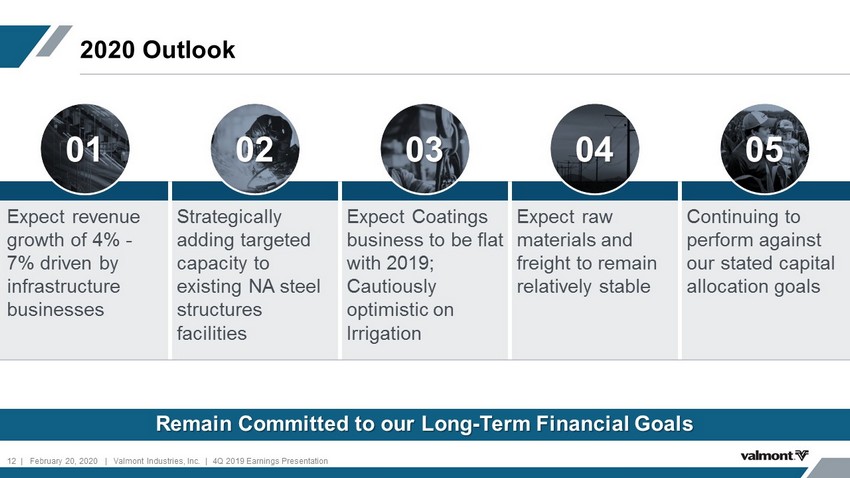
Expect revenue growth of 4% - 7% driven by infrastructure businesses Strategically adding targeted capacity to existing NA steel structures facilities Expect Coatings business to be flat with 2019; Cautiously optimistic on Irrigation Expect raw materials and freight to remain relatively stable Continuing to perform against our stated capital allocation goals 2020 Outlook Remain Committed to our Long - Term Financial Goals 01 05 02 04 03 12 | February 20, 2020 | Valmont Industries, Inc. | 4Q 2019 Earnings Presentation
APPENDIX 13 | February 20, 2020 | Valmont Industries, Inc. | 4Q 2019 Earnings Presentation

Fourth Quarter and Full Year 2019 Financial Summary Net Sales 2019 2018 Change FY 2019 FY 2018 Change Engineered Support Structures $ 25 5.2 $ 25 9 . 7 (1.7%) $ 1,012.3 $ 9 86.9 2.6% Utility Support Structures 23 1.9 2 3 3. 3 ( 0.6%) 890.6 859. 2 3.7% Coatings 8 9.7 8 6 . 4 3.8% 3 67.8 3 53.4 4.1% Irrigation 1 33.0 14 2.6 ( 6.7%) 585.2 6 33.7 ( 7.6%) Other - - NM - 23.1 NM Intersegment Sales ( 26.2) ( 2 4.7) NM ( 88.9) ( 9 9.0) NM Net Sales $ 6 83.6 $ 697.4 ( 2. 0%) $ 2,7 67.0 $ 2, 757.1 0.4 % Operating Income $ 55.0 $ 36.3 51.7% $ 2 37.7 $ 2 02.3 17.5% Adjusted Operating Income 1 $ 55.0 $ 6 6.1 (16.8%) $ 2 37.7 $ 26 9.4 (11.8%) Net Income (loss) $ 35.7 $ 17.7 102.4% $ 153.8 $ 94.4 62.9% Adjusted Net Income 1 $ 35.7 $ 41.3 (13.5%) $ 153.8 $ 1 70.4 (9.7%) Diluted Earnings (loss) Per Share (EPS) $ 1.66 $ 0.80 107.5% $ 7.06 $ 4.20 68.1% Adjusted Diluted (EPS) $ 1. 66 $ 1. 87 (11.2%) $ 7. 06 $ 7.59 (7.0%) 1 Please see Reg G reconciliation of non - GAAP financial measures to GAAP measures at end of the document. $M, except for per share amounts 14 | February 20, 2020 | Valmont Industries, Inc. | 4Q 2019 Earnings Presentation
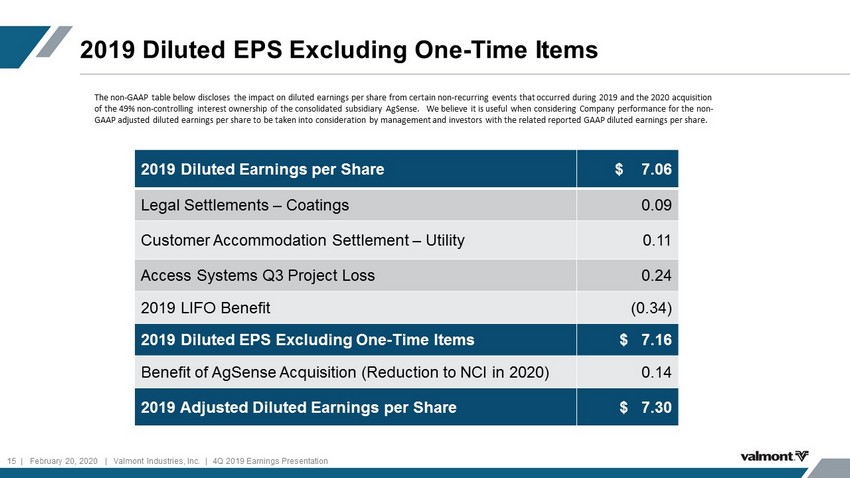
2019 Diluted EPS Excluding One - Time Items 2019 Diluted Earnings per Share $ 7.06 Legal Settlements – Coatings 0.09 Customer Accommodation Settlement – Utility 0.11 Access Systems Q3 Project Loss 0.24 2019 LIFO Benefit (0.34) 2019 Diluted EPS Excluding One - Time Items $ 7.16 Benefit of AgSense Acquisition (Reduction to NCI in 2020) 0.14 2019 Adjusted Diluted Earnings per Share $ 7.30 15 | February 20, 2020 | Valmont Industries, Inc. | 4Q 2019 Earnings Presentation The non - GAAP table below discloses the impact on diluted earnings per share from certain non - recurring events that occurred duri ng 2019 and the 2020 acquisition of the 49% non - controlling interest ownership of the consolidated subsidiary AgSense. We believe it is useful when considering Company performance for the non - GAAP adjusted diluted earnings per share to be taken into consideration by management and investors with the related reported GA AP diluted earnings per share.
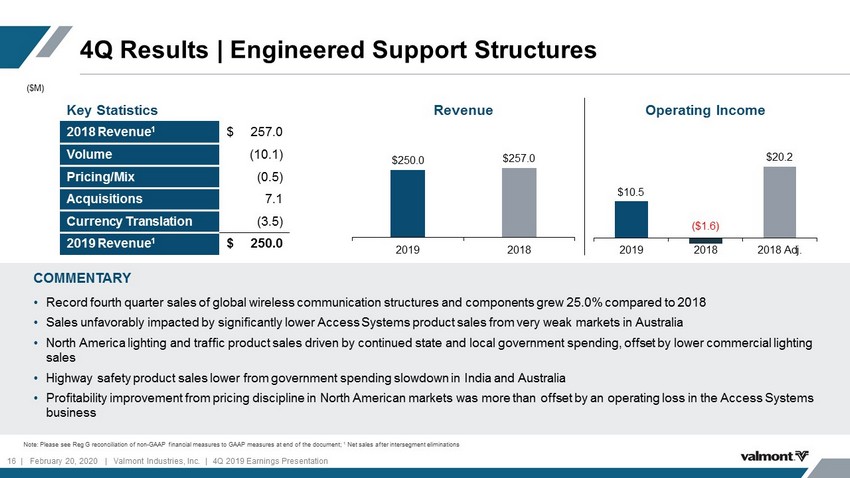
Revenue Operating Income 4Q Results | Engineered Support Structures COMMENTARY • Record fourth quarter sales of global wireless communication structures and components grew 25.0% compared to 2018 • Sales unfavorably impacted by significantly lower Access Systems product sales from very weak markets in Australia • North America lighting and traffic product sales driven by continued state and local government spending, offset by lower commercial lighting sales • Highway safety product sales lower from government spending slowdown in India and Australia • Profitability improvement from pricing discipline in North American markets was more than offset by an operating loss in the Access Systems business Note: Please see Reg G reconciliation of non - GAAP financial measures to GAAP measures at end of the document; 1 Net sales after intersegment eliminations ($M) Key Statistics 2018 Revenue 1 $ 257.0 Volume (10.1) Pricing/Mix (0.5) Acquisitions 7.1 Currency Translation (3.5) 2019 Revenue 1 $ 250.0 $250.0 $257.0 2019 2018 $10.5 ($1.6) $20.2 2019 2018 2018 Adj. 16 | February 20, 2020 | Valmont Industries, Inc. | 4Q 2019 Earnings Presentation
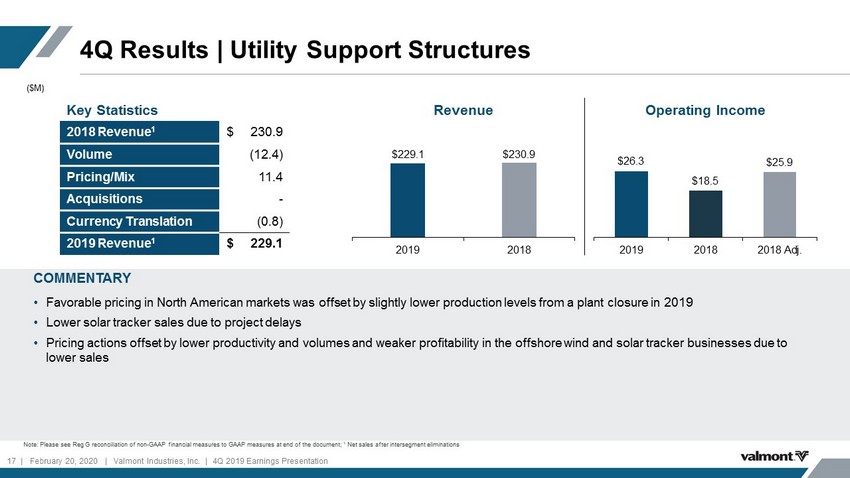
Revenue Operating Income 4Q Results | Utility Support Structures COMMENTARY • Favorable pricing in North American markets was offset by slightly lower production levels from a plant closure in 2019 • Lower solar tracker sales due to project delays • Pricing actions offset by lower productivity and volumes and weaker profitability in the offshore wind and solar tracker businesses due to lower sales Note: Please see Reg G reconciliation of non - GAAP financial measures to GAAP measures at end of the document; 1 Net sales after intersegment eliminations ($M) Key Statistics 2018 Revenue 1 $ 230.9 Volume (12.4) Pricing/Mix 11.4 Acquisitions - Currency Translation (0.8) 2019 Revenue 1 $ 229.1 $229.1 $230.9 2019 2018 $26.3 $18.5 $25.9 2019 2018 2018 Adj. 17 | February 20, 2020 | Valmont Industries, Inc. | 4Q 2019 Earnings Presentation
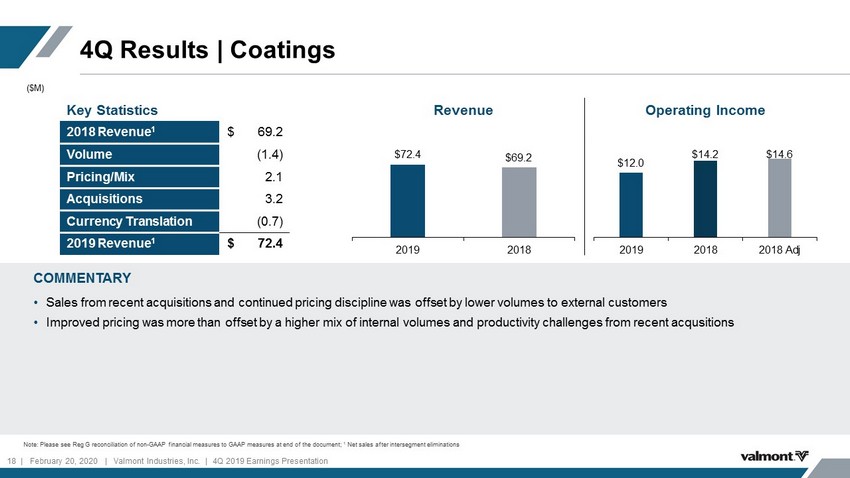
Revenue Operating Income 4Q Results | Coatings COMMENTARY • Sales from recent acquisitions and continued pricing discipline was offset by lower volumes to external customers • Improved pricing was more than offset by a higher mix of internal volumes and productivity challenges from recent acqusitions Note: Please see Reg G reconciliation of non - GAAP financial measures to GAAP measures at end of the document; 1 Net sales after intersegment eliminations ($M) Key Statistics 2018 Revenue 1 $ 69.2 Volume (1.4) Pricing/Mix 2.1 Acquisitions 3.2 Currency Translation (0.7) 2019 Revenue 1 $ 72.4 $72.4 $69.2 2019 2018 $12.0 $14.2 $14.6 2019 2018 2018 Adj 18 | February 20, 2020 | Valmont Industries, Inc. | 4Q 2019 Earnings Presentation
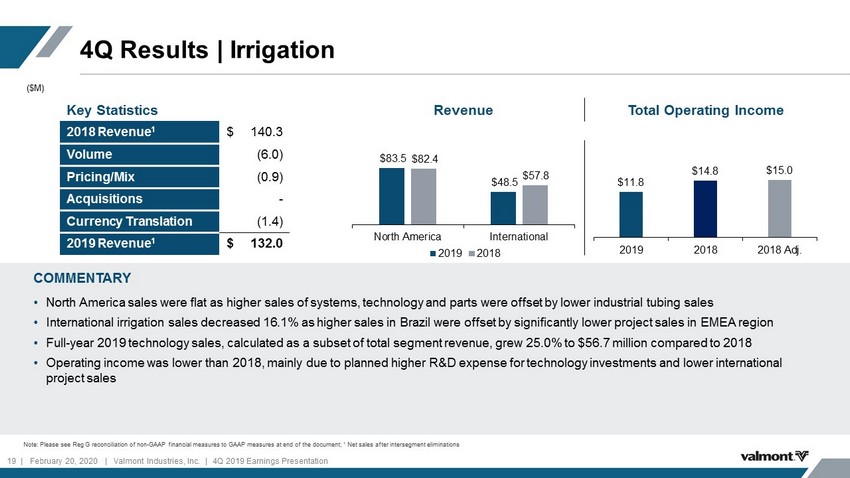
Revenue Total Operating Income 4Q Results | Irrigation COMMENTARY • North America sales were flat as higher sales of systems, technology and parts were offset by lower industrial tubing sales • International irrigation sales decreased 16.1% as higher sales in Brazil were offset by significantly lower project sales in EME A region • Full - year 2019 technology sales, calculated as a subset of total segment revenue, grew 25.0% to $56.7 million compared to 2018 • Operating income was lower than 2018, mainly due to planned higher R&D expense for technology investments and lower internati ona l project sales Note: Please see Reg G reconciliation of non - GAAP financial measures to GAAP measures at end of the document; 1 Net sales after intersegment eliminations ($M) Key Statistics 2018 Revenue 1 $ 140.3 Volume (6.0) Pricing/Mix (0.9) Acquisitions - Currency Translation (1.4) 2019 Revenue 1 $ 132.0 $11.8 $14.8 $15.0 2019 2018 2018 Adj. 2019 2018 $83.5 $48.5 $82.4 $57.8 North America International 19 | February 20, 2020 | Valmont Industries, Inc. | 4Q 2019 Earnings Presentation
New State - of - the - Art Manufacturing Facility Opens in Poland 20 | February 20, 2020 | Valmont Industries, Inc. | 4Q 2019 Earnings Presentation
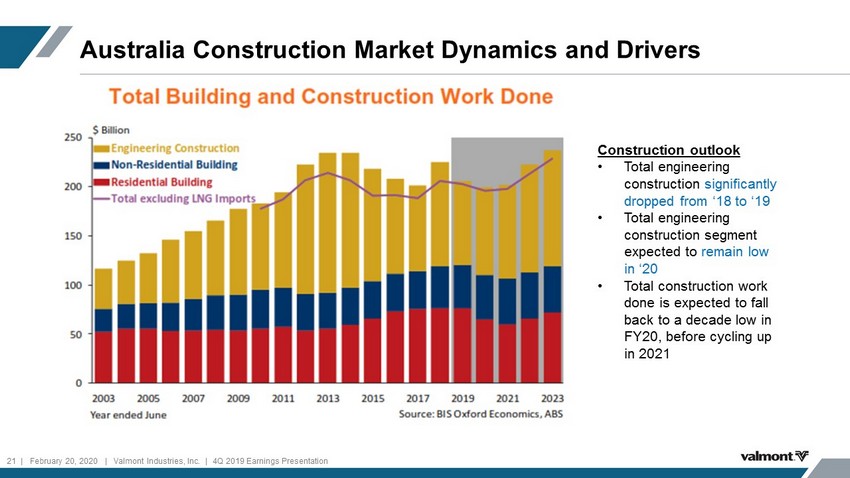
Australia Construction Market Dynamics and Drivers 21 | February 20, 2020 | Valmont Industries, Inc. | 4Q 2019 Earnings Presentation Construction outlook • Total engineering construction significantly dropped from ‘18 to ‘19 • Total engineering construction segment expected to remain low in ‘20 • Total construction work done is expected to fall back to a decade low in FY20, before cycling up in 2021
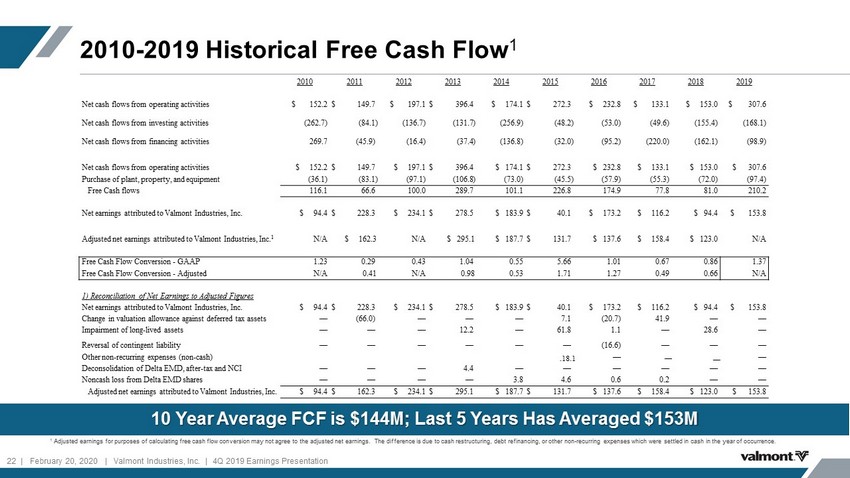
2010 - 2019 Historical Free Cash Flow 1 10 Year Average FCF is $ 144M ; Last 5 Years Has Averaged $ 153M 20 10 201 1 201 2 201 3 201 4 201 5 201 6 201 7 201 8 201 9 Net cash flows from operating activities $ 152.2 $ 149.7 $ 1 97 . 1 $ 396.4 $ 174 . 1 $ 272 . 3 $ 232 . 8 $ 133.1 $ 1 5 3. 0 $ 307 . 6 Net cash flows from investing activities ( 262.7 ) ( 84 . 1 ) ( 136 . 7 ) ( 13 1 .7 ) ( 256 . 9 ) ( 48 . 2 ) ( 53 . 0 ) ( 49 . 6 ) ( 155 . 4 ) ( 1 68 . 1 ) Net cash flows from financing activities 269 . 7 (45 . 9) ( 16 . 4 ) ( 37 .4 ) ( 1 3 6 . 8 ) ( 32 . 0 ) ( 95 . 2 ) ( 220 . 0 ) ( 162 . 1 ) ( 98 . 9 ) Net cash flows from operating activities $ 152 . 2 $ 149 . 7 $ 1 97 . 1 $ 3 9 6 . 4 $ 174 . 1 $ 272 . 3 $ 2 3 2. 8 $ 133.1 $ 1 5 3. 0 $ 3 07 . 6 Purchase of plant, property, and equipment ( 36 .1 ) ( 83 .1 ) ( 97 .1 ) ( 106 . 8 ) ( 73 . 0 ) ( 45.5 ) ( 57 . 9 ) ( 5 5 . 3 ) ( 72 . 0 ) ( 97 . 4 ) Free Cash flows 116 . 1 6 6. 6 100 . 0 289 . 7 101 . 1 226 . 8 174 . 9 7 7. 8 81 . 0 210 . 2 Net earnings attributed to Valmont Industries, Inc. $ 94 . 4 $ 228 . 3 $ 2 34 . 1 $ 2 78 . 5 $ 183 . 9 $ 40 . 1 $ 173 . 2 $ 1 16 .2 $ 94 . 4 $ 153 . 8 Adjusted net earnings attributed to Valmont Industries, Inc. 1 N/A $ 162.3 N/A $ 295.1 $ 187 . 7 $ 1 31.7 $ 13 7 . 6 $ 1 58 . 4 $ 1 23 . 0 N/A Free Cash Flow Conversion - GAAP 1 . 2 3 0 .2 9 0. 43 1 . 04 0 . 55 5 . 66 1 . 01 0 . 67 0. 8 6 1 . 37 Free Cash Flow Conversion - Adjusted N/A 0.41 N/A 0.98 0. 53 1 . 71 1. 27 0 . 49 0. 66 N/A 1) Reconciliation of Net Earnings to Adjusted Figures Net earnings attributed to Valmont Industries, Inc. $ 94 . 4 $ 228 . 3 $ 2 34 . 1 $ 2 78 . 5 $ 183 . 9 $ 40 . 1 $ 173 . 2 $ 1 16 .2 $ 94 . 4 $ 153.8 Change in valuation allowance against deferred tax assets — (66.0) — — — 7.1 (20.7) 41.9 — — Impairment of long - lived assets — — — 12.2 — 61.8 1. 1 — 28.6 — Reversal of contingent liability — — — — — — (16.6) — — — Other non - recurring expenses (non - cash) 18. 18.1 — — — — Deconsolidation of Delta EMD, after - tax and NCI — — — 4.4 — — — — — — Noncash loss from Delta EMD shares — — — — 3.8 4 . 6 0 .6 0. 2 — — Adjusted net earnings attributed to Valmont Industries, Inc. $ 94 . 4 $ 162 . 3 $ 234 . 1 $ 295 .1 $ 187 . 7 $ 1 31 .7 $ 13 7 . 6 $ 1 58 . 4 $ 1 23 . 0 $ 1 5 3. 8 1 Adjusted earnings for purposes of calculating free cash flow conversion may not agree to the adjusted net earnings. The differ ence is due to cash restructuring, debt refinancing, or other non - recurring expenses which were settled in cash in the year of o ccurrence. 22 | February 20, 2020 | Valmont Industries, Inc. | 4Q 2019 Earnings Presentation
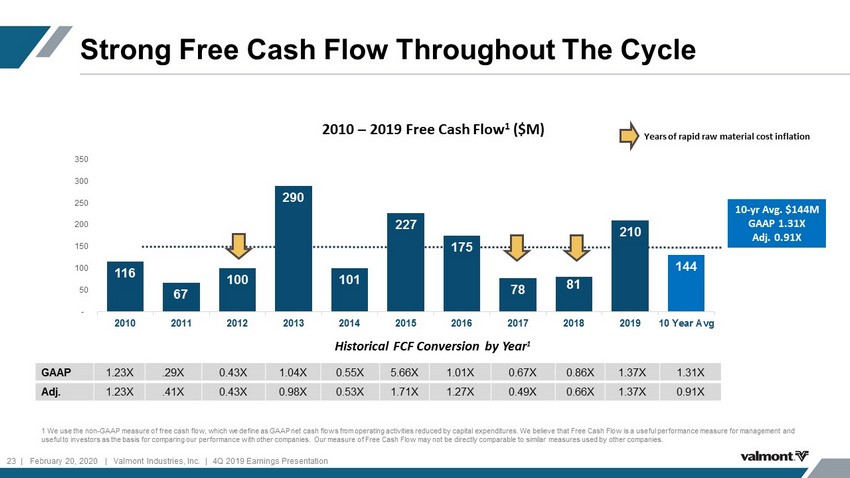
Strong Free Cash Flow Throughout The Cycle Years of rapid raw material cost inflation GAAP 1.23X .29X 0.43X 1.04X 0.55X 5.66X 1.01X 0.67X 0.86X 1.37X 1.31X Adj. 1.23X .41X 0.43X 0.98X 0.53X 1.71X 1.27X 0.49X 0.66X 1.37X 0.91X Historical FCF Conversion by Year 1 2010 – 2019 Free Cash Flow 1 ($M) 1 We use the non - GAAP measure of free cash flow, which we define as GAAP net cash flows from operating activities reduced by cap ital expenditures. We believe that Free Cash Flow is a useful performance measure for management and useful to investors as the basis for comparing our performance with other companies. Our measure of Free Cash Flow may not b e d irectly comparable to similar measures used by other companies. 116 67 100 290 101 227 175 78 81 210 144 - 50 100 150 200 250 300 350 2010 2011 2012 2013 2014 2015 2016 2017 2018 2019 10 Year Avg 10 - yr Avg. $ 144M GAAP 1.31X Adj. 0.91X 23 | February 20, 2020 | Valmont Industries, Inc. | 4Q 2019 Earnings Presentation

Calculation of Adjusted EBITDA & Leverage Ratio Certain of our debt agreements contain covenants that require us to maintain certain coverage ratios. Our Debt/Adjusted EBITDA may not exceed 3.5X Adjusted EBITDA (or 3.75X Adjusted EBITDA after certain material acquisitions) of the prior four quarters. See “Leverage Ratio “ below. YTD 2 8 - Dec - 1 9 Net earnings attributable to Valmont Industries, Inc. $ 153,769 Interest expense 40,153 Income tax expense 50,207 Depreciation and amortization expense 82, 264 EBITDA 326,293 Debt $ 7 87,478 Leverage Ratio 2. 41 24 | February 20, 2020 | Valmont Industries, Inc. | 4Q 2019 Earnings Presentation

Summary of Effect of Significant Non - recurring Items on Reported Results VALMONT INDUSTRIES, INC. AND SUBSIDIARIES SUMMARY OF EFFECT OF SIGNIFICANT NON - RECURRING ITEMS ON REPORTED 2018 RESULTS REGULATION G RECONCILIATION (Dollars in thousands, except per share amounts) (unaudited) The non - GAAP tables below disclose the impact on (a) diluted earnings per share of (1) debt refinancing expenses (2) impairment of goodwill and tradename (3) restructuring and related asset impairment costs (4) non - recurring costs of a vendor quality issue that we expect to recover through future purcha ses (5) acquisition diligence expenses and (6) the loss from divestiture of its grinding media business, (b) operating income of (1) impairment of goodwill and tradename (2) re str ucturing and related asset impairment costs (3) a non - recurring vendor quality issue (4) acquisition diligence expenses, and (c) segment operating income for these same 4 categor ies of expenses. Amounts may be impacted by rounding. We believe it is useful when considering company performance for the non - GAAP adjusted net earnings and operating inco me to be taken into consideration by management and investors with the related reported GAAP measures. Thirteen Weeks Ended December 29, 2018 Diluted earnings per share Year ended December 29, 2018 Diluted earnings per share Net earnings attributable to Valmont Industries, Inc. - as reported $ 17,662 $ 0.80 $ 94,351 $ 4.20 Debt refinancing expenses, pre - tax — — 14,820 0.66 Impairment of goodwill and tradename, pre - tax (743 ) (0.03 ) 15,037 0.67 Restructuring and related asset impairment costs - pre - tax 24,313 1.10 41,975 1.87 Non - recurring costs for vendor quality issue (Utility), pre - tax 5,000 0.23 5,000 0.22 Acquisition diligence costs, pre - tax 520 0.02 4,360 0.19 Loss from divestiture of grinding media business, pre - tax — — 6,084 0.27 Total Adjustments 29,090 1.32 87,276 3.89 Tax effect of adjustments * (5,407 ) (0.25 ) (10,767 ) (0.48 ) Completion of 2017 tax reform adjustment — — (491 ) (0.02 ) Net earnings attributable to Valmont Industries, Inc. - Adjusted $ 41,345 $ 1.87 $ 170,369 $ 7.59 Average shares outstanding (000’s) - Diluted 22,061 22,446 25 | February 20, 2020 | Valmont Industries, Inc. | 4Q 2019 Earnings Presentation
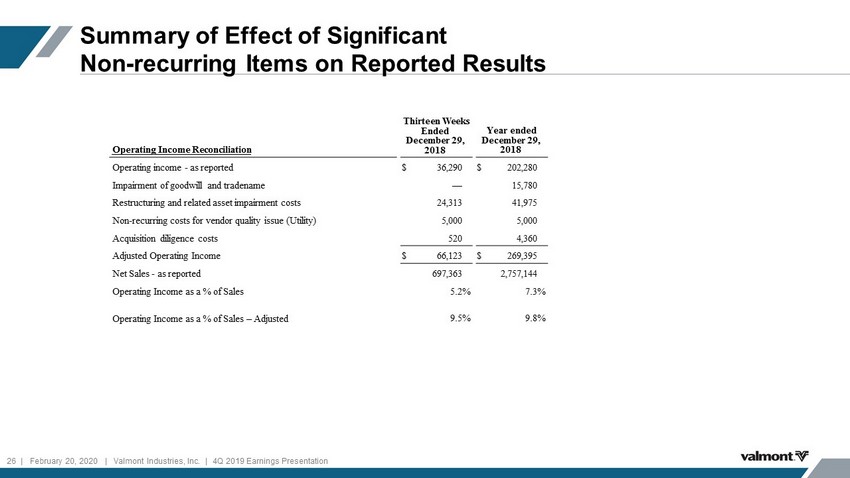
Summary of Effect of Significant Non - recurring Items on Reported Results Thirteen Weeks Ended December 29, 2018 Year ended December 29, 2018 Operating Income Reconciliation Operating income - as reported $ 36,290 $ 202,280 Impairment of goodwill and tradename — 15,780 Restructuring and related asset impairment costs 24,313 41,975 Non - recurring costs for vendor quality issue (Utility) 5,000 5,000 Acquisition diligence costs 520 4,360 Adjusted Operating Income $ 66,123 $ 269,395 Net Sales - as reported 697,363 2,757,144 Operating Income as a % of Sales 5 .2 % 7.3 % Operating Income as a % of Sales – Adjusted 9.5 % 9.8 % 26 | February 20, 2020 | Valmont Industries, Inc. | 4Q 2019 Earnings Presentation
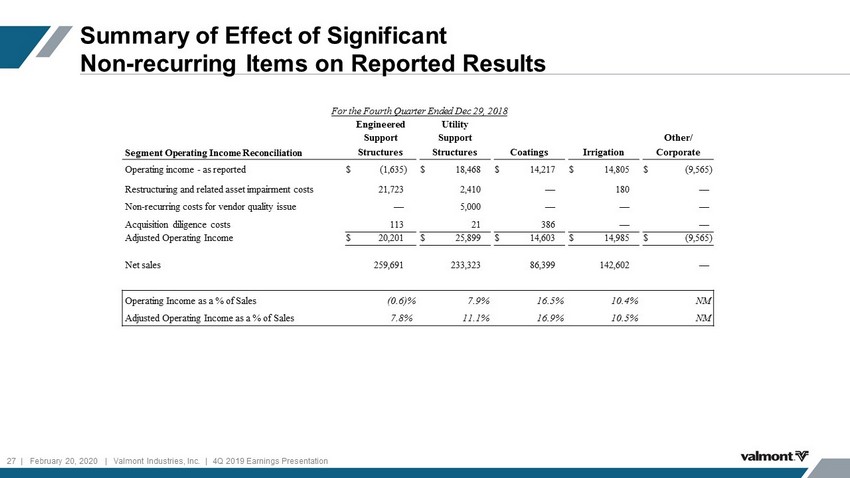
Summary of Effect of Significant Non - recurring Items on Reported Results For the Fourth Quarter Ended Dec 29, 2018 Engineered Utility Support Support Other/ Segment Operating Income Reconciliation Structures Structures Coatings Irrigation Corporate Operating income - as reported $ (1,635 ) $ 18,468 $ 14,217 $ 14,805 $ (9,565 ) Restructuring and related asset impairment costs 21,723 2,410 — 180 — Non - recurring costs for vendor quality issue — 5,000 — — — Acquisition diligence costs 113 21 386 — — Adjusted Operating Income $ 20,201 $ 25,899 $ 14,603 $ 14,985 $ (9,565 ) Net sales 259,691 233,323 86,399 142,602 — Operating Income as a % of Sales (0.6 )% 7.9 % 16.5 % 10.4 % NM Adjusted Operating Income as a % of Sales 7.8 % 11.1 % 16.9 % 10.5 % NM 27 | February 20, 2020 | Valmont Industries, Inc. | 4Q 2019 Earnings Presentation