Attached files
| file | filename |
|---|---|
| EX-99.1 - EXHIBIT 99.1 - INTERPUBLIC GROUP OF COMPANIES, INC. | ipgq42019earningsrelease.htm |
| 8-K - 8-K - INTERPUBLIC GROUP OF COMPANIES, INC. | ipgq42019earningsrelea.htm |

FOURTH QUARTER & FULL YEAR 2019 EARNINGS CONFERENCE CALL Interpublic Group February 12, 2020

Overview • Fourth quarter 2019 net revenue increased 0.8% • Fourth quarter organic growth of net revenue was 2.9%, comprised of 2.1% in the US and 4.1% in our international markets • FY-19 net revenue increased 7.4%, with organic growth of 3.3% • FY-19 net income was $656 million • FY-19 adjusted EBITA margin was 14.0%, an increase of 50 bps, and adjusted EBITA increased 11.3% • FY-19 diluted EPS was $1.68, and adjusted diluted EPS was $1.93 compared with $1.86 in FY-18 as similarly adjusted • Total debt decreased by $408 million from a year ago • Increased quarterly common share dividend 9% to $0.255 "Organic growth" refers exclusively to the organic change of net revenue. Full year adjusted EBITA is operating income as adjusted for amortization of acquired intangibles, first quarter restructuring charges in 2019 and Acxiom transaction costs in 2018. Adjusted diluted EPS is adjusted for amortization of acquired intangibles, sales of businesses, discrete tax items, first quarter restructuring charges in 2019 and Acxiom 2 transaction costs in 2018. See reconciliations of organic net revenue change on pages 17-18 and adjusted non-GAAP reconciliations on pages 19-23.

Operating Performance (Amounts in Millions, except per share amounts) Three Months Ended December 31, 2019 2018 Net Revenue $ 2,433.0 $ 2,413.7 Billable Expenses 468.8 442.3 Total Revenue 2,901.8 2,856.0 Salaries and Related Expenses 1,432.1 1,423.7 Office and Other Direct Expenses 419.7 381.0 Billable Expenses 468.8 442.3 Cost of Services 2,320.6 2,247.0 Selling, General and Administrative Expenses (1) 24.5 81.0 Depreciation and Amortization 65.4 68.9 Restructuring Charges 0.0 0.0 Operating Income 491.3 459.1 Interest Expense, net (38.7) (41.6) Other Expense, net (24.8) (13.6) Income Before Income Taxes 427.8 403.9 Provision for Income Taxes 86.1 62.2 Equity in Net Income of Unconsolidated Affiliates 0.5 0.8 Net Income 342.2 342.5 Net Income Attributable to Noncontrolling Interests (13.3) (16.3) Net Income Available to IPG Common Stockholders $ 328.9 $ 326.2 Earnings per Share Available to IPG Common Stockholders - Basic $ 0.85 $ 0.85 Earnings per Share Available to IPG Common Stockholders - Diluted $ 0.84 $ 0.84 Weighted-Average Number of Common Shares Outstanding - Basic 386.9 383.4 Weighted-Average Number of Common Shares Outstanding - Diluted 393.3 390.3 Dividends Declared per Common Share $ 0.235 $ 0.210 3 (1) Includes $22.6 related to Acxiom transaction costs in 2018.

Net Revenue ($ in Millions) Three Months Ended Twelve Months Ended $ % Change $ % Change December 31, 2018 $ 2,413.7 $ 8,031.6 Total change 19.3 0.8% 593.5 7.4% Foreign currency (24.0) (1.0%) (143.1) (1.7%) Net acquisitions/(divestitures) (27.5) (1.1%) 467.8 5.8% Organic 70.8 2.9% 268.8 3.3% December 31, 2019 $ 2,433.0 $ 8,625.1 Three Months Ended Twelve Months Ended December 31, December 31, Change Change 2019 2018 Organic Total 2019 2018 Organic Total IAN (1) $ 2,087.3 $ 2,076.6 2.9% 0.5% $ 7,348.2 $ 6,767.5 3.5% 8.6% CMG $ 345.7 $ 337.1 3.3% 2.6% $ 1,276.9 $ 1,264.1 2.3% 1.0% (1) Results for December 31, 2018 have been recast to conform to the current-period presentation. 4 See reconciliations of segment organic net revenue change on pages 17-18.

Geographic Net Revenue Change Three Months Ended Twelve Months Ended December 31, 2019 December 31, 2019 Organic Total Organic Total United States 2.1% 1.5% 1.9% 11.6% International 4.1% (0.2%) 5.5% 1.0% United Kingdom 4.0% 2.9% 3.7% 2.1% Continental Europe 6.2% (0.6%) 7.3% 0.7% Asia Pacific (3.0%) (7.8%) (0.3%) (4.3%) Latin America 17.1% 8.6% 21.8% 11.4% All Other Markets 4.7% 4.7% 4.6% 2.1% Worldwide 2.9% 0.8% 3.3% 7.4% “All Other Markets” includes Canada, Africa and the Middle East. 5 See reconciliations of organic net revenue change on pages 17-18.
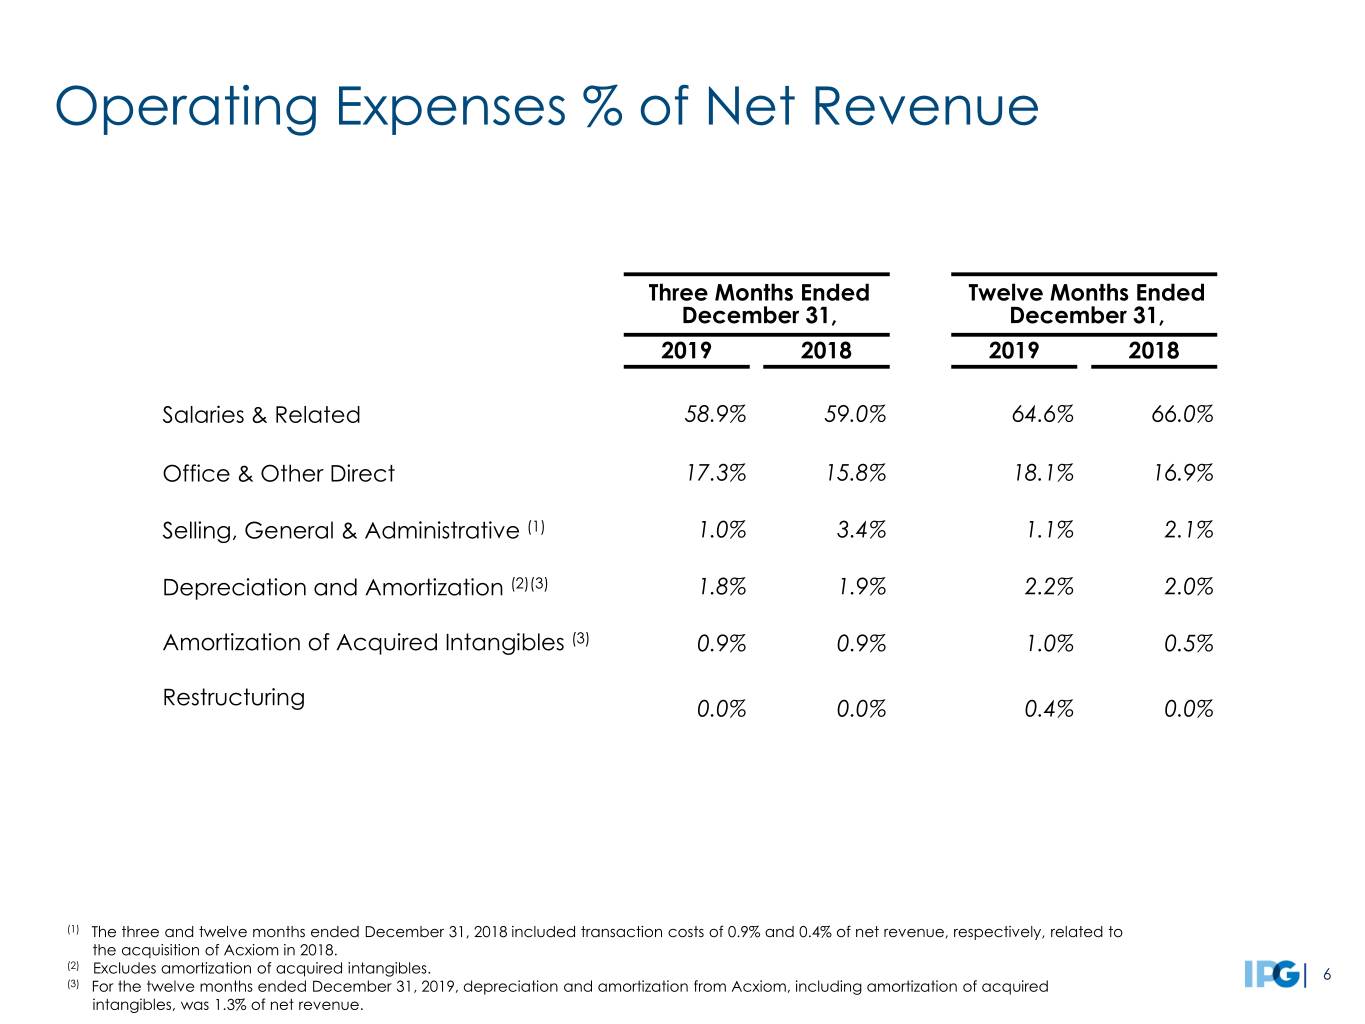
Operating Expenses % of Net Revenue Three Months Ended Twelve Months Ended December 31, December 31, 2019 2018 2019 2018 Salaries & Related 58.9% 59.0% 64.6% 66.0% Office & Other Direct 17.3% 15.8% 18.1% 16.9% Selling, General & Administrative (1) 1.0% 3.4% 1.1% 2.1% Depreciation and Amortization (2)(3) 1.8% 1.9% 2.2% 2.0% Amortization of Acquired Intangibles (3) 0.9% 0.9% 1.0% 0.5% Restructuring 0.0% 0.0% 0.4% 0.0% (1) The three and twelve months ended December 31, 2018 included transaction costs of 0.9% and 0.4% of net revenue, respectively, related to the acquisition of Acxiom in 2018. (2) Excludes amortization of acquired intangibles. 6 (3) For the twelve months ended December 31, 2019, depreciation and amortization from Acxiom, including amortization of acquired intangibles, was 1.3% of net revenue.
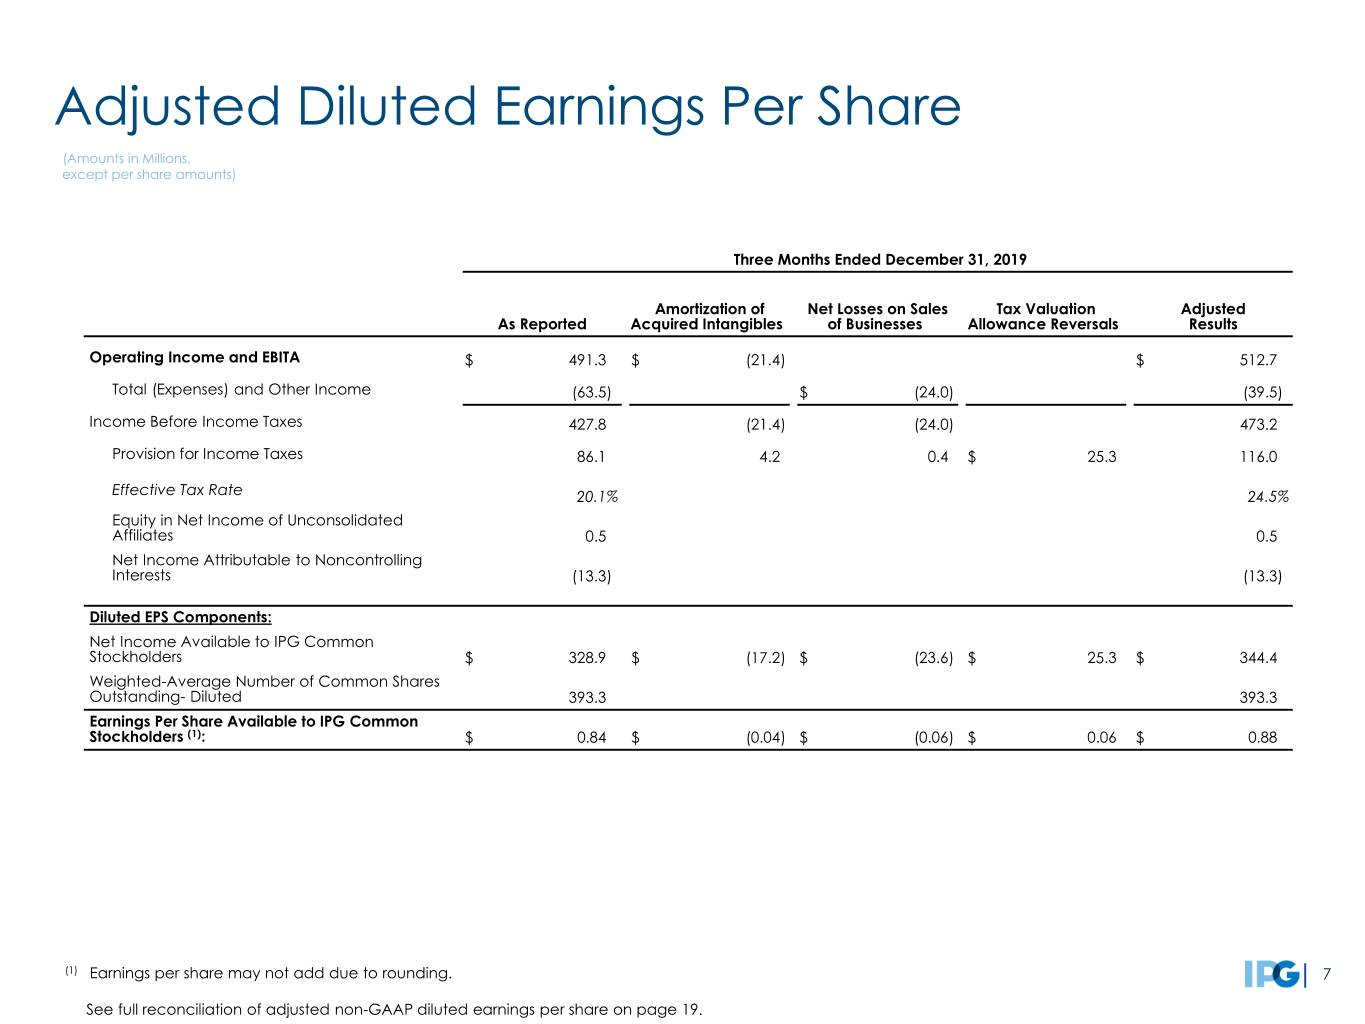
Adjusted Diluted Earnings Per Share (Amounts in Millions, except per share amounts) Three Months Ended December 31, 2019 Amortization of Net Losses on Sales Tax Valuation Adjusted As Reported Acquired Intangibles of Businesses Allowance Reversals Results Operating Income and EBITA $ 491.3 $ (21.4) $ 512.7 Total (Expenses) and Other Income (63.5) $ (24.0) (39.5) Income Before Income Taxes 427.8 (21.4) (24.0) 473.2 Provision for Income Taxes 86.1 4.2 0.4 $ 25.3 116.0 Effective Tax Rate 20.1% 24.5% Equity in Net Income of Unconsolidated Affiliates 0.5 0.5 Net Income Attributable to Noncontrolling Interests (13.3) (13.3) Diluted EPS Components: Net Income Available to IPG Common Stockholders $ 328.9 $ (17.2) $ (23.6) $ 25.3 $ 344.4 Weighted-Average Number of Common Shares Outstanding- Diluted 393.3 393.3 Earnings Per Share Available to IPG Common Stockholders (1): $ 0.84 $ (0.04) $ (0.06) $ 0.06 $ 0.88 (1) Earnings per share may not add due to rounding. 7 See full reconciliation of adjusted non-GAAP diluted earnings per share on page 19.

Adjusted Diluted Earnings Per Share (Amounts in Millions, except per share amounts) Twelve Months Ended December 31, 2019 Amortization of Q1 2019 Net Impact of Acquired Restructuring Net Losses on Sales Various Discrete Adjusted As Reported Intangibles Charges of Businesses Tax Items (1) Results Operating Income and Adjusted EBITA $ 1,086.0 $ (86.0) $ (31.8) $ 1,203.8 Total (Expenses) and Other Income (207.7) $ (46.3) (161.4) Income Before Income Taxes 878.3 (86.0) (31.8) (46.3) 1,042.4 Provision for Income Taxes 204.8 16.9 7.6 0.4 $ 39.2 268.9 Effective Tax Rate 23.3% 25.8% Equity in Net Income of Unconsolidated Affiliates 0.4 0.4 Net Income Attributable to Noncontrolling Interests (17.9) (17.9) Diluted EPS Components: Net Income Available to IPG Common Stockholders $ 656.0 $ (69.1) $ (24.2) $ (45.9) $ 39.2 $ 756.0 Weighted-Average Number of Common Shares Outstanding- Diluted 391.2 391.2 Earnings Per Share Available to IPG Common Stockholders (2): $ 1.68 $ (0.18) $ (0.06) $ (0.12) $ 0.10 $ 1.93 (1) Includes $13.9 million related to the settlement of certain tax positions in the second quarter of 2019 and $25.3 million related to tax valuation allowance reversals in the fourth quarter of 2019. (2) Earnings per share may not add due to rounding. 8 See full reconciliation of adjusted non-GAAP diluted earnings per share on page 20.

Cash Flow Twelve Months Ended December 31, ($ in Millions) 2019 2018 NET INCOME $ 673.9 $ 637.7 OPERATING ACTIVITIES Depreciation & amortization 368.0 291.6 Deferred taxes 9.7 14.1 Net losses on sales of businesses 43.4 61.9 Other non-cash items 20.0 7.7 Change in working capital, net 442.8 (431.1) Change in operating lease right-of-use assets and lease liabilities 0.7 — Change in other non-current assets & liabilities (29.3) (16.8) Net cash provided by Operating Activities 1,529.2 565.1 INVESTING ACTIVITIES Capital expenditures (198.5) (177.1) Acquisitions, net of cash acquired (0.6) (2,309.8) Other investing activities 37.4 (4.6) Net cash used in Investing Activities (161.7) (2,491.5) FINANCING ACTIVITIES Exercise of stock options 4.3 15.5 Proceeds from long-term debt — 2,494.2 Repurchases of common stock — (117.1) Repayments of long-term debt (403.3) (104.8) Common stock dividends (363.1) (322.1) Tax payments for employee shares withheld (22.4) (29.2) Distributions to noncontrolling interests (21.6) (16.9) Net decrease in short-term borrowings (19.8) (17.5) Acquisition-related payments (15.8) (33.7) Other financing activities (1.3) (15.2) Net cash (used in) provided by Financing Activities (843.0) 1,853.2 Currency effect (6.0) (47.3) Net increase (decrease) in Cash, Cash Equivalents and Restricted Cash $ 518.5 $ (120.5) 9
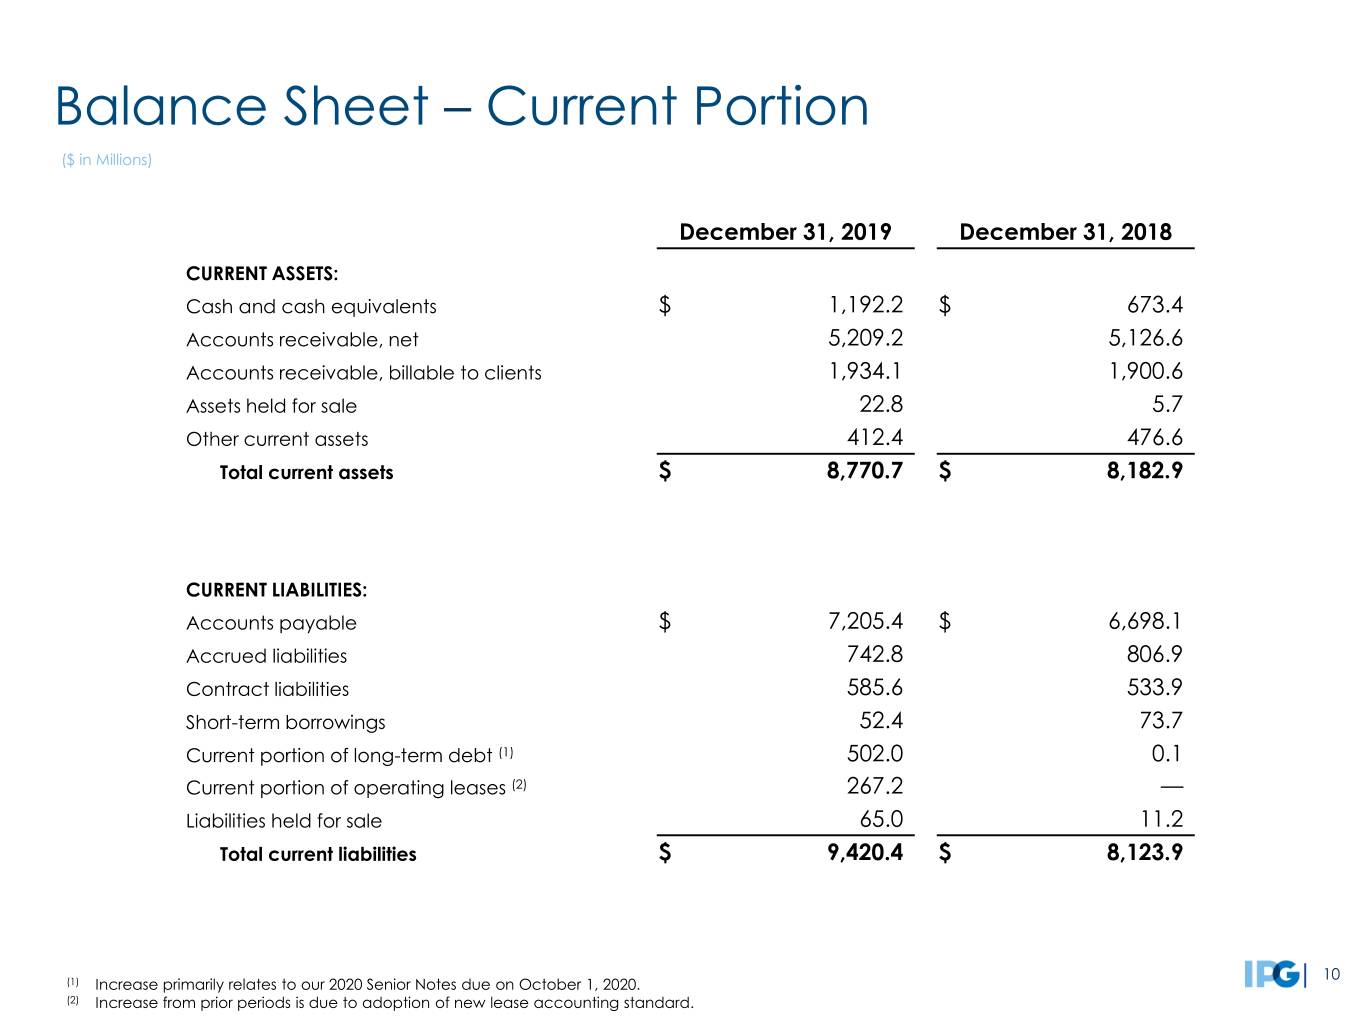
Balance Sheet – Current Portion ($ in Millions) December 31, 2019 December 31, 2018 CURRENT ASSETS: Cash and cash equivalents $ 1,192.2 $ 673.4 Accounts receivable, net 5,209.2 5,126.6 Accounts receivable, billable to clients 1,934.1 1,900.6 Assets held for sale 22.8 5.7 Other current assets 412.4 476.6 Total current assets $ 8,770.7 $ 8,182.9 CURRENT LIABILITIES: Accounts payable $ 7,205.4 $ 6,698.1 Accrued liabilities 742.8 806.9 Contract liabilities 585.6 533.9 Short-term borrowings 52.4 73.7 Current portion of long-term debt (1) 502.0 0.1 Current portion of operating leases (2) 267.2 — Liabilities held for sale 65.0 11.2 Total current liabilities $ 9,420.4 $ 8,123.9 10 (1) Increase primarily relates to our 2020 Senior Notes due on October 1, 2020. (2) Increase from prior periods is due to adoption of new lease accounting standard.

Debt Maturity Schedule ($ in Millions) Total Debt = $3.3 billion 3.50% 3.75% 4.00% 3.75% 4.20% 4.65% 5.40% Senior Notes - Current Other Short-Term Debt Long-Term Senior Notes Senior Notes shown at face value on December 31, 2019 11

Summary • Foundation for sustained value creation in top talent and key strategic initiatives ⦁ Quality of our offerings and strength of our agency brands ⦁ "Open architecture” solutions ⦁ Data management at scale ⦁ Fully integrated digital competencies ⦁ Increasing performance-based revenue streams • Effective expense management an ongoing priority • Continued focus on growth and margin improvement • Financial strength an ongoing source of value creation 12

Appendix 13

Operating Performance (Amounts in Millions, except per share amounts) Twelve Months Ended December 31, 2019 2018 Net Revenue $ 8,625.1 $ 8,031.6 Billable Expenses 1,596.2 1,682.8 Total Revenue 10,221.3 9,714.4 Salaries and Related Expenses 5,568.8 5,298.3 Office and Other Direct Expenses 1,564.1 1,355.1 Billable Expenses 1,596.2 1,682.8 Cost of Services 8,729.1 8,336.2 Selling, General and Administrative Expenses (1) 93.8 166.5 Depreciation and Amortization (2) 278.5 202.9 Restructuring Charges 33.9 — Operating Income 1,086.0 1,008.8 Interest Expense, net (1) (164.8) (101.2) Other Expense, net (1) (42.9) (69.6) Income Before Income Taxes 878.3 838.0 Provision for Income Taxes 204.8 199.2 Equity in Net Income (Loss) of Unconsolidated Affiliates 0.4 (1.1) Net Income 673.9 637.7 Net Income Attributable to Noncontrolling Interests (17.9) (18.8) Net Income Available to IPG Common Stockholders $ 656.0 $ 618.9 Earnings per Share Available to IPG Common Stockholders - Basic $ 1.70 $ 1.61 Earnings per Share Available to IPG Common Stockholders - Diluted $ 1.68 $ 1.59 Weighted-Average Number of Common Shares Outstanding - Basic 386.1 383.3 Weighted-Average Number of Common Shares Outstanding - Diluted 391.2 389.0 Dividends Declared per Common Share $ 0.940 $ 0.840 (1) Includes $35.0 in Selling, General and Administrative Expenses, $3.3 in Interest Expense, net, and $10.3 in Other Expense, net related to 14 Acxiom transaction costs in 2018. (2) Includes $86.0 and $37.6 of amortization of acquired intangibles in 2019 and 2018, respectively.

Cash Flow ($ in Millions) Three Months Ended December 31, 2019 2018 NET INCOME $ 342.2 $ 342.5 OPERATING ACTIVITIES Depreciation & amortization 89.6 93.7 Deferred taxes 11.2 37.0 Net losses on sales of businesses 23.9 11.9 Other non-cash items 10.8 (5.9) Change in working capital, net 603.1 436.2 Change in operating lease right-of-use assets and lease liabilities (2.1) — Change in other non-current assets & liabilities 26.9 (23.6) Net cash provided by Operating Activities 1,105.6 891.8 INVESTING ACTIVITIES Capital expenditures (64.7) (71.4) Acquisitions, net of cash acquired (1) — (2,297.8) Other investing activities 23.7 (5.7) Net cash used in Investing Activities (41.0) (2,374.9) FINANCING ACTIVITIES Exercise of stock options 0.1 6.4 Proceeds from long-term debt — 500.0 Net decrease in short-term borrowings (192.9) (12.9) Repayments of long-term debt (103.1) (99.9) Common stock dividends (90.9) (80.5) Distributions to noncontrolling interests (9.2) (3.5) Acquisition-related payments (0.5) (3.3) Tax payments for employee shares withheld (0.1) (0.4) Other financing activities (1.4) (3.3) Net cash (used in) provided by financing activities (398.0) 302.6 Currency effect 5.1 (12.0) Net increase (decrease) in Cash, Cash Equivalents and Restricted Cash $ 671.7 $ (1,192.5) 15 (1) Decrease primarily relates to the acquisition of Acxiom in the fourth quarter of 2018.

Depreciation and Amortization ($ in Millions) 2019 Q1 Q2 Q3 Q4 FY 2019 Depreciation and amortization (1) $ 49.5 $ 51.7 $ 47.3 $ 44.0 $ 192.5 Amortization of acquired intangibles (2) 21.6 21.3 21.7 21.4 86.0 Amortization of restricted stock and other non-cash compensation 28.2 15.9 14.2 21.9 80.2 Net amortization of bond discounts and deferred financing costs 2.3 2.3 2.4 2.3 9.3 2018 Q1 Q2 Q3 Q4 FY 2018 Depreciation and amortization (1) $ 40.7 $ 38.8 $ 38.9 $ 46.9 $ 165.3 Amortization of acquired intangibles (2) 5.3 5.2 5.1 22.0 37.6 Amortization of restricted stock and other non-cash compensation 30.0 16.0 13.7 22.5 82.2 Net amortization of bond discounts and deferred financing costs 1.4 1.3 1.5 2.3 6.5 (1) Excludes amortization of acquired intangibles. 16 (2) The increase in amortization for 2019 as compared to 2018 primarily relates to the acquisition of Acxiom during the fourth quarter of 2018.
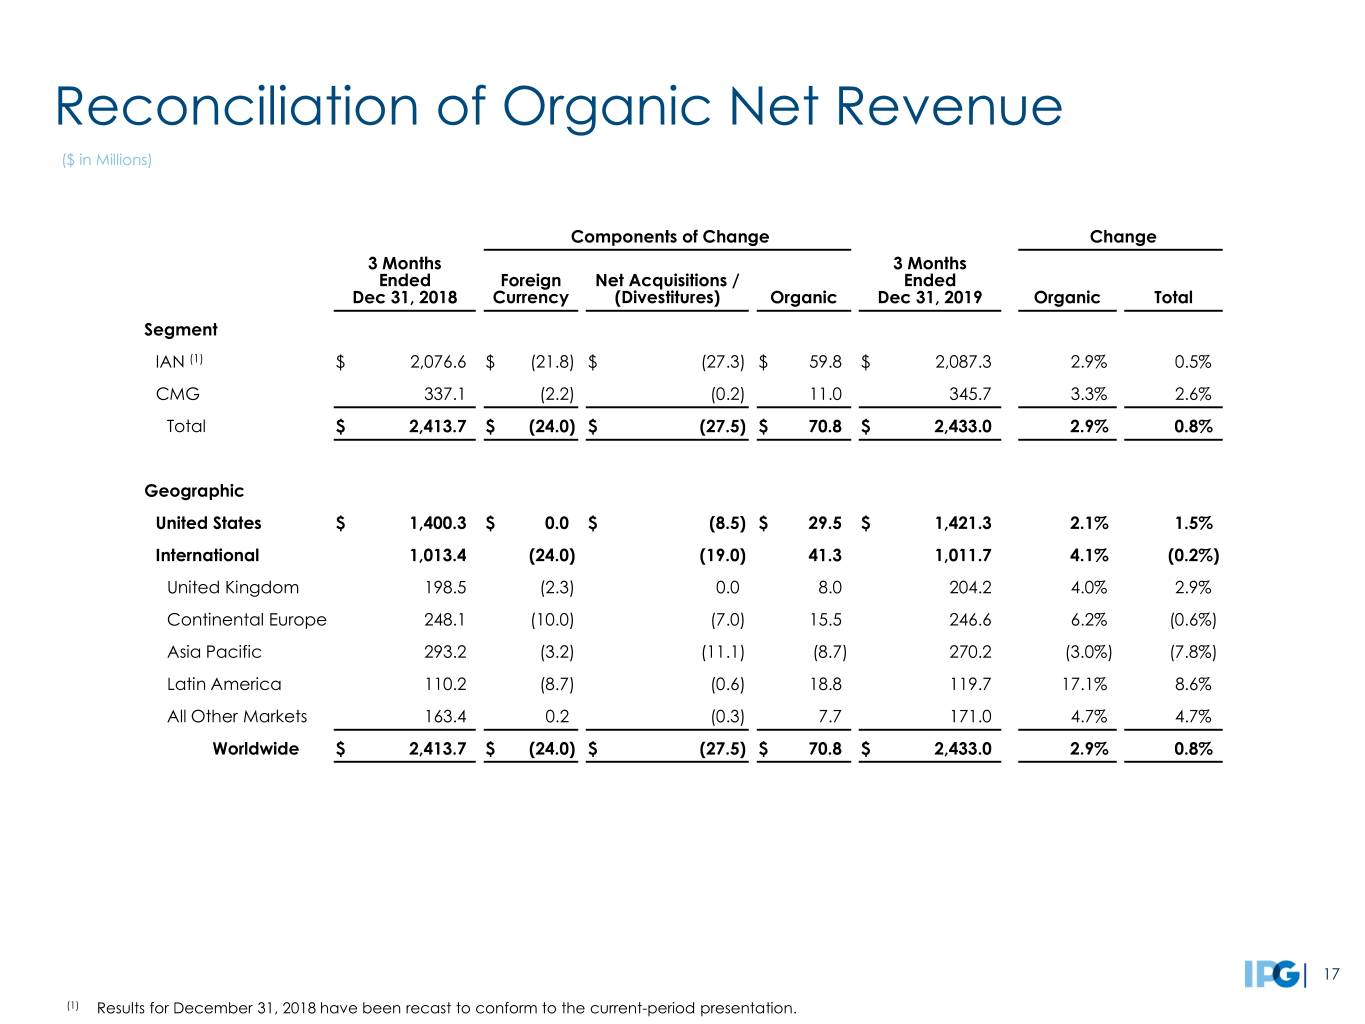
Reconciliation of Organic Net Revenue ($ in Millions) Components of Change Change 3 Months 3 Months Ended Foreign Net Acquisitions / Ended Dec 31, 2018 Currency (Divestitures) Organic Dec 31, 2019 Organic Total Segment IAN (1) $ 2,076.6 $ (21.8) $ (27.3) $ 59.8 $ 2,087.3 2.9% 0.5% CMG 337.1 (2.2) (0.2) 11.0 345.7 3.3% 2.6% Total $ 2,413.7 $ (24.0) $ (27.5) $ 70.8 $ 2,433.0 2.9% 0.8% Geographic United States $ 1,400.3 $ 0.0 $ (8.5) $ 29.5 $ 1,421.3 2.1% 1.5% International 1,013.4 (24.0) (19.0) 41.3 1,011.7 4.1% (0.2%) United Kingdom 198.5 (2.3) 0.0 8.0 204.2 4.0% 2.9% Continental Europe 248.1 (10.0) (7.0) 15.5 246.6 6.2% (0.6%) Asia Pacific 293.2 (3.2) (11.1) (8.7) 270.2 (3.0%) (7.8%) Latin America 110.2 (8.7) (0.6) 18.8 119.7 17.1% 8.6% All Other Markets 163.4 0.2 (0.3) 7.7 171.0 4.7% 4.7% Worldwide $ 2,413.7 $ (24.0) $ (27.5) $ 70.8 $ 2,433.0 2.9% 0.8% 17 (1) Results for December 31, 2018 have been recast to conform to the current-period presentation.

Reconciliation of Organic Net Revenue ($ in Millions) Components of Change Change 12 Months 12 Months Ended Foreign Net Acquisitions / Ended Dec 31, 2018 Currency (Divestitures) (1) Organic Dec 31, 2019 Organic Total Segment IAN (2) $ 6,767.5 $ (124.5) $ 465.5 $ 239.7 $ 7,348.2 3.5% 8.6% CMG 1,264.1 (18.6) 2.3 29.1 1,276.9 2.3% 1.0% Total $ 8,031.6 $ (143.1) $ 467.8 $ 268.8 $ 8,625.1 3.3% 7.4% Geographic United States $ 4,825.0 $ 0.0 $ 469.9 $ 91.2 $ 5,386.1 1.9% 11.6% International 3,206.6 (143.1) (2.1) 177.6 3,239.0 5.5% 1.0% United Kingdom 711.7 (32.0) 20.8 26.5 727.0 3.7% 2.1% Continental Europe 737.5 (40.6) (8.4) 53.9 742.4 7.3% 0.7% Asia Pacific 896.8 (26.2) (9.9) (2.4) 858.3 (0.3%) (4.3%) Latin America 350.1 (34.4) (2.1) 76.3 389.9 21.8% 11.4% All Other Markets 510.5 (9.9) (2.5) 23.3 521.4 4.6% 2.1% Worldwide $ 8,031.6 $ (143.1) $ 467.8 $ 268.8 $ 8,625.1 3.3% 7.4% 18 (1) Includes net revenue from Acxiom for the first nine months of 2019. (2) Results for December 31, 2018 have been recast to conform to the current-period presentation.

(1) Reconciliation of Adjusted Results (Amounts in Millions, except per share amounts) Three Months Ended December 31, 2019 Amortization of Net Losses on Tax Valuation Acquired Sales of Allowance Adjusted As Reported Intangibles Businesses Reversals Results Operating Income and EBITA $ 491.3 $ (21.4) $ 512.7 Total (Expenses) and Other Income (63.5) $ (24.0) (39.5) Income Before Income Taxes 427.8 (21.4) (24.0) 473.2 Provision for Income Taxes 86.1 4.2 0.4 $ 25.3 116.0 Effective Tax Rate 20.1% 24.5% Equity in Net Income of Unconsolidated Affiliates 0.5 0.5 Net Income Attributable to Noncontrolling Interests (13.3) (13.3) Net Income Available to IPG Common Stockholders $ 328.9 $ (17.2) $ (23.6) $ 25.3 $ 344.4 Weighted-Average Number of Common Shares Outstanding - Basic 386.9 386.9 Dilutive effect of stock options and restricted shares 6.4 6.4 Weighted-Average Number of Common Shares Outstanding - Diluted 393.3 393.3 Earnings Per Share Available to IPG Common Stockholders (2): Basic $ 0.85 $ (0.04) $ (0.06) $ 0.07 $ 0.89 Diluted $ 0.84 $ (0.04) $ (0.06) $ 0.06 $ 0.88 (1) The table reconciles our reported results to our adjusted non-GAAP results. Management believes the resulting comparisons provide useful supplemental data that, while not a substitute for GAAP measures, allow for greater transparency in the review of our financial and 19 operational performance. (2) Earnings per share may not add due to rounding.
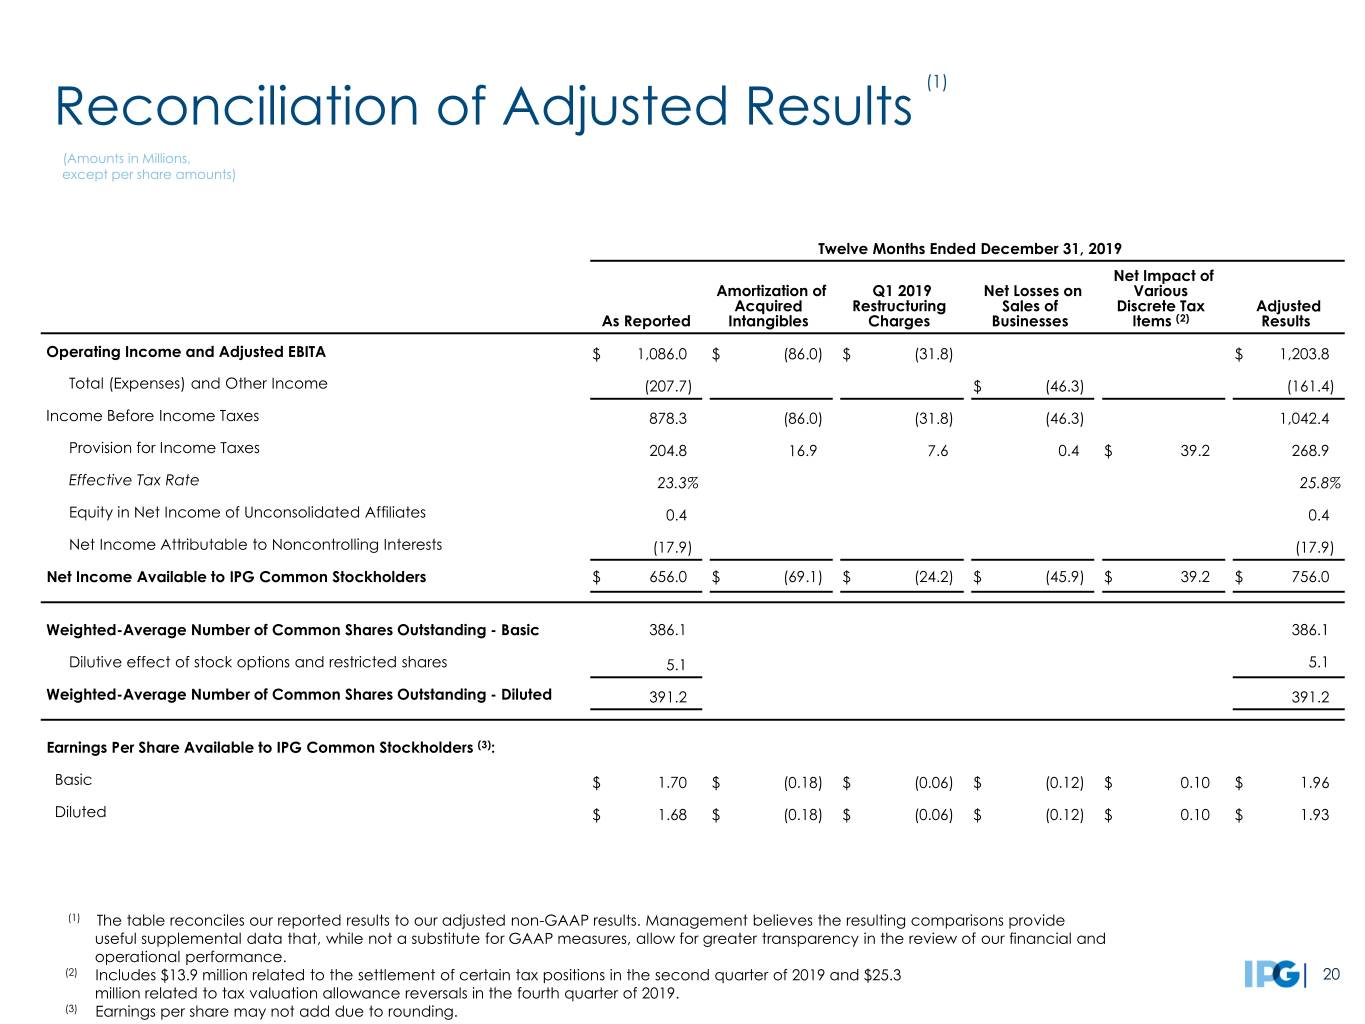
(1) Reconciliation of Adjusted Results (Amounts in Millions, except per share amounts) Twelve Months Ended December 31, 2019 Net Impact of Amortization of Q1 2019 Net Losses on Various Acquired Restructuring Sales of Discrete Tax Adjusted As Reported Intangibles Charges Businesses Items (2) Results Operating Income and Adjusted EBITA $ 1,086.0 $ (86.0) $ (31.8) $ 1,203.8 Total (Expenses) and Other Income (207.7) $ (46.3) (161.4) Income Before Income Taxes 878.3 (86.0) (31.8) (46.3) 1,042.4 Provision for Income Taxes 204.8 16.9 7.6 0.4 $ 39.2 268.9 Effective Tax Rate 23.3% 25.8% Equity in Net Income of Unconsolidated Affiliates 0.4 0.4 Net Income Attributable to Noncontrolling Interests (17.9) (17.9) Net Income Available to IPG Common Stockholders $ 656.0 $ (69.1) $ (24.2) $ (45.9) $ 39.2 $ 756.0 Weighted-Average Number of Common Shares Outstanding - Basic 386.1 386.1 Dilutive effect of stock options and restricted shares 5.1 5.1 Weighted-Average Number of Common Shares Outstanding - Diluted 391.2 391.2 Earnings Per Share Available to IPG Common Stockholders (3): Basic $ 1.70 $ (0.18) $ (0.06) $ (0.12) $ 0.10 $ 1.96 Diluted $ 1.68 $ (0.18) $ (0.06) $ (0.12) $ 0.10 $ 1.93 (1) The table reconciles our reported results to our adjusted non-GAAP results. Management believes the resulting comparisons provide useful supplemental data that, while not a substitute for GAAP measures, allow for greater transparency in the review of our financial and operational performance. (2) Includes $13.9 million related to the settlement of certain tax positions in the second quarter of 2019 and $25.3 20 million related to tax valuation allowance reversals in the fourth quarter of 2019. (3) Earnings per share may not add due to rounding.
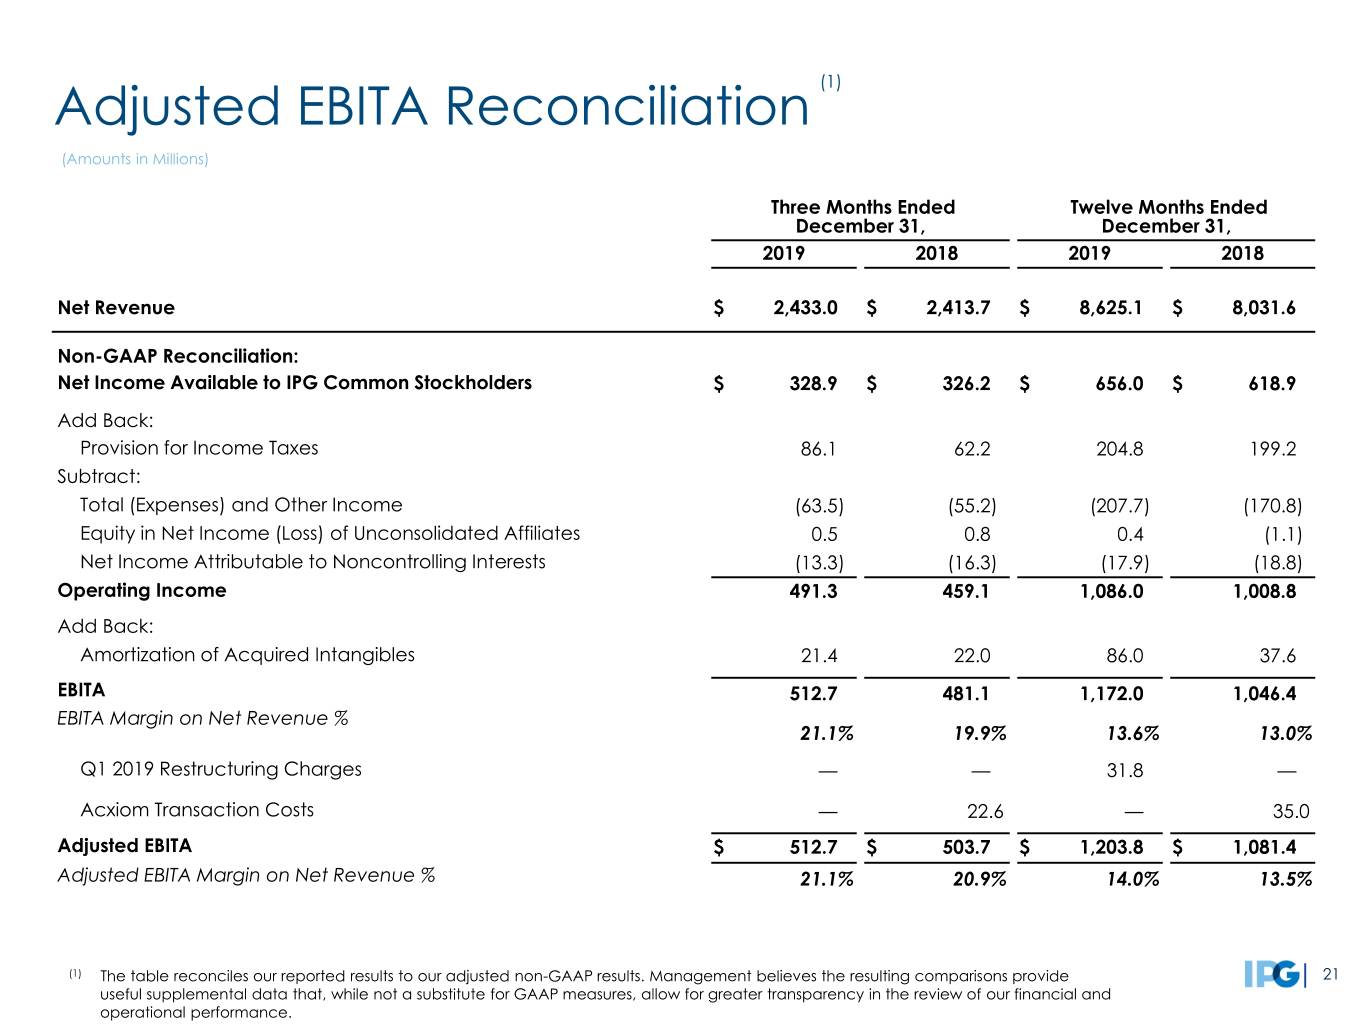
(1) Adjusted EBITA Reconciliation (Amounts in Millions) Three Months Ended Twelve Months Ended December 31, December 31, 2019 2018 2019 2018 Net Revenue $ 2,433.0 $ 2,413.7 $ 8,625.1 $ 8,031.6 Non-GAAP Reconciliation: Net Income Available to IPG Common Stockholders $ 328.9 $ 326.2 $ 656.0 $ 618.9 Add Back: Provision for Income Taxes 86.1 62.2 204.8 199.2 Subtract: Total (Expenses) and Other Income (63.5) (55.2) (207.7) (170.8) Equity in Net Income (Loss) of Unconsolidated Affiliates 0.5 0.8 0.4 (1.1) Net Income Attributable to Noncontrolling Interests (13.3) (16.3) (17.9) (18.8) Operating Income 491.3 459.1 1,086.0 1,008.8 Add Back: Amortization of Acquired Intangibles 21.4 22.0 86.0 37.6 EBITA 512.7 481.1 1,172.0 1,046.4 EBITA Margin on Net Revenue % 21.1% 19.9% 13.6% 13.0% Q1 2019 Restructuring Charges — — 31.8 — Acxiom Transaction Costs — 22.6 — 35.0 Adjusted EBITA $ 512.7 $ 503.7 $ 1,203.8 $ 1,081.4 Adjusted EBITA Margin on Net Revenue % 21.1% 20.9% 14.0% 13.5% (1) The table reconciles our reported results to our adjusted non-GAAP results. Management believes the resulting comparisons provide 21 useful supplemental data that, while not a substitute for GAAP measures, allow for greater transparency in the review of our financial and operational performance.

(1) Reconciliation of Adjusted Results (Amounts in Millions, except per share amounts) Three Months Ended December 31, 2018 Acxiom Amortization of Net Losses on Net Impact of Transaction Acquired Sales of Various Discrete Adjusted As Reported Costs (2) Intangibles Businesses Tax Items (3) Results Operating Income and Adjusted EBITA $ 459.1 $ (22.6) $ (22.0) $ 503.7 Total (Expenses) and Other Income (55.2) $ (11.9) (43.3) Income Before Income Taxes 403.9 (22.6) (22.0) (11.9) 460.4 Provision for Income Taxes 62.2 5.6 4.2 1.1 $ 23.4 96.5 Effective Tax Rate 15.4% 21.0% Equity in Net Income of Unconsolidated Affiliates 0.8 0.8 Net Income Attributable to Noncontrolling Interests (16.3) (16.3) Net Income Available to IPG Common Stockholders $ 326.2 $ (17.0) $ (17.8) $ (10.8) $ 23.4 $ 348.4 Weighted-Average Number of Common Shares Outstanding - Basic 383.4 383.4 Dilutive Effect of Stock Options and Restricted Shares 6.9 6.9 Weighted-Average Number of Common Shares Outstanding - Diluted 390.3 390.3 Earnings per Share Available to IPG Common Stockholders (4): Basic $ 0.85 $ (0.04) $ (0.05) $ (0.03) $ 0.06 $ 0.91 Diluted $ 0.84 $ (0.04) $ (0.05) $ (0.03) $ 0.06 $ 0.89 (1) The table reconciles our reported results to our adjusted non-GAAP results. Management believes the resulting comparisons provide useful supplemental data that, while not a substitute for GAAP measures, allow for greater transparency in the review of our financial and operational performance. (2) Acxiom transaction costs of $22.6 recorded in Selling, General and Administrative Expenses. (3) Includes a tax benefit of $16.9 from net adjustments to the valuation allowance and a benefit of $6.5 related to the estimated costs associated with our 22 change in assertion (APB 23) that we will no longer permanently reinvest undistributed earnings attributable to certain foreign subsidiaries. (4) Earnings per share may not add due to rounding.

(1) Reconciliation of Adjusted Results (Amounts in Millions, except per share amounts) Twelve Months Ended December 31, 2018 Acxiom Amortization of Net Losses on Net Impact of Transaction Acquired Sales of Various Discrete Adjusted As Reported Costs (2) Intangibles Businesses Tax Items (3) Results Operating Income and Adjusted EBITA $ 1,008.8 $ (35.0) $ (37.6) $ 1,081.4 Total (Expenses) and Other Income (170.8) (13.6) $ (61.9) (95.3) Income Before Income Taxes 838.0 (48.6) (37.6) (61.9) 986.1 Provision for Income Taxes 199.2 12.1 4.8 2.2 $ 23.4 241.7 Effective Tax Rate 23.8% 24.5% Equity in Net Loss of Unconsolidated Affiliates (1.1) (1.1) Net Income Attributable to Noncontrolling Interests (18.8) (18.8) Net Income Available to IPG Common Stockholders $ 618.9 $ (36.5) $ (32.8) $ (59.7) $ 23.4 $ 724.5 Weighted-Average Number of Common Shares Outstanding - Basic 383.3 383.3 Dilutive Effect of Stock Options and Restricted Shares 5.7 5.7 Weighted-Average Number of Common Shares Outstanding - Diluted 389.0 389.0 Earnings per Share Available to IPG Common Stockholders (4): Basic $ 1.61 $ (0.10) $ (0.09) $ (0.16) $ 0.06 $ 1.89 Diluted $ 1.59 $ (0.09) $ (0.08) $ (0.15) $ 0.06 $ 1.86 (1) The table reconciles our reported results to our adjusted non-GAAP results. Management believes the resulting comparisons provide useful supplemental data that, while not a substitute for GAAP measures, allow for greater transparency in the review of our financial and operational performance. (2) Acxiom transaction costs of $22.6 recorded in Selling, General and Administrative Expenses. (3) Includes a tax benefit of $16.9 from net adjustments to the valuation allowance and a benefit of $6.5 related to the estimated costs associated with our 23 change in assertion (APB 23) that we will no longer permanently reinvest undistributed earnings attributable to certain foreign subsidiaries. (4) Earnings per share may not add due to rounding.

(1) Total Shares: Basic and Eligible for Dilution (Amounts in Millions) Weighted-Average (2) (1) Includes basic common shares outstanding, restricted shares, in-the-money stock options and convertible debt and preferred stock 24 eligible for dilution. (2) Equals weighted-average shares outstanding as defined above for the twelve months ending December 31st for the periods presented.

(1) Acquisition Payments ($ in Millions) (2) (1) Amounts represent payments related to our previous acquisitions based on current estimates of financial performance and are subject to change. Amounts include deferred payments, payments we may be required to make in connection with our redeemable noncontrolling interests and call options with affiliates. With respect to redeemable noncontrolling interests and call options with affiliates, the estimated payment amounts are shown as an obligation in the earliest year in which they are exercisable and payable, 25 though some are eligible for exercise in multiple years and can also be paid over multiple years. (2) 2019 payments included $9 recorded within Operating Activities in our Statement of Cash Flows.

Metrics Update 26

Metrics Update Category Metric NET REVENUE By Client Sector SALARIES & RELATED Twelve Months Ended (% of net revenue) Base, Benefits & Tax Incentive Expense Severance Expense Temporary Help OFFICE & OTHER DIRECT Twelve Months (% of net revenue) Occupancy Expense All Other Office and Other Direct Expenses REAL ESTATE Total Square Feet FINANCIAL Available Liquidity Credit Facility Covenants 27

Net Revenue By Client Sector Top 100 Clients for the twelve months ended December 31 Approximately 55% of Consolidated Net Revenue 28

Salaries & Related Expenses Twelve Months Ended December 31 (1) 29 (1) Contributing to the improved ratio is the inclusion of Acxiom, for the full year in 2019, which has a lower ratio of salaries and related expenses as a percentage of its net revenue.

Salaries & Related Expenses (% of Net Revenue) Three and Twelve Months Ended December 31 2019 2018 30 “All Other Salaries & Related,” not shown, was 3.1% for both the three months ended December 31, 2019 and 2018, and was 2.1% and 2.3% for the twelve months ended December 31, 2019 and 2018, respectively.

Office & Other Direct Expenses Twelve Months Ended December 31 (1) 31 (1) The higher expense ratio is primarily due to the inclusion of Acxiom, for the full year in 2019, which has a higher ratio of office and other direct expenses as a percentage of its net revenue, mainly driven by client service costs and professional fees.

Office & Other Direct Expenses (% Net of Revenue) Three and Twelve Months Ended December 31 2019 2018 “All Other” primarily includes client service costs, non-pass through production expenses, travel and entertainment, professional fees, 32 spending to support new business activity, telecommunications, office supplies, bad debt expense, adjustments to contingent acquisition obligations, foreign currency losses (gains), long-lived asset impairments and other expenses.

Real Estate Total Square Feet as of December 31, (Amounts in Millions) (1) 33 (1) Increase primarily due to the inclusion of Acxiom real estate.

Available Liquidity Cash, Cash Equivalents and Short-Term Marketable Securities + Available Committed Credit Facility ($ in Millions) 34

(1) Credit Facility Covenants ($ in Millions) Twelve Months Ended Covenants December 31, 2019 I. Leverage Ratio (not greater than) (2): 3.75x Actual Leverage Ratio: 2.28x Twelve Months Ended EBITDA Reconciliation December 31, 2019 Operating Income: $1,086.0 + Depreciation and amortization 369.8 EBITDA: $1,455.8 (1) Our November 1, 2019 Credit Agreement Amendment removed the interest coverage ratio financial covenant. 35 (2) Pursuant to Amendment No. 1 of the Credit Agreement, the maximum leverage ratio decreased from 4.00x to 3.75x on the last day of the fourth fiscal quarter ending after the closing date of the Acxiom acquisition.

Cautionary Statement This investor presentation contains forward-looking statements. Statements in this investor presentation that are not historical facts, including statements about management’s beliefs and expectations, constitute forward- looking statements. These statements are based on current plans, estimates and projections, and are subject to change based on a number of factors, including those outlined in our most recent Annual Report on Form 10-K under Item 1A, Risk Factors, and our other filings with the Securities and Exchange Commission ("SEC"). Forward- looking statements speak only as of the date they are made, and we undertake no obligation to update publicly any of them in light of new information or future events. Forward-looking statements involve inherent risks and uncertainties. A number of important factors could cause actual results to differ materially from those contained in any forward-looking statement. Such factors include, but are not limited to, the following: ⦁ potential effects of a challenging economy, for example, on the demand for our advertising and marketing services, on our clients’ financial condition and on our business or financial condition; ⦁ our ability to attract new clients and retain existing clients; ⦁ our ability to retain and attract key employees; ⦁ risks associated with assumptions we make in connection with our critical accounting estimates, including changes in assumptions associated with any effects of a weakened economy; ⦁ potential adverse effects if we are required to recognize impairment charges or other adverse accounting-related developments; ⦁ risks associated with the effects of global, national and regional economic and political conditions, including counterparty risks and fluctuations in economic growth rates, interest rates and currency exchange rates; ⦁ developments from changes in the regulatory and legal environment for advertising and marketing and communications services companies around the world; and ⦁ failure to realize the anticipated benefits on the acquisition of the Acxiom business Investors should carefully consider these factors and the additional risk factors outlined in more detail in our most recent Annual Report on Form 10-K under Item 1A, Risk Factors, and our other SEC filings. 36
