Attached files
| file | filename |
|---|---|
| EX-99.1 - EX-99.1 - INSIGHT ENTERPRISES INC | nsit-ex991_6.htm |
| 8-K - 8-K - INSIGHT ENTERPRISES INC | nsit-8k_20200212.htm |

Insight Enterprises, Inc. Fourth Quarter and Full Year 2019 Earnings Conference Call and Webcast Exhibit 99.2
Agenda Opening Comments CEO Commentary Fourth Quarter 2019 Consolidated Financials Full Year 2019 Consolidated Financials 2019 Highlights 2020 Priorities CFO Commentary Financial results by region Taxes and cash flow Closing Comments & 2020 Guidance
Disclosures Safe harbor statement This presentation includes “forward-looking statements” within the meaning of the Private Securities Litigation Reform Act of 1995 related to Insight’s plans and expectations. Statements that are not historical facts, including the Company’s expected 2020 financial results and assumptions, as well as statements about future trends in the IT market and our opportunities for growth, are forward-looking statements. These forward-looking statements are subject to assumptions, risks and uncertainties which could cause actual results or future events to differ materially from such statements. The Company undertakes no obligation to update publicly or revise any of the forward-looking statements, except as otherwise required by law. More detailed information about risk factors is included in today’s press release and discussed in the Company’s most recently filed periodic reports and subsequent filings with the Securities and Exchange Commission. Non-GAAP measures This presentation will reference certain non-GAAP financial information as ‘Adjusted’. A reconciliation of non-GAAP financial measures presented in this document to our actual GAAP results is attached to the back of this presentation and included in the press release issued today, which you may find on the Investor Relations section of our website at investor.insight.com. Constant currency In some instances the Company refers to changes in net sales, gross profit and earnings from operations on a consolidated basis and in North America, EMEA and APAC excluding the effects of fluctuating foreign currency exchange rates. In computing these changes and percentages, the Company compares the current year amount as translated into U.S. dollars under the applicable accounting standards to the prior year amount in local currency translated into U.S. dollars utilizing the weighted average translation rate for the current period.
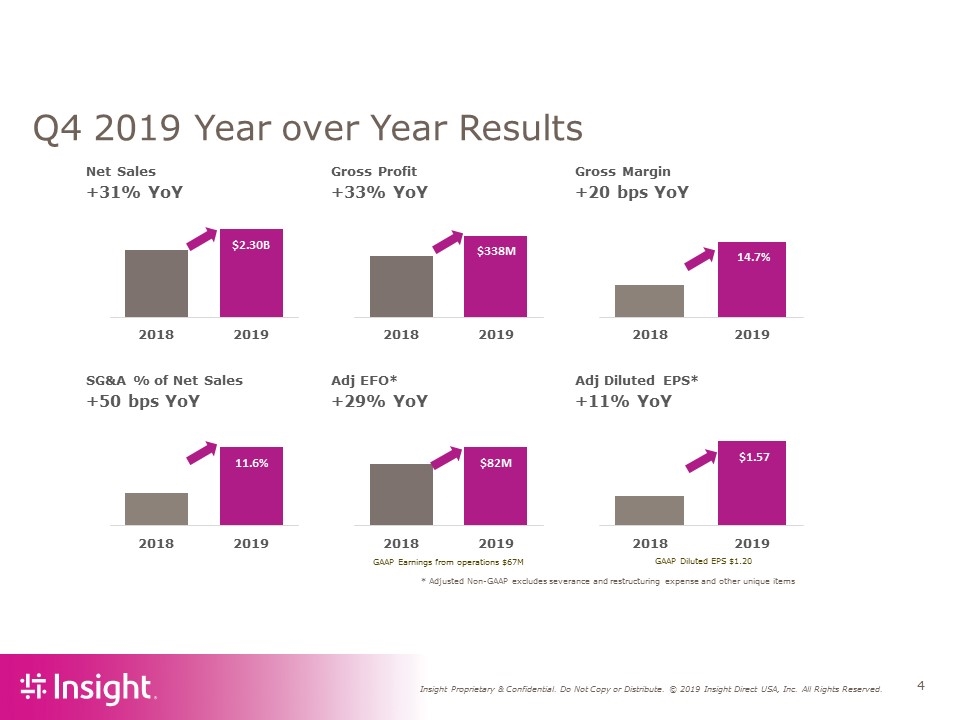
Q4 2019 Year over Year Results Net Sales Gross Profit Gross Margin +31% YoY +33% YoY +20 bps YoY SG&A % of Net Sales Adj EFO* Adj Diluted EPS* +50 bps YoY +29% YoY +11% YoY $2.30B 2018 2019 $338M 2018 2019 $82M 2018 2019 11.6% 2018 2019 14.7% 2018 2019 $1.57 2018 2019 GAAP Earnings from operations $67M GAAP Diluted EPS $1.20 * Adjusted Non-GAAP excludes severance and restructuring expense and other unique items
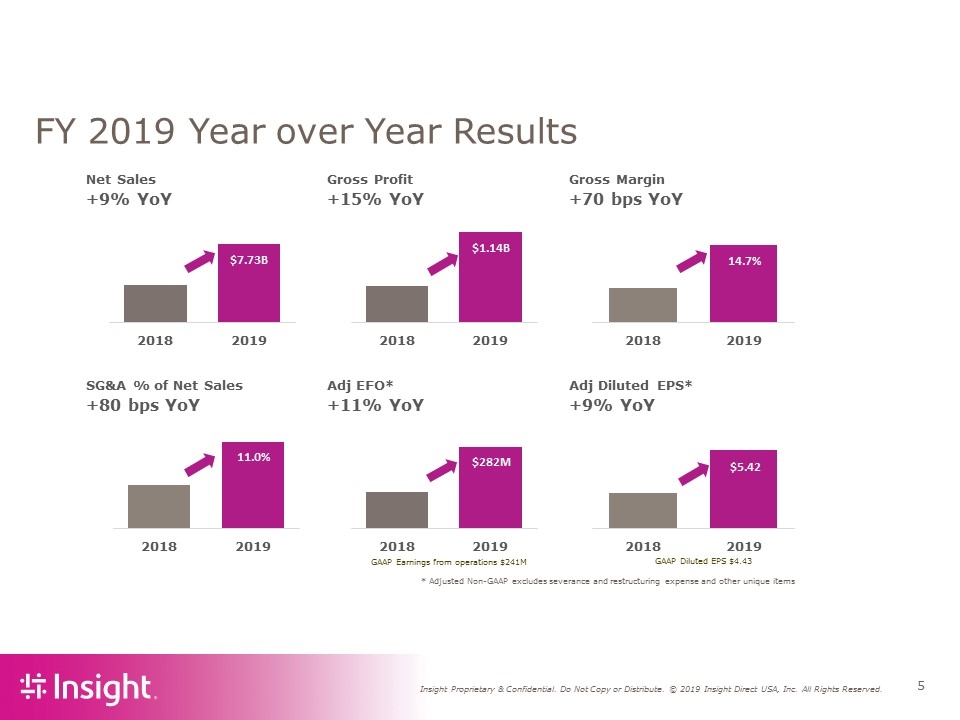
* Adjusted Non-GAAP excludes severance and restructuring expense and other unique items FY 2019 Year over Year Results Net Sales Gross Profit Gross Margin +9% YoY +15% YoY +70 bps YoY SG&A % of Net Sales Adj EFO* Adj Diluted EPS* +80 bps YoY +11% YoY +9% YoY $7.73B 2018 2019 $1.14B 2018 2019 $282M 2018 2019 11.0% 2018 2019 14.7% 2018 2019 $5.42 2018 2019 GAAP Earnings from operations $241M GAAP Diluted EPS $4.43
FY 2019 Highlights Strategic Investments Acquisition of PCM Teammate Development Fortune’s 100 Best Workplaces for Diversity, ranked #70 Fortune’s 50 Best Workplaces in Technology, ranked #23 Capacity for growth – New debt facilities Strong Financial Performance High single-digit top line growth Fourth year of double-digit adjusted earnings growth Services GP % of consolidated GP expands 90 basis points
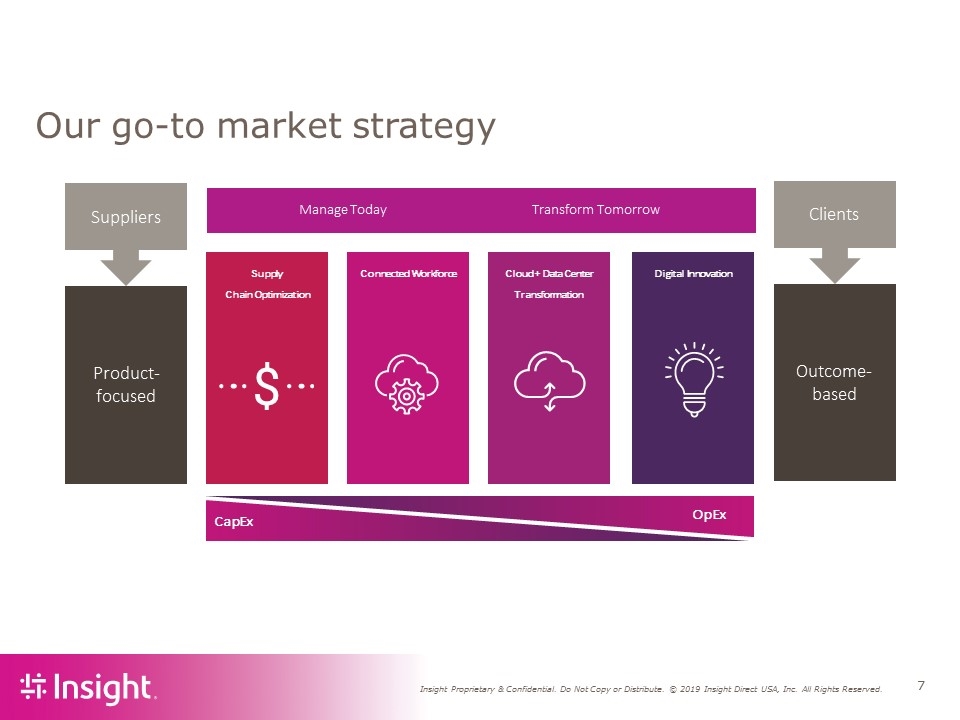
Our go-to market strategy Product-focused Suppliers Outcome-based Clients Supply Chain Optimization Connected Workforce Cloud + Data Center Transformation Digital Innovation CapEx OpEx Manage Today Transform Tomorrow
CFO Commentary Financial results by region Taxes and cash flow
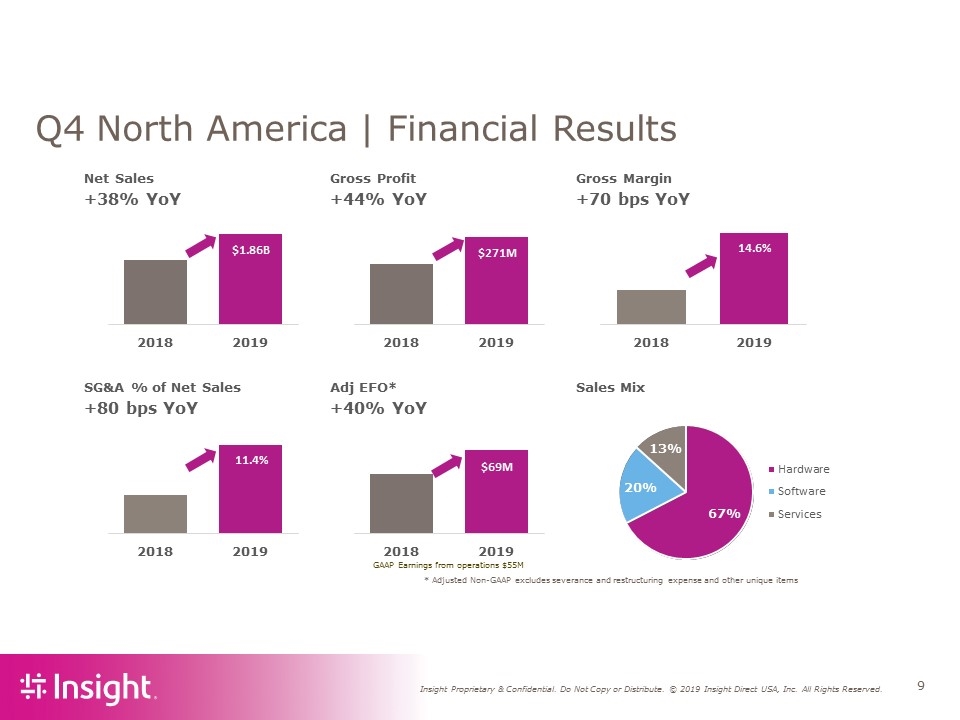
* Adjusted Non-GAAP excludes severance and restructuring expense and other unique items Q4 North America | Financial Results Net Sales Gross Profit Gross Margin +38% YoY +44% YoY +70 bps YoY SG&A % of Net Sales Adj EFO* Sales Mix +80 bps YoY +40% YoY 67% 20% 13% Hardware Software Services $1.86B 2018 2019 $271M 2018 2019 14.6% 2018 2019 $69M 2018 2019 11.4% 2018 2019 GAAP Earnings from operations $55M
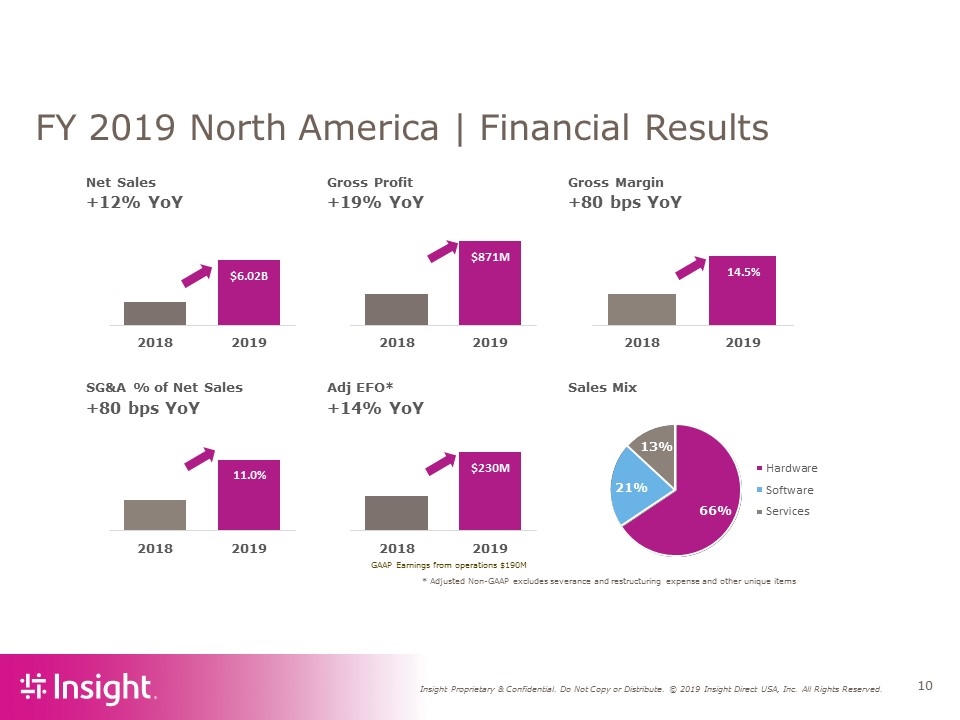
* Adjusted Non-GAAP excludes severance and restructuring expense and other unique items FY 2019 North America | Financial Results Net Sales Gross Profit Gross Margin +12% YoY +19% YoY +80 bps YoY SG&A % of Net Sales Adj EFO* Sales Mix +80 bps YoY +14% YoY 66% 21% 13% Hardware Software Services $6.02B 2018 2019 $871M 2018 2019 14.5% 2018 2019 $230M 2018 2019 11.0% 2018 2019 GAAP Earnings from operations $190M
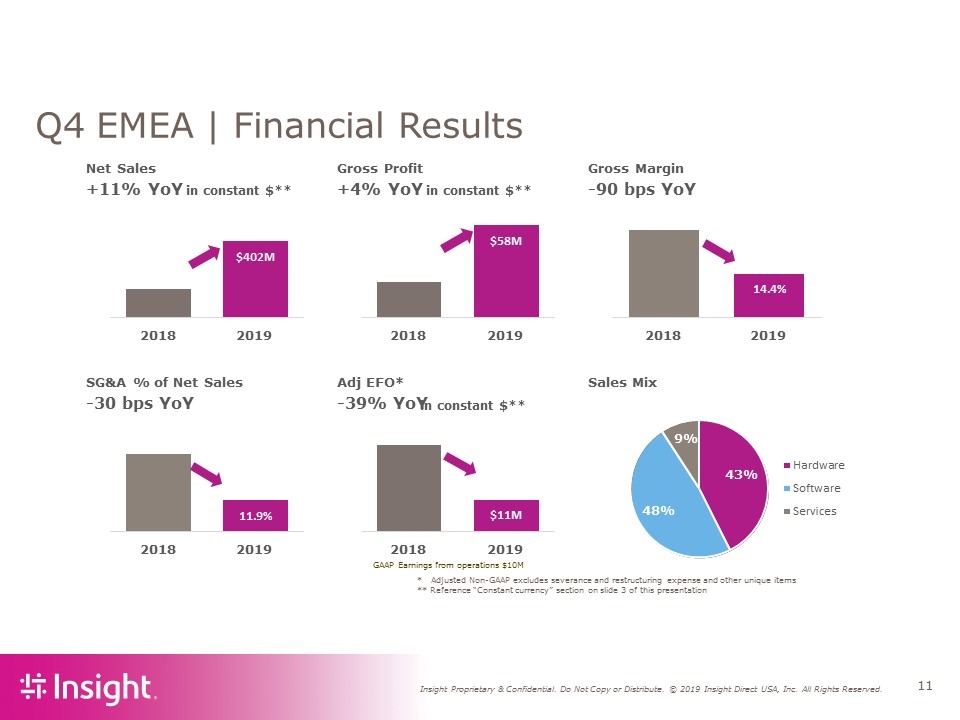
* Adjusted Non-GAAP excludes severance and restructuring expense and other unique items ** Reference “Constant currency” section on slide 3 of this presentation Q4 EMEA | Financial Results Net Sales Gross Profit Gross Margin +11% YoY +4% YoY -90 bps YoY SG&A % of Net Sales Adj EFO* Sales Mix -30 bps YoY -39% YoY 43% 48% 9% Hardware Software Services $402M 2018 2019 $58M 2018 2019 14.4% 2018 2019 $11M 2018 2019 11.9% 2018 2019 in constant $** in constant $** GAAP Earnings from operations $10M in constant $**
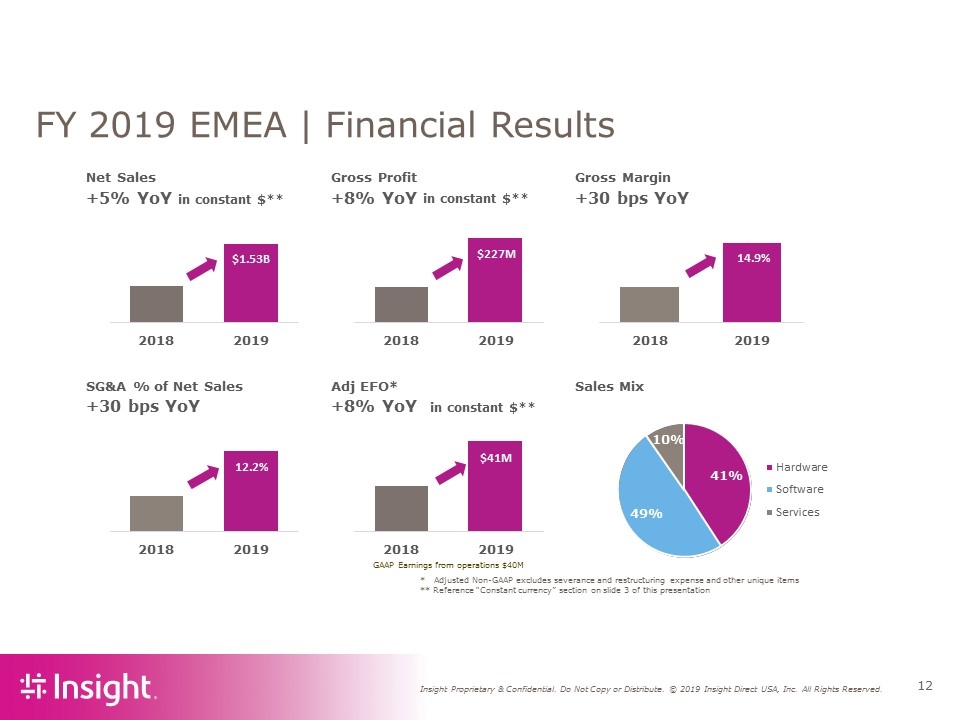
* Adjusted Non-GAAP excludes severance and restructuring expense and other unique items ** Reference “Constant currency” section on slide 3 of this presentation FY 2019 EMEA | Financial Results Net Sales Gross Profit Gross Margin +5% YoY +8% YoY +30 bps YoY SG&A % of Net Sales Adj EFO* Sales Mix +30 bps YoY +8% YoY 41% 49% 10% Hardware Software Services $1.53B 2018 2019 $227M 2018 2019 14.9% 2018 2019 $41M 2018 2019 12.2% 2018 2019 in constant $** in constant $** GAAP Earnings from operations $40M in constant $**
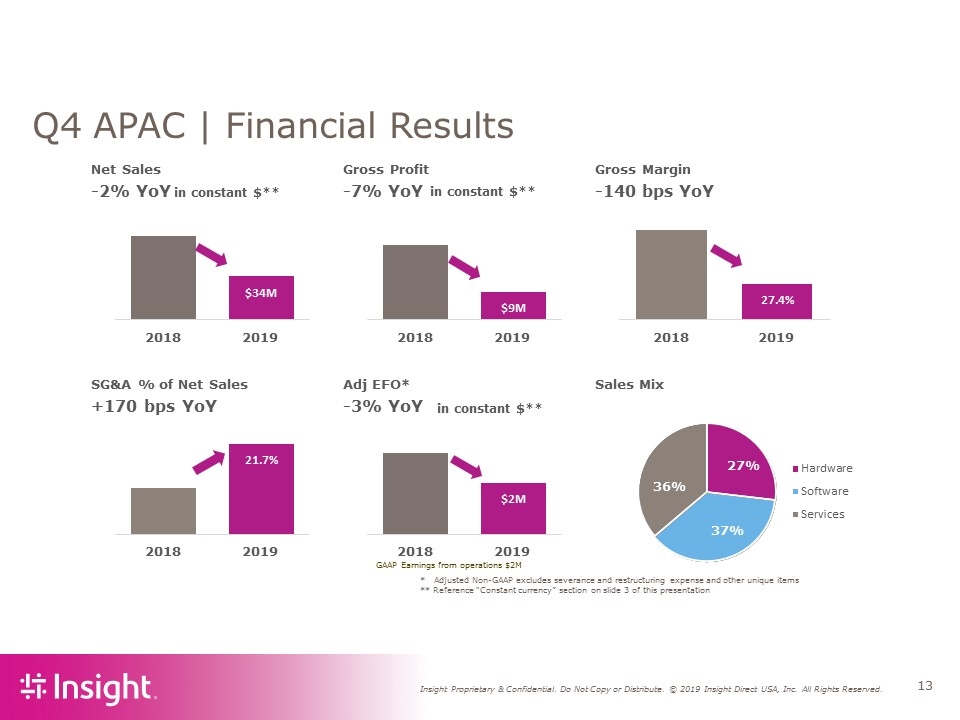
* Adjusted Non-GAAP excludes severance and restructuring expense and other unique items ** Reference “Constant currency” section on slide 3 of this presentation Q4 APAC | Financial Results Net Sales Gross Profit Gross Margin -2% YoY -7% YoY -140 bps YoY SG&A % of Net Sales Adj EFO* Sales Mix +170 bps YoY -3% YoY $34M 2018 2019 $9M 2018 2019 27.4% 2018 2019 $2M 2018 2019 21.7% 2018 2019 27% 37% 36% Hardware Software Services in constant $** in constant $** GAAP Earnings from operations $2M in constant $**
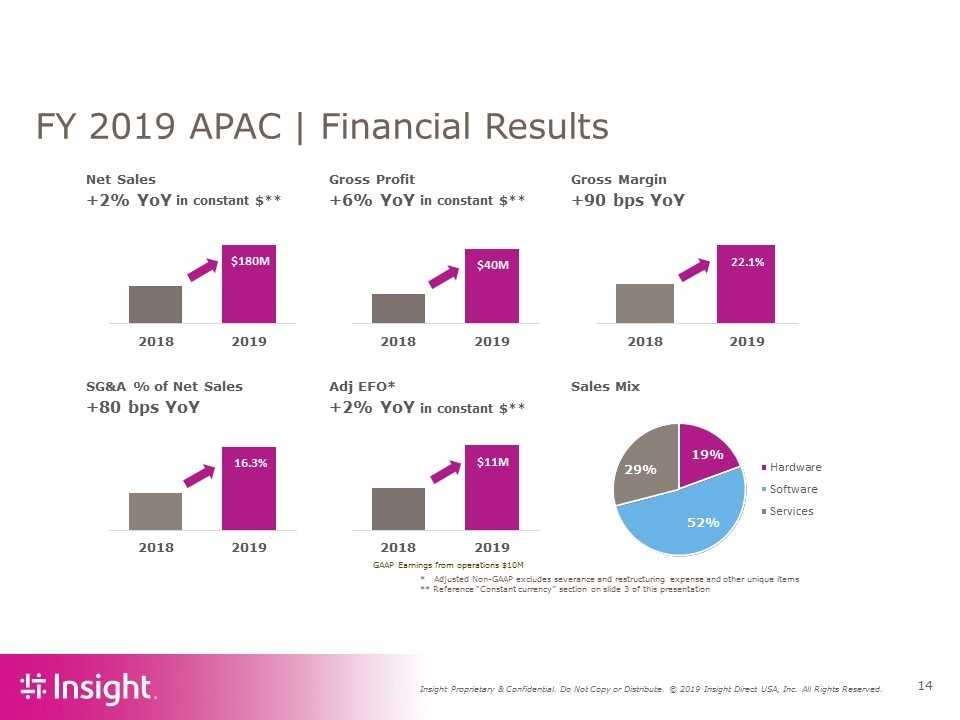
* Adjusted Non-GAAP excludes severance and restructuring expense and other unique items ** Reference “Constant currency” section on slide 3 of this presentation FY 2019 APAC | Financial Results Net Sales Gross Profit Gross Margin +2% YoY +6% YoY +90 bps YoY SG&A % of Net Sales Adj EFO* Sales Mix +80 bps YoY +2% YoY $180M 2018 2019 $40M 2018 2019 22.1% 2018 2019 $11M 2018 2019 16.3% 2018 2019 19% 52% 29% Hardware Software Services in constant $** in constant $** in constant $** GAAP Earnings from operations $10M
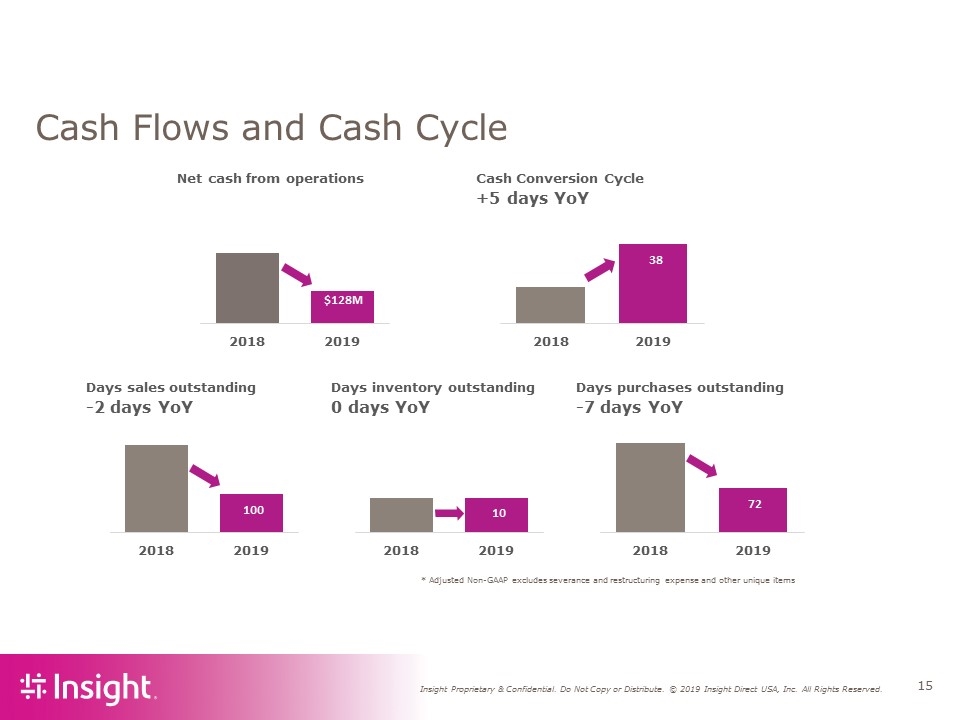
* Adjusted Non-GAAP excludes severance and restructuring expense and other unique items Cash Flows and Cash Cycle Net cash from operations Cash Conversion Cycle +5 days YoY Days sales outstanding Days inventory outstanding Days purchases outstanding -2 days YoY 0 days YoY -7 days YoY $128M 2018 2019 38 2018 2019 100 2018 2019 10 2018 2019 72 2018 2019
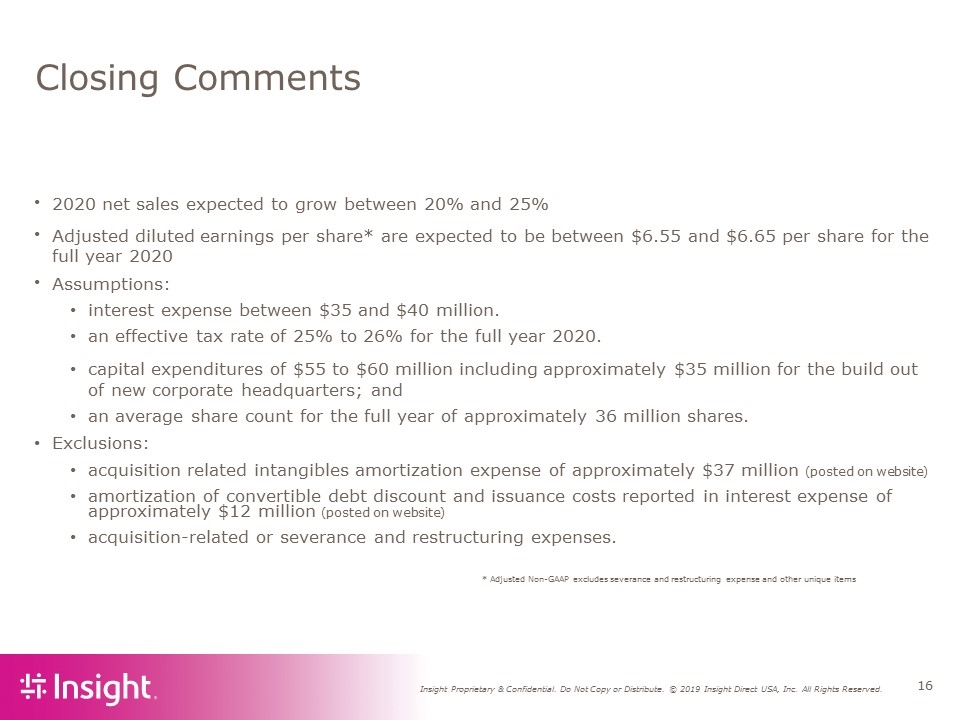
Closing Comments 2020 net sales expected to grow between 20% and 25% Adjusted diluted earnings per share* are expected to be between $6.55 and $6.65 per share for the full year 2020 Assumptions: interest expense between $35 and $40 million. an effective tax rate of 25% to 26% for the full year 2020. capital expenditures of $55 to $60 million including approximately $35 million for the build out of new corporate headquarters; and an average share count for the full year of approximately 36 million shares. Exclusions: acquisition related intangibles amortization expense of approximately $37 million (posted on website) amortization of convertible debt discount and issuance costs reported in interest expense of approximately $12 million (posted on website) acquisition-related or severance and restructuring expenses. * Adjusted Non-GAAP excludes severance and restructuring expense and other unique items
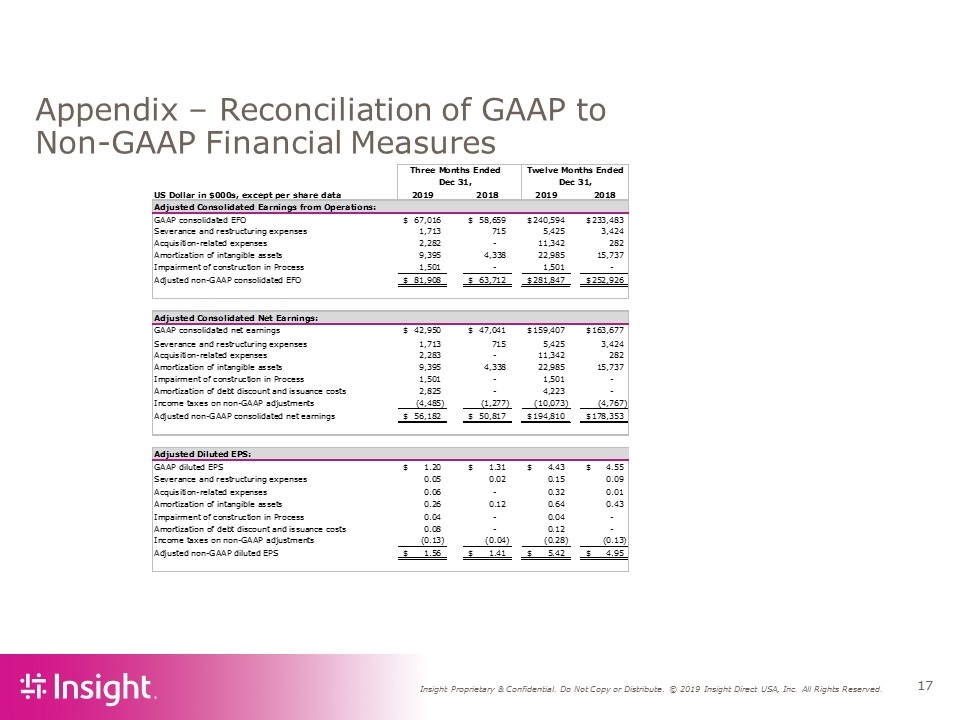
Appendix – Reconciliation of GAAP to Non-GAAP Financial Measures
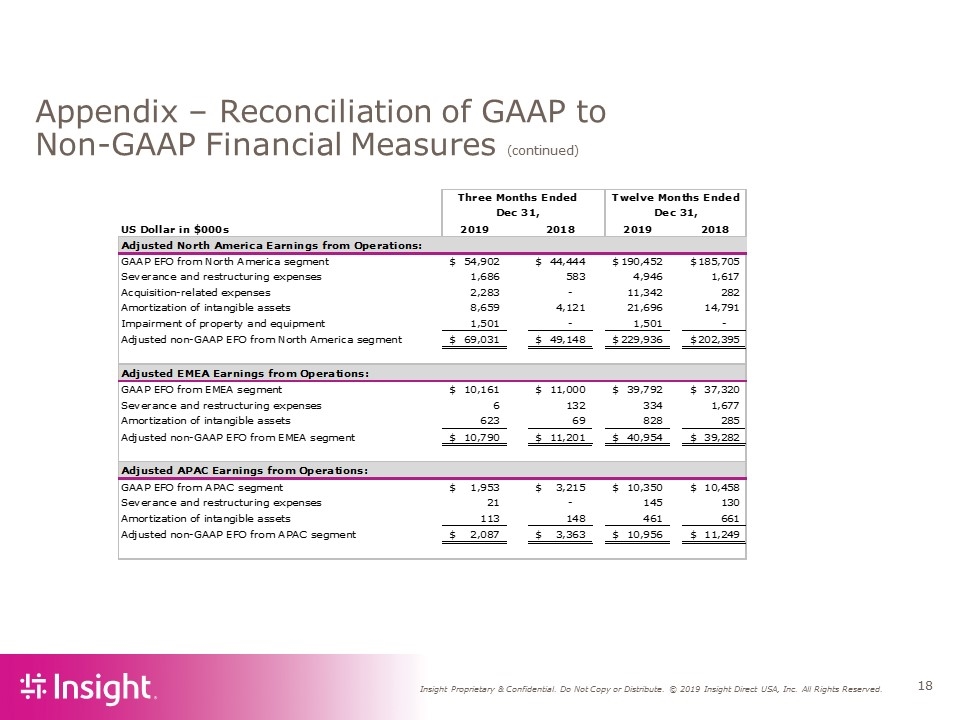
Appendix – Reconciliation of GAAP to Non-GAAP Financial Measures (continued)
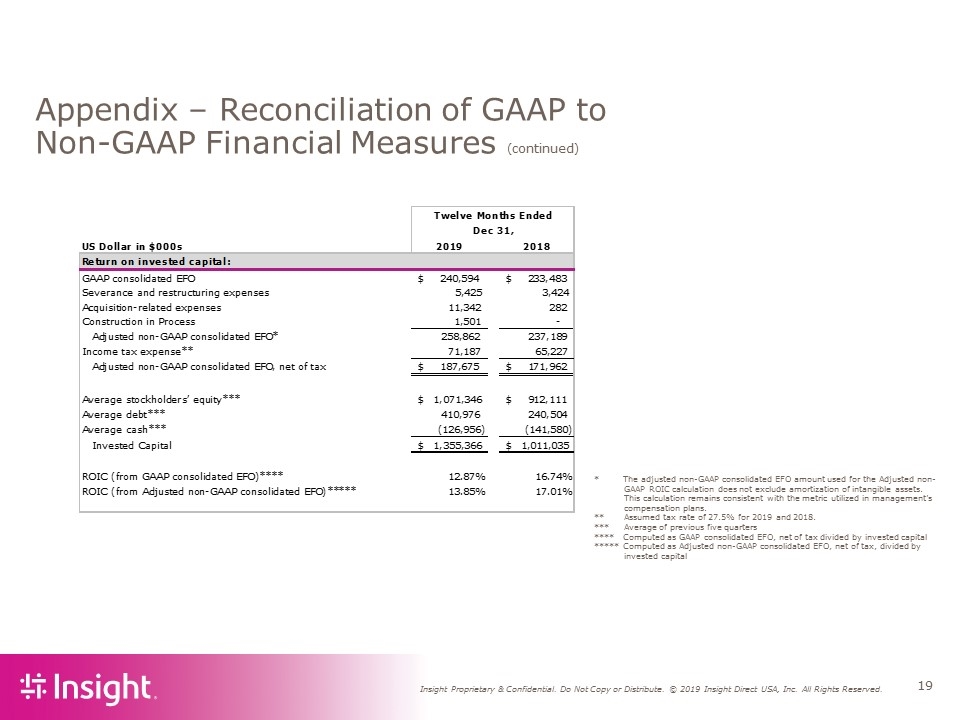
Appendix – Reconciliation of GAAP to Non-GAAP Financial Measures (continued) * The adjusted non-GAAP consolidated EFO amount used for the Adjusted non-GAAP ROIC calculation does not exclude amortization of intangible assets. This calculation remains consistent with the metric utilized in management’s compensation plans. ** Assumed tax rate of 27.5% for 2019 and 2018. *** Average of previous five quarters **** Computed as GAAP consolidated EFO, net of tax divided by invested capital ***** Computed as Adjusted non-GAAP consolidated EFO, net of tax, divided by invested capital
