Attached files
| file | filename |
|---|---|
| 8-K - 8-K - FIRST FINANCIAL BANCORP /OH/ | a8k21220investpresent.htm |

Exhibit 99.1 Investor Presentation Fourth Quarter 2019
Forward Looking Statement Disclosure Certain statements contained in this report which are not statements of historical fact constitute forward-looking statements within the meaning of the Private Securities Litigation Reform Act of 1995. Words such as ‘‘believes,’’ ‘‘anticipates,’’ “likely,” “expected,” “estimated,” ‘‘intends’’ and other similar expressions are intended to identify forward-looking statements but are not the exclusive means of identifying such statements. Examples of forward-looking statements include, but are not limited to, statements we make about (i) our future operating or financial performance, including revenues, income or loss and earnings or loss per share, (ii) future common stock dividends, (iii) our capital structure, including future capital levels, (iv) our plans, objectives and strategies, and (v) the assumptions that underlie our forward-looking statements. As with any forecast or projection, forward-looking statements are subject to inherent uncertainties, risks and changes in circumstances that may cause actual results to differ materially from those set forth in the forward-looking statements. Forward-looking statements are not historical facts but instead express only management’s beliefs regarding future results or events, many of which, by their nature, are inherently uncertain and outside of management’s control. It is possible that actual results and outcomes may differ, possibly materially, from the anticipated results or outcomes indicated in these forward-looking statements. Important factors that could cause actual results to differ materially from those in our forward-looking statements include the following, without limitation: (i) economic, market, liquidity, credit, interest rate, operational and technological risks associated with the Company’s business; (ii) the effect of and changes in policies and laws or regulatory agencies, including the Dodd-Frank Wall Street Reform and Consumer Protection Act and other legislation and regulation relating to the banking industry; (iii) management’s ability to effectively execute its business plans; (iv) mergers and acquisitions, including costs or difficulties related to the integration of acquired companies; (v) the possibility that any of the anticipated benefits of the Company’s merger with MainSource Financial Group, Inc. will not be realized or will not be realized within the expected time period; (vi) the effect of changes in accounting policies and practices; (vii) changes in consumer spending, borrowing and saving and changes in unemployment; (viii) changes in customers’ performance and creditworthiness; and (ix) the costs and effects of litigation and of unexpected or adverse outcomes in such litigation. Additional factors that may cause our actual results to differ materially from those described in our forward-looking statements can be found in the Form 10-K for the year ended December 31, 2018, as well as our other filings with the SEC, which are available on the SEC website at www.sec.gov. All forward-looking statements included in this filing are made as of the date hereof and are based on information available at the time of the filing. Except as required by law, the Company does not assume any obligation to update any forward-looking statement. . 2

Presentation Contents About First Financial Bancorp Financial Performance Appendix 3

Company Overview Overview Lines of Business Founded: 1863 Commercial C&I, O-CRE, ABL, Equipment Finance, Treasury, Headquarters: Cincinnati, Ohio Bannockburn Global Forex Banking Centers: 145 Retail Banking Assets: $14.5 billion Consumer, Business Banking, Small Business Loans: $9.2 billion Mortgage Banking Deposits: $10.2 billion Wealth Management / Private Banking Wealth Mgmt: $4.5 billion Investment Commercial Real Estate $2.9 billion AUM Commercial Finance $1.6 billion brokerage NASDAQ: FFBC 3.66% 3.63% 3.76% 3.62% 3.37% $25.44 $24.48 $23.72 $24.06 $24.22 4Q18 1Q19 2Q19 3Q19 4Q19 www.bankatfirst.com Share Price Dividend Yield 4

Current Priorities Achieve targeted income and balance sheet growth objectives Realize expected benefits of Bannockburn acquisition Implement strategic technology and bank transformation roadmap Transform branch distribution network Open second innovation hub location Re-imagine Greater Cincinnati distribution strategy Close additional underperforming branch locations Continue transition to advising functions Invest in LMI locations Drive associate engagement and cultural development Partnership with Gallup Connecting to community Holistic approach to associate development Execute acquisition strategy Prioritize fee-based businesses Strategic bank acquisitions that provide improved market share or niche businesses / expertise Continue shareholder-focused capital management 5

Bannockburn Transaction Overview First Financial acquired Cincinnati based Bannockburn Global Forex, LLC (“BGF”), a capital markets firm specializing in foreign exchange payments, hedging, and other fee- based advisory services to small and medium enterprise (“SME”) clients Highly-additive transaction, consistent with FFBC’s previously communicated strategic focus on growing fee income Strategic Benefits Transaction Detail Financial Impact • Adds >$30mm of fee income • ~$114.6mm transaction value • Low-single digit GAAP EPS accretion / mid-single digit • FFBC Fee Income / Revenue • ~2.6mm shares and $53.7mm Cash EPS accretion increases by ~400 bps in cash • Enhances ROA and ROATCE • Meaningful cross-sell • All key BGF team members will opportunities to both sets of enter into retention agreements • IRR > 40%; ~100% free cash existing clients flow generation • BGF team previously worked at • Counter-cyclical – BGF’s a large regional bank under • TBV earnback < 5 years activity increases in downturns FFB’s Chief Commercial Executive Attractive risk / reward profile, with shared history and strong cultural alignment 6

4th & Vine – Opened 8/12/19 New 15,000 sq. ft. First Innovation Center and Downtown Cincinnati Banking Hub Site Dedicated landing page www.4thvine.com Multi-use spaces free for the community including multiple conference rooms, areas for shared workspace, and 5,000 sq. ft. for seminars and events Office/workspace for front facing associates representing most revenue lines of business 1,500 sq. ft. full-service branch Since inception: 375 programming events, 29,749 visitors, 5,077 visits to 4thvine.com Opening second innovation center within the next 12 months 7

Digital + Technology Investments “ Enabling a simple, consistent & seamless customer experience across digital & physical channels & making it easier for associates to provide best- in-class customer service. 8
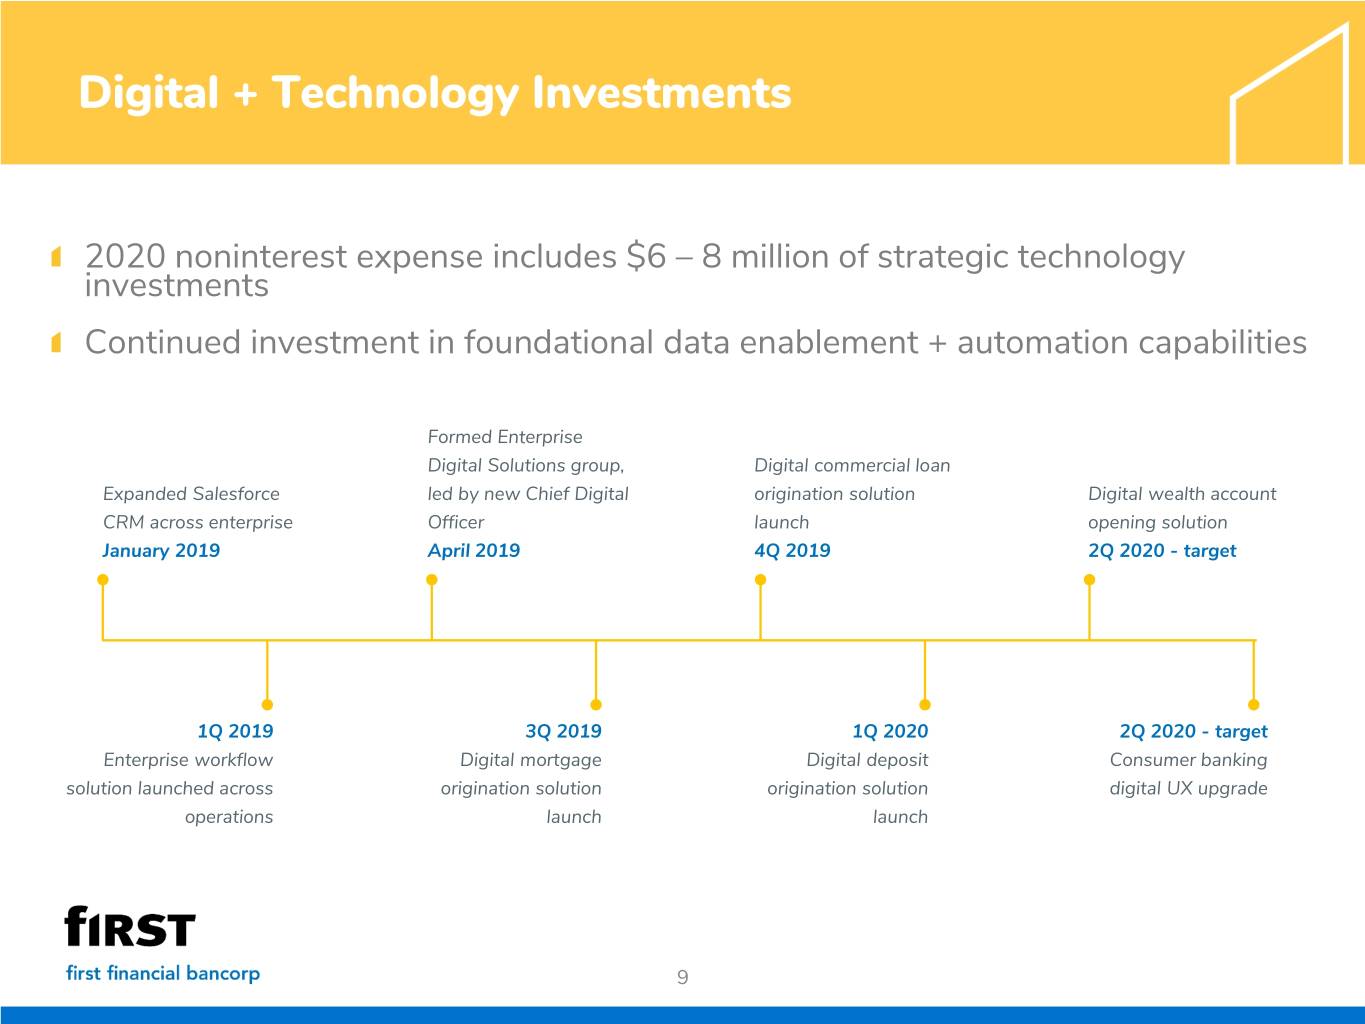
Digital + Technology Investments 2020 noninterest expense includes $6 – 8 million of strategic technology investments Continued investment in foundational data enablement + automation capabilities Formed Enterprise Digital Solutions group, Digital commercial loan Expanded Salesforce led by new Chief Digital origination solution Digital wealth account CRM across enterprise Officer launch opening solution January 2019 April 2019 4Q 2019 2Q 2020 - target 1Q 2019 3Q 2019 1Q 2020 2Q 2020 - target Enterprise workflow Digital mortgage Digital deposit Consumer banking solution launched across origination solution origination solution digital UX upgrade operations launch launch 9

Capital Strategy & Deployment Tangible Book Value Per Share Strategy & Deployment Repurchased 1.6 million shares in $12.79 $12.33 $12.42 fourth quarter; 2.8 million repurchased $12.19 in 2019 $11.72 3.6% dividend yield Targeted dividend payout ratio remains 40 - 45% Strategic M&A 4Q18 1Q19 2Q19 3Q19 4Q19 Tangible Book Value per Share 10

Revenue Growth Strategies 11

Franchise Growth Plans 12

Market Centric Strategies 13

Invest in First Financial Experienced and proven management team Increased scale to invest in technology Proven & sustainable business model Well managed through the cycle Conservative operating philosophy Consistent profitability – 117 consecutive quarters Top quartile performer – ROAA, ROATCE, Efficiency, Credit Robust capital management Prudent steward of shareholders’ capital Strong asset quality Well defined M&A strategy Selective markets, products & revenue diversification 14

Presentation Contents About First Financial Bancorp Financial Performance Appendix 15

4Q 2019 Results 117th Consecutive Quarter of Profitability Net income = $48.7 million or $0.49 per diluted share. Adjusted1 net income = $51.4 million or $0.52 per diluted share2. Profitability Return on average assets = 1.34%. Adjusted1 return on average assets = 1.41%. Return on average shareholders’ equity = 8.60%. Adjusted1 return on average shareholders’ equity = 9.08%. Return on average tangible common equity = 15.84%1. Adjusted1 return on average tangible common equity = 16.73%. Net interest income = $118.9 million. Net interest margin of 3.84% on a GAAP basis; 3.89% on a fully tax equivalent basis1. Noninterest income = $36.8 million. Income Statement Noninterest expense = $93.1 million; $87.8 million1 as adjusted. Efficiency ratio = 59.78%. Adjusted 1 efficiency ratio = 56.36%. Effective tax rate of 16.0%. Adjusted 1 effective tax rate of 18.9%. EOP assets increased $31.2 million compared to the linked quarter to $14.5 billion. EOP loans increased $138.0 million compared to the linked quarter to $9.2 billion. Balance Sheet Average deposits increased $204.3 million compared to the linked quarter to $10.2 billion. EOP investment securities remained relatively flat compared to the linked quarter. Provision expense = $4.6 million. Net charge-offs = $3.5 million. NCOs / Avg. Loans = 0.15% annualized. Asset Quality Nonperforming Loans / Total Loans = 0.65%. Nonperforming Assets / Total Assets = 0.42%. ALLL / Nonaccrual Loans = 119.69%. ALLL / Total Loans = 0.63%. Classified Assets / Total Assets = 0.62%. Total capital ratio = 13.39%. Tier 1 common equity ratio = 11.30%. Capital Tangible common equity ratio = 9.07%. Tangible book value per share = $12.42. 1 Non-GAAP financial measure which management believes facilitates a better understanding of the Company’s financial condition. See Appendix for Non-GAAP reconciliation. 2 See Slide 18 for Adjusted Earnings detail. 16

4Q 2019 Highlights Solid quarterly earnings Adjusted1 earnings per share - $0.52 Adjusted1 return on assets – 1.41% Adjusted1 return on average tangible common equity – 16.73% Loan and deposit growth in line with expectations Loan balances increased $138.0 million compared to the linked quarter; 6.0% on an annualized basis Strong average deposit growth driven by 19.8% annualized increase in average noninterest bearing deposits Strong net interest margin exceeded expectations 7 bps decline driven by lower asset yields; partially offset by favorable shift in funding costs and mix Strong fee income Full quarter impact of Bannockburn Sustained level of client derivative fees and mortgage banking income Core banking expenses in line with expectations Adjusted1 noninterest expense of $87.8 million; Adjusted for $0.7 million of severance and merger related costs, a $2.9 million historic tax credit writedown and approximately $1.7 million of other non-recurring costs (i.e. branch consolidation costs) $1.7 million of additional incentive compensation recorded in the quarter due to strong operating results $0.8 million of additional collection costs directly attributable to significant decline in classified assets Improved credit profile 33% decline in classified asset balances Provision expense of $4.6 million sufficient to cover net charge-offs and loan growth Effective tax rate of 16.0% Includes $3.2 million of historic tax credits $0.7 million of taxes incurred on merger-related executive compensation Strong Capital ratios Total capital of 13.39%; Tier 1 common equity of 11.30%; Tangible common equity of 9.07% Tangible book value increased to $12.42 Repurchased 1.6 million shares during the quarter 1 Non-GAAP financial measure which management believes facilitates a better understanding of the Company’s financial condition. See Appendix for Non-GAAP reconciliations. 17

Adjusted1 Net Income The table below lists certain adjustments that the Company believes are significant to understanding our quarterly performance. 4Q 2019 3Q 2019 As Reported Adjusted As Reported Adjusted Net interest income $ 118,902 $ 118,902 $ 121,535 $ 121,535 Provision for loan and lease losses $ 4,629 $ 4,629 $ 5,228 $ 5,228 Noninterest income $ 36,768 $ 36,768 $ 33,140 $ 33,140 less: gains (losses) on investment securities - (56) A - 208 A Total noninterest income $ 36,768 $ 36,824 $ 33,140 $ 32,932 Noninterest expense $ 93,064 $ 93,064 $ 86,226 $ 86,226 less: severance and merger-related expenses - 693 A - 5,192 A less: historic tax credit investment write-down - 2,862 A less: other - 1,740 A - 711 A Total noninterest expense $ 93,064 $ 87,769 $ 86,226 $ 80,323 Income before income taxes $ 57,977 $ 63,328 $ 63,221 $ 68,916 Income tax expense $ 9,300 $ 9,300 $ 12,365 $ 12,365 less: tax effect of executive compensation - 747 - 269 plus: after-tax impact on of historic tax credit write-down @ 21% - 2,261 - - plus: tax effect of adjustments (A) @ 21% statutory rate - 1,124 - 1,195 Total income tax expense $ 9,300 $ 11,938 $ 12,365 $ 13,291 Net income $ 48,677 $ 51,390 $ 50,856 $ 55,625 Net earnings per share - diluted $ 0.49 $ 0.52 $ 0.51 $ 0.56 Pre-tax, pre-provision return on average assets 1.72% 1.86% 1.90% 2.05% 1 Non-GAAP financial measure which management believes facilitates a better understanding of the Company’s financial condition. See Appendix for Non-GAAP reconciliations. All dollars shown in thousands, except per share amounts. 18
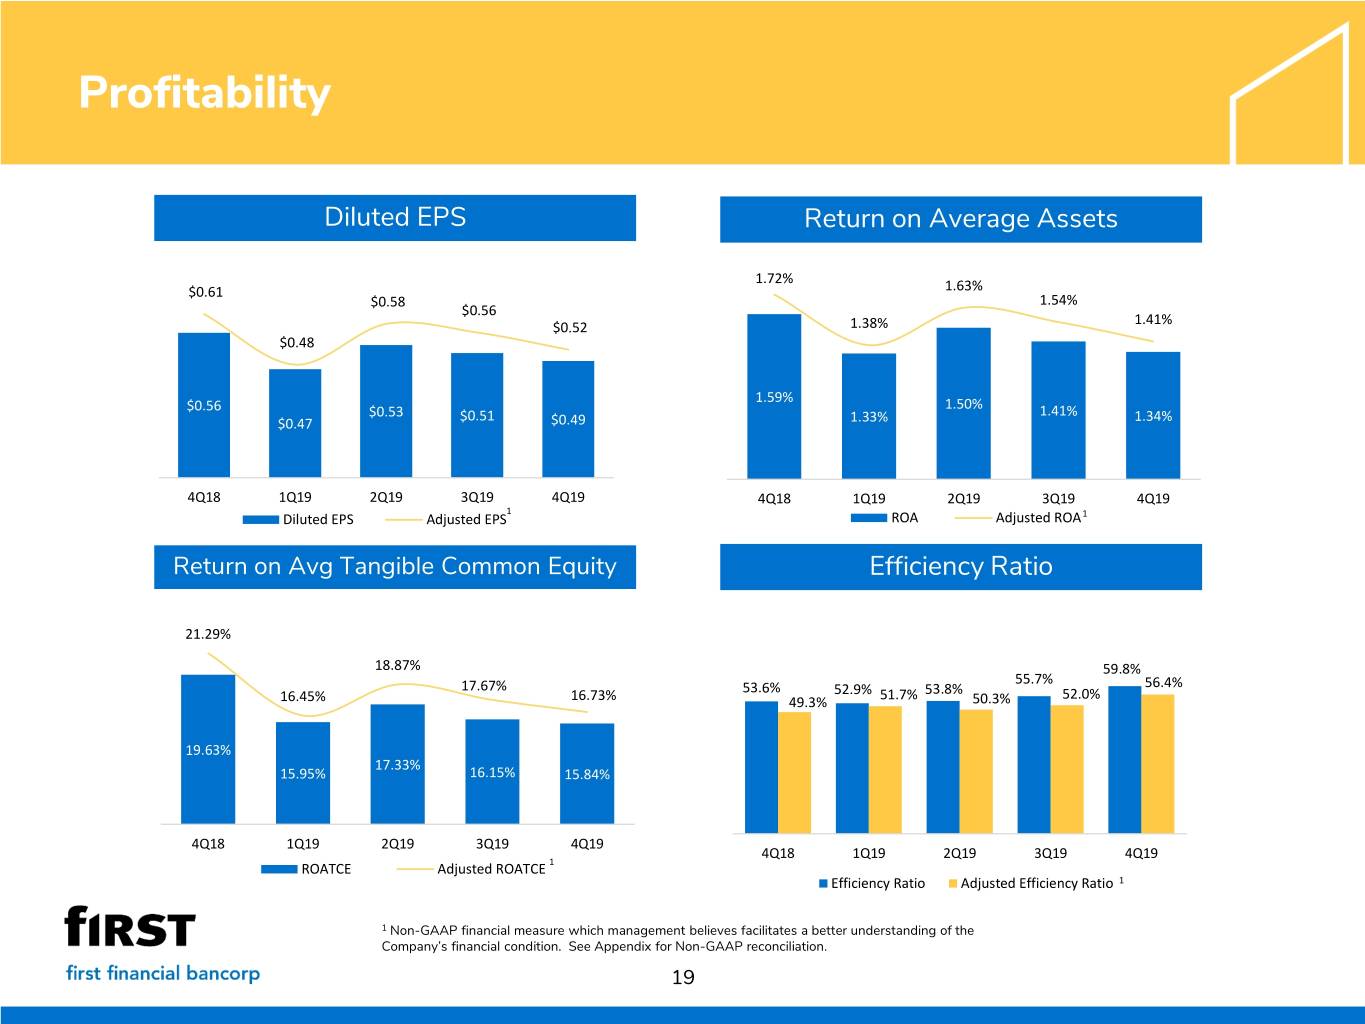
Profitability Diluted EPS Return on Average Assets 1.72% $0.61 1.63% $0.58 1.54% $0.56 1.41% $0.52 1.38% $0.48 1.59% $0.56 1.50% $0.53 $0.51 1.41% 1.34% $0.47 $0.49 1.33% 4Q18 1Q19 2Q19 3Q19 4Q19 4Q18 1Q19 2Q19 3Q19 4Q19 1 Diluted EPS Adjusted EPS ROA Adjusted ROA1 Return on Avg Tangible Common Equity Efficiency Ratio 21.29% 18.87% 59.8% 17.67% 55.7% 56.4% 53.6% 52.9% 51.7% 53.8% 52.0% 16.45% 16.73% 49.3% 50.3% 19.63% 17.33% 15.95% 16.15% 15.84% 4Q18 1Q19 2Q19 3Q19 4Q19 4Q18 1Q19 2Q19 3Q19 4Q19 ROATCE Adjusted ROATCE 1 Efficiency Ratio Adjusted Efficiency Ratio 1 1 Non-GAAP financial measure which management believes facilitates a better understanding of the Company’s financial condition. See Appendix for Non-GAAP reconciliation. 19
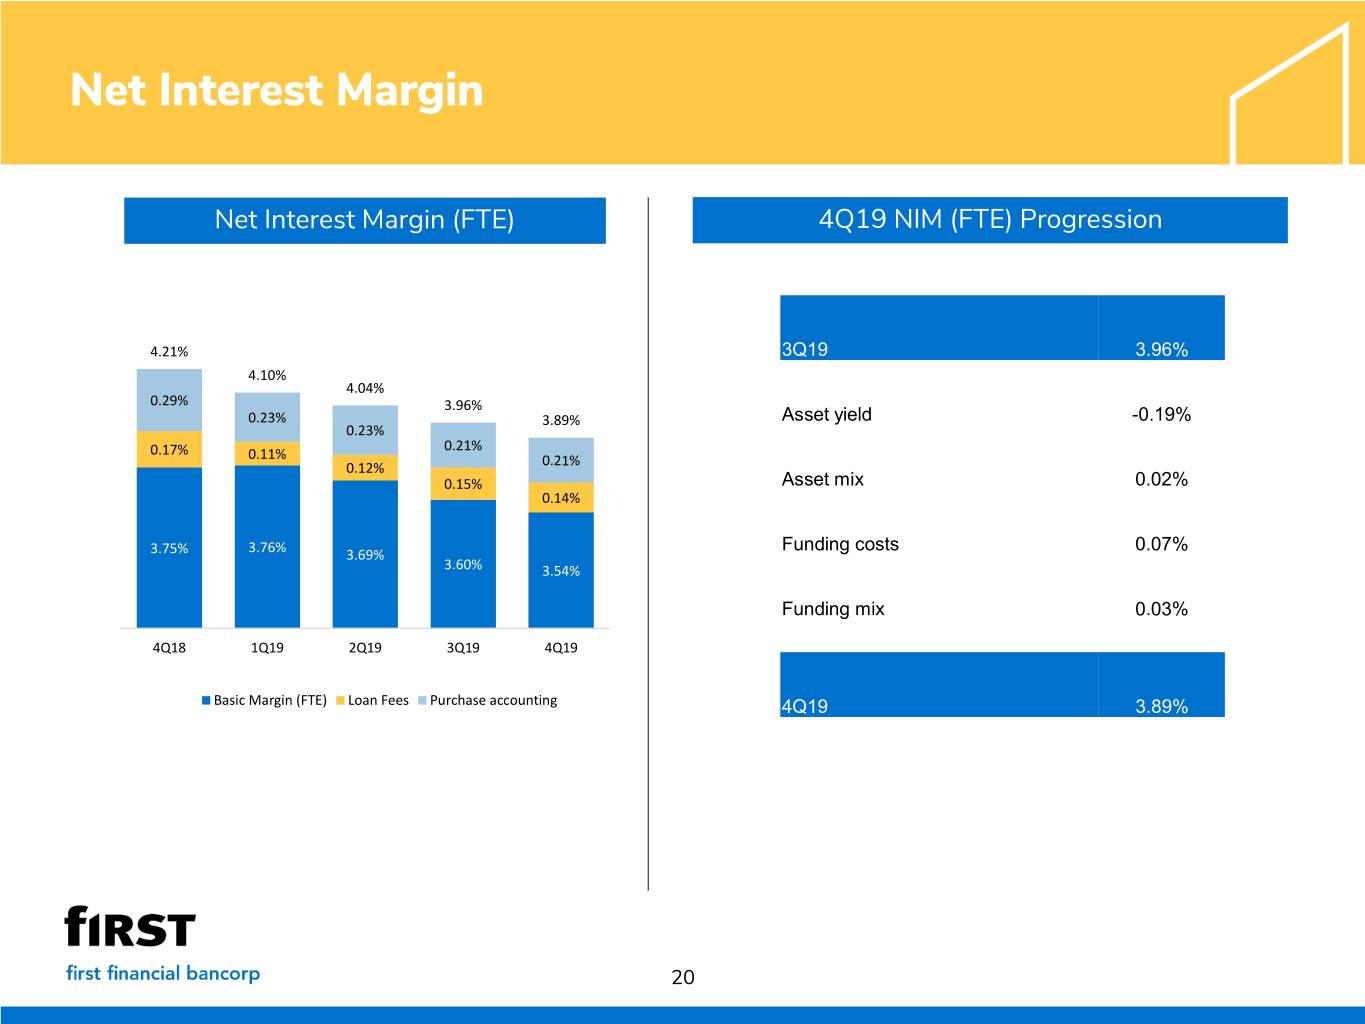
Net Interest Margin Net Interest Margin (FTE) 4Q19 NIM (FTE) Progression 4.21% 3Q19 3.96% 4.10% 4.04% 0.29% 3.96% 0.23% 3.89% Asset yield -0.19% 0.23% 0.21% 0.17% 0.11% 0.12% 0.21% 0.15% Asset mix 0.02% 0.14% Funding costs 0.07% 3.75% 3.76% 3.69% 3.60% 3.54% Funding mix 0.03% 4Q18 1Q19 2Q19 3Q19 4Q19 Basic Margin (FTE) Loan Fees Purchase accounting 4Q19 3.89% 20
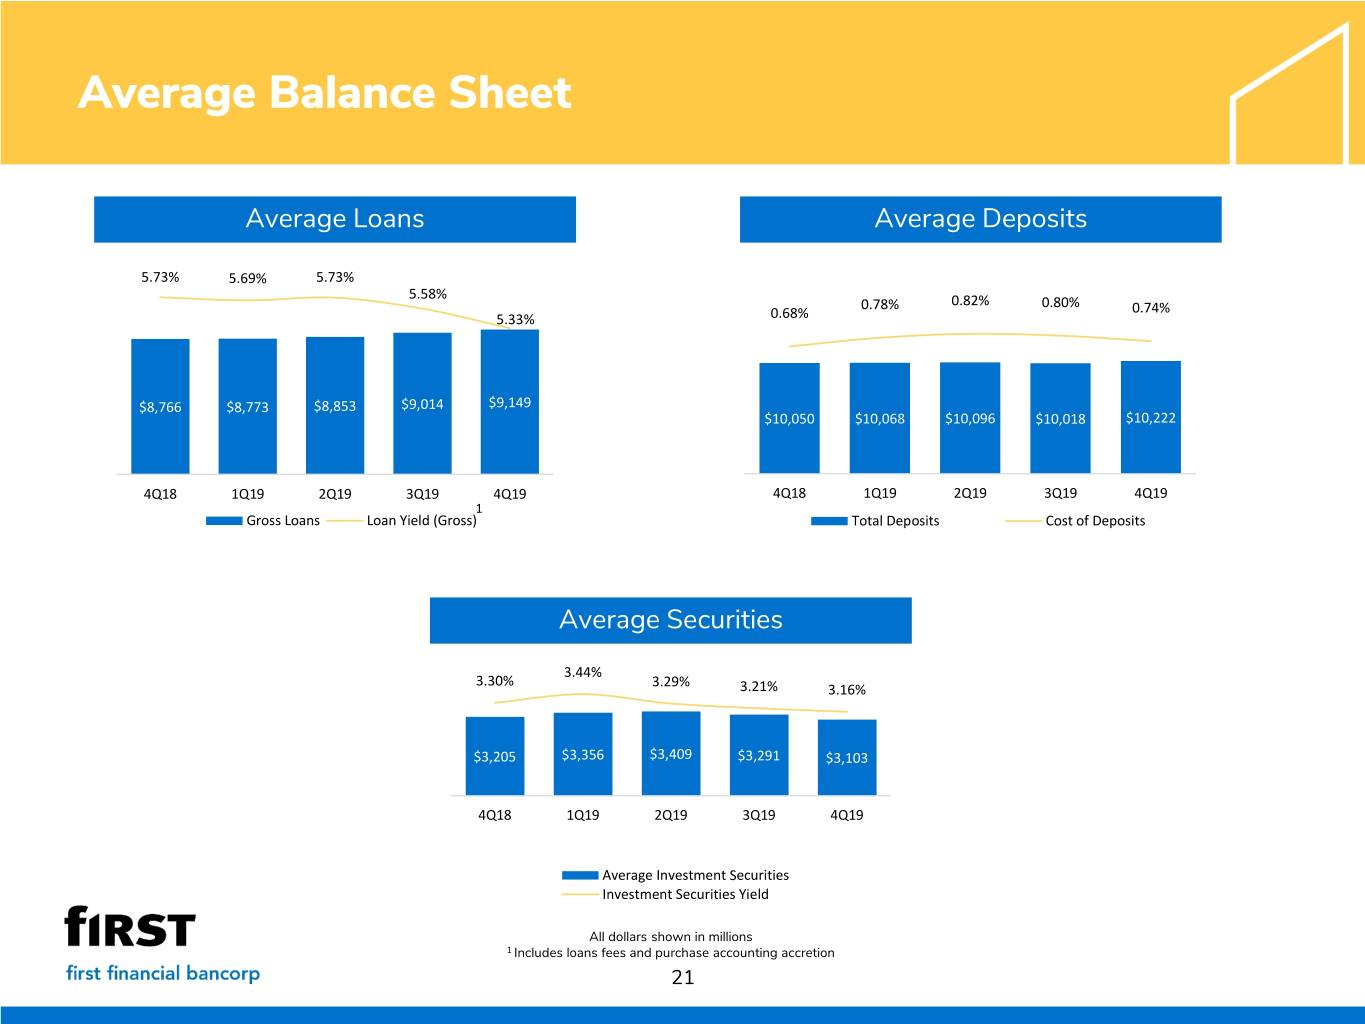
Average Balance Sheet Average Loans Average Deposits 5.73% 5.69% 5.73% 5.58% 0.78% 0.82% 0.80% 0.74% 5.33% 0.68% $8,766 $8,773 $8,853 $9,014 $9,149 $10,050 $10,068 $10,096 $10,018 $10,222 4Q18 1Q19 2Q19 3Q19 4Q19 4Q18 1Q19 2Q19 3Q19 4Q19 1 Gross Loans Loan Yield (Gross) Total Deposits Cost of Deposits Average Securities 3.44% 3.30% 3.29% 3.21% 3.16% $3,205 $3,356 $3,409 $3,291 $3,103 4Q18 1Q19 2Q19 3Q19 4Q19 Average Investment Securities Investment Securities Yield All dollars shown in millions 1 Includes loans fees and purchase accounting accretion 21

Loan Portfolio Loan LOB Mix (EOP) Net Loan Change-LOB (Linked Quarter) Total $9.2 Billion ICRE $165.1 $468 $595 5% Commercial -$16.8 7% Small Business Banking -$27.3 $1,120 $3,257 12% 35% Consumer -$8.5 Mortgage $7.8 $864 9% Oak Street $16.8 $1,175 Franchise -$8.2 13% $1,723 19% Other $9.1 ICRE Commercial Small Business Banking Consumer Mortgage Oak Street Total growth/(decline): Franchise $138.0 million All dollars shown in millions. 22

Loan Portfolio C&I Loans by Industry 1 CRE Loans by Collateral 2 C&I Loans: $3.7B CRE Loans: $3.5B Nursing/Assisted Accommodation Hotel/Motel Living & Food Services Office 12% 6% Real Estate 13% 14% 14% Strip Center Manufacturing 6% 12% Residential, 1-4 Family Health Care Finance & 4% 6% Insurance Retail 18% 18% Industrial Facility Agriculture 3% 5% Restaurant 3% Construction Student Housing 2% Other 5% Residential, Multi Other 13% 15% Wholesale Trade Family 5+ 19% 4% Other Services Professional & 4% Tech 4% 1 Industry types included in Other representing greater than 1% of total C&I loans include Retail Trade, Transportation & Warehousing, Public Administration, Waste Management, Educational Services, Arts & Recreation, and Management of Companies & Enterprises. Includes owner- occupied CRE. 2 Collateral types included in Other representing greater than 1% of total CRE loans include Medical Office, Warehouse, Mini Storage, Vacant Land Not Held for Development, and Real Estate IUB Other. 23

Deposits Deposit Product Mix (Avg) 4Q19 Average Deposit Progression Total $10.2 billion Interest-bearing demand $26.8 $1,624 $1,367 16% 13% Noninterest-bearing $114.2 $683 7% Savings -$4.4 $2,474 24% $1,438 Money Markets -$8.3 14% Retail CDs -$35.9 $881 $1,755 9% 17% Brokered CDs $12.0 Interest-bearing demand Noninterest-bearing Public Funds $99.9 Savings Money Markets Retail CDs Brokered CDs Total growth/(decline): Public Funds $204.3 million All dollars shown in millions. 24
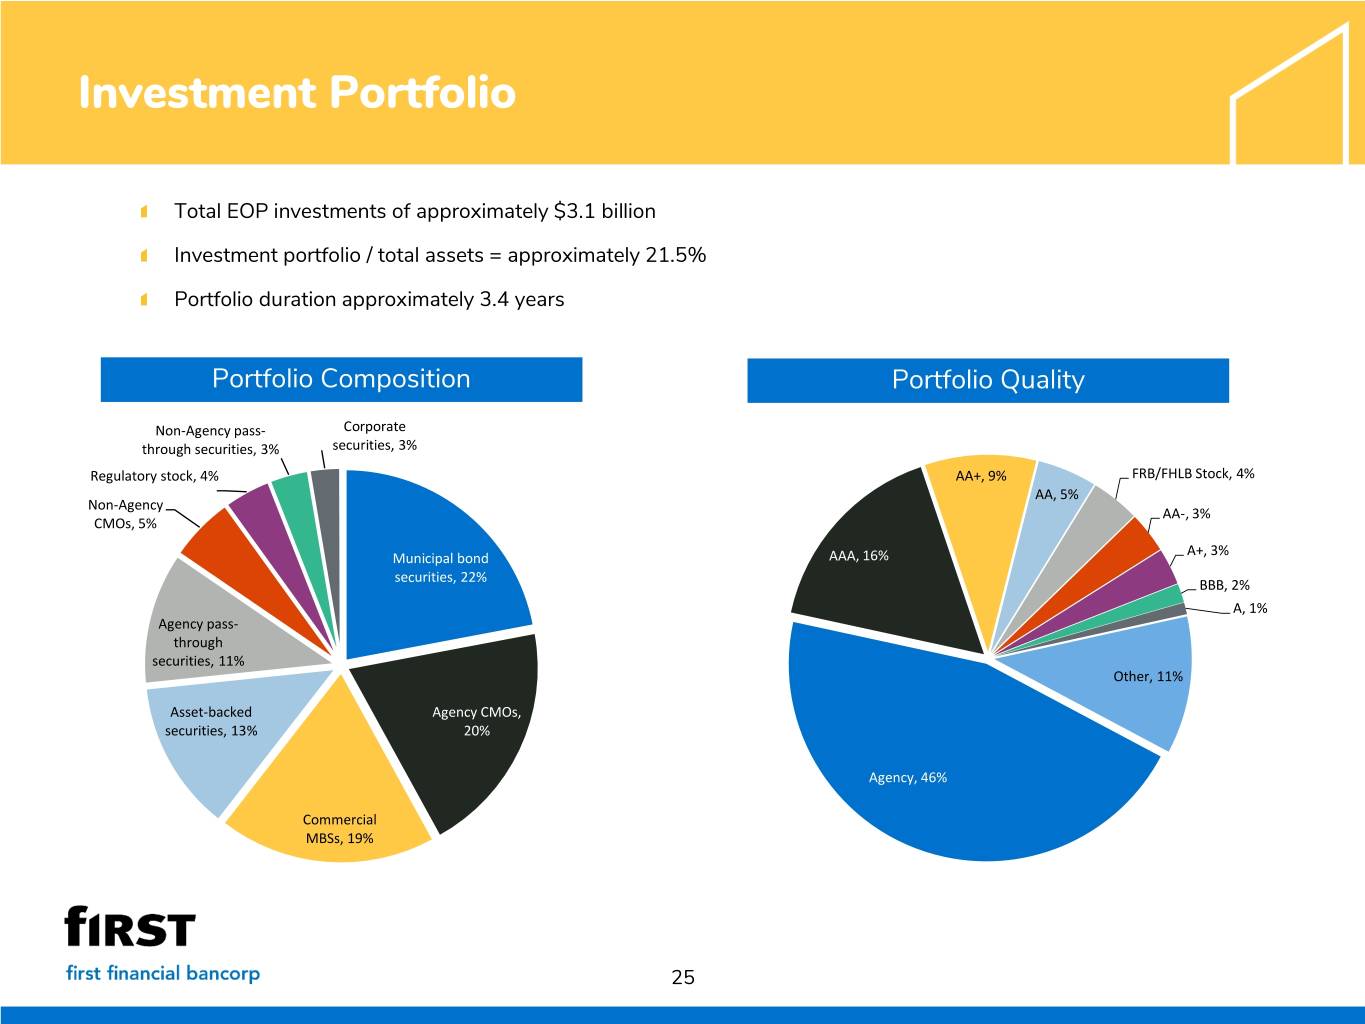
Investment Portfolio Total EOP investments of approximately $3.1 billion Investment portfolio / total assets = approximately 21.5% Portfolio duration approximately 3.4 years Portfolio Composition Portfolio Quality Non-Agency pass- Corporate through securities, 3% securities, 3% Regulatory stock, 4% AA+, 9% FRB/FHLB Stock, 4% AA, 5% Non-Agency AA-, 3% CMOs, 5% A+, 3% Municipal bond AAA, 16% securities, 22% BBB, 2% A, 1% Agency pass- through securities, 11% Other, 11% Asset-backed Agency CMOs, securities, 13% 20% Agency, 46% Commercial MBSs, 19% 25
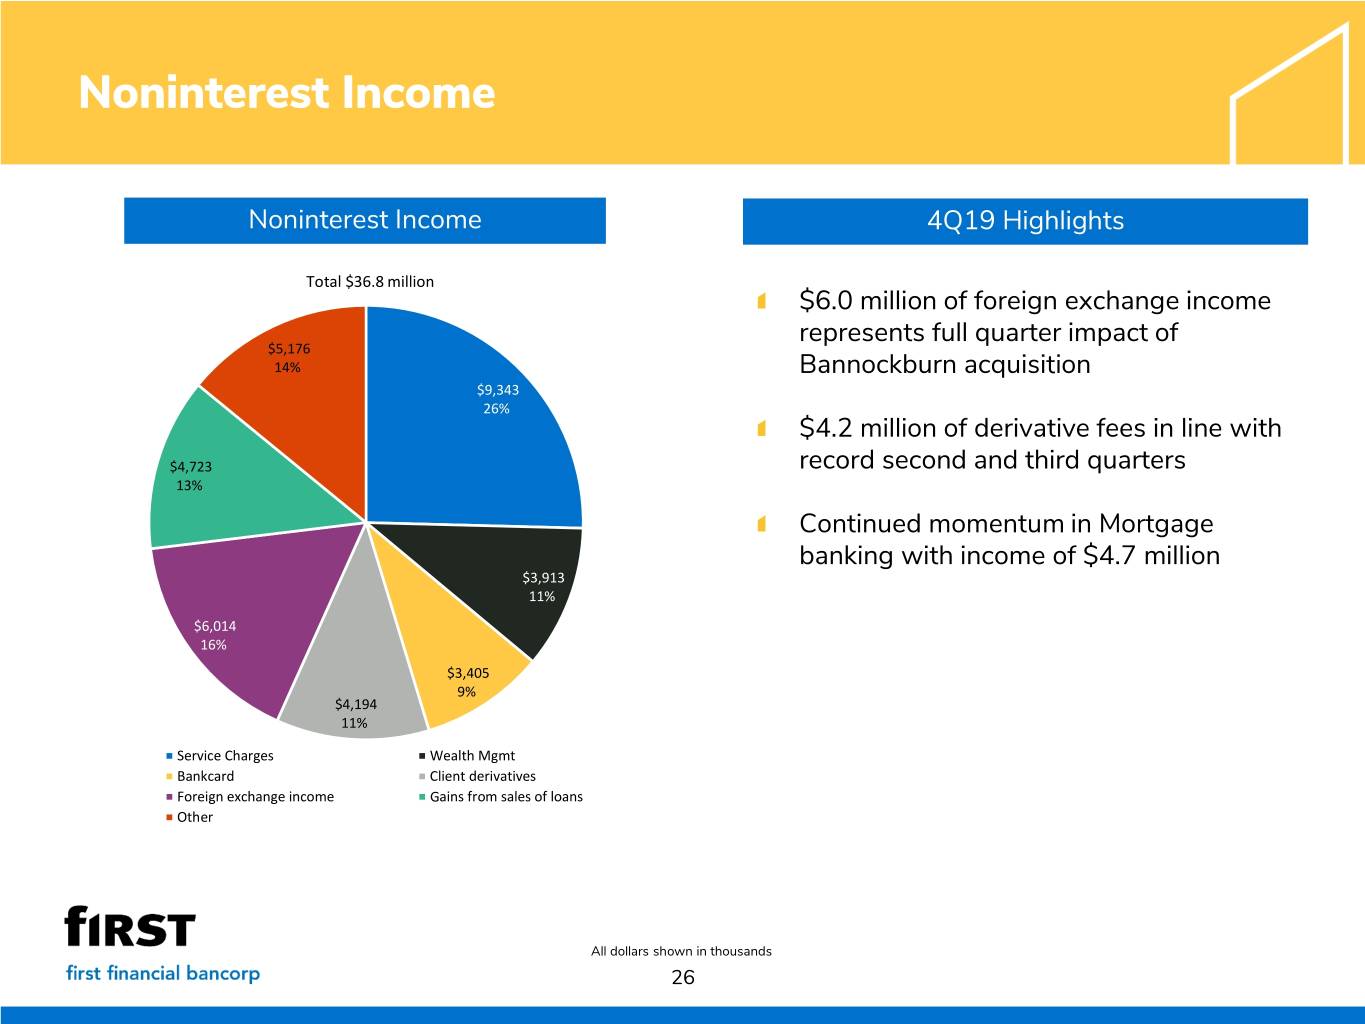
Noninterest Income Noninterest Income 4Q19 Highlights Total $36.8 million $6.0 million of foreign exchange income $5,176 represents full quarter impact of 14% Bannockburn acquisition $9,343 26% $4.2 million of derivative fees in line with $4,723 record second and third quarters 13% Continued momentum in Mortgage banking with income of $4.7 million $3,913 11% $6,014 16% $3,405 9% $4,194 11% Service Charges Wealth Mgmt Bankcard Client derivatives Foreign exchange income Gains from sales of loans Other All dollars shown in thousands 26

Noninterest Expense Noninterest Expense 4Q19 Highlights Total $93.1 million Includes $0.7 million of severance and merger related costs $17,295 19% $2.9 million write-down of historic tax credit investment $3,150 3% $2,192 $1.7 million related to other non-recurring 2% costs such as branch consolidations $5,996 7% $53,952 58% Salaries and benefits impacted by $1.7 $10,479 million of commissions and incentive 11% compensation $0.8 million of additional collection costs directly attributable to significant decline in Salaries and benefits Occupancy and equipment classified assets Data processing Professional services Intangible amortization Other $0.4 million contribution to First Financial Foundation All dollars shown in thousands 27

Asset Quality Classified Assets / Total Assets Nonperforming Assets / Total Assets 1.01% 1.02% 0.94% 0.92% 0.63% 0.60% 0.62% 0.56% $142.0 $147.8 0.62% $131.7 $132.5 0.42% $88.2 $90.2 $83.9 $80.8 $89.3 $61.6 4Q18 1Q19 2Q19 3Q19 4Q19 4Q18 1Q19 2Q19 3Q19 4Q19 Classified Assets Classified Assets / Total Assets NPAs NPAs / Total Assets Allowance / Total Loans Net Charge Offs & Provision Expense 0.64% 0.69% 0.29% 0.45% 0.64% 0.64% 0.62% 0.63% 0.15% $14.1 0.08% $13.9 $61.5 $56.5 $56.7 $56.6 $57.7 $10.2 $6.5 $6.7 $5.3 $5.2 $4.6 $3.5 $1.8 4Q18 1Q19 2Q19 3Q19 4Q19 4Q18 1Q19 2Q19 3Q19 4Q19 Allowance for Loan Losses ALLL / Total Loans NCOs Provision Expense NCOs / Average Loans All dollars shown in millions. 28

Capital Tier 1 Common Equity Ratio Tier 1 Capital Ratio 12.03% 12.00% 11.87% 11.52% 12.28% 11.30% 12.43% 12.40% 9.00% 11.91% 10.50% 11.69% 4Q18 1Q19 2Q19 3Q19 4Q19 4Q18 1Q19 2Q19 3Q19 4Q19 Tier 1 Common Equity Ratio Target Tier 1 Capital Ratio Target Total Capital Ratio Tangible Common Equity Ratio 9.34% 14.10% 14.24% 14.20% 9.15% 9.17% 9.07% 13.62% 8.79% 12.50% 13.39% 7.50% 4Q18 1Q19 2Q19 3Q19 4Q19 4Q18 1Q19 2Q19 3Q19 4Q19 Total Capital Ratio Target Tangible Common Equity Ratio Target All capital numbers are considered preliminary. 29

Franchise Lending Portfolio Overview Quality Portfolio Well-regarded national brand concepts Total $466.4 million Financing for acquisition, development of new stores, $19.0 $16.1 4% and remodeling of existing stores 3% Top 15 concepts comprise 85% of portfolio outstandings Disciplined portfolio management Annual concept reviews Annual reviews of borrower relationships Ongoing monitoring of borrower financial performance Granular portfolio Average relationship: $2.6 million Top 10 relationships comprise 29% of the portfolio and are performing well $431.3 93% 9 of top 10 include at least some real estate collateral Largest relationship exposure is $18.2 million Strategic portfolio management Pass Special mention Substandard/Nonaccrual Balance 12/31/2018 – $556 million Balance 12/31/2019 – $466 million All dollars shown in millions. 30

2020 Outlook1 Annualized loan growth expected to be in the mid-single digits on a percentage Balance Sheet basis NIM (FTE) expected to remain relatively flat, assuming no further rate cuts and Net Interest Margin excluding purchase accounting NIM (FTE) expected to decline 6 - 8 bps for each 25 bps decline in rates Credit Credit outlook remains stable Noninterest income2 Estimated to be $145 - $155 million, with seasonal fluctuations expected Estimated to be $348 - $358 million, with seasonal fluctuations expected Noninterest Expense2 Includes $6 -$8 million of expenses related to strategic technology investments All capital ratios expected to exceed current internal targets Capital Flexibility to consider additional deployment opportunities Taxes Full year effective tax rate approximately 19.0% 1 See Forward Looking Statement Disclosure on page 2 of this presentation for a discussion of factors that could affect management’s expectations and results in future periods. 2 Management’s estimated outlook excludes merger-related activities. 31
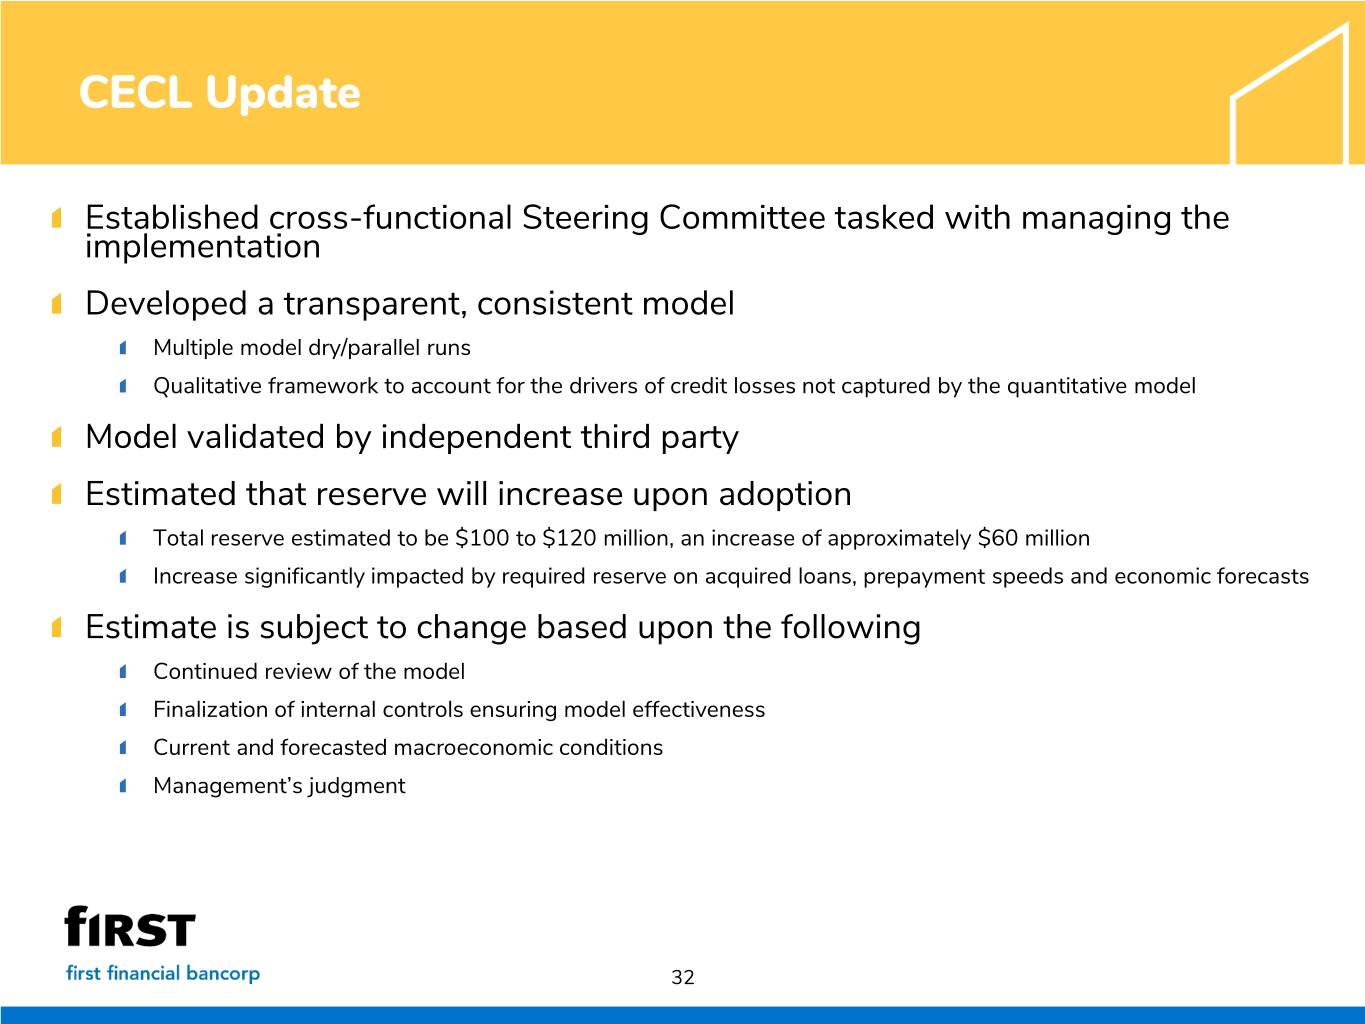
CECL Update Established cross-functional Steering Committee tasked with managing the implementation Developed a transparent, consistent model Multiple model dry/parallel runs Qualitative framework to account for the drivers of credit losses not captured by the quantitative model Model validated by independent third party Estimated that reserve will increase upon adoption Total reserve estimated to be $100 to $120 million, an increase of approximately $60 million Increase significantly impacted by required reserve on acquired loans, prepayment speeds and economic forecasts Estimate is subject to change based upon the following Continued review of the model Finalization of internal controls ensuring model effectiveness Current and forecasted macroeconomic conditions Management’s judgment 32

Presentation Contents About First Financial Bancorp Financial Performance Appendix 33

Appendix: Our Markets Greater Cincinnati Indianapolis Loans $2.8 billion Loans $1.2 billion Deposits $3.2 billion Deposits $0.7 billion Deposit Market Share #4 (2.8%) Deposit Market Share #14 (1.5%) Banking Centers 52 Banking Centers 10 Fortune 500 Companies 8 Fortune 500 Companies 2 Central OH Louisville Loans $1.2 billion Loans $0.6 billion Deposits $0.4 billion Deposits $0.5 billion Deposit Market Share #15 (0.8%) Deposit Market Share #14 (1.6%) Banking Centers 5 Banking Centers 11 Fortune 500 Companies 5 Fortune 500 Companies 3 Community Markets Commercial Finance (National) Loans $1.8 billion Loans $1.1 billion Deposits $4.3 billion Banking Centers 67 All numbers as of 12/31/2019 except deposit market share which is as of 6/30/2019. Loan and deposit balances exclude special assets, loan marks, other out of market and corporately held balances. 34

Appendix: Non-GAAP Measures The Company’s earnings release and accompanying presentation contain certain financial information determined by methods other than in accordance with accounting principles generally accepted in the United States (GAAP). Such non-GAAP financial information should be considered supplemental to, and not as a substitute for, or superior to, financial measures calculated in accordance with GAAP. However, we believe that non-GAAP reporting provides meaningful information and therefore we use it to supplement our GAAP information. We have chosen to provide this supplemental information to investors, analysts and other interested parties to enable them to perform additional analyses of operating results, to illustrate the results of operations giving effect to the non-GAAP adjustments and to provide an additional measure of performance. We believe this information is helpful in understanding the results of operations separate and apart from items that may, or could, have a disproportional positive or negative impact in any given period. For a reconciliation of the differences between the non-GAAP financial measures and the most comparable GAAP measures, please refer to the following reconciliation tables. to GAAP Reconciliation 35

Appendix: Non-GAAP to GAAP Reconciliation Net interest income and net interest margin - fully tax equivalent Three months ended Dec. 31, Sep. 30, June 30, Mar. 31, Dec. 31, 2019 2019 2019 2019 2018 Net interest income $ 118,902 $ 121,535 $ 122,302 $ 121,515 $ 125,959 Tax equivalent adjustment 1,630 1,759 1,416 1,523 1,442 Net interest income - tax equivalent $ 120,532 $ 123,294 $ 123,718 $ 123,038 $ 127,401 Average earning assets $ 12,288,761 $ 12,343,327 $ 12,294,911 $ 12,163,751 $ 12,003,073 Net interest margin1 3.84 % 3.91 % 3.99 % 4.05 % 4.16 % Net interest margin (fully tax equivalent)1 3.89 % 3.96 % 4.04 % 4.10 % 4.21 % 1 Margins are calculated using net interest income annualized divided by average earning assets. The tax equivalent adjustment to net interest income recognizes the income tax savings when comparing taxable and tax-exempt assets and assumes a 21% tax rate. Management believes that it is a standard practice in the banking industry to present net interest margin and net interest income on a fully tax equivalent basis. Therefore, management believes these measures provide useful information to investors by allowing them to make peer comparisons. Management also uses these measures to make peer comparisons. All dollars shown in thousands. 36

Appendix: Non-GAAP to GAAP Reconciliation Additional non-GAAP ratios Three months ended YTD Dec. 31, Sep. 30, June 30, Mar. 31, Dec. 31, Dec. 31, Dec. 31, (Dollars in thousands, except per share data) 2019 2019 2019 2019 2018 2019 2018 Net income (a) $ 48,677 $ 50,856 $ 52,703 $ 45,839 $ 55,014 $ 198,075 $ 172,595 Average total shareholders' equity 2,245,107 2,210,327 2,146,997 2,094,234 2,042,884 2,174,679 1,752,261 Less: Goodw ill (937,710) (899,888) (879,726) (878,541) (878,669) (899,131) (714,528) Other intangibles (78,190) (51,365) (37,666) (39,900) (42,305) (51,884) (33,682) MSR's (10,367) (10,118) (9,906) (9,896) (9,986) (10,073) (7,665) Average tangible equity (b) 1,218,840 1,248,956 1,219,699 1,165,897 1,111,924 1,213,591 996,386 Total shareholders' equity 2,247,705 2,261,313 2,188,189 2,130,419 2,078,249 2,247,705 2,078,249 Less: Goodw ill (937,771) (937,689) (879,727) (879,727) (880,251) (937,771) (880,251) Other intangibles (76,201) (79,506) (36,349) (38,571) (40,805) (76,201) (40,805) MSR's (10,650) (10,293) (10,086) (9,891) (9,974) (10,650) (9,974) Ending tangible equity (c) 1,223,083 1,233,825 1,262,027 1,202,230 1,147,219 1,223,083 1,147,219 Total assets 14,511,625 14,480,445 14,437,663 14,074,263 13,986,660 14,511,625 13,986,660 Less: Goodw ill (937,771) (937,689) (879,727) (879,727) (880,251) (937,771) (880,251) Other intangibles (76,201) (79,506) (36,349) (38,571) (40,805) (76,201) (40,805) MSR's (10,650) (10,293) (10,086) (9,891) (9,974) (10,650) (9,974) Ending tangible assets (d) 13,487,003 13,452,957 13,511,501 13,146,074 13,055,630 13,487,003 13,055,630 Risk-w eighted assets (e) 11,023,795 10,883,554 10,674,394 10,358,805 10,241,159 11,023,795 10,241,159 Total average assets 14,460,288 14,320,514 14,102,733 13,952,551 13,768,958 14,210,719 12,611,438 Less: Goodw ill (937,710) (899,888) (879,726) (878,541) (878,669) (899,131) (714,528) Other intangibles (78,190) (51,365) (37,666) (39,900) (42,305) (51,884) (33,682) MSR's (10,367) (10,118) (9,906) (9,896) (9,986) (10,073) (7,665) Average tangible assets (f) $ 13,434,021 $ 13,359,143 $ 13,175,435 $ 13,024,214 $ 12,837,998 $ 13,249,631 $ 11,855,563 Ending shares outstanding (g) 98,490,998 100,094,819 98,647,690 98,613,872 97,894,286 98,490,998 97,894,286 Ratios Return on average tangible shareholders' equity (a)/(b) 15.84% 16.15% 17.33% 15.95% 19.63% 16.32% 17.32% Ending tangible equity as a percent of: Ending tangible assets (c)/(d) 9.07% 9.17% 9.34% 9.15% 8.79% 9.07% 8.79% Risk-w eighted assets (c)/(e) 11.09% 11.34% 11.82% 11.61% 11.20% 11.09% 11.20% Average tangible equity as a percent of average tangible assets (b)/(f) 9.07% 9.35% 9.26% 8.95% 8.66% 9.16% 8.40% Tangible book value per share (c)/(g) $ 12.42 $ 12.33 $ 12.79 $ 12.19 $ 11.72 $ 12.42 $ 11.72 All dollars shown in thousands. 37

Appendix: Non-GAAP to GAAP Reconciliation Additional non-GAAP measures 4Q19 3Q19 2Q19 1Q19 4Q18 (Dollars in thousands, except per share data) As Reported Adjusted As Reported Adjusted As Reported Adjusted As Reported Adjusted As Reported Adjusted Net interest income (f) $ 118,902 $ 118,902 $ 121,535 $ 121,535 $ 122,302 $ 122,302 $ 121,515 $ 121,515 $ 125,959 $ 125,959 Provision for loan and lease losses (j) 4,629 4,629 5,228 5,228 6,658 6,658 14,083 14,083 5,310 5,310 Noninterest income 36,768 36,768 33,140 33,140 34,638 34,638 26,827 26,827 29,504 29,504 less: gains from the redemption of off balance sheet securitizations (1,645) plus: Bankcard interchange less: gains (losses) on sale of investment securities (56) 208 52 (34) (60) Total noninterest income (g) 36,768 36,824 33,140 32,932 34,638 34,586 26,827 26,861 29,504 27,919 Noninterest expense 93,064 93,064 86,226 86,226 84,378 84,378 78,499 78,499 83,352 83,352 less: severance and merger-related expenses 693 5,192 5,187 1,734 7,485 less: historic tax credit w rite-dow n @ 21% 2,862 less: other 1,740 711 336 78 Total noninterest expense (e) 93,064 87,769 86,226 80,323 84,378 78,855 78,499 76,687 83,352 75,867 Income before income taxes (i) 57,977 63,328 63,221 68,916 65,904 71,375 55,760 57,606 66,801 72,701 Income tax expense 9,300 9,300 12,365 12,365 13,201 13,201 9,921 9,921 11,787 11,787 plus: tax effect of adjustments 377 926 785 388 1,239 plus: after-tax impact of historic tax credit w rite-dow n @ 35% 2,261 Total income tax expense (h) 9,300 11,938 12,365 13,291 13,201 13,986 9,921 10,309 11,787 13,026 Net income (a) $ 48,677 $ 51,390 $ 50,856 $ 55,625 $ 52,703 $ 57,389 $ 45,839 $ 47,297 $ 55,014 $ 59,675 Average diluted shares (b) 99,232 99,232 99,078 99,078 98,648 98,648 98,436 98,436 98,468 98,468 Average assets (c) 14,460,288 14,460,288 14,320,514 14,320,514 14,102,733 14,102,733 13,952,551 13,952,551 13,768,958 13,768,958 Average shareholders' equity 2,245,107 2,245,107 2,210,327 2,210,327 2,146,997 2,146,997 2,094,234 2,094,234 2,042,884 2,042,884 Less: Goodw ill and other intangibles (1,026,267) (1,026,267) (961,371) (961,371) (927,298) (927,298) (928,337) (928,337) (930,960) (930,960) Average tangible equity (d) 1,218,840 1,218,840 1,248,956 1,248,956 1,219,699 1,219,699 1,165,897 1,165,897 1,111,924 1,111,924 Ratios Net earnings per share - diluted (a)/(b) $ 0.49 $ 0.52 $ 0.51 $ 0.56 $ 0.53 $ 0.58 $ 0.47 $ 0.48 $ 0.56 $ 0.61 Return on average assets - (a)/(c) 1.34% 1.41% 1.41% 1.54% 1.50% 1.63% 1.33% 1.38% 1.59% 1.72% Pre-tax, pre-provision return on average assets - ((a)+(j)+(h))/(c) 1.72% 1.86% 1.90% 2.05% 2.06% 2.22% 2.03% 2.08% 2.08% 2.25% Return on average tangible shareholders' equity - (a)/(d) 15.84% 16.73% 16.15% 17.67% 17.33% 18.87% 15.95% 16.45% 19.63% 21.29% Efficiency ratio - (e)/((f)+(g)) 59.8% 56.4% 55.7% 52.0% 53.8% 50.3% 52.9% 51.7% 53.6% 49.3% Effective tax rate - (h)/(i) 16.0% 18.9% 19.6% 19.3% 20.0% 19.6% 17.8% 17.9% 17.6% 17.9% 38

Update -New colors 39
